PRINT your name on the line below and returnthis booklet with your answer sheet. Failure todo so may result in disqualification.
TEST CODE 02120010
MAY/JUNE 2012
C A R I B B E A N E X A M I N A T I O N S C O U N C I L
ADVANCED PROFICIENCY EXAMINATION
ENVIRONMENTAL SCIENCE
UNIT 1 -Paper 01
90 minutes
f 07 MAY 2012 (a.m.))
READ THE FOLLOWING INSTRUCTIONS CAREFULLY.
1 . This test consists of 45 items. You will have 90 minutes to answer them.
2. In addition to this test booklet, you should have an answer sheet.
3 . Do not be concerned that the answer sheet provides spaces for more answers than there are itemsin this test.
4. Each item in this test has four suggested answers lettered (A), (B), (C), (D). Read each itemyou are about to answer and decide which choice is best.
5. On your answer sheet, find the number which corresponds to your item and shade the spacehaving the same letter as the answer you have chosen. Look at the sample item below.
Sample Item
The interaction of plants and animals with componentssuch as air and water defines
Sample Answer
(A) a biome (A(B) a biosphere(C) an ecosystem(D) an ecological niche
The best answer to this item is "an ecosystem", so answer space (C) has been shaded.
6. If you want to change your answer, erase it completely before you fill in your new choice.
7. When you are told to begin, turn the page and work as quickly and as carefully as you can. Ifyou cannot answer an item, go on to the next one. You may return to this item later. Your scorewill be the total number of correct answers.
8. You may use a silent, non-programmable calculator to answer items.
_ DO NOT TURN THIS PAGE UNTIL YOU ARE TOLD TO DO SO. _
The life existing in all of Earth's water, landand atmosphere is known as
(A)(B)(C)(D)
biomebiospherecommunitypopulation
Which of the following are examples of waysin which adaptation in species occurs?
I. Plants that grow thornsII. Hibernation of the bear
III. Protective colourationIV. Exotic plumage
(A) II and IV only(B) I, III and IV only(C) II, III and IV only(D) I, II, III and IV
Which of the following factors promoteecosystem stability?
I. Fluctuating rainfall patternsII. Interspecific competition
III . High levels of species diversityIV. High levels of human activity
(A) 1 and II only(B) II and III only(C) III and IV only(D) II, III and IV only
9.
10.
Item 9 refers to the following pyramiddiagram.
According to Lindermann's ten per centlaw, about ten per cent of total energy istransmitted during energy flow throughtrophic levels, indicating a gradual decreasein the amount of energy.
t
Decreasingrate ofenergy flow
The energy of Level II is 1000 kcal. Whatwould be the energy of Level III?
(A)(B)(C)(D)
10 kcal100 kcal
1 000 kcal10 000 kcal
Which of the following BEST illustrates theprocess of evolution?
(A) A popula t ion of mosquitoesdevelops resistance to a pesticide.
(B) A plant loses its leaves in a drought.(C) A population of frogs increases as
more prey becomes available.(D) A lizard's colour becomes brown
as it sits on a log.
02120010/CAPE2012GO ON TO THE NEXT PAGE
-4 -
Itein I I refers to the following graph whichshows how an ecosystem changes over time.
11.
Time (months)
The rate of population growth is HIGHESTduring the period
(A)(B)(C)(D)
0 -PP - QQ - RR - S 12.
Item 12 refers to the following graph whichshows a typical growth curve for a populationof bacteria in a nutrient medium.
5 6 7 8Time (days)
The MAXIMUM number of bacterialcolonies at the end of the period whenconditions are ideal is
(A)(B)(C)(D)
5.5 x 10³
7.0 x l O 3
7.5 x 10³
8.0 x 10³
Item 13 refers to the following results, which were obtained by students investigating the density anddistribution of three species of plants, A, B and C, in a grassy field using a 1m2 quadrat.
Quadrat ThrowSpecies
AB
C
1
964
2054
31
03
4304
540
5
620
3
71
74
8094
911
4
10504
13. The mean density, in plants/in2, of Species A in the field is
(A)(B)(C)(D)
2.603.003.253.30
02120010/CAPE2012GO ON TO THE NEXT PAGE
14. A student sampled the number of organismsin a garden. The results are shown below.
Garden Community
Species
12
3
4
Abundance
2510
40
15
What is the species diversity of the garden?
(A)(B)(C)(D)
1.611.623.243.26
16. Which of the following are factors that affectpopulation growth rate?
I. CultureII. Level of affluence
III. Social and economic status ofwomen
IV. Availability of pension schemes
(A) I, II and IV only(B) I, III and IV only(C) II, III and IV only(D) 1, II, III and IV
17.
Item 15 refers to the following graph whichshows the growth rate of bacteria at differenttemperatures.
40Temperature (°C)
15. Which of the fol lowing conclusions iscorrect'?
I. The least growth is in area Y.II. 16 °C to 32 °C identifies the
optimal rangeIII. 16 °C to 40 °C identifies the limit
of toleranceIV. Areas X and Z identify the zone of
intolerance
(A) I and II only(B) II and III only(C) II and IV only(D) III and IV only
02120010/CAPE20I2
The meaning of 'per capita freshwaterconsumption' is the average amount offreshwater consumed by
(A) the population(B) the population annually(C) each member of the population(D) each member of the population
annually
18. The TOTAL annual production of goods andservices within an economy is referred to asthe
(A) annual productivity index (ANP)(B) per capita product (PCP)(C) gross national product (GNP)(D) gross production index (GP1)
Item 19 refers to the following diagram whichrepresents a human population.
Births (B)Immigration (I)
TOTALPOPULATION
Deaths (D)Emigration (E)
19. The equation which represents an unchangedpopulation over a period of time is
(A) B + D = I + E(B) B + E = D + I
. (C) B = D + E + I(D) B + I = D + E
GO ON TO THE NEXT PAGE
- 6 -
20. Urbanization is the process which results inan increase in
(A) the number of cities in a country(B) the number of people living in cities
in a country(C) migration from rural areas in a
country(D) industrialization in urban areas in
a country
21. Which of the following is NOT a directpopulation control measure?
(A) Migration laws(B) Natural disasters(C) Family planning(D) Govemment policies
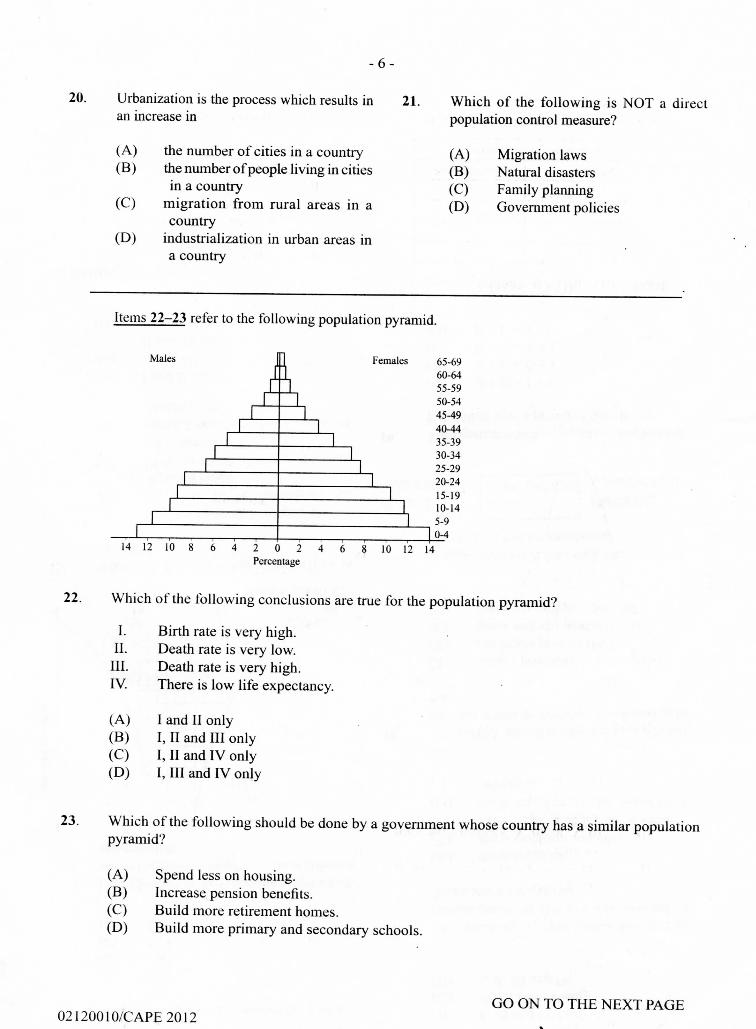
Items 22-23 refer to the following population pyramid.
Males 1
1
|
1
11
| Females 65-691 60-64| 55-59
_j 50-5445-4940-4435-39
| 30-34| 25-29| 20-24
15-19I 10-14
1 5-9|0-4
14 12 10 8 6 4 2 0 2 4 6 8 10 12 14Percentage
22. Which of the following conclusions are true for the population pyramid?
I. Birth rate is very high.II. Death rate is very low.
III. Death rate is very high.IV. There is low life expectancy.
(A) I and II only(B) I, II and III only(C) I, II and IV only(D) 1, III and IV only
23. Which of the following should be done by a government whose country has a similar populationpyramid?
(A) Spend less on housing.(B) Increase pension benefits.(C) Build more retirement homes.(D) Build more primary and secondary schools.
GO ON TO THE NEXT PAGE02120010/CAPE2012
- 7 -
24.
25.
Which of the following types of charts isNOT ideal for displaying the age structureof a population?
26. If the animal growth rate of Country X is 2%,then the doubling time, in years, for CountryXis
(A) Column(B) Pyramid(C) Line graph(D) Inverted pyramid
(A)(B)(C)(D)
3570
105140
Using the following data calculate the 27. Which of the following situations is adheringpercentage growth in population in Country to theX for the period 2008-2009.
Population Country X
2008-5,366,2192009-6,274,231
(A) 14%(B) 15%(C) 16%(D) 17%
Item 28 refers to the following graph,
I.
11.
111.
IV.
(A)(B)(C)(D)
concept of sustainable development?
Fishing the mature fish instead ofthe young fish.
Using wind power instead ofburning coal for electricity.
Monoculture to attain the highestyield per acre.
The prohibi t ion of t r ad ingendangered species
I, II and HI onlyI, II and IV onlyI, III and IV onlyI, II, III and IV
which shows different stages related to the birth and death ratesfor a typical human population over time.
% Stage I Stage II Stag•« ~ft Birth
I f f \u 0 \- \ t \ g. - ^
JS ^ \ III Stage IV
rate
\0 -
Time—^-
28. The rate of population growth starts to slow down at
(A) the end of Stage I(B) the middle of Stage II(C) the beginning of Stage 111(D) the end of Stage IV
GO ON TO THE NEXT PAGE02120010/CAPE2012
hems 29-30 refer to the following graph which shows the projected world population total up to 2100.
10
9
8
7
e*+->- 5s 3a.oa.
!"4~tU444-
T"":"""T"T"
t ±tt - -
1950
44.4 tthi:
I"1I Developed countries
2000 2050
Time (years)
2100
29. In 2025, the population in developingcountries is projected to surpass that ofthe developed countries by a factor ofapproximately
30. The projected increase in the population ofdeveloped countries, in billions, between theyears 2000 and 2075 is
(A)(B)(C)(D)
1.83.66.48.0
(A)(B)(C)(D)
0.41.62.43.6
31. Toxic pesticides can re-enter the food chainvia
(A)(B)(C)(D)
erosiontranspirationgroundwater contaminationsedimentation of water bodies
32. Which of the following terms refers to theintensive search for compounds of medicinalvalue in organisms that were not previouslyused for such purposes?
33. An example of consumptive use of forest is 37.
34.
35.
36
(A)(B)(C)(D)
loggingecotourismagroforestrybioprospecting
What agricultural practice of the indigenouspeople of the Caribbean preserves nutrients?
(A) Monoculture(B) Intercropping(C) Crop rotation(D) Slash and burn activities
A National Environmental Policy Act wouldMOST likely require all agencies responsiblefor a major project that could significantlyaffect the quality of the environment tosubmit
(A) a cost-benefit analysis(B) an environmental impact statement(C) a geographic information system
report(D) a mitigated negative declaration
Which international environmental agreementdeals specifically with wetlands?
(A) Kyoto Protocol(B) Ramsar Convention(C) Convention on Biological Diversity
(CBD)(D) Specifically Protected Areas and
Wildlife (SPAW)
38.
Human populations historically have settledin floodplains because
I. the soil in floodplains is usuallyfertile
II. the terrain in floodplains tends tobe flat
III. floodplains are close to rivers fortransportation
(A)(B)(C)(D)
I onlyI and III onlyII and III onlyI, II and 111
Which of the following is MOST likely tooccur in a forested region that recently hasbeen cleared by cutting?
(A) The concentration of nutrientsin streams running through theregion will increase.
(B) The average depth of topsoil willincrease.
(C) The water temperature in streamsrunning through the region willdecrease.
(D) The volume of run-off after rainswill decrease.
02120010/CAPE2012GO ON TO THE NEXT PAGE
- 10-
ttem 39 refers to the following table which shows a management function for each of four categoriesof protected areas.
1II
I I I
IV
Category of Protected AreaStrict nature reserveNational park
Managed resource protectedareaNatural monument
Management FunctionOnly for scienceFor ecosystem protection and recreationMainly for conservation through managementinterventionMainly for conservation of specific naturalfeatures
39. The category of protected area that is INCORRECTLY matched to the given management function is
(A)(B)(C)(D)
II I
111IV
Item 40 refers to the following pie chart which shows the estimated world arable land loss togetherwith the causes, for the period 1985-2000.
Estimated world arable land loss between 1985 and 2000
Road building,urban development,
industry(150 million ha)
Desertification (25 million ha)
Salinisation (60 million ha)
Erosion (50 million ha)
40. Based on the information shown on the pie chart above, the loss of arable land would be MOSTeffectively slowed by
(A) reducing urban development(B) using more extensive irrigation systems(C) increasing the efficiency of erosion control(D) increasing the efficiency of desalination processes
GO ON TO THE NEXT PAGE02120010/CAPE 2012
- 1 1 -
41. Measures used in the conservation of natural resources include
I. sustainable yield managementII. use of appropriate technology
III. reduction and minimization of wastesIV. physical conversion of vegetation and land
(A) I and III only(B) II and IV only(C) III and IV only(D) I, II and III only
42. Two MAJOR natural resources found in Guyana are
(A) tar and forest(B) bauxite and forest(C) oil and natural gas(D) bauxite and beaches
GO ON TO THE NEXT PAGE02120010/CAPE 2012
- 12-
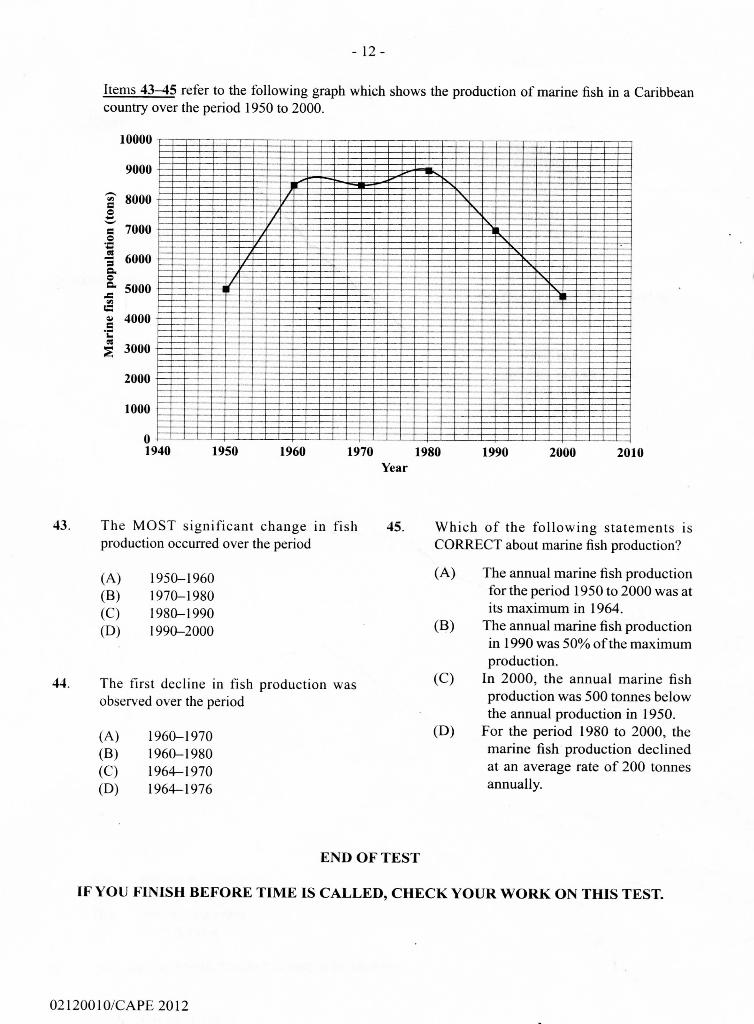
Itenis 43-45 refer to the following graph which shows the production of marine fish in a Caribbeancountry over the period 1950 to 2000.
10000
9000
3a.o
5000
| 3000
1000
0^1940 1950 1960 1970 1980
Year1990 2000 2010
43.
44.
The MOST significant change in fishproduction occurred over the period
(A)(B)(C)(D)
1950-19601970-19801980-19901990-2000
The first decline in fish production wasobserved over the period
(A)(B)(C)(D)
1960-19701960-19801964-19701964-1976
45. Which of the following statements isCORRECT about marine fish production?
(A) The annual marine fish productionfor the period 1950 to 2000 was atits maximum in 1964.
(B) The annual marine fish productionin 1990 was 50% of the maximumproduction.
(C) In 2000, the annual marine fishproduction was 500 tonnes belowthe annual production in 1950.
(D) For the period 1980 to 2000, themarine fish production declinedat an average rate of 200 tonnesannually.
END OF TEST
IF YOU FINISH BEFORE TIME IS CALLED, CHECK YOUR WORK ON THIS TEST.