Canoco 5.12 Benefits and Features Page of 1 10 Canoco for visualization of multivariate data Canoco is a software package for multivariate data analysis and visualization, with an emphasis on dimension reduction (ordination), regression analysis, and the combination of the two, constrained ordination. Canoco 5, released in 2012, is now in version 5.12. Canoco 4.0-5.0 were cited more than 10,000 times in the past 20 years (1998-2018, ISI Web of Science). Canoco 5 implements many recent advances in ordination, such as variation partitioning, co- correspondence analysis, distance-based redundancy analysis and double constrained ordination for trait-environment association, but the major advance is in user- friendliness. In Canoco 5, data import, analyses and making graphs are integrated in a single Canoco 5 project. The Canoco Adviser helps in choosing data transformations and methods of analysis. Numerical analyses that used to take many runs, are now available through a single analysis template and the Analysis Notebook concisely summarizes the results and allows access to the full results. All analyses done on a set of data tables are now collected within Canoco 5 projects, sharing the analytical and graphing settings. Canoco 5 helps to make even better publication-quality ordination diagrams. The manual has been largely re-written and the large set of real-life examples is updated and extended to show new ways of working with multivariate data. Introduction to Canoco Human beings wish to detect, explain and understand pattern and structure in nature. The aim can be scientific or technical or often both. But nature can be chaotic and so pattern and structure must often be derived from noisy data- sets ranging from a few to many cases and variables. Ordination methods as provided by Canoco can help scientists to infer pattern and structure from such data sets, in particular in the form of relationships among cases and variables. The data may arise from the field or the laboratory, and can be observational or experimental. Nowadays many data-sets come from high- throughput instruments resulting in DNA profiles or expression levels or in the amounts of proteins or metabolites with associated factors or properties of the sample, such as tissue type, experimental treatments, and time of sampling.
Transcript
Canoco 5.12 Benefits and Features Page � of �1 10
Canoco for visualization of multivariate data
Canoco is a software package for multivariate data analysis and visualization, with an emphasis on dimension reduction (ordination), regression analysis, and the combination of the two, constrained ordination.Canoco 5, released in 2012, is now in version 5.12. Canoco 4.0-5.0 were cited more than 10,000 times in the past 20 years (1998-2018, ISI Web of Science). Canoco 5 implements many recent advances in ordination, such as variation partitioning, co-correspondence analysis, distance-based redundancy analysis and double constrained ordination for trait-environment association, but the major advance is in user-friendliness.In Canoco 5, data import, analyses and making graphs are integrated in a single Canoco 5 project. The Canoco Adviser helps in choosing data transformations and methods of analysis. Numerical analyses that used to take many runs, are now available through a single analysis template and the Analysis Notebook concisely summarizes the results and allows access to the full results. All analyses done on a set of data tables are now collected within Canoco 5 projects, sharing the analytical and graphing settings. Canoco 5 helps to make even better publication-quality ordination diagrams. The manual has been largely re-written and the large set of real-life examples is updated and extended to show new ways of working with multivariate data.
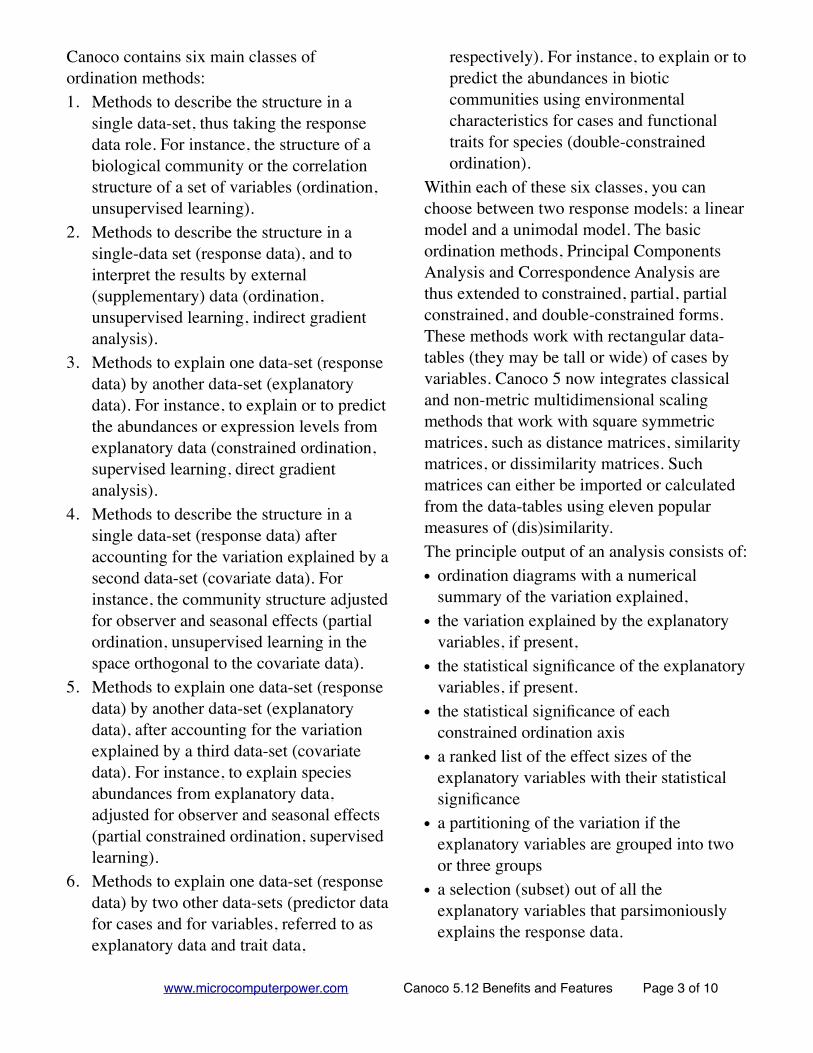
Introduction to CanocoHuman beings wish to detect, explain and understand pattern and structure in nature. The aim can be scientific or technical or often both. But nature can be chaotic and so pattern and structure must often be derived from noisy data-sets ranging from a few to many cases and variables. Ordination methods as provided by Canoco can help scientists to infer pattern and structure from such data sets, in particular in the form of relationships among cases and variables. The data may arise from the field or the
laboratory, and can be observational or experimental. Nowadays many data-sets come from high-throughput instruments resulting in DNA profiles or expression levels or in the amounts of proteins or metabolites with associated factors or properties of the sample, such as tissue type, experimental treatments, and time of sampling.
www.microcomputerpower.com Canoco 5.12 Benefits and Features Page � of �2 10
Canoco software offers methods in which data-tables and/or their constituent variables are assigned a particular role. There are four roles. The data-table that is to be understood in some way takes the role of response data. If data are subjected to analysis to find the main structure, those data are said to take the response data role. The reason is that in this method the data are explained by ordination axes (hypothetical explanatory variables or latent variables). The resulting ordination of this data-table can then be interpreted by variables in a second data-table taking the role of supplementary data. Explanatory data (in the second or a third data-table) takes a stronger role than just interpretation. As its name says, its variables are used to explain the response data. In consequence, the ordination must focus on the explained variation and on the effects that the explanatory variables have on the response data. This is achieved by constrained ordination which integrates aspects of (unconstrained) ordination and multiple regression. Constrained ordination brings in the power of regression analysis such as variation partitioning and statistical testing of effects. The final role is the covariate data role. Covariates (often in the same data-table as the explanatory or supplementary data) enable the detection of the main structure in the response data after accounting for the variation explained by these covariates. All data other than response data is often termed metadata.
Canoco methods originated in the field of ecology. There, ordination analysis with Canoco can provide insights into the structure of biological communities and into the impact of natural and human-induced environmental disturbances on biological assemblages. Canoco has been used in the past to help answer research questions such as:• How does the vegetation develop on
abandoned cultivation sites within a tropical rain forest?
• How does agricultural management practice affect meadow vegetation?
• What are the effects on forest undergrowth if liming is used to mitigate the effects of acid rain?
• Do diatoms respond so strongly to lake pH that they can be used to monitor trends in acidity?
• How long does it take before an invertebrate community recovers from an application of the insecticide chlorpyrifos? How does the time to recover depend on the concentration?
From the way these questions are worded it is already fairly clear which are the response data and which data have an explanatory or supplementary role.
www.microcomputerpower.com Canoco 5.12 Benefits and Features Page � of �3 10
Canoco contains six main classes of ordination methods:1. Methods to describe the structure in a
single data-set, thus taking the response data role. For instance, the structure of a biological community or the correlation structure of a set of variables (ordination, unsupervised learning).
2. Methods to describe the structure in a single-data set (response data), and to interpret the results by external (supplementary) data (ordination, unsupervised learning, indirect gradient analysis).
3. Methods to explain one data-set (response data) by another data-set (explanatory data). For instance, to explain or to predict the abundances or expression levels from explanatory data (constrained ordination, supervised learning, direct gradient analysis).
4. Methods to describe the structure in a single data-set (response data) after accounting for the variation explained by a second data-set (covariate data). For instance, the community structure adjusted for observer and seasonal effects (partial ordination, unsupervised learning in the space orthogonal to the covariate data).
5. Methods to explain one data-set (response data) by another data-set (explanatory data), after accounting for the variation explained by a third data-set (covariate data). For instance, to explain species abundances from explanatory data, adjusted for observer and seasonal effects (partial constrained ordination, supervised learning).
6. Methods to explain one data-set (response data) by two other data-sets (predictor data for cases and for variables, referred to as explanatory data and trait data,
respectively). For instance, to explain or to predict the abundances in biotic communities using environmental characteristics for cases and functional traits for species (double-constrained ordination).
Within each of these six classes, you can choose between two response models: a linear model and a unimodal model. The basic ordination methods, Principal Components Analysis and Correspondence Analysis are thus extended to constrained, partial, partial constrained, and double-constrained forms. These methods work with rectangular data-tables (they may be tall or wide) of cases by variables. Canoco 5 now integrates classical and non-metric multidimensional scaling methods that work with square symmetric matrices, such as distance matrices, similarity matrices, or dissimilarity matrices. Such matrices can either be imported or calculated from the data-tables using eleven popular measures of (dis)similarity. The principle output of an analysis consists of:• ordination diagrams with a numerical
summary of the variation explained,• the variation explained by the explanatory
variables, if present,• the statistical significance of the explanatory
variables, if present.• the statistical significance of each
constrained ordination axis • a ranked list of the effect sizes of the
explanatory variables with their statistical significance
• a partitioning of the variation if the explanatory variables are grouped into two or three groups
• a selection (subset) out of all the explanatory variables that parsimoniously explains the response data.
Discriminant analysis CVA, Fisher’s linear multi-group
discriminant analysis
CVA
GLM Generalized linear models, including multiple
regression
CVA, Multregr
CWM-RDA Community-weighed means RDA Traits
Response trait-methods Response variable-level analysis of response
traits (e.g. species traits)
Traits
*
available via the Analysis | Add new analysis| Compare ordinations menu command
From version 4.0 Petr Šmilauer took the lead in improving the user interface and the
capabilities of the program. CANOCO 4.0 was the first to have a Windows user interface under
Microsoft Windows™. A console version of CANOCO 4.x continued to be available, but has
now become obsolete. The facilities for permutation tests were further extended in versions 4.x
to include tests for split-plot designs and related multi-level designs, and the scaling of the
response variable scores was also improved. The documentation became a 500 page blue
manual. CANOCO 4.5 was bundled with CanoDraw for Windows, which replaced two separate
programs used in version 4.0 (CanoDraw 3.1 and CanoPost). Data could be imported from
spreadsheets with the Windows utility, WCanoImp, and several data-tables could be combined
with the CanoMerge program. Program PrCoord provided an easy access to the distance-based
RDA method for Canoco users. The whole package was called Canoco for Windows.
In version 5 the separate programs are all fully integrated into one and we name the
integrated package Canoco 5, so abolishing the capitals from the computer stone age. Data-
tables are now visible and editable in the spreadsheet-like Data Notebook. They form the basis
of the Canoco 5 project files with extension c5p, for example Algae.c5p. The project file collects
all the analyses performed on the data, with both the graphical and the numerical output of each
analysis collected in the Analysis Notebook. Moreover, analyses can have multiple steps. This
enables packaging more complicated tasks into a single analysis, such as the variation
decomposition that used to take many separate runs in CANOCO 4.x. Many common types of
analyses are available as analysis templates, arranged in folders running from standard to
advanced. Many users will stick to using templates, but it is not difficult to make customized
analyses, when needed. The Canoco Adviser gives suggestions for interesting analyses and
appropriate data transformations. The famous example set of CANOCO 4.x has been reworked
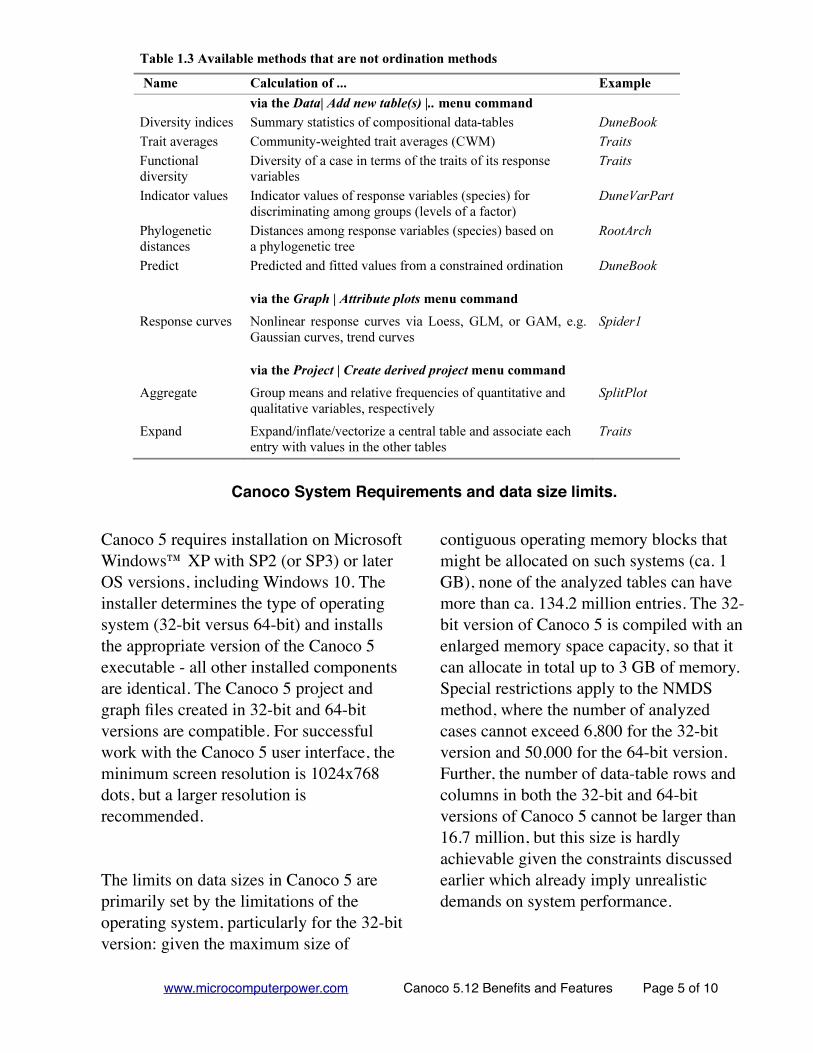
Tables extracted directly from the 536 page Canoco 5.1 ManualThe tables cross reference Example analyses studied in the manual. The examples come from peer-reviewed articles using original data sets also included in the Canoco distribution.
Diversity of a case in terms of the traits of its response
variables
Traits
Indicator values Indicator values of response variables (species) for
discriminating among groups (levels of a factor)
DuneVarPart
Phylogenetic
distances
Distances among response variables (species) based on
a phylogenetic tree
RootArch
Predict Predicted and fitted values from a constrained ordination DuneBook
via the Graph | Attribute plots menu command
Response curves Nonlinear response curves via Loess, GLM, or GAM, e.g.
Gaussian curves, trend curves
Spider1
via the Project | Create derived project menu command
Aggregate
Group means and relative frequencies of quantitative and
qualitative variables, respectively
SplitPlot
Expand Expand/inflate/vectorize a central table and associate each
entry with values in the other tables
Traits
1.3 Organization of the chapters
Chapter 2 (Canoco tutorial) describes the installation of the software under the Windows
operating systems and provides tutorial sessions on how to create a project from data in Excel
spreadsheets, how to carry out ordination analyses and how to make ordination diagrams. The
second part focuses on CANOCO 4.x users and helps them to get started quickly with version 5.
Chapter 3 gives the background theory, with topics such as interpreting ordination diagrams,
permutation tests with P-value adjustments, the analysis of compositional data, and distance-
based methods. The emphasis here is on aspects that are new or that deserve more attention than
is given in the Data Analysis textbook (Jongman et al. 1995), the Unimodal Models booklet (Ter
Braak 1987) or its extended version (Ter Braak 1996), which is included with Canoco 5 in
electronic form (see section 8.6).
Chapter 4 describes the Canoco application workspace, the Data Notebook, how to set up
analyses of the data with the Canoco Adviser, and how to obtain graphs using the Graph Wizard.
The results of an analysis are the topic of Chapter 5. Chapter 6 presents examples of most of the
methods available in Canoco 5. It shows how the results of the ordination examples in the
Unimodal Models booklet can be obtained with Canoco (section 6.2) and also illustrates with
real data how to carry out and interpret variation partitioning and more advanced methods such
as principal response curves (section 6.3). Sections 6.4 and 6.5 illustrate specialized analyses,
Canoco 5 requires installation on Microsoft Windows™ XP with SP2 (or SP3) or later OS versions, including Windows 10. The installer determines the type of operating system (32-bit versus 64-bit) and installs the appropriate version of the Canoco 5 executable - all other installed components are identical. The Canoco 5 project and graph files created in 32-bit and 64-bit versions are compatible. For successful work with the Canoco 5 user interface, the minimum screen resolution is 1024x768 dots, but a larger resolution is recommended.
The limits on data sizes in Canoco 5 are primarily set by the limitations of the operating system, particularly for the 32-bit version: given the maximum size of
contiguous operating memory blocks that might be allocated on such systems (ca. 1 GB), none of the analyzed tables can have more than ca. 134.2 million entries. The 32-bit version of Canoco 5 is compiled with an enlarged memory space capacity, so that it can allocate in total up to 3 GB of memory. Special restrictions apply to the NMDS method, where the number of analyzed cases cannot exceed 6,800 for the 32-bit version and 50,000 for the 64-bit version. Further, the number of data-table rows and columns in both the 32-bit and 64-bit versions of Canoco 5 cannot be larger than 16.7 million, but this size is hardly achievable given the constraints discussed earlier which already imply unrealistic demands on system performance.
www.canoco5.com Canoco 5.12 Benefits and Features Page � of �6 10
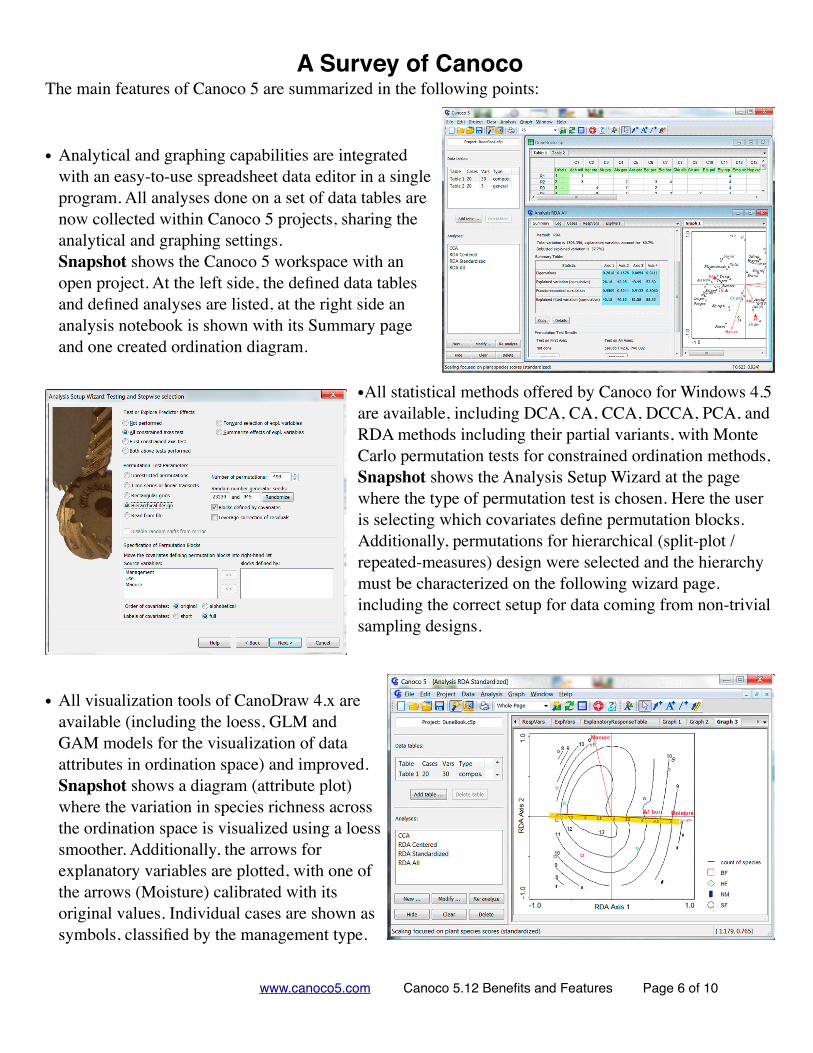
A Survey of CanocoThe main features of Canoco 5 are summarized in the following points:
• Analytical and graphing capabilities are integrated with an easy-to-use spreadsheet data editor in a single program. All analyses done on a set of data tables are now collected within Canoco 5 projects, sharing the analytical and graphing settings. Snapshot shows the Canoco 5 workspace with an open project. At the left side, the defined data tables and defined analyses are listed, at the right side an analysis notebook is shown with its Summary page and one created ordination diagram.
•All statistical methods offered by Canoco for Windows 4.5 are available, including DCA, CA, CCA, DCCA, PCA, and RDA methods including their partial variants, with Monte Carlo permutation tests for constrained ordination methods, Snapshot shows the Analysis Setup Wizard at the page where the type of permutation test is chosen. Here the user is selecting which covariates define permutation blocks. Additionally, permutations for hierarchical (split-plot / repeated-measures) design were selected and the hierarchy must be characterized on the following wizard page. including the correct setup for data coming from non-trivial sampling designs.
• All visualization tools of CanoDraw 4.x are available (including the loess, GLM and GAM models for the visualization of data attributes in ordination space) and improved. Snapshot shows a diagram (attribute plot) where the variation in species richness across the ordination space is visualized using a loess smoother. Additionally, the arrows for explanatory variables are plotted, with one of the arrows (Moisture) calibrated with its original values. Individual cases are shown as symbols, classified by the management type.
www.canoco5.com Canoco 5.12 Benefits and Features Page � of �7 10
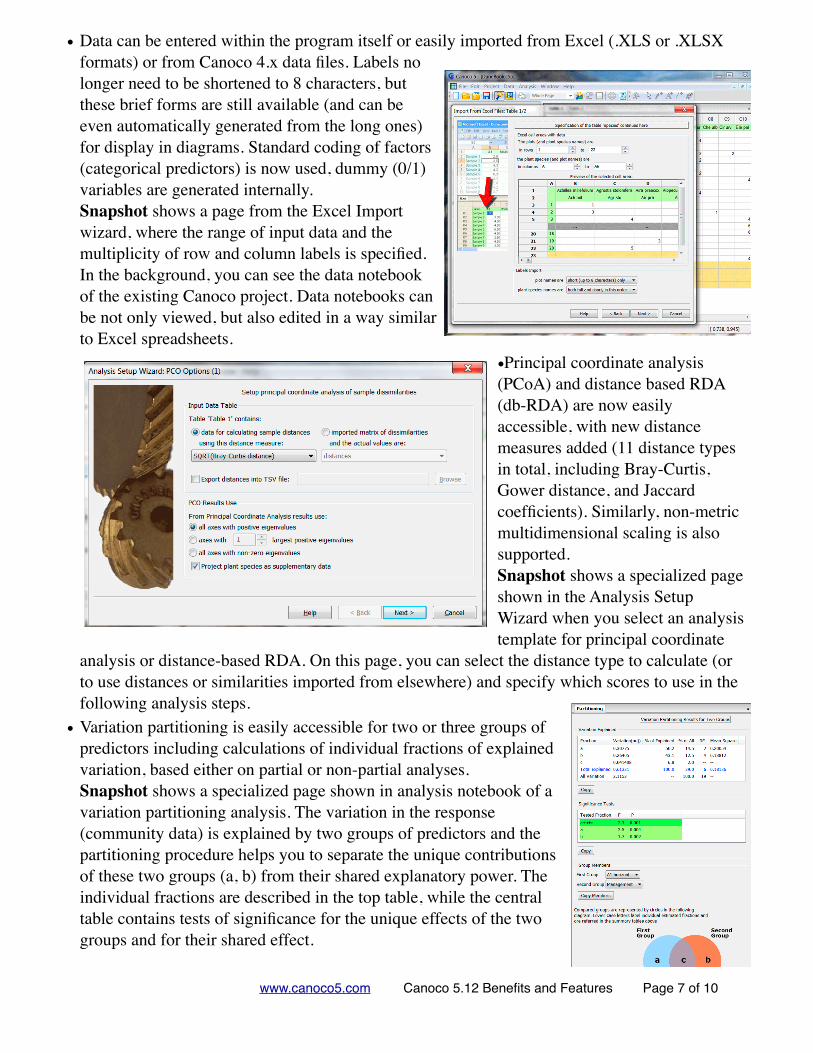
• Data can be entered within the program itself or easily imported from Excel (.XLS or .XLSX formats) or from Canoco 4.x data files. Labels no longer need to be shortened to 8 characters, but these brief forms are still available (and can be even automatically generated from the long ones) for display in diagrams. Standard coding of factors (categorical predictors) is now used, dummy (0/1) variables are generated internally. Snapshot shows a page from the Excel Import wizard, where the range of input data and the multiplicity of row and column labels is specified. In the background, you can see the data notebook of the existing Canoco project. Data notebooks can be not only viewed, but also edited in a way similar to Excel spreadsheets.
•Principal coordinate analysis (PCoA) and distance based RDA (db-RDA) are now easily accessible, with new distance measures added (11 distance types in total, including Bray-Curtis, Gower distance, and Jaccard coefficients). Similarly, non-metric multidimensional scaling is also supported. Snapshot shows a specialized page shown in the Analysis Setup Wizard when you select an analysis template for principal coordinate
analysis or distance-based RDA. On this page, you can select the distance type to calculate (or to use distances or similarities imported from elsewhere) and specify which scores to use in the following analysis steps.
• Variation partitioning is easily accessible for two or three groups of predictors including calculations of individual fractions of explained variation, based either on partial or non-partial analyses. Snapshot shows a specialized page shown in analysis notebook of a variation partitioning analysis. The variation in the response (community data) is explained by two groups of predictors and the partitioning procedure helps you to separate the unique contributions of these two groups (a, b) from their shared explanatory power. The individual fractions are described in the top table, while the central table contains tests of significance for the unique effects of the two groups and for their shared effect.
www.canoco5.com Canoco 5.12 Benefits and Features Page � of �8 10
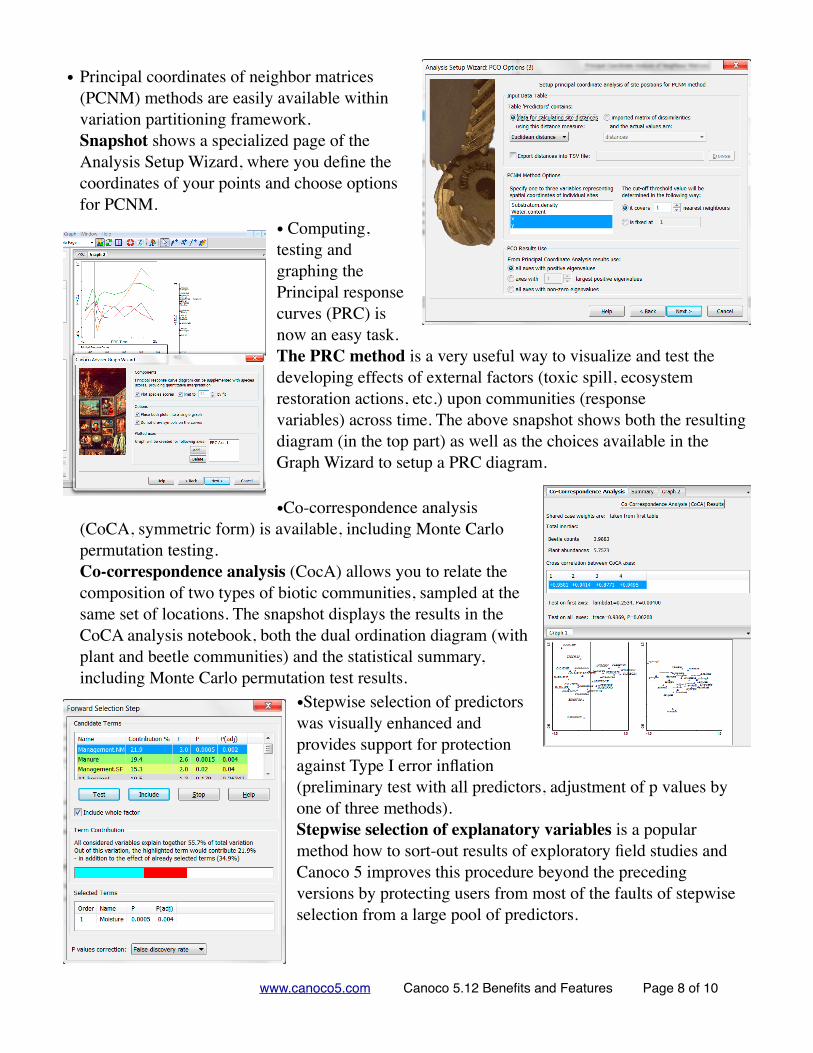
• Principal coordinates of neighbor matrices (PCNM) methods are easily available within variation partitioning framework. Snapshot shows a specialized page of the Analysis Setup Wizard, where you define the coordinates of your points and choose options for PCNM.
• Computing, testing and graphing the Principal response curves (PRC) is now an easy task. The PRC method is a very useful way to visualize and test the developing effects of external factors (toxic spill, ecosystem restoration actions, etc.) upon communities (response variables) across time. The above snapshot shows both the resulting diagram (in the top part) as well as the choices available in the Graph Wizard to setup a PRC diagram.
•Co-correspondence analysis (CoCA, symmetric form) is available, including Monte Carlo permutation testing. Co-correspondence analysis (CocA) allows you to relate the composition of two types of biotic communities, sampled at the same set of locations. The snapshot displays the results in the CoCA analysis notebook, both the dual ordination diagram (with plant and beetle communities) and the statistical summary, including Monte Carlo permutation test results.
•Stepwise selection of predictors was visually enhanced and provides support for protection against Type I error inflation (preliminary test with all predictors, adjustment of p values by one of three methods). Stepwise selection of explanatory variables is a popular method how to sort-out results of exploratory field studies and Canoco 5 improves this procedure beyond the preceding versions by protecting users from most of the faults of stepwise selection from a large pool of predictors.
www.canoco5.com Canoco 5.12 Benefits and Features Page � of �9 10
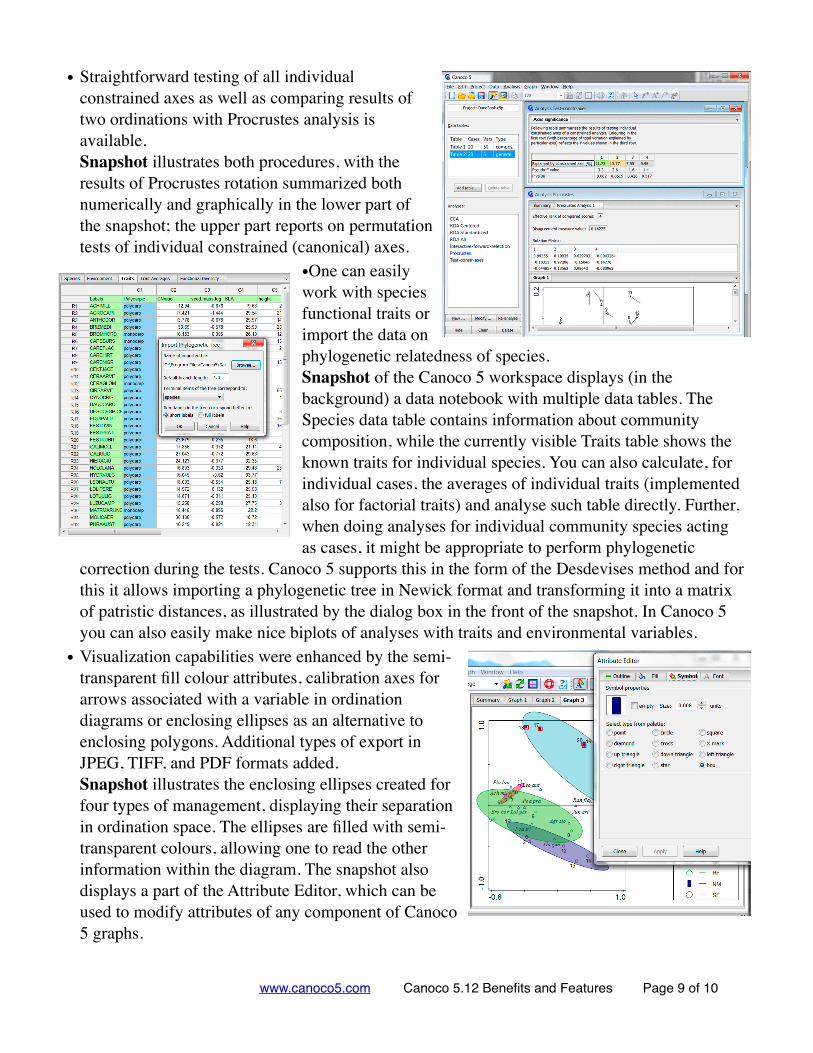
• Straightforward testing of all individual constrained axes as well as comparing results of two ordinations with Procrustes analysis is available. Snapshot illustrates both procedures, with the results of Procrustes rotation summarized both numerically and graphically in the lower part of the snapshot; the upper part reports on permutation tests of individual constrained (canonical) axes.
•One can easily work with species functional traits or import the data on phylogenetic relatedness of species. Snapshot of the Canoco 5 workspace displays (in the background) a data notebook with multiple data tables. The Species data table contains information about community composition, while the currently visible Traits table shows the known traits for individual species. You can also calculate, for individual cases, the averages of individual traits (implemented also for factorial traits) and analyse such table directly. Further, when doing analyses for individual community species acting as cases, it might be appropriate to perform phylogenetic
correction during the tests. Canoco 5 supports this in the form of the Desdevises method and for this it allows importing a phylogenetic tree in Newick format and transforming it into a matrix of patristic distances, as illustrated by the dialog box in the front of the snapshot. In Canoco 5 you can also easily make nice biplots of analyses with traits and environmental variables.
• Visualization capabilities were enhanced by the semi-transparent fill colour attributes, calibration axes for arrows associated with a variable in ordination diagrams or enclosing ellipses as an alternative to enclosing polygons. Additional types of export in JPEG, TIFF, and PDF formats added. Snapshot illustrates the enclosing ellipses created for four types of management, displaying their separation in ordination space. The ellipses are filled with semi-transparent colours, allowing one to read the other information within the diagram. The snapshot also displays a part of the Attribute Editor, which can be used to modify attributes of any component of Canoco 5 graphs.
www.microcomputerpower.com Canoco 5.12 Benefits and Features Page � of �10 10
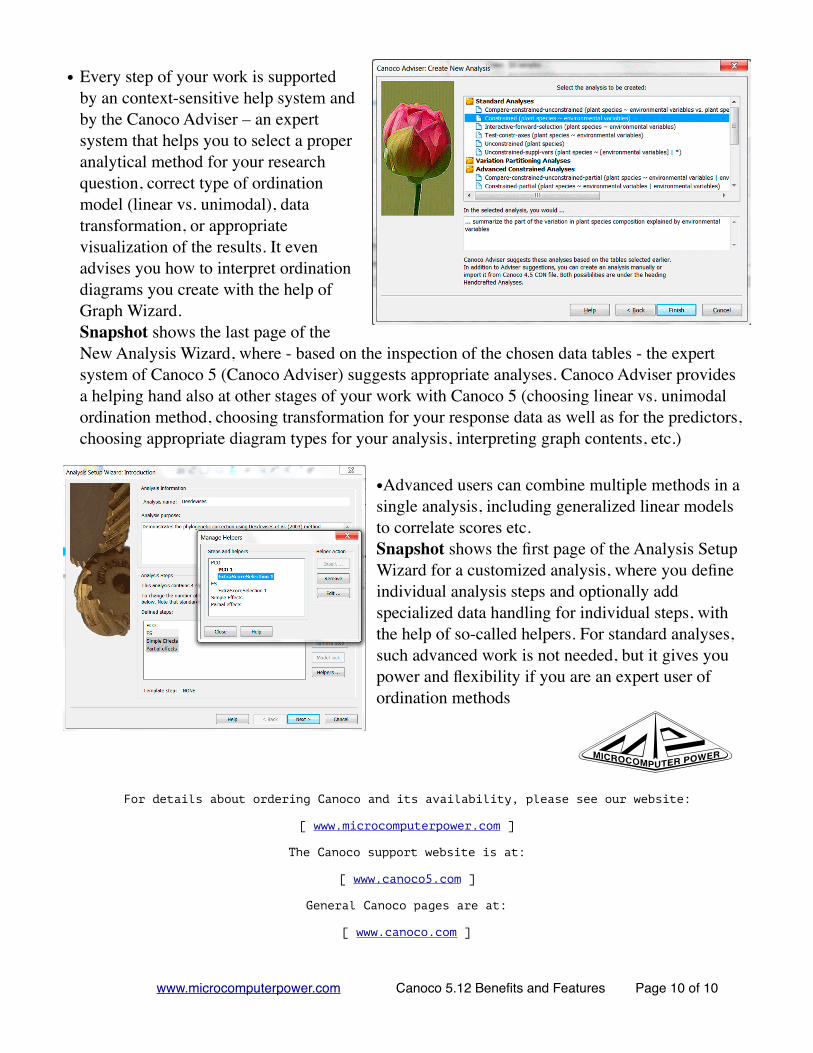
• Every step of your work is supported by an context-sensitive help system and by the Canoco Adviser – an expert system that helps you to select a proper analytical method for your research question, correct type of ordination model (linear vs. unimodal), data transformation, or appropriate visualization of the results. It even advises you how to interpret ordination diagrams you create with the help of Graph Wizard. Snapshot shows the last page of the New Analysis Wizard, where - based on the inspection of the chosen data tables - the expert system of Canoco 5 (Canoco Adviser) suggests appropriate analyses. Canoco Adviser provides a helping hand also at other stages of your work with Canoco 5 (choosing linear vs. unimodal ordination method, choosing transformation for your response data as well as for the predictors, choosing appropriate diagram types for your analysis, interpreting graph contents, etc.)
•Advanced users can combine multiple methods in a single analysis, including generalized linear models to correlate scores etc. Snapshot shows the first page of the Analysis Setup Wizard for a customized analysis, where you define individual analysis steps and optionally add specialized data handling for individual steps, with the help of so-called helpers. For standard analyses, such advanced work is not needed, but it gives you power and flexibility if you are an expert user of ordination methods
M For details about ordering Canoco and its availability, please see our website: