INT. J. REMOTE SENSING, 1985, VOL. 6, No.8, 1335-1372 Canopy reflectance, photosynthesis and transpiration P. J. SELLERS Hydrological Sciences Branch/Code 624, NASA/Goddard Space Flight Center, Greenbelt, Maryland 20771, U.S.A. (Received 19 February 1985) Abstract. A two-stream approximation model of radiative transfer is used 10 calculate values of hemispheric canopy reflectance in the visible and near-infrared wavelength intervals.Simpleleaf modelsof photosynthesis and stomatal resistance' are integrated over leaf orientation and canopy depth to obtain estimatesof canopy photosynthesis and bulk stomatal or canopy resistance. The ratio of near-infrared and visiblereflectances ispredicted to bea near linear indicator of minimumcanopy resistance and photosynthetic capacity but a poor predictor of leaf area index or biomass. 1. Introduction A number of recent studies have investigated the correlation between the state of a given terrestrial vegetation cover and its spectral reflectance as obtained via field measurements or from remote-sensing platforms. In particular, efforts have concen- trated on: (I) Relating the simple ratio or the normalized difference (the vegetation index) of the reflected visible and near-infrared radiances to leaf area index and/or biomass (see, for example, Asrar et al. 1984, Tucker et al. 1981, Curran 1980). (2) Relating the simple ratio (sic) or vegetation index to the amount of photosyn- thetically active radiation (PAR) absorbed by a vegetated surface (see, for example, Asrar et al. 1984). (3) Relating the time-integral of the amount of PAR absorbed by the vegetation canopy to biomass production (see, for example, Monteith 1977). This paper explores means by which the simple ratio of the reflectances or the vegetation index may be used to obtain estimates of gross primary productivity and the canopy resistance to transpiration loss. The methods involve the use of models that integrate existing formulations which describe the interception of radiation, photosyn- thesis and transpiration by individual leaves over whole canopies. Some simplifying assumptions are made to facilitate the solution of the relevant equations, but it is thought that the effect of these simplifications upon the results is small. The discussion that follows is divided into three parts. The first part describes a radiative transfer model which may be used to calculate the spectral reflectance of vegetated surfaces. Next, mathematical representations of the photosynthetic and transpiration rates of individual leaves as functions of environmental variables are briefly reviewed. Simplified versions of two of these formulae are then integrated in order to calculate values of the photosynthetic rate and the surface resistance of whole Downloaded by [Colorado State University] at 13:44 05 May 2013
Transcript
INT. J. REMOTE SENSING, 1985, VOL. 6, No.8, 1335-1372
Canopy reflectance, photosynthesis and transpiration
P. J. SELLERSHydrological Sciences Branch/Code 624, NASA/Goddard Space Flight Center,Greenbelt, Maryland 20771, U.S.A.
(Received 19 February 1985)
Abstract. A two-stream approximation model of radiative transfer is used 10calculate values of hemispheric canopy reflectance in the visible and near-infraredwavelength intervals.Simpleleafmodelsof photosynthesis and stomatal resistance'are integratedover leaforientation and canopy depth to obtain estimatesof canopyphotosynthesis and bulk stomatal or canopy resistance.The ratio of near-infraredand visiblereflectances ispredicted to bea near linear indicator ofminimumcanopyresistance and photosynthetic capacity but a poor predictor of leaf area index orbiomass.
1. IntroductionA number of recent studies have investigated the correlation between the state of a
given terrestrial vegetation cover and its spectral reflectance as obtained via fieldmeasurements or from remote-sensing platforms. In particular, efforts have concen-trated on:
(I) Relating the simple ratio or the normalized difference (the vegetation index) ofthe reflected visible and near-infrared radiances to leaf area index and/orbiomass (see, for example, Asrar et al. 1984, Tucker et al. 1981, Curran 1980).
(2) Relating the simple ratio (sic) or vegetation index to the amount of photosyn-thetically active radiation (PAR) absorbed by a vegetated surface (see, forexample, Asrar et al. 1984).
(3) Relating the time-integral of the amount of PAR absorbed by the vegetationcanopy to biomass production (see, for example, Monteith 1977).
This paper explores means by which the simple ratio of the reflectances or thevegetation index may be used to obtain estimates ofgross primary productivity and thecanopy resistance to transpiration loss. The methods involve the use of models thatintegrate existing formulations which describe the interception of radiation, photosyn-thesis and transpiration by individual leaves over whole canopies. Some simplifyingassumptions are made to facilitate the solution of the relevant equations, but it isthought that the effect of these simplifications upon the results is small.
The discussion that follows is divided into three parts. The first part describes aradiative transfer model which may be used to calculate the spectral reflectance ofvegetated surfaces. Next, mathematical representations of the photosynthetic andtranspiration rates of individual leaves as functions of environmental variables arebriefly reviewed. Simplified versions of two of these formulae are then integrated inorder to calculate values of the photosynthetic rate and the surface resistance ofwhole
Dow
nloa
ded
by [C
olor
ado
Stat
e U
nive
rsity
] at 1
3:44
05
May
201
3
1336 P. J. Sellers
canopies. Lastly, the integrals of photosynthesis and canopy resistance are comparedwith equivalent simple ratio and vegetation index values.
2. Radiative transfer in vegetative canopies2.1. The two-stream approximation radiative transfer model
Rigorous, realistic models of the interception, scattering and absorption ofradiation by vegetation communities have been designed and tested, (see, for example,the work of Suits (1972), Kimes (1984) and Goudriaan (J977). These models describethe process of radiative transfer via a finite-element approach whereby the scatteredrays of radiation are traced numerically. Although these techniques allow one toinclude intricate details regarding the optical characteristics of leaf elements (e.g. non-isotropic scattering), they tend to be computationally expensive and cumbersome touse. The requirement for this investigation is a computationally cheap model that isreadily manipulable.
For the purpose of this preliminary study, therefore, we shall use a simple butreasonably realistic analytical approach. Dickinson (J983) reviewed the work ofMeador and Weaver (J980) in which the application of the two-stream approximationmethod to the description of radiative transfer in atmospheres was summarized. Thesame equations may be adapted to describe radiative transfer in vegetative canopies forwhich Dickinson (1983) proposed the following form
- ji (dIi /dL)+ [I - (I - P)w]lj - wPIl = wjiKPo exp ( - KL) (J)
ji (dl !jdL)+ [I -(1-P)w]ll-wtHi =wjiK(l- Po)exp (- KL) (2)
where Ii and I! are the upward and downward diffuse radiative fluxes, normalized bythe incident flux,Jlis the cosine of the zenith angle of the incident beam, K is the opticaldepth of direct beam per unit leaf area and is equal to G(Jl)/Jl, G(Jl) is the relativeprojected area of leaf elements in the direction cos - I u, ji is the average inverse diffuseoptical depth per unit leaf area and is equal to J6[Jl'/G(Jl')] du', Jl' is the direction ofscattered flux, w is the scattering coefficient and is equal to IX+ r, IX is the leaf-elementreflectance, r is the leaf-element transmittance and L is the cumulative leaf area index.
In equations (J) and (2) the individual leaves are treated as isotropic scatteringelements. In nature, however, leaf reflectivity commonly increases as the angle betweenthe incident beam and leaf plane decreases. This effect is probably only significantwithin a narrow range of glancing angles and will be ignored here.
Physical processes can be attributed to each of the four terms in (I) and (2).Equation (I) describes the vertical profile of the upward diffuse radiative flux, Ii,within the canopy. It should be noted that both the upward and downward diffusefluxes are assumed to be completely isotropic. The first term in equation (J) describesthe attenuation of the upward diffuse flux. The second term defines that fraction of ljthat is rescattered in an upward direction following interaction with leafelements. Thethird terms refers to the fraction of the downward diffuse flux, 1L which is convertedinto an upward diffuse flux by backscattering. The last term on the righthand side ofequation (I) refers to the contribution to the upward diffuse flux by the scattering ofdirect incident flux penetrating to the specified depth L in the canopy. Correspondingdescriptions may be assigned to the four terms in equation (2) which describes theprofile of the downward diffuse flux.
Pand Poare the upscatter parameters for the diffuse and direct beams, respectively.
Dow
nloa
ded
by [C
olor
ado
Stat
e U
nive
rsity
] at 1
3:44
05
May
201
3
Canopy reflectance, photosynthesis and transpiration 1337
wp may be inferred from the analysis of Norman and Jarvis (1975)
WP=HIX+T+(IX-T)COS2 l1] (3)
lJ is the mean leaf inclination angle relative to the horizontal plane (identical to anglebetween leaf normal and local vertical). .
In equation (3) the leaf is treated as an inclined plane with isotropic forward andbackscattering properties. A flat leaf (cos lJ= I) will reflect downward fluxes ·into theupwards direction only and will transmit in the downwards direction only. As the leaf-angle inclination increases, a greater fraction of the downward diffuse flux may bereflected into the lower hemisphere and transmitted into the upper hemisphere.If equations (I) and (2) are solved in the w--+O limit (single scatter approximation
and semi-infinite canopy), the upward diffuse flux at the canopy top may be taken asequal to the single scattering albedo. Manipulation of the resultant expression gives usan equation for the diffuse upscatter parameter, Po, where
l+pKPo = wPK as(JL)
and as(JL), the single scattering albedo, is given by
(4)
() rI JLT(JL, JL') d 'as JL =W Jo [JLG(JL')+JL'G(JL)J JL (5)
where r(JL, JL') =G(JL)G(JL')P(JL, JL') and P(JL, JL') is the scattering phase function. Much ofthe above discussion borrows heavily from the review ofDickinson (1983) where a fulldescription of the derivation of the parameters P, Po and as(JL) may be found.
A simple expression for as(JL) may be found if we assume isotropic scattering for theleaf elements
P(JL, JL') o:1/G(JL') (6)
The scattering phase function P(JL, JL') is now independent of the angle of theincident beam. To satisfy the normalization expression
f I P(JL, JL')G(JL') dJL' = I (7)
P(JL, JL') must be equal to [2G(JL')J - '. Insertion of equation (7) into equation (5) yieldsan expression for as(JL) that may be readily solved for a number of leaf-angledistributions.
Dickinson (1983) adapted a solution from Meador and Weaver (1980) whichdescribes the albedo of a semi-infinite medium. Accordingly the hemispheric canopyalbedo, ac(/l), for an infinitely thick canopy is defined as
ac(JL) =Ii at L =O.a( )=wPK [ I + (2Po- \)P1Jc JL (P2 +PK)(I +P,)
(8)
where LT is the total leaf area index, P,=(I-W)/P2 and P2=(I-W)'/2(1=W+2PW)'/2. Equation (8) provides us with a useful check at one of the limits of thefollowing analysis, i.e. a very dense canopy.
When considering cases where the soil surface may playa part in the scattering of
Dow
nloa
ded
by [C
olor
ado
Stat
e U
nive
rsity
] at 1
3:44
05
May
201
3
1338 P. J. Sellers
direct beam radiation (i.e. a sparse canopy), we may solve equations (I) and (2) withboundary conditions appropriate to a vegetative canopy covering a reflective soilsurface
l!=O atL=OIi = p,[I! +exp (- KLr)] (9)
p, is the soil reflectance. The second boundary condition implies that both thedowncoming diffuse and direct radiation above the soil surface are reflectedisotropically.
The solution of equations (I) and (2) with equation (9) yields
Ij = [hi exp( - KL)](u+h2 exp( -hL)+h3 eXP(hL)}l! = [h4 exp( - KL)](u+h s exp (-hL)+h6 exp (hL) (10)
The values of the constants, a, hand h, to h6 are determined from manipulation ofequations (I) and (2) and are provided in the Appendix.The canopy albedo is then simply given by
(II)
Suitable boundary conditions may be used in place of equation (9) and the directradiation terms on the right-hand sides ofequations (I) and (2) dropped from the basicequation set to solve for incident diffuse radiative fluxes (see the Appendix).Henceforth, the term albedo will refer to the sum of the diffuse and direct componentsof albedo.The exact value ofthe calculated albedo willdepend upon the value ofthe constants
in equation (II) which in turn depend upon
(I) the scattering coefficients for. the leaves and soil,(2) the leaf-area index,(3) the leaf-angle distribution and(4) the angle of the incident radiation.
2.2. Comparison of radiative transfer model results with observationsMuch of the discussion in this paper makes use ofoptical property values typical of
a maize canopy (see, for example, Goudriaan 1977, Dickinson 1983, Miller 1972) asshown in table I. The following assumptions are made throughout the analysis:
(1) The leaves are randomly arranged in space.(2) When a mixture of green and dead leaves is specified, they are evenly
distributed throughout the canopy.(3) When a cover fraction is specified, all the vegetation is randomly distributed
inside that fraction, the remaining area being completely bare. It is assumedthat the length scale of such bare areas is large in relation to the size ofindividual plants. The total albedo ofsuch an area is then taken as the weightedsum of the albedos of the vegetated and bare areas.
The calculation of hemispheric albedos from equation (11) necessitates thespecification of a,(/l) for a given leaf-angle distribution from (5). Derivation of theexpressions for a,(/l) for flat, spherically arranged and vertical leaves is reasonablystraightforward and the solutions are listed in table 2. Less regular leaf-angledistributions may be described by means of the XL function of Ross (1975) whereby the
Dow
nloa
ded
by [C
olor
ado
Stat
e U
nive
rsity
] at 1
3:44
05
May
201
3
Canopy reflectance. photosynthesis and transpiration
Table 1. Optical and physiological properties of maize leaves.
1339
Live leavesScatteringcoefficient Reflectance Transmittance
t Dickinson (1983) and Miller (1972).from curve fit to data of Hesketh and Baker (1967) and Turner (1974).
The optical properties are averaged values for the wavelength intervals 0·4-0·7 I'm (visible)and O'7-3'0 /lm (near infrared). Except where otherwise stated, these values are used throughoutthe analysis in this paper. (N.B. Equation (15) in text represents a simplification of a modeldeveloped to describe C3 photosynthesis. Here. it has been fitted directly to data to represent thefunctioning of a C. plant, maize, in the absence of an equivalent model.)§Optical properties of soil used for this study.
Table 2. Single scattering albedo a,(J1) for different leaf-angle distributions. w is the scatteringcoefficient and I' is the cosine of solar zenith angle.
Horizontal leavesa,(I') =w/4
Spherically distributed leaves
a,(I')=I[ l-I'ln (": I)JVertical leaves
</Iw (</1+ I </I )a,(I')=1+</12 -2-+2)(1+</12/
[) (I +</I2)+</I-XJ'='J= -i-In)(1 + </12)+ </I +X '=0
[X- </I - ) (I +</I2)J':,J=-lnX_</I+)(I+</I2) '=0
(1_1'2)1/2</I
I'Ross-Goudriaan function: G(I')=<p, +<P2/l
a co = w G(/l) (I I'<P, In {G(/l)+ I'<P, + /l<P2})s 2 G(I') + /l<P2 G(I')+ /l<P2 /l<P1
Dow
nloa
ded
by [C
olor
ado
Stat
e U
nive
rsity
] at 1
3:44
05
May
201
3
1340 P. J. Sellers
departure of leaf angles from a spherical distribution is characterized by a simpleexpression
XL = ±J:,zll- O(e)1 sin 0dO (12)
where 0 is the leaf inclination angle relative to the horizontal plane, 0(0) is the leaf-angle distribution function and XL =0 for spherically arranged leaves, + I forhorizontal leaves and - I for vertical leaves.Goudriaan (1977) fitted a curve to data sets generated from equation (12) which
provides reasonable estimates of the average leaf projection in any direction given thevalue of XL
G(/l)=<p, +<Pz/l (13)where <P, =0·5 -0'633XL -0'33Xi and <Pz =0·877(1-2<p,). The value ofG(/l) given byequation (13) may be used to obtain values ofa,(/l) over the range -0-4< XL < 0·6 (seetable 2).
Figure I shows calculated global albedo values for a young wheat crop on a clearday in F.R. Germany compared with two days ofdata obtained from Van der Ploeg etal. (1980). For this trial, the data ofDickinson (1983) and Goudriaan (1977) were usedto specify the values of the leaf transmittances and reflectances for the visible«0·7/lm) and near-infrared (>0'7/lm) wavelength intervals (see table I). Theincident solar radiation was split into visible and near-infrared direct and diffusecomponents according to the scheme ofGoudriaan (1977, figure I, page II). Both the
oowal-'-c
0.1o OBSERVATIONS 20 JUNEx OBSERVATIONS 21 JUNE
- SIMULATION 20 JUNE
6 8 10 12 14 16 18 20LOCAL TIME (HOURS)
Figure I. Measured and simulated albedo values for short-wave radiation above a wheat crop.The data points were calculated from observations of incoming and outgoing short waveradiation taken at Vo1kenrude, F.R. Germany, 20-21 June 1979(seeVan der Ploeg et al.1980). The simulation for the wheat crop at Ruthe (50km away) for 20 June is alsoshown.
Dow
nloa
ded
by [C
olor
ado
Stat
e U
nive
rsity
] at 1
3:44
05
May
201
3
Canopy reflectance, photosynthesis and transpiration 1341
magnitude of the global albedo (obtained by summing diffuse and direct componentsof the visible and near-infrared reflectances) and its diurnal variation agree closely withthe data. To validate the description of the transmission of radiation through avegetation canopy, data from another source were used. Fuchs et al. (1983) measureddiffuse and direct fluxes of photosynthetically active radiation (PAR), taken here to beequivalent to visible radiation, above and below a young wheat canopy (leaf-area index= 1,4). Figure 2 shows the canopy transmittance values as functions of the fraction ofdirect PAR to total PAR. Also plotted are the predicted transmittances as calculatedfrom the solution ofequations (\) and (2). It can be seen that a small error in estimatingthe local leaf-area density (which would result from a slight bias in the positioning of
(a I
z0i=ou.
CI:
....uwa: 00
0.2 0.3PENETRATION
0.10.0 '-----'-----.L-----'-----.L---....,..w0.0
0.00.0 0.1 0.2 0.3 0.4 0.5
1.0(bl
z0i=o«a:u.CI:
....uura: 00
Figure 2. Direct and total transmittances for PAR in a wheat canopy as related to the fractionof direct incident PAR. x and 0 are observations from Fuchs et al. (\983) of direct andtotal PAR penetration, respectively. Solid and dotted lines are predicted values of PARpenetration for inclined (60°) and spherically distributed leaves, respectively. (a) Leaf-area index = \·4 (in accordance with reported value), (b) leaf-area index= I,8; consistentwith slight biasing of sensor positions under crop rows. Direct PAR fraction increaseswith solar elevation; a value of 0·6 corresponds to solar elevation of 10°.
Dow
nloa
ded
by [C
olor
ado
Stat
e U
nive
rsity
] at 1
3:44
05
May
201
3
1342 P. J. Sellers
(14)
radiation
the radiation sensors below the canopy) would result in a large difference in thepredicted transmittance at low solar angles. In this case, direct PAR fraction valuesbelow 0·6 correspond to solar evaluation angles of < 10°. For the higher values of solarelevation, that is PAR fraction >0'6, the match between prediction and observation isreasonably good.
Figure 3 shows the predicted absorption of PAR compared with observations fromAsrar et al. (1984) for a wheat cover over a range of leaf-area-index values. It is clearthat a near maximum absorption value of PAR is achieved at a relatively low leaf-areaindex, somewhere in the range 'of 2-3. Also, the effect of solar angle on the calculatedrange of PAR absorption seems to cover the spread of observations, leading one tosuspect that this may be one of the main causes of the variation in the data.
Figure 4 shows the predicted variation in surface spectral albedo with thewavelength of incident radiation for a range of leaf-area indices. Soil reflectance ispredicted to have only a small effect on albedo in the PAR wavelength interval exceptwhen the vegetation cover is very light (the semi-infinite value ofalbedo is approachedwhen the leaf-area index is only 2). Conversely, the relatively large value of thescattering coefficient of green leaves in the near-infrared region (-0'8) is predicted tomake the effect of soil reflectance on the surface near-infrared albedo significant athigher values of the leaf-area index.
The model may be used to calculate the simple ratio and vegetation index by:
simple ratio = aCNIR/aCVIS }
vegetation index =a CNIR - acv lsaCN 1R + ac v l s
where a CN I R is the hemispherically integrated albedo for near-infrared(0,7-3'0 JIm) and acv ls is as above for visible radiation (0·4-0'7 JIm).
80cJ?
70Z0t=0-re 500(J)lJJ 40<l: -.-.- SOLAR ANGLE= 10're 30 --- SOLAR ANGLE = 50'<l: ---- SOLAR ANGLE=80'0-
20
10
02.0 6.0 7.0
LEAF AREA INDEXFigure3. Observed (solidcircles) and predicted(lines) absorption of PARfor a growingwheat
canopy. Observationsare from Asrar et al. (1984); predictionsare from calculations inthe text. Resultsare for the direct beam radiation only.
Dow
nloa
ded
by [C
olor
ado
Stat
e U
nive
rsity
] at 1
3:44
05
May
201
3
Canopy reflectance. photosynthesis and transpiration 1343
0.09(a)
0.08
0.07
0.08 LAI = 1
0.05aVIS
0.04
0.03
0.02
0.01
0.00
Figure 4. Variation of the albedos of green vegetated surfaces with solar elevation as given bysolutions to equations{l) and (2) in the text. (0) Albedo for visible wavelength interval,aVIs; a=0·105, b=0·007, p,=0'15, (b) Albedo for near-infrared wavelength interval,aNI'; a =0'58, b= 0·25, p, = O'30. (Leaves are distributed spherically and only direct beamradiation considered.)
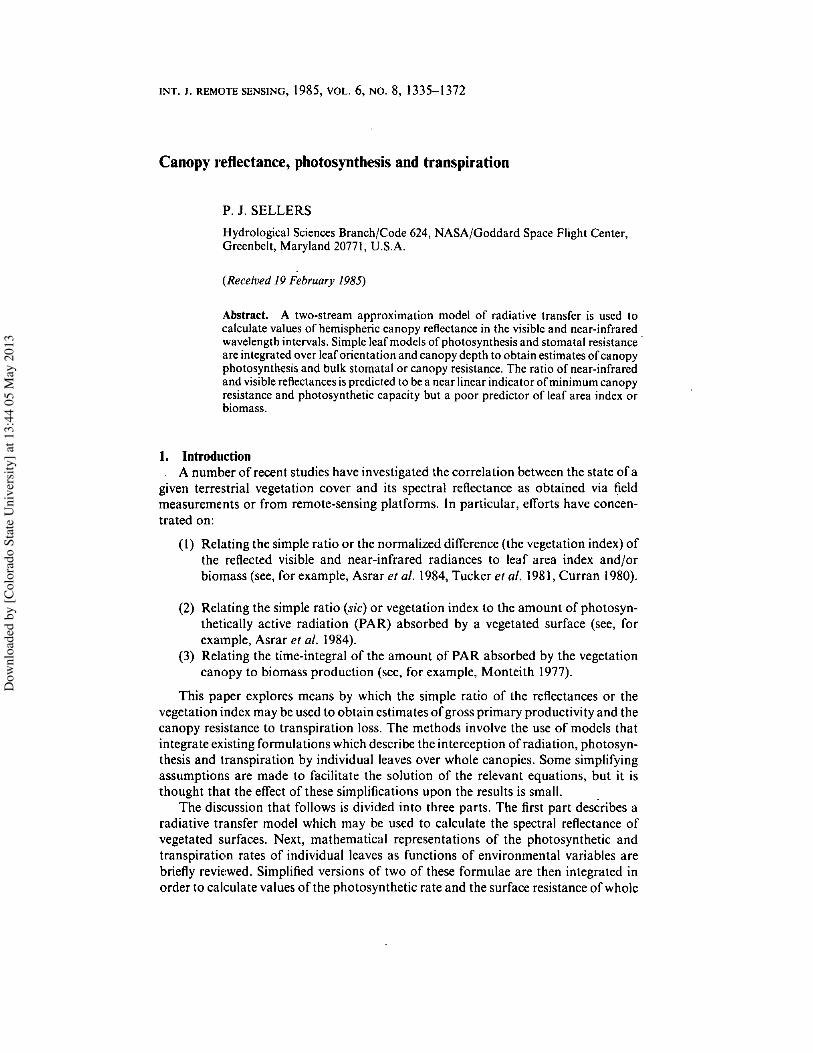
When comparing these derived values with measurements, it should be noted thatthe calculated values are hemispherical integrals and that most vegetation indexmeasurements make use of observed unidirectional radiances. Also, the observedalbedos an: weighted by the relative proportions of downcoming visible and near-infrared radiation. The derived values of the vegetation index compare reasonably wellwith data (see figure 5) and approach the values derived from the semi-infinite canopyalbedos of equation (8) at high leaf-area indices (see figure 4).
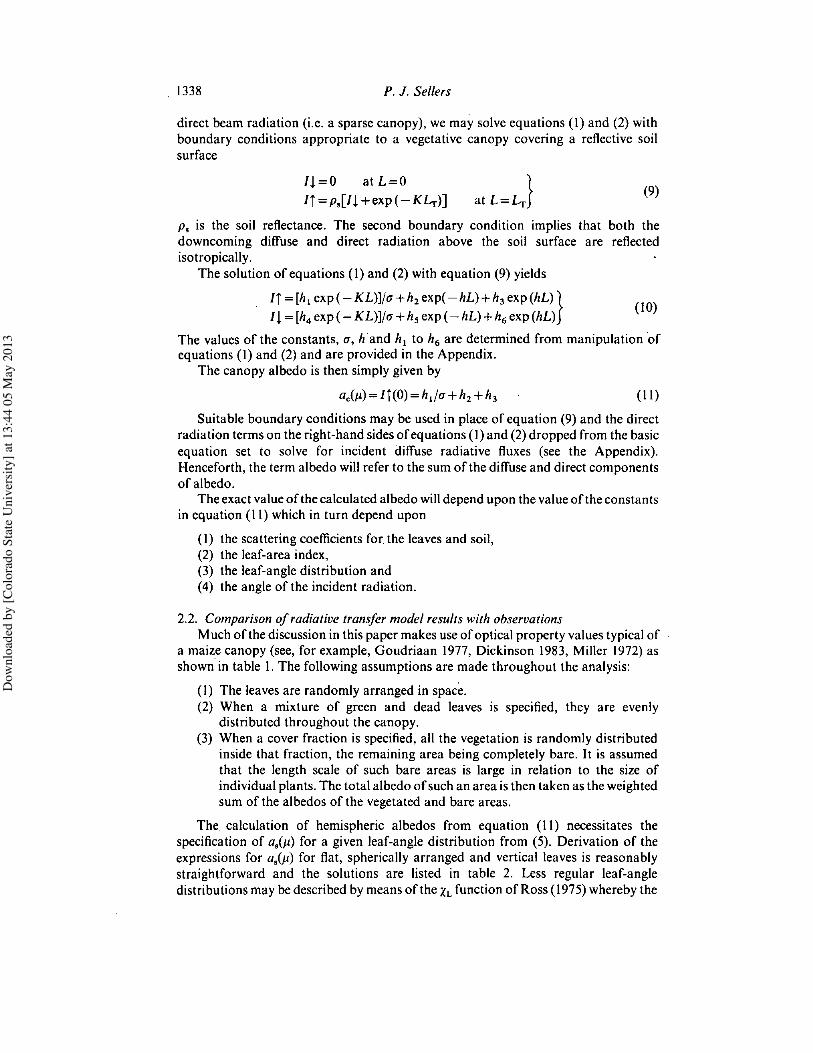
Figure 6 shows the calculated variation of the vegetation index with leaf-area indexfor horizontal leaves with a range of canopy greenness fractions. The results indicatethat the presence ofany significant fraction ofdead material (and presumably materialwith no chlorophyll-twigs, branches, etc.) severely affects the relationship between
Figure 5. Observed and predicted values of the vegetation index for a growing wheat canopy.Predicted values '(lines) are obtained from equation (14) in text; observations (solidcircles) are from Asrar et al. (1984). N.B. Asrar et al. (1984) used narrow bandinstruments which were presumably nadir viewing: visible interval=0·6-{j·7I'm, nearinfrared = 0,8-1,1 I'm; calculations used leaf optical properties taken from data of Asraret al. (1984) for these wavelength intervals.
Figure 6. Calculated values of the vegetation index as a function ofleaf-area index and canopygreenness (denoted by 'g') for horizontal leaves. The vegetation index is given as afunction of total and green leaf area index. Optical properties (broadband) listed in tableI were used for these calculations.
Dow
nloa
ded
by [C
olor
ado
Stat
e U
nive
rsity
] at 1
3:44
05
May
201
3
Canopy reflectance, photosynthesis and transpiration 1345
vegetation index and leaf area index. This finding holds whether one considers total(dead plus live leaves) or just green leaf area index.
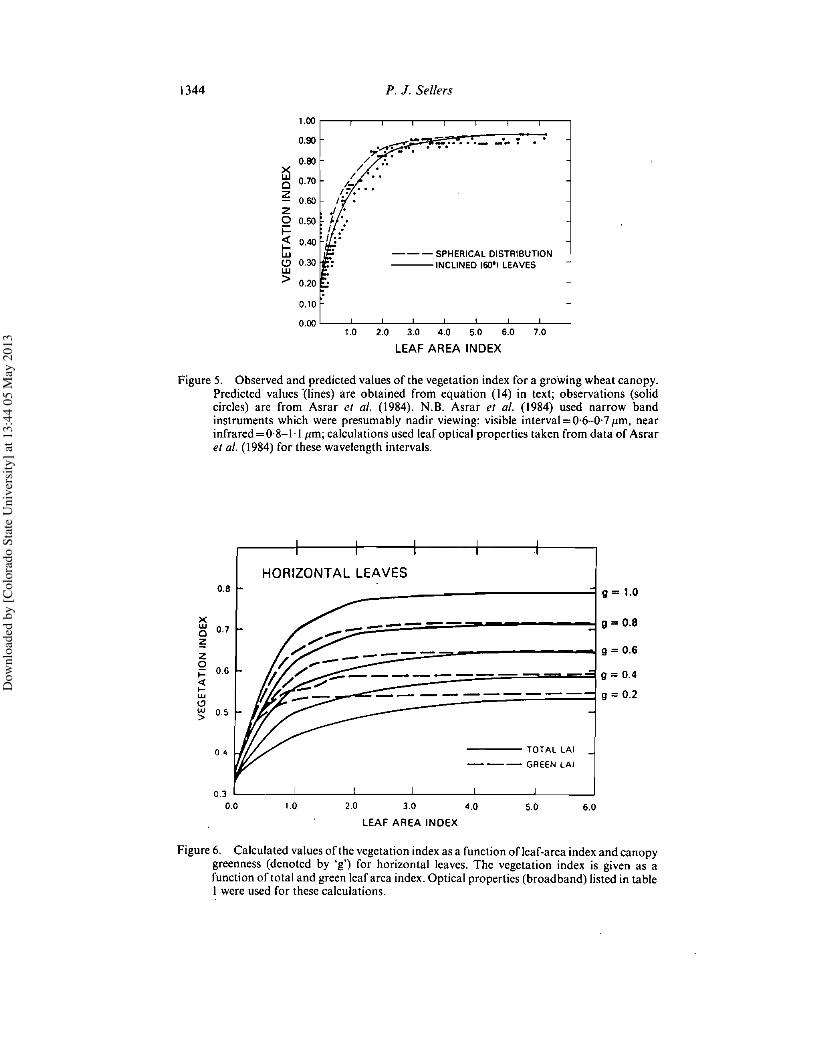
The effect of leaf angle and solar elevation on the calculated vegetation index isshown in figure 7. At extreme solar elevations and for low values of the leaf-area index,leaf angle may cause a wide spread in the vegetation index response. The effect is mostextreme for vertical leaves which present a maximum optical thickness relative to thedirect beam at low solar angles and a zero value for an overhead sun. Horizontal leaves,on the other hand, show no change in vegetation index with solar angle as the opticalthickness is invariant with the direction of incident radiation (G(IJ)/Jl= I). With ahigher leaf area index, the differences in the response of the vegetation index diminishas the trapping of radiation by the canopy saturates the effect of soil reflectance.
I I I , I I-.-------l- ................. .... ............. --
Figure 7. Calculated variation of the vegetation index with solar elevation and leaf-angledistribution for two (1'0 and 4'0) leaf area indices. The interactionof solar elevationandleaf-angle distribution is predicted to have a large effect at low leaf area indices. Opticalproperties taken from table I.
Dow
nloa
ded
by [C
olor
ado
Stat
e U
nive
rsity
] at 1
3:44
05
May
201
3
1346 P. J. Sellers
Figure 7 also provides us with an indication of the efficacy of the empirical XLrelationship. The plot for the lower value of leaf area index demonstrates that theresponse of the spherically distributed leaves and its XL analogue (XL = 0,0) are almostidentical. Similarly, the planophile canopy (XL = +0,5) yields a reasonably close matchto the response of the horizontal leaves. The erectophile canopy (XL = -0·5) shows asimilar trend to the variation predicted for vertical leaves but does not attain the sameextreme value for high solar elevations. (It must be remembered that the non-zero XLfactors do not represent canopies with completely horizontal or completely verticalleaves but intermediate distributions approaching one or other extreme.) Generallyspeaking, the variation described by the XL function seems to be in accordance with thetrends implied by the 'exact' analytical solutions for vertical, horizontal and spheri-cally distributed leaves.
The question ofambiguous interpretation ofthe vegetation index arises again whenconsidering the effects of cover fraction. Figure 8 shows the relation betweenvegetation index and leaf area index where the same amount of area-averaged green-leafbiomass isconfined to smaller fractions of the ground area. The presence ofonly 25per cent bare ground (c= 0'75) greatly affects the response. The reason for this is clear;even when the response may be saturated in most of the area, the contribution of thebare ground fraction to the vegetation index is disproportionately strong due to thenon-linearity of the vegetation-index/leaf-area-index relationship.
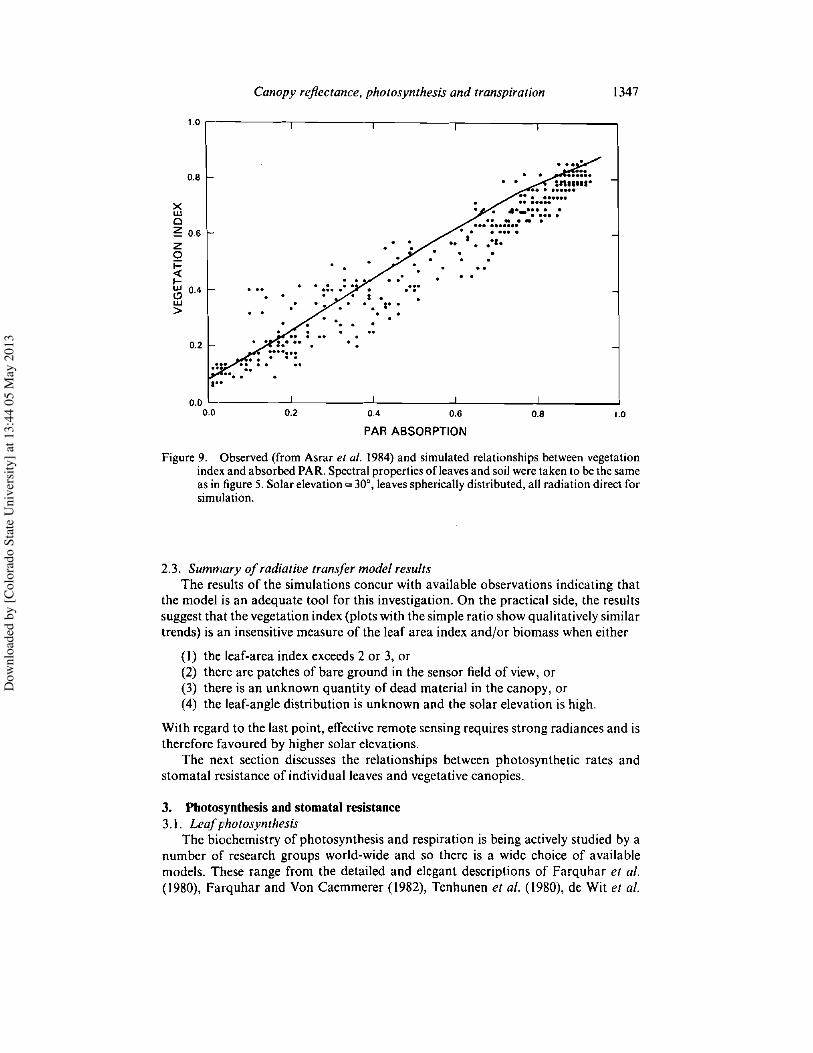
Lastly figure 9 shows data ofAsrar et al. (1984) relating the vegetation index to theabsorbed fraction of PAR. Again, the simulations yield a reasonable agreement withthe data and support the proposition that the vegetation index is a near-linearpredictor of absorbed PAR.
Canopy reflectance. photosynthesis and transpiration 1347
1.0,-----,------,------,----_-. ---,
0.8
xwCl
0.6Zo
0.4w>
0.2..:.e ••......... . .... .. ....... .
.....
. .-_.... ........ . .... ... ... '. . .. .. .
C"
1.00.80.60.40.20.0 L -"--- --'-- .....L -l.. .....10.0
PAR ABSORPTION
Figure 9. Observed (from Asrar et al. 1984) and simulated relationships between vegetationindexand absorbed PAR.Spectral properties ofleaves and soilwere taken to be the sameas in figure 5. Solar elevation=30', leavessphericallydistributed, all radiation direct forsimulation.
2.3. Summary of radiative transfer model resultsThe results of the simulations concur with available observations indicating that
the model is an adequate tool for this investigation. On the practical side, the resultssuggest that the vegetation index (plots with the simple ratio show qualitatively similartrends) is an insensitive measure of the leaf area index and/or biomass when either
(\) the leaf-area index exceeds 2 or 3, or(2) there are patches of bare ground in the sensor field of view, or(3) there is an unknown quantity of dead material in the canopy, or(4) the leaf-angle distribution is unknown and the solar elevation is high.
With regard to the last point, effective remote sensing requires strong radiances and istherefore favoured by higher solar elevations.
The next section discusses the relationships between photosynthetic rates andstomatal resistance of individual leaves and vegetative canopies.
3. Photosynthesis and stomatal resistance3.1. LeafphotosynthesisThe biochemistry of photosynthesis and respiration is being actively studied by a
number of research groups world-wide and so there is a wide choice of availablemodels. These range from the detailed and elegant descriptions of Farquhar et al.(1980), Farquhar and Von Caemmerer (1982), Tenhunen et al. (1980), de Wit et al.
Dow
nloa
ded
by [C
olor
ado
Stat
e U
nive
rsity
] at 1
3:44
05
May
201
3
1348 P. J. Sellers
(16)
(1978) to simpler application oriented models such as those of Charles-Edwards andLudwig (1974), Van Bavel (1975) and others summarized in Milthorpe and Moorby(1979).
The more detailed models explore the role of enzyme kinetics in the photosyntheticprocess and provide the researcher with insights regarding the limiting factors exertedby the environment (for example, PAR) and the plant's biochemistry (for example, thesize of the ribulose diphosphate pool).
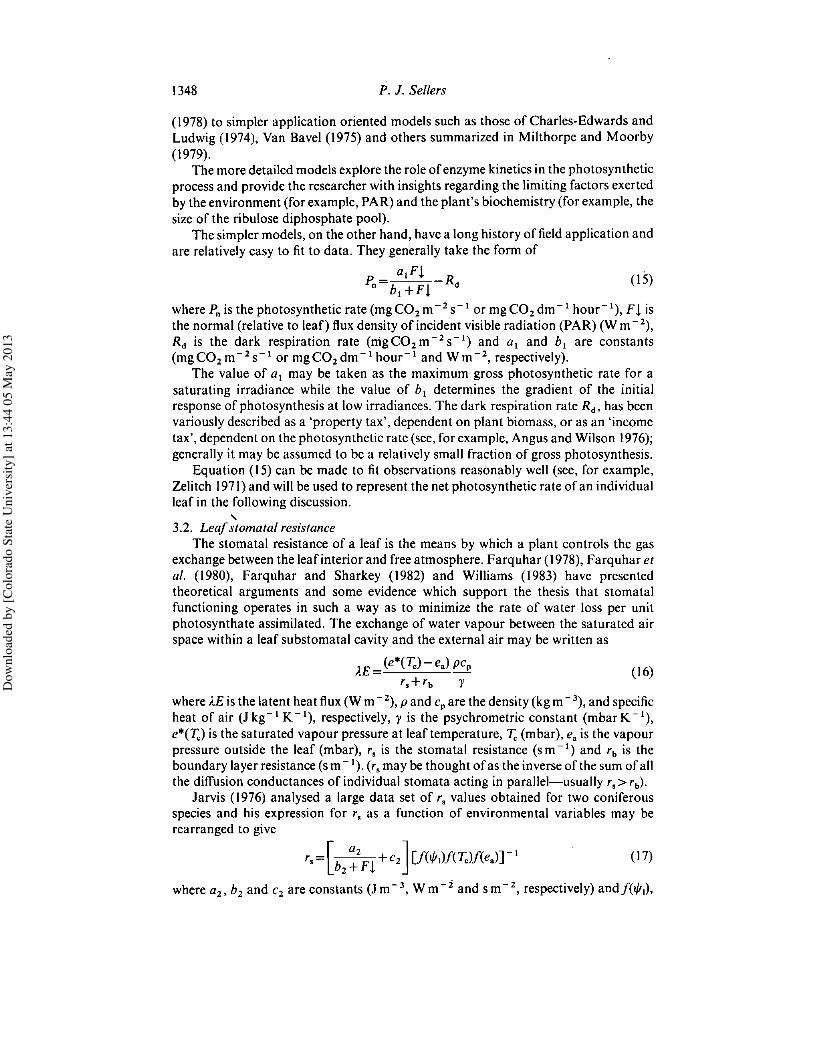
The simpler models, on the other hand, have a long history offield application andare relatively easy to fit to data. They generally take the form of
alF.I. .Pn=bl+F! Rd (15)
where Pn is the photosynthetic rate (mg CO2 m -2 s -lor mg CO2 dm -I hour-I), F.I. isthe normal (relative to leaf) flux density of incident visible radiation (PAR) (W m - 2),Rd is the dark respiration rate (rrigC02m-2s- l) and al and b, are constants(mg CO2 m - 2 S -lor mg CO2 dm -I hour- 1 and W m - 2, respectively).
The value of a1 may be taken as the maximum gross photosynthetic rate for asaturating irradiance while the value of b[ determines the gradient of the initialresponse of photosynthesis at low irradiances. The dark respiration rate Rd , has beenvariously described as a 'property tax', dependent on plant biomass, or as an 'incometax', dependent on the photosynthetic rate (see, for example, Angus and Wilson 1976);generally it may be assumed to be a relatively small fraction of gross photosynthesis.
Equation (15) can be made to fit observations reasonably well (see, for example,Zelitch 1971) and will be used to represent the net photosynthetic rate of an individualleaf in the following discussion.,3.2. Leafstomatal resistance
The stomatal resistance of a leaf is the means by which a plant controls the gasexchange between the leaf interior and free atmosphere. Farquhar (1978), Farquhar etal. (1980), Farquhar and Sharkey (1982) and Williams (1983) have presentedtheoretical arguments and some evidence which support the thesis that stomatalfunctioning operates in such a way as to minimize the rate of water loss per unitphotosynthate assimilated. The exchange of water vapour between the saturated airspace within a leaf substomatal cavity and the external air may be written as
)'E= (e*(7;,)-ea) pc.r,+ rb Y
where)'E is the latent heat flux (W m - 2),P and c. are the density (kgm - 3),and specificheat of air (J kg- [ K -I), respectively, Y is the psychrometric constant (mbar K -I),e*(7;,) is the saturated vapour pressure at leaf temperature, 7;, (mbar), ea is the vapourpressure outside the leaf (mbar), r, is the stomatal resistance (s m -I) and rb is theboundary layer resistance (s m - I). (r, may be thought of as the inverse of the sum ofallthe diffusion conductances of individual stomata acting in parallel-usually r,> rb) .
Jarvis (1976) analysed a large data set of r, values obtained for two coniferousspecies and his expression for r, as a function of environmental variables may berearranged to give
r,=[b27F! +C2 ] [J(ifI[)f(7;,)f(eaW I (17)
where a2 , b2 and C2 are constants (Jm- 3 , Wm- i and s m " ", respectively) andf(ifI,),
Dow
nloa
ded
by [C
olor
ado
Stat
e U
nive
rsity
] at 1
3:44
05
May
201
3
Canopy reflectance, photosynthesis and transpiration 1349
fer.) andf(e.) are the adjustment factors for the influence of leaf water potential, 1/11'leaf temperature, r., and vapour pressure, e., The factors are limited to the range 0-1.The constants a2 , b2 and C2 may be fitted to measurements of r, (see, for example, Geeand Federer 1972, Fletcher 1976, Tan and Black 1978, Kaufmann 1976). For thisstudy, data from Turner (1974) were used to obtain the parameters a2 • b2 and C2 for amaize leaf, see table I. If one accepts the arguments favouring a constant ratio betweenPn and the transpiration rate, it is relatively easy to derive values ofa2 , b2 and C2 from aconsideration of the constants in the photosynthetic equation, equation (15), theconstant of water-use efficiency and an assumed climatic mean evaporative demand.For the present, however, the values of the constants in equation (17) are determinedfrom fitting to data. The form of the adjustment factors are described in full in Jarvis(1976) but will not be reviewed here; most of the following analysis assumes nearoptimal conditions for both photosynthesis, as given by equation (15), and stomatalfunctioning, as given by the first term in parentheses in equation (17).
3,3. Simplification of the description of the attenuation ofphotosynthetically activeradiation in plant canopiesEquations (15) and (17) are adequate descriptions of processes on an isolated leaf.
In order to estimate the area-averaged photosynthetic rate and canopy resistance(resistance to vapour transfer imposed by the canopy per unit ground area) we mustintegrate these expressions over all the leaves in the canopy.
Before doing this, we must make some simple assumptions about the way PAR isattenuated, absorbed and utilized within a canopy. Direct beam radiation incident on acanopy of randomly distributed elements with near-zero scattering coefficients will beallenuated in accordance with the exponential extinction law of Monsi and Saeki(1953)
(18)
where lois the incident radiation above canopy (Wm - 2)and ILis the radiation below aleaf-area index of L (W m- 2).
The attenuation of radiation when the scallering coefficient is non-zero has beenalready discussed in the previous section. For small values of W (w";0·2, for PAR),however, Goudriaan (1977) found that equation (18) could be modified to give goodnumerical values of the intensity profile by a simple empirical adjustment of theextinction coefficient:
(\9)
(20)
It is normal practice to estimate the photosynthetic rate and resistance of wholecanopies by considering the separate contributions made by leaves exposed to full(direct beam) sunlight and shade leaves (see, for example, Isobe 1967, Sinclair et al.1976,Jahnke and Lawrence 1965).The areas of sunlit and shade leaves are calculatedby using equation (18)
It seems-more reasonable, however, to assume that the photosynthetic rate and thetotal resistance of an ensemble of leaves of similar orientation and position in thecanopy will be closer to estimates obtained by using one mean irradiance (as calculated
Dow
nloa
ded
by [C
olor
ado
Stat
e U
nive
rsity
] at 1
3:44
05
May
201
3
1350 P. J. Sellers
from equation (19) rather than summing the two components represented by equation(20)). The arguments one can put forward for this are:
(I) Leaves of the same orientation at the canopy top will all be sunlit while those atthe canopy base will be receiving mainly scattered light.
(2) Leaf position changes with the wind and the Sun moves during the day and sosunflecks cannot be assumed to stay focused on an individual leaf inside thecanopy long enough for it to attain a steady-state photosynthetic rate andstomatal aperture. Ino (1969, 1970) reported that the radiative flux densitybeneath a sugar-beet canopy showed three to six peaks per lOs. Woods andTurner (1971) reported that the time constant for the stomatal function of fourdeciduous tree species was of the order of 3-20 min for opening stomata and12-35 min for closing stomata. If, as Williams (1983) observed, stomata remainin a slightly 'too open' state (in terms of water-use efficiency), the longer timeconstant appropriate to the closing response will be applicable.
(3) If, the real situation were closer to that represented by equation (20) rather thanby equation (19), we would expect canopies to consist of large flat regularlyspaced leaves, nearly all of which would be sunlit, with little radiationpenetrating below a leaf-area index of I. While this arrangement is broadly trueof shade-loving species, which have to make the best use of low radiationincomes, it does not seem to hold" for most upper storey vegetation (see, forexample, Goudriaan 1977, Parkhurst and Loucks 1972, Davis and Taylor1980).
3.4. Canopy photosynthesis and resistanceEquations (15) for leafphotosynthesis, (17) for leaf stomatal resistance and (19) for
radiation attenuation may now be combined to estimate integral values of photosyn-thesis and stomatal resistance for whole canopies. In doing this, we must assume thatmost of the absorbed PAR is intercepted in the direction of the incident beam-obviously this will be in error when considering processes at the canopy base but theresults indicate that this effect is not serious.
Leaves will differ in their photosynthetic rates and stomatal resistance valuesaccording to
(I) the strength of the incident PAR flux, and therefore the position of the leaf inthe canopy,
(2) the orientation of the leaves to the PAR flux, and(3) the preconditioning of the leaf: leaves at the top of the canopy (sun leaves) tend
to exhibit higher maximum photosynthetic rates and lower minimum stomatalresistance values than the 'shade' leaves at the canopy base (see, for example,Alderfer 1975).
With regard to the last point, it is not thought that the variations in leaf propertieswill greatly affect the validity of this analysis. Most data indicate that leaves within acanopy exhibit roughly the same initial responses to incident PAR flux at lowirradiances. The transition from the semilinear relationship between photosynthesisand irradiance over to the asymptotic light-saturated condition occurs over a relativelynarrow irradiance interval and at decreasing values of irradiance deeper within thecanopy. Now under normal illumination conditions, the leaves deeper in the canopyare operating below their light-saturated limits (due to the effects of shading) and so
Dow
nloa
ded
by [C
olor
ado
Stat
e U
nive
rsity
] at 1
3:44
05
May
201
3
Canopy reflectance, photosynthesis and transpiration 1351
their actual performance may be described by the low irradiance section of the sunleaves' response.
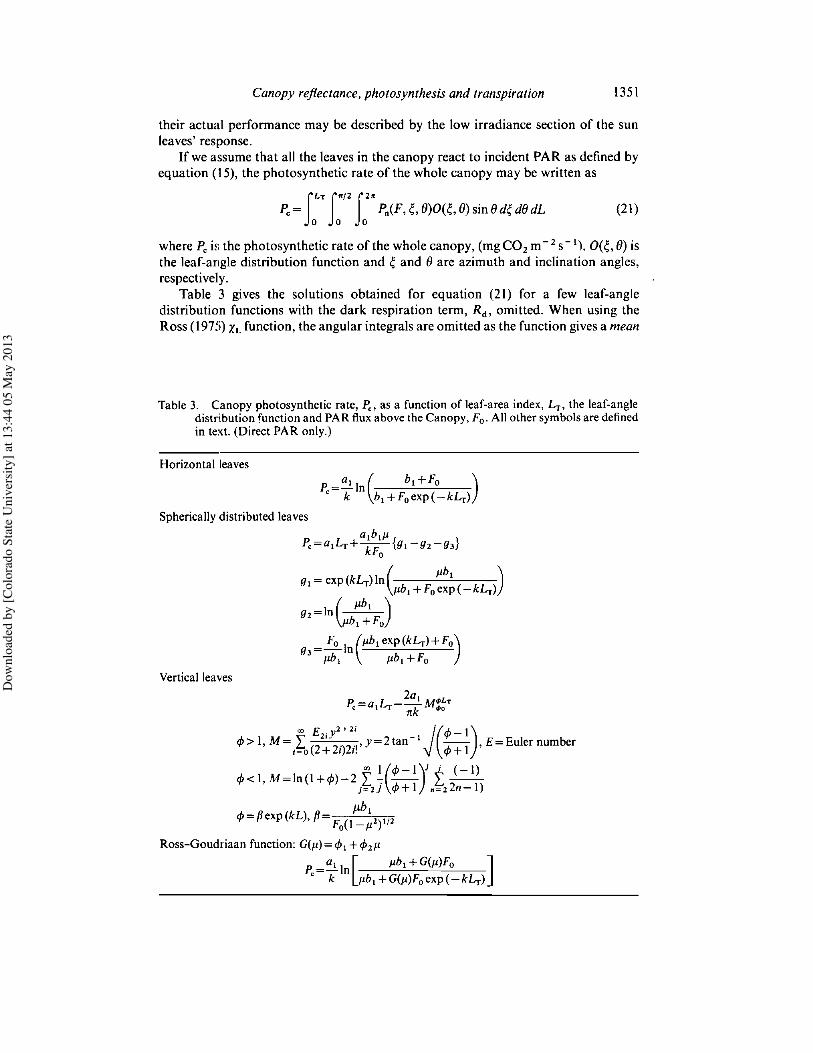
If we assume that all the leaves in the canopy react to incident PAR as defined byequation (15), the photosynthetic rate of the whole canopy may be written as
rLT rO!2 r20Pc= Jo Jo Jo e) sin dedL (21)
where Pc is the photosynthetic rate of the whole canopy, (mgCO2 m- 2 S-'), e) isthe leaf-angle distribution function and and eare azimuth and inclination angles,respectively.Table 3 gives the solutions obtained for equation (21) for a few leaf-angle
distribution functions with the dark respiration term, R d , omitted. When using theRoss (1975) XL function, the angular integrals are omitted as the function gives a mean
Table 3. Canopy photosynthetic rate, Pc, as a function of leaf-area index, L.r, the leaf-angledistribution function and PAR flux above the Canopy, Fo.All other symbols are definedin text. (Direct PAR only.)
projection in the direction Jl so that equation (21) becomes
fLTPc= 0 Pn(F,G(Jl»)dL
where G(Jl) is the mean projection of leaves in direction u.Equation (22) represents a simplification of equation (21) in using the mean leaf
projection to calculate the activity of all the leaves (see, for example, Monsi 1968) at agiven depth in the canopy while equation (21) takes the effect of the distribution ofleaforientations into account explicitly. Numerically, however, equations (21) and (22)give similar results for the same leaf-angle distributions. This finding, and calculationsof Pc and canopy resistance, r., for diffuse radiation indicate that the vegetation'sresponse is relatively insensitive to the direction of incoming radiation (except forvertical and near-vertical leaves) over the middle range of solar angles.
Ifwe assume, as before, that leaves at all levels in the canopy react in a similar wayto incident PAR, the bulk canopy resistance, r., may be written as
I fLTfn l2f2' "-= (F ): 0) sin 0 dO dL'c 0 0
Table 4 lists solutions to equation (23). A solution for the Ross-Goudriaan XLfunction (Goudriaan 1977) (equivalent to equation (22) for P.) is also given.
3.5. Comparison ofpredicted and observed canopy photosynthesisThere have been few experimental studies where leaf and canopy photosynthesis
were measured simultaneously. Figure 10shows the net photosynthetic response of anindividual wheat leaf as observed by Evans and Dunstone (1970) with some individualdata points for net photosynthesis from Denmead (1976) for comparison. Using valuesor at and b l fitted to the data of Evans and Dunstone (1970), P; was calculated forwhole wheat canopies with leaf-area indices of 1·6and 3·2 for clear days in January, i.e.the Australian summer, via equation (21). We have assumed that Rd is a constantfraction of gross photosynthesis in this instance which may produce errors at lowirradiances. The PAR was assumed to be half of the incident global radiation in bothcases.
These calculations are plotted against the corresponding data in figure 10. Twofeatures are immediately apparent, first, additional increments of leaf-area index arepredicted to yield diminishing returns in terms of the total net photosynthetic rate and,secondly, the response of a whole canopy is more linear than that ofan individual leafheld normal to the same flux. The first effect is due to the shading ofleaves at the base ofthe canopy. The cause of the second effect is to be found in the way the incident flux ispartitioned in the canopy; spherically distributed leaves will maintain the samedistribution of leaf inclinations relative to the incoming beam regardless of the solarelevation, but the path length will decrease from a maximum at low solar elevations toa minimum for an overhead Sun. The combination of these two phenomena-shadingand the interaction of leaf inclination and solar elevation-tends to linearize theresponse of P; to global radiation.
3,6. Comparison ofpredicted and observed canopy resistance valuesAs with photosynthesis, few studies of stomatal resistance have correlated
processes at the level of a leafwith the functioning ofan entire canopy."First, we shouldquestion the validity of using the integral of all the leaf stomatal resistance values as an
Dow
nloa
ded
by [C
olor
ado
Stat
e U
nive
rsity
] at 1
3:44
05
May
201
3
Canopy reflectance, photosynthesis and transpiration 1353
Table 4. Canopy resistance, r" as a function of leaf-area index, Lr, the leaf-angledistributionfunction and.PAR flux above the canopy, Fo.All other symbolsare definedin text. (Direct PAR
only.)
Horizontal leaves
(dexp (kLT )+ I) -In (d+exp (-kLr))]r kC2 dFo d+ I d-i- I
d a2+b2C2C2 FO
Sphericallydistributed leaves
I 1 [a2/l ]trt: kLT- - p (g.-g5+g6)rc C2 C2 0
g. =exp(kLr) In(I + 0 eXP\kLT) )
g5 = In(I + 1/0)J (OeXP(kLrl+ I)g6=nln ,O=d/l" 0+ I
approximation to the canopy resistance term used in 'unilayer' models of evapotran-spiration (see, for example, Monteith 1973).
Tan and Black (1976) used a numerical analogue of equation (23) to estimatecanopy resistance for a Douglas Fir stand in British Columbia, Canada. Their resultsindicated that the omission of terms representing the different gradients of Tc, e. and T-in the canopy did not greatly affect the estimation of the canopy transpiration rateimplying that r as given by (23) should provide us with a usable estimate ofevapotranspiration when inserted in the Penman-Monteith equation (see, forexample, Monteith 1973), providing the soil surface and canopy are dry. Monteith etal. (1965) measured the stomatal resistance of barley leaves with a viscous flowporometer and estimated the surface resistance of the crop as a residual of an energy-balance calculation. Figure II shows a comparison of the results of Monteith et al.(1965) and the estimate ofr, as given by equation (23) for spherically distributed leavesusing values of a2 , b2 and C2 fitted to the porometer data of r, for an individual leaf.Both the trend and magnitude of the predicted surface resistance are in reasonableagreement with the observations. The divergence between the observed and calculated
Dow
nloa
ded
by [C
olor
ado
Stat
e U
nive
rsity
] at 1
3:44
05
May
201
3
1354
4(a) .,
::J0s:
NIEN 20uEe0..
o
P. J. Sellers '
•
--- FIT FROM EO. 15--- EVANSAND DUNSTONE (1970)
• DATA: DENMEAD (1976)
100 200 300 400 500
INCIDENT VISIBLE RADIATION (W m-z)600
(b)::J,g 6
NIEN 4ouE
21Cl.."
LA I = 1.6
••
0 200 400 600 800 1000 1200
GLOBAL RADIATION (W m-Z )8
(C)::J0s: 6'
NIEN 40uECl
21Cl.."
0 200 400 600 800 1000 1200
GLOBAL RADIATION (W m-z)
Figure 10. (a) Relation between net photosynthetic rate of individual wheat leaves and incidentvisible radiation. Solid line is from Evans and Dunstone (1970), dashed line is best fit ofequation (15) in text, points are for another wheat crop (see Denmead 1976). (h) and (e)show the calculated net photosynthetic rates (from equation (21) and dashed line in (a»of whole wheat canopies for two leaf area indices and two leaf-angle distributionscompared with measurements of Denmead (1976).
Dow
nloa
ded
by [C
olor
ado
Stat
e U
nive
rsity
] at 1
3:44
05
May
201
3
Canopy reflectance, photosynthesis and transpiration 1355
values of "c at high radiation incomes may be attributed to the effects of leaf waterpotential on stomatal closure at high transpiration rates.
Figure 12shows the variation of'r, with leaf-area index as measured byMonteith etal. (1965)and as predicted by equation (23). For the predictions, daily mean values ofrcwere obtained by assuming clear days on the appropriate dates and totally green
r,(s m·ll
200
100
-- r. (FITTED CURVEl---- rif; LAI" 4............ rif;lAI- 8
" !.•... 'oJ. 1 I
0 J. 'l··I···::·...::tl±J"'.+."'....350 700
INCIDENT SOLAR RADIATION IW m·2, .
o __
Figure II. Relation between leaf stomatal resistance (r,) and irradiance for individual barleyleaves. Open squares are data from Monteith et al. (1965), vertical lines are error bars,solid line is best-fit of equation (17) in text. Lower part of figure shows estimated surfaceresistance for a barley crop (open circles) from Monteith et al. (1965) compared withvalues of the canopy resistance, r", as given by equation (23) for two leaf-area indices.
FIT TODATAU¥LAI (MONTEITH. ETAl.. 1965)FROM MODEL (ASSUMING CLEARDAYS AND GREEN CANOPY)
1.4
1.2
1.0
z:E 0.8
.e....o
0.6
0.4
0.2
0 2 4 6 8 10 . 12
LEAF AREA INDEX
Figure 12. Observed (open circles and solid line) course of surface resistance of a barley cropover a growing season. Also shown is the suggested relationship as proposed byMonteithet al. (1965) and value of minimum canopy resistance as calculated from equation (23) inthe text.
Dow
nloa
ded
by [C
olor
ado
Stat
e U
nive
rsity
] at 1
3:44
05
May
201
3
1356 P. J. Sellers
canopies. We expect the predictions to undershoot the observations by a slight amountduring the growing phase (due to less than clear conditions) and to significantlyunderestimate r, as the crop senesces. Both trends are apparent in figure 12.
Some confirmation of the predicted variation in r, with canopy position may beobtained from the data of Watts et al. (1976). Watts et al. (1976)measured profiles of r,in a Sitka spruce canopy and the results qualitatively concur with the combination ofequation (19) with equation (23). Canopy resistance was calculated numerically fromthe profiles in the same way as Tan and Black (l 976) and the results emphasize thedominance of the upper layers of the canopy in determining the transpiration rate.
3.7. Diurnal variation of canopy photosynthesis and resistanceFigures 13and 14show the predicted variation of1'., and r, with leaf-area index, the
angle of incoming radiation and leaf orientation. Clearly, a saturation effect occurs atthe higher leaf-area indices, which is increased if the cover or greenness fraction isreduced (see later discussion). In all cases, the coefficients used in calculating r, and P,were fitted to data for maize (see table I).
Most of the above discussion has been concerned with instantaneous values of P,and r,. We shall now consider daily mean estimates of these quantities which may becompared with observations taken intermittently during a growing season. Figure 15shows time-averaged values ofP, and r, for Julian day 180at a latitude of 30oN. (Clearskies are assumed and Goudriaan's (1977) data relating visible and near-infraredradiation fluxes to the solar angle are used.) In all cases, P, and r, were obtainednumerically by
I fMP=-- Pdtc M-D D c
I I 1M I-=-- -dtr, M-D D r,
(24)
(25)
(26)
P, is the daily mean photosynthetic rate (mg CO2 dm - I hour- I), r;; is the daily meancanopy resistance (sm- I ) , D is the time of dawn and M is the time of midday.
3.8. Relationships between absorbed photosynthetically active radiation and primaryproductivityThe results shown in figure 13may be compared with some field studies. Monteith
(1977) presented results which indicate that net photosynthesis or growth could berelated to the integrated amount of PAR absorbed by a canopy
P,=.2- ["€Fa dtt.tJawhere s is the efficiencyofconversion ofPAR to net photosynthesis (gm CO2J" I) andFa is the PAR absorbed by the canopy (W m- 2).The PAR absorbed by the canopy, Fa' may be calculated for the direct fraction by
(27)
Fa is the downward flux ofPAR above the canopy (Wm - 2) and IXv is the albedo of thesurface in the PAR wavelength interval, from equation (II). Figures 16 and 17 show
Dow
nloa
ded
by [C
olor
ado
Stat
e U
nive
rsity
] at 1
3:44
05
May
201
3
Canopy reflectance, photosynthesis and transpiration 1357
2.
6.4 .
400
__-,1.
350JOO250200150100
HORIZONTAL LEAVES
0'
(a)90
.. 90...J0 70s:
E 60"0N 500U 40Ol.§. JOC\.U
20
\0
00
6
2
400J50JOO150 200 250
PAR (Wm-1 )
100
__
HORIZONTAL LEAVES
r,;;;;;;;;;;;;d:::::==±====:::t:::=:::r:====I:::==:::r:==:J o. I
(b):1.5
3.0
2.5-v>
E 2.0
.-1 c...v 1.5
, 0
0.5
000
Figure 13. (0) Calculated canopy photosynthetic rate, PO' as a function of leaf area index(numbers on the right-hand side of the figure) and incident PAR. P, is given by equation(24) in the text using coefficients from table I. Note diminishing effect of leaf areaincrements. The canopy is green and the solar elevation =40°. (b) Calculated canopyresistance values, r" as a function of leaf area index (numbers on right-hand side of thefigure) and incident PAR. r, is given by equation (25) in the text. (Other conditions as in(a).)
Figure 14. Calculated effect of solar elevation on (0) canopy photosynthetic rate, PO' and (b)canopy resistance, '" for three leaf-angle inclinations. PAR =200Wm-2 throughout,which yields no change in the photosynthetic response of horizontal leaves with solarangle.
Dow
nloa
ded
by [C
olor
ado
Stat
e U
nive
rsity
] at 1
3:44
05
May
201
3
Canopy reflectance, photosynthesis and transpiration 1359
3.02.0
LEAF AREA INDEX1.0
-- FLAT-- SPHERICAL
o ""'- L- --''- --''-__
0.0
40,
"os:I aoE"0N0U 20tnE
10
(a)
3.02.01.00.0
3.0(b)
-- FLAT--- SPHERICAL••••••• VERTICAL
2.0
.=-IVl
E2 I9 = 0.4-I,-u
1.0
LEAF AREA INDEX
Figure 15. (a) Calculated relation between daily mean photosynthetic rate, P" and leaf-areaindex for two leaf-angle distributions and two greenness values, 'g'. Valuesare for a maizecanopy (table I) on Julian day 180 at 30'N. (b) Calculated relation between daily meancanopy resistance, r;, and leaf-area index for two leaf-angle distributions and twogreenness values, 'g'. Values are for a maize canopy (table I) on Julian day 180at 30aN.
Dow
nloa
ded
by [C
olor
ado
Stat
e U
nive
rsity
] at 1
3:44
05
May
201
3
P. J. Sellers
10 20 30 40 50
Pc (mg C02 dm-' hour")60 70
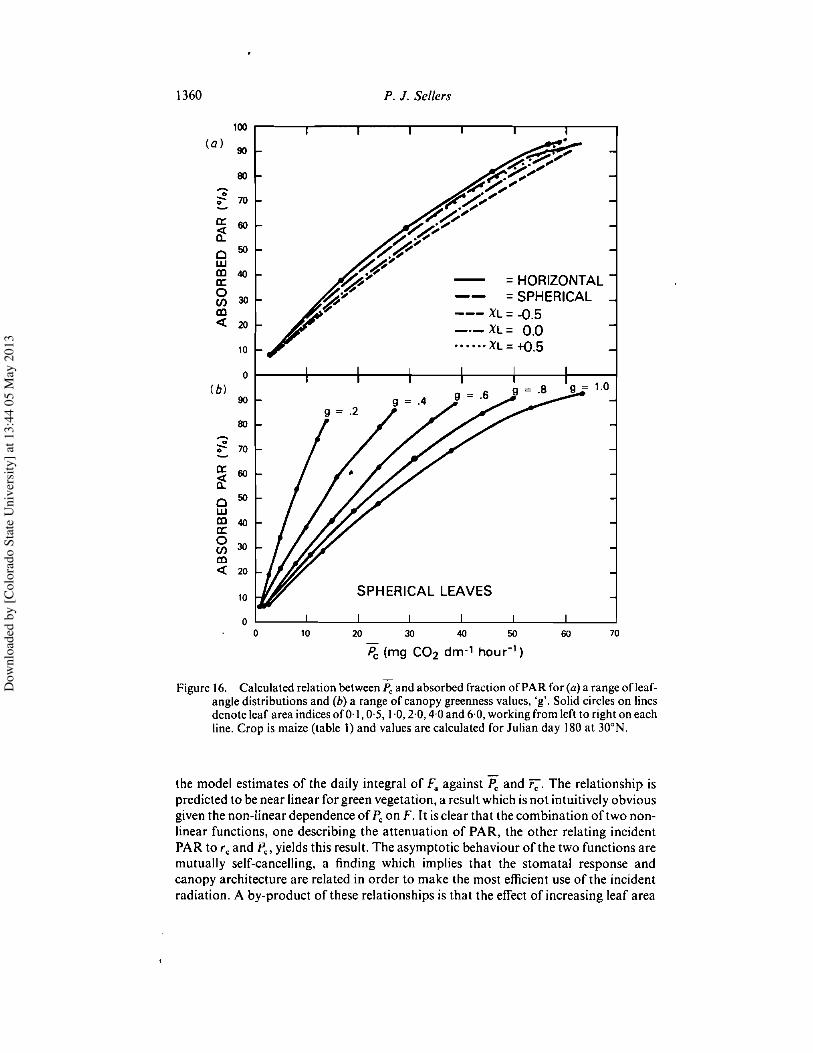
Figure \6. Calculated relation between P, and absorbed fraction of PAR for (a) a range of leaf-angle distributions and (b) a range of canopy greenness values, 'g'. Solid circles on linesdenote leaf area indices of'O'}, 0·5, \,0,2,0,4,0 and 6·0, working from left to right on eachline. Crop is maize (table I) and values are calculated for Julian day 180 at 30aN.
the model estimates of the daily integral of Fa against Pc and r.: The relationship ispredicted to be near linear for green vegetation, a result which is not intuitively obviousgiven the non-linear dependence of Pc on F. It isclear that the combination of two non-linear functions, one describing the attenuation of PAR, the other relating incidentPAR to rc and PO' yields this result. The asymptotic behaviour of the two functions aremutually self-cancelling, a finding which implies that the stomatal response andcanopy architecture are related in order to make the most efficient use of the incidentradiation. A by-product of these relationships is that the effect of increasing leaf area
Dow
nloa
ded
by [C
olor
ado
Stat
e U
nive
rsity
] at 1
3:44
05
May
201
3
Canopy reflectance, photosynthesis and transpiration 1361
=HORIZONTAL=SPHERICAL
---- XL'= - 0.5-.-•• XL = 0.0........ XL = .+0.5
lilO(a)
so
IlO
0 70-0a: 00it0 soWIII 40a:0 ,10(/)III« 20
10
0(b)
00
80
-e 700
a: 60it0 50WIII 40a:0 30(/)III-c 20
10
I)0.0 0.5 1.0 1.5 2.0
1/rc (em 5.1)2.5 3.0
Figure 17. Calculated relation between r; and absorbed fraction of PAR for (a) a rangeof leaf-angle distributions and (b) a range of canopy greennessvalues, 'g'. Solid circles on linesdenote leaf area indicesof 0'1, 0'5,1'0,2'0,4,0 and 6'0, workingfrom left to right on eachline.Other variables are the same as in figure 16.
index on Pc is calculated to fall ofTin a near-geometric fashion. Equation (26) mighttherefore be expected to perform well in regions where the crop is not subject toenvironmental stress.
3.9. Summary of the performance of the canopy photosynthesis and resistance modelsFrom the discussion in the preceding sections, the integration of formulae
describing photosynthesis and stomatal resistance for individual leaves over the depthof whole canopies seem to provide us with reasonable area-averaged estimates ofphotosynthesis and surface resistance (if we neglect soil evaporation). Additionally,
Dow
nloa
ded
by [C
olor
ado
Stat
e U
nive
rsity
] at 1
3:44
05
May
201
3
1362 P. J. Sellers
the integrated expressions give rise to the following predictions which are supported bywhat data are available:
(I) Additional increments in leaf area index have a diminishing effect on canopyphotosynthesis and resistance due to the effects of shading.
(2) The combination of shading, leaf orientation and solar angle tend tolinearize the photosynthetic and stomatal response of whole canopies toincident PAR.
(3) The linearizing effect predicted in (2) results in the prediction ofa near-linearrelation between plant growth rate and canopy resistance (and hencetranspiration loss) and absorbed PAR accordance with observations.
The above relationships are not expected to hold when the crop is subjected tostress or when leaf properties change drastically throughout the depth of the canopy.
4. Canopy photosynthesis, resistance and spectral reflectivity4.1. Limitations of the modelling approach
Prior to interrelating the results of the previous sections, a summary of thelimitations of the theoretical approach seems in order:
(I) The radiative transfer model (equations (I) and (2» is not consistent with theexpression used for describing the attenuation of PAR down through thecanopy in equation (19).
(2) Few scattering processes are isotropic-.(3) The expressions describing leaf photosynthesis and resistance are empirical
summaries of complicated processes.(4) The physiological processes are considered in isolation from factors other than
PAR, i.e. the effects of temperature, leafwater potential, humidity and leaf agehave not been addressed.
(5) Leaf properties are assumed to be constant within the canopy.
In spite of the above, we shall assume that the trends predicted by the simple modelsshould be indicative of what happens in reality.
4.2. Relating canopy photosynthesis and resistance to spectral reflectivityFigures 18 and 19 show the predicted canopy photosynthetic rate, Pc, and the
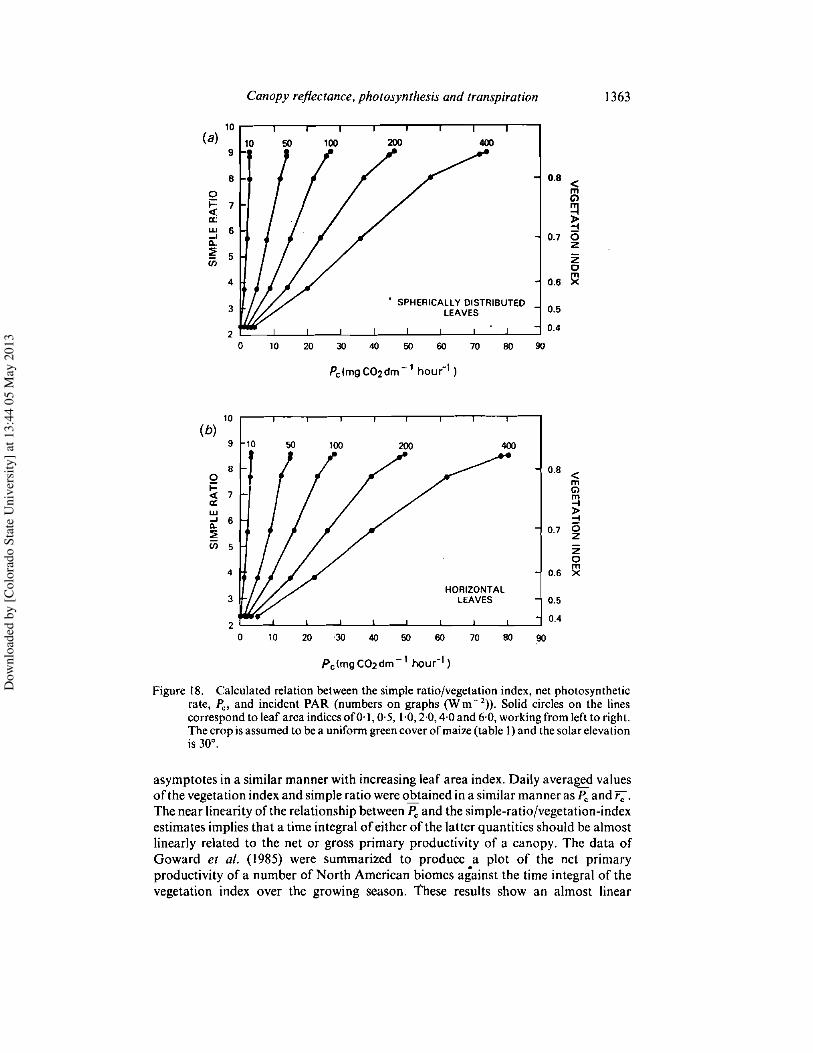
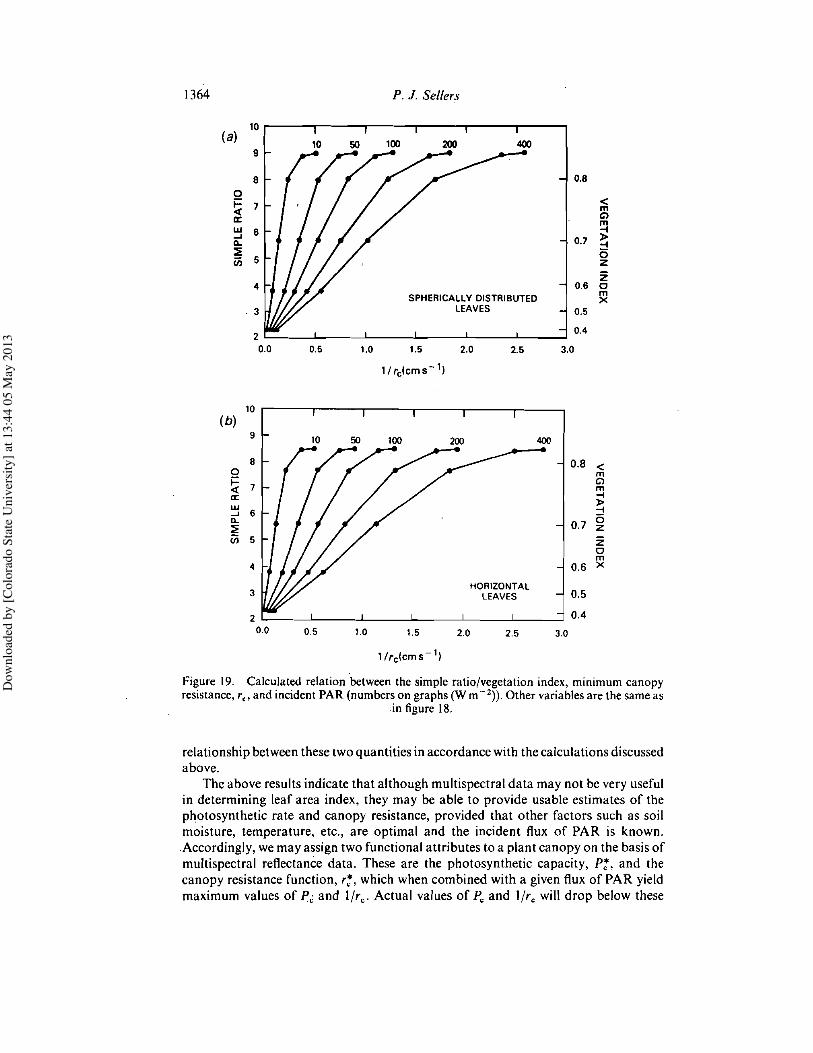
resistance, r c , as functions of leaf area index and incoming photosynthetically activeradiation. The corresponding simple-ratio values are predicted to be near linearlyrelated to Pc and I/rc, the slope of the relationship depending on the incident radiationintensity. While the same trend is apparent in the vegetation index values (see right-hand sides of figures), this quantity is less linearly related to either P; or I/rc than thesimple ratio. This result, which recurs throughout the following discussion, is due tothe more rapid increase in the denominator and decrease in the numerator in theexpression for vegetation index in equation (14) as green leaf area increases. Thevegetation index therefore exhibits a swifter relative response at low leaf area indicesand a more rapid saturation than the simple ratio.
Figures 20 and 21 compare the daily mean values, Pc and r;, to the simple ratio andthe vegetation index as given by equations (I), (2) and (14). It is clear that while thesimple ratio and vegetation index are not very sensitive predictors of leaf area index,they are simulated to be good indicators of the canopy photosynthetic capacity andresistance. The reason for this effect is obvious; Pc, r;and the reflectances approach
Dow
nloa
ded
by [C
olor
ado
Stat
e U
nive
rsity
] at 1
3:44
05
May
201
3
Canopy reflectance, photosynthesis and transpiration 1363
0.8 <mCl
E0.7 0
ZZo
0.6
9060
400
705050
200
4030
100
zo
50
10
10
8
9
J 0.5
Z '--_--'-_----'-__'--_...l.-_--'-_---l'--_..L-_-'-_--' 0.4o
Figure \8. Calculated relation between the simple ratio/vegetation index, net photosyntheticrate, and incident PAR (numbers on graphs (Wm- 2)). Solid circles on the linescorrespond to leaf area indicesof0·\, 0·5, \·0,2·0,4·0 and 6·0, workingfrom left to right.The crop isassumed to bea uniformgreencover ofmaize(table I) and thesolar elevationis 30'.
asymptotes in a similar manner with increasing leaf area index. Daily averaged valuesof the vegetation index and simple ratio were obtained in a similar manner as Pc and r;.The near linearity of the relationship between Pc and the simple-ratio/vegetation-indexestimates implies that a time integral of either of the latter quantities should be almostlinearly related to the net or gross primary productivity of a canopy. The data ofGoward et at. (1985) were summarized to produce a plot of the net primaryproductivity of a number of North American biomes against the time integral of thevegetation index over the growing season. These results show an almost linear
Dow
nloa
ded
by [C
olor
ado
Stat
e U
nive
rsity
] at 1
3:44
05
May
201
3
1364 P. J. Sellers
10(a) 10 50 100 200 400
9
8 0.80i= 7 <c( m
Cla:w 6....l 0.7 »D- ::!
5 0til Z
Z4 0.6 0
SPHERICALLY DISTRIBUTED mX
3 LEAVES 0.5
2 0.40.0 0.5 1.0 1.5 2.0 2.5 3.0
1/ rclcms- 1)
10(b)
9
B 0.8 <0 mi= 7 oc( ma: -iw »
6 -i...J i5D- 0.7:; z(ij 5 Z
0m4 0.6 x
3 HORIZONTALLEAVES 0.5
2 0.40.0 0.5 1.0 1.5 2.0 2.5 3.0
l/fclcms-1)
Figure 19. Calculated relation between the simple ratio/vegetation index, minimum canopyresistance, fe' and incident PAR (numbers on graphs (W m -2)). Other variables are the same as
in figure 18.
relationship between these two quantities in accordance with the calculations discussedabove.
The above results indicate that although multispectral data may not be very usefulin determining leaf area index, they may be able to provide usable estimates of thephotosynthetic rate and canopy resistance, provided that other factors such as soilmoisture, temperature, etc., are optimal and the incident flux of PAR is known.Accordingly, we may assign two functional attributes to a plant canopy on the basis ofmultispectral reflectance data. These are the photosynthetic capacity, P:, and thecanopy resistance function, r:, which when combined with a given flux of PAR yieldmaximum values of P; and lire. Actual values of Pe and I/re will drop below these
Dow
nloa
ded
by [C
olor
ado
Stat
e U
nive
rsity
] at 1
3:44
05
May
201
3
Canopy reflectance, photosynthesis and transpiration 1365
Figure 20. Calculated relation between the simple ratio/vegetation index (equation (14» and(a) P, and (b) 1';. All variables and symbols are the same as in figures 18 and' 19. Canopyhas spherically distributed leaves. Variation with canopy greenness, denoted by 'g', isshown.
maxima if the canopy is subject to any kind of stress. A number of points should beborne in mind when considering these applications:
. (I) Bare ground. The presence of even a small proportion of bare ground (asopposed to an even distribution of vegetation) may seriously complicate theinterpretation of multispectral data. Figure 8 indicates that very densevegetation confined to a 75 per cent cover would appear to correspondspectrally to a leaf-area index of just over unity for a continuous cover. (The
Dow
nloa
ded
by [C
olor
ado
Stat
e U
nive
rsity
] at 1
3:44
05
May
201
3
Figure 21. Calculated relation betweensimple ratio/vegetation index (equation (14))and (0) p.;and (b) T, for a green canopy with spherically distributed leaves for a range of coverfractions, denoted by 'c'. Allother variables and symbolsare the same as in figures 15and20.
figures will change, of course, with different values of soil reflectance, etc.)Figures 20 and 21 show that there is a corresponding uncertainty when relatingPc to the simple ratio.
(2) Greenness. The presence of even a small fraction of dead leaves in the canopywould appear to reduce the vegetation index and simple ratio drastically (seefigures 20 and 21).
(3) Leaforientation and solar elevation. The correlation ofmultispectral data withleaf area index is predicted to be significantly dependent on leaf orientationand solar elevation for leaves with angular distributions other than horizontal.
Dow
nloa
ded
by [C
olor
ado
Stat
e U
nive
rsity
] at 1
3:44
05
May
201
3
Canopy reflectance, photosynthesis and transpiration 1367
The effect increases in severity the more the leaves approach a verticaldist.ribution. Such a result is not surprising in view of t.he fact that the singlescattering albedo, a,(/l), for vertical leaves varies from w/2 to zero as the solarelevation increases from zero to 1(/2.
(4) Viewing angle. Although not discussed here, operational measurements ofsurface reflectances are usually made with narrow field-of-view sensors. Therelationship between the bidirectional reflectance and the biophysical quant-ities of Pc and rccan be expected to vary with view angle, solar azimuth angle,etc. Here, only the integrated hemispherical reflectances are considered.
5. ConclusionsIn conclusion, it would appear that multispectral data may be of some use in
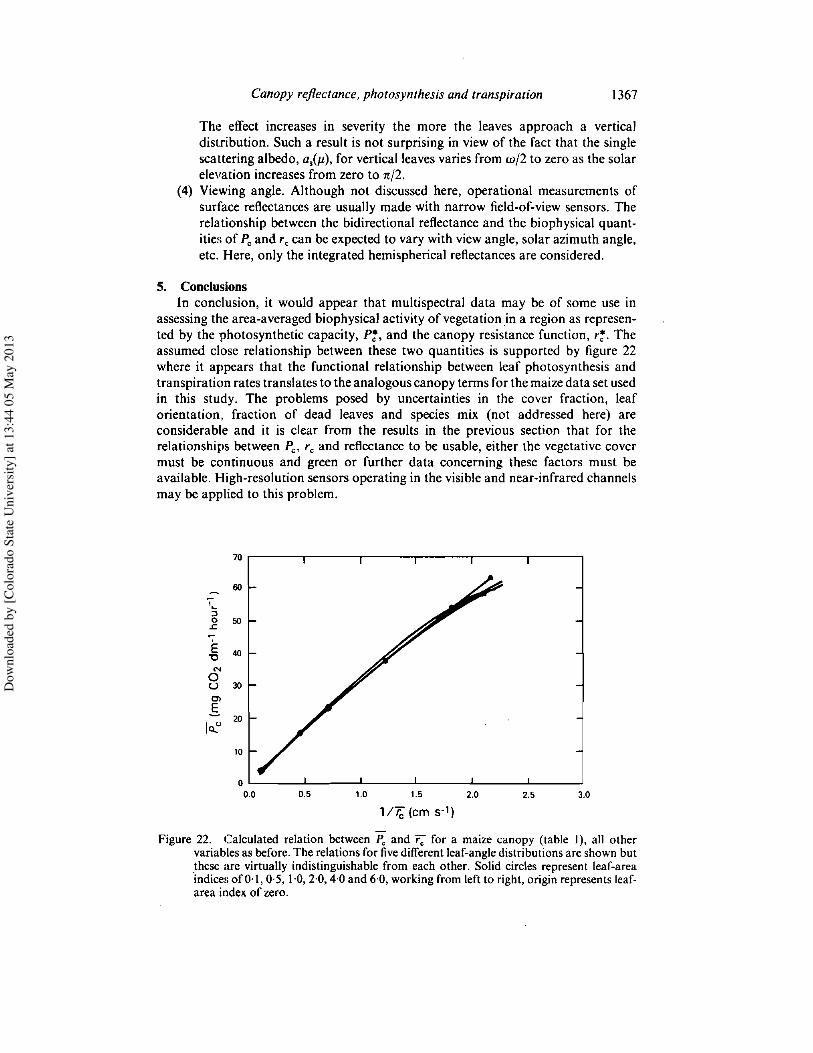
assessing the area-averaged biophysical activity of vegetationin a region as represen-ted by the photosynthetic capacity, and the canopy resistance function, Theassumed close relationship between these two quantities is supported by figure 22where it appears that the functional relationship between leaf photosynthesis andtranspiration rates translates to the analogous canopy terms for the maize data set usedin this study. The problems posed by uncertainties in the cover fraction, leaforientation, fraction of dead leaves and species mix (not addressed here) areconsiderable and it is clear from the results in the previous section that for therelationships between Pc, rc and reflectance to be usable, either the vegetative covermust be continuous and green or further data concerning these factors must beavailable. High-resolution sensors operating in the visible and near-infrared channelsmay be applied to this problem.
70
60
"0 50s:
E 40"0N0U 30Cl
I 2010.."
10
0,5 1.0 1.5
11Tc (cm 5.1)2.0 2.5 3.0
Figure 22. Calculated relation between Pc and r; for a maize canopy (table I), all othervariables as before. The relationsfor five different leaf-angle distributionsare shownbutthese are virtually indistinguishable from each other. Solid circles represent leaf-areaindices of 0'\,0,5, 1,0,2,0,4,0 and 6,0, workingfrom left to right,originrepresents leaf-area index of zero.
Dow
nloa
ded
by [C
olor
ado
Stat
e U
nive
rsity
] at 1
3:44
05
May
201
3
1368 P. J. Sellers
A major obstacle to using satellite observations of surface spectral reflectances inconjunction with physiological models is connected to the range of physiological'responses exhibited by different species in a given plant community, all of which maybe expected to contribute to the total area-averaged photosynthetic and transpirationrates in a complex and non-linear fashion. On the other hand, it is reasonable to assumethat species occupying overlapping or adjacent niches (in ecological terms) will havesimilar physiognomies and physiological responses to environmental forcings (see, forexample, Colinvaux 1973,Kormondy 1969, Dunn 1975, Taylor 1975).Obviously, thissituation does not hold in many regions; for example, shrub-savanna consists ofcoexisting herbacious and shrubby vegetation with differing morphological andphysiological characteristics (Walter, 1973) which implies that there are two broadgroups of evolutionary stable strategies (see, for example, Dawkins 1976) for thevegetation under these particular climatic conditions. However, in other regions(tropical rain forest, grasslands, seasonal forests), the dominant species exhibitsimilarities in form and primary production rates. Here, the assumption of area-averaged canopy characteristics is not so unreasonable.
As mentioned before, this paper is exploratory and further work must be done withmore sophisticated models in conjunction with field experiments to test the validity ofthe various assumptions made in the preceding analysis. It does seem, however, thatsome canopies may utilize the absorbed photosynthetically active radiation in a near-linear fashion and that the visible and near-infrared albedos may respond accordingly.That the simple ratio or vegetation index are poor predictors of leaf area index andbiomass should not be surprising, therefore, but the indications that they may be ableto provide more profound information regarding photosynthesis and transpiration areencouraging.
AcknowledgmentsAt the time of this work, Piers Sellers was a National Academy ofSciencejNational
Research Council Resident Research Associate. Special thanks for help with theintegration of some of the formulae in this paper must be extended to A. Dalcher, P. J.Camillo, R. E. Dickinson and A. T. C. Chang. Helpful discussions with C. J. Tucker, B.J. Choudhury, G. Asrar, J. Norman, J. Monteith, R. J. Gurney, T. J. Schmugge, D. S.Kimes, B. N. Holben, S. N. Goward, Y. Kaufman and R. S. Fraser contributed to thefinal form ofthe paper. The impetus for the work was provided by R. E. Murphy and S.I. Rasool who while attending a workshop on the use of vegetation-index valuessimultaneously said "but what does it all mean?" Joyce Tippett is to be speciallythanked for typing and editing the manuscript.
AppendixSolution to two-stream approximation equations as described in the text.
Direct beam radiation
(10)
b=(l-(I-Plw)
Dow
nloa
ded
by [C
olor
ado
Stat
e U
nive
rsity
] at 1
3:44
05
May
201
3
Canopy reflectance, photosynthesis and transpiration
c=wp'd=wJJKpof=wJJK(l-Po)h=(b2_ C2)1/2/JJ
CT=(JJK)2+C2 - b2
h,=-dp4- cf
I [( hi) - I ( hi _) ]h»> D, d---;;P3 (ul-jlh)S;-P2 d-c---;;(u , +jlK) S2
I [( h,) - . ( hi _) ]h3= d---;;P3 (u, +/lh)S,-p, d-c---;;(u , +jlK) S2
h4=fp3 -cd
I [h4 - I ( h4 _) ]hs= -II; --;;(u2+jlh)S, + U3---;;(U2- jlK) S2
ReferencesALDERFER, R. G., 1975, Photosynthesis in developing plant canopies. In Perspectives of
Biophysical Ecology, edited by D. M. Gates and R. B. Schmerl (New York: Springer-Verlag), pp. 227-238.
ANGUS, J. F., and WILSON, J. H., 1976, Photosynthesis of barley and wheat leaves in relation tocanopy models. Photosynthetica, 10,367.
ASRAR, G., FUCHS, M., KANEMASU, E. T., and HATFIELD, J. L., 1984, Estimating absorbedphotosynthetic radiation and leafarea index from spectral reflectance in wheat. Agron. J.,76,300.
CHARLES-EDWARDS, D. A., and LUDWIG, L. J., 1974, A model for leaf photosynthesis by C3plant species. Ann. Bot., 38, 921.
COLINVAUX, P. A., 1973, Introduction to Ecology (New York: Wiley).CURRAN, P: J., 1980, Multispectral photographic remote sensing of vegetation amount and
productivity. Proceedings of the 14th International Symposium on Remote Sensing oftheEnvironment, Ann Arbor, Michigan, pp. 623-637.
DAVIS, J. M., and TAYLOR, S. E., I980"Leaf physiognomy and climate: a multivariate analysis.Quaternary Res., 14,337-348.
DAWKINS, R., 1976, The Selfish Gene (Oxford: Oxford University Press).DENMEAD, 0. T., 1976, Temperate cereals. In Vegetation and the Atmosphere /I. edited by J. L.
Monteith (New York, London: Academic Press), pp. 1-31.DE WIT, C. T., et al., 1978, Simulation of Assimilation, Respiration and Transpiration of Crops,
(New York: Wiley).DICKINSON, R. E., 1983, Land surface processes and climate-surface albedos and energy balance.
Adv. Geophys., 25, 305.DUNN, E. L., 1975, Environmental stresses and inherent limitations affecting CO2 exchange in
evergreen sclerophylls in Mediterranean climates. In Perspectives ofBiophysical Ecology,edited by D. M. Gates and R. B. Schmerl (New York: Springer-Verlag), pp. 159-181.
EVANS, L. T., and DUNSTONE, R. L., 1970, Some physiological aspects of evolution in wheat.Aust. J. bioi. Sci., 23, 725.
FARQUHAR, G. D., 1978, Feedforward responses of stomata to humidity. Aust. J. PI. Physiol., 5,487.
FARQUHAR, G. D., and SHARKEY, T. D., 1982, Stomatal conductance and photosynthesis. An.Rev. PI. Physiol., 33, 317.
FARQUHAR, G. D., and VON CAEMERRER, S., 1982, Modeling of photosynthetic response toenvironmental conditions. In Encyclopedia ofPlant Physiology, Vol. 12B, edited by 0. L.Lange, P. S. Noble, C. B. Osmond and H. Ziegler (Berlin; Heidelberg: Springer-Verlag),pp. 549-558.
FARQUHAR, G. D., VON CAEMERRER, S., and BERRY, J. A., 1980, A biochemical model ofphotosynthetic CO 2 assimilation in leaves of C 3 species. Planta (Berl.), 149, 78.
FLETCHER, N., 1976, Patterns of leaf resistance to lodgepole pine transpiration in Wyoming.Ecology, 57, 339.
FUCHS, M., ASRAR, G., KANEMASU, E. T., and HIPPS, L. E., 1983, Leaf area estimates frommeasurements of photosynthetically active radiation in wheat canopies. NASA Tech-nical Report SR-M3-04420, NASA/JSC, ERRD, Houston, 77058, U.S.A.
GEE, G. W., and FEDERER, C. A., 1972, Stomatal resistance during senescence of hardwoodleaves, Wat. Resour. Res., 8, 1456.
GOUDRIAAN, J., 1977, Crop Micrometeoroloqy: A Simulation Study. (Wageningen; WageningenCenter for Agricultural Publishing and Documentation).
GOWARD, S. N., TuCKER, C. J., and DYE, D. G., 1985, North American vegetation patternsobserved with the NOAA-7 Advanced Very High Resolution Radiometer, Veqetatio (inthe press).
HESKETH, J. D., and BARKER, D., 1967, Light and carbon assimilation by plant communities.Crop Sci., 7, 285.
INO, Y., 1969, CO2 fixation activity of cut leaf under intermittent illumination conditions.JIBP/pP-Photosynthesis Level III Experiments 1968, pp. 56-59. From Photosynthesisand Productivity in Different Environments, edited by J. P. Cooper (London: CambridgeUniversity Press), pp. 301-302.
INO, Y., 1970, The effect of fluctuating light on photosynthesis. JIBP/PP-Photosynthesis LevelIII Experiments 1969, pp. 68-70. [ibid.]
Dow
nloa
ded
by [C
olor
ado
Stat
e U
nive
rsity
] at 1
3:44
05
May
201
3
Canopy reflectance, photosynthesis and transpiration 1371
ISOBE, S., 1967, Theory of light distribution and photosynthesis in canopies of randomlydispersed foliage area. Bull. Nat. Inst. Sci. A, 16, I.
JAHNKE, L. S., and LAWRENCE, D. B., 1965, Influence of photosynthetic crown structure onpotential productivity of vegetation based primarily on mathematical models. Ecology,46,319.
JARVIS, P. G., 1976, The interpretation of the variations in leaf water potential and stomatalconductance found in canopies in the field. Phil. Trans. R. Soc. B, 273, 593.
KAUFMANN, M. R., 1976, Stomatal response of Engelmann spruce to humidity, light and waterstress. Plant Physiol., 57,898.
KIMES, D. S., 1984, Modeling the directional reflectance from complete homogeneous vegetationcanopies with various leaf orientation distributions. J. opt. Soc. Am. A, 1,725.
KORMONDY, E. J., 1969, Concepts ofEcology. (Englewood Cliffs, New Jersey: Prentice-Hall).MEADOR, W. E., and WEAVER, W. R., 1980, Two-stream approximations to radiative transfer in
planetary atmospheres: a unified description of existing methods and a new improve-ment. J. atmos. Sci., 37, 630.
MILLER, L. D., 1972, Passive remote sensing of natural resources. Dept. Watershed Science,Colorado State University, Colorado.
MILTHORPE, F. L., and MOORBY, J., 1979, An Introduction to Crop Physiology, 2nd edition (NewYork: Cambridge University Press).
MONSt, M., 1968, Mathematical models of plant communities. In Functioning of TerrestrialEcosystems at the Primary Production Level, edited by E. F. Eckardt (Paris: UNESCO),pp. 131-149.
MONSI, M., and SAEKI, T., 1953, Uber den Lichtfactor in den Pflanzengesellschaft und seineBedeutung fur die Stoffproduktion. Jap. J. Bot., 14,22.
MONTEITH, J. L., 1973, Principles ofEnvironmental Physics. (London: Edward Arnold).MONTEITH, J. L., 1977, Climate and the efficiency of crop production in Britain. Phil. Trans. R.
Soc. B, 281, 277.MONTEITH, J. L., SZEICZ, G., and WAGGONER, P. E., 1965, The measurement and control of
stomatal resistance in the field. J. appl. Eco/., 2, 345.NORMAN, J. M., and JARVIS, P. G., 1975, Photosynthesis in Sitka Spruce (Picea Sitchensis
(Bong.) Carr.), V. J. appl. Ecol., 839.PARKHURST, D. G., and LOUCKS, O. L., 1972, Optimal leaf size in relation to environment. J.
Ecol. 60, 505.Ross, J., 1975, Radiative transfer in plant communities. In Vegetation and the Atmosphere, Vol.
I, edited by J. L. Monteith (London: Academic Press), pp. 13-52.SINCLAIR, T. R., MURPHY, C. E., and KNOERR, K. R., 1976, Development and evaluation of
simplified models for simulating canopy photosynthesis and transpiration. J. appl. Ecol.,13,813.
SUITS, G. H." 1972, The calculation of the directional reflectance ofa vegetative canopy. RemoteSensing Environ., 2, 117.
TAN, C. S., and BLACK, T. A.. 1976, Factors affecting the canopy resistance of a Douglas-Firforest. Boundary-Layer Met., 10,475.
TAN, C. S., and BLACK, T. A., 1978, Evaluation of a ventilated diffusion porometer for themeasurement of stomatal diffusion resistance of Douglas-Fir needles. Arch. Met.Geophys. Biok/im. B, 26, 257.
TAYLOR, S. E., 1975, Optimal leaf form. In Perspectives ofBiophysical Ecology, edited by D. M.Gates and R. B. Schmerl (New York: Springer-Verlag), pp. 73-86.
TENHUNEN, J. D., HESKETH, J. D., and GATES, D. M., 1980, Leaf photosynthesis models. InPredicting Photosynthesis for Ecosystem Models, Vol. II, edited by J. D. Hesketh and J.W. Jones. (CRC Press), (Boca Raton: CRC Press), pp. 17-47.
TUCKER, C. J., HOLBEN, B. N., ELGIN,J. H.,and McMURTREY, 1981, Remote sensing of total drymatter accumulation in winter wheat. Remote Sensing Emiiron., 11, 171.
TURNER, N. c., 1974, Stomatal response to light and water under field conditions. R. Soc. NiZ.Bull., 12,423.
VAN BAVEL, C. H. M., 1975, A behavioral equation for leaf carbon dioxide assimilation and atest of its validity. Photosynthesis, 9, 165.
VAN DER PLOEG, R. R., TASSONE, G., and VON HOYNINGEN-HEUNE, J., 1980, Thejoint measuringcampaign 1979 in Ruthe (West Germany)-description of Preliminary Data. E.E.e.Joint Research Center, Ispra.
Dow
nloa
ded
by [C
olor
ado
Stat
e U
nive
rsity
] at 1
3:44
05
May
201
3
/372 Canopy reflectance, photosynthesis and transpiration
WALTER, H., 1973, Vegetation of the Earth: In Relation to Climate and Eco-physioloqicalConditions(New York, Heidelberg, Berlin: Springer-Verlag), pp. 238.
WATTS, W. R., NEILSON, R. E., and JARVIS, P. G., 1976, Photosynthesis in Sitka Spruce iPiceaSitchensis (Bong.) Carr.)), VII. J. appl. £Col., 13,623.
WILLIAMS, W. E., 1983, Optimal water-use efficiency in a California shrub. Plant. Cell Entnron.,6,145.
WOODS, D. 8., and TuRNER, N. c., 1971, Stomatal response to changing light by four tree speciesof varying shade tolerance. New Phytol., 70, 77.
ZELITCH, 1., 1971, Photosynthesis, Photorespiration and Plant Productivity (New York:Academic Press).