165
Canterbury Regional Economic Development Strategy 2009

Canterbury Regional
Economic
Development Strategy
2009
2
Contents
Section 1 Canterbury Regional Profile and Economic Outlook
Section 2 Vision and Objectives
Section 3 Implementation Plan
Section 4 Exemplar Projects

3
Canterbury Regional Profile
and Economic Outlook
4
Acknowledgements
This project was funded by New Zealand Trade and Enterprise through the Canterbury Economic Development Co. The authors Paul Dalziel and Caroline Saunders AERU Research Unit, Lincoln University are particularly grateful to Heather Warwick (Enterprise North Canterbury), Lesley Symington and Barbara Bately (Selwyn District Council), Rob Brawley (Enterprise Ashburton) and Wendy Smith and Andrea Miller (Aoraki Development Trust) for helping us identify key sectors in their respective districts. We are also particularly grateful to John Reid (Te Rūnanga o Ngāi Tahu) for briefing us on approaches to economic development within Ngāi Tahu. We thank Simon Markham and Mary Sparrow (Waimakariri District Council), John McPhail (Kaikoura District Councillor) and Annie Paterson (Kaikoura District Council) for feedback through Heather Warwick on economic development in North Canterbury. We thank Rachel Pugh for comments on economic development in the Selwyn District. We are grateful for helpful comments from participants in two meetings hosted by the Canterbury Development Corporation: Justin Andrist, Toni Browne, Blair Cottam, Chris Hyland, Trish Leddy, Larry Podmore, Simon Worthington (all CDC), Adam Naiman (Christchurch City Council) and Richard Simmonds (Christchurch City Holdings Ltd). We thank staff from the Christchurch offices of New Zealand Trade and Enterprise who provided us with written or verbal background material: Stephen Bryant, David Grant, Mark Hazeldine, Cate Hlavac, David Lough, Maureen Manson and Irvine Paulin. We pay tribute to our former AERU colleague, Meike Guenther, for her outstanding work in collecting data and preparing the Economic Base Reports that provided the foundations for this Canterbury Regional Profile and Economic Outlook.
iii
Contents
Acknowledgements ii
Contents iii
List of Tables iv
List of Figures v
Preface vii
1. Introduction 1
2. Producing from the Land 5
3. The People of Canterbury 15
4. The Canterbury Labour Force 21
5 The Canterbury Economy 29
6. Key Sectors in Canterbury 37
7. Economic Infrastructure in Canterbury 43
8. Economic Outlook 57
References 69

iv
List of Tables
2.1 Agriculture Land Use in Canterbury, 2002 and 2007 8
2.2 Farm Types in Canterbury, 2002 and 2007 9
2.3 Livestock in Canterbury, 2002 and 2007 10
2.4 Selected Crops in Canterbury, 2002 and 2007 11
2.5 Canterbury/Waipara Grape Varieties, 2008 13
3.1 Usually Resident Population in Canterbury, 2001 and 2006 15
3.2 Projected Population in Canterbury, 2006 and 2031 17
3.3 Age Distribution in Canterbury, 2001 and 2006 18
3.4 Highest Attainment of Canterbury School Leavers, 2007 20
4.1 Highest Education Attainments of Working Age Population, 2006 24
4.2 Total Personal Incomes of Working Age Population, 2005/06 25
4.3 Occupations of Employed People, 2006 26
5.1 Estimated GDP for Canterbury, 2007 31
5.2 Shift-Share Analysis of Canterbury Employment, 2001-2006 36
6.1 Annual Guest Nights in Canterbury, 2004-2008 40
7.1 Overview of Canterbury Transport Infrastructure, 2006/07 46
7.2 Canterbury Regional Land Transport Strategy Targets 47
7.3 Household Access to Telecommunications, 2001 and 2006 49
8.1 Forecasts of Trading Partners’ Economic Growth 58
8.2 Composition of the Property and Business Services Sector 61

v
List of Figures
The Canterbury Region x
1.1 Canterbury Regional Strategic Land Transport Network 3
2.1 Land-Use Capability Classes in Canterbury 6
2.2 Vineyard Production Areas of New Zealand, 2008 12
2.3 Canterbury/Waipara Grape Varieties, 2008 13
3.1 Canterbury Projected Median Age, 1996-2031 19
4.1 Canterbury Working Age Population and Labour Force, 1988-2008 21
4.2 Canterbury and New Zealand Participation Rates, 1988-2008 22
4.3 Canterbury and New Zealand Unemployment Rates, 1988-2008 22
5.1 New Zealand Real Per Capita GDP, 1969/70-2007/08 29
5.2 Canterbury and New Zealand Industry Employment Shares, 2006 33
5.3 Canterbury and New Zealand Increase in Employment, 2006 33
5.4 Extra Employees Not Explained by National Trends, 2001-2006 35
6.1 The South Island Clusters Identified By NZTE, 2002 38
6.2 Annual Guest Nights in Canterbury, 2001-2008 41
6.3 Forecasts of Total Visits to Canterbury, 2008-2014 42
7.1 Passenger Movements at Christchurch International Airport, 1999-2008 43
7.2 Cargo Movements at Christchurch International Airport, 1999-2008 44
7.3 Cargo Movements at Port of Lyttelton, 1999-2008 45
7.4 Cargo Movements at PrimePort Timaru, 1999-2008 45
7.5 Urban/Rural Use of Dial-Up and Broadband Technologies, 2006 50
7.6 Canterbury Water Resource Zones 52
7.7 Average Seasonal Variation of Future Water Demand Scenario 53
7.8 Stylised Regional Innovation System 55

vi
List of Figures (Continued)
8.1 Actual and Projected Economic Growth, New Zealand, 2006-2012 57
8.2 Actual and Projected Unemployment, New Zealand, 2006 2012 59
8.3 New Zealand United States Exchange Rate, 1999-2008 60
8.4 New Zealand’s Economic Structure in Four Segments 64

vii
Preface
E te whenua, e takoto nei, tēnā koe.
E Aoraki, e ngā maunga o tēnei motu, tēnā koutou.
E ngā awa, e ngā moana, e ngā mahinga kai, tēnā koutou.
E Te Moana-nui-a-Kiwa, tēnā koe.
E ngā Papatipu Rūnanga o Ngāi Tahu whānui, tēnā koutou.
Kei te mihi māua ki ngā taonga o Waitaha, Ngāti Māmoe me Ngāi Tahu.
E ngā tāngata kua nau mai no ngā hau e whā ki tēnei wāhi, tēnā koutou.
Tēnā koutou, tēnā koutou, kia ora tatou katoa.
The authors of this report are very pleased to begin by greeting the land, the mountains, the rivers, the lakes, the gathering places of food and the ocean of Canterbury. We are very pleased to acknowledge the region’s tāngata whenua and to pay tribute to the treasured heritage of Waitaha, Ngāti Māmoe and Ngāi Tahu. We are very pleased to greet all the peoples who have come to this region from the four corners of the world. Greetings, greetings, may we all live in good health.
In November 2008, the AERU Research Unit at Lincoln University (working in close partnership with the economic development agencies of North Canterbury, Christchurch City, Selwyn, Ashburton and South Canterbury) was commissioned to update the Canterbury Regional Economic Development Strategy (CREDS) that was first prepared in 2000 and then revised in 2005. This report completes the first stage of our work, in which we present a snapshot of the region’s economic profile and outlook.
Any regional economic development strategy must build on the strengths of its existing businesses and industries. In New Zealand, the policy focus is on firms who export, since other firms are constrained by the size of New Zealand’s relatively small domestic market. Consequently, our intention in this report is to assess Canterbury’s strengths and opportunities for export-based economic development, based on the region’s social, economic, environmental and cultural resources. The data analysed in the chapters that follow provide important foundations for the design of an updated economic development strategy, which is the next step in our work.

viii
In presenting this first report, the authors acknowledge the work that was done for CREDS 2000 and CREDS 2005, particularly by the Canterbury Development Corporation (which was responsible for coordinating the writing of those two strategic documents). Our own work seeks to build on those earlier documents and follows their example in many important ways.
CREDS 2000 sought to identify regional issues grouped under five major headings: economy; education and skills; social; environment; and attitude. A number of priorities were chosen for each heading, and then each priority was fleshed out with a series of action areas and measures of success. The result was a very comprehensive spreadsheet of goals, priorities, action areas and measures of success, but the review of the strategy in 2005 came to the view that ‘while a significant number of projects and activities resulted from the 2000 strategy, the document and its action framework suffered from being too high-level in its focus’.
Consequently, CREDS 2005 sought to complement a high-level ‘top-down’ strategic approach with a sub-regional ‘bottom-up’ focus on local issues within the constituent territorial authorities of Canterbury. This was timely since the regional, city and district councils were engaged in preparing Long Term Council Community Plans (LTCCPs) under the recently reformed Local Government Act 2002. CREDS 2005 identified ten major regional issues and opportunities, and supplemented this regional analysis with stand-alone strategic plans at the district or city level for North Canterbury, Christchurch, Banks Peninsula, Selwyn, Ashburton and South Canterbury.
During our consultations for the preparation of this CREDS update, the authors were told that the projects identified in the district-level strategic plans have generally been completed, and that CREDS 2005 had provided a valuable impetus to those projects. There is a general perception that CREDS 2005 was less successful in initiating regional-level initiatives. That perception was validated by examining the CREDS website at the end of 2008, which stated without further detail that ‘the local Government and key stakeholders in CREDS are currently working on the development of several transformational regional and local projects as identified in the strategic plan, all determined by our vision and mission of transforming Canterbury into a world-class regional economy founded on innovation, diversity and sustainability’.

ix
Important regional initiatives have taken place within Canterbury since 2005. Different partnerships of central and local government bodies have begun strategic work programmes related to the region’s economic development; for example, the Greater Christchurch Urban Development Strategy, the Canterbury Regional Land Transport Strategy 2008 - 2018, Stages 2 and 3 of the Canterbury Strategic Water Study and the Canterbury Labour Market Strategy. Further, in February 2009 all of Canterbury’s territorial authorities published renewed Long Term Council Community Plans in draft.
Against this background, the team responsible for updating CREDS is focusing on identifying strategic region-wide initiatives for fostering regional economic development, taking into account the various regional and local strategies already in existence. The update process is following Regional Economic Development Strategy Guidelines published as a web-based resource by the Ministry of Economic Development in October 2008 (see www.med.govt.nz/strategy-development/). These guidelines recommend research at an early stage of the process to gather relevant data that will help identify the region’s positioning in the national economy and its key regional drivers of economic development. This report presents the results of this stage of our work.
The authors are particularly grateful to our former colleague, Meike Guenther, for her outstanding work in collating data on the local and regional economies of Canterbury. This resulted in five Economic Base Reports for North Canterbury, Christchurch City, Selwyn, Ashburton and South Canterbury, as well as a separate report for the Canterbury region as a whole. These reports were discussed in draft with our partner economic development agencies before the final reports were prepared.
The Canterbury Regional Profile and Economic Outlook presented here is based on those final reports. It is written for a general audience with the aim of synthesising relevant data to highlight important features of the Canterbury regional economy. These features will be taken into account in the next step of the project, which involves preparing an updated regional economic development strategy.
Paul Dalziel Caroline Saunders (30 March 2009)

x
The Canterbury Region
Source: Morgan et al. (2002, p. 8).

1
1. Introduction
The Canterbury region covers 4.8 million hectares in the middle of the South Island of New Zealand. To the east, the Canterbury coastline extends along the Pacific Ocean, from Kekerengu Point in the north to the Waitaki River in the south. The Canterbury Plains extend westwards to the Southern Alps, overseen by Aoraki/Mt Cook, the tallest mountain in Australasia (3754 metres).
Eighteen major rivers flow across the plains to the sea: Clarence (Waiau-Toa), Conway (Tūtae Putaputa), Waiau, Hurunui, Waipara, Kowai, Ashley (Rakahuri), Waimakariri, Selwyn (Waikirikiri), Rakaia, Ashburton (Hakatere), Hinds (Hekeato), Rangitata, Orari, Opihi, Pareora, Waihao and Waitaki. Nearly 90 per cent of the Canterbury area is covered by pastoral grasses, tussock, scrub or bare land, with another 8 per cent devoted to forests.
The first settlers in the region were Māori, beginning with the Waitaha tribes, followed by Ngāti Māmoe and then Ngāi Tahu. As successive migrations arrived, they defeated or intermingled with their predecessors, so that today Ngāi Tahu describe themselves as ‘the iwi comprised of Ngāi Tahu whānui; that is, the collective of the individuals who descend from the five primary hapū of Ngāi Tahu, Ngāti Māmoe and Waitaha, namely Kāti Kurī, Ngāti Irakehu, Kāti Huirapa, Ngāi Tūāhuriri and Ngāi Te Ruahikihiki’ (see the Ngāi Tahu website, www.ngaitahu.iwi.nz/About-Ngai-Tahu/).
An Act of Parliament set up Te Rūnanga o Ngāi Tahu (TRONT) in 1996, which is governed by elected representatives from 18 Papatipu Rūnanga throughout the South Island. Ten of these hold manawhenua over land within Canterbury: Te Rūnanga o Kaikōura; Te Ngāi Tuahuriri Rūnanga; Rapaki Rūnanga (Te Hapū o Ngāti Wheke); Te Rūnanga o Koukourarata; Wairewa Rūnanga; Te Rūnanga o Onuku; Taumutu Rūnanga; Te Rūnanga o Arowhenua; Te Rūnanga o Waihao; and Te Rūnanga o Moeraki.
The first wave of organised European migrations began in England with the formation of the Canterbury Association by John Godley and Edward Wakefield in 1848 and the arrival at Lyttelton of the Association’s first four ships in December 1850: the Charlotte Jane, the Randolph, the Sir George Seymour and the Cressy. Further vessels brought the number of European settlers in Canterbury to 3,000 by the end of 1851. In 1852, New Zealand was divided into six self-governing provinces, including Canterbury. These provincial governments were replaced by a national government on 1 November 1876, with local government devolved to 64 counties.

2
The system of local government in New Zealand has continued to change over the decades. Canterbury now has a Regional Council, known as Environment Canterbury, which covers territories governed by the Kaikoura District Council, the Hurunui District Council, the Waimakariri District Council, the Christchurch City Council, the Selwyn District Council, the Ashburton District Council, the Timaru District Council, the Waimate District Council and the Mackenzie District Council. The Environment Canterbury region also includes the western half of the Waitaki District Council.
The Canterbury region continues to attract migrants from around the world. In the 2006 census, 17.9 per cent of the normally resident Canterbury population who reported their place of birth were born outside New Zealand. The largest group were born in the United Kingdom and Ireland (6.7 per cent), followed by residents who had been born in Asia (4.7 per cent).
Figure 1.1 comes from Environment Canterbury’s (2008) Regional Land Transport Strategy. It shows the region’s strategic land transport network, and is a good representation of the integrated province. There are five main points of entry by land. From the north, State Highway One brings traffic from the top of the South Island through Marlborough into Canterbury and towards Kaikoura. To the west, three mountain passes provide access from the north-west (Lewis Pass), the west (Arthur’s Pass) and the south-west (Lindis Pass). From the south, State Highway One brings traffic from Oamaru in North Otago towards Timaru in South Canterbury.
The city of Christchurch lies at the centre of the network. Christchurch International Airport is the point of arrival into the province for many visitors from overseas and the rest of New Zealand; it recorded three million passenger arrivals in 2008. In the 2006 census, two-thirds of Canterbury’s normally resident population (521,832 people) lived in Christchurch City (348,435 people).
Canterbury offers a great diversity of cultural, recreational and sporting opportunities to visitors and residents alike. The city of Christchurch, the larger towns and the smaller villages of Canterbury are conscious of their heritage, which is interpreted in museums, galleries, festivals and events throughout the province. To give an example that reflects the region’s agricultural roots, in any given calendar year there are nineteen Agricultural and Pastoral (A&P) shows in Canterbury, organised in Amberley, Amuri (Rotherham), Ashburton, Banks Peninsula, Cheviot, Christchurch (the Royal New Zealand Show), Courtenay, Duvachelle, Ellesmere, Hawarden, Kaikoura, MacKenzie, Malvern, Mayfield, Methven, Oxford, Rangiora, Temuka and Geraldine, and Waimate.

3
Figure 1.1 Canterbury Regional Strategic Land Trans port Network
Source: Environment Canterbury (2008, p. 98).

4
The following chapters of this report provide data and analysis to describe important features of the Canterbury regional economy. Chapter 2 begins with production from the land. Chapter 3 presents data on the Canterbury population, mainly drawn New Zealand’s five yearly census and population projections, and Chapter 4 describes trends in the Canterbury labour force. Chapter 5 discusses the Canterbury economy, using standard industry classifications. For many purposes, the standard classifications are too broad, and so Chapter 6 discusses important industry clusters in the region, including tourism. Chapter 7 presents data on infrastructure in Canterbury, focusing on airports and seaports, land transport, telecommunications, water and innovation systems. Chapter 8 concludes the report with a discussion of the short-term outlook for the Canterbury economy in the context of recent national and international trends.

5
2. Producing from the Land
There is considerable diversity in land types within the Canterbury region (see Winterbourn, 2008, which is the source of the material in this paragraph). In the most straightforward classification, Jon Harding and Michael Winterbourn (1997) identify four ecoregions: the Southern Alps, the High Country, the East Coast Plains and Banks Peninsula. The Southern Alps ecoregion involves steep mountain terrain with no forest vegetation. The High Country ecoregion is characterised by less steep terrain on the eastern foothills of the Southern Alps. Parts of this ecoregion can support beech forest, exotic plantation forests, indigenous and introduced scrub and pasture grasses. The East Coast Plains extend from the Southern Alps foothills to the east coast of the South Island. This ecoregion is highly modified to support pastoral and other types of farming, as well as hosting the main urban settlements in Canterbury. Banks Peninsula is comprised of two deeply eroded volcanic craters, which has resulted in a distinctive ecoregion despite the similar climate to that on the East Coast Plains.
The Canterbury Regional Council has defined eight soil environment groups (Environment Canterbury, 2004). These are: (a) High country: moist mountain ranges; (b) High country: dry mountain ranges; (c) Inland basins and major river valleys; (d) Soft rock hill country and downs; (e) Hard rock hill country; (f) Kaikoura coastal zone; (g) Banks Peninsula; and (h) The Canterbury Plains. Maps of these groups can be found on pages 8-6 and 8-7 of the Council’s Proposed Natural Resources Regional Plan.
Kevin O’Connor and George Knox (2008) offer a different classification based on ten major land systems. This classification again recognises Banks Peninsular as a distinctive system, but divides the East Coast Plains into three land systems: the Hurunui Basin, the Canterbury Plains and the Timaru Downs. The Southern Alps and High Country are divided into six land systems: Hope-Kaikoura, Arrowsmith-Arthur’s, Heron-Porter, Aoraki, Mackenzie-Waitaki and Kohurau-Hunter. A map showing the ten major land systems can be found on page 865 of their book chapter.
A third classification is provided by Peter Newsome’s (1987) eight classes of land-use capabilities. Classes 1-4 are suitable for cultivation. Class 1 describes land that is good for multiple uses and has very little erosion risk; class 4 has severe limitations on what can be grown, requiring very careful land management. Classes 5-8 cover non-arable land. Classes 5 and 6 are good for forestry and pasture, Class 7 is very difficult for pasture but moderately suited for forestry, and Class 8 is not suitable for production.

6
Figure 2.1 presents a pie chart of the distribution of land-use capability classes in Canterbury, taken from a table prepared by Trevor Webb (2008) using Newsome’s categories. Given the presence of the Southern Alps in the west of the region, it is not surprising that nearly one-quarter (23 per cent) of the land in Canterbury is not suited for production and another 16 per cent is in Class 7.
Figure 2.1 Land-Use Capability Classes in Canterbur y
Classes 1-2
4%
Class 3
29%
Class 4
4%
Classes 5-6
24%
Class 7
16%
Class 8
23%
Source: Webb (2008, p. 116).
Note: The classes are ranked from the most versatile soils in Class 1 to non-productive land in Class 8.
More than a third of the land in Canterbury is arable (Classes 1 to 4), but only four per cent of the total land area is in the most versatile categories of Classes 1 and 2. Webb (2008, pp. 115) comments that half of this four per cent lies within a one hour commuting distance from Christchurch, so that there has been pressure on this resource from rising demand for lifestyle blocks. Environment Canterbury (1998, p. 87) has a policy objective to ‘minimise the irreversible effect of land use activities on land comprising versatile soils where such use would foreclose future land use options that benefit from being located on those soils, where it is practicable to so’.

7
Just over 60 per cent of Canterbury land is in land-use capability Classes 1 to 6, which is good for cultivation (Classes 1 to 3) or good for pasture and forestry (Classes 1 to 6). The quality of these soils has long been the basis of Canterbury’s land-based economy. Nevertheless, from the earliest migrations into the region, settlers have had to be innovative to produce from the land. Sir Tipene O’Regan (1989), for example, has explained how Ngāi Tahu settlers in the seventeenth century modified Māori culture to meet the rigours of the colder environment and a very different economy from their previous experience in the eastern North Island. The Waitangi Tribunal (1991, p. 843) has recorded that survival for the tribes depended on seasonal journeys to hunt and gather food from mahinga kai spread over wide territories.
Similarly, the vision of the Canterbury Association in 1848 was that the new English settlement would be based on an agriculture sector involving large numbers of yeoman farmers on relatively small blocks of land. Once the settlers arrived, they discovered this was impractical. The rules were soon changed to allow large properties for running sheep to produce wool for export to the United Kingdom. The decade after 1857 was a boom time for the pastoralists; at its height in 1867, annual wool exports from Canterbury were 11 million pounds, worth more than £600,000 (Rogers, 2007, p. 55).
Primary sector producers in Canterbury have access to a number of research organisations that offer expertise in raising land productivity while improving environmental outcomes. In particular, the Lincoln Resource is a group of companies and organisations involved in land-based research and its application in business, based in and around the Lincoln township in Selwyn. Partners include AgResearch, Crop and Food Research, the Foundation for Arable Research, Heinz Wattie’s, Lincoln University, Lincoln Ventures, Manaaki Whenua Landcare Research Ltd, PGG Wrightson Ltd and Selwyn District Council. This cluster involves more than 900 staff involved in a range of research, development, consulting, support and management roles. It is an important strategic asset for the ongoing improvement of land productivity in Canterbury.
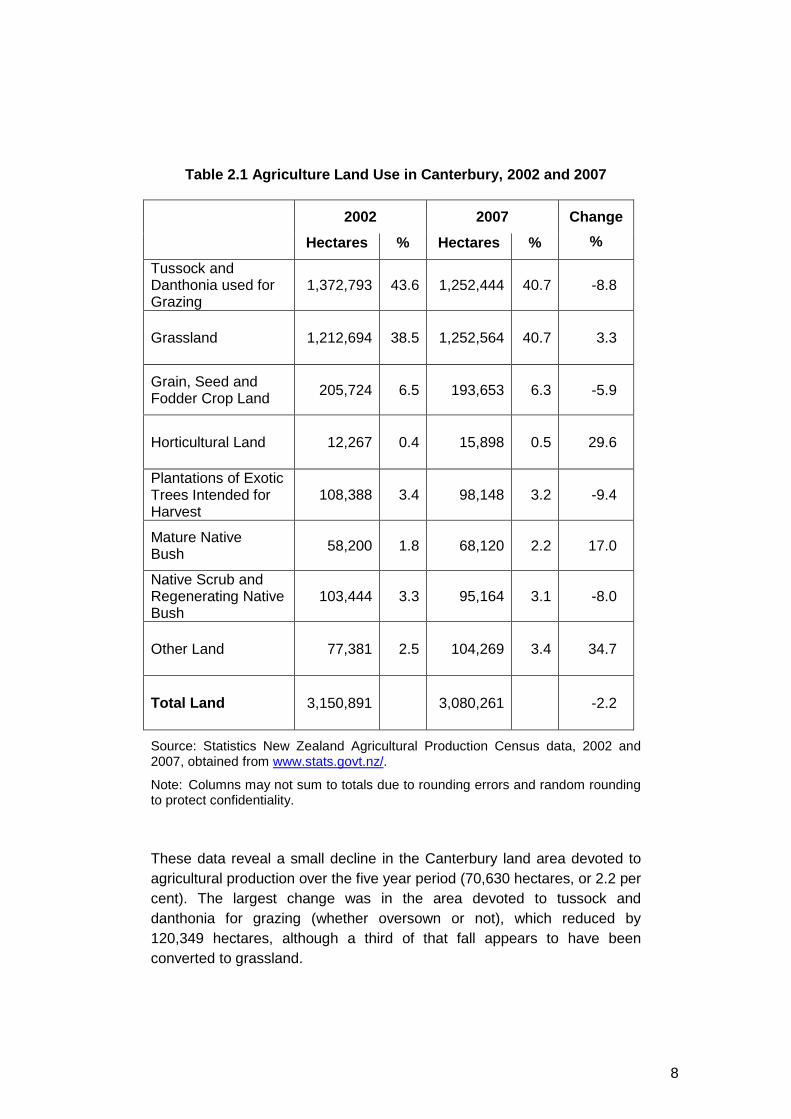
Statistics New Zealand in association with the Ministry of Agriculture and Forestry conducts a census of agricultural production in New Zealand every five years (www.stats.govt.nz/economy/primary-production/). The census provides statistics on animal farming (including sheep, beef and dairy cattle, and deer), crop growing (including grain and seed crops, fruit and vegetables, wine grapes and nursery plants) and forestry. Table 2.1 presents information on agricultural land use in Canterbury as recorded in the 2002 and the 2007 agricultural production censuses.
8
Table 2.1 Agriculture Land Use in Canterbury, 2002 and 2007
2002 2007
Hectares % Hectares %
Change
%
Tussock and Danthonia used for Grazing
1,372,793 43.6 1,252,444 40.7 -8.8
Grassland
1,212,694 38.5 1,252,564 40.7 3.3
Grain, Seed and Fodder Crop Land 205,724 6.5 193,653 6.3 -5.9
Horticultural Land
12,267 0.4 15,898 0.5 29.6
Plantations of Exotic Trees Intended for Harvest
108,388 3.4 98,148 3.2 -9.4
Mature Native Bush 58,200 1.8 68,120 2.2 17.0
Native Scrub and Regenerating Native Bush
103,444 3.3 95,164 3.1 -8.0
Other Land
77,381 2.5 104,269 3.4 34.7
Total Land
3,150,891 3,080,261 -2.2
Source: Statistics New Zealand Agricultural Production Census data, 2002 and 2007, obtained from www.stats.govt.nz/.
Note: Columns may not sum to totals due to rounding errors and random rounding to protect confidentiality.
These data reveal a small decline in the Canterbury land area devoted to agricultural production over the five year period (70,630 hectares, or 2.2 per cent). The largest change was in the area devoted to tussock and danthonia for grazing (whether oversown or not), which reduced by 120,349 hectares, although a third of that fall appears to have been converted to grassland.
9
Table 2.2 Farm Types in Canterbury, 2002 and 2007
2002 2007 Farm type (ANZSIC06) Number % Number %
Change
%
Sheep Farming 3,000 29.2 2,220 23.3 -26.0
Beef Cattle Farming 1,400 13.6 1,551 16.3 10.8
Sheep-Beef Cattle Farming 540 5.3 591 6.2 9.4
Dairy Cattle Farming 820 8.0 858 9.0 4.6
Deer Farming 570 5.5 420 4.4 -26.3
Horse Farming 480 4.7 408 4.3 -15.0
Other Animal Farming 555 5.4 588 6.2 5.9
TOTAL FARMING 7,365 71.6 6,636 69.7 -9.9
Fruit Growing 543 5.3 447 4.7 -17.7
Grain Growing 300 2.9 330 3.5 10.0
Vegetable Growing 490 4.8 291 3.1 -40.6
Plant Nurseries 220 2.1 180 1.9 -18.2
Grape Growing 110 1.1 153 1.6 39.1
Cut Flower & Flower Seed Growing 190 1.8 114 1.2 -40.0
Other Crop Growing 170 1.7 528 5.5 210.6
TOTAL GROWING 2,023 19.7 2,043 21.5 1.0
Forestry 550 5.3 495 5.2 -10.0
Other 345 3.4 342 3.6 -0.9
TOTAL FARMS 10,000 9,519 -7.5
Source: Statistics New Zealand Agricultural Production Census data, 2002 and 2007, obtained from www.stats.govt.nz/.
Note: Columns do not sum to totals due to rounding errors and random rounding to protect confidentiality. Some smaller categories in the original census data have been combined in this table.
10
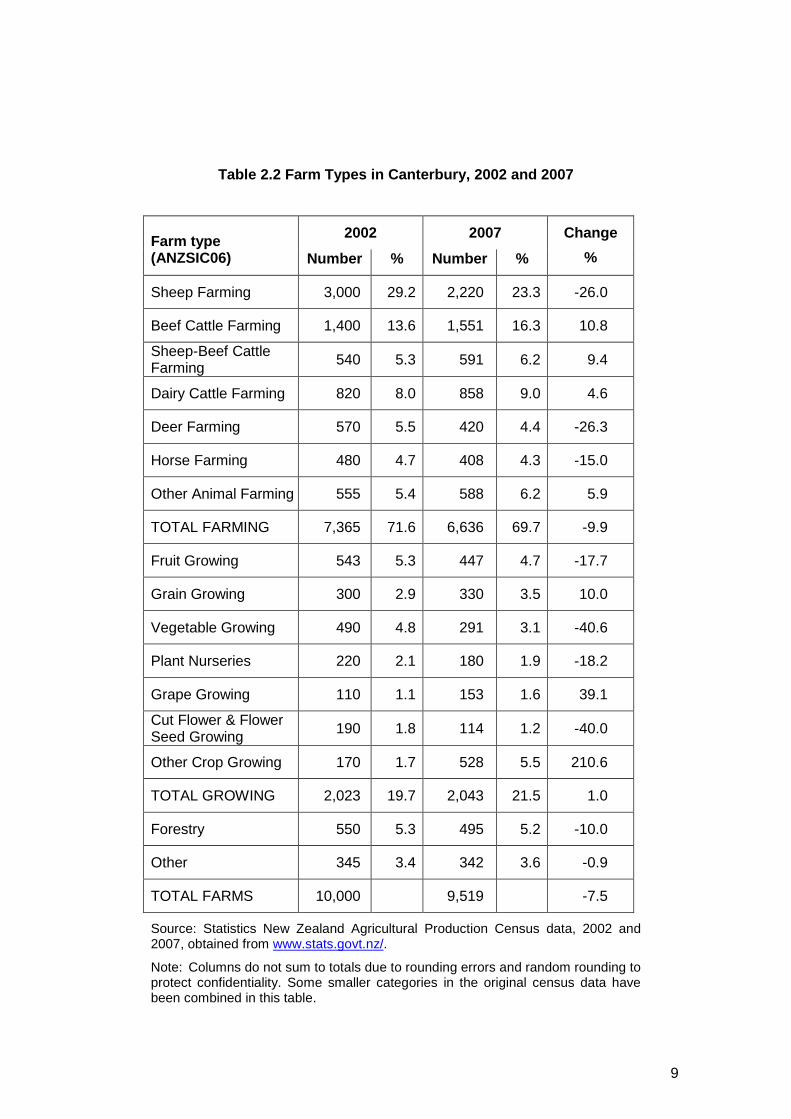
Table 2.2 analyses the farms in Canterbury by farm type. It is divided into three subgroups: animal farming; crop growing; and forestry and other categories (including services to farming). The number of farms primarily engaged in animal farming fell by 9.9 per cent between 2002 and 2007. The census data record a large drop in the number of sheep farms, from 3,000 in 2002 to 2,220 in 2007. The numbers of deer farms and horse farms also reduced, offset by increases in the number of beef cattle farms and dairy cattle farms.
The number of crop farms recorded in the 2007 census was slightly higher than in the 2002 census. There were significant falls in the number of farms primarily engaged in vegetable growing and fruit growing, but a large increase in the number of farms engaged in other crops not elsewhere classified (358 farms, or 210.6 per cent). This may represent a movement in niche crops for specialist markets.
The data recorded a fall in the number of forest plantations in Canterbury from 550 in 2002 to 495 in 2007.
Table 2.3 Livestock in Canterbury, 2002 and 2007
2002 2007
Livestock Number % Number %
Change
%
Sheep 7,758,336 82.5 7,166,822 78.4 -7.6
Dairy Cattle 542,610 5.8 754,937 8.3 39.1
Beef Cattle 505,461 5.4 584,806 6.4 15.7
Deer 411,581 4.4 394,833 4.3 -4.1
All Other 191,001 2.0 234,243 2.6 22.6
TOTAL 9,408,989 100.0 9,135,641 100.0 -2.9
Source: Statistics New Zealand Agricultural Production Census data, 2002 and 2007, obtained from www.stats.govt.nz/.
Note: Columns do not sum to totals due to rounding errors and random rounding to protect confidentiality. Some smaller categories in the original census data have been combined in this table.
11
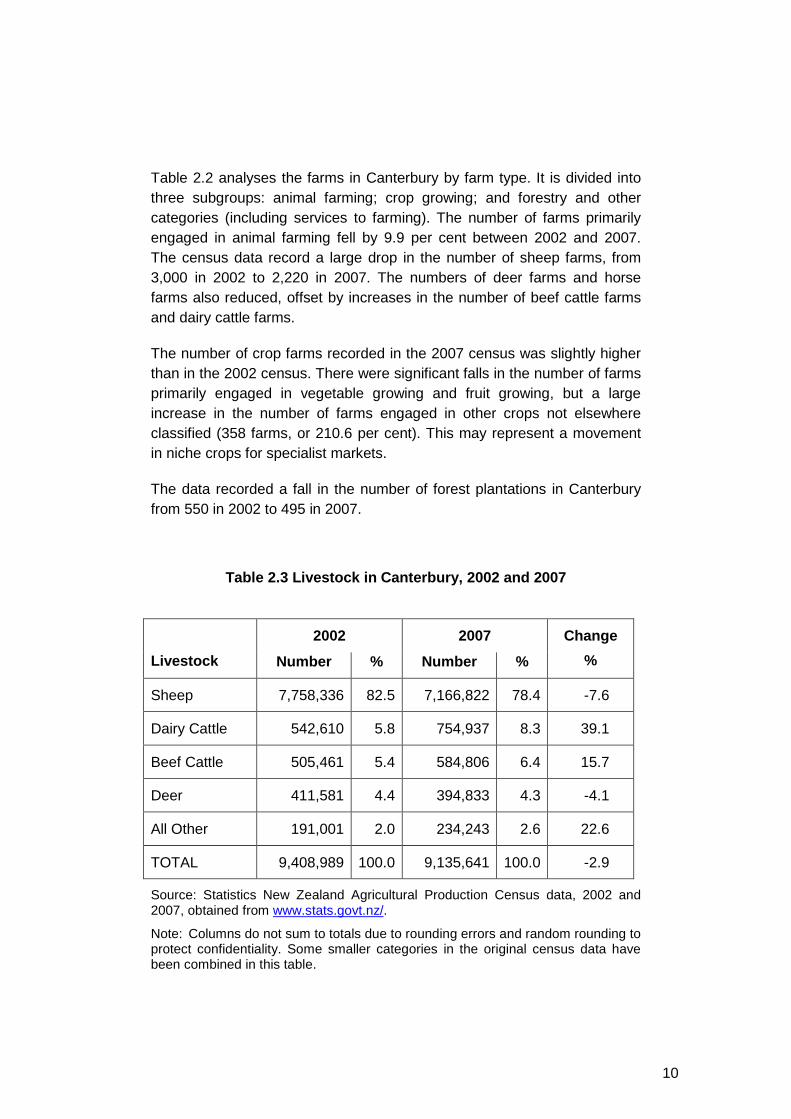
Table 2.3 confirms the scale of the changes in Canterbury that took place in animal farming between 2002 and 2007. The size of the total sheep flock decreased by 7.6 per cent, while the dairy cattle herd and the beef cattle herd both increased significantly. The record milksolid price received by dairy cattle farmers in 2007/08 means that the dairy cattle herd is likely to have increased further that year. In January 2009, however, the Fonterra Co-operative Group announced a much lower forecast payout for the 2008/09 season ($5.10 per kg, down from $7.90 in 2007/08).
Table 2.4 Selected Crops in Canterbury, 2002 and 20 07
Crop
2002
Hectares
2007
Hectares
Change
%
Grain and Seed Crops
Wheat 35,261 35,301 0.1
Barley 51,567 36,869 -28.5
Oats 4,631 2,925 -36.8
Other Cereal Grains 1,689 2,129 26.1
Maize Grain 404 432 6.9
Field / Seed Peas 8,518 5,063 -40.6
Other Pulses 1,424 352 -75.3
Seed and Other Grain Crops 23,727 36,716 54.7
Fruit Grown Outdoors
Wine Grapes 749 1,683 124.7
Blackcurrents 846 660 -22.0
Olives 659 437 -33.7
Apples 343 249 -27.4
Walnuts 192 327 70.3
Source: Statistics New Zealand Agricultural Production Census data, 2002 and 2007, obtained from www.stats.govt.nz/.

12
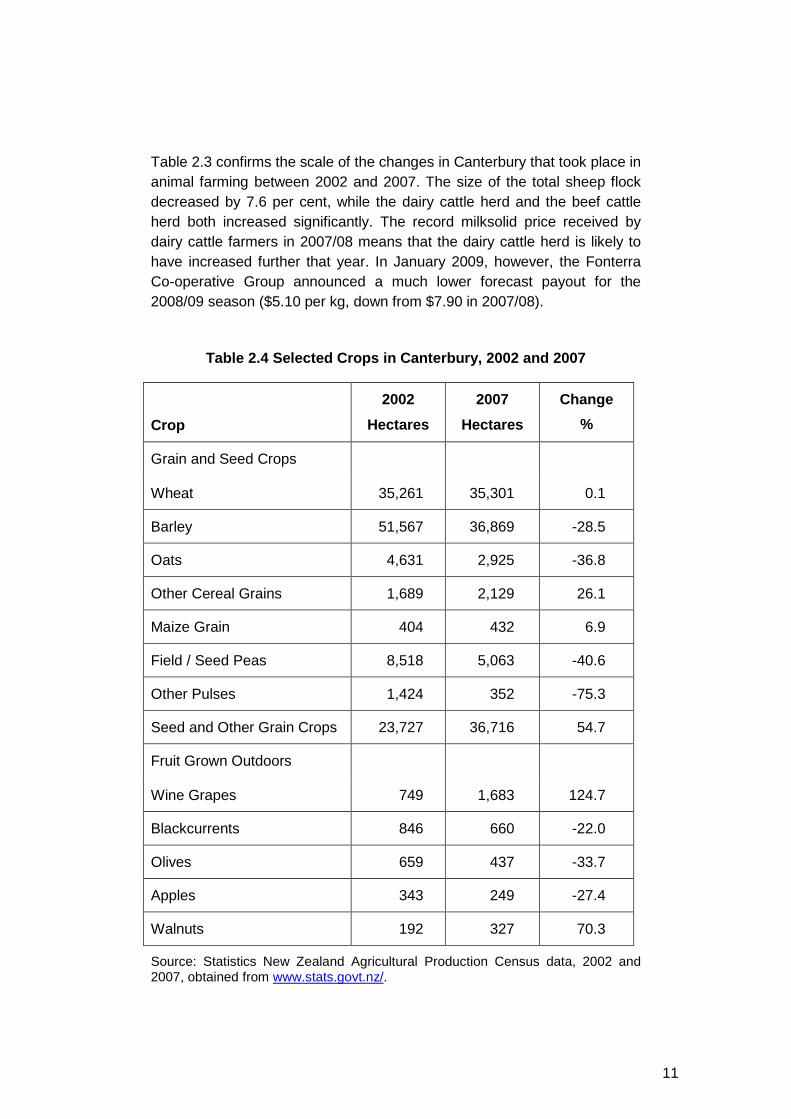
Table 2.4 presents 2002 and 2007 data for Canterbury hectares planted in selected crops. The top half of the table shows grain and seed crops, while the bottom half shows some outdoor fruit crops. There were significant falls in the area devoted to barley and oats, but a significant increase in seed and other grain crops. This last category is dominated by herbage seeds (statistics on this item were not collected separately in the 2002 census) and illustrates the responsiveness of farmers to shift towards a high value-added product in a reasonably short period.
The table shows that the area devoted to wine grapes more than doubled, from 749 hectares in June 2002 to 1,683 hectares in June 2007. This means that the Canterbury/Waipara region is now the fourth largest vineyard production area in New Zealand, as shown in Figure 2.2 below. Table 2.5 presents data on the grape varieties grown in the Canterbury/ Waipara region. More than four-fifths (82.1 per cent) of the vineyard areas are in Waipara, which has become an important wine-growing cluster in North Canterbury. Two-fifths of the Canterbury/Waipara wine area is devoted to Sauvignon Blanc grapes (see also Figure 2.3). Pinot Noir accounts for a further 24 per cent, with Chardonnay, Pinot Gris and Riesling being the other three significant varieties in the region.
Figure 2.2 Vineyard Production Areas of New Zealand , 2008
Marlborough
54%
Hawkes Bay
17%
Gisbourne
7%
Canterbury/
Waipara
6%
Otago
5%
Wairarapa/
Wellington
3%
Nelson
3%
Other
5%
Source: New Zealand Winegrowers (2008) Statistical Annual 2008, p. 4, obtained from www.nzwine.com/statistics/.
Note: Calculated from hectares in production. Auckland and Waikato/Bay of Plenty data have been combined with the Other and Unknown category in this chart.

13
Table 2.5 Canterbury/Waipara Grape Varieties, 2008
Crop
Waipara
Hectares
Canterbury
Hectares
Total
Hectares
Pinot Noir 300.0 119.8 419.8
Chardonnay 67.5 56.0 123.5
Pinot Gris 78.6 32.7 111.3
Riesling 279.4 50.5 329.9
Sauvignon Blanc 650.9 34.1 685.0
Other 45.9 16.4 62.3
Total 1422.3 309.5 1731.8
Source: New Zealand Winegrowers (2008) Statistical Annual 2008, pp. 23-24, obtained from www.nzwine.com/statistics/.
Figure 2.3 Canterbury/Waipara Grape Varieties, 2008
Pinot Noir
24%
Chardonnay
7%
Pinot Gris
6%
Riesling
6%
Sauvignon Blanc
40%
Other
3%
Source: New Zealand Winegrowers (2008) Statistical Annual 2008, pp. 23-24, obtained from www.nzwine.com/statistics/.

14
A well recognised characteristic of land production in Canterbury is the influence of water. Recent research by Arthur Grimes and Andrew Aitken (2008) on land in the Mackenzie District of Canterbury, for example, found that irrigated farms sell for up to 50 per cent more than similar non-irrigated farms. Water storage and related issues are considered in the infrastructure chapter of this report.

15
3. The People of Canterbury
The number of people recorded in the 2006 census as usually resident in Canterbury was 521,832. This was 13.0 per cent of the New Zealand usually resident population. It represented an increase of 8.4 per cent since the previous census in 2001, which was above the national rate of increase (7.8 per cent). Table 3.1 shows the distribution of the population among Christchurch City, the eight Districts and the half District of West Waitaki that make up the Canterbury region.
Table 3.1 Usually Resident Population in Canterbury , 2001 and 2006
2001 2006 City, Districts and Region Number % Number %
Change
%
Christchurch City 324,057 67.3 348,435 66.8 4.0
Kaikoura 3,483 0.7 3,621 0.7 6.0
Hurunui 9,885 2.1 10,476 2.0 7.5
Waimakariri 36,900 7.7 42,834 8.2 16.1
Selwyn 27,312 5.7 33,666 6.5 23.3
Ashburton 25,443 5.3 27,372 5.2 7.6
Timaru 41,967 8.7 42,867 8.2 2.1
Mackenzie 3,717 0.8 3,804 0.7 2.3
Waimate 7,101 1.5 7,206 1.4 1.5
West Waitaki 1,566 0.3 1,551 0.3 -1.0
Canterbury 481,431 521,832 8.4
Source: Statistics New Zealand Census of Population and Dwellings data, 2001 and 2006, obtained from www.stats.govt.nz/.
Note: The West Waitaki data is calculated as a residual to ensure that the sum of the numbers for the districts of Canterbury equals the numbers for the region.
16
Two features immediately stand out from Table 3.1. First, two-thirds of the Canterbury population reside in Christchurch City. Of these residents, just over 5,000 live on Banks Peninsula, but a further 11.8 per cent of the region’s population live in the four towns with more than 10,000 residents (Rangiora, 11,871; Kaiapoi, 12,946; Ashburton, 11,931; and Timaru, 24,694). Thus, more than three-quarters of people usually resident in Canterbury live in the region’s five largest urban settlements.
Second, the two Districts that are immediately outside Christchurch City (Waimakariri and Selwyn) had very high population growth over the five year period. The 23.3 per cent increase in Selwyn was the second highest growth by a New Zealand territorial authority between the 2001 census and the 2006 census (only the Queenstown-Lakes District had a higher growth rate), and the 16.1 per cent increase in Waimakariri was the fifth highest in the country. The population of Rolleston on the outskirts of Christchurch City almost doubled from 1,974 people to 3,822 people, an increase of 93.6 per cent. These increases meant that Christchurch City itself grew at the modest rate of 4.0 per cent over the five years. The growth rates in South Canterbury (Timaru, Mackenzie, Waimate and West Waitaki) were all below 2.5 per cent.
The expansion in the residential population within commuting distance of Christchurch City has led to a definition of the ‘Greater Christchurch’ urban area that includes the eastern parts of the Waimakariri and Selwyn Districts and the urban and some rural areas of Christchurch City (including the Lyttelton Harbour Basin). Environment Canterbury, the Christchurch City Council, the Waimakariri District Council, the Selwyn District Council and Transit New Zealand collaborated to produce the Greater Christchurch Urban Development Strategy and Action Plan 2007, referred to by the acronym UDS. This substantial 194 page document is intended to provide the primary strategic direction for the UDS area and to establish a basis for all organisations and the community to co-operatively manage growth.
Official projections of the region’s population growth for the next 25 years are reported in Table 3.2. The Selwyn and Waimakariri Districts are projected to grow at the fastest rate between 2006 and 2031, while the projections suggest that South Canterbury will lose population. Under the medium fertility, mortality and migration assumptions used to derive the data in Table 3.2, the combined share of Christchurch City, Waimakariri District and Selwyn District is projected to increase from 81.6 per cent in 2006 to 84.2 per cent in 2031, while the combined population of South Canterbury is projected to fall by 4.6 per cent over the twenty-five years.

17
Table 3.2 Projected Population in Canterbury, 2006 and 2031
2006 2031 City, Districts and Region Number % Number %
Change
%
Christchurch City 361,800 67.0 422,100 65.9 16.7
Kaikoura 3,700 0.7 3,900 0.6 5.4
Hurunui 10,800 2.0 12,600 2.0 16.7
Waimakariri 44,100 8.2 64,100 10.0 45.4
Selwyn 35,000 6.5 53,400 8.3 52.6
Ashburton 28,000 5.2 30,900 4.8 10.4
Timaru 43,800 8.1 42,300 6.6 -3.4
Mackenzie 3,900 0.7 3,800 0.6 -2.6
Waimate 7,400 1.4 6,400 1.0 -13.5
West Waitaki 1,500 0.3 1,500 0.2 0.0
Canterbury 540,000 641,000 18.7
Source: Statistics New Zealand Subnational Population Projections: 2006(base)-2031 data, 2006 and 2031, obtained from www.stats.govt.nz/.
Notes: Projections are for the 30th of June each year, involving medium assumptions about fertility, mortality and migration. The West Waitaki data is calculated as a residual to ensure that the sum of the numbers for the districts of Canterbury equals the numbers for the region.
There are some important differences in the population dynamics of Christchurch City compared to the rest of Canterbury. These are presented in Table 3.3 on the next page, which shows the region’s age distribution for three age groups: 0-14 years, 15-64 years, and 65 years and above. The middle group approximates the region’s workforce. The first set of data is for Christchurch City; the second set is for the rest of Canterbury; and the third set contains the totals for the whole of Canterbury.
The first point to note from Table 3.3 is that the growth rate of the youngest age group in Canterbury (5.1 per cent for the five years from 2001 to 2006) is well below the growth rate of the two older age groups (9.3 per cent and
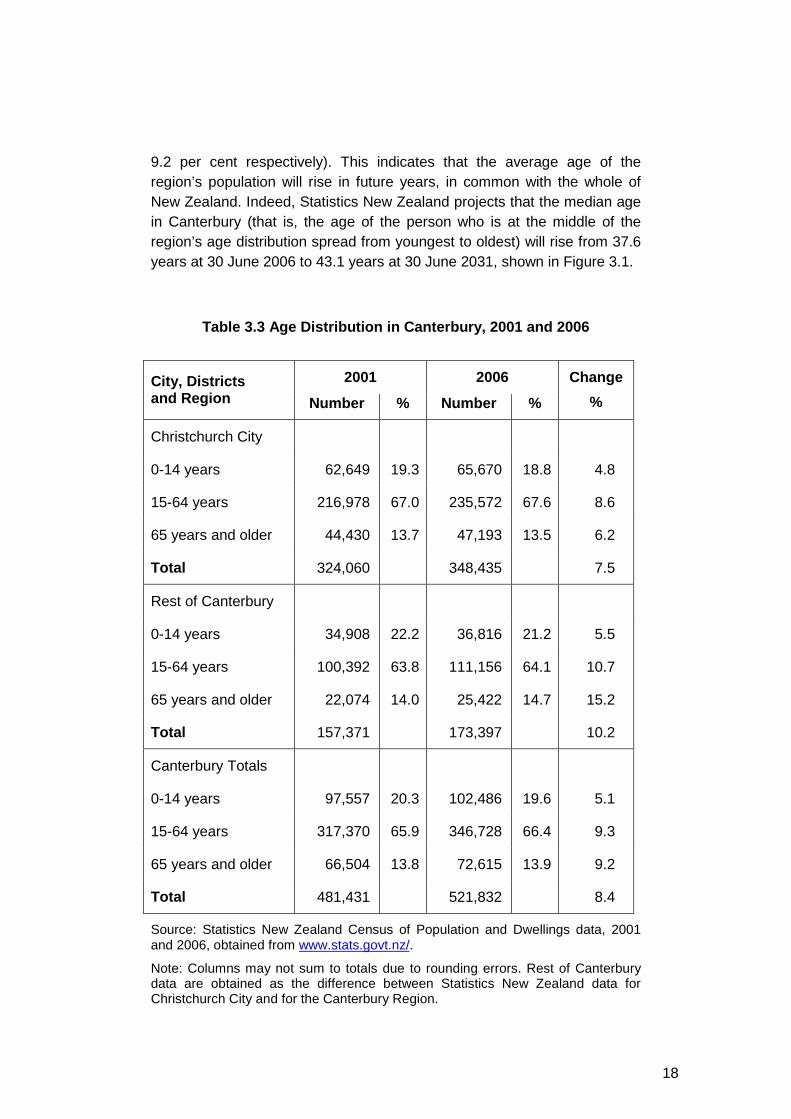
18
9.2 per cent respectively). This indicates that the average age of the region’s population will rise in future years, in common with the whole of New Zealand. Indeed, Statistics New Zealand projects that the median age in Canterbury (that is, the age of the person who is at the middle of the region’s age distribution spread from youngest to oldest) will rise from 37.6 years at 30 June 2006 to 43.1 years at 30 June 2031, shown in Figure 3.1.
Table 3.3 Age Distribution in Canterbury, 2001 and 2006
2001 2006 City, Districts and Region Number % Number %
Change
%
Christchurch City
0-14 years 62,649 19.3 65,670 18.8 4.8
15-64 years 216,978 67.0 235,572 67.6 8.6
65 years and older 44,430 13.7 47,193 13.5 6.2
Total 324,060 348,435 7.5
Rest of Canterbury
0-14 years 34,908 22.2 36,816 21.2 5.5
15-64 years 100,392 63.8 111,156 64.1 10.7
65 years and older 22,074 14.0 25,422 14.7 15.2
Total 157,371 173,397 10.2
Canterbury Totals
0-14 years 97,557 20.3 102,486 19.6 5.1
15-64 years 317,370 65.9 346,728 66.4 9.3
65 years and older 66,504 13.8 72,615 13.9 9.2
Total 481,431 521,832 8.4
Source: Statistics New Zealand Census of Population and Dwellings data, 2001 and 2006, obtained from www.stats.govt.nz/.
Note: Columns may not sum to totals due to rounding errors. Rest of Canterbury data are obtained as the difference between Statistics New Zealand data for Christchurch City and for the Canterbury Region.

19
Figure 3.1 Canterbury Projected Median Age, 1996-20 31
25
30
35
40
45
50
1996 2001 2006 2011 2016 2021 2026 2031
Years
As at 30 June
Source: Statistics New Zealand Subnational Population Projections: 2006(base)-2031 data, 2006 and 2031, obtained from www.stats.govt.nz/.
The second point to note from Table 3.3 is that the population of Christchurch City has been growing more slowly than the rest of the region (7.5 per cent, compared to 10.2 per cent for the rest of Canterbury), but has a greater share of its population in the working age group (15-64 years). In times of low unemployment, this is likely to imply labour shortages in the rural districts of Canterbury if there is a tendency for working age adults who do not have young or elderly dependents to move to the city.
Table 3.4 on the following page presents data on the education attainments of Canterbury school leavers in 2007, available at the Ministry of Education’s Education Counts website. It records 6,759 young people left Canterbury schools in 2007, 40 per cent of whom attained National Certificate of Educational Attainment (NCEA) Level 3 qualification or higher. The proportion attaining NCEA Level 1 or higher was 83.1 per cent, and the proportion qualifying for university entrance was 37.8 per cent. These figures are all better than the national averages recorded that year.
More than two-thirds of the school leavers came from Christchurch City schools (68.3 per cent). The table records some disparities between Christchurch City schools and schools in the rest of Canterbury, especially at the highest attainment levels. Thus, 41.4 per cent of school leavers from

20
Christchurch schools qualified for university entrance, but only 30.0 per cent from the rest of Canterbury. Similarly, 43.5 per cent of Christchurch school leavers attained an NCEA Level 3 qualification or higher, but only 32.4 per cent outside of Christchurch.
Table 3.4 Highest Attainment of Canterbury School L eavers, 2007
Highest Attainment Level Christchurch
City Rest of
Canterbury Canterbury
Totals
No. 2,010 695 2,705 NCEA Level 3 or higher
% 43.5 32.4 40.0
No. 538 217 755 Halfway to a Level 3 qualification % 11.7 10.1 11.2
No. 717 444 1,161 NCEA Level 2
% 15.5 20.7 17.2
No. 320 194 514 Halfway to a Level 2 qualification % 6.9 9.1 7.6
No. 278 206 484 NCEA Level 1
% 6.0 9.6 7.2
No. 335 170 505 Halfway to a Level 1 qualification % 7.3 7.9 7.5
No. 212 106 318 Less than halfway to a Level 1 qualification % 4.6 4.9 4.7
No. 207 110 317 Little or no formal attainment % 4.5 5.1 4.7
No. 4,617 2,142 6,759 Total School Leavers
% 100.0 100.0 100.0
No. 1911 642 2553 University Entrance Attainment % 41.4 30.0 37.8
Source: Ministry of Education School Leavers data, 2007, obtained from www.educationcounts.govt.nz/statistics/schooling/school_leavers2/school_leavers.
Notes: Rest of Canterbury data are obtained as the difference between Ministry of Education data for Christchurch City and for the Canterbury Region. Data excludes international and adult students. The final row (University Entrance Attainment) is already included in the Total School Leavers figures of the previous row. More precise definitions of the qualification levels can be found in the original database available at the above website.

21
4. The Canterbury Labour Force
New Zealand’s labour force statistics define the country’s working age population as those aged 15 and above. The solid line in Figure 4.1 shows the Canterbury region’s working age population over the last 20 years. The dotted line in the figure shows the number of people who were participating in the labour force each quarter. To be counted as part of the labour force, a person must be of working age, and must be either employed (including self-employed) for at least one hour a week or officially unemployed (by actively searching for employment and being available to start work immediately).
Figure 4.1 Canterbury Labour Force and Working Age Population, 1988-2008
0
100
200
300
400
500
600
88 89 90 91 92 93 94 95 96 97 98 99 00 01 02 03 04 05 06 07 08
Thousands
Working Age Population
Labour Force
Source: Statistics New Zealand Household Labour Force Survey data, 1998-2008, obtained from www.stats.govt.nz/.
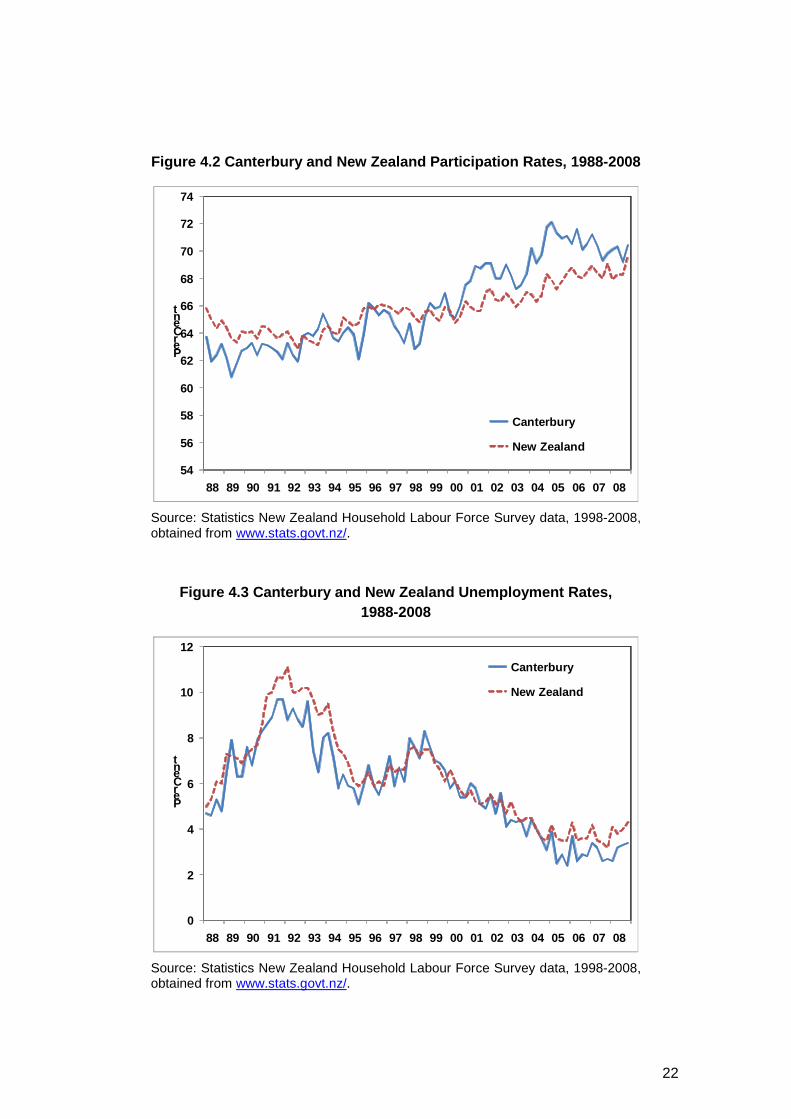
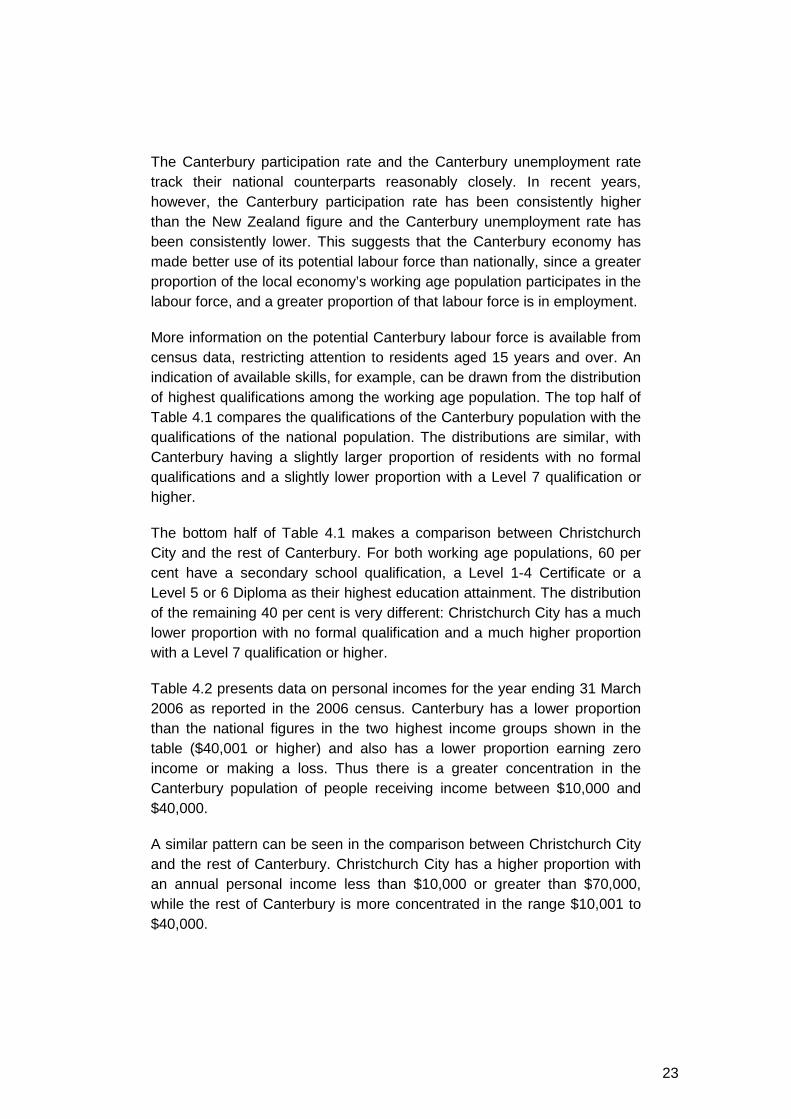
The ratio of the labour force to the working age population is known as the economy’s participation rate. The ratio of the number of people officially unemployed to the labour force is the economy’s unemployment rate. Figures 4.2 and 4.3 show for Canterbury and New Zealand the participation rates and the unemployment rates respectively over the same time period as Figure 4.1.
22
Figure 4.2 Canterbury and New Zealand Participation Rates, 1988-2008
54
56
58
60
62
64
66
68
70
72
74
88 89 90 91 92 93 94 95 96 97 98 99 00 01 02 03 04 05 06 07 08
Per Cent
Canterbury
New Zealand
Source: Statistics New Zealand Household Labour Force Survey data, 1998-2008, obtained from www.stats.govt.nz/.
Figure 4.3 Canterbury and New Zealand Unemployment Rates, 1988-2008
0
2
4
6
8
10
12
88 89 90 91 92 93 94 95 96 97 98 99 00 01 02 03 04 05 06 07 08
Per Cent
Canterbury
New Zealand
Source: Statistics New Zealand Household Labour Force Survey data, 1998-2008, obtained from www.stats.govt.nz/.
23
The Canterbury participation rate and the Canterbury unemployment rate track their national counterparts reasonably closely. In recent years, however, the Canterbury participation rate has been consistently higher than the New Zealand figure and the Canterbury unemployment rate has been consistently lower. This suggests that the Canterbury economy has made better use of its potential labour force than nationally, since a greater proportion of the local economy’s working age population participates in the labour force, and a greater proportion of that labour force is in employment.
More information on the potential Canterbury labour force is available from census data, restricting attention to residents aged 15 years and over. An indication of available skills, for example, can be drawn from the distribution of highest qualifications among the working age population. The top half of Table 4.1 compares the qualifications of the Canterbury population with the qualifications of the national population. The distributions are similar, with Canterbury having a slightly larger proportion of residents with no formal qualifications and a slightly lower proportion with a Level 7 qualification or higher.
The bottom half of Table 4.1 makes a comparison between Christchurch City and the rest of Canterbury. For both working age populations, 60 per cent have a secondary school qualification, a Level 1-4 Certificate or a Level 5 or 6 Diploma as their highest education attainment. The distribution of the remaining 40 per cent is very different: Christchurch City has a much lower proportion with no formal qualification and a much higher proportion with a Level 7 qualification or higher.
Table 4.2 presents data on personal incomes for the year ending 31 March 2006 as reported in the 2006 census. Canterbury has a lower proportion than the national figures in the two highest income groups shown in the table ($40,001 or higher) and also has a lower proportion earning zero income or making a loss. Thus there is a greater concentration in the Canterbury population of people receiving income between $10,000 and $40,000.
A similar pattern can be seen in the comparison between Christchurch City and the rest of Canterbury. Christchurch City has a higher proportion with an annual personal income less than $10,000 or greater than $70,000, while the rest of Canterbury is more concentrated in the range $10,001 to $40,000.

24
Table 4.1 Highest Education Attainments of Working Age Population, 2006
Canterbury New Zealand
Number Per Cent Number Per Cent
No qualification 98,436 25.7 708,429 25.0
Qualification gained at secondary school 137,277 35.8 992,568 35.0
Level 1-4 Certificate gained post-school 54,555 14.2 415,221 14.7
Level 5-6 Diploma 38,058 9.9 268,365 9.5
Level 7 qualification and Bachelor degree 38,142 10.0 315,846 11.2
Postgraduate or research degree 16,746 4.4 131,934 4.7
Not elsewhere included 36,126 – 328,014 –
TOTAL 419,343 3,160,371
Christchurch City Rest of Canterbury
Number Per Cent Number Per Cent
No qualification 60,408 23.4 38,028 30.5
Qualification gained at secondary school 93,348 36.1 43,929 35.2
Level 1-4 Certificate gained post-school 35,490 13.7 19,065 15.3
Level 5-6 Diploma 25,836 10.0 12,222 9.8
Level 7 qualification and Bachelor degree 29,805 11.5 8,337 6.7
Postgraduate or research degree 13,476 5.2 3,270 2.6
Not elsewhere included 24,399 – 11,727 –
TOTAL 282,765 136,578
Source: Statistics New Zealand Census of Population and Dwellings data, 2001 and 2006, obtained from www.stats.govt.nz/.
Notes: Columns may not sum to totals due to rounding errors. Rest of Canterbury data are obtained as the difference between Statistics New Zealand data for Christchurch City and for the Canterbury Region. The ‘Not Elsewhere Included’ category includes highest qualification unidentifiable or not stated, and so has not been included in the calculation of percentages.

25
Table 4.2 Total Personal Incomes of Working Age Pop ulation, 2005/06
Canterbury New Zealand
Number Per Cent Number Per Cent
Zero or Loss 18,810 4.9 162,408 5.7
$1-$10,000 61,524 15.9 447,963 15.8
$10,001-$20,000 90,744 23.5 615,981 21.7
$20,001-$40,000 119,004 30.8 839,028 29.5
$40,001-$70,000 71,460 18.5 543,456 19.1
$70,001 or more 25,392 6.6 230,643 8.1
Not stated 32,412 – 320,889 –
TOTAL 419,343 3,160,371
Christchurch City Rest of Canterbury
Number Per Cent Number Per Cent
Zero or Loss 13,008 5.0 5,802 4.6
$1-$10,000 42,531 16.4 18,993 15.0
$10,001-$20,000 59,799 23.0 30,945 24.4
$20,001-$40,000 79,170 30.4 39,834 31.4
$40,001-$70,000 47,610 18.3 23,850 18.8
$70,001 or more 17,946 6.9 7,446 5.9
Not stated 22,695 – 9,717 –
TOTAL 282,762 136,581
Source: Statistics New Zealand Census of Population and Dwellings data, 2001 and 2006, obtained from www.stats.govt.nz/.
Notes: Columns may not sum to totals due to rounding errors. Rest of Canterbury data are obtained as the difference between Statistics New Zealand data for Christchurch City and for the Canterbury Region. The ‘Not Stated’ category has not been included in the calculation of percentages.

26
Table 4.3 Occupations of Employed People, 2006
Canterbury New Zealand
Number Per Cent Number Per Cent
Managers 43,611 17.1 340,530 18.2
Professionals 46,926 18.4 374,328 20.0
Technicians and trades workers 34,569 13.5 241,857 12.9
Community & personal service workers 23,088 9.0 156,471 8.4
Clerical and administrative workers 31,059 12.2 240,816 12.9
Sales workers 26,214 10.3 186,060 9.9
Machinery operators and drivers 17,169 6.7 114,324 6.1
Labourers 32,622 12.8 218,991 11.7
Christchurch City Rest of Canterbury
Number Per Cent Number Per Cent
Managers 25,185 14.9 18,426 21.2
Professionals 35,238 20.9 11,688 13.5
Technicians and trades workers 22,815 13.5 11,754 13.5
Community & personal service workers 16,026 9.5 7,062 8.1
Clerical and administrative workers 21,573 12.8 9,486 10.9
Sales workers 19,059 11.3 7,155 8.2
Machinery operators and drivers 10,992 6.5 6,177 7.1
Labourers 17,604 10.4 15,018 17.3
Source: Statistics New Zealand Census of Population and Dwellings data, 2001 and 2006, obtained from www.stats.govt.nz/.
Notes: Columns may not sum to totals due to rounding errors. Rest of Canterbury data are obtained as the difference between Statistics New Zealand data for Christchurch City and for the Canterbury Region. The table does not report the ‘Not Elsewhere Included’ category, which includes responses that were unidentifiable, outside scope or not stated.

27
Table 4.3 presents the distribution of occupations reported by residents in the 2006 census. Compared to the New Zealand distribution, there are smaller proportions of employed people in Canterbury working as managers or professionals, and a larger proportion working as labourers. Within the Canterbury economy, Christchurch City has considerably smaller proportions employed as managers and labourers compared to the rest of the region. The share of technicians and trades workers is 13.5 per cent in the city and in the rest of Canterbury, but Christchurch has a much larger proportion of people employed in professional occupations.

28

29
5. The Canterbury Economy
The Canterbury economy has undergone radical changes over the last forty years as successive governments adopted four different approaches to managing the national economy. The approaches are listed in Figure 5.1, which shows data on New Zealand’s real per capita gross domestic product (GDP) between 1969/70 and 2007/08. This statistic measures the market value of recorded production in New Zealand, excluding the impact of inflation on market values, divided by the number of people normally resident in the country. This figure is often used as an indicator of average economic well-being in the country, before taking into account factors such as income distribution or environmental degradation.
Figure 5.1 New Zealand Real Per Capita GDP, 1969/70 -2007/08
18,000
21,000
24,000
27,000
30,000
33,000
70 72 74 76 78 80 82 84 86 88 90 92 94 96 98 00 02 04 06 08
1999/2000 NZ$
Years Ending March
EconomicStagflation
EconomicReform
EconomicTransformation
EconomicTransition
Source: Statistics New Zealand National Accounts data, 1969/70-2007/08, obtained from www.stats.govt.nz/.
The graph divides New Zealand’s policy environment over the last 30 years into four periods. Following the first oil shock of 1973, New Zealand entered into a decade of rising unemployment and relatively high inflation, a phenomenon known as economic stagflation. Following the election of the fourth Labour government in July 1984, New Zealand embarked on a programme of extensive market-led economic reform. This proceeded in two waves; the first wave focused on macroeconomic stability and product market liberalisation, while the second wave (initiated by the National government elected in 1999) focused on welfare reform and labour market liberalisation.

30
The final policy change during the economic reforms was the passing of the Fiscal Responsibility Act in 1994. This was followed by a period of economic transition, as the reforms were bedded in but not extended. A change of government at the end of 1999 saw policymakers adopt a new term: ‘economic transformation’. This approach was reflected in the Growth and Innovation Framework, published by the government in 2002, and was given a further boost in two Cabinet papers outlining the government’s Economic Transformation Agenda in November 2006.
The transformation framework guided the central government’s economic development policies, and many initiatives at the regional level, in recent years. As recorded in Figure 5.1, it was a period of strong economic growth by New Zealand standards, with steady growth in real per capita gross domestic product since 1993, punctuated by the short recession associated with domestic drought and the South-East Asian currency crisis in 1998.
At the time of writing, New Zealand has again entered into a recession triggered by world events. In this case, a global financial crisis that started in the United States sub-prime mortgage market has severely constrained credit and consumer demand in all the major markets around the world. Although New Zealand’s own financial system has not been affected to the same extent as in other countries, the world-wide fall in equity prices and associated economic downturn also affects New Zealand consumers and producers. There is considerable uncertainty about the extent and likely length of the current recession.
Further, November 2008 saw a change of government in New Zealand, with the National Party entering into formal coalition with the Act Party, the Māori Party and the United Futures Party to obtain a strong majority in Parliament. This event has led to a review of economic strategy at the national level, as the new government implements its own policy framework for economic development. As in the past, the Canterbury regional economy will respond to national policy initiatives as well as to changes in the global marketplace.
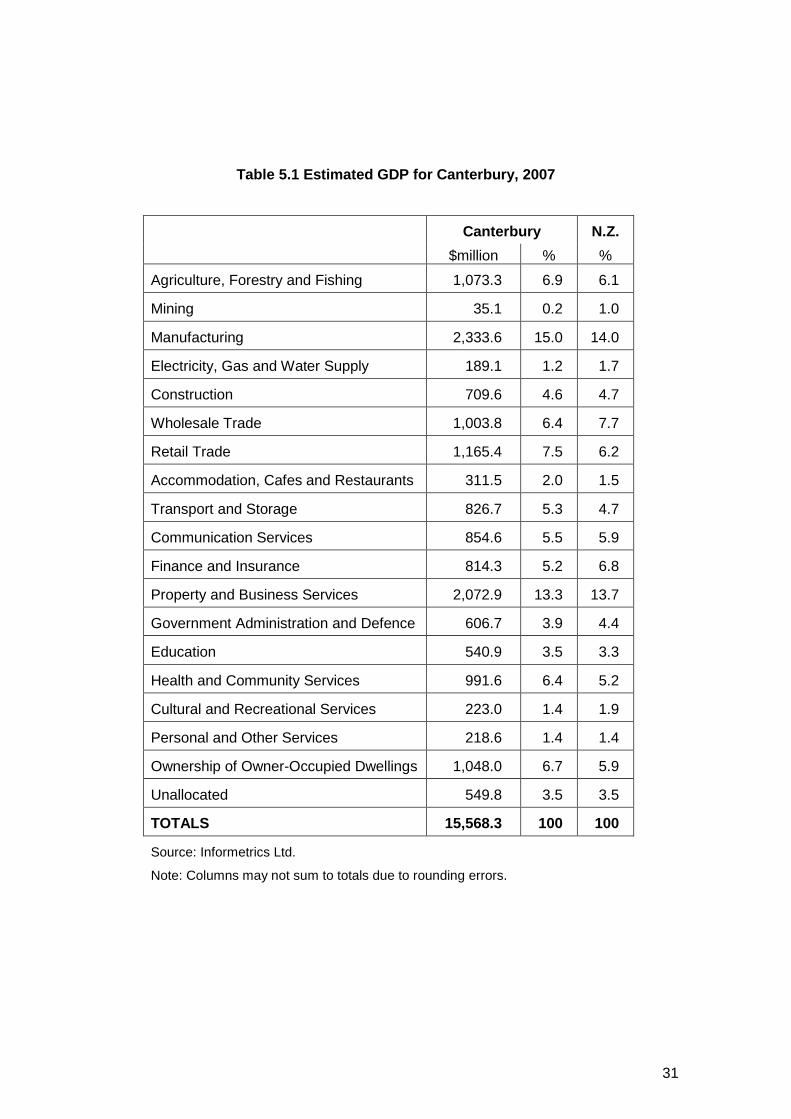
No official data exist for measuring regional gross domestic product, but a number of private institutions use advanced statistical techniques to provide reasonable estimates using standard classifications of industries. Table 5.1 presents data for the Canterbury region estimated by Infometrics Ltd for the 2007 calendar year, and compares the percentage share of each industry with the national percentage share (also estimated by Infometrics) in the same year.
31
Table 5.1 Estimated GDP for Canterbury, 2007
Canterbury N.Z.
$million % %
Agriculture, Forestry and Fishing 1,073.3 6.9 6.1
Mining 35.1 0.2 1.0
Manufacturing 2,333.6 15.0 14.0
Electricity, Gas and Water Supply 189.1 1.2 1.7
Construction 709.6 4.6 4.7
Wholesale Trade 1,003.8 6.4 7.7
Retail Trade 1,165.4 7.5 6.2
Accommodation, Cafes and Restaurants 311.5 2.0 1.5
Transport and Storage 826.7 5.3 4.7
Communication Services 854.6 5.5 5.9
Finance and Insurance 814.3 5.2 6.8
Property and Business Services 2,072.9 13.3 13.7
Government Administration and Defence 606.7 3.9 4.4
Education 540.9 3.5 3.3
Health and Community Services 991.6 6.4 5.2
Cultural and Recreational Services 223.0 1.4 1.9
Personal and Other Services 218.6 1.4 1.4
Ownership of Owner-Occupied Dwellings 1,048.0 6.7 5.9
Unallocated 549.8 3.5 3.5
TOTALS 15,568.3 100 100
Source: Informetrics Ltd.
Note: Columns may not sum to totals due to rounding errors.

32
Based on the data in Table 5.1, a feature of the Canterbury economy is its balanced industry structure, meaning that it is not too dissimilar from New Zealand’s national industry structure. The two largest sectors in Canterbury are manufacturing (15.0 per cent), and property and business services (13.3 per cent). These are followed by retail trade, agriculture, ownership of occupied dwellings and health and community services. This is similar to New Zealand national averages apart from being slightly higher by approximately one per cent in agriculture, manufacturing, retail, health and ownership of occupied dwellings and slightly lower in wholesale trade and finance and insurance.
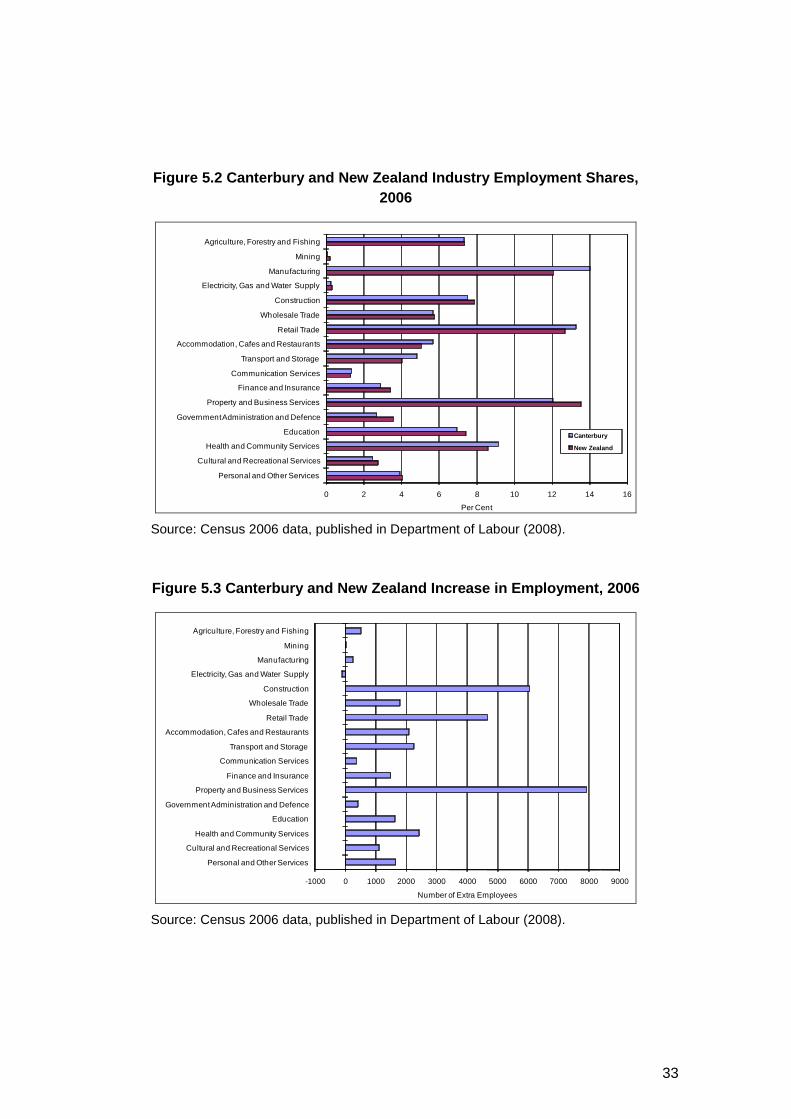
A commonly used source of official information to determine the importance of sectors in a regional economy is employment data, since these are readily obtained from the country’s five-yearly population census. Figure 5.2 shows census employment data for Canterbury, which reveal that the largest sector in the Canterbury region (measured by numbers in employment) is manufacturing, followed by retail trade, and then by property and business services. Between them, these three sectors account for nearly 40 per cent of the employment in Canterbury. The main difference between the Informetrics GDP data and these labour data is the relative ranking of the retail trade (reflecting relatively large employment per output in this sector).
The range of sectors and distribution of activity and employment in both the GDP data and the employment data suggest that the Canterbury economy is well diversified, and does not depend on a few sectors in the same way that the West Coast (for example) relies heavily on dairying, mining and tourism. This diversification means that the Canterbury economy is relatively resilient, since a downturn in one sector can be counter-balanced by ongoing strengths in other sectors.
Figure 5.3 uses the employment data to calculate the increase in number of people employed by sector between the 2001 census and the 2006 census. The largest increase by a considerable margin was in property and business services, followed by construction and then by retail trade. Thus, in terms of size and increased numbers of people in employment, the evidence is clear that the key sectors in Canterbury in recent years have been manufacturing, property and business services, retail trade, and construction.
33
Figure 5.2 Canterbury and New Zealand Industry Empl oyment Shares, 2006
0 2 4 6 8 10 12 14 16
Agriculture, Forestry and Fishing
Mining
Manufacturing
Electricity, Gas and Water Supply
Construction
Wholesale Trade
Retail Trade
Accommodation, Cafes and Restaurants
Transport and Storage
Communication Services
Finance and Insurance
Property and Business Services
Government Administration and Defence
Education
Health and Community Services
Cultural and Recreational Services
Personal and Other Services
Per Cent
Canterbury
New Zealand
Source: Census 2006 data, published in Department of Labour (2008).
Figure 5.3 Canterbury and New Zealand Increase in E mployment, 2006
-1000 0 1000 2000 3000 4000 5000 6000 7000 8000 9000
Agriculture, Forestry and Fishing
Mining
Manufacturing
Electricity, Gas and Water Supply
Construction
Wholesale Trade
Retail Trade
Accommodation, Cafes and Restaurants
Transport and Storage
Communication Services
Finance and Insurance
Property and Business Services
Government Administration and Defence
Education
Health and Community Services
Cultural and Recreational Services
Personal and Other Services
Number of Extra Employees Source: Census 2006 data, published in Department of Labour (2008).

34
Another tool often used by regional scientists to identify key sectors in a regional economy is shift-share analysis. This tool takes the increases in employment shown in Figure 5.3, and analyses how much of each sector’s increase can be explained by: (a) the national economy’s growth over the same period; (b) differences in the national growth rate of each sector; and (c) other regional factors that resulted in a different growth rate for the sector compared to the sector’s national average.
Table 5.2 presents a shift-share analysis of the Canterbury region’s employment increase between 2001 and 2006. The first column shows the total increase in employment in each sector (excluding the residual category of ‘not elsewhere included’ in the census data). This sums to 34,494 extra employees. The remaining three columns analyse how much of this increase can be explained by national trends (columns a and b) and other regional factors (column c, which is a residual calculation).
Between 2001 and 2006, census data recorded an increase of 15 per cent in the number of people employed nationally. Column (a) shows how much Canterbury employment in a sector would have grown by if the sector had increased its employment by this national average of 15 per cent. The sum of this column is 32,434, which is less than the actual figure of 34,494 actually achieved. This indicates that the Canterbury economy did better than the national average in creating employment over the five years.
At the national level, employment in some sectors grew by more than 15 per cent, and others by less than 15 per cent. The impact of this is presented in column (b), which shows how many extra people would have been employed in Canterbury if the sector in the region had grown at the national growth rate of the sector. A negative number means the sector grew by less than 15 per cent nationally. The sum of column (b) is -1,314. The minus sign indicates that Canterbury’s industry structure in 2001 was over-represented in sectors that grew relatively slowly at a national level between 2001 and 2006. Canterbury’s strong employment performance over this period was not due to a fortunate industry structure in 2001; rather the sectors did better on average in Canterbury than they did nationally.
This observation is confirmed in column (c), which is calculated by subtracting columns (a) and (b) from the figure in the first column. A positive value indicates that the sector did better in Canterbury than would be expected from the sector’s national performance, while a negative number indicates the local sector did not increase its employment by as great a percentage as nationally. The column (c) calculations are also presented in Figure 4.4.

35
Table 5.2 Shift-Share Analysis of Canterbury Employ ment, 2001-2006
Explained By:
Sector Total
Increase
(a) Total National Growth
(b) Sector National Growth
(c) Other Regional Factors
Agriculture, Forestry and Fishing
514 2,672 – 3,315 1,157
Mining 3 26 16 – 40
Manufacturing 251 5,212 – 4,854 – 107
Electricity, Gas and Water Supply
-108 109 – 94 – 123
Construction 6,053 1,935 3,652 466
Wholesale Trade 1,798 1,868 – 802 732
Retail Trade 4,661 4,291 – 73 442
Accomm., Cafes and Restaurants
2,089 1,820 395 – 125
Transport and Storage
2,254 1,470 – 136 920
Communication Services
364 445 – 289 208
Finance and Insurance
1,490 867 534 89
Property and Business Services
7,907 3,353 3,655 899
Government Admin. and Defence
409 945 – 133 – 403
Education 1,625 2,364 – 755 16
Health and Community Services
2,428 3,071 11 – 654
Cultural and Recreational Services
1,115 761 558 – 204
Personal and Other Services
1,641 1,224 316 101
TOTAL 34,494 32,434 – 1,314 3,374
Source: Census 2006 data, published in Department of Labour (2008).

36
Figure 5.4 Extra Employees Not Explained by Nationa l Trends, 2001-2006
-1000 -500 0 500 1000 1500
Agriculture, Forestry and Fishing
Mining
Manufacturing
Electricity, Gas and Water Supply
Construction
Wholesale Trade
Retail Trade
Accommodation, Cafes and Restaurants
Transport and Storage
Communication Services
Finance and Insurance
Property and Business Services
Government Administration and Defence
Education
Health and Community Services
Cultural and Recreational Services
Personal and Other Services
Number of Extra Employees Source: Column (c) of Table 4.2.
The stand-out sector in this shift-share analysis is agriculture, forestry and fishing. At the national level, employment in this sector fell by 3.5 per cent between 2001 and 2006. It increased by 2.8 per cent in Canterbury, resulting in 1,157 more people employed in agriculture, forestry and fishing than would have been expected from national trends.
Five other sectors contributed strongly to the region’s better than average performance: transport and storage; property and business services; wholesale trade; construction; and retail trade. Three of these have already been mentioned in previous paragraphs, but the relatively strong regional performance of the wholesale trade sector and of the transport and storage sector suggest that Canterbury may have increased in importance as a hub in business supply chains.

37
6. Key Sectors in Canterbury
From the analysis in Chapter 5, seven sectors might be considered key in Canterbury. Manufacturing is the largest sector in Canterbury, and has a greater share of total employment in Canterbury than is the case nationally. Property and Business Services had the largest increase in employment between 2001 and 2006, is the third largest employer in Canterbury, and grew much more strongly in Canterbury than would be expected from national trends. Retail Trade is the region’s third largest sector by GDP and second largest employer; it also grew more strongly than expected from national trends. Construction had the second largest increase in employment between 2001 and 2006, again above the national trend. Agriculture, Forestry and Fishing was the regional sector that provided the most extra jobs in Canterbury above the level that might be expected from national trends. Wholesale Trade, and also Transport and Storage, both performed better than national trends.
There are, however, weaknesses in this analysis. It does not distinguish exporting producers, and it relies on the standard industry classifications used by Statistics New Zealand. These categories are very broad (manufacturing, for example), and so further analysis is required to identify a region’s particular strengths in production. Further, a core export sector of economic activity might involve several industries in the standard classification. The most important example of this, which is recognised nationally and internationally, is the Tourism sector. Another example that is particular to Canterbury concerns the wide range of activities that take place in Christchurch because of the city’s long association with the exploration and scientific study of Antarctica (see, for example, the material at www.ccc.govt.nz/christchurch/antarcticconnections/).
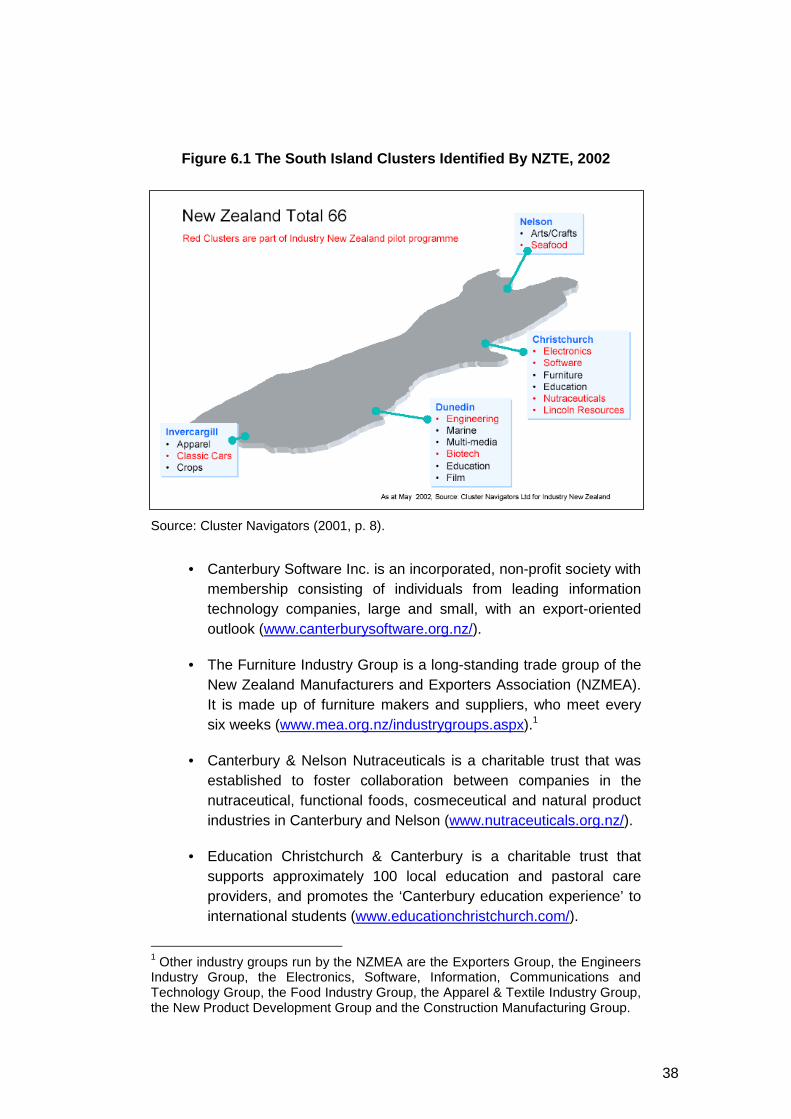
In July 2002, Industry New Zealand (now New Zealand Trade and Enterprise) published work by Ifor Ffowc-Williams and Guy Redding aimed at identifying industry clusters across New Zealand. Figure 6.1 shows the clusters identified for the South Island, six of which were in the Canterbury area: electronics, software, furniture, education, nutraceuticals and Lincoln resources. There have been a number of local and national policies aimed at strengthening these Canterbury clusters.
• Electronics South is an industry group representing approximately 200 electronics design, manufacturing and related companies. It is led by industry professionals and hosts the Connectivity event (see its website at www.electronicssouth.com/).
38
Figure 6.1 The South Island Clusters Identified By NZTE, 2002
Source: Cluster Navigators (2001, p. 8).
• Canterbury Software Inc. is an incorporated, non-profit society with membership consisting of individuals from leading information technology companies, large and small, with an export-oriented outlook (www.canterburysoftware.org.nz/).
• The Furniture Industry Group is a long-standing trade group of the New Zealand Manufacturers and Exporters Association (NZMEA). It is made up of furniture makers and suppliers, who meet every six weeks (www.mea.org.nz/industrygroups.aspx).1
• Canterbury & Nelson Nutraceuticals is a charitable trust that was established to foster collaboration between companies in the nutraceutical, functional foods, cosmeceutical and natural product industries in Canterbury and Nelson (www.nutraceuticals.org.nz/).
• Education Christchurch & Canterbury is a charitable trust that supports approximately 100 local education and pastoral care providers, and promotes the ‘Canterbury education experience’ to international students (www.educationchristchurch.com/).
1 Other industry groups run by the NZMEA are the Exporters Group, the Engineers Industry Group, the Electronics, Software, Information, Communications and Technology Group, the Food Industry Group, the Apparel & Textile Industry Group, the New Product Development Group and the Construction Manufacturing Group.

39
• The Lincoln Resource is a group of companies and organisations involved in land-based research and its application in business, located in and around the Lincoln township in the Selwyn District. It used to host a dedicated website for its profile, but no longer.
More recently, it has generally been recognised that the development of around 80 vineyards in Waipara has given rise to another significant cluster in the Canterbury region. Waipara Valley Winegrowers have created a website to promote the profile of this cluster (www.waiparawine.co.nz/). Its pages contain links to 24 wineries in the valley. The cluster is involved in a substantial research project led by Professor Steve Wratten to promote biodiversity and viticulture pest management through natural bio-control.
In the course of consultations for this report, a number of different sources suggested to the authors that there could be other (unidentified) clusters in Canterbury grouped loosely under the heading of ‘agricultural support industries’. The thought behind this suggestion is that Canterbury has more than 150 years experience exporting agricultural produce, and this has developed world-class expertise in support activities such as seed production, specialist engineering, irrigation systems and veterinary care. The suggestion is that the expertise and skills in these agricultural support industries might provide strong foundations for expansion into new areas of technology-based production.
Tourism is a special type of ‘cluster’ because it cuts across the standard industry classifications. This is recognised by Statistics New Zealand, which produces a Satellite Account to the National Accounts that provides data on tourism in New Zealand. These data are not available at the regional level, but Statistics New Zealand estimates that full-time equivalent employment (both direct and indirect) in New Zealand tourism increased nationally from 158,600 in 2001 to 178,700 in 2006 (Statistics New Zealand, 2008, Table 3, p. 8). This is an increase of 12.7 per cent, which is slightly less than the overall employment growth figure of 15 per cent used in Table 5.2 of the previous chapter.
The Canterbury region contains some of New Zealand’s international iconic tourist attractions. These include WhaleWatch Kaikoura, the Hanmer Springs Thermal Pools and Spa, the International Antarctic Centre in Christchurch, Akaroa Harbour, the Aoraki/Mount Cook National Park, the Mt Hutt Ski Area, and Lake Tekapo. This list illustrates the great diversity of visitor experiences available in Canterbury, from climbing the highest peak in Australasia to watching whales attracted by nutrients created by a 2km deep sea canyon just off the Kaikoura shore.
40
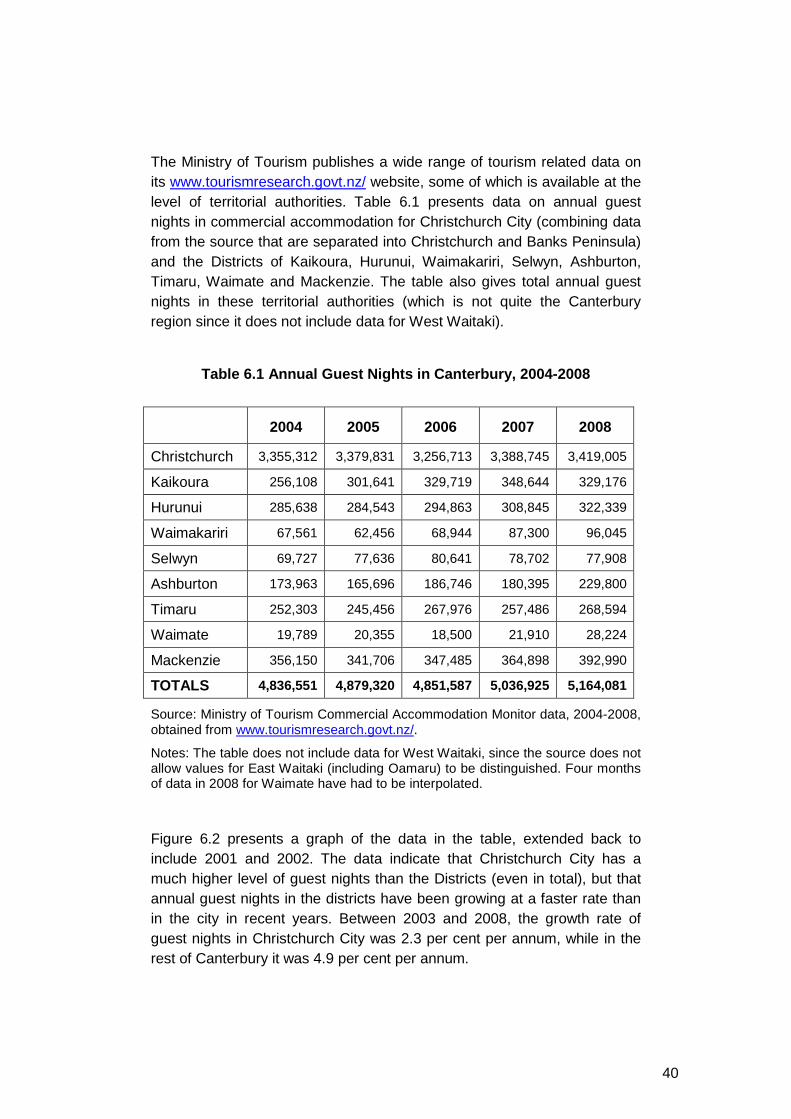
The Ministry of Tourism publishes a wide range of tourism related data on its www.tourismresearch.govt.nz/ website, some of which is available at the level of territorial authorities. Table 6.1 presents data on annual guest nights in commercial accommodation for Christchurch City (combining data from the source that are separated into Christchurch and Banks Peninsula) and the Districts of Kaikoura, Hurunui, Waimakariri, Selwyn, Ashburton, Timaru, Waimate and Mackenzie. The table also gives total annual guest nights in these territorial authorities (which is not quite the Canterbury region since it does not include data for West Waitaki).
Table 6.1 Annual Guest Nights in Canterbury, 2004-2 008
2004 2005 2006 2007 2008
Christchurch 3,355,312 3,379,831 3,256,713 3,388,745 3,419,005
Kaikoura 256,108 301,641 329,719 348,644 329,176
Hurunui 285,638 284,543 294,863 308,845 322,339
Waimakariri 67,561 62,456 68,944 87,300 96,045
Selwyn 69,727 77,636 80,641 78,702 77,908
Ashburton 173,963 165,696 186,746 180,395 229,800
Timaru 252,303 245,456 267,976 257,486 268,594
Waimate 19,789 20,355 18,500 21,910 28,224
Mackenzie 356,150 341,706 347,485 364,898 392,990
TOTALS 4,836,551 4,879,320 4,851,587 5,036,925 5,164,081
Source: Ministry of Tourism Commercial Accommodation Monitor data, 2004-2008, obtained from www.tourismresearch.govt.nz/.
Notes: The table does not include data for West Waitaki, since the source does not allow values for East Waitaki (including Oamaru) to be distinguished. Four months of data in 2008 for Waimate have had to be interpolated.
Figure 6.2 presents a graph of the data in the table, extended back to include 2001 and 2002. The data indicate that Christchurch City has a much higher level of guest nights than the Districts (even in total), but that annual guest nights in the districts have been growing at a faster rate than in the city in recent years. Between 2003 and 2008, the growth rate of guest nights in Christchurch City was 2.3 per cent per annum, while in the rest of Canterbury it was 4.9 per cent per annum.

41
Figure 6.2 Annual Guest Nights in Canterbury, 2001- 2008
0
1
2
3
4
5
6
2001 2002 2003 2004 2005 2006 2007 2008
Total Guest Nights (Millions)
Canterbury Total
Christchurch
Rest of Canterbury
Source: Ministry of Tourism Commercial Accommodation Monitor data, 2004-2008, obtained from www.tourismresearch.govt.nz/.
Notes: The table does not include data for West Waitaki, since the source does not allow values for East Waitaki (including Oamaru) to be distinguished. Four months of data in 2008 for Waimate have had to be interpolated.
The Ministry of Tourism manages two other major tourism surveys – the International Visitor Survey and the Domestic Travel Survey – which are used to provide forecasts on regional tourism. Figure 6.3 presents the latest forecasts at the time of writing (released November 2008) of total visits to Canterbury, defined to include the Chatham Islands but not including Western Waitaki.
The series in Figure 6.3 shows reasonable growth in total visits to the Canterbury region equal to 1.5 per cent per annum, although it should be noted that ‘the forecasts for 2010-14 are considered to be a fair representation of the long-term outlook for tourism in New Zealand, but based on the current economic environment it is likely that the 2008 and 2009 forecasts will overstate the actual level of tourism activity in New Zealand’ (Ministry of Tourism, 2008, p. 1). An important feature of the forecasts is that almost all of the growth is expected to come from inter-national visitors (growing at 3.3 per cent per annum) rather than from domestic visitors (0.8 per cent per annum).

42
Figure 6.3 Forecasts of Total Visits to Canterbury, 2008-2014
0
2
4
6
8
10
12
2008 2009 2010 2011 2012 2013 2014
Total Visits (Millions)
Total Visitors
Domestic
International
Source: Ministry of Tourism (2008, p. 3) Regional Tourism Forecasts data, 2008-2014, obtained from www.tourismresearch.govt.nz/.
Notes: This database defines the Canterbury RTO region as comprised of Ashburton, Chatham Islands, Christchurch City, Hurunui, Kaikoura, Mackenzie, Selwyn, Timaru and Waimate. It does not include any part of the Waitaki District.
Tourism is likely to remain very important in Canterbury, suggesting the need for a more strategic approach to tourism planning. In 2006, for example, the Christchurch City Council sponsored the development of the Christchurch Visitor Strategy 2007-2017, which noted that ‘tourism is now the largest export industry in Christchurch and Canterbury’ (CCC, 2007, p. 4). The strategy also recognised that ‘Christchurch cannot be viewed in isolation from other regional destinations such as Hanmer Springs and Aoraki/Mount Cook’ (idem, p. 15). In 2008, the Ashburton District Tourism Development Board released the draft Ashburton District Visitor Strategy 2009 – 2019, which was the first visitor strategy for the district. It too recognised the importance of connecting with other key Canterbury tourism markets such as Christchurch, Hanmer Springs and Akaroa.

43
7. Economic Infrastructure in Canterbury
This chapter considers Canterbury’s economic infrastructure under five headings: airports and seaports; land transport; telecommunications; water; and innovation systems.
Airports and Seaports
Christchurch International Airport is New Zealand’s second largest international airport (after Auckland). Timaru also has an airport serviced by the national airline network, and there are smaller aerodromes at Kaikoura, Hanmer Springs, Rangiora, West Melton, Ashburton, Mt Cook, Tekapo, Waimate and Omarama. There are two container seaports in the region: the Lyttelton Port of Christchurch; and PrimePort Timaru.
Figure 7.1 shows total passenger movements into and out of Christchurch International Airport over the last decade. Total passenger numbers increased by 59.2 per cent between 1999 and 2008 (June years) to reach 5.9 million at the end of the period.
Figure 7.1 Passenger Movements at Christchurch Inte rnational Airport, 1999-2008
0
1
2
3
4
5
6
7
1999 2000 2001 2002 2003 2004 2005 2006 2007 2008
Millions
Year Ending 30 June
Total PassengersDomesticInternational
Source: Christchurch International Airport Ltd Annual Reports, available from www.christchurchairport.co.nz/corporateandcommunity/aboutus/financialreporting/.

44
Christchurch International Airport and the region’s two container seaports are important for Canterbury’s export trade. In the year ending 30 June 2008, the airport loaded 17,022 tonnes of cargo destined for overseas, valued at $1,034 million. In the same twelve months, Lyttelton loaded 3,422,638 tonnes of cargo destined for overseas, valued at $2,983 million, while Timaru loaded 404,300 tonnes valued at $1,053,497 million.
Figures 7.2, 7.3 and 7.4 show the value of cargo movements over the last ten years at Christchurch International Airport, and at the seaports of Lyttelton and Timaru. The export values are reported ‘Free On Board’ (FOB) and the import values are reported including ‘Cost, Insurance and Freight’ (CIF).
After peaking in 2001, the value of goods exported by air through the airport has declined steadily until the increase in 2008. In 1999, the volume of exports by weight through Christchurch International Airport was 18,197 tonnes. This peaked at 20,448 tonnes in 2001, and was only 17,022 tonnes in 2008.
Figure 7.2 Cargo Movements at Christchurch Internat ional Airport, 1999-2008
0
200
400
600
800
1000
1200
1400
1999 2000 2001 2002 2003 2004 2005 2006 2007 2008
Millions of Dollars
Year Ending 30 June
Exports (FOB)
Imports (CIF)
Source: Statistics New Zealand Overseas Cargo Statistics data, 1997/98-2007/08, obtained from www.stats.govt.nz/.

45
Figure 7.3 Cargo Movements at Port of Lyttelton, 19 99-2008
0
500
1000
1500
2000
2500
3000
3500
1999 2000 2001 2002 2003 2004 2005 2006 2007 2008
Millions of Dollars
Year Ending 30 June
Exports (FOB)
Imports (CIF)
Source: Statistics New Zealand Overseas Cargo Statistics data, 1997/98-2007/08, obtained from www.stats.govt.nz/.
Figure 7.4 Cargo Movements at PrimePort Timaru, 199 9-2008
0
200
400
600
800
1000
1200
1400
1999 2000 2001 2002 2003 2004 2005 2006 2007 2008
Millions of Dollars
Year Ending 30 June
Exports (FOB)
Imports (CIF)
Source: Statistics New Zealand Overseas Cargo Statistics data, 1997/98-2007/08, obtained from www.stats.govt.nz/.

46
The most striking feature of the seaport data is the very high growth in exports through PrimePort Timaru. In the year ending June 1999, the value of exports through Timaru was $163 million; in the 2008 June year, this figure had increased 6.5 times that value, to reach $1,053 million. In contrast, the value of exports passing through the Port of Lyttelton had increased by only 45.1 per cent, from $2,591 million to $2,983 million.
Land Transport
The National Land Transport Programme provides an overview of key indicators for regional transport infrastructure in New Zealand. Table 7.1 presents data for the Canterbury region, and for the country as a whole.
Table 7.1 Overview of Canterbury Transport Infrastr ucture, 2006/07
Canterbury
New Zealand
% of NZ
State Highway - Motorway (Kilometres) 19 172 11.0%
State Highway (Kilometres) 1,327 10,893 12.2%
Local Roads - Rural (Sealed) (Kilometres) 5,671 33,432 17.0%
Local Roads - Rural (Unsealed) (Kilometres) 6,154 32,000 19.2%
Local Roads - Urban (Sealed) (Kilometres) 2,365 16,869 14.0%
Local Roads - Urban (Unsealed) (Kilometres) 58 382 15.2%
Vehicle Kilometres Travelled (Millions of Kilometres) 5,098 39,846 12.8%
Passenger Transport - Ferry (Boardings) 112,399 4,224,398 2.7%
Passenger Transport - Rail (Boardings) - 16,913,205 -
Passenger Transport - Bus (Boardings) 15,785,907 89,683,159 17.6%
Source: Land Transport New Zealand National Land Transport Programme data, 6/07, obtained from www.landtransport.govt.nz/funding/nltp/2008/canterbury.html.

47
In 2002, Environment Canterbury prepared the first Canterbury Regional Land Transport Strategy, which was updated in 2005 and again in 2008. The latest strategy records that over the previous ten years, traffic volumes increased by approximately sixty percent on the region’s state highways and by 2.0-2.5 per cent per annum within Christchurch City (Environment Canterbury, 2008, p. 11). It goes on to comment (idem, p. 18):
Predictions, based on economic and demographic forecasts, anticipate
continuing traffic growth in most parts of the region in the future. Without
major changes to the way transport and land use are managed, increasing
traffic congestion and the associated effects will erode the quality of life for
future generations. More immediately, there are issues that need addressing
such as the high costs resulting from road crash trauma.
Table 7.2 Canterbury Regional Land Transport Strate gy Targets
Region-Wide Targets for 2011
No traffic congestion outside Greater Christchurch (UDS area).
Contain carbon dioxide emissions to no more than ten percent above 2001 levels.
Reduce deaths from road crashes to six or less per 100,000 of population.
Reduce deaths plus total hospitalisations to less than 560 per year.
Increase satisfaction amongst Canterbury’s residents about their footpaths, pedestrian areas and over-all walking environment.
Targets for Greater Christchurch (UDS Area) for 201 1
Reduce the proportion of single occupant motor vehicles in peak periods.
No traffic congestion within Greater Christchurch outside peak periods.
Contain the amount of congested road within Greater Christchurch during peak periods to 40 lane kilometres or less.
Increase proportion of all trips (excluding walking trips) made by cycle to twelve percent. (In 1996, six percent of total trips by car, cycle and public passenger transport were made by cycle).
Increase proportion of all trips (excluding walking trips) made by public passenger transport to six percent. (In 1996, three percent of total trips by car, cycle and public passenger transport were made by public passenger transport.)
Source: Environment Canterbury (2008, p. 5),

48
The strategy set five region-wide targets and five targets for the Greater Christchurch area that are aimed to be achieved by 2011. These targets are presented in Table 7.2. To move towards these targets, a Canterbury Transport Regional Implementation Plan 2008-2038 (TRIP) was designed, comprised of 15 packages of activities throughout the Canterbury region. The cost of implementing these packages was estimated to be $1,190m (2007 dollars) over ten years, although only $780 million of funding sources had been identified (Environment Canterbury, 2008, p. 69). The executive summary warns that ‘without more spending in implementing the strategy, there will be large increases in the costs of travel, including financial, social and environmental costs associated with increasing traffic and congestion’ (idem, p. 4).
The Canterbury Regional Land Transport Strategy recognises the important contribution that a flexible, safe, effective and efficient land transport system makes to supporting economic development. It adopts a policy to ensure a high level of accessibility to key business destinations, including seaports and airports (strategic infrastructure), city and town centres, agricultural, tourist and industrial areas. The strategy also devotes a section to freight, building on the 2005 Canterbury Regional Land Transport Freight Action Plan. An overview of the region’s strategic land transport network was presented earlier in this report in Figure 1.1 on page 3.
Telecommunications
Table 7.3 presents data from the 2001 census and the 2006 census on access to telecommunications by Canterbury households. The percentage of households with no access declined, so that both in Christchurch City and the rest of Canterbury the percentage in 2006 was below 1.5 per cent. The other big change over the five years was the percentage with access to the internet. For Canterbury as a whole, this increased from 36.2 per cent in 2001 to 61.3 per cent in 2006.
There are some differences in the Christchurch City data compared to the rest of Canterbury, but the differences are generally small. The main exception is that households outside the city are much more likely to have a fax in their home. In 2006, they were also less likely to have access to the internet, slightly more likely to have a cellphone or mobile phone, and slightly less likely to have a telephone. The Canterbury data for 2006 are within one percentage point of the equivalent national data for New Zealand, except that the percentage of Canterbury households with access to a telephone was higher than nationally (91.6 per cent).

49
Table 7.3 Household Access to Telecommunications, 2 001 and 2006
2001 2006
Number Per Cent Number Per Cent
Christchurch City
No access 3,036 2.5% 1,833 1.4%
Cellphone/mobile phone … … 94,743 72.9%
Telephone 118,476 97.4% 122,721 94.5%
Fax machine 27,048 22.2% 28,458 21.9%
Internet 46,392 38.1% 80,841 62.2%
Total households 121,662 129,915
Rest of Canterbury
No access 1,290 2.2% 831 1.3%
Cellphone/mobile phone … … 48,204 74.4%
Telephone 57,021 97.7% 60,786 93.8%
Fax machine 16,632 28.5% 20,505 31.6%
Internet 18,759 32.1% 38,514 59.4%
Total households 58,362 64,797
Canterbury
No access 4,326 2.4% 2,664 1.4%
Cellphone/mobile phone … … 142,947 73.4%
Telephone 175,497 97.5% 183,507 94.2%
Fax machine 43,680 24.3% 48,963 25.1%
Internet 65,151 36.2% 119,355 61.3%
Total households 180,024 194,712
Source: Statistics New Zealand Census of Population and Dwellings data, 2001 and 2006, obtained from www.stats.govt.nz/.
Notes: All figures are for households in private occupied dwellings. Households reporting more than one means of access to telecommunication devices have been counted in each stated category. Therefore, the total number of responses in the table will be greater than the total number of households.

50

51
There is, however, often considerable disparity in the quality of access to the internet between the households in Christchurch and households in rural areas of Canterbury. This is due primarily to differences in access to broadband (other than via satellite) outside the main urban settings. In December 2006, for example, Statistics New Zealand undertook New Zealand’s first Household Use of Information and Communication Technology survey. The survey reported important differences in use of broadband between households in the main urban centres and in rural areas, as shown in Figure 7.5.
In the main urban areas, more households were using broadband than dial-up, but in rural areas nearly twice as many households were using dial-up as were using broadband. The gap between use of broadband in the main urban areas and in other areas lay between 13 and 15 percentage points.
Figure 7.5 Urban/Rural Use of Dial-Up and Broadband Technologies, 2006
29.3
32.3
25.9
41.3
37.0
23.922.2 22.2
0
10
20
30
40
50
Main Urban Secondary Urban Minor Urban Rural Areas
Dial-Up
Broadband
Source: Statistics New Zealand Household Use of Information and Communication Technology Survey data, 2006, obtained from www.stats.govt.nz/.
Notes: Households may have both broadband and dial-up access. Broadband includes DSL, cable, wireless and other broadband connection types. Main urban areas have a minimum population of 30,000 and include: Whangarei, Auckland, Hamilton, Tauranga, Rotorua, Gisborne, Napier-Hastings, New Plymouth, Wanganui, Palmerston North, Kapiti, Wellington, Nelson, Christchurch, Dunedin and Invercargill.

52
There are plans to improve this situation. Chorus (a Telecom New Zealand business; see www.chorus.co.nz/), has announced intentions to enhance local broadband networks to enable delivery of broadband connections between 10Mbps and 20Mbps by the end of 2011 to all towns with 500 or more phone lines. In Canterbury this includes Akaroa, Amberley, Ashburton, Christchurch, Darfield, Diamond Harbour, Fairlie, Geraldine, Governors Bay, Hanmer Springs, Kaiapoi, Kaikoura, Leeston, Lincoln, Lyttelton, Methven, Oxford, Pleasant Point, Prebbleton, Rangiora, Rolleston, Spencerville, Templeton, Temuka, Timaru, Twizel, Waimate and Woodend.
At the end of March 2009, the government announced that it plans to invest up to $1.5 billion alongside additional private sector investment to accelerate the roll-out of ultra-fast broadband to 75% of New Zealanders, concentrating in the first six years on priority broadband users such as businesses, schools and health services, plus green field developments and certain tranches of residential areas (Joyce, 2009). The plans are targeted, at least initially, to the largest 25 cities and towns in New Zealand. In Canterbury, this will include Christchurch, Timaru and Ashburton.
In announcing this initiative, the government reconfirmed its commitment to improving the state of New Zealand’s telecommunications infrastructure in rural areas, including its pre-election commitment to provide $48 million to improve rural broadband. The Minister advised that the government was currently developing options around that commitment and expected to make announcements regarding the direction of the government’s rural telecommunications policy in the near future.
Water
There is a startling paradox in the Canterbury rural and urban economies. As noted earlier in this report, the province has eighteen major rivers flowing from the Southern Alps or their foothills to the sea, and there are sizable water aquifers beneath the Canterbury Plains. Nevertheless, the region is prone to drought, and advertising campaigns in Christchurch City warn residents about the need to minimise wasteful water consumption.
In 1998, Canterbury suffered a severe and prolonged drought that had a measurable impact on national gross domestic product that year. As a consequence, the Ministry of Agriculture and Forestry, Environment Canterbury and Ministry for the Environment commissioned Lincoln Environmental to prepare the Canterbury Strategic Water Study (CSWS), subsequently published as Morgan et al. (2002). The study identified fourteen water resource zones based on areas that share similar

53
hydrological and hydrogeological characteristics. The zones are shown in Figure 7.6, reproduced from the study’s report.
Figure 7.6 Canterbury Water Resource Zones
Source: Morgan et al. (2002, p. 12).
The study made three major findings on the region’s ability to meet future demand for water (Morgan et al, 2002, p. 5):
• Canterbury is clearly a water-short region, when comparing water demand
with availability on a daily or weekly basis. Under typical low flow
conditions, the flow allocable for abstraction under the current allocation
regimes cannot meet the current peak water demand. With increasing
pressure on Environment Canterbury from some sectors to raise the
minimum flows on several rivers, and the need to establish abstraction
limits and/or flow sharing rules, it is expected that this shortfall situation will
become even more pronounced. The peak water demand for the future
scenario exceeds the total mean annual low flow of the water resource.

54
• However, when comparing the water demand with the water availability on
an annual basis, the region has enough water to meet its foreseeable
abstractive needs and provide for in-stream flow requirements. This implies
that significant water storage will be required to meet this future water
demand.
• From a net water use perspective, the overall impact of the future water
demand scenario on the long-term regional water balance is relatively
small. However, local scale impacts on the quantity and quality of the water
resource obviously still need careful consideration when assessing the
effects of water abstraction.
Figure 7.7 Average Seasonal Variation of Future Wat er Demand Scenario
Source: Morgan et al. (2002, p. 35).
The parameters for the water problem in Canterbury are perhaps best explained using Figure 7.7, which presents the CSWS model of a plausible scenario for future water demand over an average year. The model identifies five sources of water demand: (1) an almost negligible demand from forestry; (2) a reasonably constant demand industry; (3) a larger

55
demand from stock farmers; (4) a demand from municipal authorities for domestic consumers, which rises during the summer season; and (5) the demand for irrigation, which begins to rise dramatically in September each year, peaks in January the following year, and then falls away in April. At its peak, the demand for irrigation water might be nine times the total demand for all other purposes.
The Agricultural Production Census 2007 of Statistics New Zealand records that the total area in Canterbury equipped for irrigation amounts to 385,271 hectares, which is 62.2 per cent of the total area in New Zealand equipped for irrigation (619,293 hectares). The CSWS modelling work calculated that the potential net area for irrigation in Canterbury is 1,002,420 hectares (Morgan et al, 2002, p. 20). Given the large amount of potentially irrigable land in Canterbury indicated by these figures, it is all the more remarkable that the water resources of the province are sufficient to meet this potential demand in the aggregate, if suitable storage solutions could be found to meet the seasonality issue depicted in Figure 7.7.
The original CSWS report has led to further work to explore the feasibility of different water storage options in different parts of Canterbury (see www.ecan.govt.nz/Our+Environment/Water/PlansandReports/StrategicWaterStudy.htm). In 2004, the Canterbury Mayoral Forum (which is comprised of the mayors and chief executives of the regional, city and district councils in Canterbury) commissioned CSWS Stage 2 to identify potential water storage sites. In 2006, the Mayoral Forum commissioned further work to begin evaluating the environmental, social, cultural and economic impacts of the different water storage options. This evaluation was carried out by a reference group of people from across Canterbury with a wide range of interests, including Ngāi Tahu, farmers, irrigators, anglers, recreationists and environmentalists. The final report from this exercise (Whitehouse, Pearce and McFadden, 2008) is available at the above website.
Innovation Systems
Recent theories of regional economic development have emphasised the importance of creating effective innovation systems to support areas of regional strength. An innovation system is comprised of four elements shown in Figure 7.8. At its centre are the sector’s entrepreneurs, the people who can imagine new commercial possibilities and make things happen. The new possibilities are created by innovators who work to discover new knowledge with potential commercial value. To realise that potential value, the entrepreneur draws on specialist expertise in areas such as access to finance and international marketing. These activities are all underpinned by

56
the system’s policy framework that includes intellectual property laws, market regulation and the country’s openness to international trade.
Figure 7.8 Stylised Regional Innovation System
Canterbury has the potential to create very strong regional innovation systems in some of the key sectors described in Chapter 6 of this report as a result of recent initiatives to encourage greater connections between business and the region’s tertiary education institutions. The region has two universities and two polytechnics domiciled within its boundaries.1
The University of Canterbury has an enrolment headcount of about 23,000 students. It has five major colleges (Arts, Business and Economics, Education, Engineering and Science) and the School of Law. A recent example of its engagement with Canterbury’s regional innovation system was the creation of what is now called NZi3, the national ICT Innovation Institute. NZi3 sprang from a Government pledge of $9.7m through its Partnerships for Excellence scheme, matched by NZi3’s founding partners
1 Other universities, wānanga and institutes of technology have also been present in Canterbury, primarily offering education services only.
Entrepreneurs
Policy Framework
Innovators Specialist Expertise

57
HP, IBM, Tait Electronics and Jade Software Corporation. It resides in a purpose-built facility on the campus of the University of Canterbury, and aims to provide a unique fusion of the best of New Zealand’s academic expertise with industry-driven research.
Lincoln University has an enrolment headcount of about 3,500 students. Its research and teaching are focused on agriculture, the physical and biological sciences, commerce, the environment and their social dimensions. It has a number of facilities dedicated to strengthening connections with industry partners, including the Bio-Protection Research Centre. The Bio-Protection Research Centre was established in 2003 as a national Centre of Research Excellence. Based at Lincoln University, it involves four founding partners (Lincoln University, AgResearch, Plant & Food Research and Massey University) as well as eleven other collaborators. The Centre operates the purpose-built New Zealand Biotron facility for biocontrol, biosecurity and biotechnology research involving microbes and plants.
The Christchurch Polytechnic and Institute of Technology (CPIT) educates about 30,000 students each year. Its schools are grouped into five groups – the Faculty of Commerce, the Faculty of Design and Engineering, the Faculty of Health, Humanities and Science, Te Puna Wānaka, and the Trades Innovation Institute. Aoraki Polytechnic educates about 2,500 students each year on campuses in Timaru, Ashburton, Christchurch, Oamaru and Dunedin. It offers a range of 34 certificates, 12 national certificates and 22 diplomas, from advertising design to woodturning.
Both CPIT and Aoraki Polytechnic have been involved in leading regional facilitation programmes in their respective areas, overseen by the Tertiary Education Commission. These programmes have four objectives: (1) to build a shared understanding of regional tertiary education needs, gaps and priorities; (2) to develop system capability at a regional level through collaborative relationships; (3) to produce better outcomes for students and other stakeholders; and (4) to gain efficiency benefits and capability development for tertiary education organisations and stakeholders.
Chapter 5 presented employment data from the 2001 census and the 2006 census to show that the largest increase in Canterbury by a considerable margin was in property and business services, and that this increase was more than could be explained by national trends. It is not possible to judge from the aggregate data, but this may indicate an increase in the depth of specialist expertise available to Canterbury exporters, in line with the regional innovation system diagram in Figure 7.8.

58
8. Economic Outlook
The immediate outlook for the Canterbury economy is strongly influenced by the global recession triggered by the international financial crunch resulting from the collapse of values in the US sub-prime mortgage market. In its Monetary Policy Statement of March 2009, the Reserve Bank of New Zealand projected that the New Zealand economy would experience negative growth throughout 2009 before recovering in 2010 (see Figure 8.1 below). Canterbury industries that produce for the domestic market are likely to experience similar trends.
Figure 8.1 Actual and Projected Economic Growth, Ne w Zealand, 2006-2012
-3
-2
-1
0
1
2
3
4
5
6
2006 2007 2008 2009 2010 2011 2012
Per Cent
Source: Reserve Bank of New Zealand (2009, Figure 2.1 p. 4).
Notes: Data measure the percentage change, year on year, in the value of New Zealand’s gross domestic product (GDP) after removing the impact of inflation on market prices.
The Reserve Bank also reported forecast growth for New Zealand’s major trading partners. These forecasts are reproduced in Table 8.1. They suggest that Canterbury’s export industries are likely to experience significantly more difficult trading conditions in the near future.

59
Table 8.1 Forecasts of Trading Partners’ Economic G rowth
2004 2005 2006 2007 2008f 2009f 2010f
Australia 3.8 2.8 2.9 4.0 2.3 0.4 1.4
Asia ex-Japan 7.6 6.8 7.4 7.7 4.5 - 2.2 4.1
United States 3.6 2.9 2.8 2.0 1.1 - 2.5 1.0
Japan 2.7 1.9 2.0 2.4 - 0.6 - 4.4 - 0.1
Euro Area 1.9 1.8 3.0 3.0 1.0 - 2.3 0.4
United Kingdom 2.8 2.1 2.8 3.0 0.7 - 3.3 0.4
Total 4.1 3.3 3.7 4.0 1.9 - 1.8 1.6
Source: Reserve Bank of New Zealand (2009, Table 3.1 p. 14).
Notes: Data measure the percentage change, calendar year on calendar year, in the value of (GDP) after removing the impact of inflation on market prices. The ‘Total’ data are a trade weighted aggregate of New Zealand’s main trading partners.
In particular, the data in Table 8.1 report that the average real growth rate of New Zealand’s major trading partners from 2004 to 2007 was slightly below 3.8 per cent. In contrast, the forecast growth rate for 2008 was 1.9 per cent. It is expected to be strongly negative (-1.8 per cent) in 2009, with Australia being the only partner maintaining positive growth. The recovery in 2010 is forecast to be weak at only 1.6 per cent.
The slowdown in economic activity will have an impact on unemployment in New Zealand. Figure 8.2 reports data from the Reserve Bank, which projects the official unemployment rate (seasonally adjusted) to peak at 6.8 per cent in the March quarter of 2010. To put this figure into perspective, unemployment was at 7.0 per cent or higher for all of 1998 and the first half of 1999 in New Zealand’s last recession. In the recession of the early 1990s, the official unemployment rate peaked at 10.9 per cent in the September 1991 quarter.
Thus current projections are for a period of rising unemployment, but to no higher than the levels experienced in 1998 and not anywhere near the very high levels in 1991. There is, however, a great deal of uncertainty about current projections; in particular, it is very difficult to judge how long the recession will last internationally. Countries are taking coordinated actions to stimulate their economies, but the scale of the financial market problems makes it difficult to know how quickly these measures will take affect.

60
Figure 8.2 Actual and Projected Unemployment, New Z ealand, 2006-2012
0
1
2
3
4
5
6
7
8
2006 2007 2008 2009 2010 2011 2012
Per Cent
Source: Reserve Bank of New Zealand (2009, Figure 5.9, p. 28).
Notes: Data measure the number of unemployed as a percentage of New Zealand’s labour force, seasonally adjusted.
Recall that Chapter 5 identified seven broad sectors that are key in the Canterbury economy. Of these, four are mainly affected by national trends and policies (construction, retail trade, wholesale trade, and transport and storage). The remainder of this section therefore examines the current outlook of the manufacturing sector, the property and business services sector, and the agriculture forestry and fishing sector.
The Manufacturing Sector
It is universally recognised that manufacturing in New Zealand faces a particular difficulty because of the small size of the New Zealand domestic market. Manufacturers in Asia, Australia, Europe and North America are able to access large populations within a relatively short distance of their plant that allows them to capture economies of scale through mass production without having to engage in exporting to unfamiliar markets or creating an international supply chain. New Zealand manufacturers must export at a much earlier stage in their product development if they are to gain similar economies of scale.

61
Consequently, manufacturers in New Zealand tend to be more sensitive to international trends than can be the case for their overseas counterparts. Figure 8.3 depicts the value of the New Zealand dollar against the United States dollar over the period January 1999 to mid-November 2008. Between 2001 and 2007, there was a steady and significant appreciation of the New Zealand dollar, meaning that New Zealand manufacturers received fewer New Zealand dollars for every US dollar earned from exports. Under these circumstances, it is perhaps not surprising that employment in manufacturing between 2001 and 2006 grew by only 1.0 per cent nationally, and by only 0.7 per cent in Canterbury.
Figure 8.3 New Zealand United States Exchange Rate, 1999-2008
0.3
0.4
0.5
0.6
0.7
0.8
0.9
1999 2000 2001 2002 2003 2004 2005 2006 2007 2008
US$ per NZ$1
Source: Reserve Bank of New Zealand (2009, Figure 5.9, p. 28).
In recent months, there has been a sharp reversal in the exchange rate, which fell from US$0.79 at the end of March 2008 to US$0.56 by the end of 2008, which was a depreciation of 30.6 per cent in eight months. Thus Canterbury exporters who are able to maintain sales will increase their profits at the lower exchange rate, but as discussed earlier in this section, many New Zealand producers are likely to experience reduced orders until the world economy recovers.

62
The Property and Business Services Sector
The identification of property and business services as a key sector in Canterbury may be surprising; it is not a sector that is often mentioned in policy advice about regional economic development. Yet the evidence seems clear; this sector had the largest increase in employment between 2001 and 2006, is the third largest employer in Canterbury, and grew much more strongly in Canterbury than would be expected from national trends. If the Canterbury region is to prosper economically, then it is important that this sector develops in a way that enhances its own productivity growth and the productivity of the businesses it serves.
Table 8.2 presents the composition of the property and business services sector. Some of the increase in employment in property services will have been fuelled by the boom in property prices between 2003 and 2007. The increase in employment in business services, however, is consistent with a global trend that is often referred to as ‘the knowledge economy’.
Table 8.2 Composition of the Property and Business Services Sector
Property Operators and Developers
Real Estate Agents
Non-Financial Asset Investors Property Services
Machinery and Equipment Hiring and Leasing
Scientific Research
Technical Services
Computer Services
Legal and Accounting Services
Marketing and Business Management Services
Business Services
Other Business Services
Source: ANZSIC 1996 categories.
In New Zealand, a key event in the adoption of policies based on ‘the knowledge economy’ trend was the Science and Innovation Advisory Council’s 2002 report, An Innovation Framework for New Zealand. That report gave an overview of the core change being sought under the heading of economic transformation (p. 19):

63
Hitherto New Zealand companies have created advantage by competing
largely on the basis of high quality and low cost, especially in the primary
sector. Economic transformation requires that New Zealand’s future global
companies, regardless of sector, be based around exploiting ideas and
knowledge, and obtaining fullest value from them.
Entrepreneurial ventures are different from other businesses. They are
characterised by high growth and a focus on innovation, and they have a
disproportionately positive effect on job creation, productivity and economic
growth. Some commentators describe such high-value, high growth ventures
as the power-house of economic growth. New Zealand does not have many
such ventures, in spite of having a large number of self-described
entrepreneurs. We urgently need to grow more.
The report’s emphasis on the innovation system came from its observation that the critical factor for success is incorporating ‘links between the ideas and knowledge creators (the ‘innovators’), the firms and people who can turn those ideas into products, businesses, jobs and wealth (the ‘entrepreneurs’), and the sources of specialist expertise and finance essential for commercialising innovation for fullest value [(the ‘partners’)]’ (p. 17). This became a core idea in the government’s Economic Transformation Agenda – that there needs to be stronger connections between innovators, entrepreneurs and partners if New Zealand is to create more wealth from innovative ideas (as discussed in Chapter 7 of this report; see especially Figure 7.8).
This emphasis has been supported by work completed by the AERU research unit on the high tech sector in Canterbury (Saunders and Dalziel, 2003; Dalziel et al, 2005, 2006) and in New Zealand (Saunders and Dalziel, 2006). Interviewees in these projects (senior managers in the electronics or software industries) consistently advised that New Zealand has a strong competitive advantage in performing research and development. Interviewees reported that the relative cost of research and development was around 75 per cent of that in other developed countries. It was also stated that there was no shortage of ideas and potential products in the region, but it can be more challenging to develop and market new ideas.
Consequently, people with specialist skills in international marketing and product management are very highly valued in the industry, especially since New Zealand producers in global markets tend to supply niche products that require focused research and marketing efforts from professional people able to turn their hand to a wide range of practical applications.

64
These trends are likely to continue especially as Canterbury exports target niche markets that are more likely to continue to exist even in a downturn in the economy. The University of Canterbury has an international reputation for the quality of its engineering graduates, and the region has three tertiary institutions offering degree qualifications in software technologies and commerce. In recent years, the Tertiary Education Commission has been active in encouraging greater collaboration between these institutions and the business sector in Canterbury, strengthening the region’s innovation system.
The Agriculture, Forestry and Fishing Sector
In October 2003, the Growth and Innovation Advisory Board published a report it had commissioned from the Ministry of Agriculture and Forestry, Contribution of the Land-Based Industries to New Zealand’s Economic Growth. That report expressed a concern that the agribusiness sector had come to be perceived as a declining ‘old economy’ sector, in contrast to more ‘glamorous’ sectors such as tourism, film making, information technology (IT) and yacht racing. The report argued that this perception is misplaced (MAF, 2003, p. 5).
In fact, since 1986/87 (after fiscal support for agriculture had been removed)
the contribution of agribusiness (including components of transport and
wholesale trade sectors) to GDP rose from 14.2 per cent to an estimated
16.5 per cent. Agribusiness and forestry are currently estimated to contribute
around 20 per cent of GDP. There is every possibility of this rising further
over time. Perhaps significantly, this very substantial enhancement in the
contribution of the agribusiness and forestry sectors to GDP seems to
correlate with an increase in the trend rate of New Zealand’s per capita
income growth.
A contemporaneous research paper published by the Tertiary Education Commission developed that theme. It suggested that firms in New Zealand can be categorised into four segments (Webb and Grant, 2003, p. iii, see also Figure 8.4 below):
Segment 1: Existing core industries – representing most of the existing
export economy and largely based around products that are mostly
commodities.
Segment 2: Value-adding existing industries – representing the higher value
firms that already exist or are emerging from core industries in segment 1.

65
Segment 3: Emergent industries – representing industries that have
migrated into very different and high value markets removed from their
original sectors, or businesses that were originally focussed on servicing the
industries in segments 1 and 2, but are now established as high value
industries in their own right.
Segment 4: New knowledge-driven enterprises – representing the seeding
and development of technology-intensive or highly creative enterprises that
are new for New Zealand.
Figure 8.4 New Zealand’s Economic Structure in Four Segments
Source: Webb and Grant (2003, p.6).
Webb and Grant (2003, p. 13) further commented on Figure 8.4:
There is a danger that public sector administrators view the LHS as the dull/
old economy and the RHS as sexy/new economy. This ‘perception elitism’
may result in an over-weighted focus on the RHS, at the expense of the
skills and innovation required to support the LHS of the framework. This is
despite the fact that the businesses in segment 1 are the predominant
drivers of the economy and provide the cash flow (and tax base) essential
for funding the transformation to segments 2, 3 and 4. This is particularly
important when the current distribution of the New Zealand economy across
the four segments of the framework is considered. In the medium term, New
Zealand remains dependent on changes to industries in the first segment of
the framework.

66
A reason in favour of this is that these traditional industries have accumulated substantial financial capital, brand value and human capital, assets that can be leveraged to support the country’s economic transformation agenda (Webb and Grant, 2003, p. 7). This is particularly true in Canterbury. As noted in Chapter 5, the agriculture, forestry and fishing sector grew in Canterbury between 2001 and 2006, in contrast to the sector’s negative employment growth in the rest of the country.
Internationally, there are a number of factors affecting agriculture, not least changes in world demand such as the rise in emerging markets, changes in international policy and the growth in demand for specialist foods with multiple attributes. Additionally, as stated earlier in this chapter, there has been a sharp fall in the value of the New Zealand dollar that will certainly aid the agricultural sector and help maintain returns from exports.
The greatest recent changes affecting Canterbury agriculture identified in Chapter 2 is the increase in dairy production and drop in sheep numbers. This has been encouraged by the high world price for milksolids. Fonterra Co-operative Group, for example, announced a final payout of $7.90 per kilogram of milksolids for the 2007/08 season, compared to $4.46/kg in 2006/07. However the most recent forecast price is $5.10/kg and therefore the short term boom in dairy prices has not continued as perhaps expected. This may be for a number of factors not least the projections from emerging countries that their supply will increase. Changes in demand from developed countries and recovery from drought in countries such as Australia, as well as the global financial crisis, will all have their influence.
In the case of sheep meat, the recent downward trend in prices has halted, with lamb prices at 17 April 2009 being $81.82 per head compared to $50.07 a year earlier (http://www.agrifax.co.nz/); this is a 63.4 per cent increase. The message is that while dairy prices are still strong, and certainly returns to this sector are above those to other sectors such as sheepmeat, care has to be taken given especially the amount of debt on many dairy farms and capital outlay which may make some operations vulnerable if prices fall further.
In a longer-term frame, New Zealand producers in agriculture, forestry and fishing have been seeking to raise producer returns by targeting premium international markets. There is evidence of changing consumer attitudes in these markets over the last couple of decades that are likely to impact on this sector in Canterbury. In the United States, for example, the Lifestyles of Health and Sustainability (LOHAS) market was estimated to be valued at US$226 billion in 2000 and growing at more than 10 per cent per year, including 30 per cent of the United States adult population (Cohen, 2007).

67
A number of carbon labelling schemes are being set up across Europe. In the United Kingdom, Tesco has stated it is carbon footprinting 70,000 of its products, an example that is being followed by other supermarket chains. There are also industry initiatives, such as the Milk Roadmap that aims to have a reduction in emission from dairy of between 20 and 30 per cent of 1990 levels by 2020 (Dairy Supply Chain Forum, 2008). This is significant for New Zealand, since the dairy sector is a significant emitter of carbon, which will affect access to these premium markets unless New Zealand producers can demonstrate reductions that meet international benchmarks.
There is growing demand for foods which provide health benefits beyond basic nutrition. This is an important market in Japan, for example, which has 400 new foods being launched each year with its own regulatory processes. A 2006 Euromonitor report estimated that the total world sales of naturally healthy, high-fibre foods in 2005 amounted to US$25 billion. Sloan (2006) cited estimates that the sale of functional and fortified foods in the United States in 2006 would reach US$35.9 billion. This trend could create significant market opportunities for New Zealand producers.
There is now growing evidence of high value premium markets in emerging markets in Asia, Latin America and central and Eastern European. It is estimated that there are currently one billion middle class consumers in these markets, and this figure is set to grow. This has led to predictions of increased consumption of meat and dairy products in these markets. Beef consumption, for example, is predicted to grow by nearly 4 per cent per annum in China between 2008 and 2017, and by 2.7 per cent in India (compared to falling or static growth rates in Australia, Japan and Europe). Sheepmeat is projected to follow similar trends. Butter consumption is predicted to increase by over 3 per cent per annum in Brazil, China and India, and by nearly 3 per cent in Russia.
A major change in these markets is the switch from small retail outlets to large supermarkets. There were no supermarket sales in China at the start of 1990, for example, but this had grown to $100 billion annually by 2006 as a result of factors such as rising income, increased urbanisation, greater entry by women into the paid workforce and increased access to reliable transport networks and refrigeration (Reardon, 2007). The multinational supermarket chains that have produced this outcome are likely to replicate adopted standards for corporate responsibility with respect to sustainability into these markets, especially as global and regional procurement supply chains grow. Producers wanted to be involved in these supply chains will have to meet these standards. It seems very likely that life cycle assessments of products will become the norm.
68
Consistent with this, New Zealand producers need to develop integrated supply chains that can be verified at all of their stages. It is vital that the relationships along the supply chains are developed to meet market requirements, and that information is able to flow both ways along the chains. Labelling of products will be an issue. Labels such as 100% Pure must be able to be backed up by real evidence; otherwise they can very quickly lose their credibility.
There seems to be particular opportunities in the Canterbury region, because of its very strong agriculture sector and the high tech cluster of electronic and software firms. New information and communication technologies (ICT) are enabling traceability from the farm gate to the final supermarket purchase (or indeed internet purchases), such as the innovative approach of Icebreaker to allowing a potential purchaser of a woollen fashion garment to see the farm where the wool was sourced for its manufacture.

69

70
References
CCC (2007) Christchurch Visitor Strategy 2007-2017. Christchurch: Christchuch City Council. Accessed 20 February 2009 at www.ccc.govt.nz/strategies/visitorstrategy/thestrategy/christchurchvisitorstrategy2007-2017.pdf.
Cluster Navigators (2001) Cluster Building: A Toolkit. Wellington: Industry New Zealand (now New Zealand Trade and Enterprise). Accessed 1 September 2004 at www.nzte.govt.nz/common/files/cluster-builders-toolkit.pdf.
Cohen, M. (2007) ‘Consumer Credit, Household Financial Management, and Sustainable Consumption.’ International Journal of Consumer Studies, 31(1): 57-65.
Dairy Supply Chain Forum (2008) The Milk Roadmap. United Kingdom: Dairy Supply Chain Forum’s Sustainable Consumption and Production Taskforce, May.
Dalziel, Paul, Caroline Saunders and Greg Taylor (2005) Forecast of Skills Demand in the High-Tech Sector in Canterbury. Report prepared for the ETITO ICT in Canterbury Growth Pilot, funded by the Tertiary Education Commission. Lincoln University: AERU Research Report 275, available at www.lincoln.ac.nz/aeru.
Dalziel, Paul, Caroline Saunders and Eva Zellman (2006) Forecast of Skills Demand in the High-Tech Sector in Canterbury: Phase Two. Report prepared for the ETITO ICT in Canterbury Growth Pilot, funded by the Tertiary Education Commission. Lincoln University: AERU Research Report 288, available at www.lincoln.ac.nz/aeru.
Department of Labour (2008) Annual In-Depth Regional Report: Canterbury. Wellington: Department of Labour. Accessed 14 November 2008 at http://www.dol.govt.nz/PDFs/AIDR-2008-Canterbury.pdf.
Environment Canterbury (1998) Regional Policy Statement. Christchurch: Environment Canterbury. Accessed 29 March 2009 at www.ecan.govt.nz/Plans+and+Reports/RegionalPolicyStatement/.
Environment Canterbury (2004) ‘Soil Conservation.’ Chapter 8 in Proposed Natural Resources Regional Plan – Variation 1. Christchurch: Environment Canterbury, July. Accessed 29 March 2009 at www.ecan.govt.nz/Plans+and+Reports/NRRPNEW/ChapterEight/.
Environment Canterbury (2008) Canterbury Regional Land Transport Strategy 2008 - 2018. Christchurch: Environment Canterbury.

71
Grimes, Arthur and Andrew Aitken (2008) ‘Water, Water Somewhere: The Value of Water in a Drought-Prone Farming Region.’ Motu Working Paper 08-10. Wellington, Motu. Accessed 29 March 2009 at www.motu.org.nz/publications/working-papers/2008).
Harding, Jon S. and Michael J. Winterbourn (1997) ‘An Ecoregion Classification of the South Island, New Zealand.’ Journal of Environmental Management, 51(3), pp. 275-287.
Joyce, Stephen (2009) ‘New Zealand Government Broadband Investment Initiative.’ Draft proposal released for comment by the Minister for Communications and Information Technology. Wellington: Ministry of Economic Development, 31 March.
MAF (2003) Contribution of the Land-Based Industries to New Zealand’s Economic Growth. Wellington: Ministry of Agriculture and Forestry.
Ministry of Tourism (2008) New Zealand Regional Tourism Forecasts 2008-2014: Canterbury RTO. Wellington: Ministry of Tourism. Accessed 29 March 2009 at www.tourismresearch.govt.nz/By-Region/South-Island/.
Morgan, Matthew, Vince Bidwell, John Bright, Ian McIndoe and Christina Robb (2002) Canterbury Strategic Water Study. Report No. 4557/1, prepared for Ministry of Agriculture and Forestry, Environment Canterbury and Ministry for the Environment. Lincoln: Lincoln Environmental, August.
New Zealand Winegrowers (2008) Statistical Annual 2008. Auckland: New Zealand Winegrowers. Accessed 27 March 2009 at www.nzwine.com/statistics/.
Newsome, Peter (1987) The Vegetative Cover of New Zealand. Water and Soil Miscellaneous Publication No. 112. Wellington: Ministry of Works and Development.
O’Connor, Kevin F. and George A. Knox (2008) ‘Conservation in Past and Present Land Use, Chapter 27 in M. Winterbourn, G. Knox, C. Burrows and I. Marsden, Eds, The Natural History of Canterbury, 3rd Edition. Christchurch: Canterbury University Press, pp. 847-877.
O’Regan, Sir Tipene (1989) ‘The Ngāi Tahu Claim.’ In Sir Hugh Kawharu (Ed) Waitangi: Maori and Pakeha Perspectives of the Treaty of Waitangi. Auckland: Oxford University Press, pp. 234-262.
Reardon, T. (2007) ‘Supermarket Revolution: The Supermarket Revolution in Emerging Markets.’ Brief prepared for the Produce Market Association, December.

72
Reserve Bank of New Zealand (2009) Monetary Policy Statement, March 2009. Wellington: Reserve Bank of New Zealand.
Rogers, Anna (2007) Illustrated History of Canterbury. Auckland: Reed Books.
Saunders, Caroline and Paul Dalziel (2003) The High-Tech Sector in Canterbury: A Study of its Potential and Constraints. Report prepared for New Zealand Trade and Enterprise. Lincoln University: AERU Research Report 260, available at www.lincoln.ac.nz/aeru.
Saunders, Caroline and Paul Dalziel (2006) Identifying the Way Forward for High Growth Firms in the ICT Sector. Report prepared for the HiGrowth Project Trust. Lincoln University: AERU Client Report.
Sloan, A.E. (2006) ‘Top 10 Functional Food Trends.’ Food Technology, April, pp. 22-40.
Statistics New Zealand (2008) Tourism Satellite Account: 2007. Wellington: Statistics New Zealand. Accessed 14 November 2008 at www.stats.govt.nz/analytical-reports/tourism-satellite-account-07.htm.
Waitangi Tribunal (1991) Ngāi Tahu Report: Volume Three. Wellington: Brooker and Friend.
Webb, Colin J. and Craig Grant (2003) ‘Economic Transformation: An Implementation Framework.’ Tertiary Education Commission Research Paper. Wellington: Tertiary Education Commission.
Webb, Trevor H. (2008) ‘Soils.’ Chapter 4 in M. Winterbourn, G. Knox, C. Burrows and I. Marsden, Eds, The Natural History of Canterbury, 3rd Edition. Christchurch: Canterbury University Press, pp. 89-118.
Whitehouse, Ian, Andy Pearce and Grant McFadden (2008) Canterbury Strategic Water Study (CSWS) Stage 3: Multi-stakeholder Evaluation of Water Storage Options: Final Report. Christchurch: Environment Canterbury.
Winterbourn, Michael J. (2008) ‘Rivers and Streams.’ Chapter 18 in M. Winterbourn, G. Knox, C. Burrows and I. Marsden, Eds, The Natural History of Canterbury, 3rd Edition. Christchurch: Canterbury University Press, pp. 589-615.
Winterbourn, Michael, George Knox, Colin Burrows and Islay Marsden, Eds (2008) The Natural History of Canterbury, 3rd Edition. Christchurch: Canterbury University Press.

Canterbury Regional
Economic Development
Strategy, 2009
Part I: Vision and Objectives
Canterbury Economic Development Co. Ltd.
(25 September 2009)

Acknowledgements
The CREDS 2009 Update project was funded by New Zealand Trade and Enterprise through Canterbury Economic Development Co. Ltd. This report was prepared by a research team comprised of Heather Warwick (Enterprise North Canterbury), Toni Brownie (Canterbury Development Corporation), Lesley Symington, Claire Bryant and Barbara Bately (Selwyn District Council), Rob Brawley (Enterprise Ashburton), Wendy Smith and Andrea Miller (Aoraki Development Trust), and Caroline Saunders and Paul Dalziel (AERU, Lincoln University). The researchers were assisted at different stages by Annie Paterson (Kaikoura District Council), Irvine Paulin (NZTE), Bill Luff, Gerard Quinn and Simon Worthington (Canterbury Development Corporation) and Hayley Neil (AERU). Feedback on earlier drafts was provided by the Board of CED Co, with particular assistance from Board Member, Murray Cleverley, and the Administrative Agent, Stacey Scott. The research for this update involved a large number of individual interviews, focus groups, telephone surveys and feedback meetings with a wide range of people throughout the Canterbury region. Although too many to name individually, the research team is very grateful to everyone who shared their expertise and time over the last six months.

iii
Part I: Vision and Objectives
Contents
Acknowledgements ii
Contents iii
List of Tables in Part I iv
List of Figures in Part I iv
1. Introduction 1
2. Vision and Goals 4
3. Strengths and Constraints 8
4. Strategic Objectives 17
5. Priorities 20
5.1 Canterbury Water 21
5.2 Canterbury Intellectual Property 22
5.3 Canterbury Trade Alliance 23
5.4 Canterbury Connectivity (especially Broadband) 25
5.5 Canterbury Tourism 26

iv
List of Tables in Part I
2.1 Vision, Goals and Existing Strategies 7
3.1 Strengths and Constraints 9
4.1 Constraints and Objectives 18
4.2 Goals and Objectives 19
5.1 Five Priority Key Areas 21
List of Figures in Part I
1.1 Index of Regional Economic Activity, 2000-2009 1

v

1
1. Introduction
This is the third Canterbury Regional Economic Development Strategy (CREDS). The first CREDS was prepared in 2000, and the second in 2005. There has been considerable economic development in the region since 2000. This is reflected in Figure 1.1 below, which presents the National Bank’s Index of Regional Economic Activity for Canterbury and for New Zealand, both set equal to 100 in the base year of 1987. The impact of the recession is visible in 2008, and particularly in the March quarter of 2009. Prior to this, the Canterbury economy’s average annual growth rate was 3.7 per cent per annum between 2000 and 2007, above the national growth rate of 3.2 per cent per annum over the same period.
Figure 1.1 Index of Regional Economic Activity, 200 0-2009
120
140
160
180
200
2000 2001 2002 2003 2004 2005 2006 2007 2008 2009
Index (1987 = 100)
Canterbury
New Zealand
Source: National Bank, Regional Trends data, March 2000 to March 2009, obtained from www.nationalbank.co.nz/economics/regional/default.aspx.
Note: Data are seasonally adjusted.

2
In October 2008, the Canterbury Economic Development Co. Ltd. (CED Co.) published a request for proposals on behalf of the region’s territorial authorities to build upon and refresh CREDS 2005 to develop a progressive, forward thinking and well-aligned regional strategy and implementation plan. The research team selected for this task was appointed at the end of November 2008, comprised of the AERU research unit at Lincoln University and the region’s five economic development agencies (EDAs): Enterprise North Canterbury, Canterbury Development Corporation, the economic and community development officers in the Selwyn District Council, Enterprise Ashburton and the Aoraki Development Trust.
The work of the research team followed the process recommended by New Zealand’s Ministry of Economic Development, published on its website at www.med.govt.nz/strategy-development/. Details of the process’s seven phases are presented as Appendix 1 in Part II of this report, but there were three core elements involved: preparation by the AERU of the evidence-based Canterbury Regional Profile and Economic Outlook; consultation by the economic development agencies of key business leaders and stakeholders in their district or city; and drawing on the gathered evidence and consultation to prepare this strategy and implementation plan.
Together, these three core elements were designed to achieve the following aim for the CREDS update: To identify major issues in the Canterbury economy for which:
(i) there is strong evidence that the issue has a significant influence on the region’s potential for economic development;
(ii) no agency is currently able to address the issue to the extent justified by its significance for the region’s economic development; and
(iii) a co-ordinated strategic action plan focusing on the issue has a clear potential to enhance the region’s economic development.
A large number of people generously shared their expertise and time to achieve this aim. There is a long history of cooperation for regional economic development in Canterbury, including among the economic development agencies. This widespread willingness for agencies and individuals in Canterbury to cooperate provides a sound foundation for long-term strategic planning, but is not taken for granted. The research team records our gratitude for all the assistance we received in preparing this report.

3
The CREDS strategy is presented in two parts. Part I introduces the vision and objectives of the strategy. It begins in Chapter 2 with a review of the vision and high-level goals of CREDS 2005. Chapter 3 then draws on the evidence in the Canterbury Regional Profile and Economic Outlook and the evidence in the diverse consultations by the EDAs to draw up a list of ten pairs of core strengths and constraints in the Canterbury economy. Chapter 4 uses this list to offer twelve short-term strategic objectives for building on the region’s strengths in order to address the identified constraints. Chapter 5 finishes this first part with a discussion of five key areas adopted as priorities for the CREDS 2009 strategy.
Part II in a separate document sets out an implementation plan, a communication plan and an evaluation plan for the CREDS strategy. These plans are followed by three appendices. The first appendix describes in more detail the process by which this update was prepare in line with the Ministry of Economic Development’s guidelines. Appendix 2 cites material from the draft Long Term Council Community Plans that was used to review the vision and long-term goals of CREDS 2009. Appendix 3 lists existing strategic documents in Canterbury that are already guiding aspects of the region’s economic development. CREDS 2009 aims to avoid any duplication with these existing strategies.

4
2. Vision and Goals
The Canterbury Regional Economic Development Strategy prepared in 2005 adopted the following vision for the region (CREDS, 2005, p. 1):
Vision
Canterbury is a world leading regional economy founded on innovation,
diversity and sustainability: A region that is a great place to live, learn, work,
visit, invest and do business for all.
To become a world leading regional economy, that strategy identified five high level goals that Canterbury needs to achieve (CREDS, 2005, p. 4):
Goals
1. Attract, develop and grow skills and talents.
2. Provide a world-class infrastructure.
3. Develop and maintain an enterprise culture that promotes investment,
growth and innovation.
4. Become increasingly globally competitive and connected into world
markets.
5. Aspire to and work towards achieving a superior standard of living for all.
To test the validity of the vision and goals, the research team used draft Long Term Council Community Plans (LTCCPs) prepared by territorial authorities in the Canterbury region under the Local Government Act 2002. Section 10 of that Act requires territorial authorities ‘to promote the social, economic, environmental, and cultural well-being of communities, in the present and for the future’. As part of that duty, all territorial authorities in New Zealand have been required to update their LTCCPs in 2009, with initial drafts published in time for the CREDS review. These documents include summaries of the Council’s desired community outcomes, including desired economic goals.
These summaries are an authoritative source for checking given goals for a regional economic development strategy. The territorial authorities have a statutory responsibility for promoting economic well-being (alongside the other well-beings listed in the Act), and the community outcomes are determined through widespread consultation. Appendix 2 in Part II of this report presents the summaries contained in the draft LTCCPs of Canterbury local governments at the beginning of 2009.

5
After reviewing the summaries in Appendix 2, the research team concluded that the vision statement and high level goals of the 2005 Canterbury Regional Economic Development Strategy are broadly supported by the community outcomes summaries reported above. Nor was there any feedback in other parts of the research that suggested a need for change. This is not unexpected. A region’s vision and high-level economic development goals typically have a long-term focus that does not change frequently, and this is the case for CREDS.
Consequently, CREDS 2009 carries over the 2005 vision statement and five high level goals without change. In 2005, this was accompanied by the following measures of progress, which are also carried over without amendment:
We will be making progress towards achieving our Mission when:
Our economy…
• has regional GDP growth per annum consistently above the national
average.
• uses an enhanced global connectivity to increase export activity.
• creates a wide range of sustainable family wage jobs.
• has made a separation between GDP growth and resource consumption.
Our region…
• invests in refinements to primary sector performance (i.e. value chain
management).
• promotes strategically-driven tourism and visitor attraction initiatives.
• embeds consideration of future needs into everyday business to ensure
the needs of present and future generations are not compromised.
• promotes our regional brand to showcase Canterbury as an exciting
place to live, work and visit.
Our people…
• are able to participate in all aspects of the economy.
• have the skills, training and education that are aligned with the needs of
business and industry.
• enjoy growing standards of living.
• have ready and affordable access to first-world housing, health and
education services.

6
Our infrastructure…
• provides full access to competitively priced telecommunication services
(broadband).
• provides access to competitively priced energy supplies which are
reliable and sustainable in the long term.
• provides business and industry with effective access to goods and
services.
• provides for sustainable growth.
• provides a balance between competing requirements for water.
Chapter 1 reported that the aim of the CREDS update has been to identify major regional development issues that satisfy certain criteria, that ‘no agency is currently able to address the issue to the extent justified by its significance for the region’s economic development’. Consequently, the research team reviewed how the CREDS high-level goals are currently being addressed by existing regional strategies. The strategies that were considered for this review are described in Appendix 3 (Part II of this report), and Table 2.1 presents a summary of its results.
It is immediately clear from Table 2.1 that there has been a major gap in regional strategic planning for the third goal of CREDS: the research team was not able to identify any regional strategy that explicitly seeks to develop and maintain an enterprise culture that promotes investment, growth and innovation. This does not mean that programmes supporting enterprise and innovation have been absent in Canterbury. To the contrary, this has been a core focus of central government policies for regional development over the last decade. It does suggest, however, that the Canterbury region has not yet developed its own strategic framework for this goal. Consequently, the research team recommends that enterprise and innovation be adopted as the core theme for CREDS 2009 (see Chapter 5).

7
Table 2.1 Vision, Goals and Existing Strategies
Canterbury Labour Market Strategy, 2008
North Canterbury Labour Market Strategy, 2008
Department of Labour’s Annual In-Depth Regional Report: Canterbury
Goal 1: Skilled and talented workforce
Regional Statements of Tertiary Education Needs, Gaps and Priorities in Canterbury, 2008
Regional Land Transport Strategy, 2008-2018
Christchurch, Rolleston and Environs Transportation Study, 2007
Draft Canterbury Water Management Strategy, 2009
Goal 2: World-class infrastructure
Canterbury Regional Energy Strategy, 2009
Goal 3: An enterprise culture promoting investment and innovation
Christchurch Visitor Strategy, 2007-2017
Draft Ashburton District Visitor Strategy, 2009-2019
Education Christchurch & Canterbury
Education South Canterbury
Goal 4: Globally competitive firms connected into world markets
Industry Cluster Strategies
Regional Policy Statement
Greater Christchurch Urban Development Strategy, 2007
Vis
ion:
Can
terb
ury
is a
wor
ld le
adin
g re
gion
al e
cono
my
foun
ded
on in
nova
tion,
div
ersi
ty a
nd s
usta
inab
ility
: A
reg
ion
that
is a
gre
at p
lace
to li
ve, l
earn
, wor
k, v
isit,
inve
st a
nd d
o bu
sine
ss fo
r al
l.
Goal 5: Superior standard of living for all
Ministry of Social Development’s Canterbury Regional Plan for 2008/09

8
3. Strengths and Constraints
To create a list of strengths and constraints relevant to the Canterbury economy, the research team drew on two primary sources of evidence. The first source was the Canterbury Regional Profile and Economic Outlook prepared for CREDS by the AERU at Lincoln University. That report collected and analysed statistical data on the province under a variety of headings. The second source of evidence was the consultations with business leaders and key stakeholders, carried out by the project’s five EDAs and by the Kaikoura District Council. Strategic themes were identified from these two sources, and then drafted into pairs of strengths and constraints as listed in Table 3.1 on the following page.
The strengths and constraints are paired, based on the view that the key constraints to be addressed in an economic strategy are those that limit the region’s ability to build on its identified strengths. This approach is used to define objectives in the following chapter, but first this chapter gives brief overviews of each pair of strengths and objectives in Table 3.1, citing relevant evidence from the two sources used for this part of the project.
Canterbury is a great place for people to live.
A recurring theme in the consultations was that Canterbury is a great place to live. This was reflected in the generally positive responses despite the current economic crisis, and supported by the economic evidence in the Canterbury Regional Profile and Economic Outlook (see, for example, Figure 1.1. earlier in this strategy). That document also described how Canterbury offers a great diversity of cultural, recreational and sporting opportunities to residents, and during the consultations Canterbury was described as offering a ‘good quality of life’ to its residents. In the Christchurch surveys, the most common reason for the business being in Canterbury was that this is where the owner/founder lived. Outside Christchurch, people said that they lived in a desirable location for families with good schools, a quiet country community and the benefit of having a major city in close proximity – a major attraction for skilled workers. Residents also enjoyed a lower cost of living compared to Auckland, for example, as well as a good climate. Canterbury is also considered the ‘gateway to the South Island’ with easy access to a range of high quality attractions and activities. The region’s people were also clearly an important part of the region’s appeal. Comments included factors such as a ‘quality community’ with ‘strong community resources’.

9
Table 3.1 Strengths and Constraints
Strengths Constraints
Canterbury is a great place for people to live.
The region is not promoted well, nationally or internationally.
The Canterbury economy has long been built on export growth.
Access to international marketing expertise is not always easy.
There is a wealth of experienced business people in Canterbury.
Access to capital, especially venture capital, can be difficult.
Canterbury businesses are responsive to market signals.
Volatility from overseas and demand seasonality can be issues.
Canterbury has abundant land, water and other natural resources.
Water storage has not been planned well for economic development.
There is a solid skill base in the Canterbury labour force.
Skill shortages, and workers with low skill levels, have been issues.
Canterbury has strong public and private research institutions.
Linkages between researchers and businesses are often weak.
Canterbury offers visitors a range of national iconic attractions.
Planning and marketing of tourism are not well integrated regionally.
Canterbury has good infrastructure, including the airport and seaports.
Infrastructure planning is disjointed, and rural broadband is expensive.
Canterbury is well-connected, with effective working relationships.
Regulations and compliance costs can hinder business growth.
There was also feedback, however, that participants think the region is not well promoted, nationally or internationally, including to potential migrants from overseas. Data in the Canterbury Regional Profile and Economic Outlook indicates that Canterbury’s population diversity is less than the national average, suggesting it has been less successful in attracting migrants. During the consultations it was suggested that regional profiling requires a different marketing strategy to tourism promotion; as one business owner observed, ‘tourism brings in visitors, but not residents’.

10
Stakeholders felt there was a lack of a ‘clear vision’ for Canterbury and its districts within local government and as a result, the region lacks direction and cohesion. Respondents working within the education sector felt that institutions in the region missed out on students due to the lack of a strong city and region profile. In some cases, respondents felt that there needed to be an image overhaul of their district, lest a negative profile act as a barrier to attracting new residents.
The Canterbury economy has long been built on export growth.
From the earliest days of European settlement, wealth has been generated in the Canterbury economy through exporting to international markets (including hosting international tourists). This is a real strength, since it is generally recognised in New Zealand that the small size of the domestic market means that enterprise growth must involve exporting at a relatively early stage in a firm’s life. The Canterbury Regional Profile and Economic Outlook provided data on cargo and passenger movements through Christchurch International Airport, Lyttelton Port and Timaru Port to emphasise the importance of the region’s connectedness to world markets.
Business owners across the region reported that a constraint to the growth potential of their business is a lack of marketing expertise. Some felt they lack the ‘know how’ to be able to brand and advertise their business and its products internationally. Others felt there is a general lack of marketing of New Zealand businesses in global markets. This observation has been supported by other research work on Canterbury firms carried out by the AERU which has also emphasised the constraining influence of accessing overseas market.
In the CREDS consultations, business owners were asked to consider what their number one reason would be for relocating their business either somewhere else in New Zealand or offshore. The biggest consideration by far would be to gain access to larger markets and more customers. This was particularly noteworthy amongst respondents from the manufacturing industry. While Canterbury was praised for its business base, it was recognised that there could be huge growth potential by taking the business to a more accessible region. Location was seen to have implications for domestic and international freight costs; for example, respondents noted the increased cost of exporting when transporting goods firstly to Auckland before being shipped overseas.

11
There is a wealth of experienced business people in Canterbury.
Another strength emerging from the feedback was the way businesses in the region operate. Business owners are seen to be actively developing their business with good business vision, marketing and branding. Further, businesses recognise the importance of having a ‘strong customer focus’, which means providing a high quality of service and delivering quality products to customers. The Canterbury Regional Profile and Economic Outlook reported that the Property and Business Services sector had the largest increase in employment between 2001 and 2006, is the third largest employer in Canterbury, and grew much more strongly in the region than would be expected from national trends. This sector is not often recognised for its contributions to regional economic development, but there is evidence that it is a genuine strength in Canterbury. Some stakeholders commented that the region’s ageing population profile presents a risk that this wealth of skills, knowledge and experience may be lost (especially if there is little succession planning by small business owners).
Business owners across a range of sectors, particularly in Christchurch, reported access to capital as one of the biggest barriers for harnessing their full potential. Respondents spoke of the difficulty of accessing funding and the complex process involved. Financial issues were further compounded by the current economic climate. Business owners in the manufacturing sector, for example, reported that a lack of capital meant they were unable to upgrade machinery and facilities (affecting production flow) or they were unable to purchase stock. Other owners were unable to expand their business into new markets as they were unable to meet feasibility costs. Businesses were also constrained in terms of product development as they were unable to engage in research and development. Some respondents were unsure if the issue is that there is a general lack of funding available or if the problem is low understanding of the process for obtaining funds. Some indicated it would be beneficial to have a centre of expertise to provide assistance for businesses presenting a case for finance.
Canterbury businesses are responsive to market signals.
Stakeholders from the region praised the responsiveness of businesses in the region, particularly in relation to the recent economic crisis. Businesses were described as being ‘robust’, ‘buoyant’ and ‘resilient’. Business owners were also praised for their ability to retain a positive outlook for the future in light of the current troubles. Businesses in the Canterbury region were able to be responsive to customers and to changes in a market, in particular in relation to their flexibility and creativity. Evidence of this can be found in the
12
rapid changes in land use and production that took place in Canterbury in response to changes in the world price of milkfat in 2007 and 2008. As outlined in the Canterbury Regional Profile and Economic Outlook, there has been an increase in land devoted to grassland, with falls in tussock, arable land and forestry. The main change between 2002 and 2007 was the increase in dairy production and associated beef production at the expense of declines in deer and sheep farming.
Nevertheless, the feedback included many reports about the difficulty of coping with fluctuations sourced from overseas. Sharp changes in the value of the exchange rate, for example, can have very large impacts on profitability depending on whether the firm is exporting or importing. The global financial crisis was cited by business owners as having a detrimental impact on current business activity and the potential for business growth. Some respondents had lost work from major clients as a result of the economic downturn while for others; the economic downturn had meant businesses were forced to postpone planned expansion. The tourism sector had also suffered a decline in visitor numbers to New Zealand in general. The sharp rise in dairy prices has been followed by a rapid fall, having a significant impact for the region. The high value of the New Zealand dollar was reported as impacting on manufacturing, even when the local firm manages to maintain overseas orders during the crisis.
On a related theme, maintaining all-year profitability in tourism can be very difficult with attractions typically being used either in winter or in summer. This poses problems for business owners about how to maintain their enterprise all year round. There was also the issue of ‘down days’ within a season; for example, when the ski fields are closed. Other industries also mentioned the seasonality of trade having an impact on the business. For example, a livestock farmer felt that the length of the season was ‘prohibitive’. Another business owner described the same issue with the seasonal nature of the equine breeding industry.
Canterbury has abundant land, water and other natural resources.
As stated in the Canterbury Regional Profile and Economic Outlook, the region has a wide range of abundant natural resources. Over 60 per cent of Canterbury land is capable of being cultivated, and Canterbury has by far the highest share of New Zealand’s irrigated land. It is not surprising, therefore, that during the consultations people frequently mentioned Canterbury’s good fertile land and supply of high quality water. This abundance of resources enables a wide range of rural activities including agriculture, viticulture and horticulture. Moreover, these physical and
13
ecological features of the region also contribute to tourism in the area. Stakeholders in the region noted the potential for harnessing these natural resources as a source of renewable energy.
There was widespread dissatisfaction reported by respondents outside Christchurch about the way in which water storage issues have been addressed. Business owners across the region spoke of the abundant supply of water and the need to improve how it is harnessed for economic development. There were widespread feelings of frustration concerning the restraints on water storage and irrigation. Some stakeholders, on the other hand, felt that there are unrecognised limits, so that New Zealanders need to exercise restraint when it comes to water usage. Stakeholders also felt there was a lack of willingness across the government to be involved with the planning and funding of irrigation. On 3 September 2009, the Draft Canterbury Water Management Strategy was released, representing a major milestone in addressing these issues.
There is a solid skill base in the Canterbury labour force.
Canterbury as a region was seen to have a solid skill base. Census 2006 data indicate that the qualification levels of the working age population in Canterbury are close to the national average (although there is a larger percentage in the region than nationally with no school or higher qualifications). The region has a strong technology centre, which acts as a ‘central hub’ in particular for the manufacturing, consultancy and ICT sectors. Industry sectors further benefited from New Zealanders returning from overseas and bringing with them their range of experiences.
Stakeholders described Canterbury as a ‘self-reliant region’ with a ‘good spread of skills and industries’ such as agricultural, industrial, tourist, education and service sectors. Business owners in one area spoke of the importance of investing in staff through training and development; in return, they are rewarded with ‘reliable’, ‘experienced’, ‘dedicated’ and ‘loyal’ staff.
Respondents from a range of sectors noted the difficulty businesses can face in finding well-trained and experienced staff in some key areas. Canterbury has fewer managers and professional workers than the national average. Staff retention issues were noted by Kaikoura businesses. Manufacturing businesses reported difficulties accessing semi-skilled staff for manual work, while employers looking for seasonal employees have additional problems such as finding them affordable accommodation. The high tech sectors in Canterbury have frequently reported skill shortages in core occupations.

14
At the same time, concerns were reported about the quality of current staff including issues with literacy, absenteeism or poor work attitudes. Canterbury has lower income levels than the national average, reflecting in part that a larger share of its employed workforce is comprised of labourers. Groups such as the Mayors’ Taskforce for Jobs have been concerned about people (especially young people) who drop out of education and training and so limit their opportunities for employment in higher skilled occupations.
Demographic trends are likely to reinforce these concerns. The Canterbury Regional Profile and Economic Outlook recorded that in recent years the region’s participation rate has been higher and the unemployment rate lower, but the former in particular may be difficult to maintain as the population ages in the future. This will be reinforced in southern parts of the province if current official projects of a declining population turn out to be correct.
Canterbury has strong public and private research institutions.
The Canterbury Regional Profile and Economic Outlook described the regional innovation systems in Canterbury incorporating innovation from its research institutions. Participants in the consultations affirmed that Canterbury is seen as having a ‘strong research base and innovation ethos’. This includes the region’s two universities, two polytechnics, several Crown Research Institutions (CRIs), specialist research teams in medical technology, and a large number of private firms with strong research capabilities. This contributes to a strong innovation identity for the region, reflected in recent initiatives such as the Trades Innovation Institute, the New Zealand ICT Innovation Institute and the Canterbury Innovation Incubator. There is a strong core capability in land-based research in the Lincoln cluster of CRIs and Lincoln University.
Despite these and other initiatives across the region, there are concerns that linkages between researchers and businesses are weaker than they could be. This limits effective regional innovation systems. Recent and proposed changes to the country’s national science systems are intended to address these weaknesses, but there may be scope for local initiatives.
Canterbury offers visitors a range of national iconic attractions.
As described in the Canterbury Regional Profile and Economic Outlook, the Canterbury region contains some of New Zealand’s international iconic tourist attractions. These include WhaleWatch Kaikoura, the Hanmer

15
Springs Thermal Pools and Spa, the International Antarctic Centre in Christchurch, Akaroa Harbour, the Aoraki/Mount Cook National Park, the Mt Hutt Ski Area, and Lake Tekapo. This list illustrates the great diversity of visitor experiences available in Canterbury, from climbing the highest peak in Australasia to watching whales attracted by nutrients created by a 2km deep sea canyon just off the Kaikoura shore.
Some business owners in Kaikoura suggested that Canterbury lies in the shadow of other iconic experiences in New Zealand. Due to a lack of marketing of the region as a whole, people are unaware of what Canterbury has to offer and therefore miss out when it comes to choosing their holiday destinations or travellers considering tour stops. It was felt to be more important than ever to be promoting the region particularly to tourists in light of the global recession and its impact on visitor numbers to New Zealand.
Canterbury has good infrastructure, including the airport and seaports.
Canterbury is a widely accessible region with its international airport and two container seaports. Business owners felt this is a major strength of the region as it allows importing and exporting both domestically and internationally at an affordable price. Furthermore, such access is also fundamental for the tourism industry. In particular, the emergence of budget airlines in New Zealand has enabled affordable travel like never before.
Nevertheless, there were concerns that not all infrastructure investment is being effectively managed. More generally, there is a suggestion that infrastructure planning is disjointed, and that as a result the region is not making the most of the opportunities available to it. Water storage issues and energy resilience strategies, for example, are being considered separately, whereas there are opportunities for schemes that would deliver good outcomes under both headings.
A specific issue is that access to affordable and high speed broadband is problematic in rural areas. This issue was supported in the Canterbury Regional Profile and Economic Outlook (p. 50) with data from a December 2006 Statistics New Zealand survey: “In the main urban areas, more households were using broadband than dial-up, but in rural areas nearly twice as many households were using dial-up as were using broadband. The gap between use of broadband in the main urban areas and in other areas lay between 13 and 15 percentage points.”

16
Canterbury is well-connected, with effective working relationships.
Business owners described the positive relationships established within Christchurch city and within the wider region. The small interconnected communities enabled industries to work together in what one Christchurch business owner described as ‘intense collaboration’. Business owners in the region are seen as keen to work together in building and maintaining meaningful relationships. The benefits of sustaining relationships included having a ‘support system’ and a source of specialist information. Further-more, having contacts within the industry meant the opportunity to secure subcontracted work.
Nevertheless, there were also reports that national and local government are not as supportive of business as they could be. Regulations associated with various industries were clearly felt to be a constraint amongst business owners. Respondents often felt that regulatory requirements were time consuming, costly and restrictive. The cost of compliance was particularly felt by start up companies and small businesses. In the Aoraki district, respondents within the construction industry reported difficulty in complying with central and regional government requirements in relation to building size for example. Within fishing industry in Kaikoura it was felt that the number of regulations and quotas hindered the success of the business. The Resource Management Act (RMA) was widely cited by business owners as a constraint. While the act tended to be seen as positive in itself, nevertheless, it was felt there are too many issues with interpretation and ‘too much red tape’ which ultimately make it too time consuming and problematic.
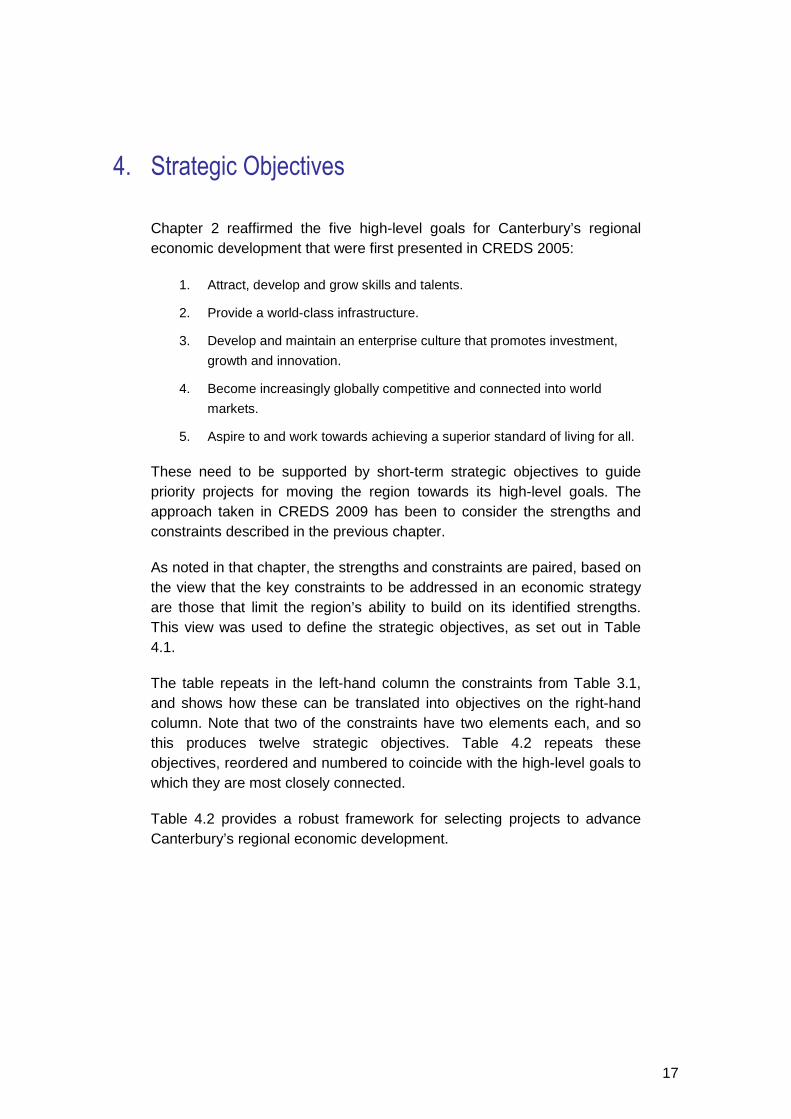
17
4. Strategic Objectives
Chapter 2 reaffirmed the five high-level goals for Canterbury’s regional economic development that were first presented in CREDS 2005:
1. Attract, develop and grow skills and talents.
2. Provide a world-class infrastructure.
3. Develop and maintain an enterprise culture that promotes investment,
growth and innovation.
4. Become increasingly globally competitive and connected into world
markets.
5. Aspire to and work towards achieving a superior standard of living for all.
These need to be supported by short-term strategic objectives to guide priority projects for moving the region towards its high-level goals. The approach taken in CREDS 2009 has been to consider the strengths and constraints described in the previous chapter.
As noted in that chapter, the strengths and constraints are paired, based on the view that the key constraints to be addressed in an economic strategy are those that limit the region’s ability to build on its identified strengths. This view was used to define the strategic objectives, as set out in Table 4.1.
The table repeats in the left-hand column the constraints from Table 3.1, and shows how these can be translated into objectives on the right-hand column. Note that two of the constraints have two elements each, and so this produces twelve strategic objectives. Table 4.2 repeats these objectives, reordered and numbered to coincide with the high-level goals to which they are most closely connected.
Table 4.2 provides a robust framework for selecting projects to advance Canterbury’s regional economic development.

18
Table 4.1 Constraints and Objectives
Constraints Objectives
The region is not promoted well, nationally or internationally.
Potential migrants and investors are easily able to obtain reliable information about the quality of life in Canterbury.
Access to international marketing expertise is not always easy.
Canterbury businesses with export potential are easily able to access expertise in international marketing.
Access to capital, especially venture capital, can be difficult.
Effective systems support Canterbury firms obtaining access to capital, especially venture capital.
Volatility from overseas and demand seasonality can be issues.
Canterbury businesses are able to manage commercial volatility from overseas and seasonality of demand.
Water storage has not been planned well for economic development.
Canterbury producers are able to increase yields as a result of well planned investment in water storage. Firms in Canterbury are able to employ all the skilled and unskilled labour they need to grow.
Skill shortages, and workers with low skill levels, have been issues. All Canterbury citizens are able to
participate in quality education, training or employment.
Linkages between researchers and businesses are often weak.
Regional innovation systems include strong linkages between Canterbury researchers and businesses.
Planning and marketing of tourism are not well integrated regionally.
The planning and marketing of Canterbury tourism is integrated regionally. Planning for infrastructure investment in Canterbury is integrated across the different types of investment.
Infrastructure planning is disjointed, and rural broadband is expensive.
Canterbury citizens in rural districts are able to access quality services such as affordable broadband.
Regulations and compliance costs can hinder business growth.
Central, regional and local governments do not impose unjustified regulations and compliance costs on Canterbury businesses.
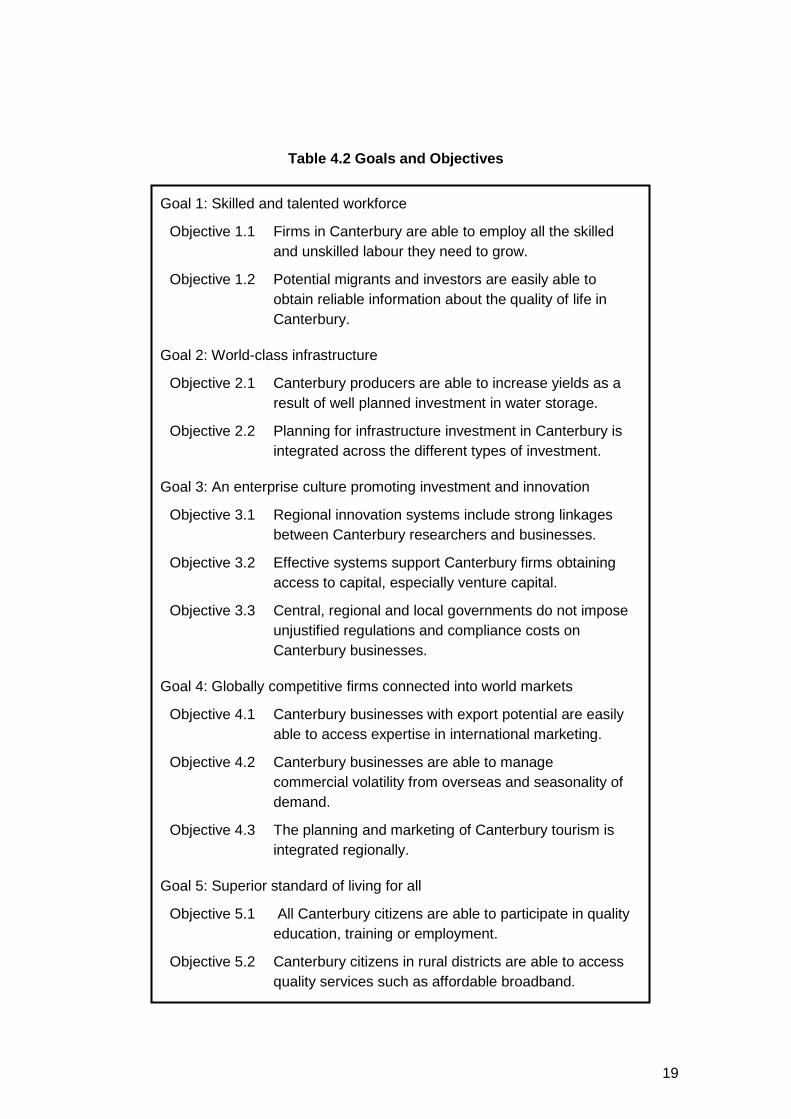
19
Table 4.2 Goals and Objectives
Goal 1: Skilled and talented workforce
Objective 1.1 Firms in Canterbury are able to employ all the skilled and unskilled labour they need to grow.
Objective 1.2 Potential migrants and investors are easily able to obtain reliable information about the quality of life in Canterbury.
Goal 2: World-class infrastructure
Objective 2.1 Canterbury producers are able to increase yields as a result of well planned investment in water storage.
Objective 2.2 Planning for infrastructure investment in Canterbury is integrated across the different types of investment.
Goal 3: An enterprise culture promoting investment and innovation
Objective 3.1 Regional innovation systems include strong linkages between Canterbury researchers and businesses.
Objective 3.2 Effective systems support Canterbury firms obtaining access to capital, especially venture capital.
Objective 3.3 Central, regional and local governments do not impose unjustified regulations and compliance costs on Canterbury businesses.
Goal 4: Globally competitive firms connected into world markets
Objective 4.1 Canterbury businesses with export potential are easily able to access expertise in international marketing.
Objective 4.2 Canterbury businesses are able to manage commercial volatility from overseas and seasonality of demand.
Objective 4.3 The planning and marketing of Canterbury tourism is integrated regionally.
Goal 5: Superior standard of living for all
Objective 5.1 All Canterbury citizens are able to participate in quality education, training or employment.
Objective 5.2 Canterbury citizens in rural districts are able to access quality services such as affordable broadband.

20
5. Priorities
The twelve strategic objectives presented in Chapter 4 provide a broad framework for the economic development of Canterbury as a region. In order to develop priorities from these the objectives, the research team sought to identify key themes based on considerations such as time sensitivity, reinforcing nationally important regional strengths, promoting stepwise changes in regional development capability, producing large returns for small outlays, addressing equity and inclusiveness, and capturing engagement.
This analysis paid particular attention to: the evidence gathered for the Canterbury Regional Profile and Economic Outlook; the importance of avoiding duplication of work being carried out under existing Canterbury strategies; and feedback from public meetings across the region that reported findings from the CREDS 2009 consultations that had carried out by the region’s economic development agencies. There was also a further round of consultation with key regional-level stakeholders.
This led to eight priority themes being identified by the research team, each of which was supported by a potential project proposal, under the following headings: Canterbury Regional Innovation System; Canterbury Innovation Support Centre; Canterbury Trade Alliance; Canterbury Natural Resource Centre; Canterbury Infrastructure Strategy; Canterbury Broadband Plans; Canterbury Workforce Development; and Canterbury Food and Beverage.
The CED Co. Ltd. Board considered this material, and further refined the eight themes to focus on five key areas that are important to the Canterbury region. These five priority areas are listed in Table 5.1, along with the objectives from Chapter 4 that they address.
Table 2.1 in Chapter 2 of this report revealed that there has been a gap in strategic planning in Canterbury aimed at the high-level goal of developing and maintaining an enterprise culture that promotes investment, growth and innovation. Consequently, Chapter 2 recommended that enterprise and innovation be adopted as the core theme for CREDS 2009.
The five priorities listed in Table 5.1 are key areas where enterprise and innovation are required to address fundamental issues in the Canterbury economy. This core theme is explored in the remainder of this chapter. Each subsection discusses the five priorities in turn, and explains the need for enterprise and innovation in each of the identified key areas.

21
Table 5.1 Five Priority Key Areas
Priorities Objectives
1 Canterbury Water 2.1
2 Canterbury Intellectual Property 3.1, 4.1
3 Canterbury Trade Alliance 1.2, 4.1, 4.2
4 Canterbury Connectivity (especially Broadband) 2.2, 5.2
5 Canterbury Tourism 4.3
5.1 Canterbury Water
Table 3.1 recorded the widespread view that Canterbury has abundant land, water and other natural resources, but water storage has not been planned well for economic development. This view is supported by evidence in the Canterbury Regional Profile and Economic Outlook prepared for the CREDS 2009 update. This reported that the province has eighteen major rivers flowing from the Southern Alps or their foothills to the sea, and there are sizable water aquifers beneath the Canterbury Plains; yet the region is prone to drought, and advertising campaigns warn residents about the need to minimise wasteful water consumption.
On 3 August 2009, the Canterbury Mayoral Forum released the Draft Canterbury Water Management Strategy, which had been prepared by a steering group chaired by Bede O’Malley after a sustained period of expert studies and extensive public consultations. The preface to the document noted the context and value of its work:
In the last decade pressure on Canterbury’s water resource has increased
significantly and with it has emerged a highly adversarial approach to
allocation and management, infrastructure provision, and related land
management practices which has exacerbated the situation leading to sub-
optimal outcomes.
It is not in the best interests of anyone in Canterbury for this situation to
continue. The work done in compiling this strategy has demonstrated there
is an alternative way forward, based on collaboration and integrated
management that will maximise the opportunities for the environment,
economy and community of Canterbury in the years ahead.
22
The draft strategy goes on to say that what is required is a new paradigm in the way water is allocated and managed (p. 9, emphasis in original):
Regulatory action to deal with environmental problems will need to be
complemented with incentive mechanisms that progressively drive efficiency
in the use of water and responsible land management practices.
The key incentive mechanism to drive these changes will be the availability
of reliable water from new storage and distribution infrastructure. However,
this new water must be used in a new way . It must not be over-allocated for
production purposes, as some water resources have been, but instead used
to achieve balanced outcomes. In particular, protection of ecosystems,
recreational and customary uses, and environmental conservation can no
longer be seen as “add-ons” to development, but mainstream elements of a
sustainability agenda.
The publication of the Draft Canterbury Water Management Strategy represents a major milestone in the development of the Canterbury regional economy. Its emphases on a ‘paradigm shift’ and ‘new ways’ for using ‘new water’ are consistent with the core theme of enterprise and innovation that is recommended for CREDS 2009. The momentum created by the public consultations undertaken for the Draft Canterbury Water Management Strategy must not be allowed to dissipate.
Consultation with businesses and stakeholders during the CREDS 2009 update confirmed that there is strong support for action on water storage for irrigation. There has been a large amount of scientific research and public consultation on this issue in recent years, including the Canterbury Water Management Strategy. A key issue raised by participants were delays caused by difficulties in collating existing knowledge on water issues and interpreting the knowledge into authoritative information for private and policy decision-making. In particular, it was suggested that there is a need for reliable integration of existing knowledge on the science of water and its uses (such as groundwater flows, crop needs and environmental impacts), the potential economic benefits and opportunity costs of water use, and the policy mechanisms by which water could be allocated.
5.2 Canterbury Intellectual Property
Table 3.1 recorded the widespread view that Canterbury has strong public and private research institutions, but linkages between researchers and businesses are often weak. The Canterbury Regional Profile and Economic Outlook drew on recent theories of regional economic development to
23
emphasise the importance of creating effective innovation systems to support areas of regional strength. At the centre of an innovation system are entrepreneurs, people who can imagine new commercial possibilities and make things happen. The new possibilities are created by innovators who work to discover new knowledge with potential commercial value. To realise that potential value, the entrepreneur draws on specialist expertise in areas such as access to finance and international marketing. These activities are all underpinned by the system’s policy framework that includes intellectual property laws.
To operate effectively, an innovation system must be capable of protecting new knowledge created by innovators as intellectual property, and then commercialising the intellectual property to take advantage of marketing opportunities. This is hard to achieve if linkages between researchers and businesses are weak.
The Canterbury Development Corporation has taken the lead in creating a Canterbury Innovation System (CRIS) as a new form of regional “soft infrastructure” supported by the resources of Christchurch City and central government funding. CRIS has been designed to ensure that intellectual property created by central government science investment in the region’s leading tertiary institutions and Crown Research Institutes is identified early, screened for commercial viability, shaped and prepared for either licensing by the research offices to third parties, or turned wherever possible into locally based start-up businesses by Powerhouse. While other private angels and investors are encouraged to join and co-invest in this process of company formation, all the processes to this point are reliant mainly on human rather than capital resource inputs.
This development is clearly closely associated with the core theme of enterprise and innovation, but CRIS is currently restricted to Christchurch city and its immediate environs, based on three hubs at the University of Canterbury, Lincoln University and the Christchurch Polytechnic Institute of Technology (see www.cdc.org.nz/main/innovation-and-CDC/). There are opportunities to extend the CRIS model to further hubs, for example in a Canterbury Centre for Innovative Foods, or in the region’s medical research institutions, or in the agricultural engineering sector in rural Canterbury.
5.3 Canterbury Trade Alliance
The first four pairs of strengths and constraints in Table 3.1 are related to the place of Canterbury’s regional economy in international markets. Canterbury is a great place for people to live, but the region is not promoted

24
well, nationally or internationally. The Canterbury economy has long been built on export growth, but access to international marketing expertise is not always easy. There is a wealth of experienced business people in Canterbury, but access to capital, especially venture capital, can be difficult. Canterbury businesses are responsive to market signals, but volatility from overseas and demand seasonality can be issues.
Producing goods or services for export, or providing services to tourists or international students, creates additional management problems compared to a business supplying domestic markets only. Prominent among these at the time of preparing the CREDS 2009 update is the volatility of the New Zealand dollar in foreign exchange markets. At the beginning of 2008, NZ$1 was worth US 77 cents. At the end of the year, it had fallen to 58 cents and fell below 50 cents at the beginning of March 2009. Six months later, the currency had risen 40 per cent to US 70 cents by 11 September.
There is little that can be done regionally about macroeconomic variables such as the exchange rate, but many regions around the world have sought to support their major exporting firms by inviting them to participate in a trade alliance that raises the profile of the region and its businesses internationally while offering the member firms access to specialist marketing and other professional services.
An example of such an initiative is the Trade Development Alliance of Greater Seattle (see www.seattletradealliance.com/). It was created out of a recognition that new local partnerships were necessary to retain the region's future competitiveness in a rapidly changing global economy. The website describes its mission in the following terms:
The mission of the Trade Alliance is to promote Greater Seattle, including
King, Snohomish, and Pierce Counties, as one of North America's premier
international gateways and commercial centers. To this end, the Trade
Alliance has developed a strategic promotion plan to enhance the identity of
Greater Seattle in targeted world markets through marketing publications,
trade missions, and other activities. The Trade Alliance is establishing
working relationships with export promotion, international tourism, and
international trade and investment organizations to coordinate this marketing.
It is widely recognised that export businesses in Canterbury need to be enterprising and innovative to maintain and strengthen their positions in global markets. A Canterbury Trade Alliance based on the Seattle model is a possible mechanism for implementing and supporting the necessary enterprise and innovation.

25
5.4 Canterbury Connectivity (especially Broadband)
Table 3.1 recorded that Canterbury has good infrastructure, including the airport and seaports, but infrastructure planning is disjointed, and rural broadband is expensive. This last issue was supported in the Canterbury Regional Profile and Economic Outlook (p. 50) with data from a December 2006 Statistics New Zealand survey showing that the use of broadband in the rural areas of Canterbury lay between 13 and 15 percentage points below the use in the main urban areas.
Previous analysis by the Canterbury Development Corporation confirms the importance of reliable and affordable broadband networks for commercial enterprises, research institutions and residential consumers. Central Government has recently announced a number of initiatives to increase investment in broadband infrastructure nationally. This includes a $1.5B plan to roll out fibre to the home aiming to cover 75% of homes within 10 years, and a decision to allocate a further $48m for rural broadband connectivity. The implementation of these initiatives in Canterbury requires sound technical and business planning. In this context, three discrete broadband infrastructure needs for the region have been identified under the headings of urban broadband, rural broadband and the national backbone.
Element One: Urban broadband
Central Government is currently seeking comment on the proposal with a Request for Proposals due to be released by Crown Fibre Investment Company (CFIC) in October/November this year. Accordingly the three main urban centres of Christchurch, Ashburton and Timaru consider that those communities which can reticulate FTTH ahead of others will create a (temporary but significant) competitive advantage and longer term will have an infrastructure which will be essential to quality of life and economic prosperity. Any FTTH investment needs to be a long term intergenerational undertaking which ensures that investment follows known demand. However the government have made it clear they wish to accelerate the investment cycle and are prepared to invest ahead of the demand curve to ensure New Zealand has FTTH for 75% of new Zealanders within 10 years.
Fibre to the Home (FTTH) is a 6-8 year project requiring significant product and service development to achieve. In Ashburton a network of some 250kms at a total cost of around $40m is suggested, in Timaru some

26
400kms, costing around $70m, and in Christchurch 3,000km of network costing around $500m.
To ensure these three centres are ready to submit a proposal to Government later this year requires the preparation of full business cases. The business cases would cover market analysis and product development, a business model, service delivery model, core metro technology architecture and technology, access technology architecture and high level access network design. The total cost of fully developing the business cases is estimated to be around $200,000.
Element Two: Rural Broadband
Access to affordable and high speed broadband is a specific issue in rural areas. On a similar basis to the urban broadband element, it is anticipated that Canterbury’s District Councils will be required to present appropriate business cases to stake a claim for a proportion of the $48m being allocated to rural broadband. Rather than each District Council making its own submission, there is considerable merit in preparing a Canterbury-wide regional submission in association with stakeholder organisations.
Element Three: National Backbone
An obligatory complement to elements one and two is the need for each network to be interconnected together with the capability to offer national and international connectivity.
5.5 Canterbury Tourism
Table 3.1 records that Canterbury offers visitors a range of national iconic attractions, but planning and marketing of tourism are not well integrated regionally. The foundations for better integration have been laid in the www.christchurchnz.com/ website of Christchurch and Canterbury Tourism, which includes an interactive map inviting the viewer to ‘explore Christchurch and its amazing Canterbury backyard’. The research team were also advised that there is a good history of positive cooperation between the regional and district tourism organisations in Canterbury. Nevertheless, there are considerable challenges for tourism in the region, such as uncertainties about the impact of ‘peak oil’ on long-haul aviation, to be addressed regionally rather than locally.
One possible consequence of issues such as ‘peak oil’ is that people will make fewer international tourism trips, but each trip will be longer than is

27
the current standard. Under this scenario, regions can gain a competitive advantage by developing a profile for offering a large number of high quality and varied tourism experiences. Different segments of the market will respond to different scales, so that Canterbury, the South Island and New Zealand each needs to develop integrated tourism strategies highlighting the diversity and quality of its offerings to international visitors.
One component that is often included in tourism strategies draws attention to a region’s distinctive cuisine. A local example recently developed is the the North Canterbury Food and Wine Trail (see its resulting website at www.foodandwinetrail.co.nz). This was launched in 2008 with a very good uptake from 40 food and wine tourism operators across the three Districts of North Canterbury. Canterbury is in an ideal position to gain from a collective effort to develop food and beverage tourism more widely in the region. The key is to promote a strong point of difference compared to other regions in New Zealand but also to develop the sector’s capability to market itself coherently, following the example of the already operational North Canterbury food and wine trail.
There are other regional themes and unique selling propositions that will continue to build on the Canterbury brand. These include: Scenic Touring Route; Relaxation and Health; Food & Beverages; Ecotourism; Adventure Activities; Heritage and Culture; and Rural Heartland.

Canterbury Regional
Economic Development
Strategy, 2009
Part II: Implementation Plan
Canterbury Economic Development Co. Ltd.
(25 September 2009)

2
Acknowledgements
The CREDS 2009 Update project was funded by New Zealand Trade and Enterprise through Canterbury Economic Development Co. Ltd. This report was prepared by a research team comprised of Heather Warwick (Enterprise North Canterbury), Toni Brownie (Canterbury Development Corporation), Lesley Symington, Claire Bryant and Barbara Bately (Selwyn District Council), Rob Brawley (Enterprise Ashburton), Wendy Smith and Andrea Miller (Aoraki Development Trust), and Caroline Saunders and Paul Dalziel (AERU, Lincoln University). The researchers were assisted at different stages by Annie Paterson (Kaikoura District Council), Irvine Paulin (NZTE), Bill Luff, Gerard Quinn and Simon Worthington (Canterbury Development Corporation) and Hayley Neil (AERU). Feedback on earlier drafts was provided by the Board of CED Co, with particular assistance from Board Member, Murray Cleverley, and the Administrative Agent, Stacey Scott. The research for this update involved a large number of individual interviews, focus groups, telephone surveys and feedback meetings with a wide range of people throughout the Canterbury region. Although too many to name individually, the research team is very grateful to everyone who shared their expertise and time over the last six months.

iii
Part II: Implementation Plan
Contents
Acknowledgements ii
Contents iii
List of Tables in Part II v
List of Figures in Part II v
1. Introduction 1
2. Implementation Plan 4
3. Communication Plan 6
4. Evaluation Plan 7
Appendix 1: The Process of Preparing CREDS 9
Appendix 2: Desired Community Outcomes 14
Appendix 3: Existing Strategies in Canterbury 17
References for Part I and Part II 24

iv
List of Tables in Part II
1.1 The CREDS Vision and Goals 1
1.1 The CREDS Goals and Objectives 2
1.2 The CREDS Priority Key Areas 3
2.1 Timetable for the Implementation Plan 5
A.1 Strategic Economic Development Planning in Canterbury 17
List of Figures in Part II
A.1 The MED Process for a Regional Development Strategy 10

v
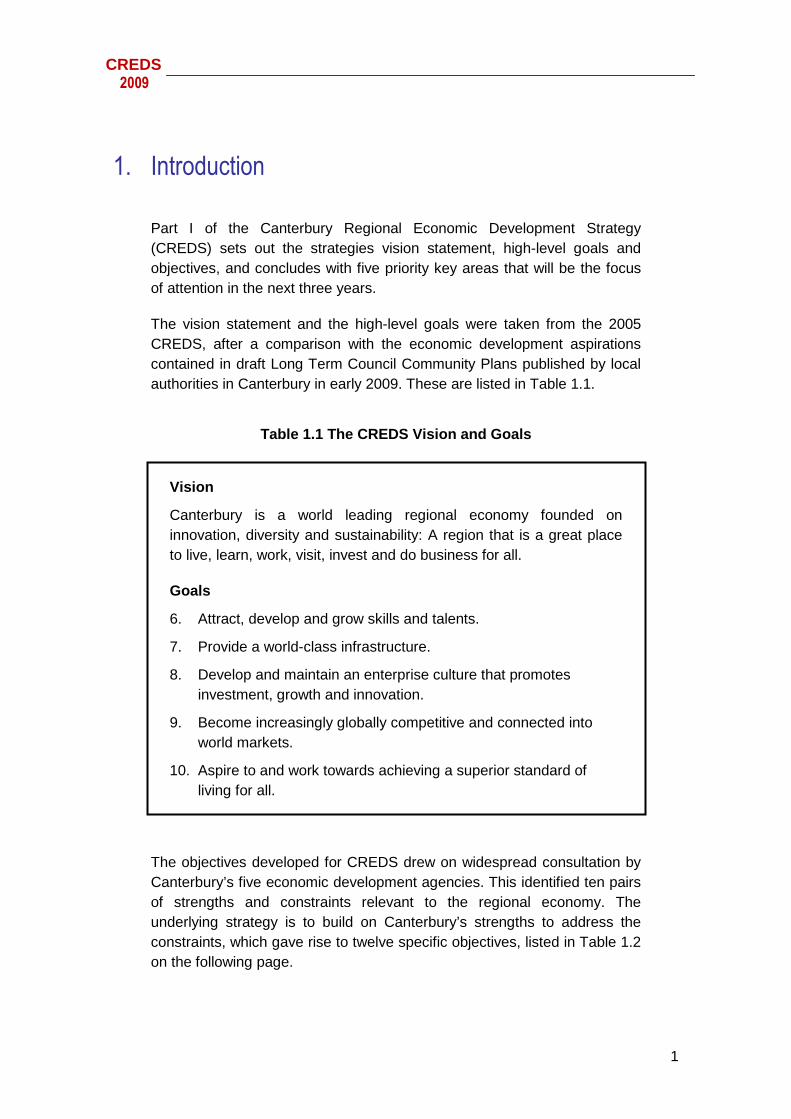
CREDS
2009
1
1. Introduction
Part I of the Canterbury Regional Economic Development Strategy (CREDS) sets out the strategies vision statement, high-level goals and objectives, and concludes with five priority key areas that will be the focus of attention in the next three years.
The vision statement and the high-level goals were taken from the 2005 CREDS, after a comparison with the economic development aspirations contained in draft Long Term Council Community Plans published by local authorities in Canterbury in early 2009. These are listed in Table 1.1.
Table 1.1 The CREDS Vision and Goals
Vision
Canterbury is a world leading regional economy founded on innovation, diversity and sustainability: A region that is a great place to live, learn, work, visit, invest and do business for all.
Goals
6. Attract, develop and grow skills and talents.
7. Provide a world-class infrastructure.
8. Develop and maintain an enterprise culture that promotes investment, growth and innovation.
9. Become increasingly globally competitive and connected into world markets.
10. Aspire to and work towards achieving a superior standard of living for all.
The objectives developed for CREDS drew on widespread consultation by Canterbury’s five economic development agencies. This identified ten pairs of strengths and constraints relevant to the regional economy. The underlying strategy is to build on Canterbury’s strengths to address the constraints, which gave rise to twelve specific objectives, listed in Table 1.2 on the following page.

CREDS
2009
2
Table 1.2 The CREDS Goals and Objectives
Goal 1: Skilled and talented workforce
Objective 1.1 Firms in Canterbury are able to employ all the skilled and unskilled labour they need to grow.
Objective 1.2 Potential migrants and investors are easily able to obtain reliable information about the quality of life in Canterbury.
Goal 2: World-class infrastructure
Objective 2.1 Canterbury producers are able to increase yields as a result of well planned investment in water storage.
Objective 2.2 Planning for infrastructure investment in Canterbury is integrated across the different types of investment.
Goal 3: An enterprise culture promoting investment and innovation
Objective 3.1 Regional innovation systems include strong linkages between Canterbury researchers and businesses.
Objective 3.2 Effective systems support Canterbury firms obtaining access to capital, especially venture capital.
Objective 3.3 Central, regional and local governments do not impose unjustified regulations and compliance costs on Canterbury businesses.
Goal 4: Globally competitive firms connected into world markets
Objective 4.1 Canterbury businesses with export potential are easily able to access expertise in international marketing.
Objective 4.2 Canterbury businesses are able to manage commercial volatility from overseas and seasonality of demand.
Objective 4.3 The planning and marketing of Canterbury tourism is integrated regionally.
Goal 5: Superior standard of living for all
Objective 5.1 All Canterbury citizens are able to participate in quality education, training or employment.
Objective 5.2 Canterbury citizens in rural districts are able to access quality services such as affordable broadband.
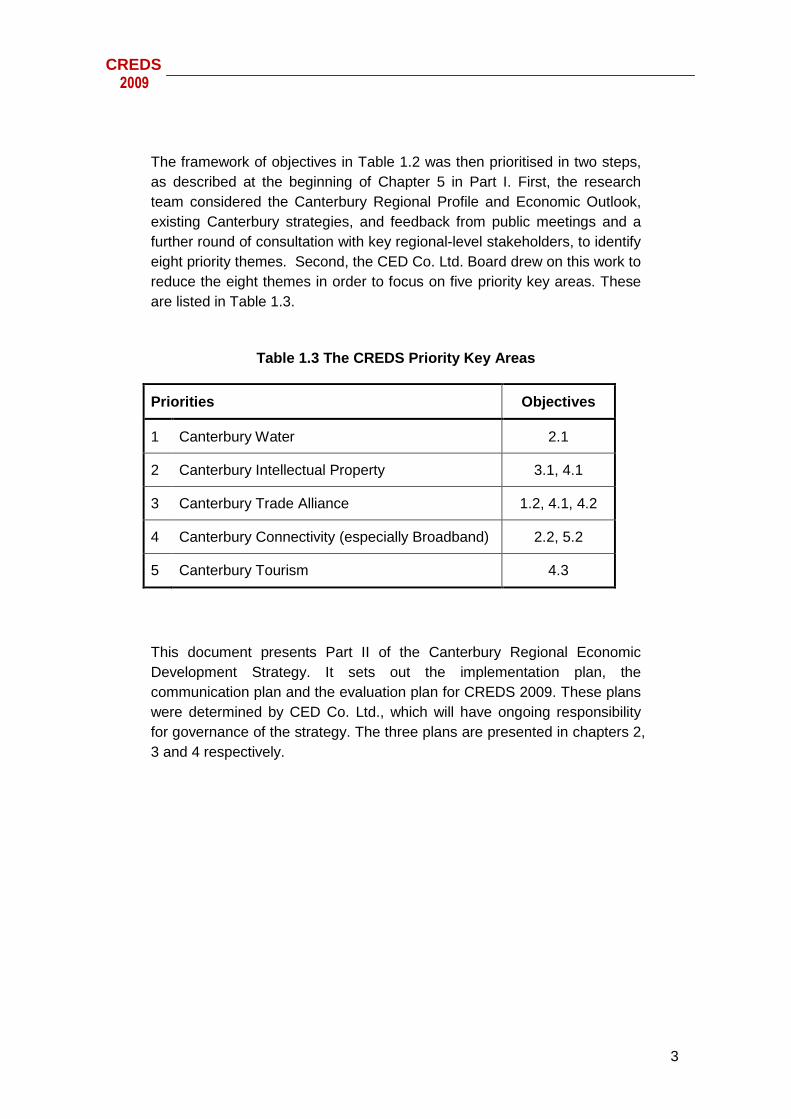
CREDS
2009
3
The framework of objectives in Table 1.2 was then prioritised in two steps, as described at the beginning of Chapter 5 in Part I. First, the research team considered the Canterbury Regional Profile and Economic Outlook, existing Canterbury strategies, and feedback from public meetings and a further round of consultation with key regional-level stakeholders, to identify eight priority themes. Second, the CED Co. Ltd. Board drew on this work to reduce the eight themes in order to focus on five priority key areas. These are listed in Table 1.3.
Table 1.3 The CREDS Priority Key Areas
Priorities Objectives
1 Canterbury Water 2.1
2 Canterbury Intellectual Property 3.1, 4.1
3 Canterbury Trade Alliance 1.2, 4.1, 4.2
4 Canterbury Connectivity (especially Broadband) 2.2, 5.2
5 Canterbury Tourism 4.3
This document presents Part II of the Canterbury Regional Economic Development Strategy. It sets out the implementation plan, the communication plan and the evaluation plan for CREDS 2009. These plans were determined by CED Co. Ltd., which will have ongoing responsibility for governance of the strategy. The three plans are presented in chapters 2, 3 and 4 respectively.

CREDS
2009
4
2. Implementation Plan
Responsibility for implementing the Canterbury Regional Economic Development Strategy has been accepted by CED Co. Ltd, which is a Council Controlled Organisation wholly owned by the region’s ten territorial authorities. It is governed by a Board comprised of ten directors, with three directors from the District Councils of North Canterbury, of Mid Canterbury and of South Canterbury, one director from the Christchurch City Council, one director from Environment Canterbury, one director from Te Rūnanga o Ngāi Tahu, and four directors representing industry. Its Draft Statement of Intent 2009/2010 describes the background of CED Co. as follows.
Background
The core purpose and mission of the Canterbury Economic Development Co
Ltd (CED Co Ltd) is to act as a promoter for transformational economic
development projects that will benefit Canterbury and to utilise the
Canterbury Regional Economic Development Strategy (CREDS) to
coordinate strategic economic development initiatives. CED Co Ltd will act
as a liaison with Central Government regarding economic development on
behalf of the councils and community of Canterbury.
In line with its mission, CED Co. Ltd. will issue a Request for Proposals for transformational economic development projects that address the priority key areas and objectives listed in Table 1.3. The Administration Agent for CED Co. is responsible for preparing this Request for Proposals, including setting out the criteria by which proposals will be evaluated.
Proposals may be submitted by any interested person or organisation. Each proposal will be sent to the submitter’s local economic development agency; the region’s five economic development agencies (EDAs) will coordinate this process. After the closing date for proposals has passed, the EDAs will prepare reports for CED Co. that evaluate the proposals against the criteria set out in the Request for Proposals. These reports will be considered by CED Co. at a workshop convened for this purpose. The workshop will rank the proposals, some of which may be selected (within the total available budget) to be forwarded to NZTE for ratification under the Regional Strategy Fund. The timetable for this Implementation Plan is presented in Table 2.1 below. The timetable for implementation beyond the January workshop will be advised once projects have been selected.

CREDS
2009
5
Table 2.1 Timetable for the Implementation Plan
Milestone Date
1 Final CREDS Report Approved 30 September 2009
2 Issue of Request for Proposals 30 September 2009
3 Closing Date for Project Proposals 30 November 2009
4 Evaluation of Proposals by EDAs 31 December 2009
5 Workshop for CED Co. Board 22 January 2010

CREDS
2009
6
3. Communication Plan
Responsibility for communicating the Canterbury Regional Economic Development Strategy has been accepted by CED Co. Ltd. The primary means of communication will be through dedicated websites hosted by the participating local authorities and the five economic development agencies of Canterbury. These websites will include the following material:
• The Canterbury Regional Profile and Economic Outlook
• CREDS 2009, Part I: Vision and Objectives
• CREDS 2009, Part II: Implementation Plan
• The Request for Proposals issued by CED Co. Ltd.
• Links to the region’s economic development agencies.
• Details of the projects selected to proceed under CREDS.
• Annual reports on the selected projects.
• Other relevant material and links determined by CED Co. Ltd.
There has been a large number of business people and other stakeholders who have taken part in the consultations leading to the preparation of this strategy. The AERU and the economic development agencies will distribute electronic copies of CREDS 2009 to these people as part of the process of honouring the stakeholders’ contributions.

CREDS
2009
7
4. Evaluation Plan
Responsibility for evaluating the Canterbury Regional Economic Development Strategy has been accepted by CED Co. Ltd. The CED Co. Administration Agent will monitor the deliverables agreed for each of the projects selected for implementation under CREDS. This will include the preparation of a public annual report by the manager of each project, with the reports being published on the CREDS 2009 websites. The Administration Agent will summarise the progress of the projects in a report prepared for the Board of CED Co. Ltd., which will also be submitted to New Zealand Trade and Enterprise once approved by the Board.

CREDS
2009
8
Appendices

CREDS
2009
9
Appendix 1: The Process of Preparing CREDS
The update of CREDS was prepared using the process developed by New Zealand Ministry of Economic Development and published on its website at www.med.govt.nz/strategy-development/. A summary flowchart of the process is reproduced on the following page as Figure A.1. It is comprised of seven phases.
Phase 1 Mobilise
In order to engage with the whole region, responsibility for updating CREDS was given to a research team that brought together the resources of the AERU research unit at Lincoln University and the experience, expertise and networks of the economic development agencies of North Canterbury, Christchurch City, the Selwyn District, the Ashburton District and South Canterbury. Within this partnership, each of the economic development agencies agreed to consult with key businesses and stakeholders in their district or city, while the academic partners agreed to analyse statistical data and strategic documents relevant to economic development in the Canterbury region.
Phase 2 Research
Any regional economic development strategy must build on the strengths of its existing businesses and industries. In New Zealand, the policy focus is on firms who export, since other firms are constrained by the size of New Zealand’s relatively small domestic market. Consequently, the AERU prepared a report to assess Canterbury’s strengths and opportunities for export-based economic development, based on the region’s social, economic, environmental and cultural resources.
The assessment was based on five Economic Base Reports for North Canterbury, Christchurch City, Selwyn, Ashburton and South Canterbury, as well as a separate report for the Canterbury region as a whole. Each of these reports was discussed in draft with the partner economic development agencies, drawing on their expertise and previous studies undertaken over several years, before the final Canterbury Regional Profile and Economic Outlook was completed in March 2009. This final report highlighted important features of the regional economy and so helped to identify the region’s positioning in the national economy and its key regional drivers.

CREDS
2009
10
Fig
ure
A.1
The
ME
D P
roce
ss fo
r a
Reg
iona
l Dev
elop
me
nt S
trat
egy

CREDS
2009
11
Phase 3 Vision
In 2009, Environment Canterbury, the Christchurch City Council and the eight District Councils in the Canterbury region prepared draft Long Term Council Community Plans (LTCCPs). These documents include summaries of desired community outcomes, sometimes accompanied by a concise vision statement. Consequently, the research team was able to compare the existing CREDS with these draft LTCCPs. It concluded that the vision statement and high level goals of CREDS 2005 are broadly supported by the community outcomes summaries in the 2009 draft LTCCPs. This is explained in more detail in chapter 2 of Part I of this strategy.
Phase 4 Analyse
The strategy for consulting with business networks was prepared at a meeting of the AERU research team and the EDA partners in Ashburton on 3 February 2009. It was agreed that all EDAs would use the same semi-structured interview guide as the foundation for their consultations. The guide was prepared by the AERU incorporating feedback from the EDA partners. It was also agreed that each EDA would have room for flexibility to obtain the right information to inform its part of the Canterbury strategy.
The consultations in the Districts typically involved one-on-one interviews or public meetings. Heather Warwick of Enterprise North Canterbury organised a series of interviews with 20 businesses and 10 stakeholders in five key sectors of Hurunui and Waimakariri, with a report-back meeting held on 18 June. Annie Paterson (Tourism and Economic Development Officer of the Kaikoura District Council) undertook similar interviews in Kaikoura. Lesley Symington and Barbara Bately of the Selwyn District Council undertook face-to-face interviews stratified by sector groups and firm size, involving about 30 interviews, with a report-back meeting held on 19 August.
Rob Brawley of Enterprise Ashburton organised a series of professionally facilitated public meetings to discuss the District’s economic development. Participants in the meetings include representatives from social agencies, social services, businesses and District Councillors. Wendy Smith and Andrea Miller identified and interviewed 12 key businesses and 11 key stakeholders in the three Districts of South Canterbury, with a focus on sectors that have strong export potential.
CREDS
2009
12
In Christchurch City, Toni Browne at the Canterbury Development Corporation developed a comprehensive consultation strategy that included commissioning a telephone survey of 600 Christchurch businesses and involving the CDC’s sector liaison staff in undertaking individual interviews with key businesses in their industry. CDC also hosted a breakfast meeting to give feedback on 16 July 2009.
While the initial consultations were taking place the AERU research team identified existing strategic documents relevant to the economic development of Canterbury. A description of these strategic documents is presented in Appendix 3 to this report. The material from the district and city consultations, and material from the existing strategies, were analysed by the AERU to identify strengths and constraints in the Canterbury regional economy. Further work by the full research team led to the strengths and constraints presented in chapter 3 of Part I of this report.
Phase 5 Prioritise
The work to identify priorities for CREDS 2009 took place in three stages. The first stage was to prepare a comprehensive set of objectives (or strategic themes) based on the strengths and constraints identified in Phase 4. After an initial discussion at a meeting of the full research team on 14 July, this stage of the work was led by Toni Brownie with input from all the other EDAs. The results of that work are presented in chapter 4 of Part I of this report.
The second stage involved selecting projects that the research team considered would best meet the aim of the CREDS update, arising from the consultations with businesses and other key stakeholders. The AERU prepared a draft set of selection criteria, which were considered and applied in a meeting of the full research team on 31 July 2009. Further decisions were made at a meeting of the full research team on 11 August 2009. After further consultation with regional stakeholders, details were finalised on eight selected projects, which are explained in Appendix 4.
In the third stage, the AERU sent a draft document to CED Co. Ltd. on 17 August 2009, and made a presentation to the CED Co. Board on 25 August. The draft document included the framework of objectives set out in chapter 4 of Part I of this report, as well as the eight selected projects that are now explained in Appendix 4. After considering this material, the CED Co. Board determined five key areas to be emphasised as of importance to the Canterbury region. These five areas are listed in chapter 5 of Part I.
CREDS
2009
13
Phase 6 Implementation Plan
At the presentation to the CED Co. Board on 25 August, the AERU raised the question of governance structure for the implementation phase of CREDS 2009. The Board subsequently advised that the implementation process will be managed by CED Co. Ltd. and coordinated through the five Canterbury economic development agencies. It also provided further details on the strategy’s implementation process (including the communication plan). The CED Co. Implementation Plan is presented in chapters 2 and 3 of Part II of this report.
Phase 7 Evaluate Update
CED Co. Ltd. also explained that responsibility for evaluating progress under CREDS would belong to the CED Co Administration Agent. This is reported in chapter 4 of Part II.

CREDS
2009
14
Appendix 2: Desired Community Outcomes
In 2009, Environment Canterbury, the Christchurch City Council and the eight District Councils in the Canterbury region prepared draft Long Term Council Community Plans. These documents include summaries of desired community outcomes (sometimes accompanied by a concise vision statement), which are repeated below:1
Environment Canterbury
Waitaha
Te whenua mataora
Kia whakaora te taiao momona
Ma tatou hei whakawehi ai
Canterbury...
a living landscape
rich in natural resources
a flourishing environment
that we all respect and enjoy.
The community outcomes are the outcomes that the Canterbury community
has decided are a priority in terms of the present and future social, economic,
environmental and cultural well-being of the community.
Environment well-being: Water is in a healthy condition, clean and plentiful
enough to support life; Air, beaches and ocean and land are all in a healthy
condition; Business and farming activities do not harm the environment;
Environment, in general, is to be looked after; Rural land is mainly for
farming and horticulture; Native plants and animals can thrive.
Economic well-being: Incomes provide good standard of living; People in
work; A strong economy; Alternatives for moving people and freight.
Social well-being: Good healthcare for all; Everyone has access to good
education; People feel safe at all times; Community services that meet
people’s needs; Everyone has access to acceptable standards of housing;
Transport and travel needs are met; Easy to travel around cities and towns
and easy access to shops and other community services.
Cultural well-being: A good place to live for all cultures; Opportunity to
participate in sport and recreation; Public parks and reserves are plentiful;
Access to open spaces and wilderness areas; Recreational needs are met;
1 The Waitaki community outcomes have not been included here, since the bulk of
the Waitaki population live in Oamaru, which is outside the Canterbury region.

CREDS
2009
15
Opportunity to participate in arts and cultural activities; Canterbury has
attractive places to live in; Heritage buildings and sites are protected.
Kaikoura District Council
The Kaikoura community displays responsible custodianship of its unique
natural, social, cultural and built environmental resources by ensuring the
sustainable utilisation and management of these resources. It is a
community that treasures the present small-scale town atmosphere and
retains and enhances this coastal village character.
Our community has identified 8 key Community Outcomes: 1. Sustainable
Development; 2. Quality Water & Wastewater Systems; 3. Safe, Efficient
Transport Network; 4. Opportunities for Quality Education & Employment; 5.
A Quality Standard of Housing; 6. Environmental Protection & Enhancement;
7. Affordable Access to Quality Community Facilities; 8. Community
Involvement in Planning the Future and Managing the Present.
Hurunui District Council
“Hurunui Wellness” is both a way of life and a planning foundation, oriented
towards optimal wellbeing in which the body, mind and spirit are integrated
by individuals (be they residents or visitors), by communities, and by the
Hurunui District at large to live more fully within the human and natural
environments. Or, in everyday language “In Hurunui, we live the lives the
rest of the world would love to live”.
For practical purposes, Hurunui Wellness can be divided into nine strategic
planning dimensions: Social (well-being); Cultural (well-being); Economic
(well-being); Environmental (well-being); Landscape & Outlook; Individual
and Community Lifestyle; Education and Skills Development; Heritage &
Tradition; Infrastructure.
Waimakariri District Council
The first six statements are the Outcomes that the community told us are
priorities. There is a safe environment for all. Transport is accessible,
convenient, reliable, affordable and sustainable. There is sufficient clean
water to meet the needs of communities and ecosystems. Businesses in the
District are diverse, adaptable, and growing. Core utility services are
provided in a timely, sustainable and affordable manner. The community’s
needs for health and social services are met.
Christchurch City Council
Our future Christchurch is a world-class boutique city, where people enjoy a
sustainable lifestyle, a healthy environment, a strong economic base and the
diverse landscapes of the city and peninsula.
CREDS
2009
16
Our residents want Christchurch to be: A safe city; A city of inclusive and
diverse communities; A city of people who value and protect the natural
environment; A well-governed city; A prosperous city; A healthy city; A city
for recreation, fun and creativity; A city of lifelong learning; An attractive and
well-designed city.
Selwyn District Council
The community outcomes to which we are all working are: a safe place to
live, work and play; a clean environment; a rural district; a healthy
community; an educated community; a prosperous community; an
accessible district; a community which values its culture and heritage.
Ashburton District Council
Ashburton District’s community outcomes: A thriving and diverse local
economy that provides the foundation for a quality lifestyle; Natural and
developed environments are sustained for the enjoyment of current and
future generations; A community with a strong sense of identity and heritage,
which welcomes new residents and encourages diversity; A community with
access to quality education and life long learning; Healthy, active people
enjoying a good quality of life in a caring and safe community; A community
with access to a variety of cultural, recreational and heritage experiences
and facilities that enrich our quality of life; A community that contributes to
improving our quality of life through democratic participation.
Timaru District Council
Common themes and ideas were identified and analysed, with seven
community outcomes identified: Quality infrastructure that meets community
needs; Strong, prosperous and innovative economy; Healthy, educated and
proud people; Healthy, valued and accessible environment; Attractive and
desirable district; Vibrant, safe and caring communities; Balanced and
sustainable water usage.
Waimate District Council
District is about Council and community working together. Our District values,
protects and enjoys the natural environment. Our District is underpinned by
a strong, successful and innovative economy. Our District is safe, healthy
and supportive of long-term learning. Our District promotes recreation, fun
and creativity.
MacKenzie District Council
The people of the Mackenzie want: an attractive and highly valued natural
environment; a thriving economy; a democracy which upholds the rights of
the individual; a fit and healthy community; safe, effective and sustainable
infrastructure; and a supportive and contributing community.

CREDS
2009
17
Appendix 3: Existing Strategies in Canterbury
Table A.1 lists the central government and local government agencies whose strategic work programmes were considered during the preparation of this updated CREDS. The first column names the agency and the second column names its major programme or unit that focuses on preparing regional economic development strategic plans. This appendix describes the key high-level strategies published by these agencies.
Table A.1 Strategic Economic Development Planning i n Canterbury
Agency Programme or Unit
Regional Level
Ministry of Economic Development NZTE Regional Development Team
Ministry of Social Development Regional Commissioner
Tertiary Education Commission Regional Facilitation Programme
Department of Labour Regional Labour Market Reports
Environment Canterbury (ECan)
CED Co. Ltd. CED Co. Administration Agent
City or District Level
Christchurch City Council Canterbury Development Corporation (CDC)
Kaikoura District Council Tourism and Economic Development Officer
Hurunui District Council
Waimakariri District Council Enterprise North Canterbury (ENC)
Selwyn District Council Economic Development Officer
Ashburton District Council Enterprise Ashburton
Timaru District Council
Waimate District Council
Mackenzie District Council
Aoraki Development Trust (ADT)
Note: This list focuses on strategic planning and so does not include agencies such as the Canterbury Employers’ Chamber of Commerce or Te Rūnanga o Ngāi Tahu whose work on behalf of members promotes the region’s economic development. Nor does it include large institutions such as the region’s two universities and two polytechnics that also play critical roles in regional economic development.

CREDS
2009
18
Regional Policy Statement
The Resource Management Act 1991 requires the Regional Council to prepare a Regional Policy Statement, providing an overview of the region’s resource management issues. The first Regional Policy Statement was approved on 5 June 1998 (Environment Canterbury, 1998) and is being updated in 2009. As part of the review, the council commissioned a report on climate change and its implications for policy. This noted that the Canterbury economy is heavily based on its ability to produce from its land resources, making the local economy particularly vulnerable to the effects of climate change (O’Donnell, 2007, p. 34). At the next layer of local government, City and District Plans address the sustainable management of resources in the city or district to which they relate and set out how councils intend to deal with their functions under the Resource Management Act.
Canterbury Regional Economic Development Strategy, 2005
New Zealand Trade and Enterprise funded the update in 2005 of the Canterbury Regional Economic Development Strategy (CREDS) that was first produced in 2000. CREDS 2005 sought to complement a high-level ‘top-down’ strategic approach with a sub-regional ‘bottom-up’ focus on local issues within the constituent territorial authorities of Canterbury. CREDS 2005 therefore identified ten major regional issues and opportunities, and supplemented this regional analysis with stand-alone strategic plans at the district or city level for North Canterbury, Christchurch, Banks Peninsula (which has since merged with Christchurch City), Selwyn, Ashburton and South Canterbury.
Regional Land Transport Strategy, 2008-2018
The Regional Land Transport Strategy was prepared to meet the requirements of the Land Transport Act 1998, as amended by the Land Transport Management Act 2003. It identifies the region’s transport needs and creates a strategy to provide for the future land transport system of Canterbury, balancing economic, social and environmental considerations (Environment Canterbury, 2008a, p. 1). The strategy is accompanied by the Canterbury Transport Regional Implementation Plan 2008-2038 (TRIP) that provides an implementation framework for transport in the region and assists with providing a coordinated approach to delivering the strategy (idem, p. 53).

CREDS
2009
19
Draft Canterbury Water Management Strategy, 2009
In 1998, the Ministry of Agriculture and Forestry, Environment Canterbury and Ministry for the Environment commissioned Lincoln Environmental to prepare the Canterbury Strategic Water Study (CSWS), subsequently published as Morgan et al. (2002). This has led to further work to explore the feasibility of different water storage options in different parts of Canterbury (Jenkins, 2007). In 2004, the Canterbury Mayoral Forum (which is comprised of the mayors and chief executives of the regional, city and district councils in Canterbury) commissioned CSWS Stage 2 to identify potential water storage sites (Dark, Bright and Sigle, 2008). In 2006, the Forum commissioned further work to begin evaluating the environmental, social, cultural and economic impacts of the different water storage options (Whitehouse, Pearce and McFadden, 2008). On 3 September 2009, the Draft Canterbury Water Management Strategy was released for public comment (see www.canterburywater.org.nz/).
Canterbury Regional Energy Strategy 2009
The Canterbury Regional Energy Strategy Project (CRESP) was set up by the Canterbury Regional Energy Forum to promote discussion, collaboration and planning by local government, energy companies and other interested parties with the aim of supporting the region’s economic progress and other goals by making its energy supply more secure, reliable and affordable (Environment Canterbury, 2008b, Appendix II). As part of this project, the New Zealand Centre for Advanced Engineering (2009) was commissioned to report on the range of possibilities for regional energy investment and energy demand reduction. A draft Canterbury Regional Energy Strategy was close to completion at the time of writing this report (Bradshaw and Nicholas, 2009).
Greater Christchurch Urban Development Strategy, 20 07
The Greater Christchurch Urban Development Strategy (UDS) is an initiative of Environment Canterbury, the Christchurch City Council, the Selwyn District Council, the Waimakariri District Council and Transit New Zealand. The project started in 2004 with public consultation that received over 3,250 submissions on options for managing growth in a sustainable way. The strategy was published in 2007. It adopts an overarching principle of ‘sustainable prosperity’ that includes a specific economic objective to encourage prosperous economies through four categories of actions: population and labour force; business land; activity centres and corridors; and business infrastructure (UDS Forum, 2007, pp. 14-15 and pp. 92-102).
CREDS
2009
20
Christchurch, Rolleston and Environs Transportation Study, 2007
The Christchurch, Rolleston and Environs Transportation Study (CRETS) began in early 2002, commissioned by Transit New Zealand, the Selwyn District Council, the Christchurch City Council, Environment Canterbury and Christchurch International Airport Ltd. The aim of the study is to produce a transport strategy that is robust and flexible to accommodate a number of future urban growth possibilities in the Christchurch to Rolleston area, such as the projected growth patterns prepared under the Greater Christchurch Urban Development Strategy. It also considers in detail a range of public passenger transport and cycle opportunities within the area (Connell Wagner, 2007, p. 6).
Christchurch Visitor Strategy, 2007-2017
The Christchurch Visitor Strategy, 2007-2017 was developed by the Christchurch City Council in partnership with Christchurch and Canterbury Tourism, Canterbury Development Corporation, the Visitor Industry of Christchurch and Ngāi Tahu. The Strategy describes Christchurch as the hub of tourism in the South Island, whose airport, port, scenic rail and road connections bring more than 9 million visitors a year into the city. It explains that tourism is now the largest export industry in Christchurch and Canterbury, employing 12 per cent of the Christchurch workforce and over half of Akaroa’s workforce. The strategy therefore aims to provide a basis for co-ordinating tourism stakeholder efforts based on clearly defined market needs and opportunities, and by promoting innovative and sustainable responses to predicted growth (CCC, 2007, p. 4).
Draft Ashburton District Visitor Strategy, 2009-201 9
The Draft Ashburton District Visitor Strategy similarly notes that tourism has grown in importance in the District, supported by investment in tourism infrastructure and attractions ventures that provide rewarding employment options for the community and make the local economy stronger and more diverse ADTDB (2009, p. 4). The strategy aims to address three core issues: enhancing the visitor’s experience; connecting with the rest of Canterbury; and reducing seasonality (currently focused on the ski season).

CREDS
2009
21
Education Christchurch & Canterbury
Education Christchurch & Canterbury is a membership based charitable trust that was first established in 1997. It supports education and pastoral care providers in Canterbury, and is responsible for promoting the ‘Canterbury education experience’ to international students and improving the quality standard of courses and support services offered in the region. It is an initiative by the education sector in Christchurch and Canterbury to work collaboratively to ensure that international students not only receive a quality education but that their everyday needs and expectations of their experience are met and exceeded. It maintains a website that promotes Christchurch (and its environs) and explains study options in the region; see http://www.educationchristchurch.com/Home.
Education South Canterbury
The vision of Education South Canterbury is ‘to be the catalyst for networking and co-operation amongst educational organisations and the South Canterbury business community in order to promote this region as a world-class centre for international education’. It maintains a website at http://studysc.org.nz/. Current members include Aoraki Polytechnic and ten schools.
Industry Cluster Strategies
The Canterbury Regional Profile and Economic Outlook noted (pp. 37-39) that several industry clusters have been identified by public and private agencies over the last decade. These include electronics, software, furniture, international education, nutraceuticals and Lincoln resources identified by New Zealand Trade and Enterprise in 2002, and eight groups set up by the New Zealand Manufacturers and Exporters Association (NZMEA): the Furniture Industry Group; the Exporters Group, the Engineers Industry Group, the Electronics, Software, Information, Communications and Technology Group, the Food Industry Group, the Apparel & Textile Industry Group, the New Product Development Group and the Construction Manufacturing Group. The Waipara Valley Winegrowers in North Canterbury are recognised as a more recent cluster, and the Canterbury Development Corporation is involved in initiatives to establish clusters around innovative foods and medical technologies. Each of these industry clusters typically has an explicit or implicit strategy for promoting the sector’s development.
CREDS
2009
22
Canterbury Labour Market Strategy, July 2008
The Canterbury Labour Market Strategy was prepared under the direction of a governance group chaired by Peter Townsend (Canterbury Employers’ Chamber of Commerce) with representatives from the Christchurch Polytechnic Institute of Technology, the Department of Labour, Enterprise Ashburton, the Tertiary Education Commission, the Ministry of Social Development, the Canterbury Development Corporation and the Christchurch City Council (CLMS Governance Group, 2008). The goal of Strategy is to increase the region’s global competitiveness, tackle skill and labour shortages, and increase productivity, with a focus on the existing workforce. There are five signature projects that initiate the strategy: literacy, language and numeracy in the workplace; migrant attraction, settlement, integration and retention; workplace connections building organisational productivity; regional facilitation including youth transitions; and improving access for employers and workers to work opportunities.
North Canterbury Labour Market Strategy, August 200 8
The North Canterbury Labour Market Strategy recognises that regions close to major metropolitan cities face particular labour market issues. Large numbers of residents commute to the city, while some people in the community may be marginalised from paid work – migrants, women returning to the workforce, the disabled, the young and the ageing (ENC, 2008, p. 2). The strategy identifies eight interlinked areas where action could make a difference: (1) investing in leadership and communication; (2) tapping into the region’s people resource; (3) identifying workplace needs; (4) improving the connections; (5) building workforce capability and capacity; (6) encouraging best workplace practice; (7) addressing the barriers; and (8) assisting business and productivity growth.
MSD Canterbury Regional Plan for 2008/09
The Ministry of Social Development devolves some of its annual planning to it Regional Commissioners for Social Development (Michelle Mitchell in Canterbury). The Commissioner releases details of their Regional Plan each year. The Canterbury Regional Plan for 2008/09 sets out five key priorities to reflect one aim: ‘to help people in the Canterbury region find solutions to live better lives’ (MSD, 2008, p. 20). The Plan also describes the partnerships entered into by the Ministry to pursue its priorities. The five priorities are: give children the best start in life; help young people achieve their potential; enable people to live independent lives; support families and whānau to be safe and resilient; and strengthen communities.
CREDS
2009
23
Annual In-Depth Regional Report: Canterbury, 15 Jul y 2008
The Department of Labour’s annual in-depth regional reports are designed for strategic decisions made at a regional level. They present a range of high-quality data and interpretation to describe the current labour market by region and territorial authority, with the aim of assisting decision makers to identify and achieve long-term development goals for their regions (Department of Labour, 2008, p. 6). The regional reports produced in 2008 focused their attention on youth labour market data.
Regional Statements of Tertiary Education Needs, Ga ps and Priorities in Canterbury, 2008
The Tertiary Education Commission has operated a programme of ‘regional facilitation’ that brings together stakeholders in tertiary education to gain a shared view of tertiary education needs, priorities and gaps at the regional level. The process is led by institutes of technology and polytechnics (ITPs) in each region. Canterbury has two processes of regional facilitation, one led by CPIT (2008) and one led by Aoraki Polytechnic (2008). Both regional statements describe local and national trends in employment and in skill shortages, changes in regional tertiary provision, and feedback from stake-holders about tertiary education issues and priorities.

CREDS
2009
24
References for Part I and Part II
ADTDB (2009) Draft Ashburton District Visitor Strategy, 2009-2019. Ashburton: Ashburton District Tourism Development Board.
Aoraki Polytechnic (2008) Central South Island 2008 Statement of Tertiary Education Needs, Gaps and Priorities. Timaru: Aoraki Polytechnic.
Bradshaw, Ket and Barbara Nicholas (2009) Building Regional Resilience: An Energy Strategy for Canterbury. Christchurch: Environment Canterbury, Draft dated 28 May 2009.
CCC (2007) Christchurch Visitor Strategy 2007-2017. Christchurch: Christchuch City Council.
CLMS Governance Group (2008) Globally Competitive Canterbury: Smart People In Smart Workplaces. Christchurch: Department of Labour.
Connell Wagner Limited (2007) Christchurch, Rolleston and Environs Transportation Study: Executive Summary Vol 1. Report prepared for Transit New Zealand, September.
CPIT (2008) Regional Statement of Tertiary Education Needs, Gaps and Priorities in Canterbury, 2008-2010. Christchurch: Christchurch Polytechnic and Institute of Technology.
CREDS (2005) CREDS, 2005-2015: Creating Tomorrow’s Canterbury. Downloaded 9 September 2009 from: www.cdc.org.nz/main/creds/.
Dalziel, Paul and Caroline Saunders (2009) Canterbury Regional Profile and Economic Outlook. Report produced by the AERU, Lincoln University.
Dark, Andrew, John Bright and Shane Sigle (2008) Canterbury Strategic Water Study (Stage 2). Report prepared for the Canterbury Mayoral Focum by Aqualink Research Ltd. Christchurch: Environment Canterbury, December.
Department of Labour (2008) Annual In-Depth Regional Report: Canterbury. Wellington: Department of Labour.

CREDS
2009
25
ENC (2008) North Canterbury Labour Market Strategy. Rangiora: Enterprise North Canterbury
Environment Canterbury (1998) Regional Policy Statement. Christchurch: Environment Canterbury.
Environment Canterbury (2008a) Canterbury Regional Land Transport Strategy 2008 - 2018. Christchurch: Environment Canterbury.
Environment Canterbury (2008b) Towards an Affordable, Reliable, Resilient and Sustainable Energy System for Canterbury: Environment Canterbury’s Energy Strategy 2007 (2008 Draft Revision). Christchurch: Environment Canterbury.
Jenkins, Bryan (2007) ‘Briefing note to Canterbury Mayoral Forum’. Christchurch: Environment Canterbury, 10 December.
Morgan, Matthew, Vince Bidwell, John Bright, Ian McIndoe and Christina Robb (2002) Canterbury Strategic Water Study. Report No. 4557/1, prepared for Ministry of Agriculture and Forestry, Environment Canterbury and Ministry for the Environment. Lincoln: Lincoln Environmental, August.
MSD (2008) Canterbury Regional Plan for 2008/2009. Wellington: Ministry of Social Development.
New Zealand Centre for Advanced Engineering (2009) Canterbury Regional Statement of Opportunities for Energy. Christchurch: Environment Canterbury.
O’Donnell, Lisa (2007) Canterbury, its People, its Resources: Climate Change. Christchurch: Environment Canterbury.
UDS Forum (2007) Greater Christchurch Urban Development Strategy and Action Plan. Christchurch: Environment Canterbury.
Whitehouse, Ian, Andy Pearce and Grant McFadden (2008) Canterbury Strategic Water Study (CSWS) Stage 3: Multi-stakeholder Evaluation of Water Storage Options: Final Report. Christchurch: Environment Canterbury.

Canterbury Regional
Economic Development
Strategy, 2009
Exemplar Projects
AERU Research Unit, Lincoln University
Aoraki Development Trust
Canterbury Development Corporation
Enterprise Ashburton
Enterprise North Canterbury
Selwyn District Council
(25 September 2009)

CREDS
2009
2
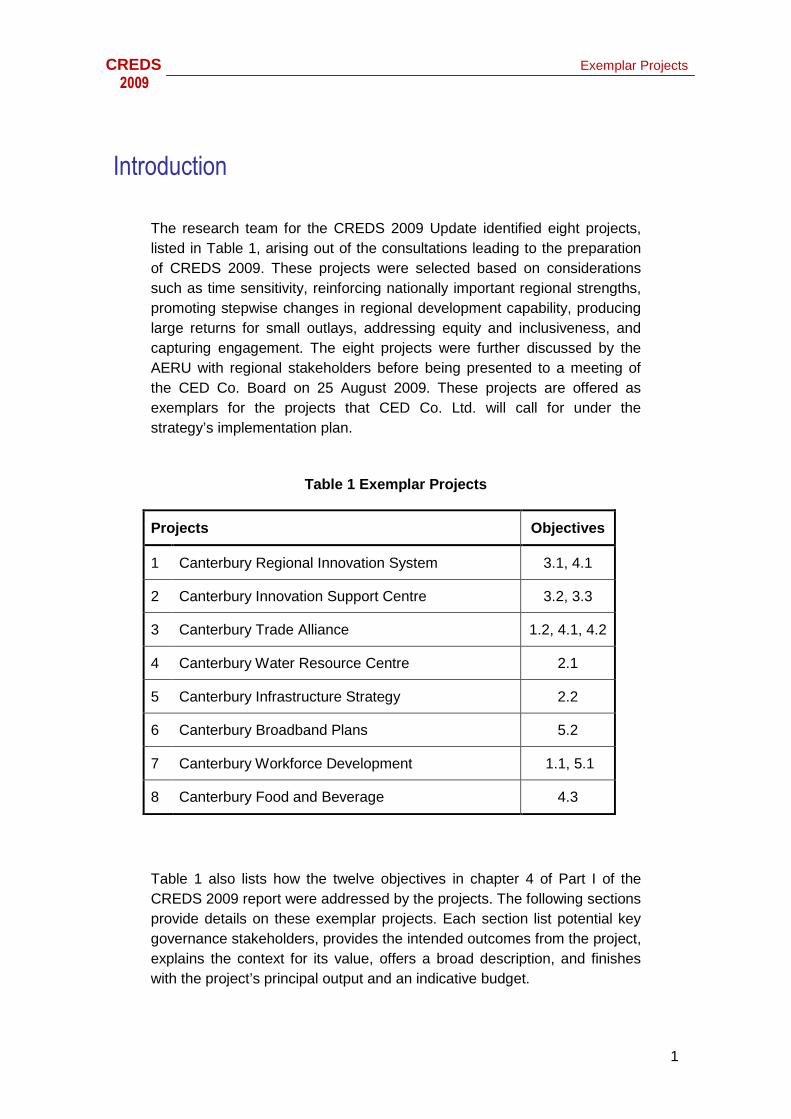
CREDS Exemplar Projects
2009
1
Introduction
The research team for the CREDS 2009 Update identified eight projects, listed in Table 1, arising out of the consultations leading to the preparation of CREDS 2009. These projects were selected based on considerations such as time sensitivity, reinforcing nationally important regional strengths, promoting stepwise changes in regional development capability, producing large returns for small outlays, addressing equity and inclusiveness, and capturing engagement. The eight projects were further discussed by the AERU with regional stakeholders before being presented to a meeting of the CED Co. Board on 25 August 2009. These projects are offered as exemplars for the projects that CED Co. Ltd. will call for under the strategy’s implementation plan.
Table 1 Exemplar Projects
Projects Objectives
1 Canterbury Regional Innovation System 3.1, 4.1
2 Canterbury Innovation Support Centre 3.2, 3.3
3 Canterbury Trade Alliance 1.2, 4.1, 4.2
4 Canterbury Water Resource Centre 2.1
5 Canterbury Infrastructure Strategy 2.2
6 Canterbury Broadband Plans 5.2
7 Canterbury Workforce Development 1.1, 5.1
8 Canterbury Food and Beverage 4.3
Table 1 also lists how the twelve objectives in chapter 4 of Part I of the CREDS 2009 report were addressed by the projects. The following sections provide details on these exemplar projects. Each section list potential key governance stakeholders, provides the intended outcomes from the project, explains the context for its value, offers a broad description, and finishes with the project’s principal output and an indicative budget.

CREDS Exemplar Projects
2009
2
4.1 Canterbury Regional Innovation System
Potential Key Governance Stakeholders: The Canterbury Regional Innovation System governance structure is currently under review by the Canterbury Development Corporation.
Intended Outcomes: (1) Increased average annual economic growth rate in Canterbury; and (2) Higher levels of labour productivity in Canterbury.
Context: The Canterbury Innovation System (CRIS) is a new form of regional “soft infrastructure” supported by the resources of Christchurch City and central government funding. It has been designed to ensure that intellectual property created by central government science investment in the region’s leading tertiary institutions and Crown Research Institutes is identified early, screened for commercial viability, shaped and prepared for either licensing by the research offices to third parties, or turned wherever possible into locally based start-up businesses by Powerhouse. While other private angels and investors are encouraged to join and co-invest in this process of company formation, all the processes to this point are reliant mainly on human rather than capital resource inputs. An outline of the structure of CRIS is shown in the diagram below.

CREDS Exemplar Projects
2009
3
The CRIS uses a low cost incubation model that allows entry to the incubator at an early stage when assistance is required most. It is therefore based on a very low cost structure, with the incubator taking small equity stakes in IP deemed suitable for start up development in return for services provided. Students are employed to provide the extensive human resource requirement whilst achieving valuable learning experiences relating innovation to market opportunities. As most potential IP is not selected for immediate commercialisation, any inexpert performance of the mentored students is relatively unimportant. The critical factor is identification of sufficient IP which does actually have promise, and developing a culture of innovation and commercialisation in Canterbury’s research institutions.
Description: The CRIS currently focuses on Christchurch city and its immediate environs. This project would use its existing structure to trial an agricultural hub based in rural Canterbury. It would employ a project manager to search for innovations in Canterbury agriculture (including agricultural engineering and services) that have potential to be developed as commercialised intellectual property. The creators of the innovations will then have access to the services of the CRIS which include IP protection, business planning, commercialisation strategies, and access to networks and guidance. They will also have access to Powerhouse services such as the creation of new companies ready for investment and full incubation once the technology and business proposition has been developed.
Stage 1: CDC completes the review of the CRIS governance structure.
Stage 2: The governance structure forms an Advisory Group with expertise related to commercialisation of IP in the agriculture.
Stage 3: The governance structure in consultation with the Advisory Group prepares a job description for a contractor who will search for IP in the Canterbury agricultural sector.
Stage 4: The governance structure enters into a contract with an Economic Development Office to provide office space.
Stage 5: The governance structure advertises for, and appoints, the contractor.
Stage 6: The contractor identifies initiative to take forward, reporting to the governance structure assisted by the Advisory Group.
Output: Increased quantity and speed of commercialisation of IP from agricultural innovation.
Indicative Budget: $100,000 for 2 years.

CREDS Exemplar Projects
2009
4
4.2 Canterbury Innovation Support Centre
Potential Key Governance Stakeholders: It is proposed that this project might be governed by the region’s five economic development agencies.
Intended Outcome: Higher per capita income levels throughout Canterbury.
Context: A key message from the feedback obtained during the preparation of this strategy was that innovative projects to promote regional economic development do not advance because of a lack of support for champions of projects that could make a regional difference. This feedback was not about individuals with good business ideas; such people are routinely helped by EDAs and other agencies to put their ideas into practice. Rather the focus was on potential champions in the community with good connections, charisma and vision for an idea that could have a stepwise impact on the local area’s development. It was reported that frequently these people are restricted by time constraints and limited access to specialist resources needed to take the project forward such as developing business plans, dealing with regulations and resource consent processes, and engaging with media attention and community reactions. Thus to provide specialist support, particularly project management support and connections to other professional services, would enable more economic development projects to be explored with minimal time delays.
On a regional level, an initiative by the Canterbury Development Corporation, the Canterbury Employers’ Chamber of Commerce and the University of Canterbury is seeking to identify up to five projects of national significance that each have the potential to generate $100 million of revenue for the Canterbury Region within five years and $1 billion or more in revenue within 20 years (see http://www.canterburyv5.org.nz/). The selected projects will receive assistance targeted to their needs, including for example: assistance with a feasibility study; assistance with cost benefit analysis; assistance with consent applications; and assistance to facilitate and progress the project through the provision of a network of professional expertise (such as specialist legal, financial, public relations, marketing, strategic planning and project management expertise). The feedback from the consultations for the CREDS update is that there are opportunities on a smaller scale that would make a difference for communities throughout the Canterbury region.

CREDS Exemplar Projects
2009
5
Description: The project would establish an office to provide project management support for a small number of economic development champions selected by the five economic development agencies through an open bidding procedure or competition. The criteria for selecting the champions must stress that while the project may have commercial goals, it must have wider benefits for local and regional economic development in order to qualify. The assistance will involve a project manager who will help take the projects through their various stages towards fruition. This will involve the project manger in a range of facilitating roles depending on each project. It might include putting together a business plan, liaising with the press, or aiding with resource management consent.
Stage 1: The governance group of five EDAs prepares a job description for the project manager employed for this scheme.
Stage 2: The governance group prepares and publishes a request for proposals for assistance by the Canterbury Innovation Support Centre.
Stage 3: The governance group advertises for, and appoints, the project manager.
Stage 4: The governance group selects the initiatives to be taken forward from around Canterbury.
Stage 5: The project manager undertakes his/her tasks, reporting to the governance group.
Output: Five local economic development projects selected and business proposal completed.
Indicative Budget: $100,000 for 2 years.

CREDS Exemplar Projects
2009
6
4.3 Canterbury Trade Alliance
Potential Key Governance Stakeholders: It is proposed that this project might be governed by a working group of invited representatives from:
• Economic development agencies;
• Regional or district tourism organisations;
• Institutions involved in the education of overseas students;
• Large employers of skilled labour in the region; and
• The Canterbury Employers’ Chamber of Commerce.
The working group members should be invited to ensure a good representation across the Canterbury region.
Intended Outcomes: (1) Increased visitor nights spent in Canterbury by international tourists; (2) Increased applications by overseas students for education in Canterbury; (3) Increased exports by producers of Canterbury products; and (4) Increased applications by skilled migrants and families to live in Canterbury.
Context: A number of organisations in Canterbury include material on their websites promoting the attractions of Canterbury to international clients. This includes organisations involved in marketing regional tourism and international education, firms selling Canterbury products in global markets, and enterprises regularly seeking investment or skilled workers from overseas. Examples are the region’s economic development agencies, local government Councils, regional and district tourism organisations, Chambers of Commerce, Christchurch International Airport, the Lyttelton and Timaru seaports, tertiary education organisations, industry sector interest groups and large private sector businesses.
The aim of this project is to provide a coordinated approach to the branding and support for businesses in Canterbury who wish to access and profile themselves to overseas markets, attract students, tourists and /or migrants. Initially the project will focus upon developing a coordinated approach to branding /marketing the region but also move towards assessing the other support needed fro businesses and how this may be addressed.
These organisations are providing and publishing material that is generally restricted to brief and high level descriptions of the province. There is an opportunity for pooling these fragmented resources to develop a state-of-the-art web-based portal for information about visiting, living, working or

CREDS Exemplar Projects
2009
7
investing in Canterbury. Such a portal is clearly an economic public good, however, which means incentives for private sector initiatives to create this asset are very weak even though the benefits are potentially very high. Description: This project is based on the Trade Development Alliance of Greater Seattle (see www.seattletradealliance.com/). The project will create a Canterbury Trade Alliance (CTA) whose long-term goal is to assist in coordinating and promoting the trade and investment interests of the region, including providing support to Canterbury exporters and to Canterbury enterprises seeking to attract international tourists or students. Its first task will be to design and publish a web-based portal for promoting Canterbury to international audiences. It will not be a new physical entity but rather a serviced private/public sector partnership that pools resources of organisations already actively involved in promoting the region internationally. The project is comprised of the following stages:
Stage 1: Form the Governance Working Group
Stage 2: Review the needs and gaps for business to identification of key target markets, business attraction campaigns, trade assistance and activities, and coordination of resources across agencies.
Stage 3: As an initial project analyse target segments of the international audience for a web-based portal..
Stage 4: Prepare a request for proposals from web-designers to create a web-based portal to meet specifications based on the analysis in Stage 3 and enter into contract.
Stage 5: Monitor the contracted web-designer’s work and evaluation of the final product.
Stage 6: Launch, and maintain, the web-based portal, and invite links to it on the websites of Canterbury organisations and enterprises.
Stage 7: Take learning from the development of the portal to assess other means, by which key markets can be targeted, businesses attracted as well as students, tourists and migrants.
Output: A world-class web-based portal promoting Canterbury to targeted international audiences.
Indicative Budget: $140,000 for 2 years.

CREDS Exemplar Projects
2009
8
4.4 Canterbury Water Resource Centre
Potential Key Governance Stakeholders: It is proposed that this project might be governed by a working group of invited representatives from:
• Economic development agencies;
• Environment Canterbury;
• Te Rūnanga o Ngāi Tahu;
• The University of Canterbury; and
• Lincoln University.
Intended Outcome: Canterbury’s water resources are sustainably managed to promote the social, economic, environmental, and cultural well-being of communities, in the present and for the future.
Context: A key constraint on regional development emphasised by many businesses and stakeholders, especially outside Christchurch city, is water storage for irrigation. There has been a large amount of scientific research and public consultation on this issue in recent years, including the ongoing Canterbury Water Management Strategy. Nevertheless, there have been delays caused by difficulties in collating existing knowledge on water storage issues (including its potential uses for energy generation and recreation, as well as for irrigation) and interpreting the knowledge into authoritative information for private and policy decision-making. In particular there is a need for reliable integration of existing knowledge on the science of water and its uses (such as groundwater flows, crop needs and environmental impacts), the potential economic benefits and opportunity costs of water use, and the policy mechanisms by which water could be allocated.
Recognition of the importance of these issues was made in 2008 when the Tertiary Education Commission provided $3 million of funding for a joint Chair of Water Management Studies at the University of Canterbury and Lincoln University, in response to calls by local authorities and businesses for more water management specialists. At the time, this initiative was expected to be a catalyst for collaborative work on sustainable water management issues. Research for CREDS 2009 has revealed the importance for some of this work to have a clear focus on informing private and public decision-makers.

CREDS Exemplar Projects
2009
9
Description: The Water Resource Centre would be a central facility for coordinating and interpreting information for the ‘management’ and allocation of water resources across the Canterbury region. It might be housed in a university or a Crown Research Institute environment to easily access and assess existing knowledge on the science, economics, policy and allocation issues of natural resource management decisions.
The centre would have two main functions: to act as a knowledge manager of information on water resource issues across the science, social sciences, policy and economics disciplines; and to analyse on a case by case basis the implications of various water allocation policies to determine their overall impact on social, economic, environmental and cultural well-being as an input into private and public policy decisions. It would draw upon the existing capability and capacity in knowledge around the use of natural resources the effects of this and the various potential policy mechanisms to facilitate change.
Initially the centre would concentrate upon the allocation of water but this could provide a basis for extending its expertise to other natural resources in Canterbury. This facility might be similar to overseas models such as the Natural Resources Management Centre at Cranfield University (see its website at http://www.cranfield.ac.uk/sas/nrmc/index.jsp), which develops knowledge about natural systems to meet current and future social and economic needs for ecosystem services such as the production of food, fibre and bio-fuels, enhancement of the environment, attenuation of floods and re-charge of aquifers, conservation of biodiversity, and carbon storage.
Stage 1: Form the governance working group.
Stage 2: Negotiate with the University of Canterbury and Lincoln University about the requirements for the Centre
Stage 3: Develop the Centre with collation of expertise and office support.
Stage 4: The Centre commences work providing commissioned reports on information relevant to key policy questions, reporting annually to the governance working group.
Output: Commissioned reports delivered to private and public agencies.
Indicative Budget: $100,000 for 2 years.
CREDS Exemplar Projects
2009
10
4.5 Canterbury Infrastructure Strategy
Potential Key Governance Stakeholders: It is proposed that this project might be governed by the region’s five economic development agencies.
Intended Outcome: Economic growth in Canterbury is not constrained by any elements of infrastructure that are missing or below world standards.
Context: Infrastructure is a critical element in growing a region’s economy. Modern, efficient infrastructure is necessary to get New Zealand and Canterbury goods and services to global markets. Poor public infrastructure slows the movement of goods and negatively impacts on productivity. Modern infrastructure also creates employment opportunities and attracts skilled knowledge workers, particularly in urban centres, boosting urban growth and competitiveness, as well as increasing the quality of life for residents. There is the need to distinguish between infrastructure which needs to be ‘for-for-purpose’ and that which should be ‘world-class’.
Infrastructure development across the Canterbury region is managed via City and District Councils, Environment Canterbury, central Government and the private sector and a number of strategies are starting to be developed to provide a more coordinated approach within the various infrastructure sectors. From an economic development perspective, however, the region does not have a coordinated long term infrastructure plan that aims to forecast infrastructure impediments to economic growth or address ways in which investment in world-class infrastructure would enable greater regional development.
Description: This project would initiate a stocktake of the longer-term state of infrastructure in the Canterbury region, and develop a strategy to guide investment to address identified gaps. The project has three phases.
Phase 1. Commission a stocktake of the region’s current and projected economic infrastructure with the purpose of determining whether Canterbury has, or will continue to have, the necessary infrastructure for supporting and promoting the region’s economic development. This phase would include determining criteria to assess the performance of current infrastructure and identifying future infrastructure projects necessary to ensure Canterbury is not constrained but has the infrastructure needed for its areas of ongoing competitive advantage.
CREDS Exemplar Projects
2009
11
Phase 2. Develop a long-term economic infrastructure plan for the region that clearly identifies priority projects from an economic development perspective.
Phase 3. It may be desirable to create an economic infrastructure office with the purpose of coordinating economic infrastructure planning across the region and championing projects key to the regions economic success.
The priority is to implement Phases 1 and 2. Depending on the outcome of that work, it could be appropriate to explore options for Phase 3.
Stage 1: Prepare a request for proposals from suitably qualified people to carry out the initial infrastructure audit alongside predicted and desirable growth in the region.
Stage 2: Select a person to carry out the audit.
Stage 3: Establish criteria for prioritising infrastructure projects.
Stage 4: Determine the infrastructure projects to be developed.
Stage 5: Assess the feasibility of the infrastructure projects above and derive implementation plans to undertake projects.
Output: A comprehensive review of infrastructure and needs in the Canterbury region and implementation plan on how to achieve this.
Indicative Budget: $100,000 for Phases 1 and 2 of the project over 2 years.
.

CREDS Exemplar Projects
2009
12
4.6 Canterbury Broadband Plans
Potential Key Governance Stakeholders: It is proposed that this project might be governed by the region’s five economic development agencies.
Intended Outcome: Urban and rural businesses and households have access to affordable, quality broadband services.
Context: Previous analysis by the Canterbury Development Corporation has confirmed the importance of reliable and affordable broadband networks for commercial enterprises, research institutions and residential consumers. Central Government has recently announced a number of initiatives to increase investment in broadband infrastructure nationally. This includes a $1.5B plan to roll out fibre to the home aiming to cover 75% of homes within 10 years, and a decision to allocate a further $48m for rural broadband connectivity. The implementation of these initiatives in Canterbury requires sound technical and business planning. In this context, CREDS has identified three discrete broadband infrastructure needs for the region which together comprise an integrated broadband project.
Description: The project involves three elements, which have been termed urban broadband, rural broadband and the national backbone.
Element One: Urban broadband
Central Government is currently seeking comment on the proposal with a Request for Proposals due to be released by Crown Fibre Investment Company (CFIC) in October/November this year. Accordingly the three main urban centres of Christchurch, Ashburton and Timaru consider that those communities which can reticulate FTTH ahead of others will create a (temporary but significant) competitive advantage and longer term will have an infrastructure which will be essential to quality of life and economic prosperity. Any FTTH investment needs to be a long term intergenerational undertaking which ensures that investment follows known demand. However the government have made it clear they wish to accelerate the investment cycle and are prepared to invest ahead of the demand curve to ensure New Zealand has FTTH for 75% of new Zealanders within 10 years.
Fibre to the Home (FTTH) is a 6-8 year project requiring significant product and service development to achieve. In Ashburton a network of some 250kms at a total cost of around $40m is suggested, in Timaru some 400kms, costing around $70m, and in Christchurch 3,000km of network costing around $500m.

CREDS Exemplar Projects
2009
13
To ensure these three centres are ready to submit a proposal to Government later this year requires the preparation of full business cases. The business cases would cover market analysis and product development, a business model, service delivery model, core metro technology architecture and technology, access technology architecture and high level access network design. The total cost of fully developing the business cases is estimated to be around $200,000.
Element Two: Rural Broadband
Access to affordable and high speed broadband is a specific issue in rural areas. On a similar basis to the urban broadband element, it is anticipated that Canterbury’s District Councils will be required to present appropriate business cases to stake a claim for a proportion of the $48m being allocated to rural broadband. Rather than each District Council making its own submission, there is considerable merit in preparing a Canterbury-wide regional submission in association with stakeholder organisations.
Element Three: National Backbone
An obligatory complement to elements one and two is the need for each network to be interconnected together with the capability to offer national and international connectivity.
Stage 1: Engage a suitable qualified person or organisation to prepare the business cases for elements one and two, taking into account the need for element three.
Stage 2: Prepare the business cases in line with national guidelines and in close consultation with the relevant territorial authorities.
Stage 3: Submit the agreed business cases.
Output: Comprehensive business cases submitted for investment in urban and rural broadband networks in Canterbury.
Indicative Budget: Total cost of establishing the concept and business case is expected to be $200,000. CREDS contribution 50%.

CREDS Exemplar Projects
2009
14
4.7 Canterbury Workforce Development
Potential Key Governance Stakeholders: It is proposed that this project might be governed by a working group of invited representatives from:
• Economic development agencies;
• The Canterbury Employers’ Chamber of Commerce;
• The South Canterbury Chamber of Commerce; and
• Federated Farmers of New Zealand.
The working group members should be invited to ensure a good representation across the Canterbury region.
Intended Outcomes: (1) Economic growth in Canterbury is not constrained by skill shortages; and (2) Structural unemployment in Canterbury is kept as low as possible.
Context: In today’s global talent marketplace there is increasing mobility within and between local labour markets, more diversity in the workplace and emerging pockets of skills shortages. These issues will be exacerbated in the coming twenty-five years by an ageing population, relatively small proportions of young people and an increasingly older workforce aged 44-64. Statistics New Zealand projections estimate that by 2026, people aged 65 years and over will make up over a fifth of the population in Canterbury and over a quarter of the population in the districts of Kaikoura, Hurunui, Ashburton, Timaru, Mackenzie and Waimate. They also suggest declining populations in the southern districts of the province. Currently major industry sector clusters driving export growth have not prepared strategic plans that address the impacts of the ageing workforce on the need for a stable supply of the appropriate human capital required for growth.
Description: This project will focus on two industry sectors in Canterbury; Agriculture and Manufacturing. Agriculture directly employs 17,000 people. Three key agricultural occupations have retirement rates above the national average (of 2%) and approximately one third of the workforce were over 55 years of age in the 2006 Census. Manufacturing is the largest industry employer in the region, directly employing 33,000 people in Canterbury.
The project will analyse a range of sector information from a variety of sources into two reports, one on each of these two sectors. This will include analysis of Census data and official population projections, as well as surveys and interviews undertaken with industry experts, to determine the

CREDS Exemplar Projects
2009
15
likely future direction and its impact on the skills and labour needs of each sector. It will identify the impact of an ageing workforce on productivity and facilitate responses by the agriculture and manufacturing sectors including developing and coordinating implementation plans.
These data will allow a gap analysis to be completed, with recommendations to key stakeholders about how gaps can be addressed. In particular, it will contribute to bringing together the needs of industry with the supply from tertiary providers. This will include a process to improve the quality of careers information received by young people in school considering possible career pathways in Canterbury.
Stage 1: Form the Governance Working Group.
Stage 2: Prepare a brief for consultants or a request for proposals from researchers able to undertake the necessary data gathering and analysis.
Stage 3: Select the best consultant or proposal for each element of the research and supervise the work that is undertaken.
Stage 4: Prepare a communication plan for the reports so that they are received by all relevant agencies.
Stage 5: Follow up with stakeholders the identification of changes that will address the gaps identified in the research.
This project will take approximately one year to complete and require a staff resource and funding to undertake a sector workforce survey. It is estimated that the project will cost $100,000, these costs being primarily personnel and survey implementation.
Outputs: Two policy reports (one for agriculture and one for manufacturing) delivered to the relevant agencies that will: improve alignment of skills and training provision by Canterbury tertiary providers that meets the needs of businesses in each sector; allow a process to be initiated to improve the quality of careers information received by young people in school; identify technological and social changes that, when implemented at the firm level, will improve the productivity of older workers; and develop a framework that can be applied to other sectors within Canterbury and New Zealand.
Indicative Budget: $100,000 for 1 year.

CREDS Exemplar Projects
2009
16
4.8 Canterbury Food and Beverage
Potential Key Governance Stakeholders: It is proposed that this project might be governed by a working group of invited representatives from:
• Economic development agencies;
• Regional or district tourism organisations; and
• Key businesses in the sector in Canterbury.
The working group members should be invited to ensure a good representation across the Canterbury region.
Intended Outcomes: (1) Tourists are attracted to stay longer in Canterbury to experience local foods and beverages; and (2) International and national consumers understand the qualities of Canterbury foods and beverages.
Context: Two years ago, a Product Development and Marketing Plan was developed for local food and wine stakeholders in North Canterbury with an interest in tourism. A project steering group oversaw the development and implementation of the North Canterbury Food and Wine Trail (see its resulting website at www.foodandwinetrail.co.nz). There was a very good uptake from 40 food and wine tourism operators in 2008 across the three Districts. Now in its second year the project is gaining momentum as a self drive trail with 6 operators from Kaikoura, 47 from Hurunui (incorporating 25 Waipara Valley Wine producers) and 14 from Waimakariri.
Canterbury is in an ideal position to gain from a collective effort to develop food and beverage tourism more widely in the region. The key is to promote a strong point of difference compared to other regions in New Zealand but also to develop the sector’s capability to market itself coherently, following the example of the already operational North Canterbury food and wine trail.
Description: This project will use the North Canterbury Food and Wine Trail as a template for creating Food and Beverage Trails throughout Canterbury. The project will deliver the following outputs.
1) Put Canterbury, and its major towns, on the map (literally) as a food and beverage tourism destination including developing our own map and referral system.
2) Build awareness and support of the Canterbury Food and Beverage Trail locally, domestically and internationally.

CREDS Exemplar Projects
2009
17
3) Continue to develop appealing, valuable and high quality food and beverage tourism products and experiences that will appeal to domestic and international visitors.
4) Create new visitor demand for food and beverage tourism experiences in Canterbury with an emphasis on repeat visitation and off-season visits and events.
5) Enhance local knowledge of, and support for, the Canterbury Food and Beverage Trail and its associated experiences.
The regional themes and unique selling propositions that will continue to build on the Canterbury brand include: Scenic Touring Route; Relaxation and Health; Food & Wine; Ecotourism; Adventure Activities; Heritage and Culture; and Rural Heartland.
Stage 1: Form the Governance Working Group.
Stage 2: Prepare a job description for, and appoint, a project facilitator.
Stage 3: Use the existing professionally written Product Development and Marketing Plan as a template for expansion – agree on existing membership criteria.
Stage 4: Collaborate with district marketing managers to sell Trail memberships and with district economic development managers to sell Trail associate memberships.
Stage 5: Oversee the development of promotional material and launch the new Canterbury Food and Beverage Trail.
Stage 6: Continue to develop the trail; for example, strengthen critical mass in each district/town/farmers markets/specialist stores and food producers, and offer relevant training advice to focus on adding value and delivering authentic experience.
Output: A sustainable food and beverage trail that clearly conveys Canterbury’s rural flavours, personalities and authentic experiences with full members paying to be part of the trail and associate members paying to be suppliers of ‘locally produced, processed or grown in the region’ product to the restaurants and cafes.
Indicative Budget: Total cost of project $375,000 over three years (including membership fees, sponsorship, and in kind support from Marketing Managers, economic development managers and the working group). The contribution sought from CREDS is $75,000.


