143
APPENDIX F X:\Anaheim AFC\Appendix Cover Pages.doc 25 GEOTECHNICAL REPORT
| Date post: | 23-May-2018 |
| Category: |
Documents |
| Upload: | nguyenkhanh |
| View: | 215 times |
| Download: | 1 times |
APPENDIX F
X:\Anaheim AFC\Appendix Cover Pages.doc 25
GEOTECHNICAL REPORT

REPORT OF GEOTECHNICAL INVESTIGATION PROPOSED CITY OF ANAHEIM 200 MW PEAKING
POWER PLANT
3071 EAST MIRALOMA AVENUE ANAHEIM, CALIFORNIA
Prepared for:
PB AMERICAS, INC. San Francisco, California
October 10, 2007
Project 4953-07-1741
MACTEC

MACTEC Engineering and Consulting, Inc. 5628 East Slauson • Los Angeles, CA 90040-1554 • Phone: 323.889.5300 • 323.889-5398
October 10, 2007
Mr. Jay K. Johnson, Vice President PB Americas, Inc. 303 Second Street Suite 700 North San Francisco, California 94107
Subject: LETTER OF TRANSMITTAL Report of Geotechnical Investigation
Proposed City of Anaheim 200 MW Peaking Power Plant 3071 East Miraloma Avenue
Anaheim, California MACTEC Proposal 4953-07-1741
Dear Mr. Johnson:
We are pleased to submit the results of our geotechnical investigation for the proposed City of Anaheim 200 MW Peaking Power Plant to be constructed at 3071 East Miraloma Avenue in Anaheim, California. This investigation was conducted in general accordance with the agreement between your firm and MACTEC Engineering and Consulting, Inc. dated August 21, 2007 and subject to the terms and conditions contained in that agreement.
The scope of our services was planned based on your Request for Proposal and discussions with you. You have furnished us with plans and advised us of the structural features of the proposed facilities at the Power Plant.
The results of our investigation and design recommendations are presented in this report. Please note that you or your representative should submit copies of this report to the appropriate governmental agencies for their review and approval prior to obtaining a building permit.

REPORT OF GEOTECHNICAL INVESTIGATION PROPOSED CITY OF ANAHEIM 200 MW PEAKING POWER PLANT
3071 EAST MIRALOMA AVENUE ANAHEIM, CALIFORNIA
Prepared for:
PB AMERICAS, INC.
Anaheim, California
MACTEC Engineering and Consulting, Inc.
Los Angeles, California
October 10, 2007
Project 4953-07-1741

PB Americas, Inc. - City of Anaheim 200 MW Peaking Power Plant October 10, 2007 MACTEC Engineering and Consulting, Inc., Project 4953-07-1741
ii
TABLE OF CONTENTS
LIST OF TABLES AND FIGURES .................................................................................................. iv
EXECUTIVE SUMMARY.................................................................................................................v
1 SCOPE...................................................................................................................................1
2 PROJECT DESCRIPTION....................................................................................................3
3 SITE CONDITIONS .............................................................................................................4
4 EXPLORATIONS AND LABORATORY TESTS ................................................................5
5 SOIL CONDITIONS .............................................................................................................6
6 GEOLOGY............................................................................................................................76.1 GEOLOGIC SETTING ............................................................................................76.2 GEOLOGIC MATERIALS ......................................................................................76.3 GROUND WATER...................................................................................................76.4 FAULTS....................................................................................................................86.5 SEISMICITY.......................................................................................................... 116.6 GEOLOGIC HAZARDS ........................................................................................126.7 SEISMICITY..........................................................................................................126.8 SLOPE STABILITY...............................................................................................126.9 LIQUEFACTION AND SEISMIC-INDUCED SETTLEMENT ...........................136.10 TSUNAMIS, INUNDATION, SEICHES, AND FLOODING ...............................136.11 SUBSIDENCE........................................................................................................146.12 OIL WELLS AND METHANE GAS.....................................................................146.13 EXPANSIVE SOILS ..............................................................................................146.14 CONCLUSIONS ....................................................................................................15
7 RECOMMENDATIONS .....................................................................................................167.1 MAT FOUNDATIONS...........................................................................................167.2 SPREAD FOOTINGS ............................................................................................177.3 CAST-IN-DRILLED HOLE PILE FOUNDATIONS.............................................187.4 SITE COEFFICIENT AND SEISMIC ZONATION ..............................................227.5 ULTIMATE DESIGN FACTORS ..........................................................................247.6 FLOOR SLAB SUPPORT......................................................................................247.7 RETAINING WALLS.............................................................................................257.8 PAVING..................................................................................................................267.9 PIPELINE SUBGRADE, BEDDING AND TRENCH BACKFILL......................287.10 DYNAMIC CHARACTERISTICS OF SOIL........................................................307.11 GRADING..............................................................................................................317.12 GEOTECHNICAL OBSERVATION......................................................................33
8 GENERAL LIMITATIONS AND BASIS FOR RECOMMENDATIONS .........................34
9 BIBILIOGRAPHY ..............................................................................................................35
PB Americas, Inc. - City of Anaheim 200 MW Peaking Power Plant October 10, 2007 MACTEC Engineering and Consulting, Inc., Project 4953-07-1741
iii
TABLE OF CONTENTS - continued
TABLES
FIGURES
APPENDIX A: CURRENT EXPLORATIONS AND LABORATORY TESTS
APPENDIX B: CONE PENETRATION TEST RESULTS
APPENDIX C: ELECTRICAL RESISTIVITY TEST RESULTS
APPENDIX D: PRIOR EXPLORATIONS AND LABORATORY TESTS
PB Americas, Inc. - City of Anaheim 200 MW Peaking Power Plant October 10, 2007 MACTEC Engineering and Consulting, Inc., Project 4953-07-1741
iv
LIST OF TABLES AND FIGURES
Tables
1 Major Named Faults Considered to be Active in Southern California
2 Major Named Faults Considered to be Potentially Active in Southern California
3 List of Historic Earthquakes of Magnitude 4.0 or Greater within 100km of the site
Figures
1 Vicinity Map
2 Plot Plan
3 Geologic Map
4 Regional Faults and Seismicity Map
5 Axial Pile Capacities
6 Typical Pipeline Trench Conditions

PB Americas, Inc. - City of Anaheim 200 MW Peaking Power Plant October 10, 2007 MACTEC Engineering and Consulting, Inc., Project 4953-07-1741
v
EXECUTIVE SUMMARY
We have completed our geotechnical investigation of the site of the proposed City of Anaheim 200 MW Peaking Power Plant located at 3071 East Miraloma Avenue in Anaheim, California for PB Americas. Our subsurface explorations, geologic-seismic hazards evaluation, engineering analyses, and foundation design recommendations are summarized below.
We explored the soil conditions by drilling five borings at the site; fill soils, 1 to 2½ feet thick, were found in our borings. The natural soils consist of medium dense to very dense silty sand and poorly graded sands. Ground water was not encountered within the 50½-foot depth explored. The on-site soil has a low expansion potential.
Active or potentially active faults with the potential for surface fault rupture are not known to be located beneath or projecting toward the site. In our opinion, the potential for surface rupture at the site due to fault plane displacement propagating to the ground surface during the design life of the project is considered low. Although the site could be subjected to strong ground shaking in the event of an earthquake, this hazard is common in Southern California and the effects of ground shaking can be mitigated by proper engineering design and construction in conformance with current building codes and engineering practices.
The site is located within a potential inundation area for an earthquake-induced dam failure, however programs of review, modification, or total reconstruction of existing dams are intended to ensure that all dams are capable of withstanding the maximum credible earthquake (MCE) for the site. Therefore, the potential for inundation at the site as a result of an earthquake-induced dam failure is considered low.
The site is in the 100-year flood (with flooding depth of less than one foot) to 500-year flood zone. Site structures/elevations should be designed to minimize impacts of a flood event.
The potential for other geologic hazards such as liquefaction, seismic-induced settlement, slope instability, tsunamis, and subsidence affecting the site is considered low.
The proposed major structures can be supported on mat or spread footing foundations established on a 5-foot-thick layer of properly compacted fill soils. Smaller foundations may be supported on spread footing foundations established in the natural soils or on properly compacted fill. Structures with significant overturning loads may be supported on short drilled pile foundations. Floor slabs, paving, and other slabs may be supported on natural soil or on properly compacted fill
PB Americas, Inc. - City of Anaheim 200 MW Peaking Power Plant October 10, 2007 MACTEC Engineering and Consulting, Inc., Project 4953-07-1741
1
1 SCOPE
This report provides foundation design information for the proposed City of Anaheim 200 MW
Peaking Power Plant project. The location of the site is shown in Figure 1, Vicinity Map. The
locations of the various components of the Power Plant and our current and prior exploration
borings are shown in Figure 2, Plot Plan.
We submitted the results of an investigation for the Second Lower Cross Feeder (a new water
supply pipeline) along Miraloma Avenue (at the southern side of the site) in a report dated
February 13, 2006 (our Job No. 4953-05-2661). The location of our previous boring is shown on
Figure 2. The recommendations in the current report were developed in part using geotechnical
information from our previous investigation.
This investigation was authorized to determine the physical characteristics of the soils at the site of
the proposed Power Plant perform a geologic-seismic hazards evaluation, and to provide
recommendations for foundation design, floor slab and pavement support, buried utility line
installation, dynamic characteristics, grading, and electrical resistivity. We were to evaluate the
existing soil and ground-water conditions at the site and develop recommendations for the
following:
Feasible foundation systems for the various components of the project along with the necessary design parameters, including the estimated settlement due to the expected loadings.
Subgrade preparation and floor slab support.
Design of minor retaining walls.
Subgrade preparation and design of paving.
Buried utility line installation, including bedding.
Grading, including site preparation, excavation and slopes, the placing of compacted fill, and quality control measures relating to earthwork.
Electrical resistivity.
PB Americas, Inc. - City of Anaheim 200 MW Peaking Power Plant October 10, 2007 MACTEC Engineering and Consulting, Inc., Project 4953-07-1741
2
The assessment of general site environmental conditions for the presence of contaminants in the
soils and groundwater of the site was beyond the scope of this investigation.
Our recommendations are based on the results of our field explorations, laboratory tests, and
appropriate engineering analyses. The results of our current borings and laboratory tests are
presented in Appendix A. The results of our current Cone Peneration Tests are presented in
Appendix B. The results of the current Electrical Resistivity testing are presented in Appendix C.
The results of our prior boring and associated laboratory testing immediately adjacent to the site are
presented in Appendix D.
PB Americas, Inc. - City of Anaheim 200 MW Peaking Power Plant October 10, 2007 MACTEC Engineering and Consulting, Inc., Project 4953-07-1741
3
2 PROJECT DESCRIPTION
The City of Anaheim is planning to construct a 200 MW combustion turbine peaking power plant.
There will be combustion turbines, cooling towers, an aqueous ammonia storage tank, water
storage tanks, a plant operations building, pipe racks, a switchyard, natural gas pumps, and
driveways and a parking lot. Some of the equipment will be subject to vibration. The facility is
being designed to accommodate a future possible expansion on the western portion of the site.
We understand that the combustion turbines will be supported on large concrete mats. There will
also be numerous smaller lightly loaded foundations. Ring wall foundations are anticipated for
large water storage tanks. Drilled piers will be required for certain plan equipment with higher
overturning moments such as pipe racks.
PB Americas, Inc. - City of Anaheim 200 MW Peaking Power Plant October 10, 2007 MACTEC Engineering and Consulting, Inc., Project 4953-07-1741
4
3 SITE CONDITIONS
The site is located north of East Miraloma Avenue in Anaheim, California. The site is currently
partially occupied by existing buildings and a truck wash, and the remaining portion is mostly
covered with asphalt and concrete pavement. There is a small amount of landscaping in some
portions of the site. The ground surface of the site is relatively level. Reportedly there have been
underground storage tanks in the northern portion of the site. Various underground utilities cross
the site.

PB Americas, Inc. - City of Anaheim 200 MW Peaking Power Plant October 10, 2007 MACTEC Engineering and Consulting, Inc., Project 4953-07-1741
5
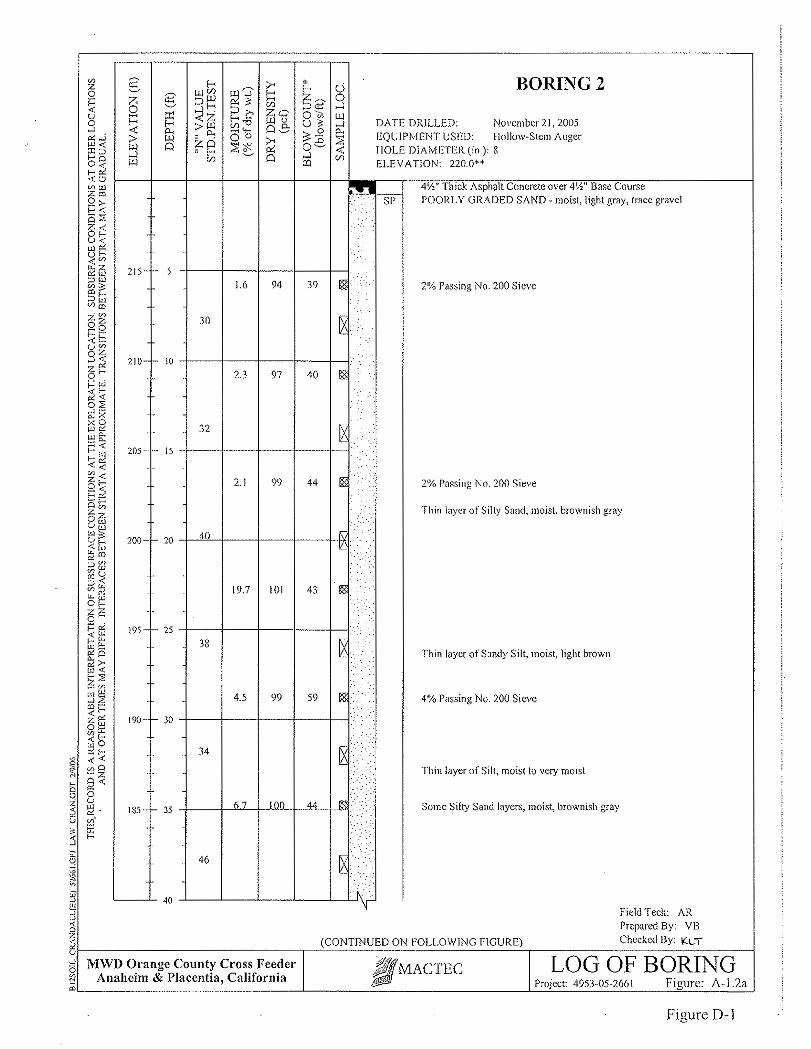
4 EXPLORATIONS AND LABORATORY TESTS
The soil conditions beneath the site were explored by drilling 5 borings to depths of 30 to 50½ feet
below the existing grade and advancing 11 CPT soundings to depth of about 30 to 50 below
existing grade at the locations shown in Figure 2. Details of the explorations and the logs of the
borings are presented in Appendix A. The results of the CPT soundings are presented in Appendix
B. In addition, 11 Electrical Resistivity tests were conducted in accordance with the guidelines
outlined in IEEE 80. The results are attached in Appendix C.
Finally, data was available from one prior boring drilled along Miraloma Avenue; the boring
location is also shown in Figure 2, and the data is presented in Appendix D.
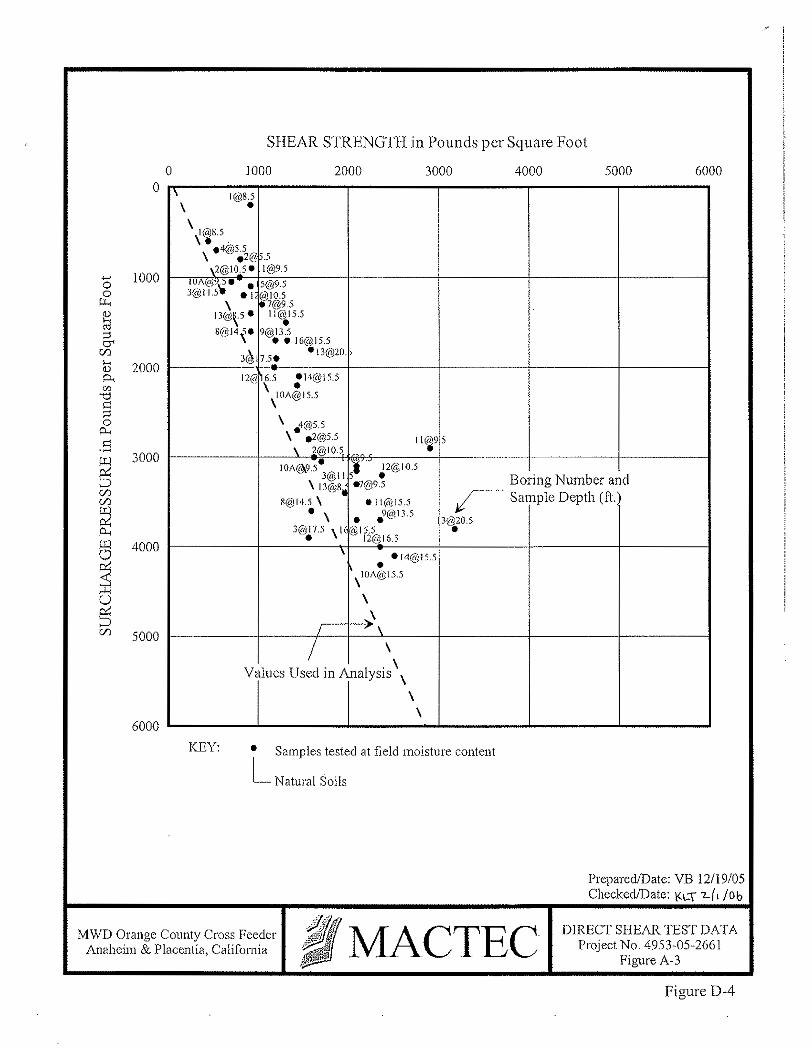
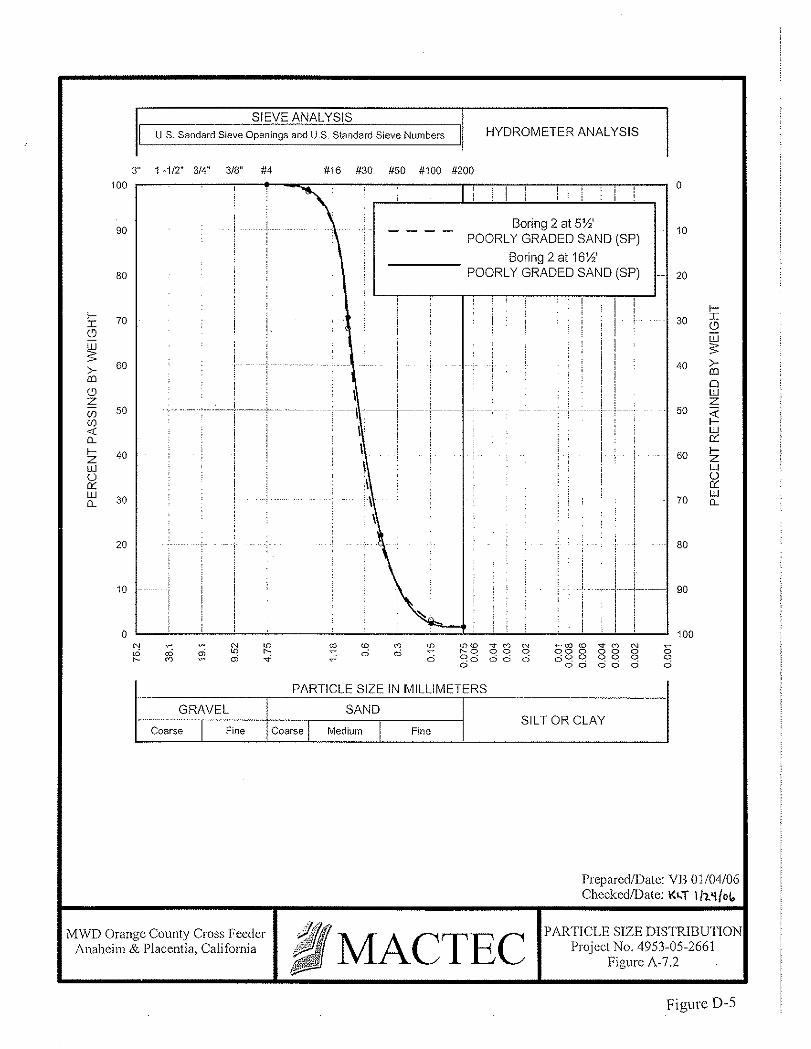
Laboratory tests were performed on selected samples obtained from the borings to aid in the
classification of the soils and to determine the pertinent engineering properties of the foundation
soils. The following tests were performed on samples from current borings:
Moisture content and dry density determinations. Direct shear. Consolidation.Compaction Stabilometer (R-Value)
All testing was done in general accordance with applicable ASTM specifications. Details of the
current laboratory testing program and test results are presented in Appendix A.
Laboratory tests were also previously performed on samples obtained from the prior boring
performed adjacent to the site. The testing, consisting of moisture content and dry density
determination, direct shear, and particle size distribution, are presented in Appendix D.

PB Americas, Inc. - City of Anaheim 200 MW Peaking Power Plant October 10, 2007 MACTEC Engineering and Consulting, Inc., Project 4953-07-1741
6
5 SOIL CONDITIONS
Fill soils, 1 to 2½ feet thick, were found in the borings. The fill soils consist of silty sand. Deeper
fill could occur between borings, and should be anticipated at locations where subterranean tanks,
foundations, and other subterranean elements are or were formerly located. The natural soils
consist of medium dense to very dense silty sand and poorly graded sand with some isolated layers
of sandy silt. Ground water was not encountered within the 50½-foot depth explored. The on-site
soil has a low expansion potential.

PB Americas, Inc. - City of Anaheim 200 MW Peaking Power Plant October 10, 2007 MACTEC Engineering and Consulting, Inc., Project 4953-07-1741
7
6 GEOLOGY
6.1 GEOLOGIC SETTING
Regionally, the site is in the northern portion of the Peninsular Ranges geomorphic province. This
province extends northwesterly from Baja California to the north edge of the Los Angeles Basin
and westerly into the offshore area, including Santa Catalina, Santa Barbara, San Clemente and San
Nicolas islands. The northern boundary of the province is the Transverse Ranges along the Malibu,
Santa Monica, Hollywood, Raymond, Sierra Madre, and Cucamonga faults. The eastern boundary
of the province is the Colorado Desert geomorphic province along the San Jacinto fault system.
The Peninsular Range province is characterized by northwest/southeast trending alignments of
mountains and hills and intervening basins, reflecting the influence of northwest trending major
faults and folds, such as the nearby Whittier fault zone, located approximately 5.1 miles northeast
of the site, controlling the general geologic structural fabric of the region.
The site is situated on the alluvial plain of the Santa Ana River, west of the Peralta Hills. The
relationship of the site to local geologic features is depicted in Figure 3, Geologic Map. Figure 4,
Regional Faults and Seismicity Map, shows major faults and earthquake epicenters in Southern
California with respect to the site.
6.2 GEOLOGIC MATERIALS
The site is underlain by artificial fill and alluvium. Artificial fill soils, 1 to 2½-foot thick were
found in our borings and consist predominantly of silty sand. The alluvium consists of medium
dense to very dense silty sand and poorly graded sand with some local layers of sandy silt.
6.3 GROUND WATER
Ground water was not encountered within the 50½-foot depth explored. According to the
California Geological Survey, the historic high water level at the site was approximately 20 feet
below the ground surface (California Division of Mines and Geology, 1997).

PB Americas, Inc. - City of Anaheim 200 MW Peaking Power Plant October 10, 2007 MACTEC Engineering and Consulting, Inc., Project 4953-07-1741
8
6.4 FAULTS
The numerous faults in Southern California include active, potentially active, and inactive faults.
The criteria for these major groups are based on criteria developed by the California Geological
Survey (previously the California Division of Mines and Geology) for the Alquist-Priolo
Earthquake Fault Zoning Program (Hart, 1999). By definition, an active fault is one that has had
surface displacement within Holocene time (about the last 11,000 years). A potentially active fault
is a fault that has demonstrated surface displacement of Quaternary age deposits (last 1.6 million
years). Inactive faults have not moved in the last 1.6 million years. A list of nearby active faults,
those included in CGS 2003, with the distance in miles between the site and the nearest point on
the fault, the maximum Magnitude (MW), and the slip rate for the fault is given in Table 1. A
similar list for potentially active faults is presented in Table 2. The faults in the vicinity of the site
are shown on Figure 4.
Active Faults
Whittier Fault
The active Whittier fault is located approximately 5.1 miles northeast of the site. The northwest-
trending Whittier fault extends along the south flank of the Puente Hills from the Santa Ana River
on the southeast to Whittier Narrows on the northwest. According to Yeats, at Whittier Narrows the
Whittier fault turns more northwesterly becoming the East Montebello fault. The main Whittier
fault trace is a high-angle reverse fault, with the north side uplifted over the south side at an angle
of approximately 70 degrees, although late Quaternary movement has been nearly pure strike slip
and total right separation may be around 8 to 9 kilometers (Yeats, 2004). In the Brea-Olinda Oil
Field, the Whittier fault displaces Pleistocene age alluvium, and Carbon Canyon Creek is offset in a
right lateral sense by the Whittier fault.
Elsinore Fault
The active Glen Ivy segment of the Elsinore fault zone is located approximately 11 miles east-
southeast of the site, where it becomes the Whittier fault. An average slip rate of 5.0 millimeters
per year and a maximum Magnitude of 6.8 are estimated for the Glen Ivy segment by the California
Geological Survey (2003).

PB Americas, Inc. - City of Anaheim 200 MW Peaking Power Plant October 10, 2007 MACTEC Engineering and Consulting, Inc., Project 4953-07-1741
9
San Andreas Fault Zone
The active San Andreas fault zone is located about 37 miles northeast of the site. This fault zone,
California's most prominent geological feature, trends generally northwest for almost the entire length
of the state. The Mojave segment of the fault is the closest to the site. The CGS (2003) estimates a slip
rate of 30 millimeters/yr for the Mojave segment. The magnitude 7.8 1857 Fort Tejon earthquake was
the last major earthquake along the San Andreas fault zone in Southern California.
Blind Thrust Faults
Several buried thrust faults, commonly referred to as blind thrusts, underlie the Los Angeles Basin
at depth. These faults are not exposed at the ground surface and are typically identified at depths
greater than 3 kilometers. These faults do not present a potential surface fault rupture hazard.
However, the following described blind thrust faults are considered active and potential sources for
future earthquakes.
Puente Hills Blind Thrust
The Puente Hills Blind Thrust (PHBT) is defined based on seismic reflection profiles, petroleum
well data, and precisely located seismicity (Shaw et. al, 2002). This blind thrust fault system
extends eastward from downtown Los Angeles to Brea (in northern Orange County). The PHBT
includes three north-dipping segments, named from east to west as the Coyote Hills segment, the
Santa Fe Springs segment, and the Los Angeles segment. These segments are overlain by folds
expressed at the surface as the Coyote Hills, Santa Fe Springs Anticline, and the Montebello Hills.
The Santa Fe Springs segment of the PHBT is believed to be the causative fault of the October 1,
1987 Whittier Narrows Earthquake (Shaw et. al, 2002).
The PHBT underlies the site at depth. Postulated earthquake scenarios for the PHBT include single
segment fault ruptures capable of producing an earthquake of magnitude 6.5 to 6.6 (Mw) and a
multiple segment fault rupture capable of producing an earthquake of magnitude 7.1 (Mw) (Shaw
et.al, 2002). More recent paleoseismic studies of Holocene uplift include estimated earthquakes of
magnitude 7.2 to 7.5 (Mw) (Dolan et. al, 2003). The PHBT is not exposed at the ground surface
and does not present a potential for surface fault rupture. However, the PHBT is considered an
active fault capable of generating future earthquakes beneath the Los Angeles Basin. An average
slip rate of 0.7 millimeters per year and a maximum Magnitude of 7.1 are estimated by the
California Geological Survey (2003) for the Puente Hills Blind Thrust.
PB Americas, Inc. - City of Anaheim 200 MW Peaking Power Plant October 10, 2007 MACTEC Engineering and Consulting, Inc., Project 4953-07-1741
10
San Joaquin Hills Blind Thrust
Until recently, the southern Los Angeles Basin has been estimated to have a low seismic hazard
relative to the greater Los Angeles region (Working Group on California Earthquake Probabilities,
1995; Dolan et al., 1995). This estimation was generally based on the fewer number of known
active faults and the lower rates of historic seismicity for this area. However, several recent studies
by Grant et al. (1999, 2002) suggest that an active blind thrust fault system underlies the San
Joaquin Hills. This postulated blind thrust fault is believed to be a faulted anticlinal fold, parallel to
the Newport-Inglewood fault zone (NIFZ) but considered a distinctly separate seismic source
(Grant et al., 2002). The recency of movement and Holocene slip rate of this fault are not known.
The vertical surface projection of the San Joaquin Hills Thrust is approximately 11 miles south of
the site at the closest point. This thrust fault is not exposed at the surface and does not present a
potential surface fault rupture hazard. However, the San Joaquin Hills Thrust is considered an
active feature that can generate future earthquakes. An average slip rate of 0.5 mm/yr and a
maximum Magnitude of 6.6 is estimated for the San Joaquin Hills Thrust by the California
Geological Survey (2003).
Potentially Active Faults
El Modeno Fault
The potentially active El Modeno fault is located about 1.5 miles south of the site. The fault is a
steeply-dipping normal fault about 9 miles long and has about 2,000 feet of uplift on its eastern
side. Movement on the fault has been inferred during Holocene time, suggesting the fault is active
(Ryan et al., 1982). However, Jennings, 1994 shows this fault to be potentially active and the CGS
does not include it in its database.
Peralta Hills Fault
The potentially active Peralta Hills fault is located approximately 1.9 miles southeast of the site.
This reverse fault is about 5 miles long and generally trends east-west and dips to the north.
Pleistocene age offsets are known along this fault; however, there is no evidence that this fault has
offset Holocene age alluvial deposits (Ziony and Jones, 1989). Additionally, Jennings, 1994 shows
this fault to be potentially active.

PB Americas, Inc. - City of Anaheim 200 MW Peaking Power Plant October 10, 2007 MACTEC Engineering and Consulting, Inc., Project 4953-07-1741
11
Norwalk Fault
The potentially active Norwalk fault is located about 4.8 miles west-northwest of the site. The fault
is a known ground-water barrier along the southern edge of the Coyote Hills, trending southeasterly
along which the Coyote Hills have been uplifted. This fault offsets lower Pleistocene age and older
deposits near the mouth of the Santa Ana Canyon. However, there is no evidence that this fault has
offset Holocene age alluvial deposits (Ziony and Jones, 1989). Additionally, the State considers the
Norwalk fault to be potentially active (Jennings, 1994).
6.5 SEISMICITY
Earthquake Catalog Data
The seismicity of the region surrounding the campus was determined from research of an electronic
database of seismic data (Southern California Seismographic Network, 2007). This database
includes earthquake data compiled by the California Institute of Technology from 1932 through
2007 and data for 1812 to 1931 compiled by Richter and the U.S. National Oceanic Atmospheric
Administration (NOAA). The search for earthquakes that occurred within 100 kilometers of the
campus indicates that 443 earthquakes of Richter magnitude 4.0 and greater occurred from 1932
through 2007; 4 earthquakes of magnitude 6.0 or greater occurred between 1906 and 1931; and 1
earthquake of magnitude 7.0 or greater occurred between 1812 and 1905. A list of these
earthquakes is presented as Table 3. Epicenters of some of the moderate and major earthquakes
(greater than magnitude 5.0) are shown in Figure 4.
In Table 3, the information for each earthquake includes date and time in Greenwich Civil Time
(GCT), location of the epicenter in latitude and longitude, quality of epicentral determination (Q),
depth in kilometers, distance from the site in kilometers, and magnitude. Where a depth of 0.0 is
given, the solution was based on an assumed 16-kilometer focal depth. The explanation of the letter
code for the quality factor of the data is presented on the first page of the table.
Historic Earthquakes
A number of earthquakes of moderate to major magnitude have occurred in the Southern California
area within the last 150 years. A partial list of these earthquakes, including the magnitude of the
earthquake and the distance of the epicenter to the campus, is included in the following table.
PB Americas, Inc. - City of Anaheim 200 MW Peaking Power Plant October 10, 2007 MACTEC Engineering and Consulting, Inc., Project 4953-07-1741
12
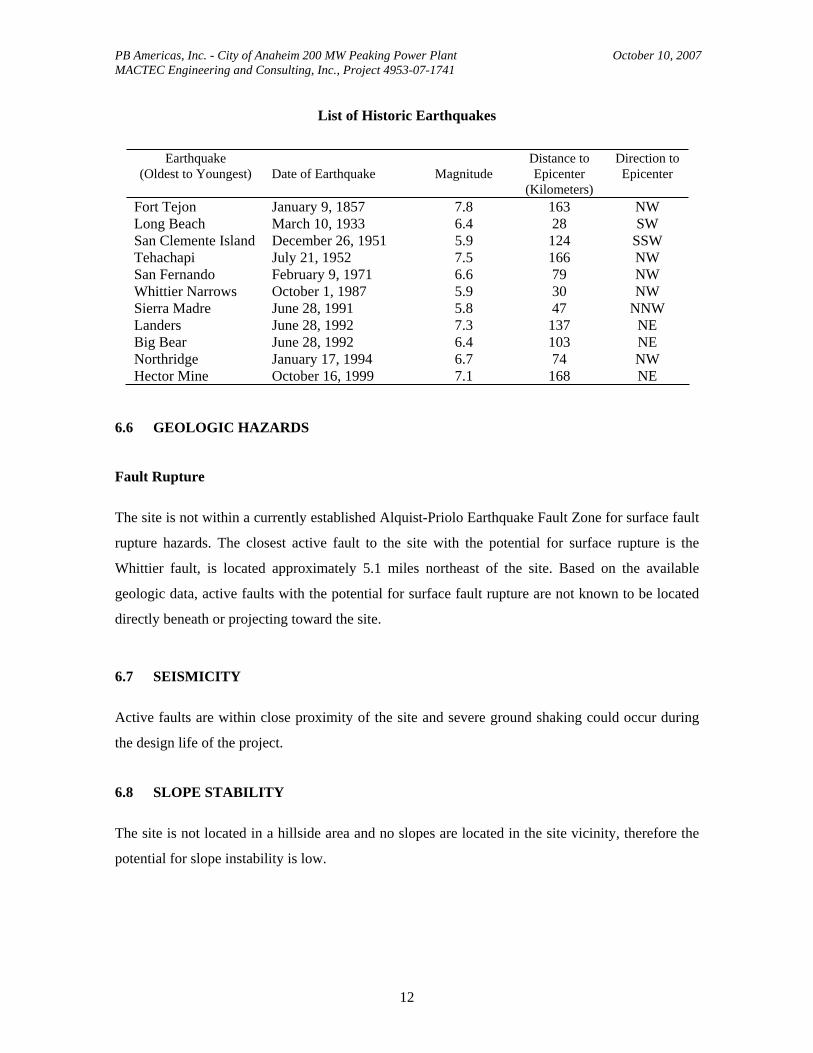
List of Historic Earthquakes
Earthquake (Oldest to Youngest) Date of Earthquake Magnitude
Distance to Epicenter
(Kilometers)
Direction to Epicenter
Fort Tejon January 9, 1857 7.8 163 NW Long Beach March 10, 1933 6.4 28 SW San Clemente Island December 26, 1951 5.9 124 SSW Tehachapi July 21, 1952 7.5 166 NW San Fernando February 9, 1971 6.6 79 NW Whittier Narrows October 1, 1987 5.9 30 NW Sierra Madre June 28, 1991 5.8 47 NNW Landers June 28, 1992 7.3 137 NE Big Bear June 28, 1992 6.4 103 NE Northridge January 17, 1994 6.7 74 NW Hector Mine October 16, 1999 7.1 168 NE
6.6 GEOLOGIC HAZARDS
Fault Rupture
The site is not within a currently established Alquist-Priolo Earthquake Fault Zone for surface fault
rupture hazards. The closest active fault to the site with the potential for surface rupture is the
Whittier fault, is located approximately 5.1 miles northeast of the site. Based on the available
geologic data, active faults with the potential for surface fault rupture are not known to be located
directly beneath or projecting toward the site.
6.7 SEISMICITY
Active faults are within close proximity of the site and severe ground shaking could occur during
the design life of the project.
6.8 SLOPE STABILITY
The site is not located in a hillside area and no slopes are located in the site vicinity, therefore the
potential for slope instability is low.
PB Americas, Inc. - City of Anaheim 200 MW Peaking Power Plant October 10, 2007 MACTEC Engineering and Consulting, Inc., Project 4953-07-1741
13
6.9 LIQUEFACTION AND SEISMIC-INDUCED SETTLEMENT
Liquefaction potential is greatest where the ground water level is shallow, and submerged loose,
fine sands occur within a depth of about 50 feet or less. Liquefaction potential decreases as grain
size and clay and gravel content increase. As ground acceleration and shaking duration increase
during an earthquake, liquefaction potential increases.
The site is within a State of California designated Liquefaction Hazard Zone.
To evaluate the liquefaction potential of the project site during the Design Basis Earthquake
(DBE), the magnitude-7.5-adjusted peak ground acceleration corresponding to the DBE, which is
defined as an event with a 10% probability of exceedance in 50 years, was computed. The
magnitude-7.5-adjusted peak ground acceleration (PGA) of the DBE, hereinafter referred to as the
liquefaction PGA, was computed probabilistically using EZFRISK, Version 7.22. The liquefaction
PGA for the subject site was calculated as 0.27g.
The liquefaction potential of the soils underlying the site during the DBE was evaluated using the
liquefaction PGA, the results of the SPTs performed in our borings, CPTs, and the historic-high
ground-water level of about 20 feet below the existing grade. We estimate liquefaction-induced
settlement on the order of ½ inch due to the DBE. However, the soils at the site are relatively
uniformly horizontally layered. Therefore, differential liquefaction-induced settlement would be
expected to be less than ¼ inch due to the DBE.
6.10 TSUNAMIS, INUNDATION, SEICHES, AND FLOODING
The site is not in a coastal area. Therefore, tsunamis (seismic sea waves) are not considered a
significant hazard at the site.
According to the City of Anaheim Safety Element (2004), the site is located within a potential
inundation area for an earthquake-induced dam failure from Prado and Carbon Canyon dams.
However, these reservoirs, as well as others in California, are continually monitored by various
governmental agencies (such as the State of California Division of Safety of Dams and the U.S.
Army Corps of Engineers) to guard against the threat of dam failure. The possibility of dam
failures during an earthquake has been addressed by the California Division of Mines and Geology

PB Americas, Inc. - City of Anaheim 200 MW Peaking Power Plant October 10, 2007 MACTEC Engineering and Consulting, Inc., Project 4953-07-1741
14
in the earthquake planning scenarios for a magnitude 8.3 earthquake on the San Andreas fault
(Davis et al., 1982) and a magnitude 7.0 earthquake on the Newport-Inglewood fault (Toppozada et
al., 1988). As stated in the both reports, catastrophic failure of a major dam as a result of a scenario
earthquake is regarded as unlikely. Current design and construction practices, and ongoing
programs of review, modification, or total reconstruction of existing dams are intended to ensure
that all dams are capable of withstanding the maximum credible earthquake (MCE) for the site.
Therefore, the potential for inundation at the site as a result of an earthquake-induced dam failure is
considered low.
The site is not located down slope of any large bodies of water that would impact the site in the
event of earthquake-induced seiches (wave oscillations in an enclosed or semi-enclosed body of
water) inundation.
The site is in the 100-year flood (with flooding below one foot) to 500-year flood zone. Site
structures/elevations should be designed to minimize impacts of a flood event.
6.11 SUBSIDENCE
The site is not within an area of known subsidence associated with fluid withdrawal (ground water
or petroleum), peat oxidation, or hydrocompaction.
6.12 OIL WELLS AND METHANE GAS
The site is adjacent to the boundaries of the Olive and Richmond oil fields. Based on maps
published by the California Division of Oil, Gas, and Geothermal Resources (CDOGG), there are
no known oil wells at the site. There is a slight potential for abandoned oil wells to be encountered
during construction. Methane migrating to the surface from the oil fields is a potential hazard.
6.13 EXPANSIVE SOILS
The soils at the site have a low expansion potential.

PB Americas, Inc. - City of Anaheim 200 MW Peaking Power Plant October 10, 2007 MACTEC Engineering and Consulting, Inc., Project 4953-07-1741
15
6.14 CONCLUSIONS
Based on the available geologic data, active or potentially active faults with the potential for surface
fault rupture are not known to be located beneath or projecting toward the site. In our opinion, the
potential for surface rupture at the site due to fault plane displacement propagating to the ground
surface during the design life of the project is considered low. Although the site could be subjected to
strong ground shaking in the event of an earthquake, this hazard is common in Southern California
and the effects of ground shaking can be mitigated by proper engineering design and construction in
conformance with current building codes and engineering practices.
The site is located within a potential inundation area for an earthquake-induced dam failure,
however programs of review, modification, or total reconstruction of existing dams are intended to
ensure that all dams are capable of withstanding the maximum credible earthquake (MCE) for the
site. Therefore, the potential for inundation at the site as a result of an earthquake-induced dam
failure is considered low.
The site is in the 100-year flood (with flooding depth of less than one foot) to 500-year flood zone.
Site structures/elevations should be designed to minimize impacts of a flood event.
The potential for other geologic hazards such as liquefaction, seismic-induced settlement, slope
instability, tsunamis, and subsidence affecting the site is considered low.
PB Americas, Inc. - City of Anaheim 200 MW Peaking Power Plant October 10, 2007 MACTEC Engineering and Consulting, Inc., Project 4953-07-1741
16
7 RECOMMENDATIONS
The proposed major structures can be supported on mat or spread footing foundations established
on a 5-foot-thick layer of properly compacted fill soils. Smaller foundations may be supported on
spread footing foundations established in the natural soils or on properly compacted fill. Structures
with significant overturning loads may be supported on short drilled pile foundations. Floor slabs,
paving, and other slabs may be supported on natural soil or on properly compacted fill
7.1 MAT FOUNDATIONS
The combustion turbines and other major structures may be supported on mat foundations. We
understand that the concrete mat will have plan dimensions of about 30 feet by 80 feet and will
impose a foundation bearing pressure of about 2,000 pounds per square foot under static loading
conditions and have peak bearing pressure of about 4,000 pounds per square foot under seismic
loading conditions. The upper 5 feet of soil beneath the bottom of the mat foundation should be
removed and recompacted as properly compacted fill. The excavation and replacement of soil
beneath the mat should extend 5 feet beyond the edge of the mats horizontally.
Bearing Value
Mat foundations supported on properly compacted fill soils and at least 2 feet below the lowest
adjacent grade can be designed to impose an average net dead-plus-live load pressure of 2,000
pounds per square foot, as planned, with peak bearing values in limited areas of the mat up to 4,000
pounds per square foot.
Peak bearing values imposed under the mat due to wind or seismic loads may be up to 6,000
pounds per square foot.
The recommended bearing value is a net value, and the weight of concrete in the mat can be taken
as 50 pounds per cubic foot.

PB Americas, Inc. - City of Anaheim 200 MW Peaking Power Plant October 10, 2007 MACTEC Engineering and Consulting, Inc., Project 4953-07-1741
17
Settlement
We estimate the static settlement of the combustion turbines supported on mat foundations in the
manner recommended, will be less than ¾ inch. The majority of that settlement will occur during
construction; the settlement after completion of the construction will be less than ¼ inch.
Differential settlement is expected to be about ½ inch in 50 feet; differential settlement after the
completion of construction is expected to be less than ¼ inch in 50 feet.
Lateral Resistance
Lateral loads can be resisted by soil friction and by the passive resistance of the soils. A coefficient
of friction of 0.4 can be used between the mat and the supporting soils. The passive resistance of
properly compacted fill soils can be assumed to be equal to the pressure developed by a fluid with a
density of 250 pounds per cubic foot. A one-third increase in the passive value can be used for
wind or seismic loads. The frictional resistance and the passive resistance of the soils can be
combined without reduction in determining the total lateral resistance.
7.2 SPREAD FOOTINGS
It is anticipated that the administration building, control room, sound walls and lightly loaded
structures will be supported on conventional spread footings. Large water and chemical storage
tanks will be supported on ring wall foundations. The foundations for the buildings, sound walls,
and other lightly loaded structures may be supported on natural soil or properly compacted fill. The
foundations for the tanks should be underlain by at least 5 feet of properly compacted fill; the
excavation and replacement of soil beneath the tanks should extend at least 5 feet beyond the edge
of the ring foundations.
Bearing Value
Spread footings supported within properly compacted fill or native soils and at least 2 feet below
the lowest adjacent grade or floor level can be designed to impose a net dead-plus-live load
pressure of 3,000 pounds per square foot.

PB Americas, Inc. - City of Anaheim 200 MW Peaking Power Plant October 10, 2007 MACTEC Engineering and Consulting, Inc., Project 4953-07-1741
18
A one-third increase can be used for wind or seismic loads. The recommended bearing value is a
net value, and the weight of concrete in the footings can be taken as 50 pounds per cubic foot; the
weight of soil backfill can be neglected when determining the downward loads.
Settlement
We estimate the settlement of the foundations supported on spread footings in the manner
recommended, will be less than ¼ inch; the settlement of the tank will be less than ½ inch.
Differential settlement between adjacent footings is expected to be about ½ inch or less.
Lateral Resistance
Lateral loads can be resisted by soil friction and by the passive resistance of the soils. A coefficient
of friction of 0.4 can be used between the footings and the floor slab and the supporting soils. The
passive resistance of natural soils or properly compacted fill soils can be assumed to be equal to the
pressure developed by a fluid with a density of 250 pounds per cubic foot. A one-third increase in
the passive value can be used for wind or seismic loads. The frictional resistance and the passive
resistance of the soils can be combined without reduction in determining the total lateral resistance.
7.3 CAST-IN-DRILLED HOLE PILE FOUNDATIONS
We understand that plant equipment such as pipe racks and other structures with higher overturning
loads and/or sensitive to settlement and vibration may be supported on deep foundations. Drilled
piles (i.e. Cast-in-Drilled Hole - CIDH foundations) are recommended for this project. However,
some caving of the foundation excavations should be anticipated; the upper soils can be wetted to
help reduce caving, or other methods can be used such as casing. Recommendations regarding axial
and lateral capacity of the drilled piles are presented in the following sections.
Axial Capacities
The downward and upward axial capacities of 24-, 30-, and 36-inch-diameter CIDH concrete piles
as a function of penetration below the pile cap are presented on the Figure 5, Axial Pile Capacities.
The pile capacities shown on the Figure 5 are dead-plus-live load capacities; a one-third increase
may be used for wind or seismic loads. The capacities presented are based on the strength of the
PB Americas, Inc. - City of Anaheim 200 MW Peaking Power Plant October 10, 2007 MACTEC Engineering and Consulting, Inc., Project 4953-07-1741
19
soils; the compressive and tensile strengths of the pile sections should be checked to verify the
structural capacity of the piles.
Piles in groups should be spaced at least 3 diameters on centers. If the piles are so spaced, no
reduction in the downward and upward capacities of the piles due to group action need be
considered in design.
Settlement
We estimate the settlement of the structures supported completely on CIDH piles as recommended,
will be ¼ inch or less.
Lateral Resistance
Lateral loads may be resisted by the piles and by the passive resistance of the soils against pile
caps.
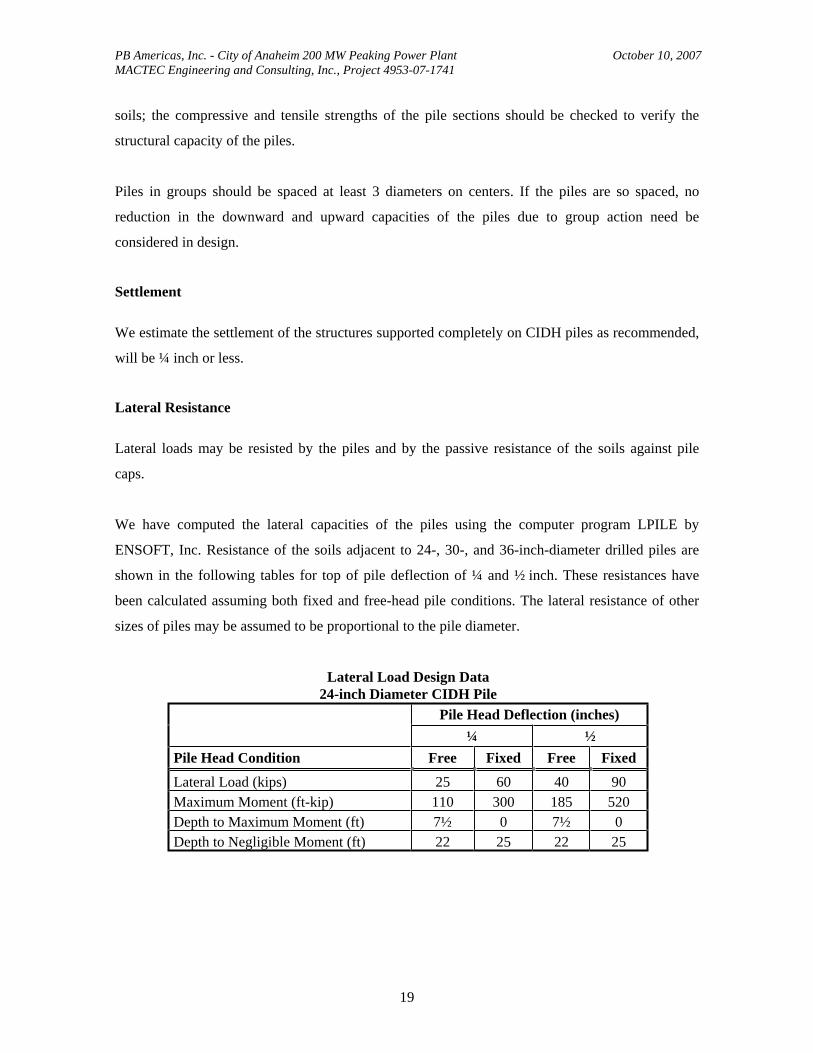
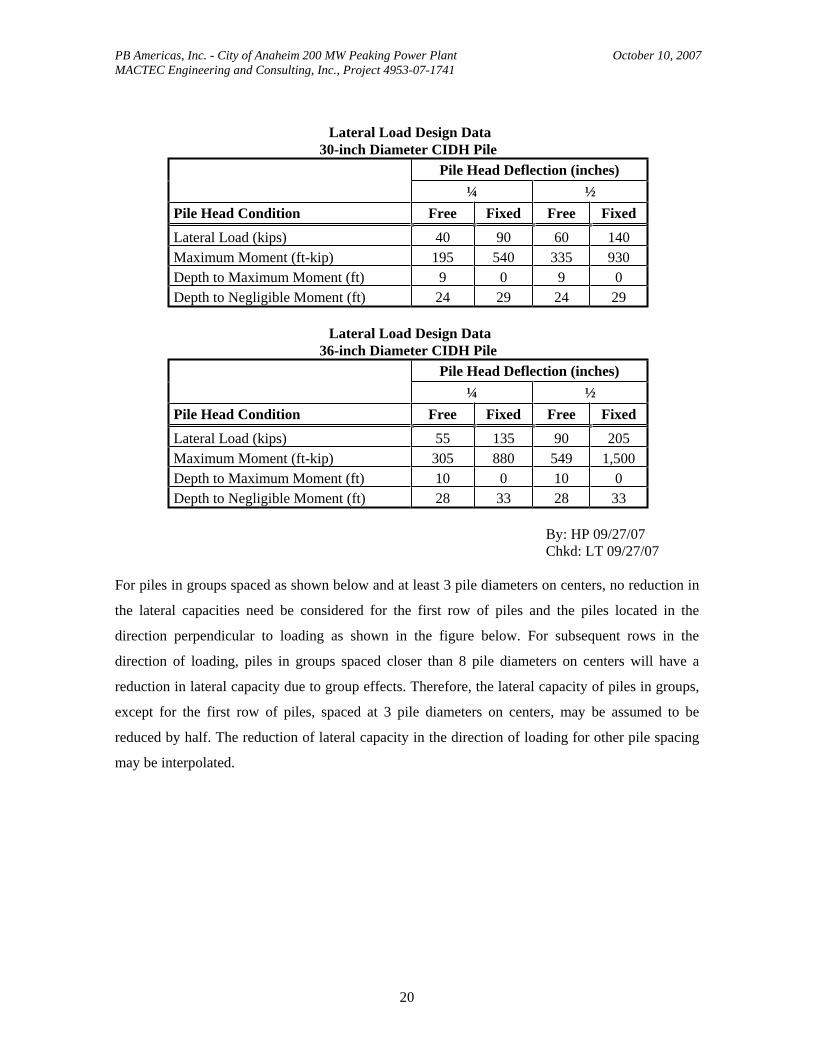
We have computed the lateral capacities of the piles using the computer program LPILE by
ENSOFT, Inc. Resistance of the soils adjacent to 24-, 30-, and 36-inch-diameter drilled piles are
shown in the following tables for top of pile deflection of ¼ and ½ inch. These resistances have
been calculated assuming both fixed and free-head pile conditions. The lateral resistance of other
sizes of piles may be assumed to be proportional to the pile diameter.
Lateral Load Design Data 24-inch Diameter CIDH Pile
Pile Head Deflection (inches) ¼ ½
Pile Head Condition Free Fixed Free Fixed Lateral Load (kips) 25 60 40 90 Maximum Moment (ft-kip) 110 300 185 520 Depth to Maximum Moment (ft) 7½ 0 7½ 0 Depth to Negligible Moment (ft) 22 25 22 25
PB Americas, Inc. - City of Anaheim 200 MW Peaking Power Plant October 10, 2007 MACTEC Engineering and Consulting, Inc., Project 4953-07-1741
20
Lateral Load Design Data 30-inch Diameter CIDH Pile
Pile Head Deflection (inches) ¼ ½
Pile Head Condition Free Fixed Free Fixed Lateral Load (kips) 40 90 60 140 Maximum Moment (ft-kip) 195 540 335 930 Depth to Maximum Moment (ft) 9 0 9 0 Depth to Negligible Moment (ft) 24 29 24 29
Lateral Load Design Data 36-inch Diameter CIDH Pile
Pile Head Deflection (inches) ¼ ½
Pile Head Condition Free Fixed Free Fixed Lateral Load (kips) 55 135 90 205 Maximum Moment (ft-kip) 305 880 549 1,500 Depth to Maximum Moment (ft) 10 0 10 0 Depth to Negligible Moment (ft) 28 33 28 33
By: HP 09/27/07 Chkd: LT 09/27/07
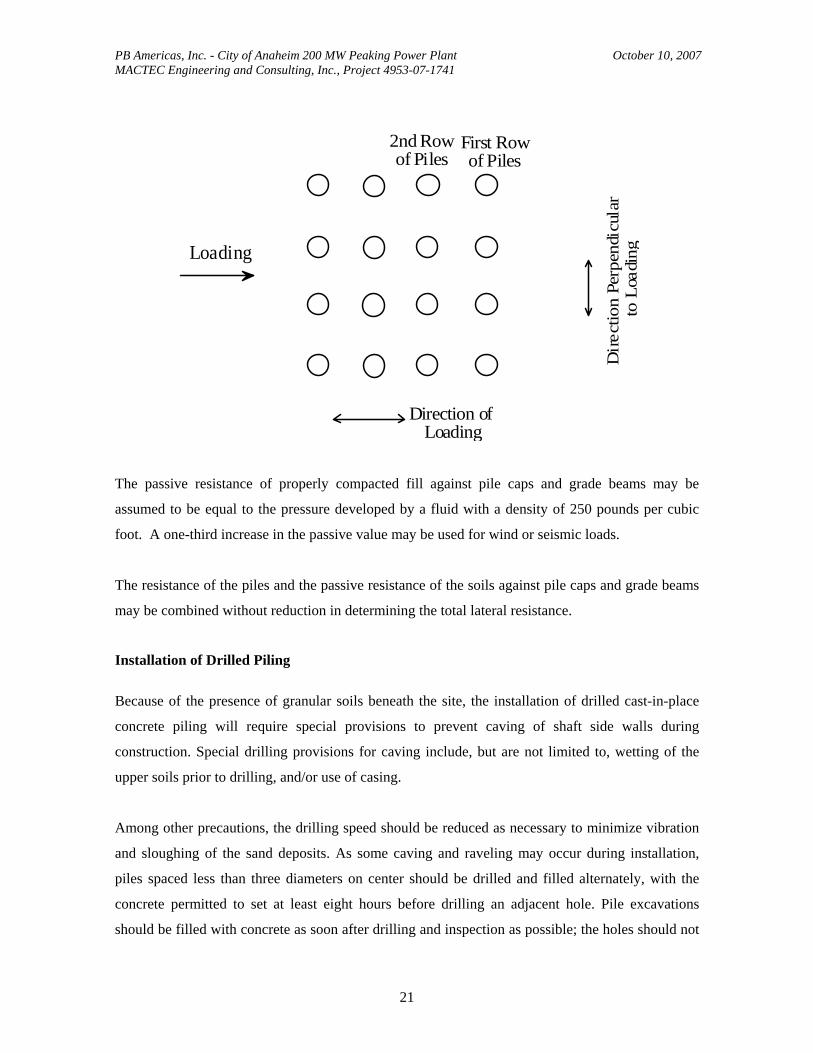
For piles in groups spaced as shown below and at least 3 pile diameters on centers, no reduction in
the lateral capacities need be considered for the first row of piles and the piles located in the
direction perpendicular to loading as shown in the figure below. For subsequent rows in the
direction of loading, piles in groups spaced closer than 8 pile diameters on centers will have a
reduction in lateral capacity due to group effects. Therefore, the lateral capacity of piles in groups,
except for the first row of piles, spaced at 3 pile diameters on centers, may be assumed to be
reduced by half. The reduction of lateral capacity in the direction of loading for other pile spacing
may be interpolated.
PB Americas, Inc. - City of Anaheim 200 MW Peaking Power Plant October 10, 2007 MACTEC Engineering and Consulting, Inc., Project 4953-07-1741
21
Loading
Direction of Loading
Dire
ctio
n Pe
rpen
dicu
lar
toLo
adin
g
First Rowof Piles
2nd Rowof Piles
The passive resistance of properly compacted fill against pile caps and grade beams may be
assumed to be equal to the pressure developed by a fluid with a density of 250 pounds per cubic
foot. A one-third increase in the passive value may be used for wind or seismic loads.
The resistance of the piles and the passive resistance of the soils against pile caps and grade beams
may be combined without reduction in determining the total lateral resistance.
Installation of Drilled Piling
Because of the presence of granular soils beneath the site, the installation of drilled cast-in-place
concrete piling will require special provisions to prevent caving of shaft side walls during
construction. Special drilling provisions for caving include, but are not limited to, wetting of the
upper soils prior to drilling, and/or use of casing.
Among other precautions, the drilling speed should be reduced as necessary to minimize vibration
and sloughing of the sand deposits. As some caving and raveling may occur during installation,
piles spaced less than three diameters on center should be drilled and filled alternately, with the
concrete permitted to set at least eight hours before drilling an adjacent hole. Pile excavations
should be filled with concrete as soon after drilling and inspection as possible; the holes should not

PB Americas, Inc. - City of Anaheim 200 MW Peaking Power Plant October 10, 2007 MACTEC Engineering and Consulting, Inc., Project 4953-07-1741
22
be left open overnight. A collar should be placed around the mouth of the shaft after drilling to
prevent soils from entering the excavation, and the pile shafts should be covered until concrete is
placed.
Concrete should be pumped from the bottom up through a rigid pipe extending to the bottom of the
drilled excavation, with the pipe being slowly withdrawn as the concrete level rises. The discharge
end of the pipe should be at least 5 feet below the surface of the concrete at all times during
placement. The discharge pipe should be kept full of concrete during the entire placing operation
and should not be removed from the concrete until all of the concrete is placed and fresh concrete
appears at the top of the pile. The volume of concrete pumped into the hole should be recorded and
compared to design volume.
Only competent drilling contractors with experience in the installation of drilled cast-in-place piles
in similar soil conditions should be considered for the pile construction. We suggest requesting the
piling contractor to submit a list of similar projects along with references for each project.
The drilling of the pile excavations and the placing of the concrete should be observed
continuously geotechnical personnel to verify that the desired diameter and depth of piles are
achieved.
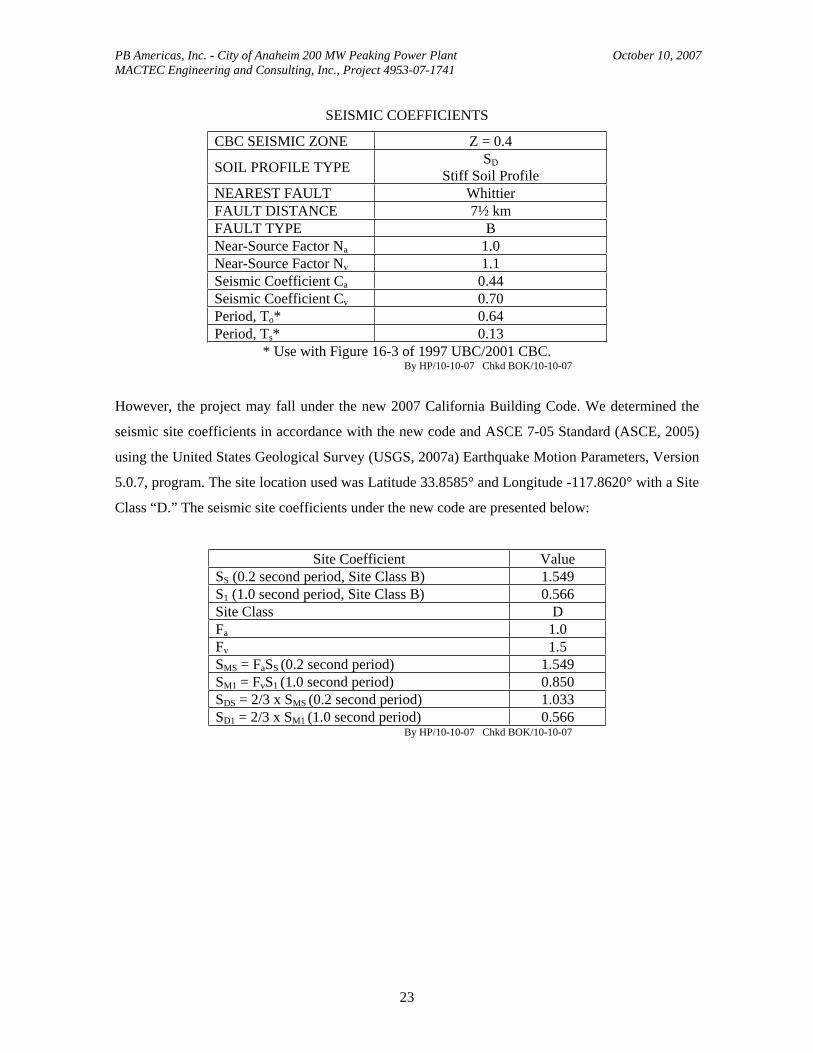
7.4 SITE COEFFICIENT AND SEISMIC ZONATION
The fault nearest the site is the Whittier fault, which has been determined to be a Type B seismic
source by the California Division of Mines and Geology. According to Map N-33 in the 1998
publication from the International Conference of Building Officials entitled “Maps of Known
Active Fault Near-Source Zones in California and Adjacent Portions of Nevada,” the site is located
at a distance of approximately 7½ kilometers from the Whittier fault.
Under the Earthquake Design regulations of Chapter 16, Divisions IV and V of the 1997 UBC and
the 2001 edition of the CBC, the following coefficients and factors apply to lateral-force design for
the building:
PB Americas, Inc. - City of Anaheim 200 MW Peaking Power Plant October 10, 2007 MACTEC Engineering and Consulting, Inc., Project 4953-07-1741
23
SEISMIC COEFFICIENTS
CBC SEISMIC ZONE Z = 0.4
SOIL PROFILE TYPE SDStiff Soil Profile
NEAREST FAULT Whittier FAULT DISTANCE 7½ km FAULT TYPE B Near-Source Factor Na 1.0 Near-Source Factor Nv 1.1 Seismic Coefficient Ca 0.44 Seismic Coefficient Cv 0.70 Period, To* 0.64 Period, Ts* 0.13
* Use with Figure 16-3 of 1997 UBC/2001 CBC. By HP/10-10-07 Chkd BOK/10-10-07
However, the project may fall under the new 2007 California Building Code. We determined the
seismic site coefficients in accordance with the new code and ASCE 7-05 Standard (ASCE, 2005)
using the United States Geological Survey (USGS, 2007a) Earthquake Motion Parameters, Version
5.0.7, program. The site location used was Latitude 33.8585° and Longitude -117.8620° with a Site
Class “D.” The seismic site coefficients under the new code are presented below:
Site Coefficient Value SS (0.2 second period, Site Class B) 1.549 S1 (1.0 second period, Site Class B) 0.566 Site Class D Fa 1.0 Fv 1.5 SMS = FaSS (0.2 second period) 1.549 SM1 = FvS1 (1.0 second period) 0.850 SDS = 2/3 x SMS (0.2 second period) 1.033 SD1 = 2/3 x SM1 (1.0 second period) 0.566
By HP/10-10-07 Chkd BOK/10-10-07
PB Americas, Inc. - City of Anaheim 200 MW Peaking Power Plant October 10, 2007 MACTEC Engineering and Consulting, Inc., Project 4953-07-1741
24
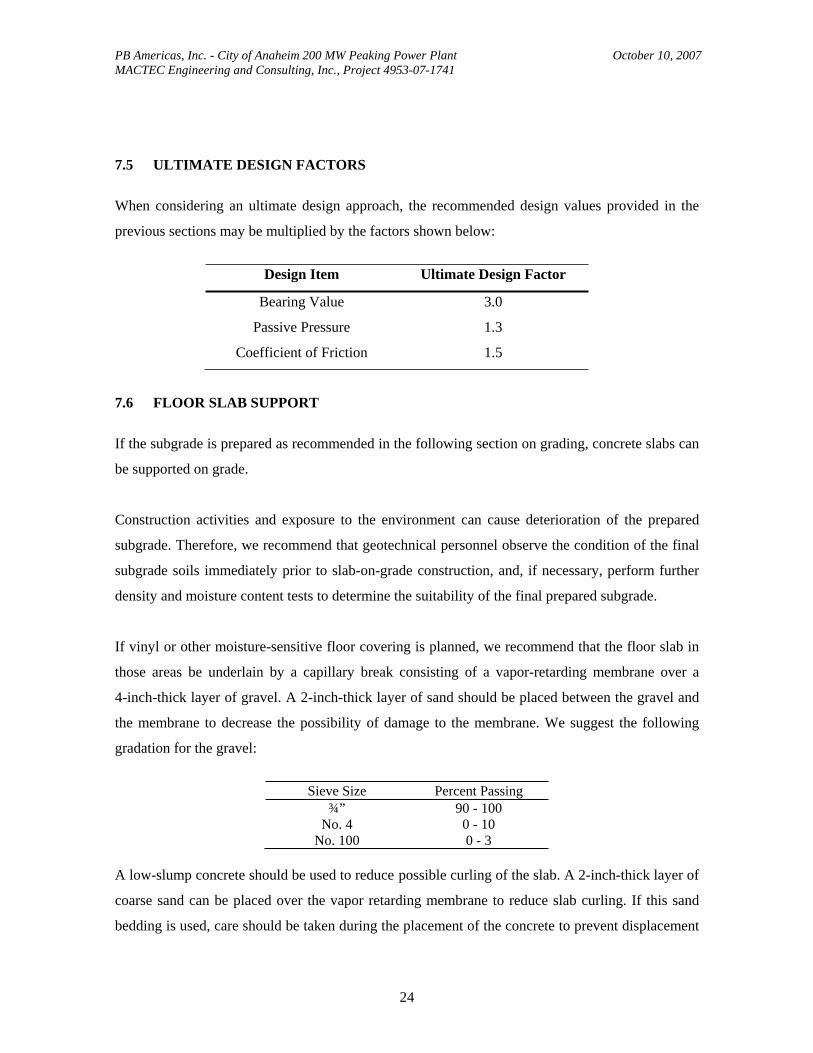
7.5 ULTIMATE DESIGN FACTORS
When considering an ultimate design approach, the recommended design values provided in the
previous sections may be multiplied by the factors shown below:
Design Item Ultimate Design Factor
Bearing Value 3.0
Passive Pressure 1.3
Coefficient of Friction 1.5
7.6 FLOOR SLAB SUPPORT
If the subgrade is prepared as recommended in the following section on grading, concrete slabs can
be supported on grade.
Construction activities and exposure to the environment can cause deterioration of the prepared
subgrade. Therefore, we recommend that geotechnical personnel observe the condition of the final
subgrade soils immediately prior to slab-on-grade construction, and, if necessary, perform further
density and moisture content tests to determine the suitability of the final prepared subgrade.
If vinyl or other moisture-sensitive floor covering is planned, we recommend that the floor slab in
those areas be underlain by a capillary break consisting of a vapor-retarding membrane over a
4-inch-thick layer of gravel. A 2-inch-thick layer of sand should be placed between the gravel and
the membrane to decrease the possibility of damage to the membrane. We suggest the following
gradation for the gravel:
Sieve Size Percent Passing ¾” 90 - 100
No. 4 0 - 10 No. 100 0 - 3
A low-slump concrete should be used to reduce possible curling of the slab. A 2-inch-thick layer of
coarse sand can be placed over the vapor retarding membrane to reduce slab curling. If this sand
bedding is used, care should be taken during the placement of the concrete to prevent displacement

PB Americas, Inc. - City of Anaheim 200 MW Peaking Power Plant October 10, 2007 MACTEC Engineering and Consulting, Inc., Project 4953-07-1741
25
of the sand. The concrete slab should be allowed to cure properly before placing vinyl or other
moisture-sensitive floor covering.
7.7 RETAINING WALLS
Minor retaining wall may be necessary at the site. In this section, data are given for the following
retaining wall design considerations:
Lateral earth pressure (for design of cantilevered retaining walls below grade).
Seismic lateral earth pressure (for design of retaining walls over 12 feet high).
Drainage.
Lateral Earth Pressure
For design of cantilevered retaining walls, where the surface of the backfill is level, it can be
assumed that drained soils will exert a lateral pressure equal to that developed by a fluid with a
density of 30 pounds per cubic foot. Where walls are prevented from deflecting, it can be assumed
that drained soils will exert a lateral pressure equal to that developed by a fluid with a density of 85
pounds per cubic foot (at-rest pressure) where the surface of the backfill is level. In addition to the
recommended earth pressure, the walls should be designed to resist any applicable surcharges due
to storage or traffic loads.
In addition to the recommended earth pressure, retaining walls adjacent to areas subject to
vehicular traffic should be designed to resist a uniform lateral pressure of 100 pounds per square
foot, acting as a result of an assumed 250 pounds per square foot surcharge behind the walls due to
normal vehicular traffic. If the traffic is kept back at least 10 feet from the walls, the traffic
surcharge can be neglected.
Seismic Lateral Earth Pressure
In addition to the above-mentioned lateral earth pressures, retaining walls more than 12 feet high
should be designed to support a seismic active pressure. The recommended seismic active pressure

PB Americas, Inc. - City of Anaheim 200 MW Peaking Power Plant October 10, 2007 MACTEC Engineering and Consulting, Inc., Project 4953-07-1741
26
distribution on the wall is illustrated in the following diagram with the maximum pressure equal to
2H pounds per square foot, where H is the wall height in feet.
Drainage
Retaining walls should be designed to resist hydrostatic pressures or be provided with a drain pipe
or weepholes. The drain could consist of a 4-inch-diameter perforated pipe placed with perforations
down at the base of the wall. The pipe should be sloped at least 2 inches in 100 feet and surrounded
by filter gravel. The filter gravel should meet the requirements of Class 2 Permeable Material as
defined in the current State of California, Department of Transportation, Standard Specifications.
If Class 2 Permeable Material is not available, ¾-inch crushed rock or gravel separated from the
on-site soils by an appropriate filter fabric can be used. The crushed rock or gravel should have less
than 5% passing a No. 200 sieve.
7.8 PAVING
To provide support for paving, the subgrade soils should be prepared as recommended in the
following section on grading. Compaction of the subgrade, including trench backfills, to at least
90%, and achieving a firm, hard, and unyielding surface will be important for paving support. The
P.S.F.)
2H
H = HEIGHT OF WALL
IN FEET

PB Americas, Inc. - City of Anaheim 200 MW Peaking Power Plant October 10, 2007 MACTEC Engineering and Consulting, Inc., Project 4953-07-1741
27
preparation of the paving area subgrade should be done immediately prior to placement of the base
course. Proper drainage of the paved areas should be provided since this will reduce moisture
infiltration into the subgrade and increase the life of the paving.
To provide data for design of asphalt paving, the R-value of a sample of the upper soils was
determined. The test results, which indicate an R-value of 67, are presented in Appendix A. An R-
value of 45 was used in the pavement design.
Asphaltic Paving
The required paving and base thicknesses will depend on the expected wheel loads and volume of
traffic (Traffic Index or TI). Assuming that the paving subgrade will consist of the on-site or
comparable soils compacted to at least 90% as recommended, the minimum recommended paving
thicknesses are presented in the following table.
Paving Thickness
Traffic Index Asphalt (Inches)
Base Course (Inches)
45
33
44
6 4 4 7 4 6 8 5 6½ 9 6 7
The asphalt paving sections were determined using the Caltrans design method. We can determine
the recommended paving and base course thicknesses for other Traffic Indices if required. Careful
inspection is recommended to verify that the recommended thicknesses or greater are achieved, and
that proper construction procedures are followed.
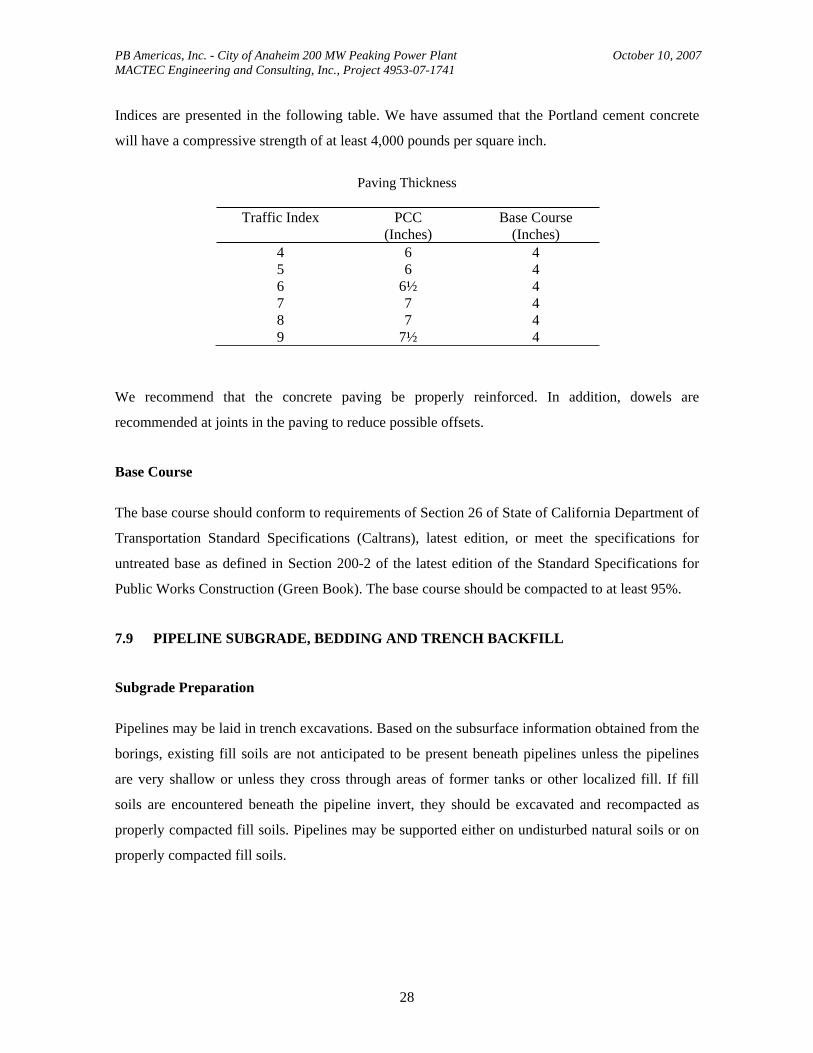
Portland Cement Concrete Paving
Portland cement concrete (PCC) paving sections were determined in accordance with procedures
developed by the Portland Cement Association. Concrete paving sections for a range of Traffic
PB Americas, Inc. - City of Anaheim 200 MW Peaking Power Plant October 10, 2007 MACTEC Engineering and Consulting, Inc., Project 4953-07-1741
28
Indices are presented in the following table. We have assumed that the Portland cement concrete
will have a compressive strength of at least 4,000 pounds per square inch.
Paving Thickness
Traffic Index PCC (Inches)
Base Course (Inches)
45
66
44
6 6½ 4 7 7 4 8 7 4 9 7½ 4
We recommend that the concrete paving be properly reinforced. In addition, dowels are
recommended at joints in the paving to reduce possible offsets.
Base Course
The base course should conform to requirements of Section 26 of State of California Department of
Transportation Standard Specifications (Caltrans), latest edition, or meet the specifications for
untreated base as defined in Section 200-2 of the latest edition of the Standard Specifications for
Public Works Construction (Green Book). The base course should be compacted to at least 95%.
7.9 PIPELINE SUBGRADE, BEDDING AND TRENCH BACKFILL
Subgrade Preparation
Pipelines may be laid in trench excavations. Based on the subsurface information obtained from the
borings, existing fill soils are not anticipated to be present beneath pipelines unless the pipelines
are very shallow or unless they cross through areas of former tanks or other localized fill. If fill
soils are encountered beneath the pipeline invert, they should be excavated and recompacted as
properly compacted fill soils. Pipelines may be supported either on undisturbed natural soils or on
properly compacted fill soils.

PB Americas, Inc. - City of Anaheim 200 MW Peaking Power Plant October 10, 2007 MACTEC Engineering and Consulting, Inc., Project 4953-07-1741
29
The excavation for the pipeline and the placing of the bedding material should be carefully
performed in order to prevent loose or disturbed soils from remaining in the bottom of the
excavation.
Pipe Bedding and Pipe Zone Backfill
Typical pipe bedding and pipe zone backfill details are shown on Figure 6, Typical Pipe Backfill
and Pipeline Trench Conditions. Unshaped bedding is typically used for pipeline support. Material
for pipe bedding and pipe-zone backfill could be either on-site sandy soils or imported sand and
gravelly sand, free from organic matter, loam, contaminates, or other deleterious substances. The
material should meet the gradation requirements shown below when tested in accordance with
ASTM D422. Based on the information obtained during our field explorations, it is our opinion
that in general, the on-site sandy soils may be suitable for the pipe-bedding or pipe zone backfill.
This should be checked during the construction.
SieveSize No.
Percentage Passing Sieve (by weight)
½” 100
4 70-10
16 50-90
50 10-40
200 0-10
To provide a uniform bearing condition, we recommend a minimum 6-inch layer of bedding
material be placed beneath pipes. Pipe zone backfill will be required all around proposed pipes and
to a height of 6 inches above the top of pipes. The pipe bedding and pipe zone backfill materials
should be compacted to at least 95% and 90% of the maximum density obtainable by the ASTM
Designation D1557-02 method of compaction, respectively.
The pipe-zone backfill materials may be compacted in place by vibration or may be backfilled with
1- to 1½-sack sand-cement slurry.
We recommend that the backfill along the sides of the pipe be placed simultaneously and brought
up to at least the top of the pipe in equal lifts and level heights during the backfill operation.

PB Americas, Inc. - City of Anaheim 200 MW Peaking Power Plant October 10, 2007 MACTEC Engineering and Consulting, Inc., Project 4953-07-1741
30
Trench Backfill
The soils at the site are suitable for use as trench backfill less any debris, vegetation, and cobbles
larger than 6 inches. Although not anticipated, to avoid nesting of larger particles, the trench
backfill should not contain more than 10% of particles greater than 3 inches. We recommend these
soils be compacted by mechanical means.
Any required imported fill should consist of relatively non-expansive soils (expansion index less
than 35 per ASTM D-4829). Imported fill material should contain sufficient fines (binder material)
so the resulting compacted fill will not rut under the wheels of compaction equipment. The use of
cobbles or rock fragments larger than 3 inches in size should be avoided. Nesting of these materials
should be avoided.
After placement of pipe zone backfill around the pipe, the final backfill above the pipe zone (as
shown on Figure 6a) should be placed in layers and mechanically compacted to at least 90% of the
maximum dry density obtainable by the ASTM Designation D 1557-02 method of compaction with
the exception of the upper 3 feet of backfill beneath pavements which should be compacted to at
least 95% of the maximum dry density obtainable by the ASTM Designation D 1557-02 method of
compaction. Any required fill should be placed in horizontal lifts, not more than 12 inches in loose
thickness. It is recommended that the soils be compacted at moisture contents ranging from
optimum moisture content to 2% above optimum moisture content at the time of compaction.
7.10 DYNAMIC CHARACTERISTICS OF SOIL
The dynamic shear modulus (small-strain shear modulus), Gmax, may be taken as 5,000,000 pounds
per square foot. The poisson’s ratio of the soil may be taken as 0.3. The material damping ratio of
the soil (small strain) may be taken as 0.5%. The depth to rigid layer at the site may be taken as
infinite (with respect to the size of the foundations). The total unit soil weight (for the purpose of
dynamic computations) may be taken as 110 pounds per cubic foot.
A vertical modulus of subgrade reaction of 200 pounds per cubic inch may be used. This value is a
unit value for use with a 1-foot-square area. The modulus should be reduced in accordance with the
following equation when used with the larger foundations:

PB Americas, Inc. - City of Anaheim 200 MW Peaking Power Plant October 10, 2007 MACTEC Engineering and Consulting, Inc., Project 4953-07-1741
31
2
21
BB
KKR
Where K = unit subgrade modulus KR = reduced subgrade modulusB = foundation width
7.11 GRADING
Beneath the turbines and the tanks, the upper 5 feet of soil (measured from the bottom of
foundations) should be excavated and replaced as properly compacted fill. The overexcavation
should extend laterally at least 5 feet beyond the edge of foundations. In other areas of the site
(including those to have pavement or hardscape), the existing fill and disturbed natural soils should
be excavated and replaced as properly compacted fill. All required fill should be uniformly well
compacted and observed and tested during placement. The on-site soils can be used in any required
fill.
This section gives recommendations for the following grading considerations:
Site preparation (includes specifications for compaction of natural soils). Excavations and temporary slopes. Compaction (specifications for fill compaction). Backfill (specifications for backfill compaction). Material for fill (specifications for on-site and import materials).
Site Preparation
After the site is cleared and existing fill and soils within the upper 5 feet of final subgrade beneath
the turbine and tank foundations are excavated as recommended, the exposed natural soils should
be carefully observed for the removal of all unsuitable deposits. Next, the exposed soils should be
scarified to a depth of 6 inches, brought to near-optimum moisture content, and rolled with heavy
compaction equipment. At least the upper 6 inches of the exposed soils should be compacted to at
least 95% of the maximum dry density obtainable by the ASTM Designation D1557-02 method of
compaction.
Excavations and Temporary Slopes
PB Americas, Inc. - City of Anaheim 200 MW Peaking Power Plant October 10, 2007 MACTEC Engineering and Consulting, Inc., Project 4953-07-1741
32
Where excavations are deeper than about 4 feet, the sides of the excavations should be sloped back
at 1½:1 (horizontal to vertical) or shored for safety. Unshored excavations should not extend below
a plane drawn at 1½:1 (horizontal to vertical) extending downward from adjacent existing footings.
We would be pleased to present data for design of shoring if required.
Excavations should be observed by geotechnical personnel so that any necessary modifications
based on variations in the soil conditions can be made. All applicable safety requirements and
regulations, including OSHA regulations, should be met.
Compaction
Any required fill should be placed in loose lifts not more than 8-inches-thick and compacted. The
fill should be compacted to at least 95% of the maximum density obtainable by the ASTM
Designation D1557-02 method of compaction. The moisture content of the on-site soils at the time
of compaction should vary no more than 2% below or above optimum moisture content.
Backfill
All required backfill should be mechanically compacted in layers; flooding should not be
permitted. Proper compaction of backfill will be necessary to reduce settlement of the backfill and
to reduce settlement of overlying slabs and paving. Backfill should be compacted to at least 90% of
the maximum dry density obtainable by the ASTM Designation D1557-02 method of compaction.
The on-site soils can be used in the compacted backfill. The exterior grades should be sloped to
drain away from the foundations to prevent ponding of water.
Some settlement of the backfill should be expected, and any utilities supported therein should be
supported on drilled piles or designed to accept differential settlement. Also, provisions should be
made for some settlement of concrete walks supported on backfill.
Material for Fill
The on-site soils, less any debris or organic matter, can be used in required fills. Cobbles larger
than 4 inches in diameter should not be used in the fill. Any required import material should consist
of relatively non-expansive soils with an expansion index of less than 35. The imported materials
should contain sufficient fines (binder material) so as to be relatively impermeable and result in a

PB Americas, Inc. - City of Anaheim 200 MW Peaking Power Plant October 10, 2007 MACTEC Engineering and Consulting, Inc., Project 4953-07-1741
33
stable subgrade when compacted. All proposed import materials should be approved by
geotechnical personnel prior to being placed at the site.
7.12 GEOTECHNICAL OBSERVATION
The reworking of the upper soils and the compaction of all required fill should be observed and
tested during placement by geotechnical personnel. The geotechnical personnel should perform at
least the following duties:
Observe the clearing and grubbing operations for proper removal of all unsuitable materials.
Observe the exposed subgrade in areas to receive fill and in areas where excavation has resulted in the desired finished subgrade. The geotechnical personnel should also observe proofrolling and delineation of areas requiring overexcavation.
Evaluate the suitability of on-site and import soils for fill placement; collect and submit soil samples for required or recommended laboratory testing where necessary.
Observe the fill and backfill for uniformity during placement.
Test backfill for field density and compaction to determine the percentage of compaction achieved during backfill placement.
Observe and probe foundation materials to confirm that suitable bearing materials are present at the design foundation depths.
The governmental agencies having jurisdiction over the project should be notified prior to
commencement of grading so that the necessary grading permits can be obtained and arrangements
can be made for required inspection(s). The contractor should be familiar with the inspection
requirements of the reviewing agencies.
PB Americas, Inc. - City of Anaheim 200 MW Peaking Power Plant October 10, 2007 MACTEC Engineering and Consulting, Inc., Project 4953-07-1741
34
8 GENERAL LIMITATIONS AND BASIS FOR RECOMMENDATIONS
Our professional services have been performed using that degree of care and skill ordinarily
exercised, under similar circumstances, by reputable geotechnical consultants practicing in this or
similar localities. No other warranty, expressed or implied, is made as to the professional advice
included in this report. This report has been prepared for PB Americas and their design consultants
to be used solely in the design of the proposed Anaheim Power Plant. The report has not been
prepared for use by other parties, and may not contain sufficient information for purpose of other
parties or other uses.
The recommendations provided in this report are based upon our understanding of the described
project information and on our interpretation of the data collected during our current and prior
subsurface explorations. We have made our recommendations based upon experience with similar
subsurface conditions under similar loading conditions. The recommendations apply to the specific
project discussed in this report; therefore, any change in the structure configuration, loads, location,
or the site grades should be provided to us so that we can review our conclusions and
recommendations and make any necessary modifications.

PB Americas, Inc. - City of Anaheim 200 MW Peaking Power Plant October 10, 2007 MACTEC Engineering and Consulting, Inc., Project 4953-07-1741
35
9 BIBILIOGRAPHY
Anaheim, City of, 2004, “Safety Element of the General Plan.”
California Division of Mines and Geology, 1998, “State of California Seismic Hazard Zones, Orange Quadrangle, Official Map,” released April 15, 1998.
California Division of Mines and Geology, 1997, “Seismic Hazard Evaluation of the Orange Quadrangle, Los Angeles County, California,” Seismic Hazard Zone Report 011, revised 2006.
California Division of Oil, Gas, and Geothermal Resources, Maps W1-5 and W-1-6.
California Geological Survey, 2006, “Estimation of Future Earthquake Losses in California,” http://www.consrv.ca.gov/cgs/rghm/loss/index.htm.
California Geological Survey, 2003, “The Revised 2002 California Probabilistic Seismic Hazard Maps, June 2003” Appendix A – 2002 California Fault Parameters.
Crook, R., Jr., Allen, C.R., Kamb, R., Bayne, C.M., and Proctor, R.J., 1987, “Quaternary Geology and Seismic Hazard of the Sierra Madre and Associated Faults of the Western San Gabriel Mountains,” in U.S. Geological Survey Professional Paper 1339. Ch. 2, pp. 27-63.
Dolan, J.F., Christofferson, S.A., and Shaw, J.H., 2003, “Recognition of Paleoearthquakes on the Puente Hills Blind Thrust Fault, California,” Science, Vol. 300, pp. 115-118.
Dolan, J. F., Sieh, K., Rockwell, T. K. Yeats, R.S., Shaw J., Suppe, J., Huftile, G., and Gath, E., 1995, “Prospects for Larger or More Frequent Earthquakes in the Los Angeles Metropolitan Region, California,” Science, Vol. 267, 199-205 pp.
Grant, L. B., Ballenger, L. J., and Runnerstrom, E. E., 2002, “Coastal Uplift of the San Joaquin Hills, Southern Los Angeles Basin, California, by a Large Earthquake Since A. D. 1635,” Bulletin of the Seismological Society of America, Vol. 92, No. 2, pp. 590-599.
Grant, L. B., Mueller, K. J., Gath, E. M., and Munro, R., 2000, “Late Quaternary Uplift and Earthquake Potential of the San Joaquin Hills, Southern Los Angeles Basin, California: Reply,” Geology, Vol. 28, No. 4, p. 384.
Grant, L. B., Mueller, K. J., Gath, E. M., Cheng, H., Edwards, R.E., and Munro, R., 1999, “Late Quaternary Uplift and Earthquake Potential of the San Joaquin Hills, Southern Los Angeles Basin, California” Geology, Vol. 27, p. 1031-1034.
Hart, E. W., 1973, revised 1999, "Fault-Rupture Hazard Zones in California, Alquist-Priolo Earthquake Fault Zoning Act with Index to Earthquake Fault Zone Maps," California Division of Mines and Geology Special Publication 42.
Hummon, C., Schneider, C. L., Yeats, R. S., Dolan, J.F., Sieh, K. E., and Huftile, G. J., 1994, “Wilshire Fault: Earthquakes in Hollywood?,” Geology, Vol. 22, pp. 291-294.

PB Americas, Inc. - City of Anaheim 200 MW Peaking Power Plant October 10, 2007 MACTEC Engineering and Consulting, Inc., Project 4953-07-1741
36
Jennings, C. W., 1994, "Fault Activity Map of California and Adjacent Areas with Locations and Ages of Recent Volcanic Eruptions," California Division of Mines and Geology Map No. 6.
LeRoy Crandall and Associates, 1978, “Report of Geologic Studies Related to Raymond Fault Identification, San Marino High School, San Marino, California,” for the San Marino Unified School District, Job No. E-77186.
Mark, R. K., 1977, "Application of Linear Statistical Models of Earthquake Magnitude Versus Fault Length in Estimating Maximum Expectable Earthquakes," Geology, Vol. 5, pp. 464-466.
Oskin, M., Sieh, K., Rockwell, T., Miller, G., Guptill, P., Curtis, M., McArdle, S., and Elliott, P., 2000, “Active Parasitic Folds on the Elysian Park Anticline, Implications for Seismic Hazard in Central Los Angeles, California”, Geological Society of America Bulletin, Vol. 112, No. 5, pp.693-707.
Petersen, M. D., Bryant, W. A., Cramer, C. H., Cao, T., Reichle, M. S., Frankel, A. D., Lienkaemper, J. J., McCrory, P. A., and Schwatz, D. P., 1996, “Probabilistic Seismic Hazard Assessment for the State of California,” California Division of Mines and Geology Open File Report 96-08.
Pratt, T.L. et al., 2002, “Shallow Seismic Imaging of Folds Above the Puente Hill Blind-Thrust Fault, Los Angeles, California,” Geophysical Research Letters, Vol. 29, No. 9, pp. 18-1-18-4.
Risk Engineering, Inc., 2007, EZ-FRISK, version 7.22.
Rubin, C. M., Lindvall, S. C., and Rockwell, T. K., 1998, “Evidence for Large Earthquakes in Metropolitan Los Angeles,” Science, p. 398-402.
Shaw, J. H. et al., 2002, “Puente Hills Blind-Thrust System Los Angeles, California,” Bulletin of the Seismological Society of America, Vol. 92, No. 8, pp. 2946-2960.
Slemmons, D. B., 1979, “Evaluation of Geomorphic Features of Active Faults for Engineering Design and Siting Studies,” Association of Engineering Geologists Short Course.
Southern California Seismographic Network, 2007, “Southern California Earthquake Catalog,” http://www.scecdc.scec.org/ftp/catalogs/SCSN/.
Triemen, J.A., 1991, “Whittier Fault Zone, Los Angeles and Orange Counties, California,” California Division of Mines and Geology Fault Evaluation Report FER-222.
Tucker, A. Z. and Dolan J. F., 2001, “Paleoseismic evidence for a > 8 ka age of the most recent surface rupture on the eastern Sierra Madre fault, northern Los Angeles metropolitan region, California” Bulletin of the Seismological Society of America, v. 91, p. 232-249.
Weaver, K. D. and Dolan, J. F., 2000, “Paleoseismology and Geomorphology of the Raymond Fault, Los Angeles County, California,” Bulletin of the Seismological Society of America, Vol. 90, p. 1409-1429.
PB Americas, Inc. - City of Anaheim 200 MW Peaking Power Plant October 10, 2007 MACTEC Engineering and Consulting, Inc., Project 4953-07-1741
37
Wesnousky, S. G., 1986, "Earthquakes, Quaternary Faults and Seismic Hazard in California," Journal of Geophysical Research, Vol. 91, No. B12, pp. 12,587-12,631.
Working Group on California Earthquake Probabilities, 1995, “Seismic Hazards in Southern California: Probable Earthquakes, 1994 to 2024,” Bulletin of the Seismological Society of America, Vol. 85, No. 2.
Yeats, R.S., 2004, “Tectonics of the San Gabriel Basin and Surroundings, Southern California,” Geological Society of America Bulletin, Vol. 116, No. 9/10, pp. 1158-1182.
Yerkes, R. F., 1972, “Geology and Oil Resources of the Western Puente Hills Area, Southern California,” U.S. Geological Survey Professional Paper 420-C.
Ziony, J. I., and Jones, L. M., 1989, “Map Showing Late Quaternary Faults and 1978–1984 Seismicity of the Los Angeles Region, California,” U.S. Geological Survey Miscellaneous Field Studies Map MF-1964.

PB Americas, Inc. - City of Anaheim 200 MW Peaking Power Plant October 10, 2007 MACTEC Engineering and Consulting, Inc., Project 4953-07-1741
TABLES

PB Americas, Inc. - City of Anaheim 200 MW Peaking Power Plant October 10, 2007 MACTEC Engineering and Consulting, Inc., Project 4953-07-1741
Table 1 Major Named Faults Considered to be Active
in Southern California
Fault(in increasing distance)
Maximum Magnitude
Slip Rate(mm/yr.)
Distance From Site (miles)
DirectionFrom Site
Puente Hills Blind Thrust 7.1 (a) BT 0.7 2.6 NW Whittier 6.8 (a) RO 2.5 5.1 NE Elsinore (Glen Ivy Segment) 6.8 (a) SS 5.0 11 ESE San Joaquin Hills 6.6 (a) BT 0.5 11 S Chino-Central Avenue 6.7 (a) RO 1.0 12 NE San Jose 6.4 (a) RO 0.5 13 NNE Newport-Inglewood Zone 7.1 (a) SS 1.0 15 SW Upper Elysian Park 6.4 (a) BT 1.3 19 NW Sierra Madre 7.2 (a) RO 2.0 19 N Cucamonga 6.9 (a) RO 5.0 21 NNE Raymond 6.5 (a) RO 1.5 22 NW Clamshell-Sawpit 6.5 (a) RO 0.5 23 N Palos Verdes 7.3 (a) SS 3.0 24 SW Verdugo 6.9 (a) RO 0.5 26 NW San Gabriel 7.2 (a) SS 1.0 26 N Hollywood 6.4 (a) RO 1.0 30 NW Santa Monica 6.6 (a) RO 1.0 33 NW San Jacinto (San Bernardino Segment) 6.7 (a) SS 12.0 34 NE San Andreas (Mojave Segment ) 7.4 (a) SS 30.0 37 NE San Andreas (San Bernardino Segment ) 7.5 (a) SS 24.0 37 NE San Fernando 6.7 (a) RO 2.0 39 NW Northridge Thrust 7.0 (a) BT 1.5 40 NW Malibu Coast 6.7 (a) RO 0.3 40 NW Anacapa-Dume 7.5 (a) RO 3.0 49 WNW Santa Susana 6.7 (a) RO 5.0 49 WNW Simi-Santa Rosa 7.0 (a) RO 1.0 56 NW
By PWK 10/8/07 checked RM 10/10/07
(a) California Geological Survey, 2003 SS Strike Slip NO Normal Oblique RO Reverse Oblique BT Blind Thrust

PB Americas, Inc. - City of Anaheim 200 MW Peaking Power Plant October 10, 2007 MACTEC Engineering and Consulting, Inc., Project 4953-07-1741
Table 2 Major Named Faults Considered to be Potentially Active
in Southern California
Fault(in increasing distance)
Maximum Magnitude
Slip Rate(mm/yr.)
Distance From Site (miles)
DirectionFrom Site
El Modeno 6.5 (b) NO 0.1 1.5 S Peralta Hills 6.5 (b) RO 0.1 1.9 SE Norwalk 6.7 (c) RO 0.1 4.8 WNWLos Alamitos 6.2 (b) SS 0.1 12 WSWPelican Hill 6.3 (b) SS 0.1 15 S Indian Hill 6.6 (b) RO 0.1 17 NNEDuarte 6.7 (c) RO 0.1 19 NNWMacArthur Park 5.7 (f) RO 3.0 26 NW Overland 6.0 (c) SS 0.1 30 NWCharnock 6.5 (c) SS 0.1 31 NWNorthridge Hills 6.6 (d) SS 1.2 42 NW
By PWK 10/8/07 checked RM 10/10/07
(b) Mark, 1977 (c) Slemmons, 1979
(d) Wesnousky, 1986 (e) Yeates, 2004 (f) Hummon et al, 1994
SS Strike Slip NO Normal Oblique RO Reverse Oblique BT Blind Thrust

PB Americas, Inc. - City of Anaheim 200 MW Peaking Power Plant October 10, 2007 MACTEC Engineering and Consulting, Inc., Project 4953-07-1741
By PWK 10/8/07 checked RM 10/10/07
Table 3 List Of Historic Earthquakes Of Magnitude 4.0 Or
Greater Within 100 Km Of The Site (CAL TECH DATA 1932-2007)
DATE TIME LATITUDE LONGITUDE Q DIST DEPTH MAGNITUDE
11-01-1932 04:45:00 34.00 N 117.25 W E 59 .0 4.0 03-11-1933 01:54:07 33.62 N 117.97 W A 28 .0 6.4 03-11-1933 02:04:00 33.75 N 118.08 W C 24 .0 4.9 03-11-1933 02:05:00 33.75 N 118.08 W C 24 .0 4.3 03-11-1933 02:09:00 33.75 N 118.08 W C 24 .0 5.0 03-11-1933 02:10:00 33.75 N 118.08 W C 24 .0 4.6 03-11-1933 02:11:00 33.75 N 118.08 W C 24 .0 4.4 03-11-1933 02:16:00 33.75 N 118.08 W C 24 .0 4.8 03-11-1933 02:17:00 33.60 N 118.00 W E 31 .0 4.5 03-11-1933 02:22:00 33.75 N 118.08 W C 24 .0 4.0 03-11-1933 02:27:00 33.75 N 118.08 W C 24 .0 4.6 03-11-1933 02:30:00 33.75 N 118.08 W C 24 .0 5.1 03-11-1933 02:31:00 33.60 N 118.00 W E 31 .0 4.4 03-11-1933 02:52:00 33.75 N 118.08 W C 24 .0 4.0 03-11-1933 02:57:00 33.75 N 118.08 W C 24 .0 4.2 03-11-1933 02:58:00 33.75 N 118.08 W C 24 .0 4.0 03-11-1933 02:59:00 33.75 N 118.08 W C 24 .0 4.6 03-11-1933 03:05:00 33.75 N 118.08 W C 24 .0 4.2 03-11-1933 03:09:00 33.75 N 118.08 W C 24 .0 4.4 03-11-1933 03:11:00 33.75 N 118.08 W C 24 .0 4.2 03-11-1933 03:23:00 33.75 N 118.08 W C 24 .0 5.0 03-11-1933 03:36:00 33.75 N 118.08 W C 24 .0 4.0 03-11-1933 03:39:00 33.75 N 118.08 W C 24 .0 4.0 03-11-1933 03:47:00 33.75 N 118.08 W C 24 .0 4.1 03-11-1933 04:36:00 33.75 N 118.08 W C 24 .0 4.6 03-11-1933 04:39:00 33.75 N 118.08 W C 24 .0 4.9 03-11-1933 04:40:00 33.75 N 118.08 W C 24 .0 4.7 03-11-1933 05:10:22 33.70 N 118.07 W C 26 .0 5.1 03-11-1933 05:13:00 33.75 N 118.08 W C 24 .0 4.7 03-11-1933 05:15:00 33.75 N 118.08 W C 24 .0 4.0 03-11-1933 05:18:04 33.58 N 117.98 W C 33 .0 5.2 03-11-1933 05:21:00 33.75 N 118.08 W C 24 .0 4.4 03-11-1933 05:24:00 33.75 N 118.08 W C 24 .0 4.2 03-11-1933 05:53:00 33.75 N 118.08 W C 24 .0 4.0 03-11-1933 05:55:00 33.75 N 118.08 W C 24 .0 4.0
NOTE: Q IS A FACTOR RELATING THE QUALITY OF EPICENTRAL DETERMINATION
A = +- 1 km horizontal distance; +- 2 km depth B = +- 2 km horizontal distance; +- 5 km depth C = +- 5 km horizontal distance; no depth restriction D = >+- 5 km horizontal distance
Event qualities are highly suspect prior to 1990. Many of these event qualities are based on incomplete information according to Caltech.
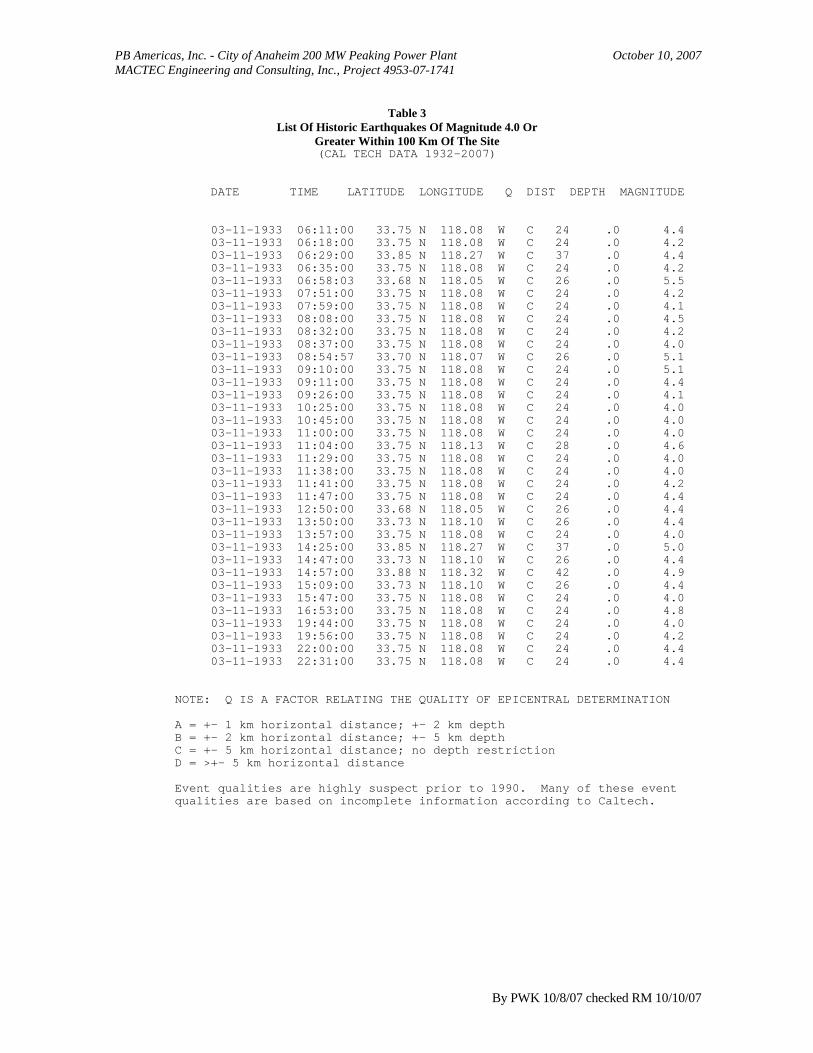
PB Americas, Inc. - City of Anaheim 200 MW Peaking Power Plant October 10, 2007 MACTEC Engineering and Consulting, Inc., Project 4953-07-1741
By PWK 10/8/07 checked RM 10/10/07
Table 3 List Of Historic Earthquakes Of Magnitude 4.0 Or
Greater Within 100 Km Of The Site (CAL TECH DATA 1932-2007)
DATE TIME LATITUDE LONGITUDE Q DIST DEPTH MAGNITUDE
03-11-1933 06:11:00 33.75 N 118.08 W C 24 .0 4.4 03-11-1933 06:18:00 33.75 N 118.08 W C 24 .0 4.2 03-11-1933 06:29:00 33.85 N 118.27 W C 37 .0 4.4 03-11-1933 06:35:00 33.75 N 118.08 W C 24 .0 4.2 03-11-1933 06:58:03 33.68 N 118.05 W C 26 .0 5.5 03-11-1933 07:51:00 33.75 N 118.08 W C 24 .0 4.2 03-11-1933 07:59:00 33.75 N 118.08 W C 24 .0 4.1 03-11-1933 08:08:00 33.75 N 118.08 W C 24 .0 4.5 03-11-1933 08:32:00 33.75 N 118.08 W C 24 .0 4.2 03-11-1933 08:37:00 33.75 N 118.08 W C 24 .0 4.0 03-11-1933 08:54:57 33.70 N 118.07 W C 26 .0 5.1 03-11-1933 09:10:00 33.75 N 118.08 W C 24 .0 5.1 03-11-1933 09:11:00 33.75 N 118.08 W C 24 .0 4.4 03-11-1933 09:26:00 33.75 N 118.08 W C 24 .0 4.1 03-11-1933 10:25:00 33.75 N 118.08 W C 24 .0 4.0 03-11-1933 10:45:00 33.75 N 118.08 W C 24 .0 4.0 03-11-1933 11:00:00 33.75 N 118.08 W C 24 .0 4.0 03-11-1933 11:04:00 33.75 N 118.13 W C 28 .0 4.6 03-11-1933 11:29:00 33.75 N 118.08 W C 24 .0 4.0 03-11-1933 11:38:00 33.75 N 118.08 W C 24 .0 4.0 03-11-1933 11:41:00 33.75 N 118.08 W C 24 .0 4.2 03-11-1933 11:47:00 33.75 N 118.08 W C 24 .0 4.4 03-11-1933 12:50:00 33.68 N 118.05 W C 26 .0 4.4 03-11-1933 13:50:00 33.73 N 118.10 W C 26 .0 4.4 03-11-1933 13:57:00 33.75 N 118.08 W C 24 .0 4.0 03-11-1933 14:25:00 33.85 N 118.27 W C 37 .0 5.0 03-11-1933 14:47:00 33.73 N 118.10 W C 26 .0 4.4 03-11-1933 14:57:00 33.88 N 118.32 W C 42 .0 4.9 03-11-1933 15:09:00 33.73 N 118.10 W C 26 .0 4.4 03-11-1933 15:47:00 33.75 N 118.08 W C 24 .0 4.0 03-11-1933 16:53:00 33.75 N 118.08 W C 24 .0 4.8 03-11-1933 19:44:00 33.75 N 118.08 W C 24 .0 4.0 03-11-1933 19:56:00 33.75 N 118.08 W C 24 .0 4.2 03-11-1933 22:00:00 33.75 N 118.08 W C 24 .0 4.4 03-11-1933 22:31:00 33.75 N 118.08 W C 24 .0 4.4
NOTE: Q IS A FACTOR RELATING THE QUALITY OF EPICENTRAL DETERMINATION
A = +- 1 km horizontal distance; +- 2 km depth B = +- 2 km horizontal distance; +- 5 km depth C = +- 5 km horizontal distance; no depth restriction D = >+- 5 km horizontal distance
Event qualities are highly suspect prior to 1990. Many of these event qualities are based on incomplete information according to Caltech.

PB Americas, Inc. - City of Anaheim 200 MW Peaking Power Plant October 10, 2007 MACTEC Engineering and Consulting, Inc., Project 4953-07-1741
By PWK 10/8/07 checked RM 10/10/07
Table 3 List Of Historic Earthquakes Of Magnitude 4.0 Or
Greater Within 100 Km Of The Site (CAL TECH DATA 1932-2007)
DATE TIME LATITUDE LONGITUDE Q DIST DEPTH MAGNITUDE
03-11-1933 22:32:00 33.75 N 118.08 W C 24 .0 4.1 03-11-1933 22:40:00 33.75 N 118.08 W C 24 .0 4.4 03-11-1933 23:05:00 33.75 N 118.08 W C 24 .0 4.2 03-12-1933 00:27:00 33.75 N 118.08 W C 24 .0 4.4 03-12-1933 00:34:00 33.75 N 118.08 W C 24 .0 4.0 03-12-1933 04:48:00 33.75 N 118.08 W C 24 .0 4.0 03-12-1933 05:46:00 33.75 N 118.08 W C 24 .0 4.4 03-12-1933 06:01:00 33.75 N 118.08 W C 24 .0 4.2 03-12-1933 06:16:00 33.75 N 118.08 W C 24 .0 4.6 03-12-1933 07:40:00 33.75 N 118.08 W C 24 .0 4.2 03-12-1933 08:35:00 33.75 N 118.08 W C 24 .0 4.2 03-12-1933 15:02:00 33.75 N 118.08 W C 24 .0 4.2 03-12-1933 16:51:00 33.75 N 118.08 W C 24 .0 4.0 03-12-1933 17:38:00 33.75 N 118.08 W C 24 .0 4.5 03-12-1933 18:25:00 33.75 N 118.08 W C 24 .0 4.1 03-12-1933 21:28:00 33.75 N 118.08 W C 24 .0 4.1 03-12-1933 23:54:00 33.75 N 118.08 W C 24 .0 4.5 03-13-1933 03:43:00 33.75 N 118.08 W C 24 .0 4.1 03-13-1933 04:32:00 33.75 N 118.08 W C 24 .0 4.7 03-13-1933 06:17:00 33.75 N 118.08 W C 24 .0 4.0 03-13-1933 13:18:28 33.75 N 118.08 W C 24 .0 5.3 03-13-1933 15:32:00 33.75 N 118.08 W C 24 .0 4.1 03-13-1933 19:29:00 33.75 N 118.08 W C 24 .0 4.2 03-14-1933 00:36:00 33.75 N 118.08 W C 24 .0 4.2 03-14-1933 12:19:00 33.75 N 118.08 W C 24 .0 4.5 03-14-1933 19:01:50 33.62 N 118.02 W C 30 .0 5.1 03-14-1933 22:42:00 33.75 N 118.08 W C 24 .0 4.1 03-15-1933 02:08:00 33.75 N 118.08 W C 24 .0 4.1 03-15-1933 04:32:00 33.75 N 118.08 W C 24 .0 4.1 03-15-1933 05:40:00 33.75 N 118.08 W C 24 .0 4.2 03-15-1933 11:13:32 33.62 N 118.02 W C 30 .0 4.9 03-16-1933 14:56:00 33.75 N 118.08 W C 24 .0 4.0 03-16-1933 15:29:00 33.75 N 118.08 W C 24 .0 4.2 03-16-1933 15:30:00 33.75 N 118.08 W C 24 .0 4.1 03-17-1933 16:51:00 33.75 N 118.08 W C 24 .0 4.1
NOTE: Q IS A FACTOR RELATING THE QUALITY OF EPICENTRAL DETERMINATION
A = +- 1 km horizontal distance; +- 2 km depth B = +- 2 km horizontal distance; +- 5 km depth C = +- 5 km horizontal distance; no depth restriction D = >+- 5 km horizontal distance
Event qualities are highly suspect prior to 1990. Many of these event qualities are based on incomplete information according to Caltech.

PB Americas, Inc. - City of Anaheim 200 MW Peaking Power Plant October 10, 2007 MACTEC Engineering and Consulting, Inc., Project 4953-07-1741
By PWK 10/8/07 checked RM 10/10/07
Table 3 List Of Historic Earthquakes Of Magnitude 4.0 Or
Greater Within 100 Km Of The Site (CAL TECH DATA 1932-2007)
DATE TIME LATITUDE LONGITUDE Q DIST DEPTH MAGNITUDE
03-18-1933 20:52:00 33.75 N 118.08 W C 24 .0 4.2 03-19-1933 21:23:00 33.75 N 118.08 W C 24 .0 4.2 03-20-1933 13:58:00 33.75 N 118.08 W C 24 .0 4.1 03-21-1933 03:26:00 33.75 N 118.08 W C 24 .0 4.1 03-23-1933 08:40:00 33.75 N 118.08 W C 24 .0 4.1 03-23-1933 18:31:00 33.75 N 118.08 W C 24 .0 4.1 03-25-1933 13:46:00 33.75 N 118.08 W C 24 .0 4.1 03-30-1933 12:25:00 33.75 N 118.08 W C 24 .0 4.4 03-31-1933 10:49:00 33.75 N 118.08 W C 24 .0 4.1 04-01-1933 06:42:00 33.75 N 118.08 W C 24 .0 4.2 04-02-1933 08:00:00 33.75 N 118.08 W C 24 .0 4.0 04-02-1933 15:36:00 33.75 N 118.08 W C 24 .0 4.0 05-16-1933 20:58:55 33.75 N 118.17 W C 31 .0 4.0 08-04-1933 04:17:48 33.75 N 118.18 W C 32 .0 4.0 10-02-1933 09:10:17 33.78 N 118.13 W A 26 .0 5.4 10-02-1933 13:26:01 33.62 N 118.02 W C 30 .0 4.0 10-25-1933 07:00:46 33.95 N 118.13 W C 27 .0 4.3 11-13-1933 21:28:00 33.87 N 118.20 W C 31 .0 4.0 11-20-1933 10:32:00 33.78 N 118.13 W B 26 .0 4.0 01-09-1934 14:10:00 34.10 N 117.68 W A 31 .0 4.5 01-18-1934 02:14:00 34.10 N 117.68 W A 31 .0 4.0 01-20-1934 21:17:00 33.62 N 118.12 W B 36 .0 4.5 04-17-1934 18:33:00 33.57 N 117.98 W C 34 .0 4.0 10-17-1934 09:38:00 33.63 N 118.40 W B 56 .0 4.0 11-16-1934 21:26:00 33.75 N 118.00 W B 18 .0 4.0 06-19-1935 11:17:00 33.72 N 117.52 W B 36 .0 4.0 07-13-1935 10:54:16 34.20 N 117.90 W A 38 .0 4.7 09-03-1935 06:47:00 34.03 N 117.32 W B 54 .0 4.5 10-24-1935 14:51:00 34.10 N 116.88 W C 94 .0 4.5 10-24-1935 14:52:00 34.10 N 116.88 W C 94 .0 4.5 10-24-1935 15:27:00 34.10 N 116.88 W C 94 .0 4.0 11-04-1935 03:55:00 33.50 N 116.92 W B 96 .0 4.5 12-25-1935 17:15:00 33.60 N 118.02 W B 32 .0 4.5 02-23-1936 22:20:42 34.13 N 117.34 W A 57 10.0 4.5 02-26-1936 09:33:27 34.14 N 117.34 W A 58 10.0 4.0
NOTE: Q IS A FACTOR RELATING THE QUALITY OF EPICENTRAL DETERMINATION
A = +- 1 km horizontal distance; +- 2 km depth B = +- 2 km horizontal distance; +- 5 km depth C = +- 5 km horizontal distance; no depth restriction D = >+- 5 km horizontal distance
Event qualities are highly suspect prior to 1990. Many of these event qualities are based on incomplete information according to Caltech.

PB Americas, Inc. - City of Anaheim 200 MW Peaking Power Plant October 10, 2007 MACTEC Engineering and Consulting, Inc., Project 4953-07-1741
By PWK 10/8/07 checked RM 10/10/07
Table 3 List Of Historic Earthquakes Of Magnitude 4.0 Or
Greater Within 100 Km Of The Site (CAL TECH DATA 1932-2007)
DATE TIME LATITUDE LONGITUDE Q DIST DEPTH MAGNITUDE
07-29-1936 14:22:52 33.45 N 116.90 W C 100 10.0 4.0 08-22-1936 05:21:00 33.77 N 117.82 W B 11 .0 4.0 10-29-1936 22:35:36 34.38 N 118.62 W C 91 10.0 4.0 01-15-1937 18:35:47 33.56 N 118.06 W B 38 10.0 4.0 03-19-1937 01:23:38 34.11 N 117.43 W A 49 10.0 4.0 07-07-1937 11:12:00 33.57 N 117.98 W B 34 .0 4.0 09-01-1937 13:48:08 34.21 N 117.53 W A 50 10.0 4.5 09-01-1937 16:35:33 34.18 N 117.55 W A 46 10.0 4.5 05-21-1938 09:44:00 33.62 N 118.03 W B 31 .0 4.0 05-31-1938 08:34:55 33.70 N 117.51 W B 37 10.0 5.2 06-10-1938 14:40:00 34.13 N 116.95 W B 90 .0 4.0 06-16-1938 05:59:16 33.46 N 116.90 W B 100 10.0 4.0 07-05-1938 18:06:55 33.68 N 117.55 W A 35 10.0 4.5 08-06-1938 22:00:55 33.72 N 117.51 W B 36 10.0 4.0 08-31-1938 03:18:14 33.76 N 118.25 W A 38 10.0 4.5 11-29-1938 19:21:15 33.90 N 118.43 W A 53 10.0 4.0 12-07-1938 03:38:00 34.00 N 118.42 W B 54 .0 4.0 12-27-1938 10:09:28 34.13 N 117.52 W B 43 10.0 4.0 04-03-1939 02:50:44 34.04 N 117.23 W A 62 10.0 4.0 11-04-1939 21:41:00 33.77 N 118.12 W B 26 .0 4.0 11-07-1939 18:52:08 34.00 N 117.28 W A 56 .0 4.7 12-27-1939 19:28:49 33.78 N 118.20 W A 32 .0 4.7 01-13-1940 07:49:07 33.78 N 118.13 W B 26 .0 4.0 02-08-1940 16:56:17 33.70 N 118.07 W B 26 .0 4.0 02-11-1940 19:24:10 33.98 N 118.30 W B 43 .0 4.0 02-19-1940 12:06:55 34.02 N 117.05 W A 77 .0 4.6 04-18-1940 18:43:43 34.03 N 117.35 W A 51 .0 4.4 06-05-1940 08:27:27 33.83 N 117.40 W B 43 .0 4.0 07-20-1940 04:01:13 33.70 N 118.07 W B 26 .0 4.0 10-11-1940 05:57:12 33.77 N 118.45 W A 55 .0 4.7 10-12-1940 00:24:00 33.78 N 118.42 W B 52 .0 4.0 10-14-1940 20:51:11 33.78 N 118.42 W B 52 .0 4.0 11-01-1940 07:25:03 33.78 N 118.42 W B 52 .0 4.0 11-01-1940 20:00:46 33.63 N 118.20 W B 40 .0 4.0 11-02-1940 02:58:26 33.78 N 118.42 W B 52 .0 4.0
NOTE: Q IS A FACTOR RELATING THE QUALITY OF EPICENTRAL DETERMINATION
A = +- 1 km horizontal distance; +- 2 km depth B = +- 2 km horizontal distance; +- 5 km depth C = +- 5 km horizontal distance; no depth restriction D = >+- 5 km horizontal distance
Event qualities are highly suspect prior to 1990. Many of these event qualities are based on incomplete information according to Caltech.

PB Americas, Inc. - City of Anaheim 200 MW Peaking Power Plant October 10, 2007 MACTEC Engineering and Consulting, Inc., Project 4953-07-1741
By PWK 10/8/07 checked RM 10/10/07
Table 3 List Of Historic Earthquakes Of Magnitude 4.0 Or
Greater Within 100 Km Of The Site (CAL TECH DATA 1932-2007)
DATE TIME LATITUDE LONGITUDE Q DIST DEPTH MAGNITUDE
01-30-1941 01:34:46 33.97 N 118.05 W A 21 .0 4.1 03-22-1941 08:22:40 33.52 N 118.10 W B 44 .0 4.0 03-25-1941 23:43:41 34.22 N 117.47 W B 54 .0 4.0 04-11-1941 01:20:24 33.95 N 117.58 W B 28 .0 4.0 10-22-1941 06:57:18 33.82 N 118.22 W A 33 .0 4.8 11-14-1941 08:41:36 33.78 N 118.25 W A 37 .0 4.8 02-27-1942 01:08:53 34.33 N 117.00 W B 96 .0 4.0 04-16-1942 07:28:33 33.37 N 118.15 W C 61 .0 4.0 08-29-1943 03:45:13 34.27 N 116.97 W C 94 .0 5.3 08-29-1943 03:57:54 34.27 N 116.97 W C 94 .0 4.0 08-29-1943 05:16:30 34.27 N 116.97 W C 94 .0 4.0 10-24-1943 00:29:21 33.93 N 117.37 W C 47 .0 4.0 06-19-1944 00:03:33 33.87 N 118.22 W B 33 .0 4.5 06-19-1944 03:06:07 33.87 N 118.22 W C 33 .0 4.4 09-07-1945 15:34:24 33.97 N 116.80 W B 99 .0 4.3 02-24-1946 06:07:52 34.40 N 117.80 W C 60 .0 4.1 09-28-1946 07:19:09 33.95 N 116.85 W B 94 .0 4.8 03-01-1948 08:12:13 34.17 N 117.53 W B 46 .0 4.7 10-03-1948 02:46:28 34.18 N 117.58 W A 44 .0 4.0 01-11-1950 21:41:35 33.94 N 118.20 W A 33 .4 4.1 09-22-1951 08:22:39 34.12 N 117.34 W A 56 11.9 4.3 10-16-1951 12:41:05 34.17 N 116.98 W B 88 .0 4.0 02-17-1952 12:36:58 34.00 N 117.27 W A 57 16.0 4.5 08-23-1952 10:09:07 34.52 N 118.20 W A 80 13.1 5.1 10-26-1954 16:22:26 33.73 N 117.47 W B 39 .0 4.1 05-15-1955 17:03:25 34.12 N 117.48 W A 46 7.6 4.0 01-03-1956 00:25:48 33.72 N 117.50 W B 37 13.7 4.7 06-27-1959 16:22:11 33.97 N 116.88 W A 91 13.8 4.0 06-28-1960 20:00:48 34.12 N 117.47 W A 46 12.0 4.1 10-04-1961 02:21:31 33.85 N 117.75 W B 10 4.3 4.1 10-20-1961 19:49:50 33.65 N 117.99 W B 26 4.6 4.3 10-20-1961 20:07:14 33.66 N 117.98 W B 25 6.1 4.0 10-20-1961 21:42:40 33.67 N 117.98 W B 24 7.2 4.0 10-20-1961 22:35:34 33.67 N 118.01 W B 25 5.6 4.1 11-20-1961 08:53:34 33.68 N 117.99 W B 23 4.4 4.0
NOTE: Q IS A FACTOR RELATING THE QUALITY OF EPICENTRAL DETERMINATION
A = +- 1 km horizontal distance; +- 2 km depth B = +- 2 km horizontal distance; +- 5 km depth C = +- 5 km horizontal distance; no depth restriction D = >+- 5 km horizontal distance
Event qualities are highly suspect prior to 1990. Many of these event qualities are based on incomplete information according to Caltech.

PB Americas, Inc. - City of Anaheim 200 MW Peaking Power Plant October 10, 2007 MACTEC Engineering and Consulting, Inc., Project 4953-07-1741
By PWK 10/8/07 checked RM 10/10/07
Table 3 List Of Historic Earthquakes Of Magnitude 4.0 Or
Greater Within 100 Km Of The Site (CAL TECH DATA 1932-2007)
DATE TIME LATITUDE LONGITUDE Q DIST DEPTH MAGNITUDE
04-27-1962 09:12:32 33.74 N 117.19 W B 64 5.7 4.1 09-14-1963 03:51:16 33.54 N 118.34 W B 56 2.2 4.2 09-23-1963 14:41:52 33.71 N 116.93 W B 88 16.5 5.1 08-30-1964 22:57:37 34.27 N 118.44 W B 71 15.4 4.0 01-01-1965 08:04:18 34.14 N 117.52 W B 45 5.9 4.4 04-15-1965 20:08:33 34.13 N 117.43 W B 50 5.5 4.5 07-16-1965 07:46:22 34.49 N 118.52 W B 92 15.1 4.0 01-08-1967 07:37:30 33.63 N 118.47 W B 61 11.4 4.0 01-08-1967 07:38:05 33.66 N 118.41 W C 55 17.7 4.0 06-15-1967 04:58:05 34.00 N 117.97 W B 19 10.0 4.1 02-28-1969 04:56:12 34.57 N 118.11 W A 82 5.3 4.3 05-05-1969 16:02:09 34.30 N 117.57 W B 56 8.8 4.4 10-27-1969 13:16:02 33.55 N 117.81 W B 35 6.5 4.5 09-12-1970 14:10:11 34.27 N 117.52 W A 55 8.0 4.1 09-12-1970 14:30:52 34.27 N 117.54 W A 55 8.0 5.2 09-13-1970 04:47:48 34.28 N 117.55 W A 55 8.0 4.4 02-09-1971 14:00:41 34.41 N 118.40 W B 79 8.4 6.6 02-09-1971 14:01:08 34.41 N 118.40 W D 79 8.0 5.8 02-09-1971 14:01:33 34.41 N 118.40 W D 79 8.0 4.2 02-09-1971 14:01:40 34.41 N 118.40 W D 79 8.0 4.1 02-09-1971 14:01:50 34.41 N 118.40 W D 79 8.0 4.5 02-09-1971 14:01:54 34.41 N 118.40 W D 79 8.0 4.2 02-09-1971 14:01:59 34.41 N 118.40 W D 79 8.0 4.1 02-09-1971 14:02:03 34.41 N 118.40 W D 79 8.0 4.1 02-09-1971 14:02:30 34.41 N 118.40 W D 79 8.0 4.3 02-09-1971 14:02:31 34.41 N 118.40 W D 79 8.0 4.7 02-09-1971 14:02:44 34.41 N 118.40 W D 79 8.0 5.8 02-09-1971 14:03:25 34.41 N 118.40 W D 79 8.0 4.4 02-09-1971 14:03:46 34.41 N 118.40 W D 79 8.0 4.1 02-09-1971 14:04:07 34.41 N 118.40 W D 79 8.0 4.1 02-09-1971 14:04:34 34.41 N 118.40 W C 79 8.0 4.2 02-09-1971 14:04:39 34.41 N 118.40 W D 79 8.0 4.1 02-09-1971 14:04:44 34.41 N 118.40 W D 79 8.0 4.1 02-09-1971 14:04:46 34.41 N 118.40 W D 79 8.0 4.2 02-09-1971 14:05:41 34.41 N 118.40 W D 79 8.0 4.1
NOTE: Q IS A FACTOR RELATING THE QUALITY OF EPICENTRAL DETERMINATION
A = +- 1 km horizontal distance; +- 2 km depth B = +- 2 km horizontal distance; +- 5 km depth C = +- 5 km horizontal distance; no depth restriction D = >+- 5 km horizontal distance
Event qualities are highly suspect prior to 1990. Many of these event qualities are based on incomplete information according to Caltech.

PB Americas, Inc. - City of Anaheim 200 MW Peaking Power Plant October 10, 2007 MACTEC Engineering and Consulting, Inc., Project 4953-07-1741
By PWK 10/8/07 checked RM 10/10/07
Table 3 List Of Historic Earthquakes Of Magnitude 4.0 Or
Greater Within 100 Km Of The Site (CAL TECH DATA 1932-2007)
DATE TIME LATITUDE LONGITUDE Q DIST DEPTH MAGNITUDE
02-09-1971 14:05:50 34.41 N 118.40 W D 79 8.0 4.1 02-09-1971 14:07:10 34.41 N 118.40 W D 79 8.0 4.0 02-09-1971 14:07:30 34.41 N 118.40 W D 79 8.0 4.0 02-09-1971 14:07:45 34.41 N 118.40 W D 79 8.0 4.5 02-09-1971 14:08:04 34.41 N 118.40 W D 79 8.0 4.0 02-09-1971 14:08:07 34.41 N 118.40 W D 79 8.0 4.2 02-09-1971 14:08:38 34.41 N 118.40 W D 79 8.0 4.5 02-09-1971 14:08:53 34.41 N 118.40 W D 79 8.0 4.6 02-09-1971 14:10:21 34.36 N 118.31 W B 69 5.0 4.7 02-09-1971 14:10:28 34.41 N 118.40 W D 79 8.0 5.3 02-09-1971 14:16:12 34.34 N 118.33 W C 69 11.1 4.1 02-09-1971 14:19:50 34.36 N 118.41 W B 75 11.8 4.0 02-09-1971 14:34:36 34.34 N 118.64 W C 90 -2.0 4.9 02-09-1971 14:39:17 34.39 N 118.36 W C 75 -1.6 4.0 02-09-1971 14:40:17 34.43 N 118.40 W C 81 -2.0 4.1 02-09-1971 14:43:46 34.31 N 118.45 W B 74 6.2 5.2 02-09-1971 15:58:20 34.33 N 118.33 W B 68 14.2 4.8 02-09-1971 16:19:26 34.46 N 118.43 W B 85 -1.0 4.2 02-10-1971 03:12:12 34.37 N 118.30 W B 70 .8 4.0 02-10-1971 05:06:36 34.41 N 118.33 W A 75 4.7 4.3 02-10-1971 05:18:07 34.43 N 118.41 W A 81 5.8 4.5 02-10-1971 11:31:34 34.38 N 118.46 W A 80 6.0 4.2 02-10-1971 13:49:53 34.40 N 118.42 W A 79 9.7 4.3 02-10-1971 14:35:26 34.36 N 118.49 W A 80 4.4 4.2 02-10-1971 17:38:55 34.40 N 118.37 W A 76 6.2 4.2 02-10-1971 18:54:41 34.45 N 118.44 W A 84 8.1 4.2 02-21-1971 05:50:52 34.40 N 118.44 W A 80 6.9 4.7 02-21-1971 07:15:11 34.39 N 118.43 W A 79 7.2 4.5 03-07-1971 01:33:40 34.35 N 118.46 W A 78 3.3 4.5 03-25-1971 22:54:09 34.36 N 118.47 W A 79 4.6 4.2 03-30-1971 08:54:43 34.30 N 118.46 W A 74 2.6 4.1 03-31-1971 14:52:22 34.29 N 118.51 W A 77 2.1 4.6 04-01-1971 15:03:03 34.43 N 118.41 W A 81 8.0 4.1 04-02-1971 05:40:25 34.28 N 118.53 W A 78 3.0 4.0 04-15-1971 11:14:32 34.26 N 118.58 W B 80 4.2 4.2
NOTE: Q IS A FACTOR RELATING THE QUALITY OF EPICENTRAL DETERMINATION
A = +- 1 km horizontal distance; +- 2 km depth B = +- 2 km horizontal distance; +- 5 km depth C = +- 5 km horizontal distance; no depth restriction D = >+- 5 km horizontal distance
Event qualities are highly suspect prior to 1990. Many of these event qualities are based on incomplete information according to Caltech.
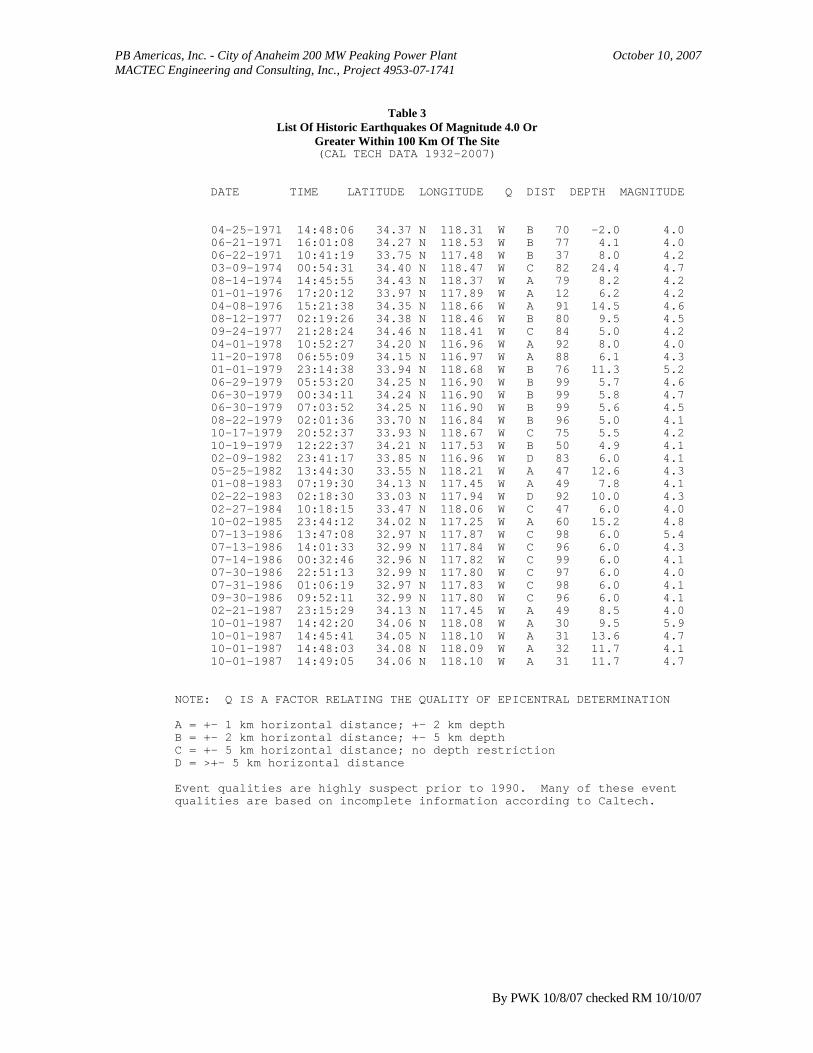
PB Americas, Inc. - City of Anaheim 200 MW Peaking Power Plant October 10, 2007 MACTEC Engineering and Consulting, Inc., Project 4953-07-1741
By PWK 10/8/07 checked RM 10/10/07
Table 3 List Of Historic Earthquakes Of Magnitude 4.0 Or
Greater Within 100 Km Of The Site (CAL TECH DATA 1932-2007)
DATE TIME LATITUDE LONGITUDE Q DIST DEPTH MAGNITUDE
04-25-1971 14:48:06 34.37 N 118.31 W B 70 -2.0 4.0 06-21-1971 16:01:08 34.27 N 118.53 W B 77 4.1 4.0 06-22-1971 10:41:19 33.75 N 117.48 W B 37 8.0 4.2 03-09-1974 00:54:31 34.40 N 118.47 W C 82 24.4 4.7 08-14-1974 14:45:55 34.43 N 118.37 W A 79 8.2 4.2 01-01-1976 17:20:12 33.97 N 117.89 W A 12 6.2 4.2 04-08-1976 15:21:38 34.35 N 118.66 W A 91 14.5 4.6 08-12-1977 02:19:26 34.38 N 118.46 W B 80 9.5 4.5 09-24-1977 21:28:24 34.46 N 118.41 W C 84 5.0 4.2 04-01-1978 10:52:27 34.20 N 116.96 W A 92 8.0 4.0 11-20-1978 06:55:09 34.15 N 116.97 W A 88 6.1 4.3 01-01-1979 23:14:38 33.94 N 118.68 W B 76 11.3 5.2 06-29-1979 05:53:20 34.25 N 116.90 W B 99 5.7 4.6 06-30-1979 00:34:11 34.24 N 116.90 W B 99 5.8 4.7 06-30-1979 07:03:52 34.25 N 116.90 W B 99 5.6 4.5 08-22-1979 02:01:36 33.70 N 116.84 W B 96 5.0 4.1 10-17-1979 20:52:37 33.93 N 118.67 W C 75 5.5 4.2 10-19-1979 12:22:37 34.21 N 117.53 W B 50 4.9 4.1 02-09-1982 23:41:17 33.85 N 116.96 W D 83 6.0 4.1 05-25-1982 13:44:30 33.55 N 118.21 W A 47 12.6 4.3 01-08-1983 07:19:30 34.13 N 117.45 W A 49 7.8 4.1 02-22-1983 02:18:30 33.03 N 117.94 W D 92 10.0 4.3 02-27-1984 10:18:15 33.47 N 118.06 W C 47 6.0 4.0 10-02-1985 23:44:12 34.02 N 117.25 W A 60 15.2 4.8 07-13-1986 13:47:08 32.97 N 117.87 W C 98 6.0 5.4 07-13-1986 14:01:33 32.99 N 117.84 W C 96 6.0 4.3 07-14-1986 00:32:46 32.96 N 117.82 W C 99 6.0 4.1 07-30-1986 22:51:13 32.99 N 117.80 W C 97 6.0 4.0 07-31-1986 01:06:19 32.97 N 117.83 W C 98 6.0 4.1 09-30-1986 09:52:11 32.99 N 117.80 W C 96 6.0 4.1 02-21-1987 23:15:29 34.13 N 117.45 W A 49 8.5 4.0 10-01-1987 14:42:20 34.06 N 118.08 W A 30 9.5 5.9 10-01-1987 14:45:41 34.05 N 118.10 W A 31 13.6 4.7 10-01-1987 14:48:03 34.08 N 118.09 W A 32 11.7 4.1 10-01-1987 14:49:05 34.06 N 118.10 W A 31 11.7 4.7
NOTE: Q IS A FACTOR RELATING THE QUALITY OF EPICENTRAL DETERMINATION
A = +- 1 km horizontal distance; +- 2 km depth B = +- 2 km horizontal distance; +- 5 km depth C = +- 5 km horizontal distance; no depth restriction D = >+- 5 km horizontal distance
Event qualities are highly suspect prior to 1990. Many of these event qualities are based on incomplete information according to Caltech.

PB Americas, Inc. - City of Anaheim 200 MW Peaking Power Plant October 10, 2007 MACTEC Engineering and Consulting, Inc., Project 4953-07-1741
By PWK 10/8/07 checked RM 10/10/07
Table 3 List Of Historic Earthquakes Of Magnitude 4.0 Or
Greater Within 100 Km Of The Site (CAL TECH DATA 1932-2007)
DATE TIME LATITUDE LONGITUDE Q DIST DEPTH MAGNITUDE
10-01-1987 15:12:31 34.05 N 118.09 W A 30 10.8 4.7 10-01-1987 15:59:53 34.05 N 118.09 W A 30 10.4 4.0 10-04-1987 10:59:38 34.07 N 118.10 W A 32 8.3 5.3 02-11-1988 15:25:55 34.08 N 118.05 W A 30 12.5 4.7 06-26-1988 15:04:58 34.14 N 117.71 W A 34 7.9 4.7 11-20-1988 05:39:28 33.51 N 118.07 W C 43 6.0 4.9 12-03-1988 11:38:26 34.15 N 118.13 W A 41 14.3 5.0 01-19-1989 06:53:28 33.92 N 118.63 W A 71 11.9 5.0 02-18-1989 07:17:04 34.01 N 117.74 W A 20 3.3 4.1 04-07-1989 20:07:30 33.62 N 117.90 W A 27 12.9 4.7 06-12-1989 16:57:18 34.03 N 118.18 W A 35 15.6 4.6 06-12-1989 17:22:25 34.02 N 118.18 W A 34 15.5 4.4 12-28-1989 09:41:08 34.19 N 117.39 W A 58 14.6 4.3 02-28-1990 23:43:36 34.14 N 117.70 W A 35 4.5 5.4 03-01-1990 00:34:57 34.13 N 117.70 W A 33 4.4 4.0 03-01-1990 03:23:03 34.15 N 117.72 W A 35 11.4 4.7 03-02-1990 17:26:25 34.15 N 117.69 W A 35 5.6 4.7 04-04-1990 08:54:39 32.97 N 117.81 W C 99 6.0 4.3 04-17-1990 22:32:27 34.11 N 117.72 W A 30 3.6 4.8 06-28-1991 14:43:54 34.27 N 117.99 W A 47 9.1 5.8 06-28-1991 17:00:55 34.25 N 117.99 W A 45 9.5 4.3 07-05-1991 17:41:57 34.50 N 118.56 W A 96 10.9 4.1 12-04-1991 08:17:03 34.18 N 117.02 W A 85 10.7 4.0 06-28-1992 14:43:21 34.16 N 116.85 W B 99 11.1 5.5 06-28-1992 15:17:00 34.13 N 116.86 W B 97 17.9 4.0 06-28-1992 15:17:13 34.10 N 116.87 W B 96 2.9 4.6 06-28-1992 17:01:31 34.18 N 116.92 W A 94 13.7 5.1 06-28-1992 17:05:57 34.26 N 116.91 W A 98 7.7 5.0 06-28-1992 17:42:32 34.24 N 116.90 W B 98 6.5 4.0 06-28-1992 17:44:30 34.16 N 116.85 W A 99 5.3 4.1 06-29-1992 14:41:26 34.12 N 117.00 W A 85 4.7 4.6 06-30-1992 21:49:00 34.08 N 116.99 W A 85 3.6 4.4 07-03-1992 17:17:06 34.26 N 116.90 W A 100 7.6 4.1 08-17-1992 20:41:52 34.19 N 116.86 W A 100 11.3 5.0 08-18-1992 09:46:40 34.20 N 116.86 W A 100 12.2 4.2
NOTE: Q IS A FACTOR RELATING THE QUALITY OF EPICENTRAL DETERMINATION
A = +- 1 km horizontal distance; +- 2 km depth B = +- 2 km horizontal distance; +- 5 km depth C = +- 5 km horizontal distance; no depth restriction D = >+- 5 km horizontal distance
Event qualities are highly suspect prior to 1990. Many of these event qualities are based on incomplete information according to Caltech.

PB Americas, Inc. - City of Anaheim 200 MW Peaking Power Plant October 10, 2007 MACTEC Engineering and Consulting, Inc., Project 4953-07-1741
By PWK 10/8/07 checked RM 10/10/07
Table 3 List Of Historic Earthquakes Of Magnitude 4.0 Or
Greater Within 100 Km Of The Site (CAL TECH DATA 1932-2007)
DATE TIME LATITUDE LONGITUDE Q DIST DEPTH MAGNITUDE
05-31-1993 08:55:29 34.12 N 117.00 W A 85 5.7 4.1 01-17-1994 12:30:55 34.21 N 118.54 W A 74 18.4 6.7 01-17-1994 12:30:55 34.22 N 118.54 W A 74 17.4 6.6 01-17-1994 12:31:58 34.27 N 118.49 W C 74 6.0 5.9 01-17-1994 12:34:18 34.31 N 118.47 W C 76 6.0 4.4 01-17-1994 12:39:39 34.26 N 118.54 W C 77 6.0 4.9 01-17-1994 12:40:09 34.32 N 118.51 W C 79 6.0 4.8 01-17-1994 12:40:36 34.34 N 118.61 W C 88 6.0 5.2 01-17-1994 12:54:33 34.31 N 118.46 W C 74 6.0 4.0 01-17-1994 12:55:46 34.28 N 118.58 W C 81 6.0 4.1 01-17-1994 13:06:28 34.25 N 118.55 W C 77 6.0 4.6 01-17-1994 13:26:45 34.32 N 118.46 W C 75 6.0 4.7 01-17-1994 13:28:13 34.27 N 118.58 W C 80 6.0 4.0 01-17-1994 13:56:02 34.29 N 118.62 W C 85 6.0 4.4 01-17-1994 14:14:30 34.33 N 118.44 W C 75 6.0 4.5 01-17-1994 15:07:03 34.30 N 118.47 W A 75 2.6 4.2 01-17-1994 15:07:35 34.31 N 118.47 W A 75 1.6 4.1 01-17-1994 15:54:10 34.38 N 118.63 W A 91 13.0 4.8 01-17-1994 17:56:08 34.23 N 118.57 W A 78 19.2 4.6 01-17-1994 19:35:34 34.31 N 118.46 W A 75 2.3 4.0 01-17-1994 19:43:53 34.37 N 118.64 W A 91 13.9 4.1 01-17-1994 20:46:02 34.30 N 118.57 W C 82 6.0 4.9 01-17-1994 22:31:53 34.34 N 118.44 W C 76 6.0 4.1 01-17-1994 23:33:30 34.33 N 118.70 W A 93 9.8 5.6 01-17-1994 23:49:25 34.34 N 118.67 W A 92 8.4 4.0 01-18-1994 00:39:35 34.38 N 118.56 W A 87 7.2 4.4 01-18-1994 00:40:04 34.39 N 118.54 W A 87 .0 4.2 01-18-1994 00:43:08 34.38 N 118.70 W A 96 11.3 5.2 01-18-1994 04:01:26 34.36 N 118.62 W A 90 .9 4.3 01-18-1994 07:23:56 34.33 N 118.62 W A 88 14.8 4.0 01-18-1994 11:35:09 34.22 N 118.61 W A 80 12.1 4.2 01-18-1994 13:24:44 34.32 N 118.56 W A 82 1.7 4.3 01-18-1994 15:23:46 34.38 N 118.56 W A 87 7.7 4.8 01-19-1994 04:40:48 34.36 N 118.57 W A 86 2.6 4.3 01-19-1994 04:43:14 34.37 N 118.71 W C 97 6.0 4.0
NOTE: Q IS A FACTOR RELATING THE QUALITY OF EPICENTRAL DETERMINATION
A = +- 1 km horizontal distance; +- 2 km depth B = +- 2 km horizontal distance; +- 5 km depth C = +- 5 km horizontal distance; no depth restriction D = >+- 5 km horizontal distance
Event qualities are highly suspect prior to 1990. Many of these event qualities are based on incomplete information according to Caltech.

PB Americas, Inc. - City of Anaheim 200 MW Peaking Power Plant October 10, 2007 MACTEC Engineering and Consulting, Inc., Project 4953-07-1741
By PWK 10/8/07 checked RM 10/10/07
Table 3 List Of Historic Earthquakes Of Magnitude 4.0 Or
Greater Within 100 Km Of The Site (CAL TECH DATA 1932-2007)
DATE TIME LATITUDE LONGITUDE Q DIST DEPTH MAGNITUDE
01-19-1994 09:13:10 34.30 N 118.74 W A 95 13.0 4.1 01-19-1994 14:09:14 34.22 N 118.51 W A 72 17.5 4.5 01-19-1994 21:09:28 34.38 N 118.71 W A 98 14.4 5.1 01-19-1994 21:11:44 34.38 N 118.62 W A 91 11.4 5.1 01-21-1994 18:39:15 34.30 N 118.47 W A 74 10.6 4.5 01-21-1994 18:39:47 34.30 N 118.48 W A 75 11.9 4.0 01-21-1994 18:42:28 34.31 N 118.47 W A 76 7.9 4.2 01-21-1994 18:52:44 34.30 N 118.45 W A 74 7.6 4.3 01-21-1994 18:53:44 34.30 N 118.46 W A 74 7.7 4.3 01-23-1994 08:55:08 34.30 N 118.43 W A 72 6.0 4.1 01-24-1994 04:15:18 34.35 N 118.55 W A 84 6.5 4.6 01-24-1994 05:50:24 34.36 N 118.63 W A 90 12.1 4.3 01-24-1994 05:54:21 34.36 N 118.63 W A 90 10.9 4.2 01-27-1994 17:19:58 34.27 N 118.56 W A 80 14.9 4.6 01-28-1994 20:09:53 34.38 N 118.49 W A 82 .7 4.2 01-29-1994 11:20:35 34.31 N 118.58 W A 83 1.1 5.1 01-29-1994 12:16:56 34.28 N 118.61 W A 84 2.7 4.3 02-03-1994 16:23:35 34.30 N 118.44 W A 73 9.0 4.0 02-05-1994 08:51:29 34.37 N 118.65 W A 92 15.4 4.0 02-06-1994 13:19:27 34.29 N 118.48 W A 74 9.3 4.1 02-25-1994 12:59:12 34.36 N 118.48 W A 80 1.2 4.0 03-20-1994 21:20:12 34.23 N 118.47 W A 70 13.1 5.2 04-06-1994 19:01:04 34.19 N 117.10 W A 80 7.3 4.8 05-25-1994 12:56:57 34.31 N 118.39 W A 70 7.0 4.4 06-15-1994 05:59:48 34.31 N 118.40 W A 71 7.4 4.1 12-06-1994 03:48:34 34.29 N 118.39 W A 69 9.0 4.5 02-19-1995 21:24:18 34.05 N 118.92 W A 100 15.6 4.3 06-21-1995 21:17:36 32.98 N 117.82 W C 97 6.0 4.3 06-26-1995 08:40:28 34.39 N 118.67 W A 95 13.3 5.0 03-20-1996 07:37:59 34.36 N 118.61 W A 89 13.0 4.1 05-01-1996 19:49:56 34.35 N 118.70 W A 95 14.4 4.1 04-26-1997 10:37:30 34.37 N 118.67 W A 94 16.5 5.1 04-26-1997 10:40:29 34.37 N 118.67 W A 94 14.6 4.0 04-27-1997 11:09:28 34.38 N 118.65 W A 93 15.2 4.8 06-28-1997 21:45:25 34.17 N 117.34 W A 60 10.0 4.2
NOTE: Q IS A FACTOR RELATING THE QUALITY OF EPICENTRAL DETERMINATION
A = +- 1 km horizontal distance; +- 2 km depth B = +- 2 km horizontal distance; +- 5 km depth C = +- 5 km horizontal distance; no depth restriction D = >+- 5 km horizontal distance
Event qualities are highly suspect prior to 1990. Many of these event qualities are based on incomplete information according to Caltech.

PB Americas, Inc. - City of Anaheim 200 MW Peaking Power Plant October 10, 2007 MACTEC Engineering and Consulting, Inc., Project 4953-07-1741
By PWK 10/8/07 checked RM 10/10/07
Table 3 List Of Historic Earthquakes Of Magnitude 4.0 Or
Greater Within 100 Km Of The Site (CAL TECH DATA 1932-2007)
DATE TIME LATITUDE LONGITUDE Q DIST DEPTH MAGNITUDE
09-19-1997 22:37:14 34.14 N 116.86 W A 98 10.3 4.1 12-05-1997 17:04:38 34.10 N 117.00 W A 84 4.5 4.1 12-21-1997 00:20:58 33.67 N 117.01 W A 82 .0 4.0 01-05-1998 18:14:06 33.95 N 117.71 W A 17 11.5 4.3 03-11-1998 12:18:51 34.02 N 117.23 W A 61 14.9 4.5 08-16-1998 13:34:40 34.12 N 116.93 W A 91 6.2 4.7 08-20-1998 23:49:58 34.37 N 117.65 W A 60 9.0 4.4 10-01-1998 18:18:15 34.11 N 116.92 W A 92 4.4 4.7 07-22-1999 09:57:24 34.40 N 118.61 W A 91 11.6 4.0 02-21-2000 13:49:43 34.05 N 117.26 W A 60 15.0 4.5 03-07-2000 00:20:28 33.81 N 117.72 W A 15 11.3 4.0 01-14-2001 02:26:14 34.28 N 118.40 W A 69 8.8 4.3 01-14-2001 02:50:53 34.29 N 118.40 W A 69 8.4 4.0 02-10-2001 21:05:05 34.29 N 116.95 W A 97 9.1 5.1 02-11-2001 00:39:15 34.29 N 116.94 W A 98 8.1 4.2 09-09-2001 23:59:18 34.06 N 118.39 W A 54 7.9 4.2 10-28-2001 16:27:45 33.92 N 118.27 W A 38 21.1 4.0 12-14-2001 12:01:35 33.95 N 117.75 W A 15 13.8 4.0 01-29-2002 05:53:28 34.36 N 118.66 W A 92 14.1 4.2 09-03-2002 07:08:51 33.92 N 117.78 W A 10 12.9 4.8 01-06-2005 14:35:27 34.13 N 117.44 W A 49 4.2 4.4 06-16-2005 20:53:26 34.06 N 117.01 W A 82 11.6 4.9 06-27-2005 22:17:33 34.05 N 117.03 W A 80 12.1 4.0
NOTE: Q IS A FACTOR RELATING THE QUALITY OF EPICENTRAL DETERMINATION
A = +- 1 km horizontal distance; +- 2 km depth B = +- 2 km horizontal distance; +- 5 km depth C = +- 5 km horizontal distance; no depth restriction D = >+- 5 km horizontal distance
Event qualities are highly suspect prior to 1990. Many of these event qualities are based on incomplete information according to Caltech.

PB Americas, Inc. - City of Anaheim 200 MW Peaking Power Plant October 10, 2007 MACTEC Engineering and Consulting, Inc., Project 4953-07-1741
By PWK 10/8/07 checked RM 10/10/07
Table 3 List Of Historic Earthquakes Of Magnitude 4.0 Or
Greater Within 100 Km Of The Site (CAL TECH DATA 1932-2007)
S E A R C H O F E A R T H Q U A K E D A T A F I L E 1
SITE: 4953-07-1741
COORDINATES OF SITE ...... 33.8582 N 117.8616 W
DISTANCE PER DEGREE ..... 110.9 KM-N 92.5 KM-W
MAGNITUDE LIMITS ..................... 4.0 - 8.5
TEMPORAL LIMITS .................... 1932 - 2007
SEARCH RADIUS (KM) ....................... 100
NUMBER OF YEARS OF DATA .................. 76.00
NUMBER OF EARTHQUAKES IN FILE ............ 4274
NUMBER OF EARTHQUAKES IN AREA ............ 443
MACTEC Engineering and Consulting

PB Americas, Inc. - City of Anaheim 200 MW Peaking Power Plant October 10, 2007 MACTEC Engineering and Consulting, Inc., Project 4953-07-1741
By PWK 10/8/07 checked RM 10/10/07
Table 3 List Of Historic Earthquakes Of Magnitude 4.0 Or
Greater Within 100 Km Of The Site (RICHTER DATA 1906-1931)
DATE TIME LATITUDE LONGITUDE Q DIST DEPTH MAGNITUDE
09-20-1907 01:54:00 34.20 N 117.10 W D 80 .0 6.0 05-15-1910 15:47:00 33.70 N 117.40 W D 46 .0 6.0 04-21-1918 22:32:25 33.75 N 117.00 W D 81 .0 6.8 07-23-1923 07:30:26 34.00 N 117.25 W D 59 .0 6.3
S E A R C H O F E A R T H Q U A K E D A T A F I L E 2
SITE: 4953-07-1741
COORDINATES OF SITE ...... 33.8582 N 117.8616 W
DISTANCE PER DEGREE ..... 110.9 KM-N 92.5 KM-W
MAGNITUDE LIMITS ..................... 6.0 - 8.5
TEMPORAL LIMITS .................... 1906 - 1931
SEARCH RADIUS (KM) ....................... 100
NUMBER OF YEARS OF DATA .................. 26.00
NUMBER OF EARTHQUAKES IN FILE ............ 35
NUMBER OF EARTHQUAKES IN AREA ............ 4
MACTEC Engineering and Consulting

PB Americas, Inc. - City of Anaheim 200 MW Peaking Power Plant October 10, 2007 MACTEC Engineering and Consulting, Inc., Project 4953-07-1741
By PWK 10/8/07 checked RM 10/10/07
Table 3 List Of Historic Earthquakes Of Magnitude 4.0 Or
Greater Within 100 Km Of The Site (NOAA/CDMG DATA 1812-1905)
DATE TIME LATITUDE LONGITUDE Q DIST DEPTH MAGNITUDE
02-09-1890 04:06:00 34.00 N 117.50 W D 37 .0 7.0
S E A R C H O F E A R T H Q U A K E D A T A F I L E 3
SITE: 4953-07-1741
COORDINATES OF SITE ...... 33.8582 N 117.8616 W
DISTANCE PER DEGREE ..... 110.9 KM-N 92.5 KM-W
MAGNITUDE LIMITS ..................... 7.0 - 8.5
TEMPORAL LIMITS .................... 1812 - 1905
SEARCH RADIUS (KM) ....................... 100
NUMBER OF YEARS OF DATA .................. 94.00
NUMBER OF EARTHQUAKES IN FILE ............ 9
NUMBER OF EARTHQUAKES IN AREA ............ 1
MACTEC Engineering and Consulting

PB Americas, Inc. - City of Anaheim 200 MW Peaking Power Plant October 10, 2007 MACTEC Engineering and Consulting, Inc., Project 4953-07-1741
By PWK 10/8/07 checked RM 10/10/07
Table 3 List Of Historic Earthquakes Of Magnitude 4.0 Or
Greater Within 100 Km Of The Site
S U M M A R Y O F E A R T H Q U A K E S E A R C H
* * *
NUMBER OF HISTORIC EARTHQUAKES WITHIN 100 KM RADIUS OF SITE
MAGNITUDE RANGE NUMBER
4.0 - 4.5 294
4.5 - 5.0 101
5.0 - 5.5 36
5.5 - 6.0 8
6.0 - 6.5 4
6.5 - 7.0 4
7.0 - 7.5 1
7.5 - 8.0 0
8.0 - 8.5 0
* * *
MACTEC Engineering and Consulting
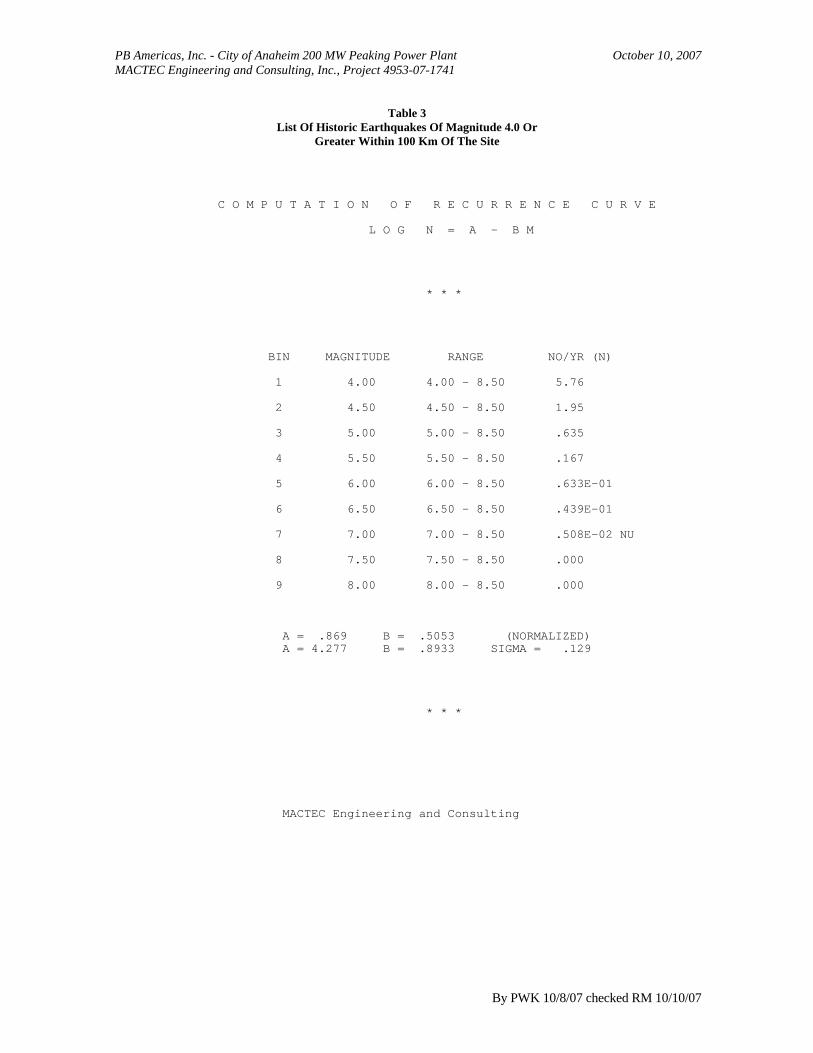
PB Americas, Inc. - City of Anaheim 200 MW Peaking Power Plant October 10, 2007 MACTEC Engineering and Consulting, Inc., Project 4953-07-1741
By PWK 10/8/07 checked RM 10/10/07
Table 3 List Of Historic Earthquakes Of Magnitude 4.0 Or
Greater Within 100 Km Of The Site
C O M P U T A T I O N O F R E C U R R E N C E C U R V E
L O G N = A - B M
* * *
BIN MAGNITUDE RANGE NO/YR (N)
1 4.00 4.00 - 8.50 5.76
2 4.50 4.50 - 8.50 1.95
3 5.00 5.00 - 8.50 .635
4 5.50 5.50 - 8.50 .167
5 6.00 6.00 - 8.50 .633E-01
6 6.50 6.50 - 8.50 .439E-01
7 7.00 7.00 - 8.50 .508E-02 NU
8 7.50 7.50 - 8.50 .000
9 8.00 8.00 - 8.50 .000
A = .869 B = .5053 (NORMALIZED) A = 4.277 B = .8933 SIGMA = .129
* * *
MACTEC Engineering and Consulting
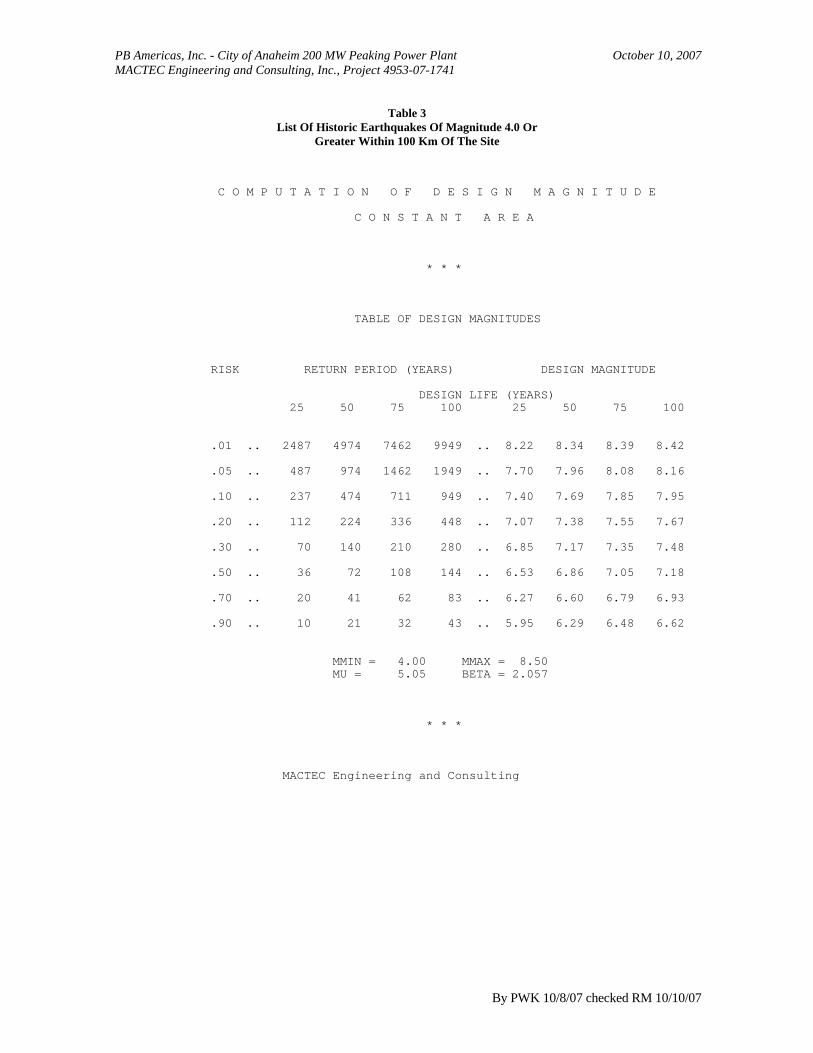
PB Americas, Inc. - City of Anaheim 200 MW Peaking Power Plant October 10, 2007 MACTEC Engineering and Consulting, Inc., Project 4953-07-1741
By PWK 10/8/07 checked RM 10/10/07
Table 3 List Of Historic Earthquakes Of Magnitude 4.0 Or
Greater Within 100 Km Of The Site
C O M P U T A T I O N O F D E S I G N M A G N I T U D E
C O N S T A N T A R E A
* * *
TABLE OF DESIGN MAGNITUDES
RISK RETURN PERIOD (YEARS) DESIGN MAGNITUDE
DESIGN LIFE (YEARS) 25 50 75 100 25 50 75 100
.01 .. 2487 4974 7462 9949 .. 8.22 8.34 8.39 8.42
.05 .. 487 974 1462 1949 .. 7.70 7.96 8.08 8.16
.10 .. 237 474 711 949 .. 7.40 7.69 7.85 7.95
.20 .. 112 224 336 448 .. 7.07 7.38 7.55 7.67
.30 .. 70 140 210 280 .. 6.85 7.17 7.35 7.48
.50 .. 36 72 108 144 .. 6.53 6.86 7.05 7.18
.70 .. 20 41 62 83 .. 6.27 6.60 6.79 6.93
.90 .. 10 21 32 43 .. 5.95 6.29 6.48 6.62
MMIN = 4.00 MMAX = 8.50 MU = 5.05 BETA = 2.057
* * *
MACTEC Engineering and Consulting

PB Americas, Inc. - City of Anaheim 200 MW Peaking Power Plant October 10, 2007 MACTEC Engineering and Consulting, Inc., Project 4953-07-1741
FIGURES

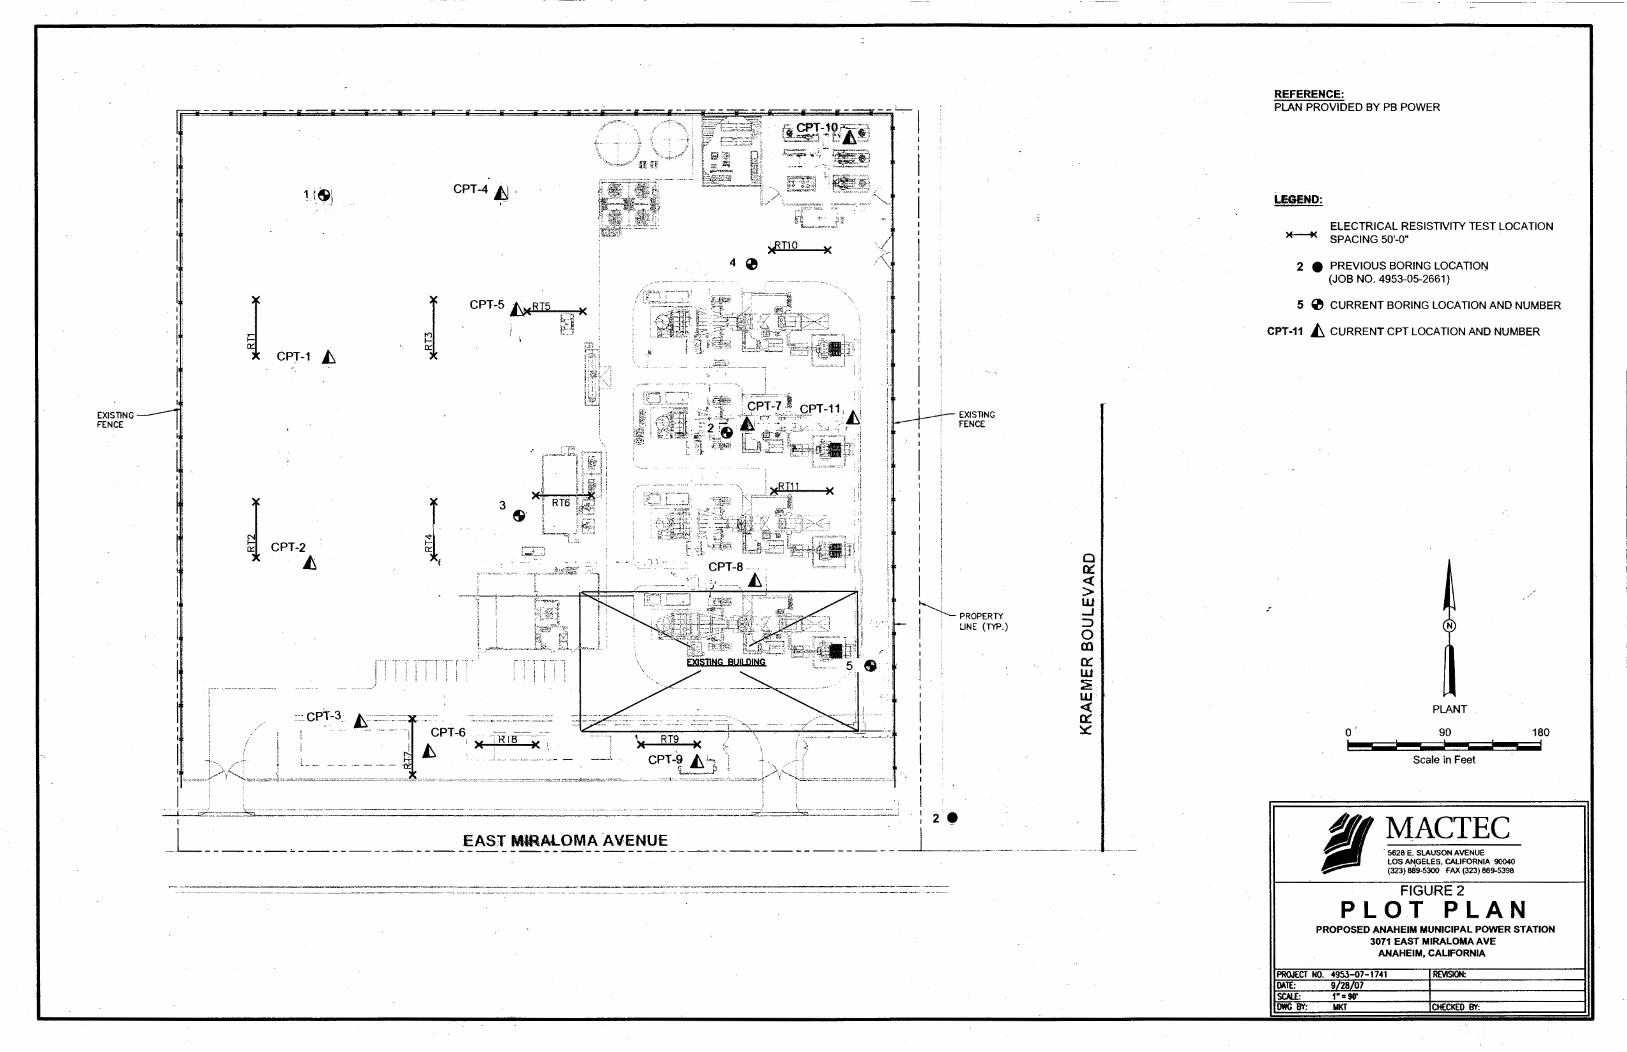

SITE
JOB NO.:
DATE:
SCALE:
DRAWN BY:
CHECKED BY:
REVISIONS:
Figure 3. Geologic MapCity of Anaheim 200 MW Peaking Power Plant
Anaheim, California
10/05/07
4953-07-1741
PWK
As shown
MACTEC ENGINEERING AND CONSULTING, INC.5628 E. Slauson Ave., Los Angeles, California 90040
(323) 889-5300, fax (323) 889-5398SCALE 1:100,000
CONTOUR INTERVAL 50 METERS
KILOMETERS0.51 1 2
1 .5 0 1 2MILES
Base: USGS Preliminary Digital Geologic Map of the Santa Ana 30’ 60’ Quadrangle,Southern CaliforniaOpen File Report 99-172, compiled by D. M. Morton
xVersion 2.0-2004,
Tpsq Puente Formation-Soquel Member (Miocene) : Predominately sandstoneand siltstone. Massive to well bedded. Contains some pebbly sandstone beds.
Qw Wash deposits (late Holocene) : Alluvium in active and recently activewashes; bouldery to sandy, unconsolidated.
Qof Old alluvial fan deposits (late to middle Pleistocene) : Sandy alluvium;reddish brown, indurated, surface of most fans slightly dissected.
Qyf Young alluvial fan deposits (Holocene and late Pleistocene) : Gravel,sand, and silt, mixtures, some contain boulders; unconsolidated.
Qvof Very old alluvial fan deposits (middle to early Pleistocene) : Sandyalluvium; reddish-brown, well-indurated, fan surfaces well-dissected.
Qch Coyote Hills Formation (Pleistocene) : Mosty mudstone and pebblysandstone, nonmarine
Qlh La Habra Formation (Pleistocene) : Nonmarine mudstone, fluvialsandstone, and conglomerate
Tfu Fernando Formation (Pliocene)-Upper member : Sandstone, pebblysandstone, and sandy conglomerate.
Tfl Fernando Formation (Pliocene)-Lower member : Siltstone, sandstoneand conglomerate.
Tpy Puente Formation-Yorba Member (Miocene) : Predominately siltstoneand sandstone.
Tpsc Puente Formation-Sycamore Canyon Member (early Pliocene and Miocene) :Predominately sandstone and pebble conglomerate.
Tplv Puente Formation-La Vida Member (Miocene) : Predominately siltstoneinterbedded with some sandstone
Tt Topanga Formation (middle Miocene) : Marine sandstone, siltstone, andlocally conglomerate.
Tv Vaqueros Formation (early Miocene, Oligocene, and late Eocene) :Sandstone and sandy siltstone; massive- to thick-bedded, marine
Ts Sespe Formation (early Miocene, Oligocene, and late Eocene) :Conglomeratic sandstone and clayey and silty sandstone; varied colored,poorly defined massive- to thick-beds, nonmarine
Tvs Vaqueros and Sespe Formations, undifferentiated (early Miocene, Oligocene,and late Eocene) : Interbedded sandstone and conglomerate; marine andnonmarine
Description of Map Units

1857M 8+
1925M 6.3
1916M 6.0
1971M 6.6
1994M 6.7
1987M 5.9
1991M 5.8
1812M 6.9
1899M 7.0
1890M 7.0
1907M 6.0
1923M 6.3
1910M 6.0
1918M 6.8
1992M 6.4
1933M 6.4
1938M 5.5
1963M 5.1
1935M 5.1
1943M 5.3
2003M 5.4
1992M 5.4
1943M 5.3
1962M 5.0
1970M 5.2
1990M 5.4
1933M 5.4
1979M 5.2
1968M 5.3 1973
M 5.3
1941M 5.5
1978M 5.1
1981M 5.5
1988M 5.4
1941M 5.1
1952M 7.5
1952M 5.1
1997M 5.1
APPROXIMATE EPICENTRAL AREA OF EARTHQUAKE
YearM8+
YearM7+
YearM6+
YearM5+
Historic FaultDisplacement
Holocene FaultDisplacementWithout HistoricRecord
REFERENCES:
Jennings, C.W., 1994, “Fault Activity Map of California and Adjacent Areas with Locations and Ages ofRecent Volcanic Eruptions,” California Division of Mines and Geology, GDM-6.
Earthquake Catalogs: Richter, 1812-1905, National Oceanic and Atmospheric Administration,1906-1931; Caltech, 1932-2005.
o
24
20KM
Miles120
0 10
L Site
4953-05-04245-31-07as shown
PER
JOB NO.:
DATE:
SCALE:
DRAWN BY:
CHECKED BY:
REVISIONS:
Figure 4. Regional Faults and Seismicity MapCity of Anaheim 200 MW Peaking Power Plant
Anaheim, California
10/4/07
4953-07-1741
PWK
As shown
MACTEC ENGINEERING AND CONSULTING, INC.
5628 E. Slauson Ave., Los Angeles, California 90040
(323) 889-5300, fax (323) 889-5398
SITE

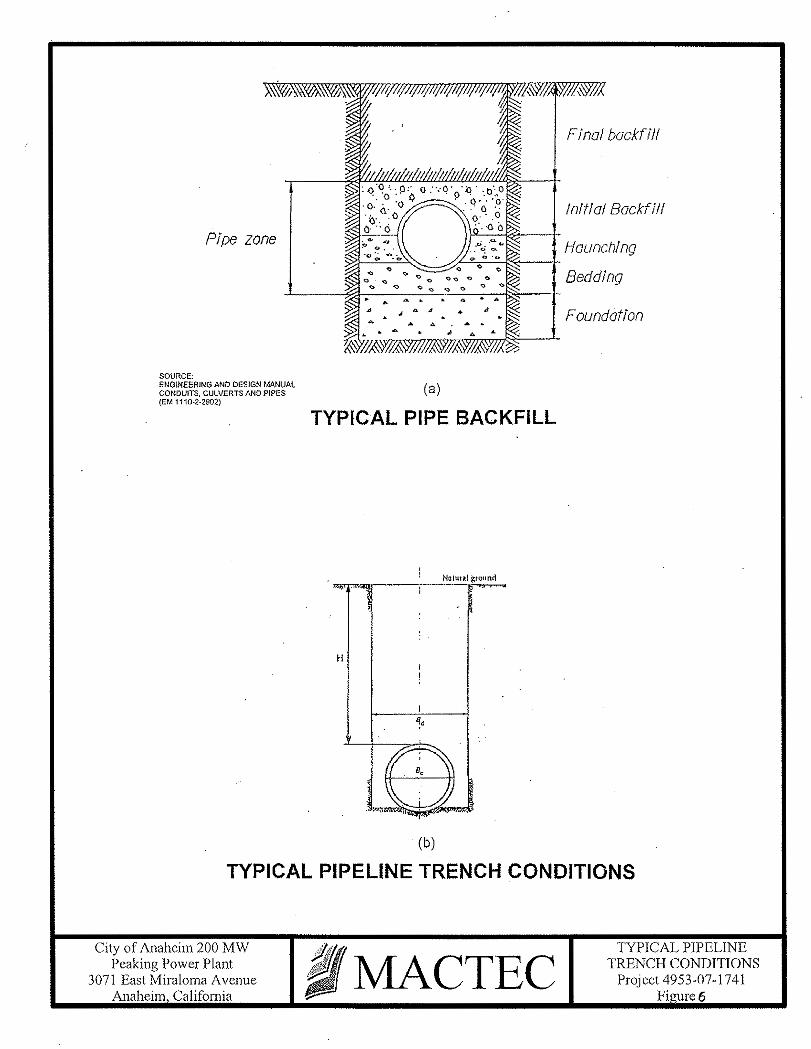

PB Americas, Inc. - City of Anaheim 200 MW Peaking Power Plant October 10, 2007 MACTEC Engineering and Consulting, Inc., Project 4953-07-1741
APPENDIX A
CURRENT EXPLORATIONS AND LABORATORY TESTS

PB Americas, Inc. - City of Anaheim 200 MW Peaking Power Plant October 10, 2007 MACTEC Engineering and Consulting, Inc., Project 4953-07-1741
A-1
APPENDIX A
EXPLORATIONS AND LABORATORY TESTS
EXPLORATIONS
The soil conditions beneath the site were explored by drilling five borings at the locations shown
on Figure 2. The borings were drilled to depths of 30 to 50½ feet below the existing grade using
truck-mounted hollow-stem auger drilling equipment.
The soils encountered were logged by our field technician, and undisturbed and bulk samples were
obtained for laboratory inspection and testing. The logs of the borings are presented on
Figures A-1.1 through A-1.5; the depths at which undisturbed samples were obtained are indicated
to the left of the boring logs. The number of blows required to drive the Crandall sampler 12 inches
using a 140 hammer falling 30 inches is indicated on the logs. In addition to obtaining undisturbed
samples, standard penetration tests (SPT) were performed in one of the borings; the results of the
tests are indicated on the logs. The soils are classified in the accordance with the Unified Soil
Classification System described on Figure A-2.
LABORATORY TESTS
Laboratory tests were performed on selected samples obtained from the borings to aid in the
classification of the soils and to determine their engineering properties.
The field moisture content and dry density of the soils encountered were determined by performing
tests on the undisturbed samples. The results of the tests are shown to the left on the boring logs.
Direct shear tests were performed on selected undisturbed samples to determine the strength of the
soils. The tests were performed at field moisture content and after soaking to near-saturated
moisture content and at various surcharge pressures. The yield-point values determined from the
direct shear tests are presented on Figure A-3, Direct Shear Test Data.
Confined consolidation tests were performed on two undisturbed samples to determine the
compressibility of the soils. Water was added to the samples during the tests to illustrate the effect

PB Americas, Inc. - City of Anaheim 200 MW Peaking Power Plant October 10, 2007 MACTEC Engineering and Consulting, Inc., Project 4953-07-1741
A-2
of moisture on the compressibility. The results of the tests are presented on Figure A-4,
Consolidation Test Data.
The optimum moisture content and maximum dry density of the upper soils were determined by
performing a compaction test on a sample obtained from Boring 5. The test was performed in
accordance with the ASTM Designation D1557-02 method of compaction. The results of the tests
are presented on Figure A-5, Compaction Test Data.
To determine the fines content, tests to determine the percentage of fines (material passing through
a -200 sieve) in selected samples were performed. The results of these tests are presented on the
boring logs.
To provide information for paving design, a stabilometer test (“R” value test) was performed on a
sample of the upper soils. The test was performed for us by LaBelle·Marvin Professional Pavement
Engineering. The results of the test are presented on Figures A-6.1 through A-6.2


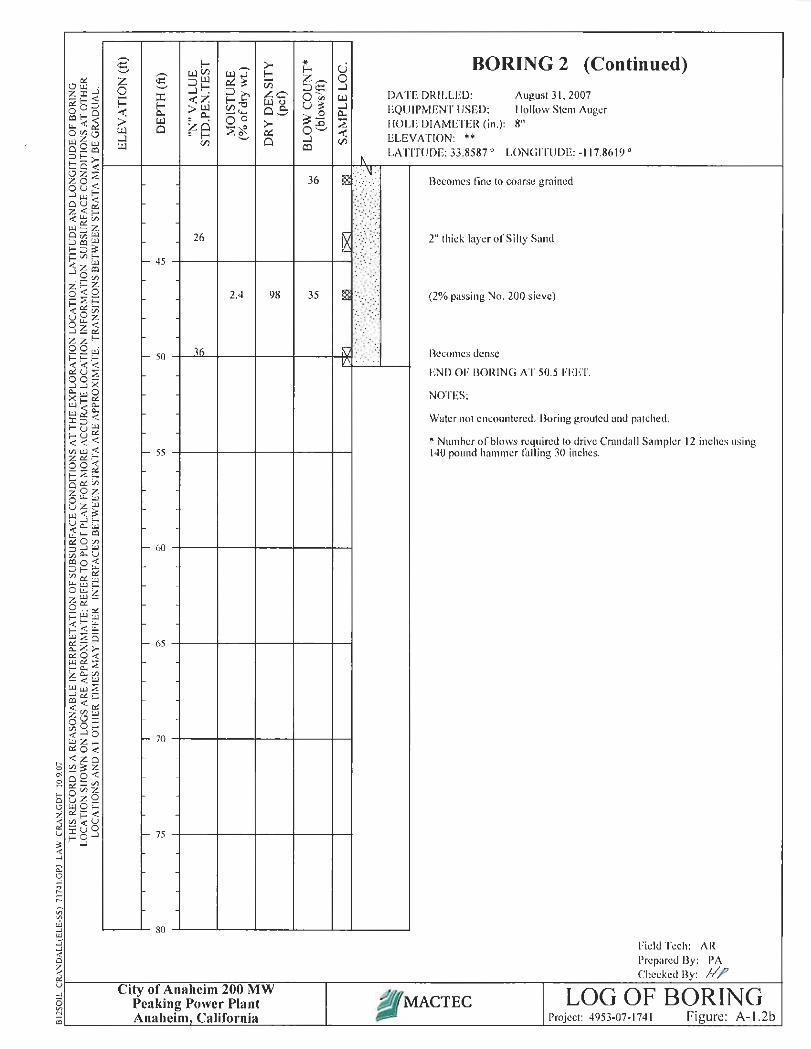

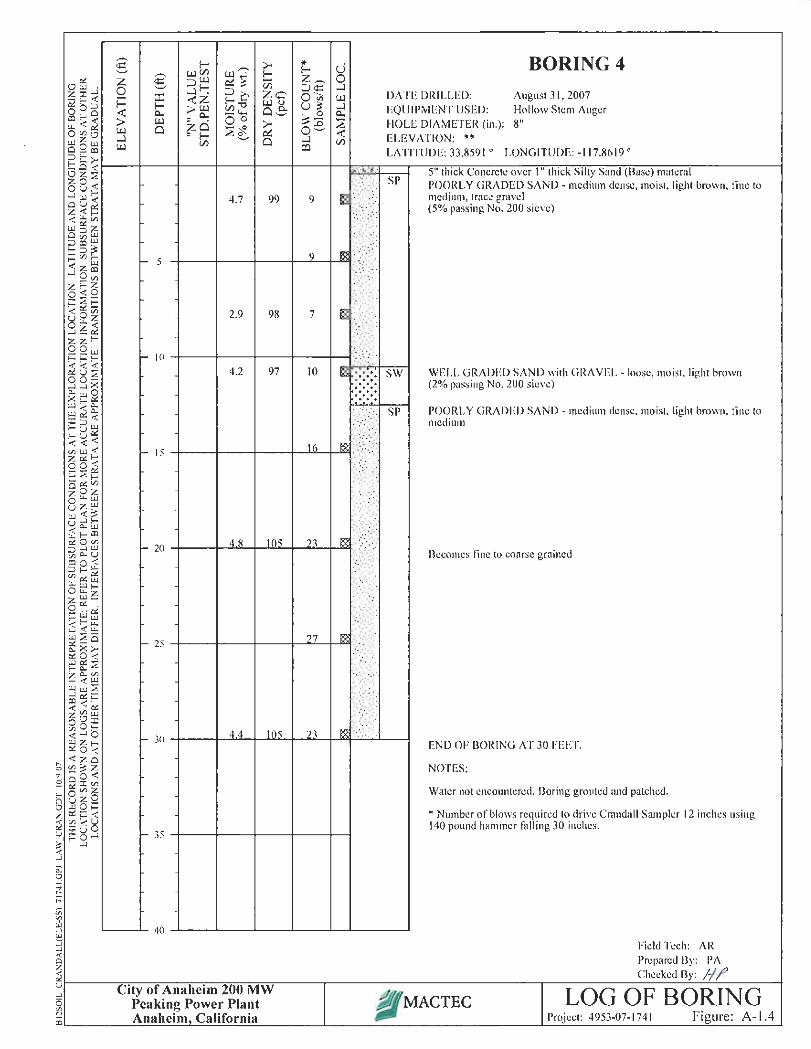

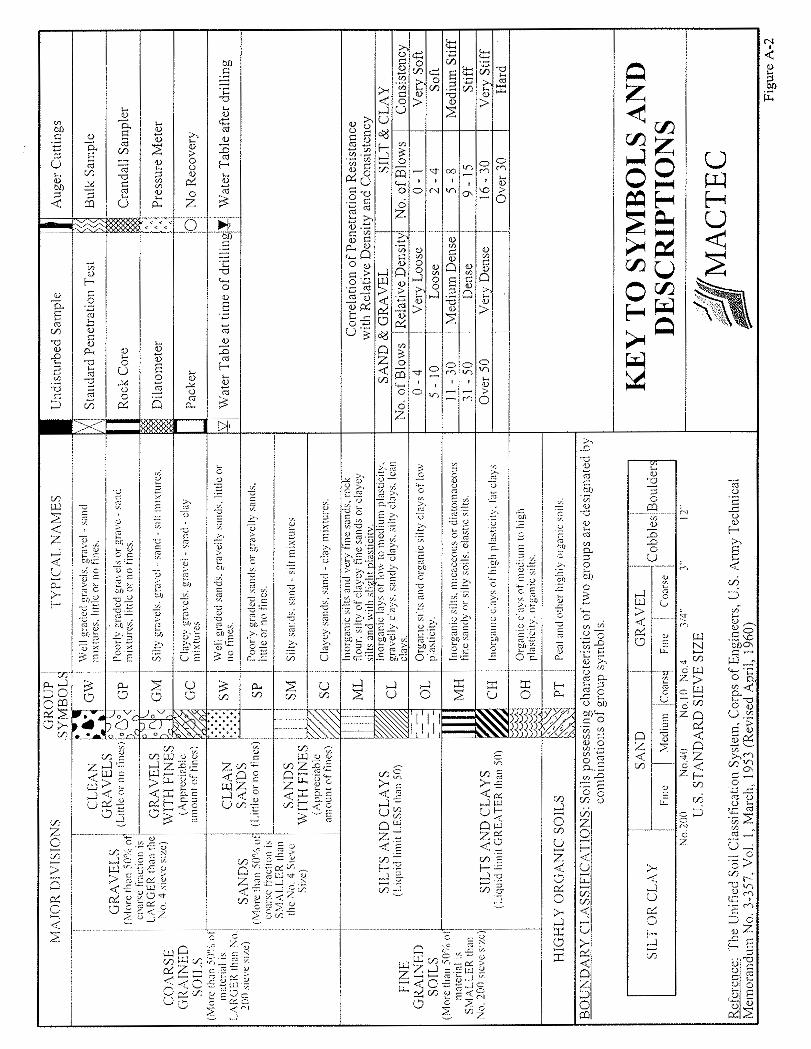


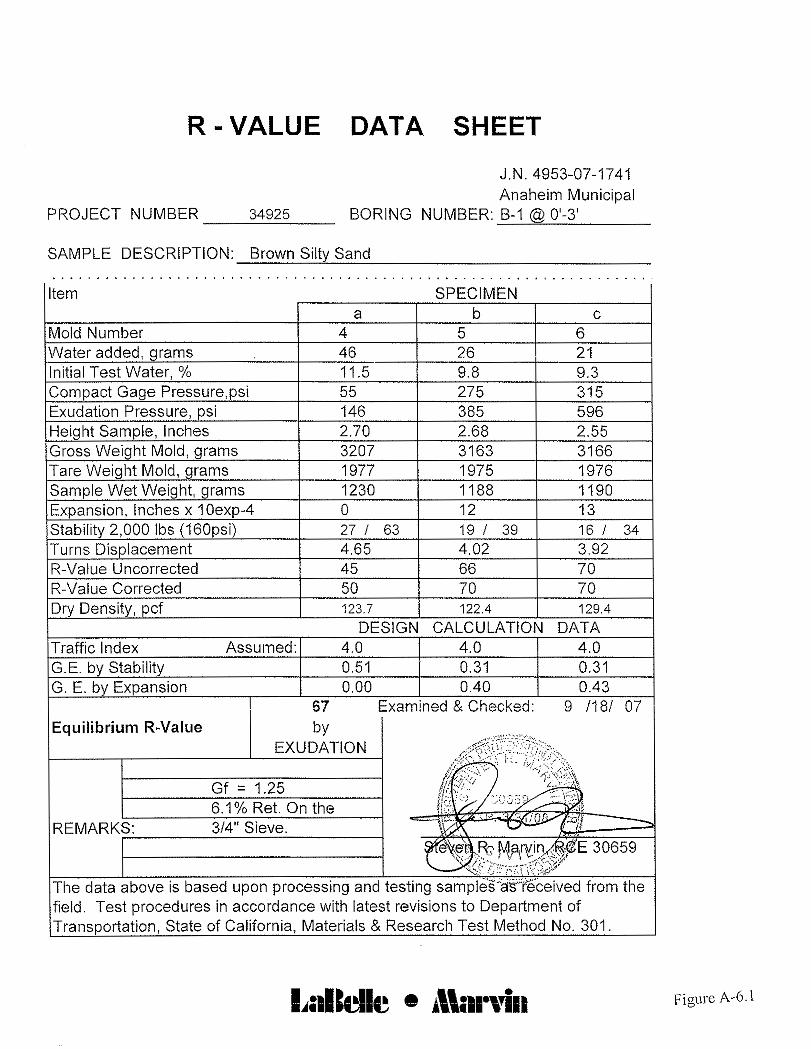

PB Americas, Inc. - City of Anaheim 200 MW Peaking Power Plant October 10, 2007 MACTEC Engineering and Consulting, Inc., Project 4953-07-1741
APPENDIX B
CONE PENETRATION TESTS RESULTS


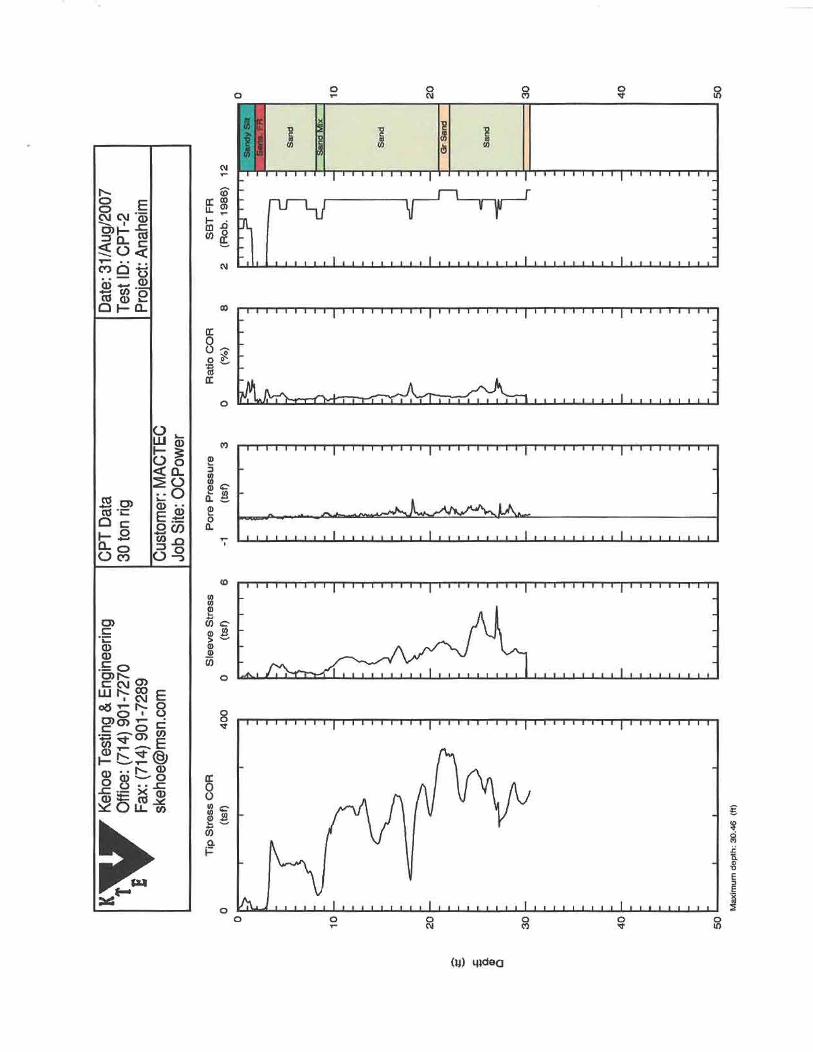


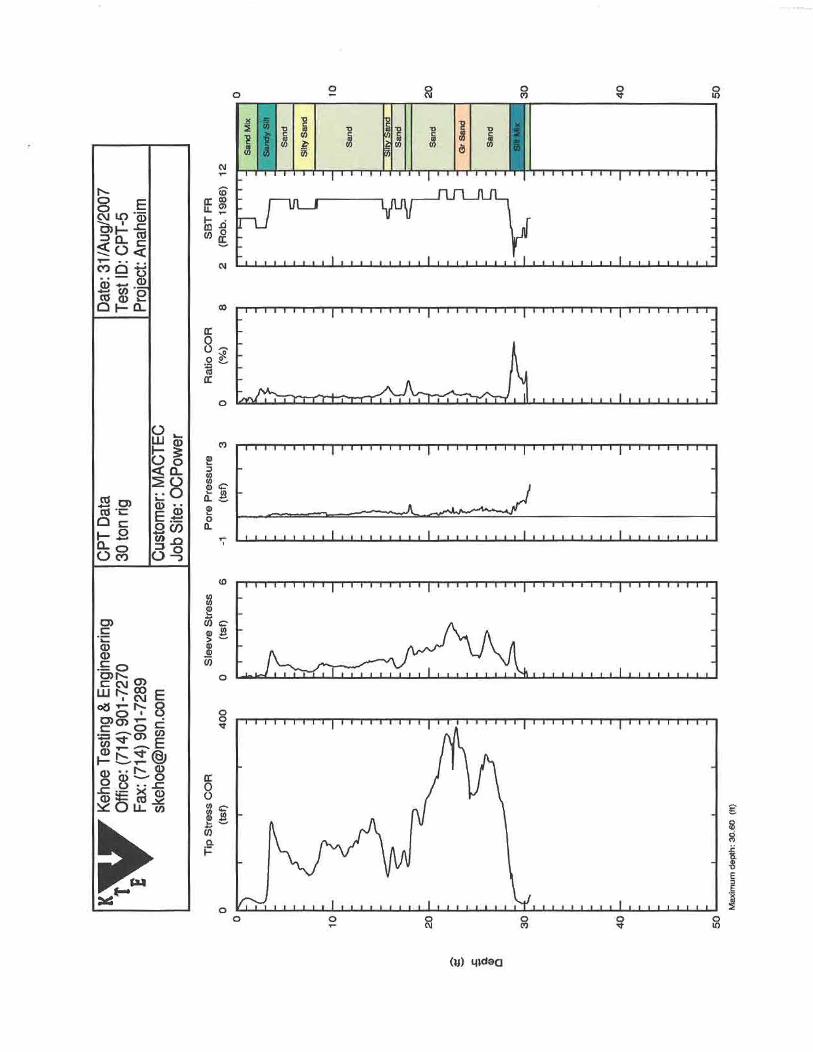
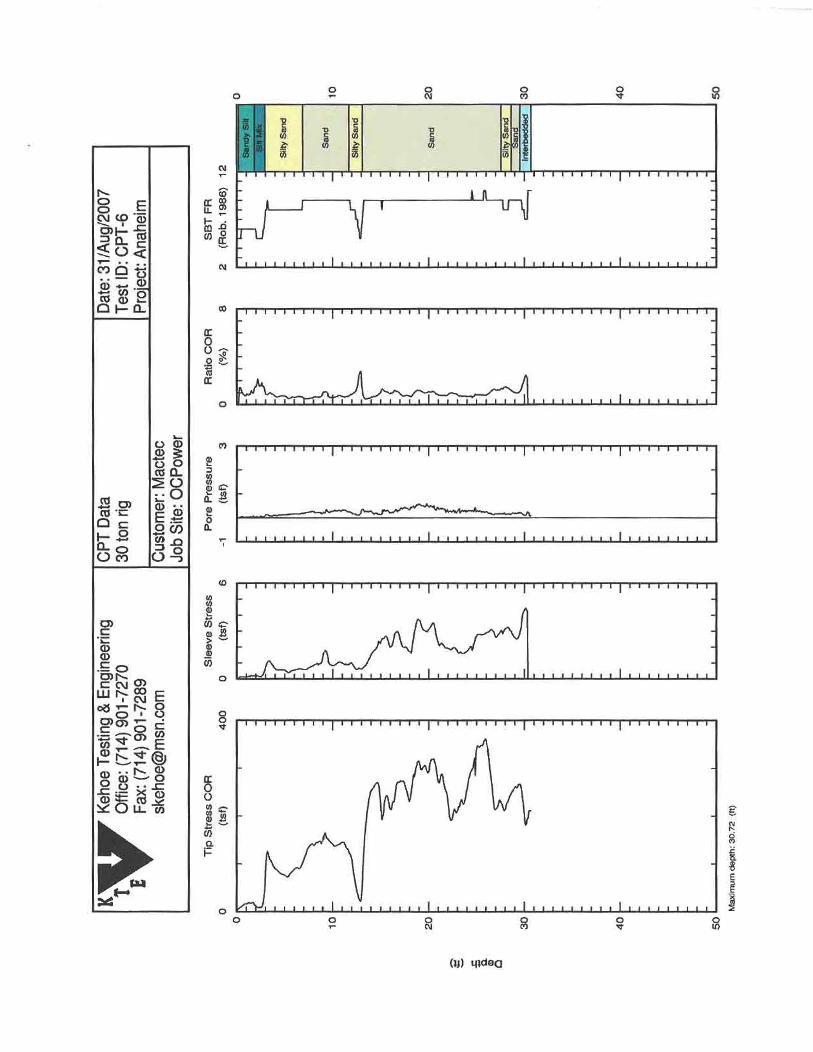


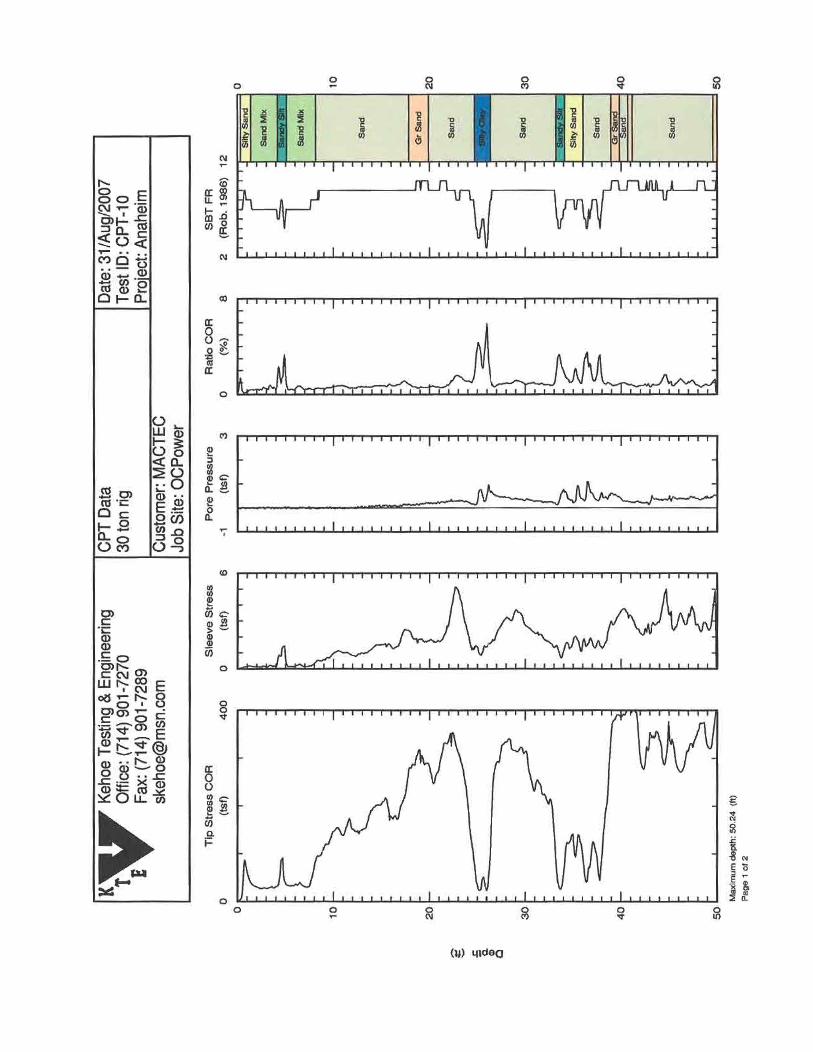

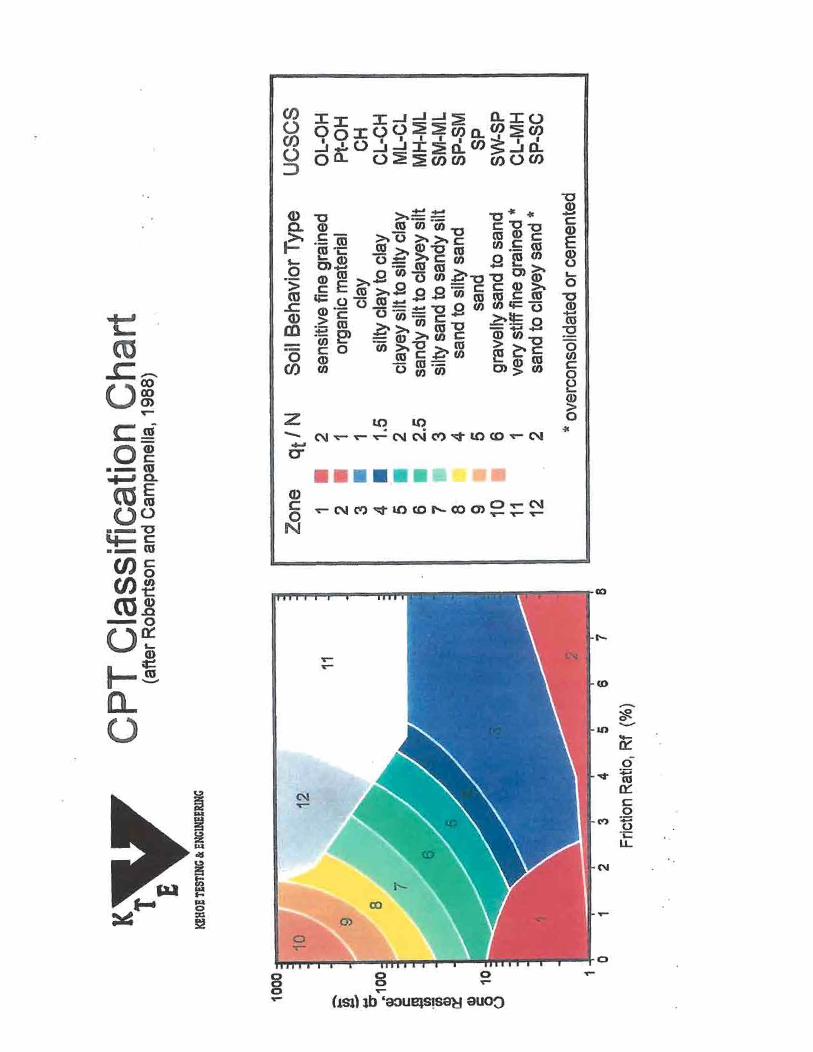

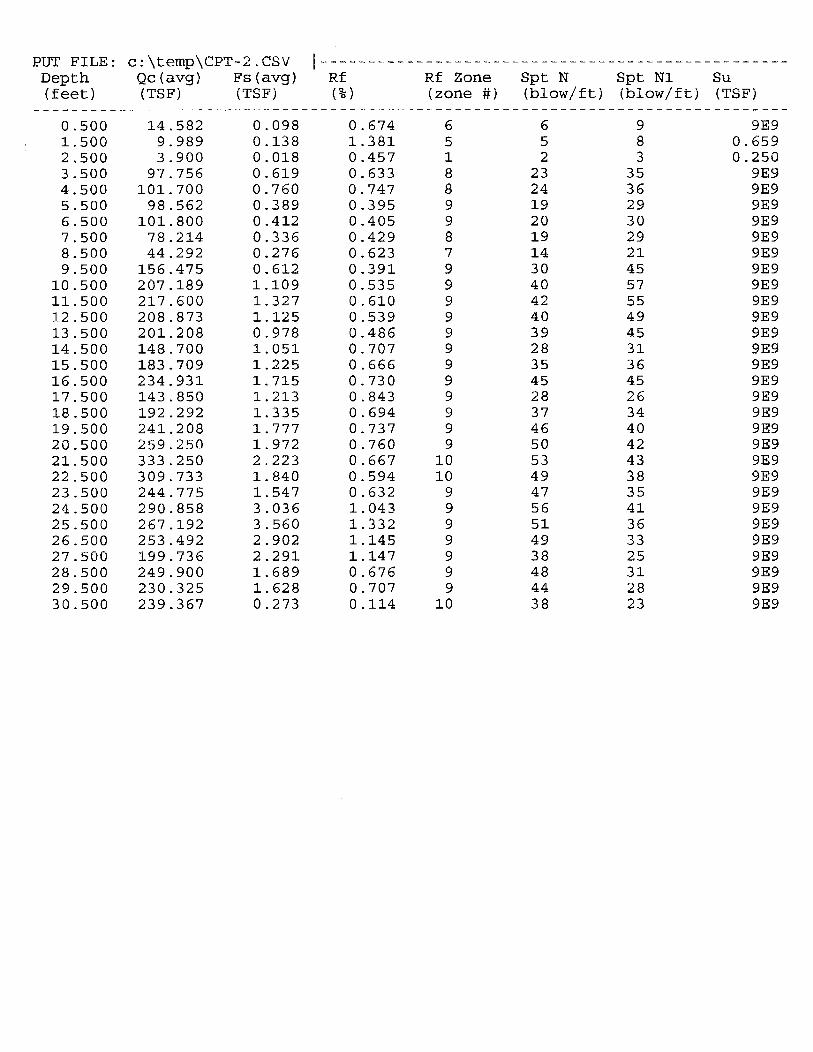

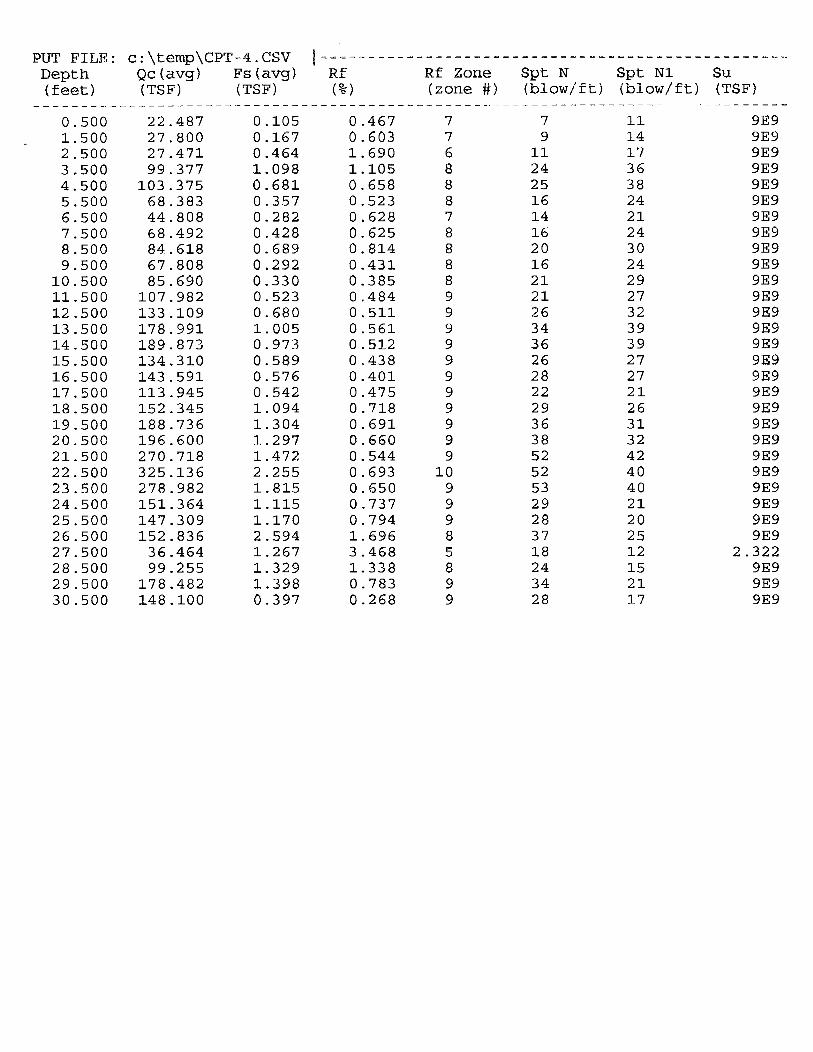
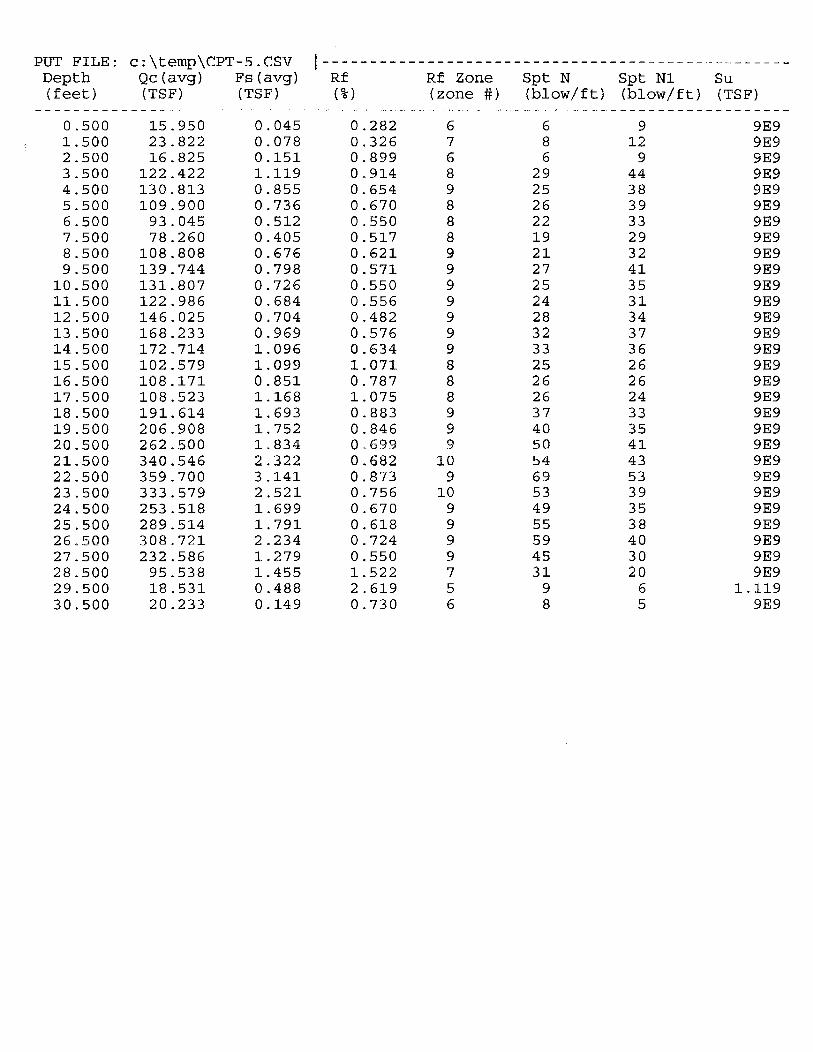
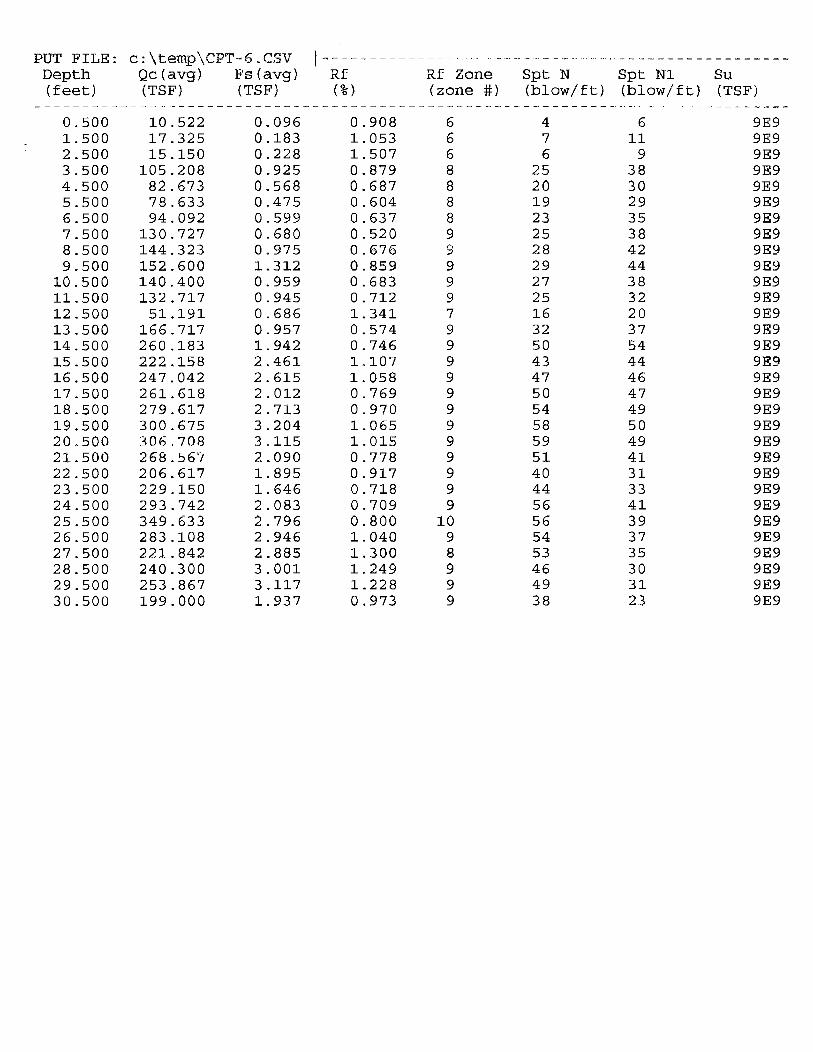


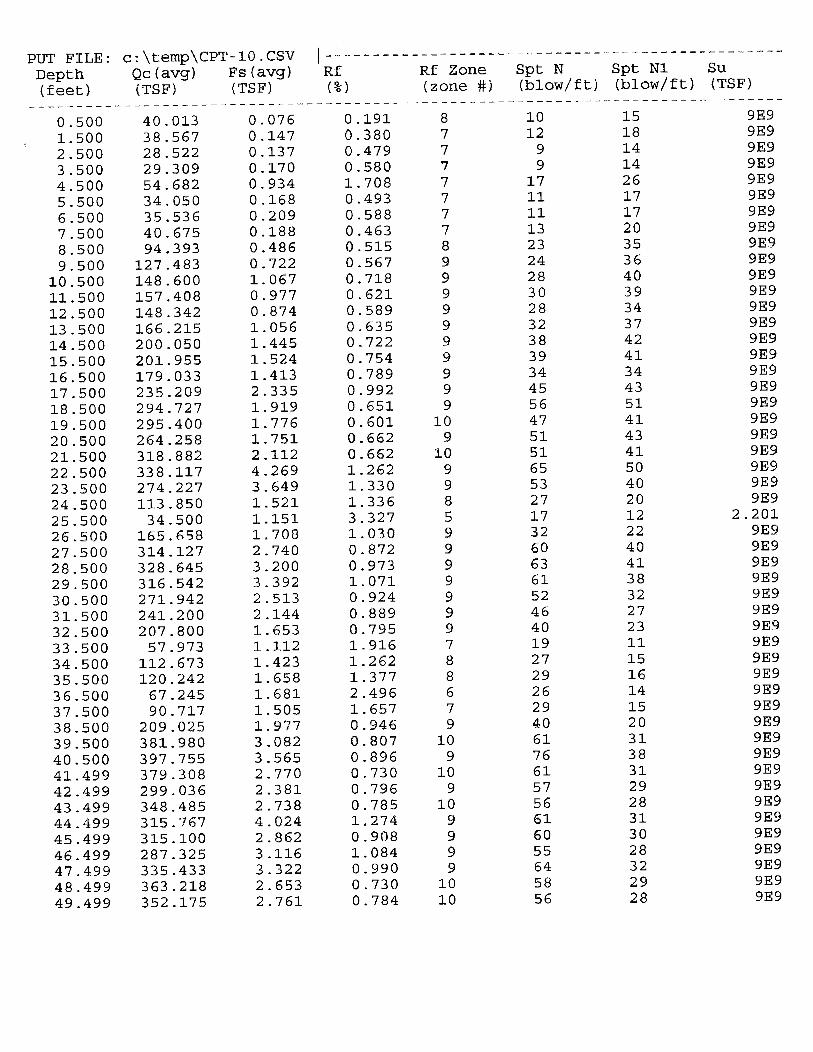


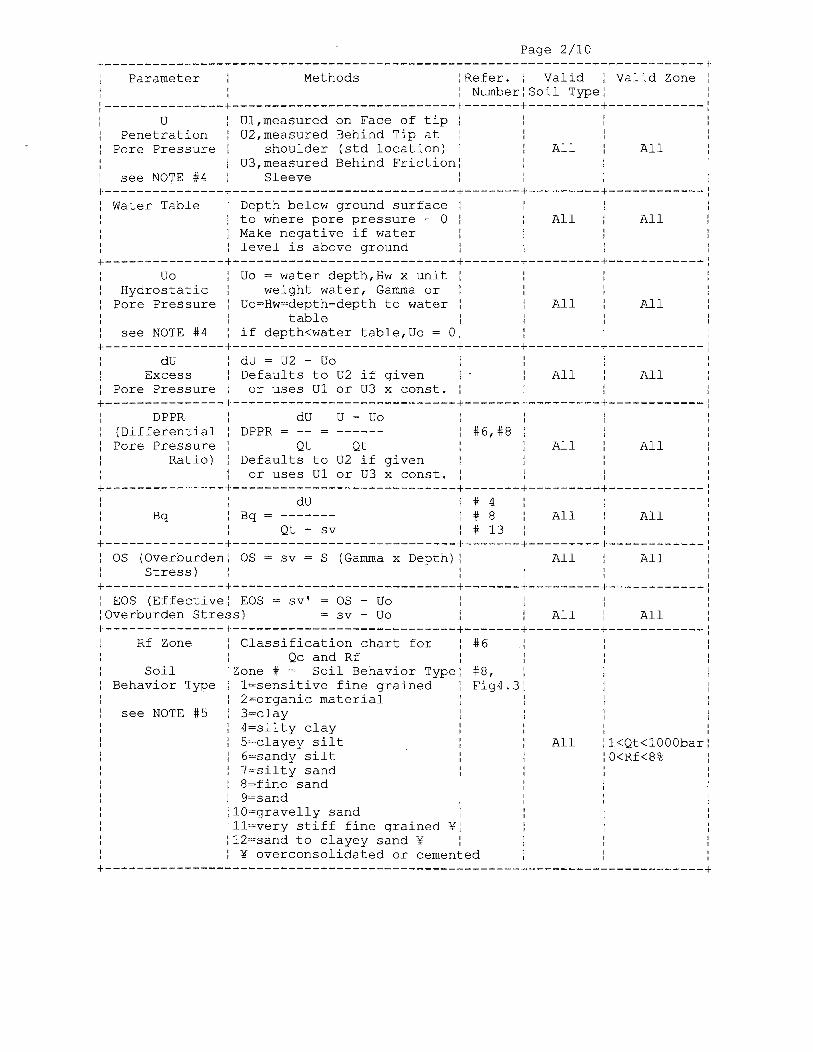


PB Americas, Inc. - City of Anaheim 200 MW Peaking Power Plant October 10, 2007 MACTEC Engineering and Consulting, Inc., Project 4953-07-1741
APPENDIX C
ELECTRICAL RESISTIVITY TEST RESULTS
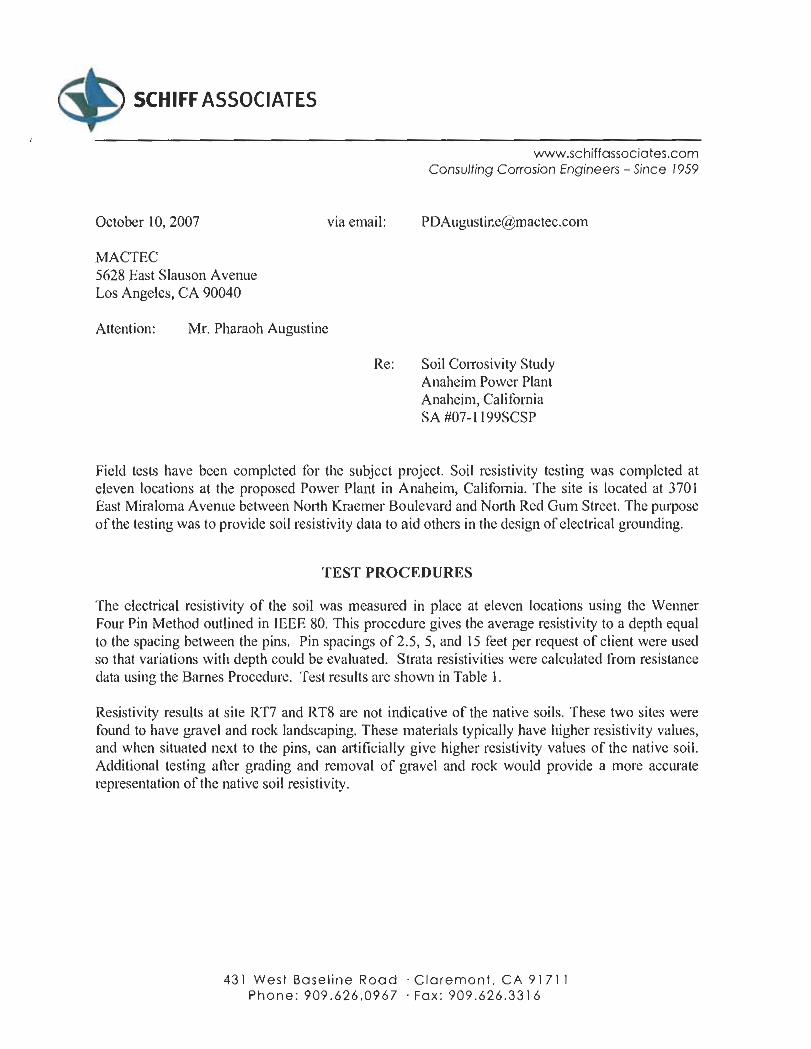


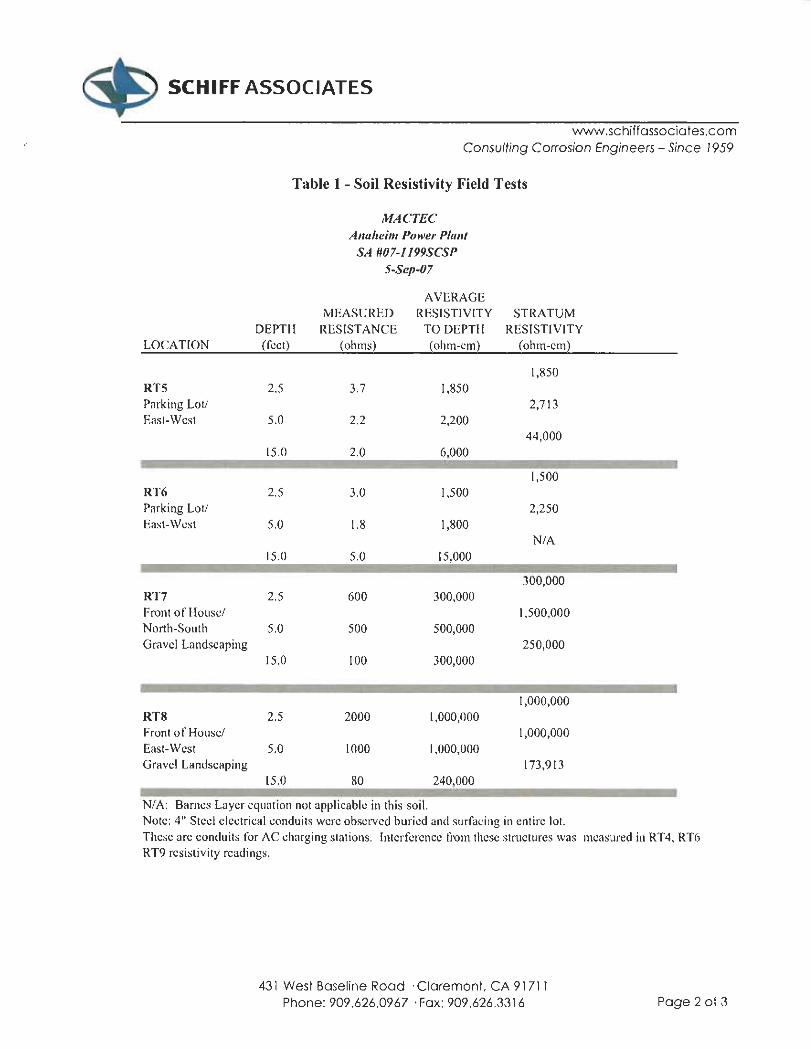


PB Americas, Inc. - City of Anaheim 200 MW Peaking Power Plant October 10, 2007 MACTEC Engineering and Consulting, Inc., Project 4953-07-1741
APPENDIX D
PREVIOUS EXPLORATIONS AND TEST RESULTS