59
Thao Nguyen Capacitive Sensing: Water Level Application Helsinki Metropolia University of Applied Sciences Degree of Bachelor Degree Programme in Electronics Thesis Date 24.05.2016

Thao Nguyen
Capacitive Sensing: Water Level Application
Helsinki Metropolia University of Applied Sciences
Degree of Bachelor
Degree Programme in Electronics
Thesis
Date 24.05.2016

Abstract
Author Title Number of Pages Date
Thao Nguyen Capacitive Sensing of Water Level 54 pages + 2 appendices 24 May 2016
Degree Bachelor of Engineering
Degree Programme Electronics
Specialisation option Sensor
Instructors
Thierry Baills, Principal Lecturer Jan-Erik Eskelinen, Software Engineer
In this thesis, the application of capacitive sensing technology in liquid level monitoring will be analysed specifically. Applying the related techniques to design a sensor port of high sensitivity is the target which allows a high accuracy and reliability of measurement. The project involves improving the quality of the control signal by the capacitive sensor, which is demanded with several particular specifications in practice of a commercial product’s design requirements. Therefore, the practicability of the project makes this paper being considered as a more applicable than theoretical document of technical research. The implementation was taken advantage of approaches and methods. A wide source for a literature review was exploited for information collection of advanced capacitance calculation theory and existing applications of liquid level capacitive sensing. Expert and professional discussions were conducted on a regular basis of meetings with the instructors and the engineer team. Practical labs were substantially carried out for simulating and prototyping the sensor with computer-aid design programs and lab devices at school or company. Test codes were written in the online compiler - an integrated development environment on ARM mbed developer site. The work results in digging deeper into the understanding of capacitive sensing, capacitance to digital conversion and their applications in water level tracking. Furthermore, it is satisfactory with a complete product of the sensor port, the sufficient accuracy of measurements and the first skills learned from designing a flexible printed circuit. Overall, the practice of the training process is fulfilled and preparatory for the valuable working experience and techniques of electronic systems designing and embedded systems programming in a coming future of a graduate in Electronics Engineering. To sum up, this document can be used as an application note of advanced capacitive sensing technology for tracking the height level of any light viscosity fluid in a symmetrical-shaped reservoir. The specifications of capacitance to digital converter FDC1004 with inter-integrated circuit data transfer are also sharpened as a beneficial reference for a broad range of different applications using this capacitive sensing technology.
Keywords liquid level, capacitive sensing, coplanar electrodes, CDC, I2C

3
Contents
I. List of Figures 4
II. Index of Tables 5
III. List of Abbreviations 6
1 Introduction 7
2 Theoretical Background 8
2.1 Capacitance Approximation of Coplanar Electrodes 9
2.2 Liquid Level Capacitive Sensing 16
2.2.1 Liquid level coplanar-plate capacitive sensors 16
2.2.2 Differential and Ratiometric Measurement of Liquid Level 19
2.2.3 Active Shielding 21
2.2.4 Out-of-Phase Liquid Level Technique 23
2.3 FDC1004 Capacitance to Digital Conversion 25
2.4 I2C data transfer between MCU and FDC1004 26
3 Methods and Materials 29
4 Sensor Layout Design 31
5 Programming 35
6 Measurement and Calibration 40
6.1 Measurement Setup 40
6.2 Calibration of Measurement 43
7 Results and Discussion 44
7.1 Measurement with Nucleo-STM32 44
7.2 Measurement with Backflow Control Board 46
8 Conclusion 51
References 52
Appendices
Appendix 1. Main code file
Appendix 2. Main header file

4
I. List of Figures
Figure 1. (a) Conventional parallel plate capacitor (b) Coplanar-plate capacitor [3, 10] . 9
Figure 2. Two dimension Electric Fields between coplanar metal plates of an infinite
length [3, 14] ............................................................................................................... 10
Figure 3. Capacitance change due to 1mm height change of dielectric from air to water
of coplanar electrodes of infinite length. ...................................................................... 15
Figure 4. Field penetration depth versus electrode width of coplanar electrodes of
different electrode gap. ............................................................................................... 15
Figure 5. Two dimension plot of the electric field by a coplanar-plate capacitor modelled
by COMSOL program ................................................................................................. 16
Figure 6. Coplanar electrodes attached with dielectric substrate on one of its side [5] 17
Figure 7. Multi-dielectric layers of liquid level sensing coplanar-plate capacitor [5] ..... 18
Figure 8. Differential and ratiometric measurement setup of liquid level sensing [6, 6] 19
Figure 9. Shielding effect on the electric field of the sensor (ch) and ground (gnd)
electrodes [7, 2] .......................................................................................................... 22
Figure 10. Focusing the sensing area of the sensor electrode with a shield [7, 3] ....... 22
Figure 11. Conventional liquid level technique by FDC1004 suffering human body effect
[9, 5] ........................................................................................................................... 23
Figure 12. Comparison of conventional and OoP electrical model in liquid level
application [9, 6] ......................................................................................................... 24
Figure 13. OoP technique sensor layout for LEVEL and REF sections [9, 7] .............. 24
Figure 14. FDC1004 block diagram [8, 10].................................................................. 25
Figure 15. Capacitance to digital conversion theory of FDC1004 [1, 4] ....................... 26
Figure 16. Diagram of a typical I2C configuration [10] ................................................. 27
Figure 17. Write frame on I2C bus [8, 14] .................................................................... 28
Figure 18. Read frame on I2C bus [8, 14] .................................................................... 28
Figure 19. Online compiler IDE on ARM mbed developer site..................................... 30
Figure 20. Nucleo-F103RB pinout ............................................................................... 31
Figure 21. Design block diagram of the liquid level FPC sensor port [6, 1] .................. 32
Figure 22. Schematic of sensor connection to FDC1004 [6, 17] .................................. 32
Figure 23. Stack-up of two layer FPC terminated with zip contact fingers. .................. 33
Figure 24. Composite view ......................................................................................... 34
Figure 25. Stiffener layer ............................................................................................. 34
Figure 26. Silkscreen top ............................................................................................ 34
Figure 27. Top copper layer ........................................................................................ 34

5
Figure 28. Base polyimide layer and drill drawing ....................................................... 35
Figure 29. Bottom copper layer ................................................................................... 35
Figure 30. Dimension of the sensor port ..................................................................... 35
Figure 31. Write and read function of I2C class reference in the mbed library ............. 39
Figure 32. Measurement setup of the liquid level system ............................................ 40
Figure 33. Devices under test ..................................................................................... 41
Figure 34. Tera Term display at COM6 serial port and the test code compiled to the MCU
................................................................................................................................... 41
Figure 35. Testing ....................................................................................................... 42
Figure 36. Measurement results read from Tera Terminal .......................................... 42
Figure 37. Measurement setup with the backflow control board .................................. 43
Figure 38. Capacitance measurement results with the Nucleo-STM32. ...................... 45
Figure 39. Capacitance measurement results with the backflow control board. .......... 48
Figure 40. Estimation of the level with 2.6pF-offset RE capacitance ........................... 49
Figure 41. Ratiometric level versus actual level without the RE sensor concerned. .... 49
Figure 42. Measured level versus actual level without RE sensor used. ..................... 50
II. Index of Tables
Table 1. Configuration of a single measurement at each starting ................................ 37
Table 2. Measurement result of capacitances with the Nucleo-STM32 ....................... 44
Table 3. Measurement result of capacitances with the backflow control board ........... 46
6
III. List of Abbreviations
ACK Acknowledgement
ADC Analog to Digital Converter
ARM Advanced RISC Machine
CAD Computer-aid Design
CDC Capacitance to Digital Converter
DUT Devices under Test
FFC Flat Flexible Cable
FPC Flexible Printed Circuit
GUI Graphic User Interface
I2C Inter Integrated Circuit
IC Inter Integrated Circuit
IDE Integrated Circuit
LSB Least Significant Bit
mbed Embedded System
MCU Microcontroler
MSB Most Significant Bit
OoP Out of Phase
PC Personal Computer
PCB Printed Circuit Board
RE Reference Environment
RL Reference Liquid
RX Receiver
SCL Serial Clock
SDA Serial Data
SDK Software Development Kit
TX Transmitter
USB Universal Serial Bus

7
1 Introduction
This bachelor thesis includes overall documentation of my final year project work which
was carried out for Finndent Company - a Finnish manufacturer of dental care units and
patient chairs. Furthermore, the document is considered beneficial for development of
professional studies at Helsinki Metropolia University of Applied Sciences.
The thesis project is to design and improve the accuracy of a capacitive sensor
monitoring water level in the tank of a backflow prevention device which are needed to
comply with European technical standards for dental care units. Capacitive sensing of
liquid level is therefore a target to be studied in a deep revision of theoretical background.
The reference of researches and developments of this technology mainly bases on
Texas Instrument’s technical documents accompanied with FD1004 capacitance to
digital converter (CDC). As expected results, specifications of a flexible printed circuit
(FPC) design of the sensor port and test codes written on an evaluation kit of Nucleo-
F103RB microcontroller (MCU) are of primary discussion. However, the scope of this
thesis is limited by the company secret as a part of the mother project and the other
details of the existing prototype of the backflow prevention device are kept excluded in
this document.
The backflow prevention device is designed to protect main supply water from
contamination by the flow of used water back into clean water supply system due to, for
example, pressure reduction in water supply line. In this prototype, main water is driven
into water tanks in which the changes in the water level is sensed as input control signal
used to command operations of air and water valve system to stabilize water flow rate at
output. The more accuracy of sensors, the better control of pneumatic and water lines.
Among several possible methods for sensing liquid level, capacitive sensing with
symmetrical topology of coplanar conducting plates being contactless with the fluid is
selected in design. Due to a high resolution of sensitivity for the expected quality of
accuracy, capacitive effect of coplanar electrodes are in conditions meeting specific
specification requirements of the product design. The water tanks came into the
prototype in cylindrical shape and the clean water is kept as much touchless as possible
by electrical and mechanical components. Therefore, the sensor port was designed as
a FPC on which the coplanar sensor electrodes were embedded and easily bent into co-
cylindrical shape surrounding the outside of the water tanks.

8
The specific scope of this thesis is to analyse the properties and specifications of:
- Coplanar capacitive sensor in a symmetrical topology, fringing effect and other
design factors affecting its sensitivity,
- The FD1004 CDC configuration in out of phase (OoP) shielding mode for a high
accuracy of measurements and
- Inter-integrated circuit (I2C) communication of CDC signal between SMT32F103
microcontroller’s peripheral and I2C of FDC1004.
Obviously, the thesis project required a combination of the knowledge and techniques
about sensors, computer-aid designs (CAD) and embedded systems (mbed). The
theoretical analyses, the practical CAD design and test codes will be reported and
discussed in details in the following sections.
2 Theoretical Background
Capacitive sensing is becoming a popular alternative to other methods in applications of
proximity detection, material analysis and liquid level sensing. The main advantages that
capacitive sensing has over other detection approaches are the capability to sense
different kinds of materials (skin, plastic, metal, liquid etc.) together with specifications of
being contactless and wear-free with a large sensing range, small design space of low
cost PCB sensors and a low-power solution. To understand different types of
applications and the constraints surrounding a system-level design entails, it is important
to understand the theory of electrostatics and capacitance calculations. [1, 1.]
This theoretical revision covers: an analysis based on fringing effect of coplanar-plated
capacitors; the way to adapt the capacitance sensing system into liquid level application
with differential measurement of capacitance by a CDC; and the factors affecting the
system to improve sensitivity of the sensor and accuracy of this measurement method.
To be introduced first of all is an approach to a capacitor model consisting of two coplanar
metallic foils whereof the capacitance can be considered approximately and similarly
behaving in the co-cylindrical configuration with an appropriate bending angle.

9
2.1 Capacitance Approximation of Coplanar Electrodes
Under fringing effect, any changes in dielectric of surrounding environment can be
detected by a capacitor consisting of a coplanar electrode pair. In this section, it is meant
to investigate the effect and optimization of the geometric parameters of the electrodes
to its high sensitivity. [2, 987.]
Figure 1. (a) Conventional parallel plate capacitor (b) Coplanar-plate capacitor [3, 10]
Capacitance (C) - a measurement of the capability to store an electrical charge (Q) in a
body at a given voltage (V) is defined by:
QC
V
The capacitance of capacitive electrodes depends on the geometrical shape of the
conductor-dielectric arrangement and position in the electric field [3, 9]. Figure 1
compares the differences of the capacitive electrodes in the coplanar structure with a
conventional parallel plate capacitor whose capacitance is calculated by
0 rACd
where 0 , r are vacuum permittivity and relative permittivity of the dielectric material
in which the capacitor is immersed, A is area of the plate and d is the separation between
the two parallel plates.

10
Coplanar electrodes can be mounted on most dielectric surfaces. “The fringing electric
fields of the coplanar electrodes bend and penetrate into the material which is attached
to the sensor. Thus, the variation of the dielectric property of the attached material affects
the inter electrode capacitance.” [3, 9.] This will be proved soon.
The solution of the two dimension electric field of a model with a coplanar rectangular
electrode pair of infinite length can be solved by conformal mapping techniques using
the inverse-cosine transform:
100
V 2ZW V cos
a
(1)
by which a coordinate Z x iy in the rectangular x-y plane is converted to
W u x, y iv x, y in the inverse cosine u-v plane, where the equipotential lines
u x, y are hyperbolic and the electrical flux lines v x, y are elliptical. [4, 479.]
Figure 2. Two dimension Electric Fields between coplanar metal plates of an infinite length [3, 14]
Figure 2 depicts the two dimension electric field between coplanar electrodes where w -
the electrode width, and a - the electrode gap separation can be seen in x-y plane; l - the
electrode length (l >> w) not showed up is in z direction and V0 represents the fixed
potential difference between two electrodes.
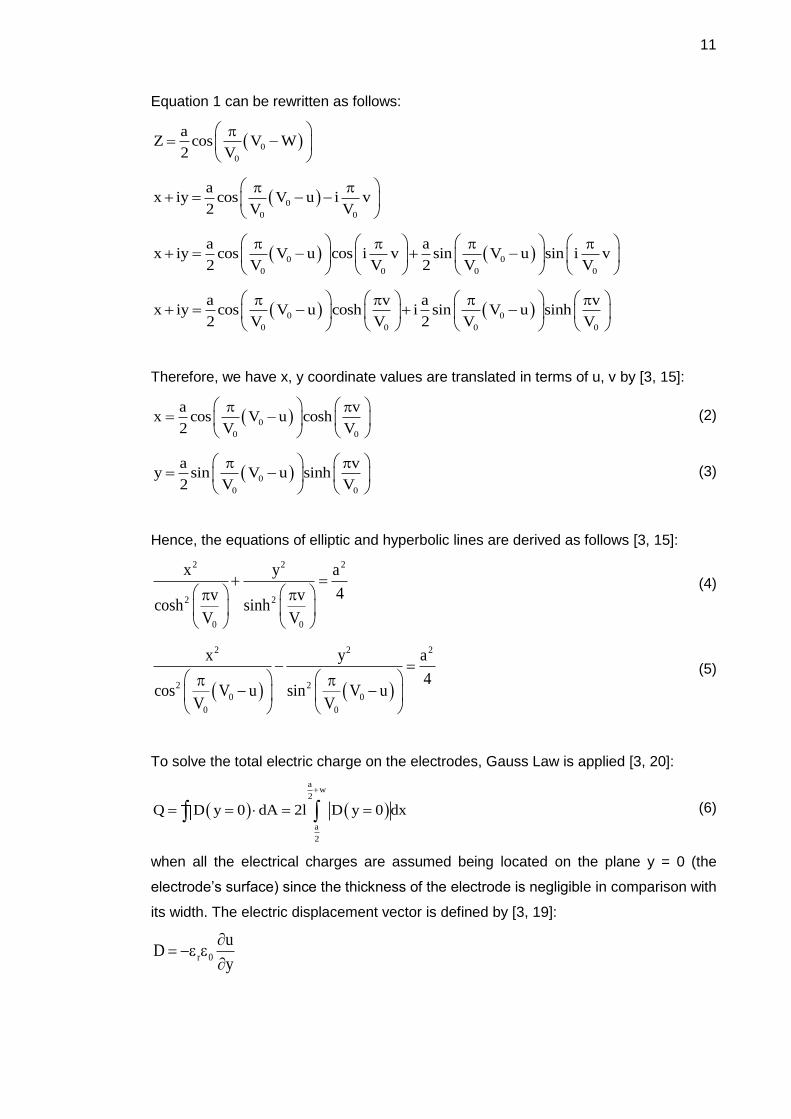
11
Equation 1 can be rewritten as follows:
0
0
aZ cos V W
2 V
0
0 0
ax iy cos V u i v
2 V V
0 0
0 0 0 0
a ax iy cos V u cos i v sin V u sin i v
2 V V 2 V V
0 0
0 0 0 0
a v a vx iy cos V u cosh i sin V u sinh
2 V V 2 V V
Therefore, we have x, y coordinate values are translated in terms of u, v by [3, 15]:
0
0 0
a vx cos V u cosh
2 V V
(2)
0
0 0
a vy sin V u sinh
2 V V
(3)
Hence, the equations of elliptic and hyperbolic lines are derived as follows [3, 15]:
2 2 2
2 2
0 0
x y a
4v vcosh sinh
V V
(4)
2 2 2
2 2
0 0
0 0
x y a
4cos V u sin V u
V V
(5)
To solve the total electric charge on the electrodes, Gauss Law is applied [3, 20]:
aw
2
a
2
Q D y 0 dA 2l D y 0 dx
(6)
when all the electrical charges are assumed being located on the plane y = 0 (the
electrode’s surface) since the thickness of the electrode is negligible in comparison with
its width. The electric displacement vector is defined by [3, 19]:
r 0
uD
y

12
r 0
y 0
uD y 0
y
(7)
u
y
can be derived from differentiation of Equation 3 with respect to y:
0 0
0 0 0 0 0 0
2 u v v vcos V u sinh sin V u cosh
a V y V V V y V V
Then, the boundary condition of 0u V along the surface of the electrode
a / 2 x a / 2 w on the plane y = 0 gives:
y 0
v0
y
0
y 0
0 y 0
2Vu
y va sinh
V
(8)
By substituting
y 0
u
y
from Equation 8 into Equation 7 and Equation 6, we have:
0r 0
0 y 0
2VD y 0
va sinh
V
aw
2
r 0 0
a
2
0 y 0
4 lV dxQ
a vsinh
V
(9)
The integrand in Equation 9 can be yielded as a function of x by solving Equation 2 at
u = V0 and y = 0:
0 y 0
a vx cosh
2 V
Therefore,

13
2
0 0y 0 y 0
2
v vsinh cosh 1
V V
2x1
a
(10)
By substituting 0 y 0
vsinh
V
from Equation 10 into Equation 9, we solve for Q:
aw
2
r 0 0
2a
2
aw
2
r 0 0
2a
2
2w1
a
r 0 0
21
2w1
a2r 0 0
1
4 lV dxQ
a 2x1
a
2dx
2 lV a
2x1
a
2 lV dt 2x; t
at 1
2 lVln t t 1
2
r 0 02 lV 2w 2wQ ln 1 1 1
a a
(11)
As a result, the capacitance of a coplanar electrode pair is:
0
QC
V
2
r 02 l 2w 2wC ln 1 1 1
a a
(12)
2
r 02 l b bC ln 1
a a
(13)
where b a 2w is the electrode outermost edge separation [3, 21].
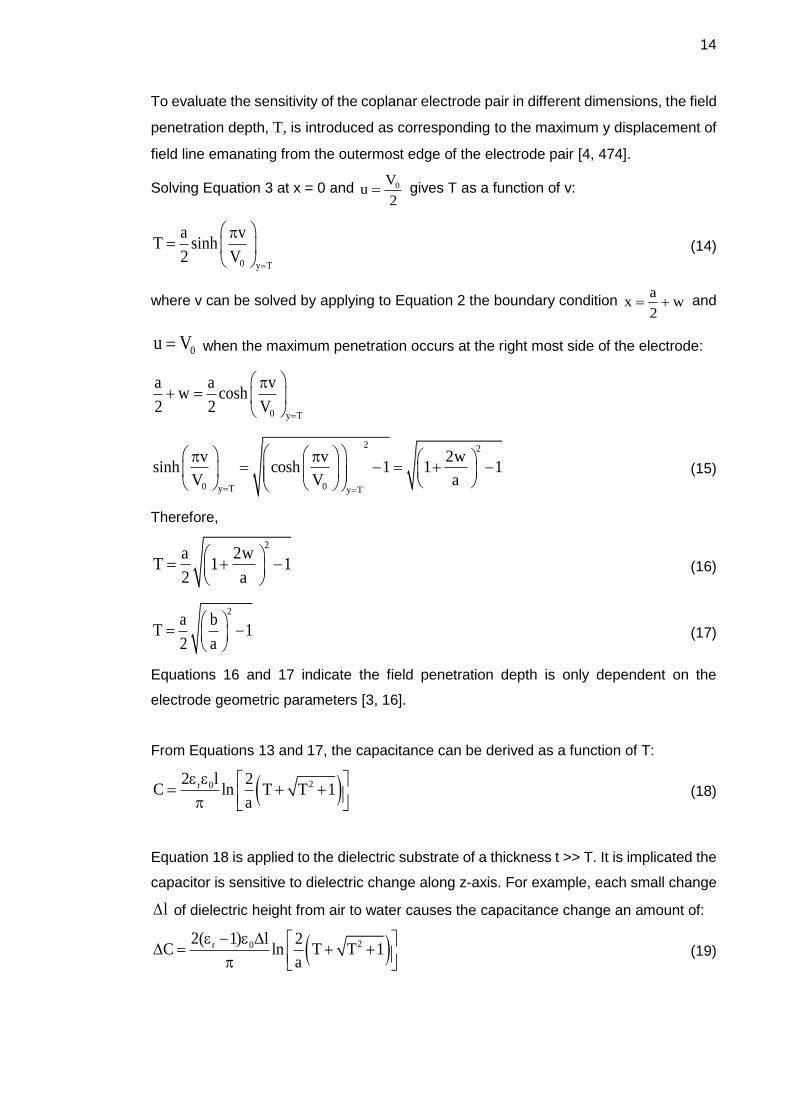
14
To evaluate the sensitivity of the coplanar electrode pair in different dimensions, the field
penetration depth, T, is introduced as corresponding to the maximum y displacement of
field line emanating from the outermost edge of the electrode pair [4, 474].
Solving Equation 3 at x = 0 and 0Vu
2 gives T as a function of v:
0 y T
a vT sinh
2 V
(14)
where v can be solved by applying to Equation 2 the boundary condition a
x w2
and
0u V when the maximum penetration occurs at the right most side of the electrode:
0 y T
a a vw cosh
2 2 V
2 2
0 0y T y T
v v 2wsinh cosh 1 1 1
V V a
(15)
Therefore,
2a 2w
T 1 12 a
(16)
2a b
T 12 a
(17)
Equations 16 and 17 indicate the field penetration depth is only dependent on the
electrode geometric parameters [3, 16].
From Equations 13 and 17, the capacitance can be derived as a function of T:
2r 02 l 2C ln T T 1
a
(18)
Equation 18 is applied to the dielectric substrate of a thickness t >> T. It is implicated the
capacitor is sensitive to dielectric change along z-axis. For example, each small change
l of dielectric height from air to water causes the capacitance change an amount of:
2r 02( 1) l 2C ln T T 1
a
(19)

15
where r 1 for air and r 80 for water at 200C.
Figure 3. Capacitance change due to 1mm height change of dielectric from air to water of coplanar electrodes of infinite length.
Figure 4. Field penetration depth versus electrode width of coplanar electrodes of different electrode gap.
0
0.2
0.4
0.6
0.8
1
1.2
1.4
1.6
1.8
1 2 3 4 5 6 7 8 9 10
∆C/∆l
(pF
/mm
)
T (mm)
a = 1 mm
a = 2mm
a = 3mm
a = 4mm
a = 5mm
0
2
4
6
8
10
12
14
1 2 3 4 5 6 7 8 9 10
T (
mm
)
w (mm)
a = 1 mm
a = 2mm
a = 3mm
a = 4mm
a = 5mm
16
Equation 19 indicates the more the dielectric height changes, the more the capacitance
changes. Furthermore, the sensitivity of the electrodes depends on dielectric variation
due to temperature drift. For example, dielectric permittivity of water has significant
changes versus temperature. Figure 3 demonstrates rising sensitivity of coplanar
electrodes with a shorter electrode gap and a longer field penetrate depth. Meanwhile,
Equation 16 and Figure 4 illustrate that field penetrate depth is significantly maximized
mainly by widening electrode width.
To sum up, optimization of the long coplanar electrodes for high sensitivity along z-axis
involves minimizing the electrode gap separation and maximizing the field penetration
depth by widening the electrode width. The condition is to be noticed that the thickness
of dielectric material much more than the field penetration depth.
2.2 Liquid Level Capacitive Sensing
2.2.1 Liquid level coplanar-plate capacitive sensors
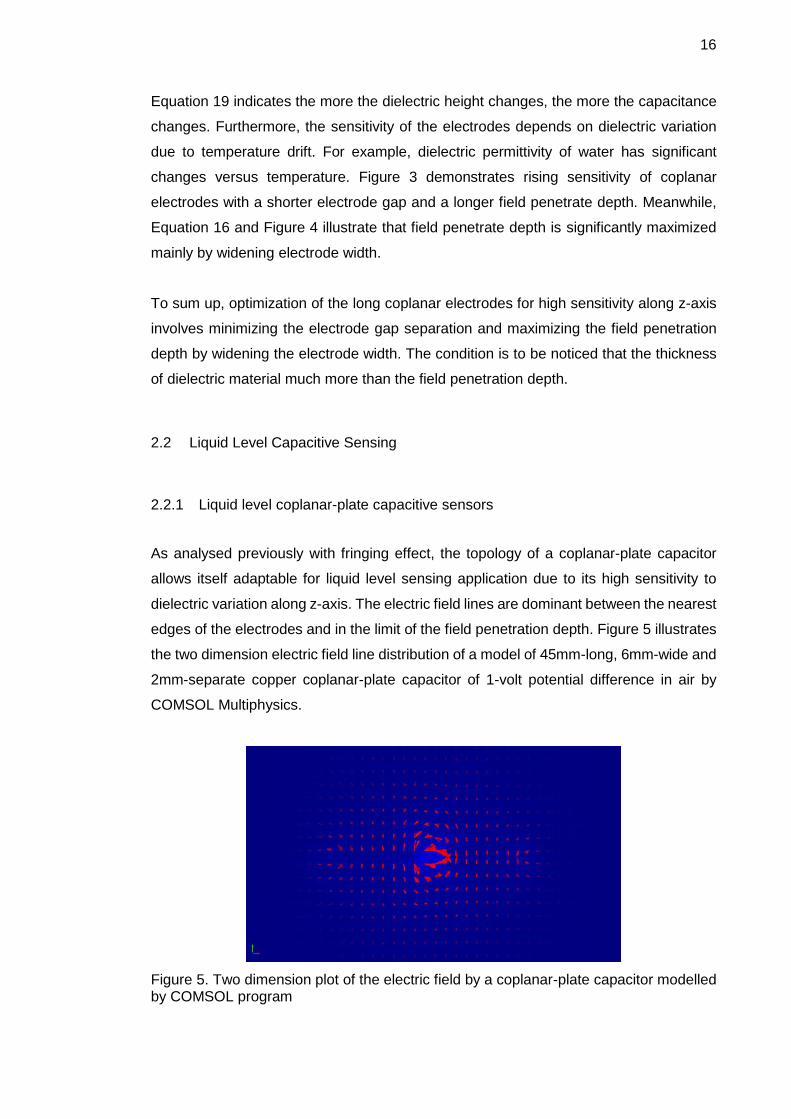
As analysed previously with fringing effect, the topology of a coplanar-plate capacitor
allows itself adaptable for liquid level sensing application due to its high sensitivity to
dielectric variation along z-axis. The electric field lines are dominant between the nearest
edges of the electrodes and in the limit of the field penetration depth. Figure 5 illustrates
the two dimension electric field line distribution of a model of 45mm-long, 6mm-wide and
2mm-separate copper coplanar-plate capacitor of 1-volt potential difference in air by
COMSOL Multiphysics.
Figure 5. Two dimension plot of the electric field by a coplanar-plate capacitor modelled by COMSOL program

17
Here continues constructing a liquid level coplanar-plate capacitive sensor. The coplanar
electrodes is now attached with a dielectric material on one of its sides with dielectric
permittivity r 0 and geometric parameters of the electrodes and of the dielectric
substrate are illustrated in Figure 6.
Figure 6. Coplanar electrodes attached with dielectric substrate on one of its side [5]
The capacitance due to the presence of the dielectric material on one of its side is given
by [5]:
K k 'C l
2K k (20)
where K k and K k ' are complete elliptic integrals of the first kind,
k and k ' are coefficients depending on the geometric parameters of the capacitor:
2k ' 1 k
t
a atanh tanh
4t 4tk ; b 2w a
bw a / 2tanhtanh
4t2t
ak
b
Equation 20 can be simply rewritten as [5]:
C l f a,w, t (21)

18
with f a,w, t independent of the length of the plates or of the dielectric permittivity of
the material.
Figure 7. Multi-dielectric layers of liquid level sensing coplanar-plate capacitor [5]
Figure 7 illustrates the model of a liquid level sensing coplanar-plate capacitor which
comprises multi dielectric layers. The total capacitance can be proved as a sum of four
capacitance components:
air wall liq air2C C C C C (22)
where Cair is the capacitance due to the presence of air outside the container, Cwall is the
capacitance due to the container's wall, Cliq is the capacitance due to the height of the
liquid column inside the container, and Cair2 is the capacitance due to the presence of air
in the upper part of the container. [5.]
Assumed with the infinite thickness of air and liquid, Equation 21 can be specifically
expanded as:
air wall wall liq airC l f (a, w, ) l f (a, w, t ) h f (a, w, ) (l h) f (a, w, ) (23)
The capacitance of liquid level coplanar-plate capacitive sensor can be reduced as a
function of the liquid height h:

19
0 liq airC C h f a, w, C(h) (24)
where 0C C(0) is the capacitance of the capacitive sensor when the container is empty.
[5.]
2.2.2 Differential and Ratiometric Measurement of Liquid Level
Equation 24 implicates the capacitance of the liquid level coplanar-plate capacitive
sensors depends on the dielectric variation due to environment changes (temperature
shifts, humidity changes etc.) and makes a linear relationship with the liquid height.
Therefore, setting up a measurement of the sensor capacitance independent of
environment changes allows an accurate result of liquid level to be detected. Such a
measurement can be implemented by a ratiometric and differential measurement setup
as shown in figure below [1, 5].
Figure 8. Differential and ratiometric measurement setup of liquid level sensing [6, 6]
In this setup, three coplanar-plate capacitive sensors are used (see Figure 8). The
LEVEL electrode provides a capacitance value proportional to the height of the column
of liquid (level). The Reference Environmental (RE) electrode and the Reference Liquid
(RL) electrode are used as references. The RL electrode accounts for the liquid dielectric
constant and its variation, while the RE electrode is used to compensate for any other
environmental variations that are not due to the liquid itself. These sensors are
20
constructed with the electrodes being identical in width, thickness and gap separation
but different in height (hL for the LEVEL electrode height and the same hR for the
reference electrodes). [6, 6.]
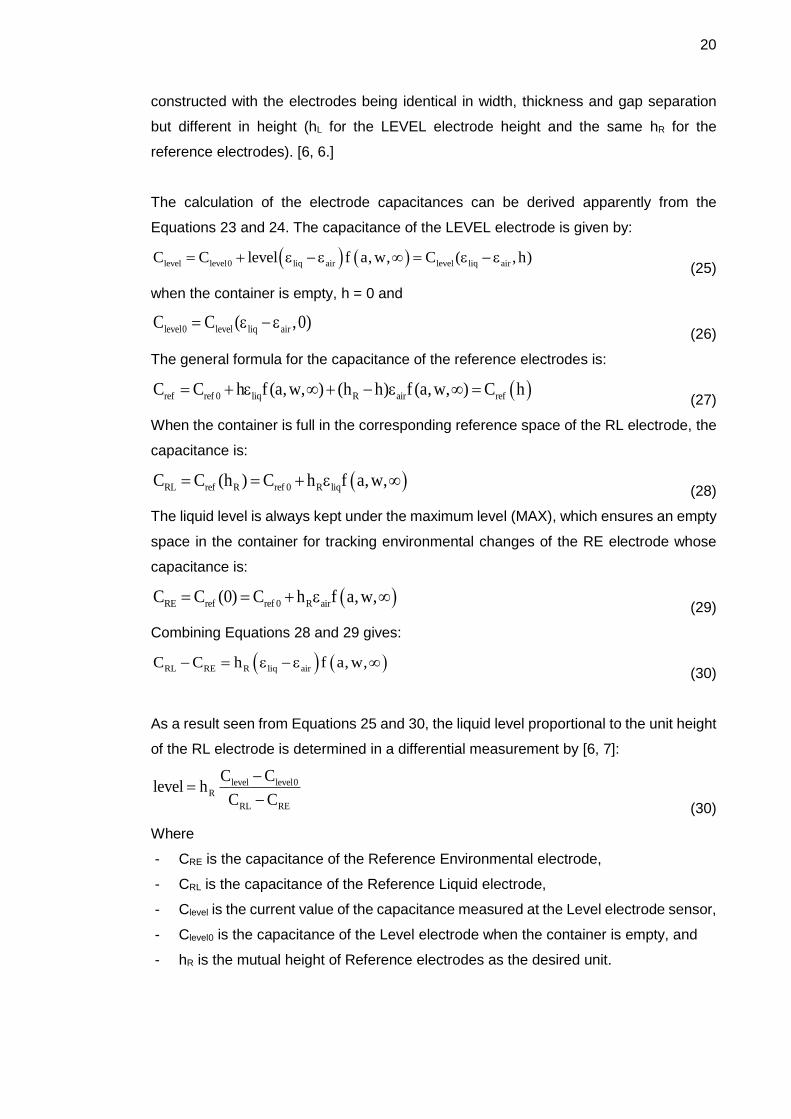
The calculation of the electrode capacitances can be derived apparently from the
Equations 23 and 24. The capacitance of the LEVEL electrode is given by:
level level0 liq air level liq airC C level f a, w, C ( ,h) (25)
when the container is empty, h = 0 and
level0 level liq airC C ( ,0) (26)
The general formula for the capacitance of the reference electrodes is:
ref ref 0 liq R air refC C h f (a,w, ) (h h) f (a,w, ) C h (27)
When the container is full in the corresponding reference space of the RL electrode, the
capacitance is:
RL ref R ref 0 R liqC C (h ) C h f a,w, (28)
The liquid level is always kept under the maximum level (MAX), which ensures an empty
space in the container for tracking environmental changes of the RE electrode whose
capacitance is:
RE ref ref 0 R airC C (0) C h f a,w, (29)
Combining Equations 28 and 29 gives:
RL RE R liq airC C h f a, w, (30)
As a result seen from Equations 25 and 30, the liquid level proportional to the unit height
of the RL electrode is determined in a differential measurement by [6, 7]:
level level0R
RL RE
C Clevel h
C C
(30)
Where
- CRE is the capacitance of the Reference Environmental electrode,
- CRL is the capacitance of the Reference Liquid electrode,
- Clevel is the current value of the capacitance measured at the Level electrode sensor,
- Clevel0 is the capacitance of the Level electrode when the container is empty, and
- hR is the mutual height of Reference electrodes as the desired unit.
21
In a differential measurement, the presence of RE sensor is needed to track variation in
dielectric due to changes in temperature, humidity and pressure on the material [1.5].
However, for relative accuracy of measurements with no concerns of environmental
changes, the RE electrode can be taken out of the system and the liquid level is
calculated as follows:
level level0R
RL RL0
C Clevel h
C C
(31)
where CRL0 is the capacitance of the RL electrode when the container is empty. Liquid
level measurement with absence of RE sensor justifies its ratiometric specification since
the level is mainly approximate to the capacitance proportion between the LEVEL and
RL sensors in the height unit of the RL sensor.
The capacitance of the electrodes can be measured by a CDC. Here used the FDC1004
chip with the ability of configuration up to 4 capacitance measurements specialized for
this application of liquid level in differential mode. The FDC1004 features and theory of
operation will be described in more details of the following sections. The differential
measurement of liquid level with the FDC1004 can be set up using active shielding and
OoP liquid level technique.
2.2.3 Active Shielding
It is also implicated from Equations 19 and 21 that the fringing capacitance of a coplanar-
plate capacitor is changing depends on variation in height (z-axis) and thickness (y-axis)
of the dielectric material to which the capacitor is attached. If both electrodes of the
sensor are shielded properly, it is intended to eliminate the electric field of the sensor
electrodes on the shielded side and then focus sensing direction toward the liquid target.
Additionally, the shield provides a barrier from any interference affecting the
measurements of the sensor capacitance from the backside. [6, 7.]

22
Figure 9. Shielding effect on the electric field of the sensor (ch) and ground (gnd) electrodes [7, 2]
The simplified model without care of fringing effects on the electrode edges in Figure 9
illustrates the effect of a shield behind both sensor electrodes. The shield is driven at the
same voltage potential of the sensor electrode. Any external interference from the
backside coupling to the shield has minimal interaction with the sensor electrode.
Moreover, the electric field between the electrodes (red lines) are blocked on the
shielded side, which reduces and directs the sensing angle to the target. Without the
shield, the sensing angle of the sensor picks up any stray interference within the field-
line vicinity. Depending on the shape and position of the shield relative to the sensor, the
sensing angle can be more focused with a larger and closer shield to the sensor
electrode (see Figure 10). [7, 2.]
Figure 10. Focusing the sensing area of the sensor electrode with a shield [7, 3]

23
When connected to a CDC to measure the sensor capacitance, the parasitic capacitance
due to the external circuity and connection between the sensor electrodes and the CDC
pins is included in the measurement results. The parasitic capacitance in some cases
can be larger than the sensor capacitance itself and significantly affected by
environmental interferences, which results in drifts likely compromising the system
accuracy. For instance, a long sensor-FDC1004 connection path produces a large
parasitic capacitance, which slows down discharging time of the capacitor and may leads
to the phenomenon of residue capacitance included in the measurement results. To
eliminate the parasitic capacitance, active shielding is again a good solution. [8, 10.]
2.2.4 Out-of-Phase Liquid Level Technique
Despite of applying active shielding, the differential measurement of the sensor
capacitances to ground of the conventional liquid level technique has still a considerable
problem with the introduction of human body effect. Figure 11 describes a conventional
electric model of liquid level measurement by FDC1004 and the human body effects as
a ground interference source in the sensing area of the sensors [9, 5].
Figure 11. Conventional liquid level technique by FDC1004 suffering human body effect [9, 5]
As mentioned previously, the symmetry in the topology of the coplanar electrodes keep
an important role in the liquid level sensing application. When applied with a driving
shield, the sensing area is focused to the liquid target and immune to external

24
interferences on the shielded side. However, the presence of human body in the sensing
area destroys the symmetry of the conventional electrical model and seriously affects
the measurement accuracy.
Figure 12. Comparison of conventional and OoP electrical model in liquid level application [9, 6]
The cause of this problem arises from the sensor electrode being excited by a signal
waveform in most CDCs, that means the liquid experiences a varying voltage potential
difference to ground during excitation phases. When the human body occurs as a ground
interference source, an extra parasitic capacitance owing to human body (CH) couples
to the liquid. The value of this parasitic capacitance changes due to the liquid potential
variation. These changes impose deviations in capacitance measurements and
contribute the asymmetry of the conventional electric model. To neutralize the human
body effect, the OoP technique is introduced to replace the conventional approach in the
liquid level application. Figure 12 justifies the liquid potential is kept constant over time
with replacement of the ground (GND) electrode by the OoP sensor (SHLDy) electrode
which is excited in 1800 out of phase with the sensor (CINx) electrode. The liquid potential
remained constant by in-phase and out-of-phase excitation signals on the electrodes is
to fix the human capacitance and preserve the symmetry of the electrical model. [9, 6.]
Figure 13. OoP technique sensor layout for LEVEL and REF sections [9, 7]

25
In OoP liquid level technique, the differential measurement setup with the FDC1004 uses
two active shield electrodes as shown in Figure 13. The sensor electrode and its shield
are driven in-phase with CINx and SHLD1 signal. The OoP sensor electrode and its
shield are excited by the same SHLD2 signal. [9, 7.]
2.3 FDC1004 Capacitance to Digital Conversion
Figure 14. FDC1004 block diagram [8, 10]
The FDC1004 is a dedicated CDC with 4 input chanels (CIN1-4) which can be configured
to measure up to 4 single capacitances in different applications (see Figure 14). Each
input chanel can be selected to chanel CHA or CHB by a multiplexer to be excited in-
phase respectively with SHLD1 or SHLD2. These two shield pins are shorted to each
other in single-ended measurement mode (chanel to ground) when chanel CHB is
disabled and CAPDAC section can be used for capacitance offset of each input chanel.
In differential measurement mode of the FDC1004, CAPDAC is unable and the shield
pins are driven out of phase with each other. It needs to be noticed that the index of the
input chanel selected to chanel CHA must be less than that of which selected to chanel
CHB. The input chanel in CHA or CHB is subsequently forwarded to the CDC section of
the FDC1004 (see Figure 15). [8.]

26
Figure 15. Capacitance to digital conversion theory of FDC1004 [1, 4]
The CDC implements a switched capacitor circuit to transfer charge from the sensor
electrode to the sigma-delta analog to digital converter (ADC). The sensor electrode is
previously charged up by an excitation of a 25 kHz step waveform for a particular duration
of time. The charge on the electrode is then transferred to a sample-hold circuit after
another certain amount of time. The analog voltage is derived out and converted into a
digital signal by the sigma-delta ADC. Once the conversion is completed, the result is
digitally filtered and corrected by gain and offset calibrations. Selecting of input channels,
configuring measurement modes, activating the CDC and Gain-Offset section, and
reading measurement results are executed on I2C interface which allows a master MCU
access the configuration and data registers of the FDC1004 and transfer data between
them. [1, 4.]
2.4 I2C data transfer between MCU and FDC1004
I2C serial communication interface between integrated circuits (ICs) was developed by
the Philips semiconductor division (now NXP). An I2C interface consists of two data
wires, known as serial data (SDA) and serial clock (SCL). They are connected through
pull-up resistors to the power supply voltage (Vcc) and a common voltage reference
(GND) is shared by ICs on the bus (see Figure 16).
27
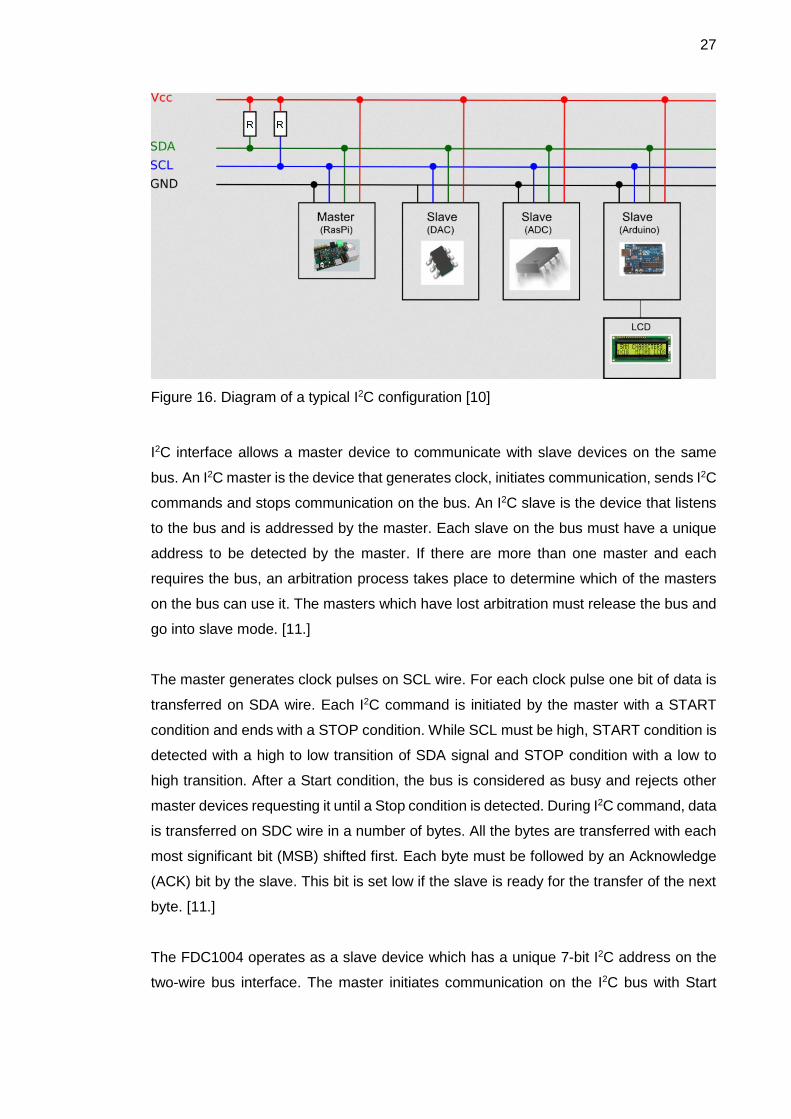
Figure 16. Diagram of a typical I2C configuration [10]
I2C interface allows a master device to communicate with slave devices on the same
bus. An I2C master is the device that generates clock, initiates communication, sends I2C
commands and stops communication on the bus. An I2C slave is the device that listens
to the bus and is addressed by the master. Each slave on the bus must have a unique
address to be detected by the master. If there are more than one master and each
requires the bus, an arbitration process takes place to determine which of the masters
on the bus can use it. The masters which have lost arbitration must release the bus and
go into slave mode. [11.]
The master generates clock pulses on SCL wire. For each clock pulse one bit of data is
transferred on SDA wire. Each I2C command is initiated by the master with a START
condition and ends with a STOP condition. While SCL must be high, START condition is
detected with a high to low transition of SDA signal and STOP condition with a low to
high transition. After a Start condition, the bus is considered as busy and rejects other
master devices requesting it until a Stop condition is detected. During I2C command, data
is transferred on SDC wire in a number of bytes. All the bytes are transferred with each
most significant bit (MSB) shifted first. Each byte must be followed by an Acknowledge
(ACK) bit by the slave. This bit is set low if the slave is ready for the transfer of the next
byte. [11.]
The FDC1004 operates as a slave device which has a unique 7-bit I2C address on the
two-wire bus interface. The master initiates communication on the I2C bus with Start

28
condition, followed by the 7-bit slave address and the data direction (R/W̅) bit. If this bit
is 0 then the master will transmit data to the slave device (write operation). Otherwise, if
the data direction bit is set to 1, the master will receive data from slave device (read
operation). After the slave address and the data direction is sent, the slave is detected
and acknowledges the transfer and then the master can continue with reading or writing
on the bus until a Stop condition is detected. Figure 17 illustrates write frame of data
transfer on the I2C bus between a master and a 7-bit I2C address slave. The slave has a
pointer register. The value of the pointer is the address of a data register of the slave.
After the slave’s first acknowledgement of the transfer in write mode, the master writes
the data register address to the pointer and data bytes are then written into the
corresponding data register. [8, 13-14.]
Figure 17. Write frame on I2C bus [8, 14]
Figure 18. Read frame on I2C bus [8, 14]

29
Figure 18 explains read operation on the I2C bus [8, 14]. To read the data stored in a
data register of the slave, the address of that data register is written to the pointer by in
a write operation. However, the master won’t write the data to the data register and turns
to change the data transfer direction from write mode to read mode by resending the
slave address bit and resetting the data direction bit to 1. After the slave acknowledges
to start read mode, the data from the desired data register of the slave is transferred onto
the bus and received by the master.
3 Methods and Materials
The theoretical analysis in this document bases on literature primarily from online
sources. A model of the coplanar-plate capacitor was simulated by COMSOL
Multiphysics software to illustrate the two dimension electric field by the capacitor model.
This software applies graphical user interface (GUI) with powerful modelling tools for
simulation of different designs in electrical, mechanical, fluid flow, and chemical
applications. Other theoretically analysing graphs were made by Excel Microsoft.
In implementation of designing the sensor for liquid level application, PADS Layout is the
CAD program used to produce the flexible printed circuit (FPC) layout of a sensor port
and a small zip connector board needed for connection between the sensor and the
FDC1004 on a mini test board for a single measurement setup. After the design of the
sensor port had been completed, an order was sent to the printed circuit board (PCB)
manufacturer Prinel for prototyping. CircuitCAM software, milling machine and lab tools
(multimeter, solder iron etc.) were needed for milling the zip connector board, soldering
and electrical testing.

30
Figure 19. Online compiler IDE on ARM mbed developer site.
For programming, the online mbed compiler is an integrated development environment
(IDE) friendly and popularly used on ARM mbed developer site. To set up measurements
for liquid level application with the FDC1004, most MCUs supported with I2C interface
can be used as a master device. The online mbed compiler IDE supports various MCU
hardware platforms to ease prototyping using the target MCU with an official mbed
C/C++ software development kit (SDK). The SDK provides the software platform and
libraries to build a program or an application to be run on the selected MCU platform.
Figure 19 shows the online mbed IDE interface and the mbed built-in library which
provides I2C class reference to build a target application. In available and convenient
conditions of this project, the Nucleo-F103RB platform was selected to build an
application for testing the sensor with the FDC1004. The Nucleo platform is one of
products of the electronics and semiconductor manufacturer STMicroelectronics for
quick prototyping of the target STM-MCUs. Therefore, ST link driver and firmware
needed installation to a personal computer (PC) for compiling the test code into the
STM32 MCU via a universal serial bus (USB). Figure 19 represents the pinout of the
Nucleo-STM32 which will be referred to use serial transmitter and receiver, I2C and digital
pins for the application. Measurement results are read via the same USB serial port on
Tera Term serial terminal which is already installed on the PC. The transmission between
the devices is described in details for the measurement setup in section 6.
31
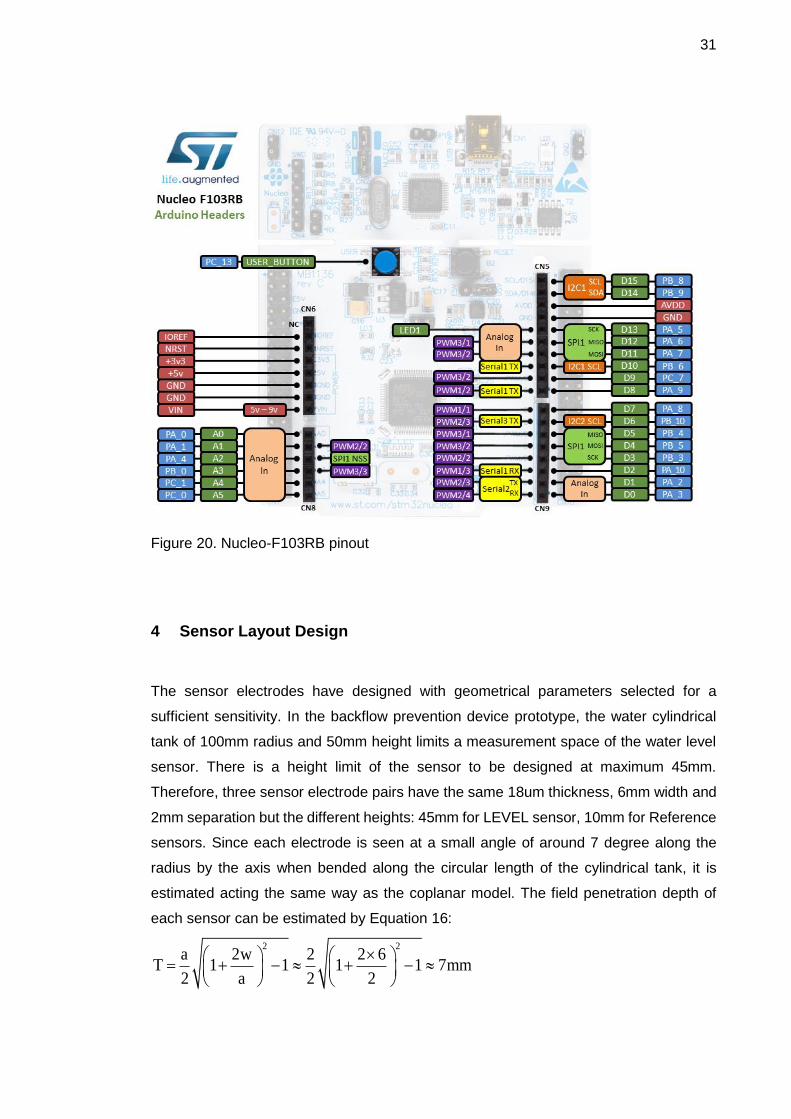
Figure 20. Nucleo-F103RB pinout
4 Sensor Layout Design
The sensor electrodes have designed with geometrical parameters selected for a
sufficient sensitivity. In the backflow prevention device prototype, the water cylindrical
tank of 100mm radius and 50mm height limits a measurement space of the water level
sensor. There is a height limit of the sensor to be designed at maximum 45mm.
Therefore, three sensor electrode pairs have the same 18um thickness, 6mm width and
2mm separation but the different heights: 45mm for LEVEL sensor, 10mm for Reference
sensors. Since each electrode is seen at a small angle of around 7 degree along the
radius by the axis when bended along the circular length of the cylindrical tank, it is
estimated acting the same way as the coplanar model. The field penetration depth of
each sensor can be estimated by Equation 16:
2 2a 2w 2 2 6
T 1 1 1 1 7mm2 a 2 2
32
Thus, water space in the tank should be large enough (about 100mm thickness seen by
the sensor) for the sensor to work according to the model. In the other words, the sensor
capacitance should be proportional to the water level in the tank and OoP liquid level
differential measurement can be applied for water level sensing.
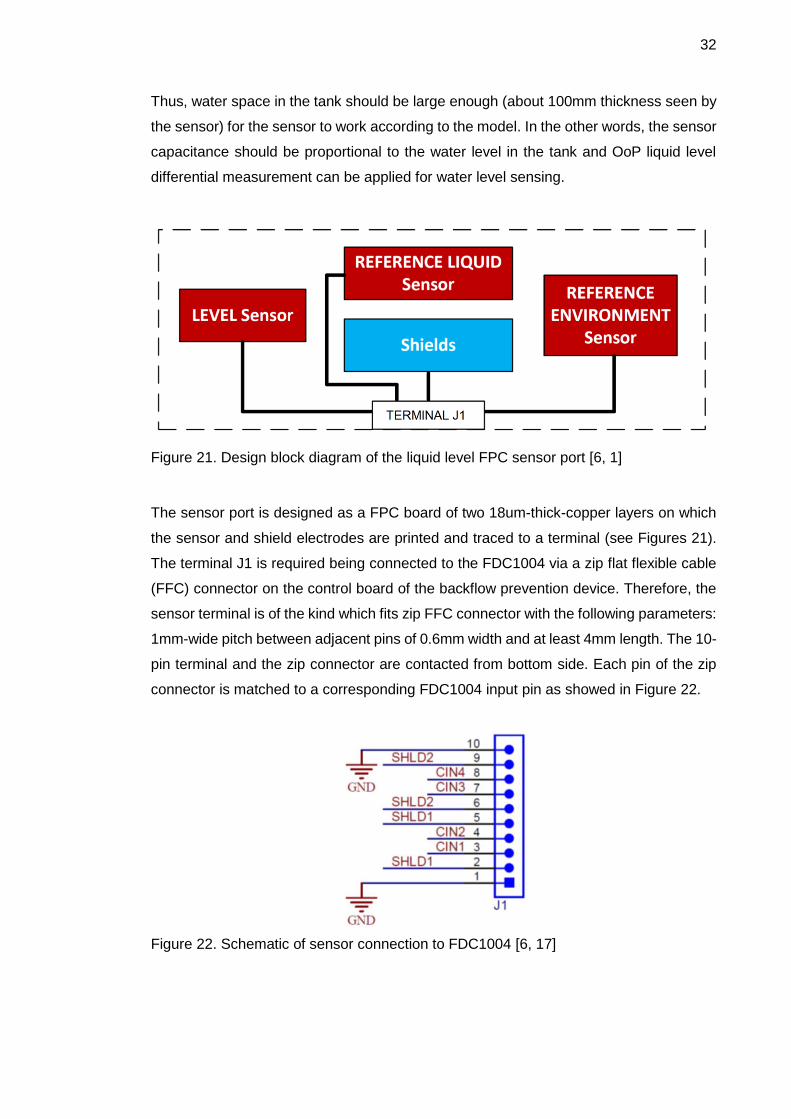
Figure 21. Design block diagram of the liquid level FPC sensor port [6, 1]
The sensor port is designed as a FPC board of two 18um-thick-copper layers on which
the sensor and shield electrodes are printed and traced to a terminal (see Figures 21).
The terminal J1 is required being connected to the FDC1004 via a zip flat flexible cable
(FFC) connector on the control board of the backflow prevention device. Therefore, the
sensor terminal is of the kind which fits zip FFC connector with the following parameters:
1mm-wide pitch between adjacent pins of 0.6mm width and at least 4mm length. The 10-
pin terminal and the zip connector are contacted from bottom side. Each pin of the zip
connector is matched to a corresponding FDC1004 input pin as showed in Figure 22.
Figure 22. Schematic of sensor connection to FDC1004 [6, 17]

33
The LEVEL sensor includes the LEVEL electrode and its paired electrode. The LEVEL
electrode and its shield are connected to CIN1 and SHLD1 pin. The electrode paired with
LEVEL electrode and its shield are connected to the same SHLD2 pin. The RL and RE
sensor have the similar connection to FDC1004 pins as the LEVEL sensor, except the
RL electrode jointed to CIN2 pin and the RE electrode to CIN3 pin. The sensor port has
no connection to CIN4 and GND pins.
Three sensors on the bottom side of a base polyimide layer each include a pair of (bottom
copper) electrodes whose (top copper) shields are on the top side. The thickness of the
FPC and of each layer are estimated as in Figure 23. The terminal region is supported
by a stiffener and all vias between the copper layers are collected at this rigid area beside
terminal pins. The traces between electrodes and terminal pins should be round at
corners for least broken risk thereof.
Figure 23. Stack-up of two layer FPC terminated with zip contact fingers.
Collecting all specifications, the sensor port layout have designed by PADS Layout
program. Figures 24 – 30 show the top view construction of each layer. Arrangement
and positon of electrodes and shields relative to each other must be the way to ensure
the highest symmetry of the system.

34
Figure 24. Composite view
Figure 25. Stiffener layer
Figure 26. Silkscreen top
Figure 27. Top copper layer
35
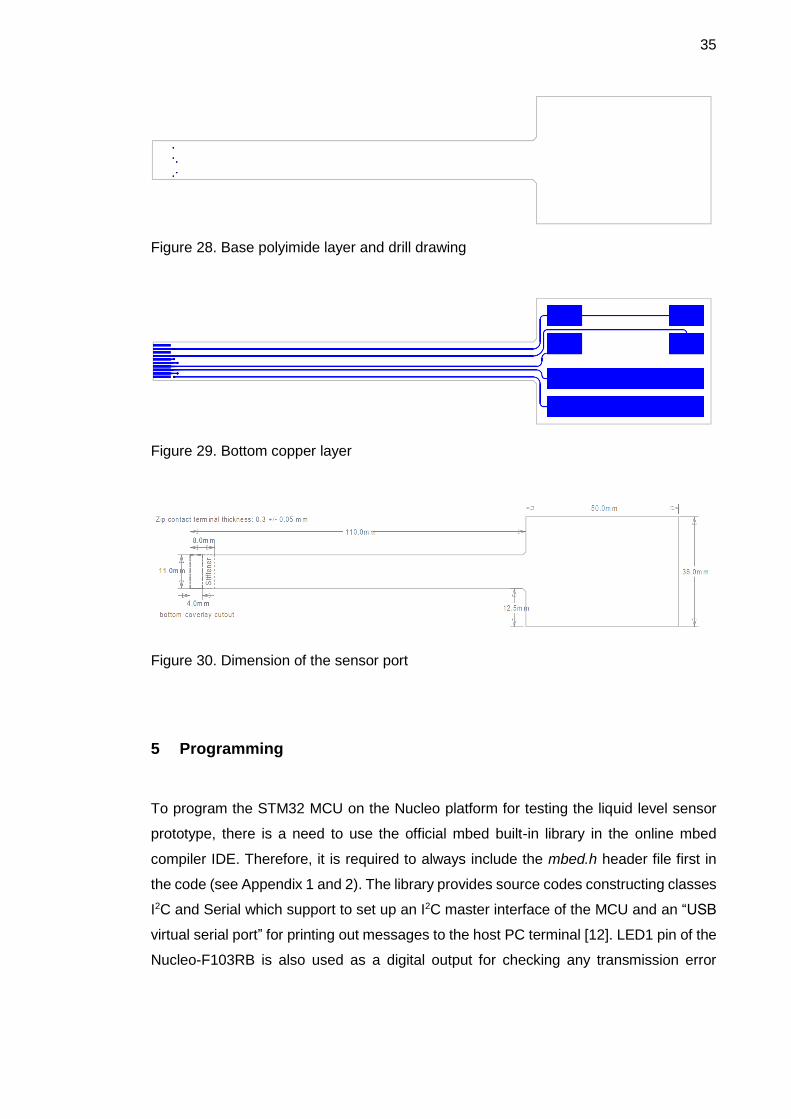
Figure 28. Base polyimide layer and drill drawing
Figure 29. Bottom copper layer
Figure 30. Dimension of the sensor port
5 Programming
To program the STM32 MCU on the Nucleo platform for testing the liquid level sensor
prototype, there is a need to use the official mbed built-in library in the online mbed
compiler IDE. Therefore, it is required to always include the mbed.h header file first in
the code (see Appendix 1 and 2). The library provides source codes constructing classes
I2C and Serial which support to set up an I2C master interface of the MCU and an “USB
virtual serial port” for printing out messages to the host PC terminal [12]. LED1 pin of the
Nucleo-F103RB is also used as a digital output for checking any transmission error
36
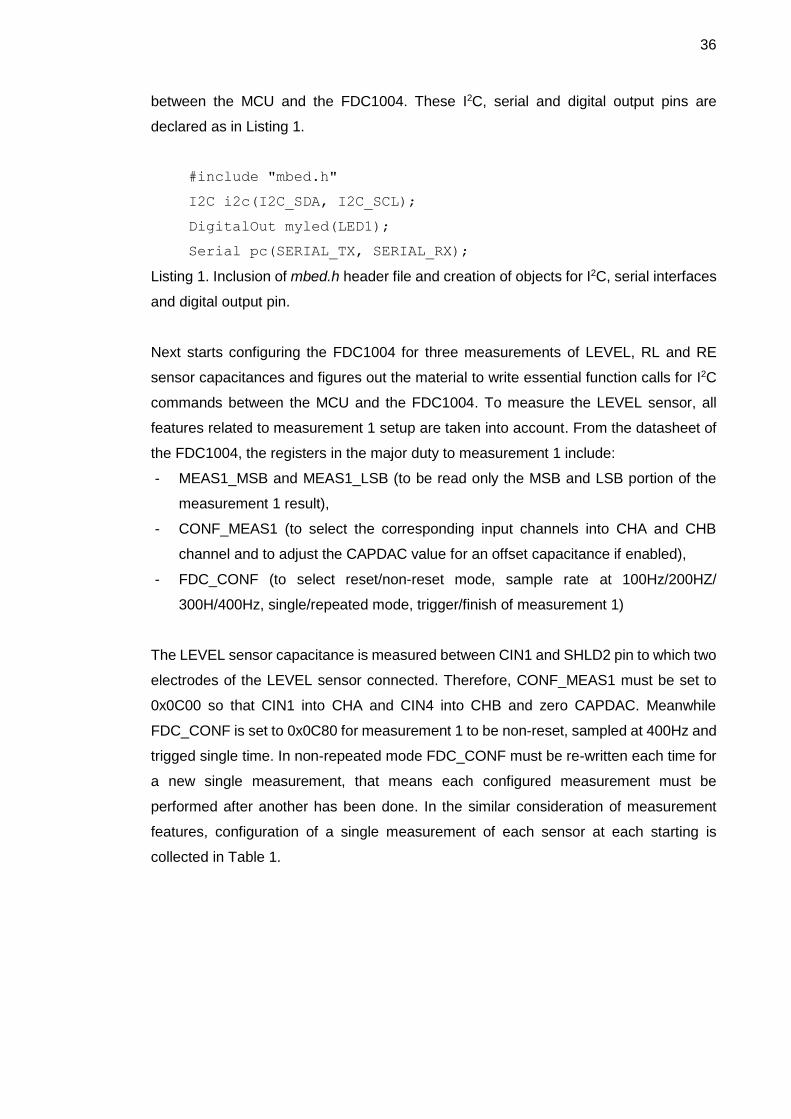
between the MCU and the FDC1004. These I2C, serial and digital output pins are
declared as in Listing 1.
#include "mbed.h"
I2C i2c(I2C_SDA, I2C_SCL);
DigitalOut myled(LED1);
Serial pc(SERIAL_TX, SERIAL_RX);
Listing 1. Inclusion of mbed.h header file and creation of objects for I2C, serial interfaces
and digital output pin.
Next starts configuring the FDC1004 for three measurements of LEVEL, RL and RE
sensor capacitances and figures out the material to write essential function calls for I2C
commands between the MCU and the FDC1004. To measure the LEVEL sensor, all
features related to measurement 1 setup are taken into account. From the datasheet of
the FDC1004, the registers in the major duty to measurement 1 include:
- MEAS1_MSB and MEAS1_LSB (to be read only the MSB and LSB portion of the
measurement 1 result),
- CONF_MEAS1 (to select the corresponding input channels into CHA and CHB
channel and to adjust the CAPDAC value for an offset capacitance if enabled),
- FDC_CONF (to select reset/non-reset mode, sample rate at 100Hz/200HZ/
300H/400Hz, single/repeated mode, trigger/finish of measurement 1)
The LEVEL sensor capacitance is measured between CIN1 and SHLD2 pin to which two
electrodes of the LEVEL sensor connected. Therefore, CONF_MEAS1 must be set to
0x0C00 so that CIN1 into CHA and CIN4 into CHB and zero CAPDAC. Meanwhile
FDC_CONF is set to 0x0C80 for measurement 1 to be non-reset, sampled at 400Hz and
trigged single time. In non-repeated mode FDC_CONF must be re-written each time for
a new single measurement, that means each configured measurement must be
performed after another has been done. In the similar consideration of measurement
features, configuration of a single measurement of each sensor at each starting is
collected in Table 1.
37
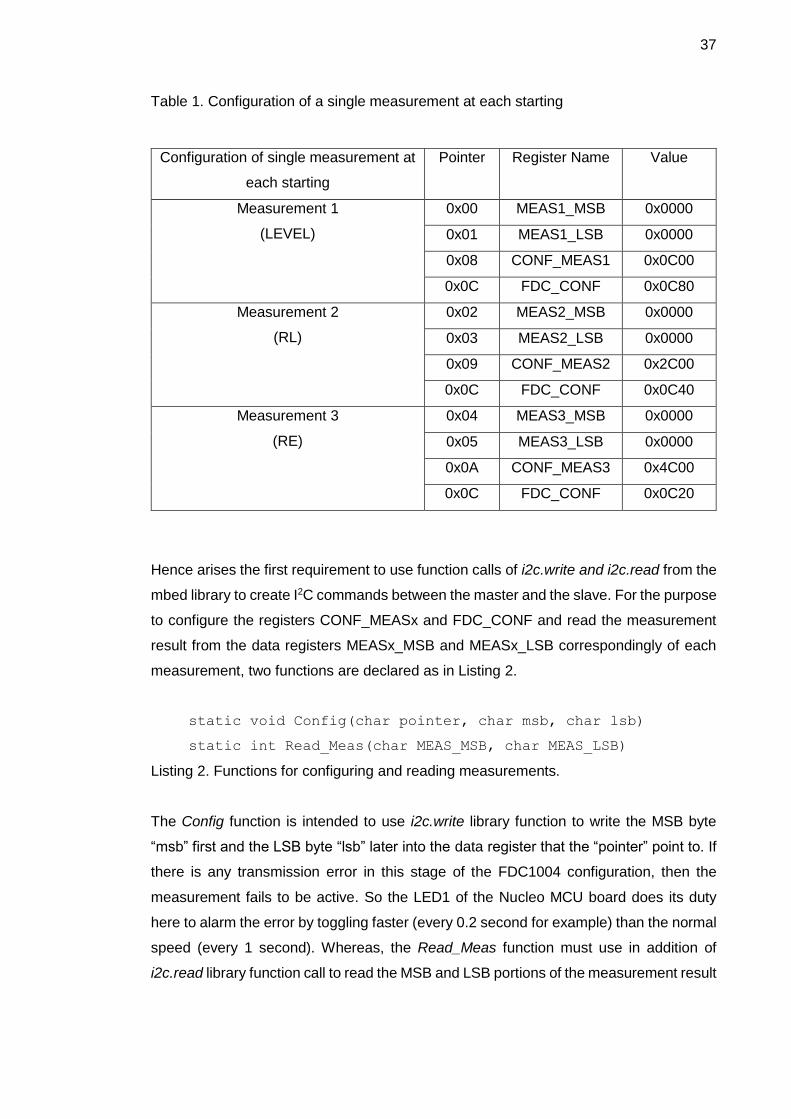
Table 1. Configuration of a single measurement at each starting
Configuration of single measurement at
each starting
Pointer Register Name Value
Measurement 1
(LEVEL)
0x00 MEAS1_MSB 0x0000
0x01 MEAS1_LSB 0x0000
0x08 CONF_MEAS1 0x0C00
0x0C FDC_CONF 0x0C80
Measurement 2
(RL)
0x02 MEAS2_MSB 0x0000
0x03 MEAS2_LSB 0x0000
0x09 CONF_MEAS2 0x2C00
0x0C FDC_CONF 0x0C40
Measurement 3
(RE)
0x04 MEAS3_MSB 0x0000
0x05 MEAS3_LSB 0x0000
0x0A CONF_MEAS3 0x4C00
0x0C FDC_CONF 0x0C20
Hence arises the first requirement to use function calls of i2c.write and i2c.read from the
mbed library to create I2C commands between the master and the slave. For the purpose
to configure the registers CONF_MEASx and FDC_CONF and read the measurement
result from the data registers MEASx_MSB and MEASx_LSB correspondingly of each
measurement, two functions are declared as in Listing 2.
static void Config(char pointer, char msb, char lsb)
static int Read_Meas(char MEAS_MSB, char MEAS_LSB)
Listing 2. Functions for configuring and reading measurements.
The Config function is intended to use i2c.write library function to write the MSB byte
“msb” first and the LSB byte “lsb” later into the data register that the “pointer” point to. If
there is any transmission error in this stage of the FDC1004 configuration, then the
measurement fails to be active. So the LED1 of the Nucleo MCU board does its duty
here to alarm the error by toggling faster (every 0.2 second for example) than the normal
speed (every 1 second). Whereas, the Read_Meas function must use in addition of
i2c.read library function call to read the MSB and LSB portions of the measurement result

38
from the two specified data registers. In the other words, the Read_Meas function is
simply calling twice a function to read each 16-bit register of the slave and combining the
results into a 32-bit memory register of the MCU. It should be noticed that the
measurement result is given by the FDC1004 in a signed 24-bit integer of Two’s
Complement. However, a call of the Read_Meas function is producing otherwise a
signed 32-bit integer of Two’s Complement. Therefore, a translation is needed for the
result of capacitance to be displayed in the end.
The function to read a single register of the FDC1004 can be apparently named as:
static int Read_1_register(char pointer)
in which the “pointer” is the address of the register desired to be read. The average time
for each measurement sample to be done is 1/400Hz = 2.5ms, i.e. about 3ms after a
trigger of measurement 1 FDC_CONF automatically turns to 0x0C81. This can be easily
checked by a pc.printf operation for printing to the PC terminal the return from a call of
the Read_1_register function to read FDC_CONF after a wait(0.003). The pc.printf
operation is also used to display the measurement results on the PC terminal.
Figure 31 refers to write and read function of I2C class in the mbed library [13]. As
required previously, the Config function can be defined with a call of the i2c.write function
with parameters: the 8-bit I2C slave address of the FDC1004; the pointer to a byte-data
array of 3 bytes “pointer”, “msb”, “lsb” to be transmitted; and a stop to end the write
command. If there is a return of non-0 with no acknowledgement by the slave, the LED1
will be toggle every 0.2 second. The FDC1004 has an 8-bit I2C slave address that is
0xA0 including 7-bit slave address bit[7:1] and the data direction bit[0] at 0 as default and
indicating a write mode.

39
Figure 31. Write and read function of I2C class reference in the mbed library
The Read_1_register function can be defined as a combinative I2C command of an I2C
write with no stop and an I2C read with a stop. First the I2C writes the “pointer” after the
8-bit FDC1004 address and no stop. Next a call of the i2c.read function will reset the
data direction bit[0] to 1. Finally, the I2C read 2 data bytes (always MSB byte first) of the
register which the “pointer” points to, transfer the data to the MCU and stop the read
transaction. The Read_Meas function can be simply defined by providing the
corresponding addresses of MEASx_MSB and MEASx_LSB registers to each call of
Read_1_register function reading one of these register. The 24-bit measurement result
translated into a 32-bit sized data.

40
The address, configuration and data registers of the FDC1004 and the Config,
Read_1_register and Read_Meas function can be defined separately in a main.h header
file to be included in the main code. In the main code, a slight control logic and calculation
of capacitances and liquid level has been built with the defined functions. Noticed that
measurements in differential mode of the FDC1004 has no offset capacitance
contribution to the measurement result, the capacitance is calculated as:
19Capacitance pf Two's Complement measurement 23:0 / 2 (32)
Equations 30 and 31 are applied to derive the water level to be measured with or without
the use of the RE sensor as shown in Listing 3.
ratio = (cap1 – level0)/(cap2 – ref0)
level = (cap1 – level0)/(cap2 – cap3)
Listing 3. Calculation of the water level measured with and without the RE sensor
concerned.
6 Measurement and Calibration
6.1 Measurement Setup
Figure 32. Measurement setup of the liquid level system
The measurement system of the liquid level OoP technique includes 4 sections as
described in Figure 32. The devices under test (DUT) are shown in Figure 33. Figure 34-
36 shows the implementation process of the measurement. The PC is connected to the
internet and opened with two programs: the online mbed compiler and Tera Terminal.
The PC communicates with the STM32F103RB microcontroller of Nucleo-F103RB
platform via the ST link USB interface. The test code is compiled to the MCU by the
mbed compiler and the data from the MCU is then received and displayed in Tera Term
window at COM6 serial port. The FDC1004 is separated on a mini test board using two

41
1k8 pull-up resistors between SCL and SDA pins and 3.3V power line from the MCU.
The MCU talks to the FDC1004 about the sensor on the I2C bus. The sensor port pasted
to the outside of a nonconductive bottom is connected to the FDC1004 via a zip
connector on another small separate board as mentioned previously. The measurement
results are read at different heights of the water column in the bottom: zero level with the
bottom empty, 10mm (the same height of the RL sensor), 15mm, 20mm … The level is
measured at maximum 35 mm with or 45mm without the reference of RE sensor.
Figure 33. Devices under test
Figure 34. Tera Term display at COM6 serial port and the test code compiled to the MCU
42
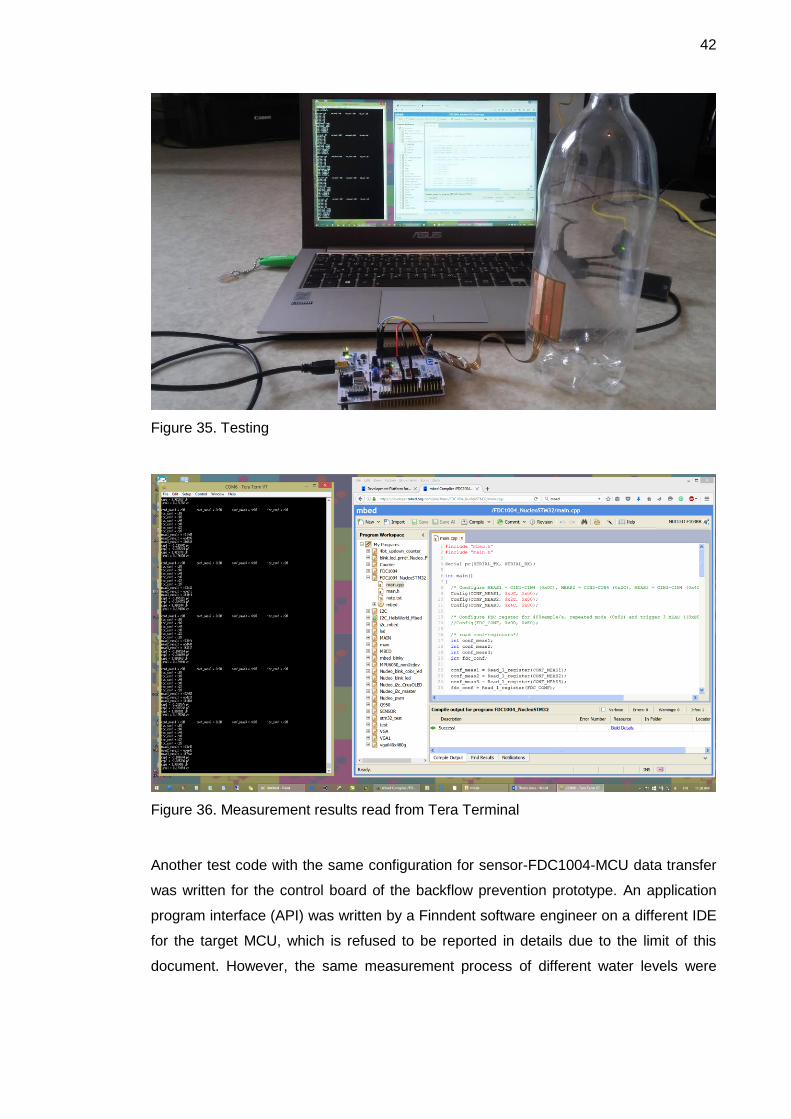
Figure 35. Testing
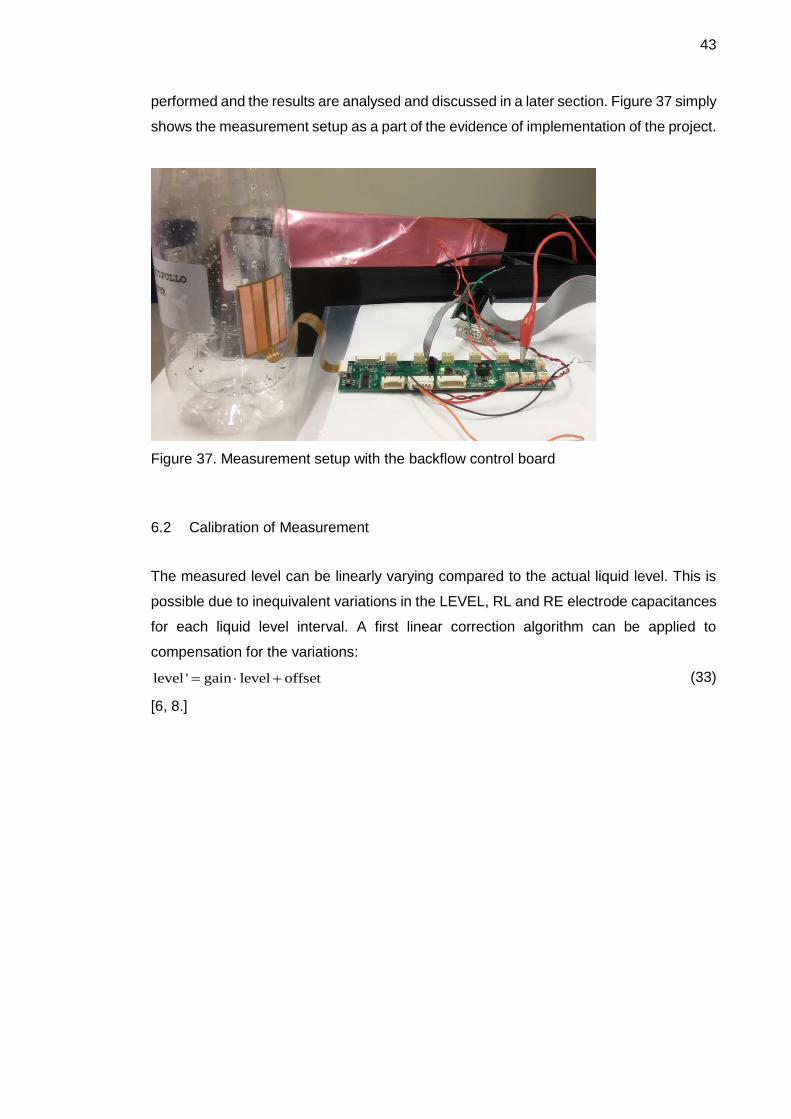
Figure 36. Measurement results read from Tera Terminal
Another test code with the same configuration for sensor-FDC1004-MCU data transfer
was written for the control board of the backflow prevention prototype. An application
program interface (API) was written by a Finndent software engineer on a different IDE
for the target MCU, which is refused to be reported in details due to the limit of this
document. However, the same measurement process of different water levels were
43
performed and the results are analysed and discussed in a later section. Figure 37 simply
shows the measurement setup as a part of the evidence of implementation of the project.
Figure 37. Measurement setup with the backflow control board
6.2 Calibration of Measurement
The measured level can be linearly varying compared to the actual liquid level. This is
possible due to inequivalent variations in the LEVEL, RL and RE electrode capacitances
for each liquid level interval. A first linear correction algorithm can be applied to
compensation for the variations:
level ' gain level offset (33)
[6, 8.]

44
7 Results and Discussion
7.1 Measurement with Nucleo-STM32
Table 2. Measurement result of capacitances with the Nucleo-STM32
Actual
level
Capacitances
(pF)
Value 1 Value 2 Value 3 Value 4 Value 5 Rounded
Value
0 cm
LEVEL -0.920 -0.930 -0.902 -0.930 -0.948 -0.9
RL -2.413 -2.419 -2.392 -2.413 -2.405 -2.4
RE 4.109 4.124 4.115 4.119 4.090 4.1
1 cm LEVEL 0.073 0.107 0.015 0.069 0.078 0.1
RL -2.381 -2.388 -2.385 -2.389 -2.388 -2.4
RE 4.378 4.350 4.400 4.377 4.373 4.4
1.5cm LEVEL 0.303 0.325 0.367 0.338 0.244 0.3
RL -2.358 -2.367 -2.349 -2.367 -2.360 -2.4
RE 4.387 4.423 4.394 4.390 4.386 4.4
2 cm LEVEL 0.636 0.611 0.712 0.662 0.641 0.6
RL -2.360 -2.363 -2.374 -2.378 -2.400 -2.4
RE 4.449 4.459 4.434 4.414 4.365 4.4
2.5cm LEVEL 1.014 1.051 1.064 1.013 1.071 1.1
RL -2.377 -2.363 -2.363 -2.357 -2.337 -2.4
RE 4.483 4.390 4.450 4.541 4.463 4.5
3 cm LEVEL 1.544 1.639 1.623 1.533 1.583 1.5
RL -2.343 -2.373 -2.339 -2.337 -2.366 -2.4
RE 4.505 4.571 4.641 4.514 4.549 4.5
3.5cm LEVEL 2.309 2.224 2.253 2.291 2.275 2.3
RL -2.335 -2.346 -2.356 -2.345 -2.381 -2.3
RE 4.611 4.630 4.595 4.646 4.670 4.6
4cm LEVEL 3.168 3.240 3.242 3.311 3.316 3.2
RL -2.354 -2.337 -2.340 -2.340 -2.340 -2.3
RE 5.568 5.658 5.613 5.678 5.656 5.6
4.5cm LEVEL 4.327 4.394 4.399 4.319 4.342 4.3
RL -2.296 -2.315 -2.305 -2.284 -2.320 -2.3
RE 6.760 6.771 6.754 6.802 6.751 6.8

45
NOTE: level0 = -0.9, ref0 = -2.4
Unfortunately, the capacitance measurement result with the Nucleo-STM32 is seriously
unreliable. Five measured capacitance values of each sensor were read directly from the
Tera Terminal and collected in Table 2. It is still a mystery with negative values of LEVEL
and RL capacitances although the FDC1004 measures a capacitance difference
between two input channels and can produces a negative value thereof. They were
expected to be positive as well as RL and RE capacitances should be approximate to
each other at zero level as the bottom is empty. The only trusty possibility is that the
LEVEL capacitance increases due to the increasing actual level of the water in the
bottom. The RL capacitance nearly remained stable over time but it should have jumped
dramatically according to a jump from 0 to 1cm of the water level. In contrast, the RE
showed a proper behaviour as expected and an impressive rise since the water level
climbed over 3.5 cm height but its value was even higher than the LEVEL’s. It can be
guessed the origin of the problem from the parasitic capacitance of poor connection
between the sensor port and the FDC1004 mini board via the zip connector board. Long
and bad connection path from the sensor to FDC1004 through these PCBs causes
significant parasitic capacitance not eliminated by proper shielding.
Figure 38. Capacitance measurement results with the Nucleo-STM32.
-3-2.5
-2-1.5
-1-0.5
00.5
11.5
22.5
33.5
44.5
55.5
66.5
77.5
0 0.5 1 1.5 2 2.5 3 3.5 4 4.5
Capacitance (
pF
)
Actual level (cm)
Measured capacitances (pF)
LEVEL
RL
RE

46
The suggestion for a solution to the parasitic capacitance is to design the FDC1004 on
the same flex-rigid PCB of the sensor for as minimal connection length as possible.
However, the reaction of the RL sensor in this setup is still in a difficult question to be
answered. Figure 38 indicates the LEVEL showing its rapid change when the water level
reach the lower edge of the RE sensor. There occurs a doubt that SHLD2 electrode
capacitance changing due to the water level affected the LEVEL capacitance
measurement in the vicinity of the RE sensor. It is noticed that shield signal pins are
continuously connected over time. Meanwhile, only one (CINx) sensor electrode is
connected each time in its turn of measurement; otherwise, it is floating. Nevertheless, if
this change is actually linear as can be seen from 3.5cm to 4.5cm then the level can be
calibrated with appropriate gains and offsets for different linear segments. This method
can be applied to better treat the results of capacitance measurement with the backflow
control board where the FDC1004 was designed as close to the sensor as possible.
7.2 Measurement with Backflow Control Board
Table 3. Measurement result of capacitances with the backflow control board
Actual
level
Capacitances
(pF)
1 2 3 4 5 round
0 cm
LEVEL 1.776 1.779 1.774 1.771 1.771 1.8
RL 0.377 0.373 0.372 0.374 0.372 0.4
RE 2.975 2.970 2.971 2.985 2.979 3.0
1 cm LEVEL 2.495 2.493 2.497 2.506 2.497 2.5
RL 1.158 1.168 1.160 1.174 1.168 1.2
RE 3.206 3.202 3.210 3.216 3.202 3.2
ratio 0.943 0.929 0.944 0.938 0.934 0.9
1.5 cm LEVEL 2.720 2.711 2.716 2.726 2.712 2.7
RL 1.182 1.188 1.187 1.185 1.176 1.2
RE 3.211 3.219 3.219 3.223 3.238 3.2
ratio 1.202 1.182 1.190 1.205 1.202 1.2
2 cm LEVEL 3.028 3.040 3.043 3.034 3.013 3.0
RL 1.191 1.200 1.193 1.205 1.192 1.2
RE 3.258 3.259 3.260 3.249 3.260 3.3
ratio 1.577 1.577 1.593 1.557 1.555 1.6

47
2.5cm LEVEL 3.489 3.519 3.509 3.517 3.525 3.5
RL 1.217 1.240 1.229 1.247 1.227 1.2
RE 3.322 3.313 3.313 3.303 3.313 3.3
ratio 2.091 2.071 2.086 2.051 2.110 2.1
3 cm LEVEL 4.072 4.082 4.078 4.097 4.085 4.1
RL 1.277 1.279 1.286 1.280 1.276 1.3
RE 3.367 3.347 3.368 3.359 3.340 3.4
ratio 2.616 2.619 2.594 2.634 2.632 2.6
3.5cm LEVEL 5.047 5.052 5.045 5.032 5.049 5.0
RL 1.305 1.320 1.300 1.298 1.300 1.3
RE 3.552 3.584 3.573 3.564 3.573 3.6
ratio 3.609 3.555 3.627 3.620 3.633 3.6
4 cm LEVEL 6.317 6.304 6.300 6.320 6.323 6.3
RL 1.326 1.315 1.309 1.311 1.317 1.3
RE 4.629 4.619 4.628 4.619 4.650 4.6
ratio 4.898 4.943 4.971 4.984 4.955 4.9
4.5cm LEVEL 7.709 7.718 7.718 7.716 7.700 7.7
RL 1.326 1.315 1.325 1.319 1.315 1.3
RE 6.356 6.374 6.354 6.373 6.368 6.4
ratio 6.413 6.487 6.421 6.456 6.473 6.4
NOTE: level0 = 1.8 and Ref0 = 0.4
Similarly Table 2 collects raw results from measurement setup with the backflow control
board. In the same consideration of the features as mentioned previously, all the three
capacitances have a proper treatment as shown in Figure 39. However, the RE brings
the problem about since it is still at high value instead.

48
Figure 39. Capacitance measurement results with the backflow control board.
If the parasitic capacitance of the sensor connection is assumed the cause, it can be
treated as an offset of 2.6pF to reduce the RE capacitance to approximate the original
value of the water-free RL sensor. In this case, the differential measurement is applied
in the measurement range under 3.5cm of the water level. Figure 40 indicates if corrected
by a gain of 0.75, the estimated level by differential measurement is closer to the
expected value but still suffers a significant error. Therefore, the RE sensor capacitance
is still unknown variable to solve for the level in differential measurement.
The situation turns brighter to the application of the ratiometric measurement of the water
level with no concerns of the RE sensor. Figure 41 depicts the measured level including
two approximate linear sections with different tangents: one before the water level reach
3cm and the upper one. These can be calibrated to be more adjacent to the expected
line, which offers a solution for an acceptable sensing accuracy as if the estimation of
the linearity of the measured level is not violated every time the water full up the RE
sensor space in the tank.
0
0.5
1
1.5
2
2.5
3
3.5
4
4.5
5
5.5
6
6.5
7
7.5
8
8.5
0 0.5 1 1.5 2 2.5 3 3.5 4 4.5
Capacitance (
pF
)
Actual level (cm)
Measured capacitances (pF)
LEVEL
RL
RE

49
Figure 40. Estimation of the level with 2.6pF-offset RE capacitance
Figure 41. Ratiometric level versus actual level without the RE sensor concerned.
00.5
11.5
22.5
33.5
44.5
55.5
66.5
77.5
88.5
99.510
10.511
11.5
0 0.5 1 1.5 2 2.5 3 3.5 4 4.5
Level (
cm
)
Actual level (cm)
Measured level vs Actual level
expected
level
corrected
0
0.5
1
1.5
2
2.5
3
3.5
4
4.5
5
5.5
6
6.5
7
0 0.5 1 1.5 2 2.5 3 3.5 4 4.5
Ratio (
cm
)
Actual level (cm)
Ratiometric level vs Actual level
ratio
expected
50
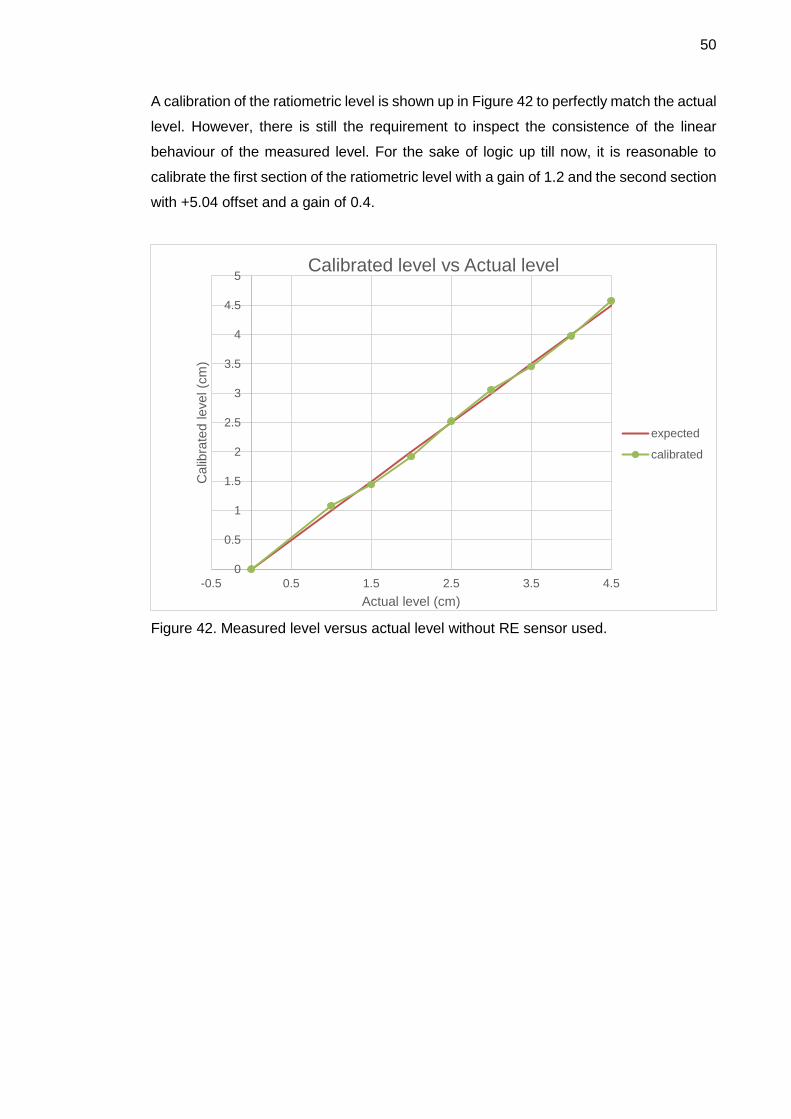
A calibration of the ratiometric level is shown up in Figure 42 to perfectly match the actual
level. However, there is still the requirement to inspect the consistence of the linear
behaviour of the measured level. For the sake of logic up till now, it is reasonable to
calibrate the first section of the ratiometric level with a gain of 1.2 and the second section
with +5.04 offset and a gain of 0.4.
Figure 42. Measured level versus actual level without RE sensor used.
0
0.5
1
1.5
2
2.5
3
3.5
4
4.5
5
-0.5 0.5 1.5 2.5 3.5 4.5
Calib
rate
d level (c
m)
Actual level (cm)
Calibrated level vs Actual level
expected
calibrated
51
8 Conclusion
In time limit of the project, there has left a work load for further development of this
subject. As discussed and suggested to produce the sensor port of a flexible-rigid PCB
whereof the FDC1004 or any other replaceable CDC integrated, the prototype can be
fast tested and well learnt with any MCU platform using the online ARMmbed IDE.
Different capacitance measurement methods can be further studied and applied to the
sensor prototype with open terminal pads designed for testing. That way offers teaching
methods of technologies of electronics designs, sensors and embedded system
programming. This document can be treated as a study reference for a new theoretical
analysis to be extended of active shielding and capacitance to digital conversion. Deep
understanding of CDC inner content can help to justify the proper behaviour of the
measured liquid level by the CDC. As a dedicated and typical application guideline of the
coplanar electrode capacitive sensing, it should be considered fundamental and
beneficial to be referred for various applications using the same technology.
For further improvement and justification of the application of liquid level capacitive
sensing OoP technology, it is supposed to re-design the system of the sensor electrodes
with different trials of geometric parameters. It is believed the better linearity of the
measured level depending on the longer length of the electrode relative to its gap
separation and width. It actually continues proceeding this process in the practice of the
development of the backflow prevention device. For a possible solution, the RE capacitor
can be taken away and the water level system operates with the other capacitors: the
LEVEL only referring the RL. However, this thesis work has come to an ending report
here with fulfilment of numerous knowledge and experience the Electronics Engineering
graduate has gained of capacitive sensors, CDC application, I2C, mbed programming
and FPC design.

52
References
[1] David Wang. FDC1004: Basics of Capacitive Sensing and Applications [online].
Application Report: SNOA927. Dallas, Texas, UAS: Texas Instruments; December
2014.
URL: http://www.ti.com/lit/an/snoa927/snoa927.pdf. Accessed 15 January 2016.
[2] M.F.A.Rahman, A.A.Manaf & M.R.Arshad. Capacitive effect of coplanar electrodes
partially outside the microchannel region for underwater microfluidic-based sensor.
Indian Journal of Geo Marine Sciences [serial online] 2013; 42(8): 987-991.
URL:
http://nopr.niscair.res.in/bitstream/123456789/25469/1/IJMS%2042%288%29%2
0987-991.pdf.
Accessed 30 January 2016.
[3] Alam M. Applications of electromagnetic principles in the design and development
of proximity wireless sensor [Doctoral dissertation]. University of South Carolina –
Columbia; September 2014.
URL:
http://scholarcommons.sc.edu/cgi/viewcontent.cgi?article=3791&context=etd.
Accessed 5 February 2016.
[4] Jian Z. Chen, Anton A. Darhuber, Sandra M. Troian & Sigurd Wagner. Capacitive
sensing of droplets for microfluidic devices based on thermocapillary actuation.
Lab Chip [serial online] 2004; 4: 473–480.
URL: http://www.its.caltech.edu/~stroian/papers/Chen_LabOnAChip_4_04.pdf.
Accessed 10 February 2016.
[5] Abraham Otero, Roemi Fernández, Andrey Apalkov & Manuel Armada. An
Automatic Critical Care Urine Meter. Sensors [serial online] 2012; 12(10): 13109-
13125.
URL: http://www.mdpi.com/1424-8220/12/10/13109/htm.
Accessed 21 February 2016.
[6] David Wang. Capacitive-Based Liquid Level Sensing Sensor Reference Design
[online]. TI Designs: TIDU736A. Dallas, Texas, UAS: Texas Instruments; January
2015.
URL: http://www.ti.com/lit/ug/tidu736a/tidu736a.pdf. Accessed 29 January 2016.
[7] David Wang. Capacitive Sensing: Ins and Outs of Active Shielding [online].
Application Report: SNOA926A. Dallas, Texas, UAS: Texas Instruments; February
2015.

53
URL: http://www.ti.com/lit/an/snoa926a/snoa926a.pdf.
Accessed 5 March 2016.
[8] FDC1004: 4-Channel Capacitance-to-Digital Converter for Capacitive Sensing
Solutions [online]. Technical Documents: SNOSCY5B. Dallas, Texas, UAS: Texas
Instruments; August 2014.
URL: http://www.ti.com/lit/ds/snoscy5b/snoscy5b.pdf. Accessed 15 March 2016.
[9] David Wang. Capacitive Sensing: Out-of-Phase Liquid Level Technique [online].
Application Report: SNOA925. Dallas, Texas, UAS: Texas Instruments; January
2015.
URL: http://www.ti.com/lit/an/snoa925/snoa925.pdf. Accessed 29 January 2016.
[10] I2C and SPI [online]. Quick2Wire. Web.
URL: http://quick2wire.com/articles/i2c-and-spi. Accessed 1 May 2016.
[11] I2C Bus Specification [online]. I2C Info. Web.
URL: http://i2c.info/i2c-bus-specification. Accessed 1 May 2016.
[12] SerialPC [online]. ARMmbed. Web.
URL: https://developer.mbed.org/handbook/SerialPC. Accessed 7 May 2016.
[13] I2C [online]. ARMmbed. Web.
URL: https://developer.mbed.org/handbook/I2C. Accessed 13 May 2016.

Appendix 1
1 (4)
Main code file /*
main.cpp by Thao Nguyen 10.5.2016
testing the liquid level FDC1004 capacitive sensor on Nucleo-
STM32 platform
*/
#include "mbed.h"
#include "main.h"
int main()
{
/* Configure MEAS1 = CIN1-CIN4 (0x0C), MEAS2 = CIN2-CIN4
(0x2C), MEAS3 = CIN3-CIN4 (0x4C) with CAPDAC disable (0x00) */
Config(CONF_MEAS1, 0x0C, 0x00);
Config(CONF_MEAS2, 0x2C, 0x00);
Config(CONF_MEAS3, 0x4C, 0x00);
/* Configure FDC regster for 400sample/s, repeated mode (0x0D)
and trigger 3 MEAS ((0xE0)*/
//Config(FDC_CONF, 0x0D, 0xE0);
/* read conf-registers*/
int conf_meas1;
int conf_meas2;
int conf_meas3;
int fdc_conf;
conf_meas1 = Read_1_register(CONF_MEAS1);
conf_meas2 = Read_1_register(CONF_MEAS2);
conf_meas3 = Read_1_register(CONF_MEAS3);
fdc_conf = Read_1_register(FDC_CONF);
/* infinite loop for continuous meassurements */
while (1)
{
/* set up meas1------------------------------------------*/

Appendix 1
2 (4)
/* print conf-registers reading on PC screen */
pc.printf("\nconf_meas1 = %x\t", conf_meas1);
pc.printf("conf_meas2 = %x\t", conf_meas2);
pc.printf("conf_meas3 = %x\t", conf_meas3);
pc.printf("fdc_conf = %x\r\n", fdc_conf);
/* Configure FDC regster for 400sample/s, single mode (0x0C)
and trigger MEAS1 ((0x80) */
Config(FDC_CONF, 0x0C, 0x80);
/* wait 10ms for meas1 complete */
wait(0.003);
/* check fdc-conf register if bit [3] for meas1 done is set
to 1 */
fdc_conf = Read_1_register(FDC_CONF);
pc.printf("fdc_conf = %x\r\n", fdc_conf);
/* read meas1 reasult */
int meas1_result = 0;
meas1_result = Read_Meas(MEAS1_MSB, MEAS1_LSB);
/* check fdc_conf register if bit [3] is set to 0 */
fdc_conf = Read_1_register(FDC_CONF);
pc.printf("fdc_conf = %x\r\n", fdc_conf);
/* set up the same for meas2 and meas3-------------------*/
/* Configure FDC regster for 400sample/s, single mode (0x0C)
and trigger MEAS2 ((0x40)*/
Config(FDC_CONF, 0x0C, 0x40);
wait(0.003);

Appendix 1
3 (4)
fdc_conf = Read_1_register(FDC_CONF);
pc.printf("fdc_conf = %x\r\n", fdc_conf);
int meas2_result = 0;
meas2_result = Read_Meas(MEAS2_MSB, MEAS2_LSB);
fdc_conf = Read_1_register(FDC_CONF);
pc.printf("fdc_conf = %x\r\n", fdc_conf);
/* Configure FDC regster for 400sample/s, single mode (0x0C)
and trigger MEAS3 ((0x20)*/
Config(FDC_CONF, 0x0C, 0x20);
wait(0.003);
fdc_conf = Read_1_register(FDC_CONF);
pc.printf("fdc_conf = %x\r\n", fdc_conf);
int meas3_result = 0;
meas3_result = Read_Meas(MEAS3_MSB, MEAS3_LSB);
fdc_conf = Read_1_register(FDC_CONF);
pc.printf("fdc_conf = %x\r\n", fdc_conf);
/* display the results-----------------------------------*/
/* calculate sensor capacitances */
float cap1;
float cap2;
float cap3;
cap1 = ((float)(meas1_result)/0x80000);
cap2 = (float)(meas2_result)/0x80000;
cap3 = ((float)(meas3_result)/0x80000);
if(cap1 >= 16){cap1 = cap1 - 32;}
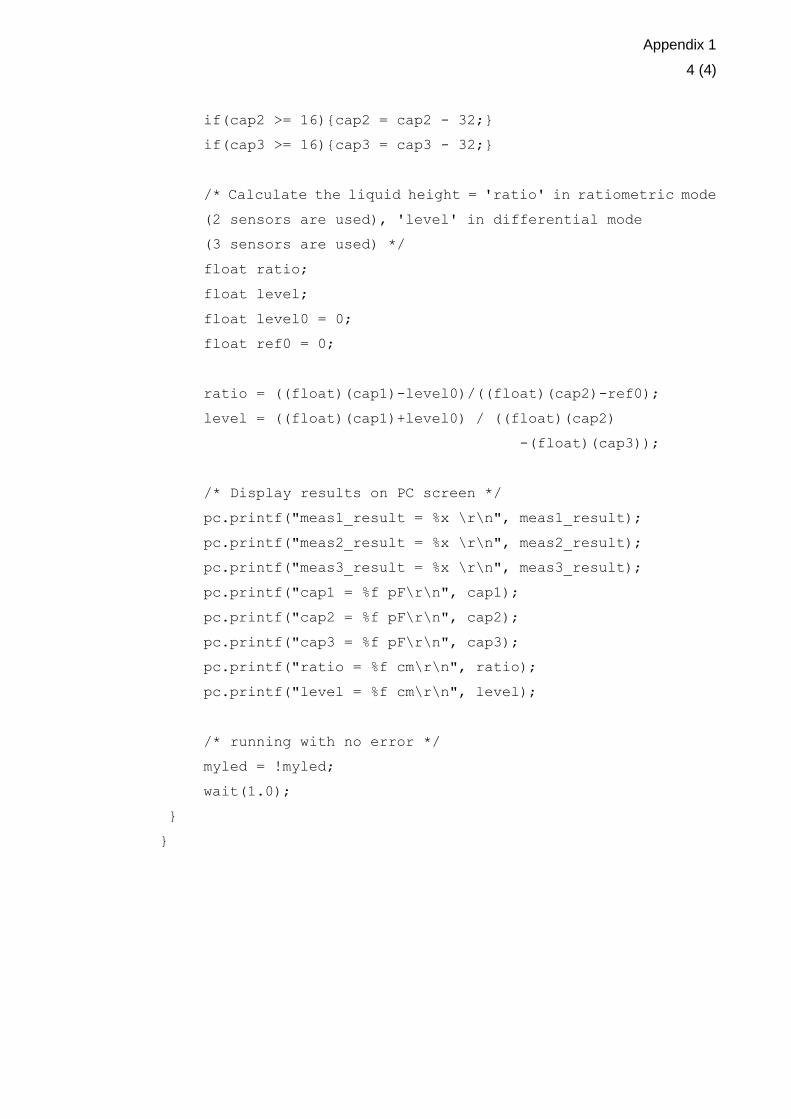
Appendix 1
4 (4)
if(cap2 >= 16){cap2 = cap2 - 32;}
if(cap3 >= 16){cap3 = cap3 - 32;}
/* Calculate the liquid height = 'ratio' in ratiometric mode
(2 sensors are used), 'level' in differential mode
(3 sensors are used) */
float ratio;
float level;
float level0 = 0;
float ref0 = 0;
ratio = ((float)(cap1)-level0)/((float)(cap2)-ref0);
level = ((float)(cap1)+level0) / ((float)(cap2)
-(float)(cap3));
/* Display results on PC screen */
pc.printf("meas1_result = %x \r\n", meas1_result);
pc.printf("meas2_result = %x \r\n", meas2_result);
pc.printf("meas3_result = %x \r\n", meas3_result);
pc.printf("cap1 = %f pF\r\n", cap1);
pc.printf("cap2 = %f pF\r\n", cap2);
pc.printf("cap3 = %f pF\r\n", cap3);
pc.printf("ratio = %f cm\r\n", ratio);
pc.printf("level = %f cm\r\n", level);
/* running with no error */
myled = !myled;
wait(1.0);
}
}

Appendix 3
1 (2)
Main header file
/*
main.h by Thao Nguyen 10.5.2016
testing the liquid level FDC1004 capacitive sensor on Nucleo-
STM32 platform
*/
#define FDC1004_ADDRESS 0xA0
#define MEAS1_MSB 0x00
#define MEAS1_LSB 0x01
#define MEAS2_MSB 0x02
#define MEAS2_LSB 0x03
#define MEAS3_MSB 0x04
#define MEAS3_LSB 0x05
#define CONF_MEAS1 0x08
#define CONF_MEAS2 0x09
#define CONF_MEAS3 0x0A
#define FDC_CONF 0x0C
I2C i2c(I2C_SDA, I2C_SCL);
DigitalOut myled(LED1);
Serial pc(SERIAL_TX, SERIAL_RX);
static void Config(char pointer, char msb, char lsb)
{
char Meas_conf[3] = {pointer, msb, lsb};
int status = i2c.write(FDC1004_ADDRESS, Meas_conf, 3, 0);

Appendix 3
2 (2)
if (status != 0) { // Error
while (1) {
myled = !myled;
wait(0.2);
}
}
};
static int Read_1_register(char pointer)
{
char address[1];
address[0] = pointer;
char value[2];
i2c.write(FDC1004_ADDRESS, address, 1, 1); // no stop
i2c.read(FDC1004_ADDRESS, value, 2, 0);
int result = (int)((int)value[0] << 8) | value[1];
return result;
};
static int Read_Meas(char MEAS_MSB, char MEAS_LSB)
{
int msb = 0;
int lsb = 0;
int result = 0;
msb = Read_1_register(MEAS_MSB);
lsb = Read_1_register(MEAS_LSB);
result = ((msb << 8) | (lsb >> 8));
return result;
}


