15
SCE003 Path Enhancements Capacity and Performance Testing Report Version 1.1 24/07/2014
SCE003 Path Enhancements
Capacity and Performance Testing Report
Version 1.124/07/2014
SCE003 Path EnhancementsCapacity and Performance Testing Report Version 1.1 24/07/2014
Contents1 Summary...................................................................................4
2 Methodology..............................................................................52.1 Objectives....................................................................................................52.2 Assumptions.................................................................................................52.3 Scenarios.....................................................................................................52.4 Pass criteria.................................................................................................5
3 Results......................................................................................63.1 Tests............................................................................................................6
4 Conclusions and recommendations............................................14
Page 2 of 14
SCE003 Path EnhancementsCapacity and Performance Testing Report Version 1.1 24/07/2014
Document managementRole Unit Name
Technical Architect Development Technology Mark DobbingOther contributors Development Technology Riky Harris
Version controlDate Version Author Sections Amendments
22/07/2014 1.0 AMD All Initial draft.24/07/2014 1.1 AMD All Minor changes to text.
Page 3 of 14
SCE003 Path EnhancementsCapacity and Performance Testing Report Version 1.1 24/07/2014
1 SummaryAs part of the Path Enhancements project (SCE003) some performance based load testing was performed on a single site (lamp-web-kb1t) of the Path system.
The desired performance of the service is to be able to handle up to 2 page views per second and response times for 90% of requests are 3 seconds or less. During the testing it was seen that at 4 page views per second, 90% of pages were returned in under 3 seconds. The monitored performance of the app tier during this time was deemed to be within expected limits.
Any errors were decided to be a fail of the load test. No errors were encountered even when load was increased to 8 page views per second, although at this load, 90% response times increased to 5.5 seconds.
Memory usage of the monitored app tier was not significantly changed by going from idle to 8 page views per second.
Page 4 of 14
SCE003 Path EnhancementsCapacity and Performance Testing Report Version 1.1 24/07/2014
2 Methodology
2.1 Objectives
The objectives of the load testing were to examine the performance of the system at one site under a variety of page views per second. The lower value was one page view every two seconds and the higher end was 8 page views per second.
2.2 Assumptions
During this load test we are only using one site, KB. During real world usage the second site will be available through the load balancer and so theoretically there could be up to a further 100% available. This value would depend on the applications though and would need to be tested to confirm.
2.3 Scenarios
There is only one scenario, as we use the term, with 4 tests. Each test is a variation on the same scenario.
Scenario Description
Scenario 1 0.5 - 8 page views per second
2.4 Pass criteria
The pass criteria for this scenario is shown below.
Scenario Pass criteria
Scenario 1 90% page returns < 3 seconds
Page 5 of 14
SCE003 Path EnhancementsCapacity and Performance Testing Report Version 1.1 24/07/2014
3 Results
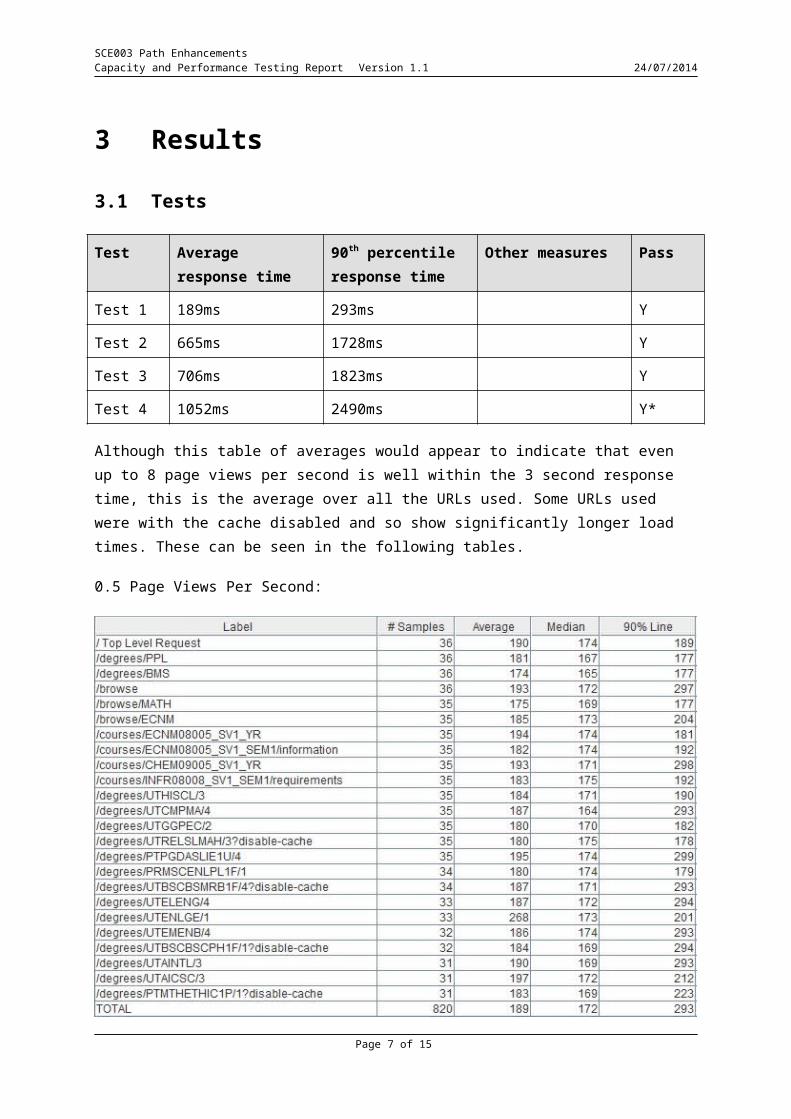
3.1 Tests
Test Average response time
90th percentile response time
Other measures Pass
Test 1 189ms 293ms YTest 2 665ms 1728ms YTest 3 706ms 1823ms YTest 4 1052ms 2490ms Y*
Although this table of averages would appear to indicate that even up to 8 page views per second is well within the 3 second response time, this is the average over all the URLs used. Some URLs used were with the cache disabled and so show significantly longer load times. These can be seen in the following tables.
0.5 Page Views Per Second:
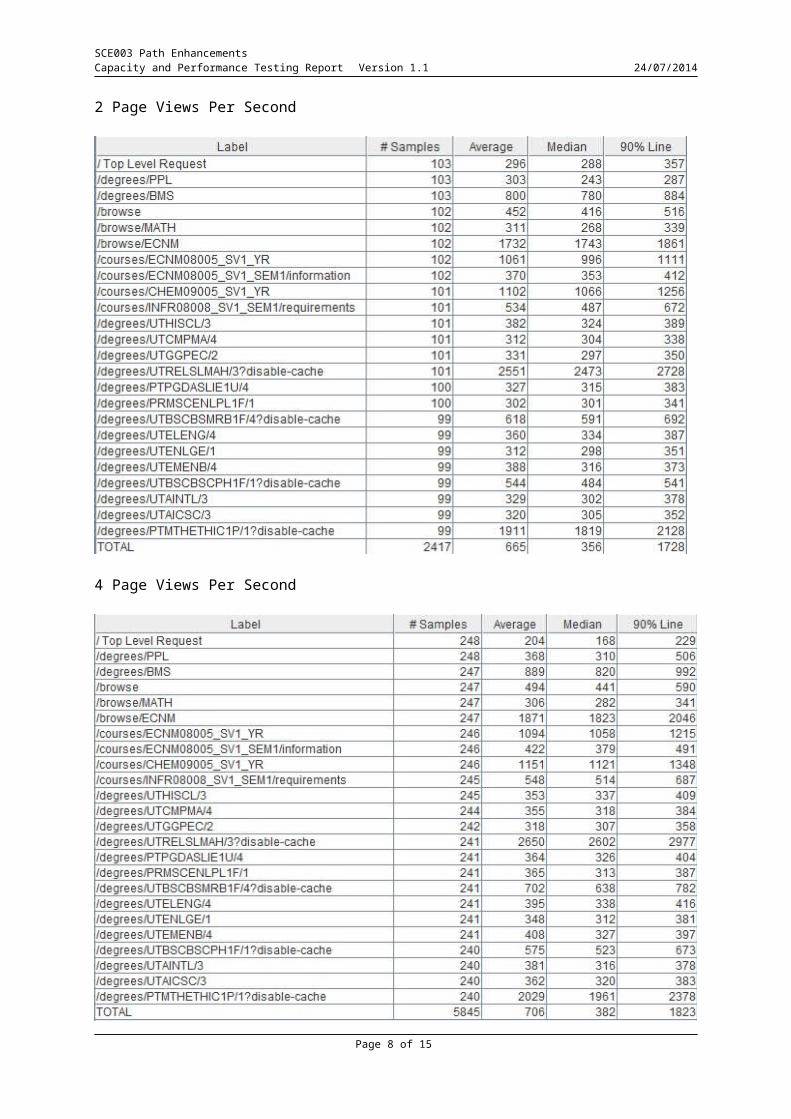
2 Page Views Per Second
Page 6 of 14
SCE003 Path EnhancementsCapacity and Performance Testing Report Version 1.1 24/07/2014
4 Page Views Per Second
8 Page Views Per Second
Page 7 of 14
SCE003 Path EnhancementsCapacity and Performance Testing Report Version 1.1 24/07/2014
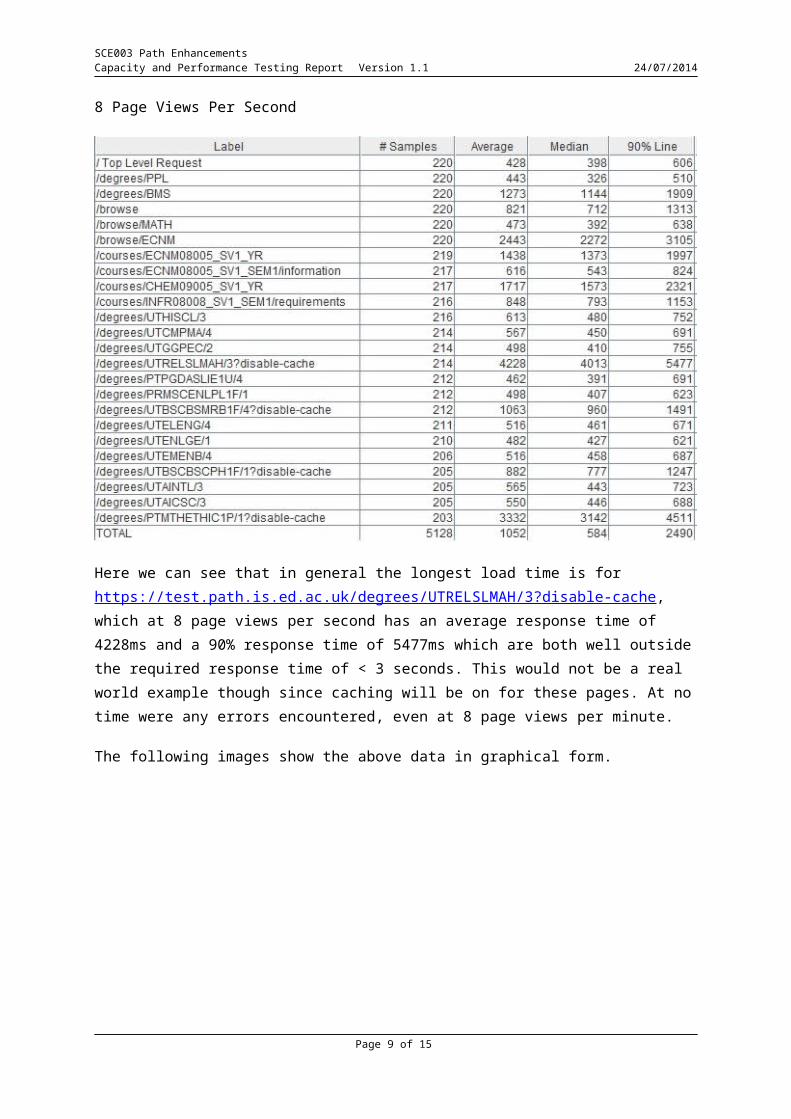
Here we can see that in general the longest load time is for https://test.path.is.ed.ac.uk/degrees/UTRELSLMAH/3?disable-cache, which at 8 page views per second has an average response time of 4228ms and a 90% response time of 5477ms which are both well outside the required response time of < 3 seconds. This would not be a real world example though since caching will be on for these pages. At no time were any errors encountered, even at 8 page views per minute.
The following images show the above data in graphical form.
Page 8 of 14
SCE003 Path EnhancementsCapacity and Performance Testing Report Version 1.1 24/07/2014
0.5 Page Views Per Second
Response times in ms.
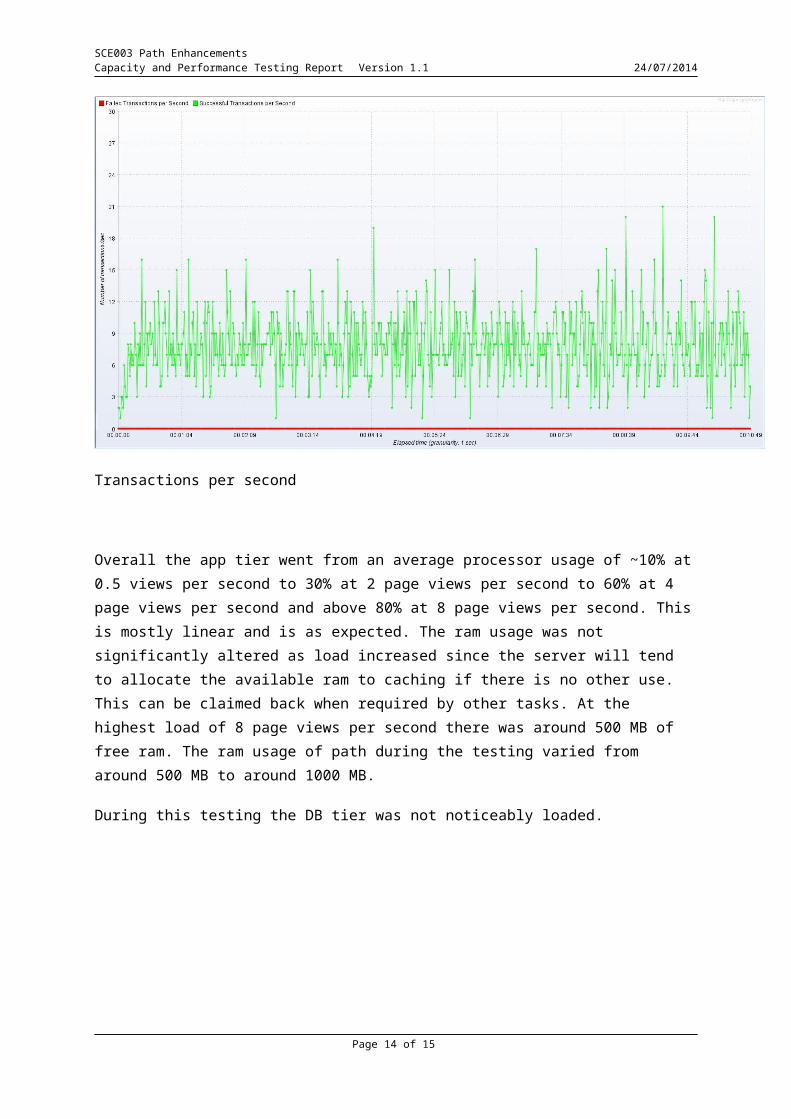
Transactions per second
Page 9 of 14

SCE003 Path EnhancementsCapacity and Performance Testing Report Version 1.1 24/07/2014
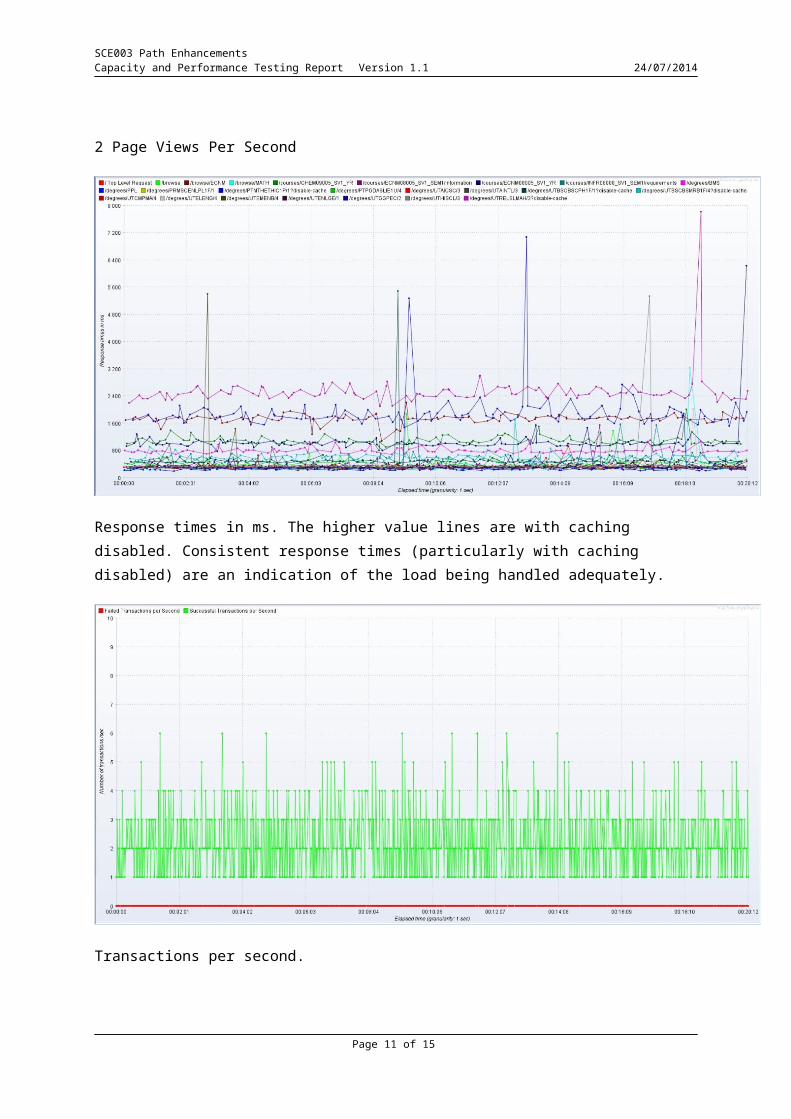
2 Page Views Per Second
Response times in ms. The higher value lines are with caching disabled. Consistent response times (particularly with caching disabled) are an indication of the load being handled adequately.
Transactions per second.
Page 10 of 14
SCE003 Path EnhancementsCapacity and Performance Testing Report Version 1.1 24/07/2014
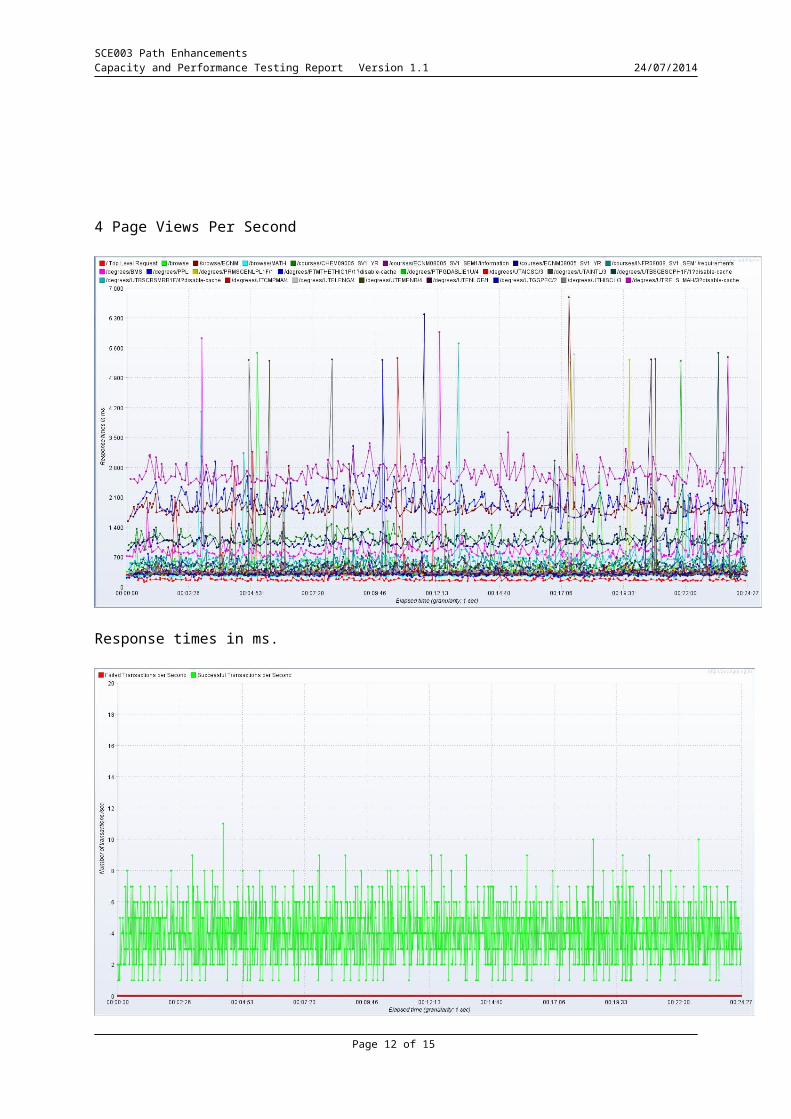
4 Page Views Per Second
Response times in ms.
Transactions per second.
Page 11 of 14
SCE003 Path EnhancementsCapacity and Performance Testing Report Version 1.1 24/07/2014
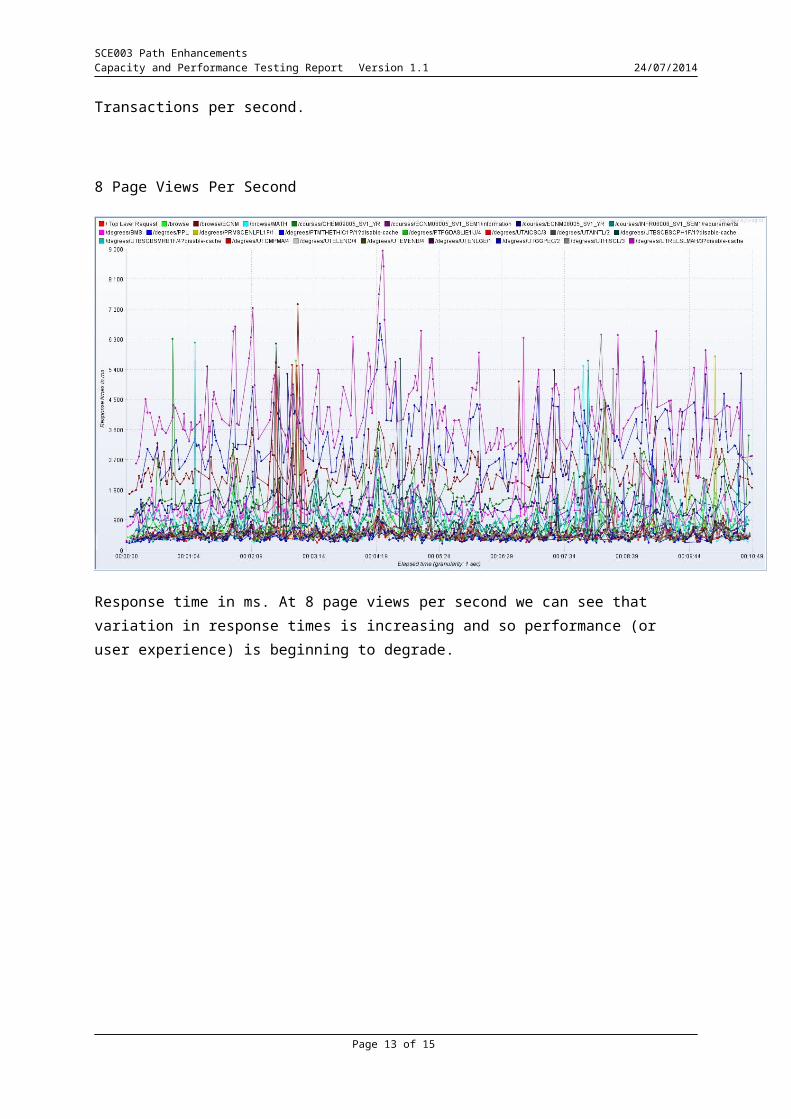
8 Page Views Per Second
Response time in ms. At 8 page views per second we can see that variation in response times is increasing and so performance (or user experience) is beginning to degrade.
Transactions per second
Page 12 of 14
SCE003 Path EnhancementsCapacity and Performance Testing Report Version 1.1 24/07/2014
Overall the app tier went from an average processor usage of ~10% at 0.5 views per second to 30% at 2 page views per second to 60% at 4 page views per second and above 80% at 8 page views per second. This is mostly linear and is as expected. The ram usage was not significantly altered as load increased since the server will tend to allocate the available ram to caching if there is no other use. This can be claimed back when required by other tasks. At the highest load of 8 page views per second there was around 500 MB of free ram. The ram usage of path during the testing varied from around 500 MB to around 1000 MB.
During this testing the DB tier was not noticeably loaded.
Page 13 of 14
SCE003 Path EnhancementsCapacity and Performance Testing Report Version 1.1 24/07/2014
4 Conclusions and recommendationsThe conclusions of the load testing are that the system has passed the set criteria.
There is the possibility of further headroom using the load balancer and two sites. The amount of this headroom would need to be tested to be known.
As the current tests were passed without issue there are currently no recommendations that we feel at required.
Page 14 of 14


