CAPACITY AS A FUNDAMENTAL OBJECTIVE Definition and Measurement in the AmeriCorps*VISTA – Habitat for Humanity International Affiliate Partnerships Ginger L. Elliott National & Community Service Fellow November, 2002 National & Community Service Fellowship Program Corporation for National & Community Service Ginger L. Elliott 2002
Transcript
CAPACITY AS A FUNDAMENTAL OBJECTIVE Definition and Measurement in the AmeriCorps*VISTA – Habitat for HumanityInternational Affiliate Partnerships
Ginger L. Elliott National & Community Service Fellow
November, 2002
National & Community Service Fellowship Program Corporation for National & Community Service
Ginger L. Elliott 2002
i Capacity as a Fundamental Objective
About the Corporation for National & Community Service
Created in 1993, the Corporation for National & Community Service engages more than 1.5 million Americans annually in improving communities through service. The Corporation supports service at national, state, and local levels through:
° AmeriCorps, whose members serve with local and national organizations to meet community needs while earning education awards to help finance college or training;
° Learn and Serve America, which helps link community service and learning objectives for youth from kindergarten through college as well as youth in community-based organizations; and
° The National Senior Service Corps (Senior Corps), the network of programs that helps Americans age 55 and older use their skills and experience in service opportunities that address the needs of their communities. Senior Corps includes the Retired and Senior Volunteer Program (RSVP), Foster Grandparent Program, and Senior Companion Program.
About the National & Community Service Fellowship Program
The National & Community Service Fellowship Program, launched by the Corporation for National Service in September 1997, involves a team of individual researchers who conduct in-depth studies that bring new knowledge to the field of national and community service. The program strengthens national service through continuous learning, new models, strong networks, and professional growth.
About the Author
Ms. Elliott is currently a doctoral student in public policy at Indiana University at Bloomington in the School of Public & Environmental Affairs and the Department of Political Science. Her research focus is on non-governmental/non-profit organizations in developing countries. She has her Master’s in Public Affairs from Indiana University, and her BA from Rice University. Her most recent adventure was as an intern in a local women’s rights organization in Tanzania. One of her first was as an AmeriCorps* VISTA member with a Habitat for Humanity affiliate.
Contract Number: CNSHQP01127
This material is based upon work supported by the Corporation for National & Community Service under a National Service Fellowship. Opinions and points of view expressed in this document are those of the author and do not necessarily reflect the official position of the Corporation for National Service.
Upon request, this material will be made available in alternative formats for people with disabilities.
Ginger L. Elliott 2002
ii Capacity as a Fundamental Objective
Acknowledgements
This project would obviously not have been possible without the National Service Fellowship Program of the Corporation for National and Community Service (the Corporation: the umbrella organization governing the activities of all AmeriCorps and other national service programs). As a Fellow, I was able to devote my time for ten months to this research, something difficult to do as a student. Within the Corporation, I am indebted to the help of Robin Dean, Robert Bush, Marcia Scott, Nathan Dietz and others who asked questions and provided answers to help the work along. Robin, Nathan and Marcia also provided substantial help in revising the document as it was written. Appreciation also goes to Jan Pigott for checking the document for errors. The six other Fellows in the program provided substantial support and encouragement, of which I am exceedingly indebted. I also want to thank Professors Kirsten Grønbjerg, Mary Tschirhart and Barry Rubin for their help in the design and review of my project. Their advice, as always, was invaluable.
I also want to acknowledge and thank the help of Hal Corlew in the HFHI Washington Office who was a critical contact with Habitat. Also with Habitat, I want to recognize Heidi Baker and Colleen Dudley for their valuable comments toward the beginning of the process, and Heidi and Rosemary Thompson for their comments at the end. Rosemary kindly read the whole report and suggested several helpful changes. Most importantly, I am very grateful to the 312 respondents who completed and returned the surveys I mailed to them. Without the time and energy they devoted to answering the four pages of questions (and the additional page for AmeriCorps* VISTA sponsors), I would not have any information to share with anyone else. Similarly, substantial material was gained from the 18 interviewees who let me ask detailed questions about their organizations. A hearty thank you is certainly warranted to all.
iii Capacity as a Fundamental Objective
Table of Contents
Acknowledgements......................................................................................................................................... ii Table of Contents........................................................................................................................................... iii Abstract.......................................................................................................................................................... iv Executive Summary........................................................................................................................................ v Introduction..................................................................................................................................................... 2
Purpose The Focus on Habitat for Humanity Affiliates
Part One: The Nature of Capacity................................................................................................................... 4 Use of the Concept of Capacity in AmeriCorps* VISTA Conception of Capacity
Part Two: The Components of Capacity......................................................................................................... 9 Capacity Dimensions Capacity Components
Part Three: Methodology .............................................................................................................................. 17 Development of Capacity Index Scoring System The Survey The Interviews
Part Four: Sample Description and Participation Characteristics ................................................................. 26 Affiliate Demographics Affiliate AmeriCorps* VISTA Program Participation Characteristics
Part Five: Capacity Characteristics ............................................................................................................... 32 Total Capacity Score Capacity Dimensions Capacity and Production
Part Six: Interviews....................................................................................................................................... 45 Definitions of Capacity Building AmeriCorps* VISTA Contribution AmeriCorps* VISTA Work AmeriCorps* VISTA Replacement Other AmeriCorps* VISTA Problems
Part Seven: Conclusions and Recommendations .......................................................................................... 54 Appendix A: Capacity Index Creation and Scoring: Tables ......................................................................... 58 Appendix B: Survey Variables and Forms.................................................................................................... 74
Survey form AmeriCorps* VISTA sponsor form Interview protocol
Appendix C: Non-Regression Data............................................................................................................... 87 Appendix D: Regression Results .................................................................................................................. 94 Appendix E: Limitations of Study .............................................................................................................. 107 References................................................................................................................................................... 108
iv Capacity as a Fundamental Objective
Abstract
Capacity building is a fundamental objective in the AmeriCorps* VISTA program. Because of its importance, it is critical to evaluate whether program members are fulfilling the mandate: are they building the capacity of their service organizations? Through survey and follow-up interview data received from Habitat for Humanity affiliate leaders, this study shows that organizations with AmeriCorps* VISTA members have higher capacity levels than those without them and that these higher levels are due to the work of the members. In particular, program benefits noted from the interviews include increased production, reduced staff work load and improved services to clientele. The results of the study also suggest that certain types of organizations—especially those that are younger and in rural areas—are underrepresented among AmeriCorps* VISTA partner organizations. In light of the benefits of program participation, it is recommended that both the Corporation for National and Community Service and associated partner supervisory organizations work to ensure that the neediest organizations received the help an AmeriCorps* VISTA partnership can provide. The results of this study are particularly relevant to policy makers, Corporation program administrators and program directors for the indications given regarding the benefits of members to their organizations.
For more information about this study, please contact the author, Ginger L. Elliott, at [email protected]. For more information about the Corporation and the AmeriCorps* VISTA program, please refer to the Corporation website, www.nationalservice.org.
v Capacity as a Fundamental Objective
Executive Summary
Capacity building is a fundamental objective in the AmeriCorps* VISTA program. Because of its importance, it is critical to evaluate whether program members are fulfilling the mandate: are they building the capacity of their service organizations? No research has been conducted on the AmeriCorps* VISTA program in its role as capacity builder. Although capacity itself—the ability of an organization to do what it wants to do—is addressed regularly in the literature, studies evaluating capacity-building activities are infrequent. By asking whether organizations with AmeriCorps* VISTA members have higher capacity than those without members—holding for previous capacity levels, the age and size of the organization, staff size and location—this study attempted to respond to a need for comprehensive evaluation of the program and its capacity-building properties. No specific outcome to this question was anticipated.
Habitat for Humanity affiliates were the only organizations studied. This was done particularly for three reasons. First, on capacity, it is much easier to compare organizations when they share a common mission (they ought to want to do the same thing and therefore need the same abilities). Second, the number of affiliates nationally is large enough (1597 at the time the sample was taken) to allow a substantial sample to be taken. Third, Habitat affiliates have been partnering with AmeriCorps* VISTA for several years and many different types of organizations have participated. There is a lot of variation in the set of affiliates, an asset when performing regression analysis.
The study consisted of several steps. First was a literature review to determine what abilities organizations are believed to need in order to achieve their missions. A capacity index score was created incorporating these different elements, or capacity components, along five different dimensions: organizational, financial, networking, advocacy and programmatic. This process closely mirrored the work of Glickman and Servon (1998) in the development of their conception and measurement of capacity in community development corporations. The score was then differentiated by organization size, as delineated by Habitat for Humanity International (2000a). Next, a survey was developed based on the capacity index, with the goal of determining whether organizations had the abilities believed to be necessary for success and whether their AmeriCorps* VISTA members contributed to increasing their abilities. Surveys were sent to 535 organizations in January 2001; 135 were sent to all of the known AmeriCorps* VISTA sponsoring organizations as of late fall 2001, while the remaining 400 went to a randomly chosen group of non-sponsoring affiliates from around the nation. Once the surveys were returned and analyzed, interviews were had with 18 affiliate directors with experience in the AmeriCorps* VISTA program. These were largely done in order to investigate further the conclusion presented by the survey data: organizations with AmeriCorps* VISTA members have higher capacity levels.
Four types of data were gathered through the surveys. Two types—organizational and community—were for control purposes, and included characteristics such as affiliate size, location, median income of the service area and the number of staff. A third set of variables referenced the AmeriCorps* VISTA program, organizations’ participation over time and members’ work. The final set, the largest, consisted of capacity characteristics. Measures of 38 components were used in the capacity index to determine what level of ability of mission achievement organizations possessed at the time the survey was taken. Data analysis primarily consisted of running computer statistical regressions that test relationships between variables.
vi Capacity as a Fundamental Objective
Three sets of conclusions could be made from the survey data: ° Regarding program participation: organizations that are more likely to participate in the
program are older, are located in larger cities and in the central and southern Atlantic regions, and are former participants. The least likely organization to be a member sponsor is relatively new, in a rural location, and has not been a sponsor in the past.
° Regarding capacity levels, the following factors have significant influence, holding for the age of the organization: ⇒ the number of full-time staff ⇒ technical assistance received in past three years ⇒ office type ⇒ the median income of the service area ⇒ the type of service area (rural versus urban) ⇒ the 1999 capacity score ⇒ having an AmeriCorps* VISTA member (and with the organizational capacity
dimension, having a member working in the area of volunteer management) ° Regarding whether capacity is related to housing production: organizations with higher
capacity levels build more houses, holding for the age and size of the organization, its staff size and the median income of the area.
The interviews highlighted the immediate roles of members: filling in activity gaps, reducing staff workload, improving client services and starting new programs. They also drew attention to several program problems as perceived by the participants. The primary problem was the issue of replacement. Nearly all respondents dreaded thinking about what would happen when their members left.
The practical implications of this research to the Corporation are indirect. The results empirically support the growing belief that national service has a direct positive impact on its partner organizations, and affirms the expansion of the program. The results of this study are particularly relevant to policy makers, Corporation program administrators and program directors for the indications given regarding the benefits of members to their organizations. There is evidence in this study that organizations may benefit more from engaging their members in volunteer management activities than in other ones. Additionally, the problems detailed in the interviews may have negative consequences if they are not addressed adequately and quickly. Their incidence is likely to occur among more than just the 18 interviewed organizations. More relevant and direct implications may be available upon further research into the specific areas in which AmeriCorps* VISTA members have the most impact.
Regarding the general field of capacity research, the study adds to Glickman and Servon’s (1998) conception of capacity by applying it to a new set of organizations and improving its specification. Additionally, the survey results concur with other research that claims a positive relationship exists between capacity levels and production. The study’s most important contribution to capacity research is its focus on national service as a capacity builder. This role had heretofore been unstudied. Left unanswered, however, are several questions regarding what aspects of capacity most influence production, why certain types of work appear to influence capacity levels while others do not, whether members’ experience, skills and education also have a bearing on organizations’ capacity levels, and why organizations with certain characteristics are more likely to participate in the AmeriCorps* VISTA program than those without them.
Capacity as a Fundamental Objective
Project Report
2 Capacity as a Fundamental Objective
Introduction
Several years ago, I was an AmeriCorps* VISTA (Volunteers in Service to America) member with a Habitat for Humanity International (HFHI) affiliate. This experience certainly gave me valuable skills in organizational development and management and solidified my interest in working within the non-profit realm. While there, however, I was not sure whether my work contributed to the long-term ability of the organization to fulfill its goal of eliminating substandard housing in the area. This uncertainty, augmented upon leaving and finding that several of my projects were not adequately continued by the next AmeriCorps* VISTA member or other volunteers, led me to propose this research project.
The goal of the research detailed in the next few pages was to discover the answers to four basic questions:
1. Do AmeriCorps* VISTA members have an impact on the capacity of their sponsoring organizations and how much?
2. What types of organizations are more likely to participate in the AmeriCorps* VISTA program?
3. What factors other than AmeriCorps* VISTA member presence are equally or more important in determining the level of capacity of an organization?
4. What kind of relationship exists between the capacity of organizations and their production levels?
The first two are highly relevant to AmeriCorps* VISTA program implementation for the Corporation for National and Community Service, while the latter two are more theoretical. Question number four is in fact central to the analysis of capacity: if it does not make a difference in mission achievement (equated here to production), then its relevance in reality is diminished. However, the majority of this study, and therefore this report, has been devoted to answering question one. It is a critical issue because of the focus placed on capacity in the Corporation (as demonstrated below) and because of the renewed attention to program effectiveness. If the AmeriCorps* VISTA program were not even meeting one of its central tenets, much work would need to be done.
I approached this work in consideration of one mandate of the AmeriCorps* VISTA program—capacity building—to begin to answer whether VISTA members are indeed increasing the capacity of their service organizations. The study examines and measures the ability of organizations to achieve their missions (capacity) and determines if and how VISTA members are contributing to higher capacity levels. Perhaps more importantly, it also considers the definition of capacity itself. In doing so, it reflects on whether capacity can be universally determined or if it must be defined by each individual organization.
Part One of the report considers the concept of capacity building in the Corporation for National and Community Service and the AmeriCorps* VISTA program. It looks to define capacity in a way that can be universally applied. Part Two takes the definition of capacity and amplifies it, determining its dimensions and components. Part Three covers the methodology of the study. Part Four presents descriptive data of the organizations in
3 Capacity as a Fundamental Objective
the sample, highlighting what aspects are most common among AmeriCorps* VISTA sponsoring organizations. The results of the regression analysis are discussed in Part Five, while the interview results are shared in Part Six. Part Seven conglomerates the data to present the study’s conclusions and recommendations. The appendixes provide further detail about the methodology, research instruments and statistical data supporting the conclusions. Appendix A presents tables related to the methodology alongside descriptive text. Appendix B contains the survey and interview documents, along with a table linking the survey questions to the variables under review. Corresponding respectively to Parts Four and Five, appendixes C and D elaborate the data analysis. Appendix E discusses the limitations of the study.
The Focus on Habitat for Humanity Affiliates
Undoubtedly, one of the first questions the reader is going to ask is “why study Habitat for Humanity?” Habitat for Humanity International (HFHI) was established in Americus, Georgia, in 1976, by Millard and Linda Fuller. The first affiliate was started by a grassroots group of local residents in San Antonio in 1978. It took twelve more years to develop the first 500 U.S. affiliates. By 1994, 1000 were in existence, and as of late 2001, there were 1600. The growth this organization is experiencing is incredible. Building houses around the world, the organization had completed 10,000 in 1991, 40,000 in 1994, 100,000 in 2000, and has set a remarkable goal of completing another 100,000 by the end of 2005. To do this, organizations will need to increase markedly their ability to provide services and perform their duties. In other words, they will need to increase their capacity. One of the ways they have worked to do this is through partnership with the AmeriCorps* VISTA program. As of late fall of 2001, 135 affiliates had members.
These affiliates of HFHI, each created and sustained at the local level by community members, were the focus of this study. They were chosen for three reasons: my own experience as an AmeriCorps* VISTA member with a Habitat affiliate, the vast number of affiliates around the nation (1600 and growing), and the fact that they are all pursuing essentially the same mission. The second point is essential for good statistical comparison. The last one is essential for good capacity comparison. As will be discussed later in this report, capacity evaluation and description are dependent on the service area of the organization under review. Additionally, when the missions are the same, many potentially problematic issues are controlled for in the sample selection phase, thus reducing their impact on the analysis itself. In order to compare organizations on capacity, then, it was deemed prudent to choose to study one set of organizations that are all attempting to achieve the same mission and using the same production goals and measures. First, measuring basic production among Habitat organizations is easy: one simply counts the number of houses built. Second, the nature of Habitat is that all of its affiliates share a common mission and common activities for fulfilling that mission. The Habitat literature frequently explains that the organization and all of its affiliates are “building houses with people in need” towards the goal of eliminating substandard housing around the world. Each local affiliate promotes this vision in its daily work.
4 Capacity as a Fundamental Objective
Part One: The Nature of Capacity
In this first section of the report, both the position of capacity within the AmeriCorps* VISTA program and its lack of definition therein will be discussed. The section will then present the importance of capacity as a research concept and its operational definition in this study. The purpose is to provide the reader a foundation of understanding with which the results of the study may be considered.
Use of the Concept of Capacity in AmeriCorps* VISTA
Volunteers in Service to America (AmeriCorps* VISTA), now a part of the AmeriCorps system, was established in 1965 in an effort to engage the citizens of the nation in poverty alleviation by serving in local institutions. Members serve one-year terms (multiple terms may follow) in a single non-profit organization focusing their efforts on program development, not direct service (e.g., creating a literacy program instead of teaching). One of the central tenets of the AmeriCorps* VISTA program is capacity building. To demonstrate its integral role, several documents are highlighted.
The 1997–2002 Strategic Plan (CNCS, 1997) states that “AmeriCorps* VISTA’s main activities involve strengthening and expanding the capacity of local organizations to address the needs of low-income communities in six program emphasis areas— education, health and nutrition, housing and homelessness, community/economic development, public safety, and the environment” (p.10). This focus on capacity derives from the program objectives listed in the authorizing legislation: “The objectives of [AmeriCorps* VISTA] are to generate the commitment of private sector resources, to encourage volunteer service at the local level, and to strengthen local agencies and organizations to carry out the purposes [of the program]” (42 U.S.C. 4951). This last phrase on strengthening institutions was added to the text only in 1993, indicating that capacity building is a relatively new endeavor of AmeriCorps. The revised guidelines for project selection mirror the objectives, stating that “each AmeriCorps* VISTA project must focus on the mobilization of community resources, the transference of skills to community residents, and the expansion of the capacity of community-based and grassroots organizations to solve local problems” (CNCS, 1995, FR 7172). The generation of funds and volunteer growth and training is separated from capacity building in the latter two statements. If this is the case conceptually, one must consider what activities would be contained within the capacity-building portion.
Allusions are made to the activities of capacity building in a brochure given to all potential organization partners, called Step-by-Step: A Guide to Partnering With AmeriCorps* VISTA. It says, “the role of the member is to build the capacity and sustainability of the project and community” (CNCS, 2001, p. 6), although it does not specifically define either capacity or sustainability. Instead, it describes types of capacity-building activities in which a member might engage. Some of those listed in the brochure include a) developing recruitment forms and volunteer assignments, b) writing a
5 Capacity as a Fundamental Objective
training curriculum/manual or training trainers, c) developing project procedures and systems, and d) creating a speakers’ bureau (p. 6). Once organizations are program participants, the Corporation requires them to submit a quarterly Project Progress Report. This report asks about the extent of the member’s participation in generating volunteers and funding (CNCS, 1998). Although the foundational documents mentioned earlier separate out these aspects from capacity building, it is possible that the Corporation conceives of these as all the same thing.
A 1998–1999 AmeriCorps* VISTA member accomplishment summary compiled by Aguirre International (2000), and developed with the cooperation of the Corporation, lists a set of “organizational capacity building activities” (p. 5) of which statistics have been taken in several states. The activities in which member participation is measured are:
a. generating additional cash funding; b. generating in-kind contributions; c. recruiting and training community volunteers to engage in capacity activities; d. establishing cooperative partnerships; e. making public appearances for sponsoring organization; f. providing technical assistance/training to other organizations; g. providing technical assistance/training to staff of sponsoring organization; h. establishing or expanding the organization computer system; i. developing or implementing public relations plans; and j. developing newsletters.
Four of these—letters a, b, c and g—are included as capacity-building activities even though they are measures of funding and volunteer growth. The Aguirre evaluation described above explicitly assumes that these activities increase the capacity of the sponsoring organization. This enumeration thus implies what an organization should look like: it should have cooperative partnerships, a public relations plan, a newsletter and a high public presence, among other things. However, none of these characteristics is directly promoted anywhere else by the Corporation as a quality an organization should have. There does appear to be some inconsistency in the various Corporation statements on capacity: there is no clear consensus on what it actually includes. If generating funds and volunteers are not actually capacity-building activities, other measures need to be developed that explicitly gauge the participation of members in capacity building.
Each of these documents articulates the Corporation’s belief in the fundamental nature of capacity and the role of AmeriCorps* VISTA members in building the capacity of their sponsoring organizations. Even so, attempting to establish what the Corporation intends capacity to entail is a daunting task. The absence of an unambiguous definition of capacity within the documents appears to be intentional. In a conversation with one AmeriCorps* VISTA administrator, it was said that it was not the place of the AmeriCorps* VISTA program to determine what an organization should look like in order for it to have the greatest ability to achieve its goals. In itself, this is a very logical and correct determination: not only is it not the place of an agency devoted to national service to define capacity or determine its benchmarks, it would be nearly impossible to do so given the great variety of types of organizations that partner with AmeriCorps.
6 Capacity as a Fundamental Objective
The result, however, is that AmeriCorps* VISTA members and their service organizations are not provided with a clear idea of how capacity should be built and, thus, in what activities they should be engaged. The meaning is left to staff and VISTA members to determine within individual organizations. The result is that “the pressure to do something has at times overridden the desirability of fully understanding what is being pursued” (Honadle, 1981, p. 577), undermining any real and useful conceptualization of capacity. Thus, the central problem is that things that can be enumerated, such as volunteers and funding generated, receive more focus than the activities that generate long-term sustainability and capacity in the organization.
One of the goals of this study was, therefore, to focus on AmeriCorps* VISTA members’ participation in capacity-building activities to determine whether they are indeed increasing the capacity of their organizations, and not just bringing in short-term help. The lack of an explicit codification of capacity building by the Corporation permitted the development of a detailed conception of capacity within the purpose of the study. This distinct definition may or may not coincide with the understanding within the Corporation of what capacity is or should be. Instead, the definition and composition of capacity were largely developed from the scholarly literature.
Conception of Capacity
Most simply, capacity is “the ability to do what [an entity] wants to do” (Gargan, 1981, p. 652). Two things need to be highlighted in this definition. First, this study assumes that what an organization “wants to do” is achieve its mission. In order to compare organizations, it is necessary for all of them to want to do the same thing. As will be demonstrated later, it is difficult to compare organizations that have different goals and thus different necessary abilities. Again, this is one of the reasons why Habitat for Humanity affiliates were chosen for the study: they all share a common mission. Second, one must assume that in having the ability to do something, the activity will be accomplished provided no outside forces inhibit it. If you are able to swim, you will do so as long as the water is not too choppy. For an organization, having the ability to do something implies that as long as the environment does not contain too many barriers, it will achieve its goals.
Many researchers are asking, ‘what makes an organization effective?’ The relationship between capacity and production/performance, even if it is not framed in those words, is the predominant question under review in the literature. While there is some controversy over the relationship, few actually conclude that it is weak. Some of these researchers include Robert D. Herman and David O. Renz (1999), whose work on nonprofit boards concludes that if there is a positive relationship between performance and board practices, it is uncertain. They argue that “the evidence for concluding that correct management practice enhances [non-profit organizational] effectiveness is scanty” (p. 118). Most others, however, such as Patricia Fredericksen and Rosanne London (2000), instead contest that successful organizations tend to share common characteristics, ranging from stable funding to skilled personnel (p. 232). Letts, Ryan and Goldman (1999, p. 18) note that program success is most often dependent on good implementation that in turn is a function of organizational skills and abilities. Another supportive study is by Rex LaMore (unpublished), in which an attempt was made “to
7 Capacity as a Fundamental Objective
identify relationships that might exist between the components of capacity and the efficient production of affordable housing” (p. 7). He also concluded that higher production levels are related to higher capacity scores, although his study has important limitations. Nonetheless, his finding is particularly relevant for this study because similar methodologies were used within parallel conceptions of capacity to study a similar set of organizations (both were based on the work of Glickman & Servon, 1998). Most studies reach the same conclusion: organizations with particular sets of characteristics are “more successful” than those without them.
If we accept that ability equals achievement given certain conditions, then one can further assume that the level of capacity of an organization is directly related to the organization’s potential for successful achievement. Beth Honadle (1981) writes that this conception of capacity, one of two possible, “disregards the results an organization is to achieve,” making it instead a matter of having the right “administrative stock” or means (p. 577). The second conceptualization she describes is indeed more concerned with what an organization does rather than how it does it (the ends), generally equating capacity with production. Capacity is not the same thing as a production outcome: it is instead the ability to reach an outcome goal. This distinction is illustrated in a comment from a USAID (2000) document: “increasing the capacity of…organizations helps them carry out their mandate effectively and function more efficiently” (p. 2). This second type has fallen out of theoretical use in the past twenty years; the vast majority of the literature reviewed for this study conceived of capacity in the first sense, focusing on what “stock” organizations need in order to achieve their goals. Based on this “stock” model, then, capacity is a set of qualities that enable an organization to be fully able to achieve its mission. Having capacity means having these components.
At the individual level, we all have stories to support this basic conclusion: until our organization (or another) did such and such, it had troubles in the area of X, Y or Z. However, determining the full set of qualities an organization needs to be successful is complex. Because of the definition’s complexity, few consider more than one distinct area at a time (such as with board practices, as in Herman & Renz, 1998 & 1999, and Green & Griesinger, 1996). Even in these limited areas, though, there is not a consensus on what indicators are appropriate; there is little conflict or contradiction, it is simply a matter of choosing the most important among the multitude (Green & Griesinger, 1996, p. 383). If, however, the knowledge gained from all of this research actually reveals those aspects most related to success, it would be possible to find and combine them into a full set. The resulting construction would be a sort of map an organization should follow in order for it to most improve its chances for high goal achievement. Norman J. Glickman and Lisa J. Servon (1998) have made great strides in this area with their expanded definition of capacity. This study has largely mirrored their formulation, as will be discussed in the next section.
Finally, there is no point at which an organization does or does not have capacity; instead, the variations in capacity indicate the relative ease with which goals can be achieved. At an ideal capacity level, problems and challenges will be fewer than at a lower level. The size of the organization must be considered in this construct. Smaller organizations do not need the same things as very large ones in order to achieve their goals. To illustrate, an organization that plans to raise only $40,000 in one year does not need to engage in the degree of fund-raising and planning that an organization wanting to
8 Capacity as a Fundamental Objective
raise $400,000 or $4,000,000 does. It does not need as many sources of income, for example, or as strict a financial review (it is easier to account for a smaller total sum— once spending reaches a certain level, however, only an audit can ensure the funds were spent properly). Of course, if it has many sources of income, it will much more easily raise funds, perhaps even exceeding its goal. If this is the case, it has greater fund-raising capacity, increasing its chances of further future growth.
9 Capacity as a Fundamental Objective
Part 2: The Components of Capacity
Given that capacity is the ability of an organization to do what it wants to do, what qualities should an organization possess in order to “be able?” As mentioned briefly in the previous section, determining these qualities, or capacity components, is a complex undertaking. The answer varies depending on the source. In some areas, such as board practices, evidence is growing that certain qualities are correlated with program effectiveness (see for example, Green & Griesinger, 1996). In other areas, such as networking, an intuitive acceptance of its beneficial qualities is common, although empirical support is scarce. This section will therefore present which qualities were ultimately chosen to constitute this study’s conception of capacity. For more detail on the process of choice and a table marking which of eighteen articles highlighted certain components, see Appendix A.
To ensure that the distinction between a dimension and a component is clearly understood, both must be defined from the start. A dimension is an overarching ability that an organization must demonstrate in order to be successful. Five dimensions of capacity are distinguished here, covering all aspects of successful organizations: organizational, financial, networking, advocacy and programmatic. A capacity component is a concrete, measurable aspect of each of these abilities; it is a quality of an organization perceived to be necessary for mission achievement. A component cannot exist outside of the five dimensions. For example, one of the dimensions, financial capacity, is defined as the ability to achieve resource stability and maintain accountability. One component of this ability (among many possible) is having an annual audit or financial review. The five dimensions will be discussed first, followed by the capacity components.
Capacity Dimensions
Glickman and Servon (1998 & 2000) have written frequently on capacity in community development corporations (CDCs). Their operationalization of capacity falls into Honadle’s (1981) “means” category and focuses on the abilities CDCs need to have in order to reach their goals. One of their goals is to make capacity building activities more specific to the needs of the organizations. Dividing these abilities into broad categories, Glickman and Servon (1998) developed five interrelated (and at times overlapping) dimensions: resource, organizational, programmatic, networking and political. Their categorical characteristics are elucidated in the following paragraphs. The five dimensions do more than distinguish between various organizational aspects; the authors actually define capacity as having these five general abilities, noting that working toward a one-dimensional definition would be counterproductive and “an exercise in futility” (1998, p. 503). They imply that without certain qualities in each of these areas, organizations will not be effective in achieving their missions.
Glickman and Servon’s multidimensional conception of capacity lays a solid foundation for exploration, and this study uses it with few changes. The changes that
Capacity as a Fundamental Objective 10
have been made were effected in order to clarify the distinctions between the dimensions and to improve their operationalization (even as suggested by LaMore, unpublished, p. 5). Modifications were partially influenced by other readings, to be discussed in the following paragraphs. First, a clarification was made of the difference between resource and organizational capacities. Commenting on resource capacity, Glickman and Servon (1998) write, “a CDC is dependent on its ability to generate and acquire resources from grants, contracts, loans and other mechanisms. It must attract, manage, and maintain funding in order to meet its objectives” (p. 503). In the following paragraph, however, while describing organizational capacity, they note that “the capability of the internal operations of a CDC” is affected by, among other qualities, “the organization’s fiscal capacity (its ability to raise and manage money).” The overlap seems unnecessary and confusing. To refine this, all financial aspects, except the type of fund-raising leadership (leadership is fundamentally an aspect of organizational capacity), have been grouped into one dimension of financial capacity in this study. This step is not without precedence. John Sidor (1990), for example, separates out all financial management issues into one section in his assessment method. In another assessment form, the Housing Assistance Council (2000) similarly separates financial, planning and management issues into different groups.
A second clarification was made in regards to programmatic capacity. The inclusion of this dimension is complex because it is difficult to draw the line between issues of program support and program implementation. This was highlighted in a conversation with Corporation staff in which one person asked how the programmatic capacity components differed from traditional production measures. In their second article detailing their research on CDC partnerships, Glickman and Servon (2000) say that this dimension “refers to the mix of activities in which CDCs engage” (p. 1); they stress that any included components are highly dependent on the area in which a nonprofit works. They chose to measure it using information about the levels of production and the kinds of programs in which the CDCs were engaged. If we conclude that we should measure programmatic capacity in this way, then we are merely counting what they do, and we cross the line between ability and performance. Instead, this capacity dimension should refer much more generally (and universally) to those aspects that allow an organization to participate in its planned activities.
Making this dimension more difficult to characterize is the intuitive idea that all aspects of the organization are supportive of program implementation. What then should fall into this category? In their initial conception, Glickman and Servon (1998) include having particular skills related to program implementation (housing construction and management, commercial and economic development, etc.), community organizing skills, responsiveness to changing community concerns and participation in mutually supportive programs (pp. 518–523). These latter three activities arguably are components of the political and networking capacity dimensions, and have been considered as such in this study. In reality, CDCs often engage in community organizing as part of their program portfolio—in this sense, it is appropriate to list it as an aspect of programmatic capacity. Focusing on skills related to program implementation is best, as they are unrelated to the other capacity dimensions. Among the skills included here are those related to having the specific resources needed to implement the program: land and
Capacity as a Fundamental Objective 11
volunteers. Habitat personnel, in interviews, highlighted their critical role in achieving their mission; without land and volunteers, no houses would be built.
One last change was made to the capacity formulation of Glickman and Servon regarding their conception of political capacity. The change is both semantic and substantial. Advocacy is a term that better befits the mission and activities of Habitat affiliates. Because of their reluctance to be partners with government (particularly in the area of funding, restricting it only to the purchase of land) and their stance on the issue of affordable housing, calling the abilities in this area “political” is not appropriate. “Political” capacity implies the ability to achieve government and community support for the organization’s programs, while “advocacy” capacity implies the ability to achieve government and community support for the organization’s mission. In a document called “Reflections on Advocacy” (2001a, p. 1), HFHI writes
community transformation and advocacy are strategic because they address the fundamental causes of poverty—that which lies at the root of homelessness and substandard housing—and therefore at the root of Habitat’s ministry…Advocacy deals with intentional efforts aimed at removing the external barriers that contribute to poverty and, as an extension, to substandard housing.
Compare this to a statement by Glickman and Servon (1998, p. 527): “this component of capacity primarily refers to two elements. First, it refers to CDCs’ influence with government officials at all levels… Second, [it] reflects a CDC’s legitimacy within the community it serves. Both types of political capacity help a CDC obtain resources and build other types of capacity.” It seems to function as a form of networking capacity, and this study categorizes government relationships and community awareness in this way. In this sense, advocacy rather than political capacity should function as a dimension of total capacity. Neil S. Mayer (1983) in fact considers “political influence and power” as an ability related to networking (p. 155).
To summarize, capacity is not one-dimensional, but consists of five related abilities, as initially presented by Glickman and Servon (1998, 2000). In order to enhance the competence of their framework to depict the abilities needed by Habitat for Humanity affiliates, modifications were made to it. These changes included reorienting several of the dimensions and clarifying all of them. The concise definitions of the five dimensions as used in this study follow; each is characterized according to the ability it encompasses. Without stating clear definitions, it is difficult to divide among them the specific components believed to be necessary to have a successful organization.
° Organizational: the ability to manage internal operations. ° Financial: the ability to achieve resource stability and maintain accountability. ° Networking: the ability to establish and grow relationships with community and
service-related institutions. ° Advocacy: the ability to address the purposes of the organization in the larger
society. ° Programmatic: the ability to provide programs and project support.
Capacity as a Fundamental Objective 12
Capacity Components
Because capacity is a complex concept, its measurement must also be comprehensive. Using a single quality to measure accurately its presence and its strength would be illegitimate. In this study, then, a total of 38 components were chosen to form the final capacity index. “Index” simply means that multiple factors are considered in the final variable that is analyzed. A large number of documents were reviewed in order to grasp what issues were deemed important for organizational effectiveness. The literature in this field is considerable, although the vast majority of it is concerned with the internal and financial operations of organizations. Most are directed to non-profit leaders to help them improve their programs (especially with growing importance placed on effectiveness among funders). One typical example is Standards of Excellence: Achieving Success in the Nonprofit Sector, by E.B. Knauft, Renee Berger and Sandra Gray (1991). They outline four “hallmarks of excellence”: mission focus, effective executive leadership, a dynamic board and strong resource development. For an organization to be effective, they note that it must be strong in all four (p. 2).
Two methods were used to determine which components within the five dimensions to include in this study’s capacity index measurement. First was a ranking process based on scholarly support. Each time a document recommended a particular quality as a means to improving the success of non-profit organizations, either theoretically or empirically, it was included in a list of components marked under the author’s name. For example, each of the four “hallmarks of excellence” mentioned above—and any related qualities noted in the text of Standards of Excellence—was included in the component table and each received one checkmark. If a second author also mentioned it, it received a second mark, and so on. Those qualities that received the most marks were more likely to be included in the index. Having a strong mission focus was mentioned ten times and was included in the index, while “staff is encouraged to be innovative and to show initiative outside the job description” was only mentioned once and therefore was not included. Having a long-term strategic plan was considered a component of organizational success 13 times, the most of any component. See Table A.1 and Appendix A to learn of the array of components’ scholarly support and to discover what components were excluded from the final index.
The second method in some instances trumped ranks. Some qualities that were ranked low were chosen to be in the index because they were specifically mentioned by Habitat for Humanity as components for success for its own affiliates (see HFHI, 2000). These included leadership areas such as site selection and homeowner support, and some programmatic and advocacy components. Two of these, having enough of both land and volunteers, were mentioned in Part One as being central to Habitat needs. No other sources recommended these qualities. This method was used because capacity is naturally dependent on the type of organization being evaluated. One of the problematic aspects of understanding capacity is that it is program-specific. Glickman and Servon (1998) discuss the problems they faced in defining and choosing measurements for capacity—they noted that it needed to be broad and specific “to take account of the wide array of CDC activities… [and] to include the details of CDCs’ work to rebuild poor communities” (p. 502). Any definition of capacity must likewise take into account the activities of the program, its resource needs and production patterns, and other individual
Capacity as a Fundamental Objective 13
program characteristics. Some evaluations even suggest that the organizations themselves determine which characteristics they believe they need to have to achieve their goals (see Gubbels & Koss, 2000). By allowing characteristics suggested by Habitat into the assessment, the index gains legitimacy for studying this specific set of organizations.
Two other considerations were made. First, the applicability of the component—or the basis of the component—had to be general enough that it could be reasonably adopted into an index for other types of organizations wanting to use a similar evaluation construct. For example, one of Habitat’s central tenets is that it remain true to its roots in Christianity. As is apparent in Table A.1 in Appendix A, many of the programmatic capacity components initially noted are related to this tenet. None of these characteristics of Habitat affiliate success was considered to apply widely enough across all types of non-profit organizations to be included in the index, however. Other Habitat-specific qualities were included. Having enough land, for example, even though a resource specific to housing organizations, is fundamentally a measure of resource acquisition; this concept can be applied universally to non-profit organizations. The second consideration was in regards to whether the component could be reasonably measured through a closed-question mail survey. Some components require a subjective evaluation (“stable, long-term operating support has been ensured”) or are sensitive enough that a truthful answer may be difficult to ensure (“the board reflects the diversity of the service area”). The answers to these two examples would be difficult to obtain using this particular research design; gathering detailed qualitative data such as this was outside the scope of the study.
Below in Table 1, each component in the capacity index is described (they are not listed in any particular order within each capacity dimension), along with a statement explaining its importance to an organization’s success in achieving its mission. The column labeled “Source” lists where the statement of importance was found. Eighteen components contribute to organizational capacity, seven are a part of financial capacity, networking and programmatic capacity each has five components, and advocacy capacity has three. Each component is an aspect of an organization that, when implemented or possessed, is believed to contribute to organizational success. It is necessary to mention that the truthfulness, or applicability, of this statement is dependent on the size of the organization and its production goals. More about this critical aspect is presented in Section Three, which relays specific information about how the presence of the components in the index was determined and measured.
14 Capacity as a Fundamental Objective
Table 1: Descriptions of and Support for Capacity Components Components of Capacity Measurement Statement of Importance Source
Organizational Capacity The organization has vested executive leadership in one individual, either volunteer or paid (strong needed)
“Systematically, credible, committed, and confident leaders are key to [organizations’] success in carrying out projects.” Mayer (1983, p. 153)
FTE staff and volunteers have been retained for at least 2 years
“The effort to continually recruit, orient, and train new people tales away from a CDC’s ability to meet its goals and maintain a stable organization.”
Glickman & Servon (1998, p. 513)
Volunteers and staff are numerous enough to prevent overload on a small group
“…The concentration of responsibility, knowledge and experience in the hands of a very few people can be unhealthy. It means that an agency is vulnerable [to] the loss or defection of one or two people…small agencies need clear and explicit strategies to spread the load.” Rochester (2000, pp. 14–15)
The affiliate has a 3-5 year long-range strategic plan in place
“Managing growth requires the ability to make long-term plans…Strategic planning encourages members of the organization to think reflectively and plan for the long term.”
Glickman & Servon (1998, p. 517)
Written evaluations are conducted of staff, programs and the board on an annual basis
“If capacity includes the ability to anticipate and influence change, there needs to be ongoing assessment of what the organization is doing…[and] how well it appears to be doing it.” Honadle (1981, p. 578)
The mission (and vision) and goals of the org are clearly stated and accepted by all
“…Effective nonprofit organizations convey a singlemindedness of purpose. Board and staff know exactly what they are offering, and for whom.”
Knauft, Berger & Gray (1991, p. 3)
Policies and procedures exist for most activities and are used
Organizations that are more formalized tend toward higher success rates.
See Bradshaw, Murray & Wolpin (1992)
Records are kept to track money, donors and volunteers
Construction growth is dependent upon adequate methods of contacting volunteers and funders, while accountability is enhanced when money is tracked efficiently. See HFHI (2000)
The Board sees its main goal as governance rather than operations
“Day to day management of affiliate operations is usually no longer effectively done by the board [once reaching a certain size], but by staff (paid and/or volunteer)…What is needed is either a definite shift in the mind-set of current board members or else their replacement by new…who have a different approach.” HFHI (2000, pp. 37–38)
The affiliate has appropriate leadership in:
Homeowner Selection
In Figure 2-1 of the HFHI capacity–building manual, “Basic Characteristics of Habitat Affiliate Growth Stages,” recommendations are made regarding the type of leadership HFHI (2000, pp. 23–24)
Homeowner Support/Relations and total staff based on the level of construction. Based on this and other research, having the appropriate staff types and levels
15 Capacity as a Fundamental Objective
Site Selection is critical to meeting and expanding services. See, e.g., Nye & Glickman
(2000, p. 176)
Construction Planning
“As Habitat 40 affiliates grow to their next level, they report that staff, either paid or volunteer, begins to assume more and more of the daily functions of affiliate operation.” HFHI (2000, p. 48)
Financial Management Volunteer Management Public Relations Fundraising/Resource Development
Board Nominations
“…Boards of effective organizations were more actively engaged in training new board members, setting specific duties of board members, and evaluating board performance than were boards of less effective organizations.”
Green & Giesinger (1996, p. 397)
Financial Capacity
The affiliate has an annual budget
“Management implies some ‘rational’ application, allocation, and handling of the resources at one’s disposal and not merely their disposal.” Honadle (1981, p. 578)
The affiliate's administrative costs are below 25% of its total annual revenue
“As a general rule, overhead costs (administration and fund raising) should be kept below 25% of the affiliate’s annual budget.” HFHI (2000, p. 58)
The affiliate had a positive fund balance at the end of last year and assets have been growing
“A CDC’s financial condition is a clear gauge of its capacity—a strong balance sheet and adequate cash flow are essential to its organizational stability.”
Nye & Glickman (2000, p. 172)
An annual independent financial review is conducted, or if income is greater than $250,000, an audit
“Being unable to demonstrate clearly how funds were used can be deadly to [organizations] if their honesty is challenged by outsiders fighting with them over other issues.” Mayer (1983, p. 154)
Individual donations increase annually
“It can be an easy temptation to ‘hunt for the elephants’ by going after corporate and government grants while neglecting to cultivate individual donors, who are the life blood of Habitat, both from a financial standpoint and also as volunteers.” HFHI (2000, p. 66)
The affiliate is active in searching out new funding sources
“CDCs recognize the need to diversify their funding and reduce their dependence on grants if they are to remain financially healthy.”
Nye & Glickman (2000, p. 172)
Funding comes from a variety of sources (see above)
16 Capacity as a Fundamental Objective
Networking Capacity
Projects are sponsored by and developed with neighborhood groups
Networking “helps bring individuals closer to each other and to institutions both inside and outside the community. These networks involve financial, political, and economic relationships and help community organizations achieve their goals more quickly and efficiently.”
Glickman & Servon (1998, p. 524)
Congregational involvement in Habitat is increasing (see above)
The affiliate is networking with nonprofits, businesses and housing entities in the area
“One of the most important advantages to be gained from paying the modest membership fee to join an “umbrella” organisation is the opportunity it provides to network with people facing similar challenges, share experiences with them and pool knowledge.” Rochester (2000, p. 18)
Community recognition of Habitat symbols and purpose is widespread
Organizations in knowledgeable communities have an easier time recruiting volunteers and raising funds. See HFHI (2000)
Advocacy Capacity
The affiliate has worked with the city or county in developing alternative affordable housing options
“A successful effort [to eliminate substandard housing] will involve partnerships with other housing providers/interest groups. Creating a local initiative is the key to these partnerships.” HFHI (2000, p. 79)
The affiliate knows the percentage of poverty housing in the community or the number that need repaired
Without knowing the extent of the problem, the full solution cannot be developed. See HFHI (2000)
The affiliate regularly reiterates that the poverty housing is a moral issue that needs redressed
Successful organizations understand that community support is dependent on the peoples’ knowledge of what needs to be done and how it will help everyone. See HFHI (2000)
Programmatic Capacity
Alternative sources of funding are used for land development
“Partnerships with local government have proven to be very effective in obtaining land and infrastructure. Increasingly, government officials at all levels are learning that supporting Habitat for Humanity is a good investment of public land and tax dollars.” HFHI (2000, p. 62-63)
Current land holdings will sustain building for two years
“Land issues must be key components of an affiliate’s strategic plan. A strong site selection committee or staff person should be involved in acquiring land well in advance of the annual building plan, perhaps as much as three to five years ahead.” HFHI (2000, p. 62)
17 Capacity as a Fundamental Objective
The affiliate has a qualified construction supervisor on site
“Generating and especially expanding [organization] success in development work is strongly tied to the full-time availability of at least one skilled and experienced developer/manager with major project responsibilities.” Mayer (1983, p. 153)
The affiliate offers appropriate recompense to supervisor (see above)
The affiliate has a large pool of volunteers from which to draw on construction days
One of the factors limiting the speed with which a house is completed is the number of hands putting it up: the more available, the work can be done. See HFHI (2000)
17 Capacity as a Fundamental Objective
Part 3: Methodology
After defining capacity and considering which components to include in its measurement index, the scoring system for the index (and the components within it) was developed. The survey document was then crafted, its questions designed to elicit responses that would translate into an index score to measure the presence and level of capacity within each organization. Along with the main survey, a second questionnaire was created that was directed specifically to AmeriCorps* VISTA-sponsoring organizations to learn more information about their members and the work they were doing. These surveys were mailed to Habitat affiliates in January 2002. Once these were returned, interviews were conducted with a subset of responding affiliates. The two survey documents and the interview protocol are available in Appendix B. The following sections detail each of these steps.
Development of Capacity Index Scoring System
A scoring system was constructed to measure each affiliate’s level of capacity, incorporating the 38 components of the five capacity dimensions discussed previously. For the current capacity level, two types of measurement were distinguished to offer different means of evaluation and comparison. The first is total capacity score, the straight numerical tally of the scores of each component in the capacity index. It ranges from one to 100, and is used in the statistical analysis. The second is the percentage score. This value offers an easy and direct way to compare organizations to each other based on their production level. Knowing the level of production of an organization is critical to the proper determination of how much capacity an organization needs to be successful. This factor is quantified in a construction called the recommended score. Additionally, one final measure of capacity was developed to provide a means to evaluate capacity growth over time. The 1999 capacity score is also an index variable, measuring qualities of capacity in 1999. All four of these constructs are elucidated below.
Total capacity score Each of the 38 components in the capacity index was assigned a total point value, or score, based on its perceived importance in enhancing the ability of an organization to achieve its mission. For example, having a strategic plan was worth eight points, the most of any factor. The full list of components and their scores is provided in Table 2 below. Components considered more important in the conception of capacity were given higher possible scores. In this way, some components have a greater impact on the total capacity index score than others. Because 100 is a very easy number with which to work, the sum total of the individual component scores is 100. This is the maximum possible total capacity score. Thus, if an organization had full capacity as defined in this study, it would receive a score of 100 on this measure. It needs to be introduced here that many organizational qualities, when appropriate, were not simply scored as being present or not being present, but as having different degrees of presence. For example, in measuring
Capacity as a Fundamental Objective 18
whether an affiliate is “active in searching out new funding sources,” if it has acquired zero new funding sources over $1000 in the past six months, it receives a score of zero. If it has found one or two new sources, it receives a score of 1.5, and if it has found more than two, it receives the maximum possible score for that component of three points. In this way, it was possible to distinguish between different organizational needs based on their production level and to create a numerical comparison system called recommended score.
Table 2: Components' Total Possible Scores Component Total Possible Score Organizational Capacity 55 The affiliate has a 3-5 year long-range strategic plan in place 8 The mission (and vision) and goals of the org are clearly stated and accepted by all 5 Written evaluations are conducted of staff, programs and the board on an annual basis 4 Policies and procedures exist for most activities and are used 4 The organization has vested executive leadership in one individual, either volunteer or paid 3 FTE staff and volunteers have been retained for at least 2 years 3 The Board sees its main goal as governance rather than operations 3 The affiliate has appropriate leadership in: Volunteer management 3 Board nominations 3 Public relations 3 Homeowner selection 2 Homeowner support/relations 2 Site selection 2 Construction planning 2 Fundraising/resource development 2 Financial management 2 Volunteers and staff are numerous enough to prevent overload on a small group 2 Records are kept to track money, donors and volunteers 2 Financial Capacity 18 Funding comes from a variety of sources 4 The organization has an annual budget 3 The organization has an annual financial review or audit 3 The affiliate is active in searching out new funding sources 3 The affiliate's administrative costs are below 25% of its total annual revenue 2 The affiliate had a positive fund balance at the end of last year and assets have been growing 2 Individual donations increase annually 1
Capacity as a Fundamental Objective 19
Networking Capacity 12 The affiliate is networking with nonprofits, businesses and housing entities in the area 5 Projects are sponsored by and developed with neighborhood groups 3 Congregational involvement in Habitat is increasing 3 Community recognition of Habitat symbols and purpose is widespread 1 Advocacy Capacity 5 The affiliate has worked with the city or county in developing alternative affordable housing options 2 The affiliate knows the percentage of poverty housing in the community or the number that need repaired 2 The affiliate regularly reiterates that the poverty housing is a moral issue that needs redressed 1 Programmatic Capacity 10 Current land holdings will sustain building for two years 4 The affiliate has a qualified construction supervisor on site 2 The affiliate has a large pool of volunteers from which to draw on construction days 2 Alternative sources of funding are used for land development 1 The affiliate offers appropriate recompense to supervisor 1 Total Score 100
Recommended score One must not assume that an affiliate must have every component of success for it to achieve its mission, or even have the same degree or level of a given quality. In any given organization, having certain qualities is only relevant when it becomes large enough to need them. For example, HFHI (2000) suggests that affiliates building only one to two houses per year do not need to have an executive director and that the board can sufficiently run daily operations. An affiliate building more than 20 houses per year, however, is recommended to have staff in all substantial areas, including volunteer management and site selection, and that the board should focus its attention on visioning and planning (pp. 25–33). The annual production level of the affiliate clearly influences its organizational needs.
HFHI has itself been working in the area of organization capacity building in recent years. One of the most prominent results of their work is the document, A Model for Capacity Building (2000), which focuses on affiliate growth. It contains numerous details on how affiliates can work to expand their programs through changes such as increasing staff size and working with government. One of the most helpful aspects of the document is a set of tables (Figure 2-2, pp. 25–33) that details what organizations should look like and have at different housing production levels in order for them fully to realize their goals at that level. Significant differences exist between organizations that produce at various levels (note the examples in the previous paragraph).
Capacity as a Fundamental Objective 20
Habitat names and describes five different levels of production, based on the number of houses built annually:
° 1 – 2 houses in a given year (Foundation Builder) ° 3 – 4 houses (Home Builder) ° 5 – 9 houses (Block Builder) ° 10 – 20 houses (Neighborhood Builder) ° 21 or more houses (Community Builder)
The manual does qualify the use of these categories, noting that affiliate growth is also influenced by factors other than the production level, including the type and size of the community, the age of the organization and the total number of houses it has built over the years. This size–based framework is not cast in stone and flexibility in its use is recommended (HFHI, 2000, p. 8).
Even so, categorizing organizations and their needs by their production level or size corresponds to others’ work on organizational growth, much of which describes different stages of growth visible in the life of every organization. Some authors do not use categories, but instead specify different processes; Mayer (1983, pp. 159–160) describes several processes that must be adopted by neighborhood development organizations before they will be mature. More often, however, the approach is categorical, as represented in the Habitat manual. One organization, World Neighbors, describes five stages of growth and lists capacity indicators relevant to each stage in its capacity assessment guide (2000, pp. 13, 15). They name the five stages embryonic, emerging, growing, well-developed and mature. Similarly, the Organizational Capacity Assessment Tool uses growth categories called nascent, emerging, expanding and mature (USAID, 2000, p. 68). Dividing organizational capabilities by the size, production level and/or age of the organization appears to be quite common, particularly among international development organizations. Accordingly, two of these aspects, size and age, are the most relevant control factors to consider when comparing organizations on their levels of capacity. The third aspect, production level, is accounted for in this study in the recommended score concept.
Essentially, this construct dictates how much capacity an organization should have based on its production level for the coming year. It is an expanded version of the tables created by Habitat mentioned above, and includes all the components in the index. Based on the Habitat information and that provided in a few other sources, each component was evaluated for its size-related aspects and scored accordingly. To illustrate, the scoring breakdown of “written evaluations are conducted of staff, programs and the board on an annual basis” will be described. Several sources in the literature recommended that organizations conduct regular internal evaluations, and was therefore accorded four points in the capacity index. The following question and answer options were on the survey:
Do you regularly (annually, for example) conduct performance evaluations on any of the following (mark all): Board, Executive Director, Other Staff, Volunteers, Programs.
If a respondent marked none of the five, it received zero points. If one, two or three of the options were marked as being evaluated, the respondent was given one, two or three
Capacity as a Fundamental Objective 21
points, respectively. If four or five of the options were marked, it received four points. By this system of differential scoring, the same process that was followed for all other components, different levels of the component were able to be measured and scored. Because lower-producing organizations are less likely to have staff of any kind, they should not be expected to evaluate staff. Similarly, in the literature, the perception is that only larger organizations need extensive evaluations to ensure that their many facets are running smoothly. Accordingly, smaller affiliates should not be expected to evaluate as much of their operations as larger ones. The recommended scores for each of the five levels of production for this component of evaluation were:
° If producing 1–2 houses, it should have a regular evaluation of one of the five options, or have a recommended score of one;
° If producing 3–4 houses, it has a recommended score of two (or two evaluations);
° If producing 5–9 houses, its recommended score is also two; ° If producing 10–20 houses, its recommended score is three; and ° If producing more than 20 houses, its recommended score is four (or the full
capacity score for this component). Table A.3 in Appendix A (and the accompanying text) provides the scoring details
for each component in the index, giving the recommended score for each component at each production level. Table 3 below provides a summary of this data for the capacity dimensions only. Again, as organizations get larger, they need more qualities and abilities than do lower-producing ones, and they need more of them. While a smaller affiliate can function smoothly without a detailed policy on staff hiring and firing, it is essential for a larger one. While a smaller organization may not need or even afford a full-time fund-raising staff person, one that is producing a small subdivision does. The recommended score construct takes into account these differences based on an organization’s production level. Essentially, it says that only the very largest of organizations should be expected to achieve the full score of 100 of the capacity index.
Table 3: Recommended Scores by Proposed 2002 Production Level Houses Planned for 2002 and
Corresponding Recommended Scores Capacity Dimension 1 to 2 3 to 4 5 to 9 10 to 20 21+
Percentage capacity score It is useful to be able to determine what percentage of the recommended capacity score any given organization has to be able to compare organizations at different production levels. Questions such as, how many organizations have full capacity for their size and do any organizations have more than the recommended amount of capacity, can be answered using a percentage score evaluation. Each organization’s percentage score value is simple to calculate: it is the total capacity score divided by the recommended capacity score. For example, if an affiliate has plans to build seven houses in 2002, it has a recommended capacity score of 81 (see Table 3). If it then received a total capacity score of 67 from the survey responses, its percentage capacity score would be 83 percent. It is important to state right from the start that the capacity index maximum score of 100 is an ideal score. According to the literature and various practitioners’ perceptions, an organization with 100 percent of the score would be perceived to be most able to achieve its mission, no matter its size. This does not mean that organizations with scores lower than this, or lower than the recommended scores for their level of production, are not able to fulfill their missions. It means simply that they do not have the ideal level of capacity as defined in this study. More research needs to be done to determine what amount of capacity is actually necessary to achieve an organization’s goals—this amount is assumed here.
1999 Capacity score The final capacity score to be developed was a measure of an organization’s capacity in 1999. A separate index was created using components that matched several from the current capacity index (leading to the total capacity score). This measure is used exclusively for control purposes in the regression analyses. Capacity in the present is dependent on capacity in the past; without taking this into account in the analysis, it would be very difficult to discuss conclusively the influence of other variables, such as having an AmeriCorps* VISTA member or the number of staff members. This is due to the reality that these factors are determined in part by the capacity of the organization. To illustrate, an organization with an executive director in 1999 is more likely to have other staff members in 2002 than an organization that did not have a director in the past. The list of variables included in the 1999 capacity score index is available in Table A.4 in Appendix A. This index was also divided up by recommended score, although percentage scores were never computed.
The Survey
The survey itself consisted of ninety questions to gather information in four areas: AmeriCorps* VISTA program participation, organization and community description, current capacity and capacity in 1999. Of the ninety questions, nine corresponded to program participation, twenty-two to description, forty-two to current capacity and seventeen to historic capacity. A second form exclusively for AmeriCorps* VISTA program participants requested information on the work and job position title of their members. Again, these forms are included in Appendix B. Also available in the same appendix is a reference table (Table B.1) listing each component measurement/indicator,
23 Capacity as a Fundamental Objective
its variable type (organizational versus financial capacity, for example), its variable code, and its corresponding question. The survey answers and scores are in Appendix A.
The answers to the survey questions were given point values that corresponded to the component point values on the capacity index. For example, the component “the board sees its main goal as governance rather than operations” was accorded three possible points in the capacity index. To measure the degree to which the board is involved in visioning and planning versus daily management issues, the question was asked, “What percentage of the usual board meeting is spent on day-to-day operations issues?” There were three possible answers: 0–33 percent for three capacity points, 34–66 percent for two points and 67–100 percent for one point. For each question on the survey, more points were awarded for answers that indicate higher levels of ability in the area under consideration, with the ‘best’ answer having a point value equal to the possible score for that component. Each answer was also related to the recommended capacity score for the various production levels.
The survey was first mailed on January 5, 2002, to all 535 affiliates in the sample. The second survey was mailed February 26 to organizations that had not responded to the first. Of the 535 surveys, 135 were sent to all of the known AmeriCorps* VISTA sponsoring affiliates as of late last fall; the remaining 400 were sent to a randomly sampled group from among the rest of the domestic affiliates. Prospective affiliates— those in the process of affiliation approval—were not included in this set, nor were affiliates in Guam, Puerto Rico, Bermuda and the Virgin Islands. These countries’ affiliates were not included because, at the time when the sampling occurred, it was believed that they did not participate in the AmeriCorps* VISTA program. The total national set of affiliates, within these two restrictions, numbered 1597 organizations as of September 2001. The contact information and date of affiliation for each affiliate came from the September 2001 HFH External Directory of All United States Affiliates.
Table 4 displays information about the final tally of surveys returned. As mentioned, all AmeriCorps* VISTA sponsoring affiliates were sent surveys, accounting for 8.5 percent of all domestic affiliates. Note for the purposes of this study, an affiliate is considered an AmeriCorps* VISTA sponsor, partner or program participant if it had a member serve in it since 1999—not all of these organizations were sampled, however. Including non-sponsoring affiliates, nearly 34 percent of all affiliates were originally mailed a survey. The overall survey return rate was 58 percent, which means that 20 percent of all national affiliates responded to the survey. Interestingly, however, the return rates differed between the two groups of AmeriCorps* VISTA sponsors and non-sponsors. Eight-five percent of surveys were returned by the set of affiliates singled out as AmeriCorps* VISTA sponsors, while only 49 percent of non-sponsors returned their surveys. Consequently, although 25 percent of the surveys were originally mailed to AmeriCorps* VISTA sponsors, 37 percent (or 102 affiliates) of the final sample (both before and after being cleaned) were sponsors. This is significant because it means that program sponsors are very much over-represented in the sample compared to the set of domestic affiliates. Cleaning simply entailed removing those surveys that either were more than half unanswered or had inconsistent responses; 39 surveys were removed from among the returned surveys. The final sample consisted of 51 percent of the original sample of 535 organizations. This rate is considered to be above average for mail surveys.
Examining the survey results In order to discover the relationships within the data gleaned from the mass of surveys, an in-depth regression analysis was done. Part Five briefly presents the results of the analysis, while Appendix D discusses them more fully. Several different variables were analyzed as dependent variables (meaning the importance of other factors on their strength was measured), divided among three different types. First were AmeriCorps* VISTA variables, analyzed in order to determine what factors were related to having an AmeriCorps* VISTA member (presented in Part Four and Appendix D). The second set of analyses were run on the capacity variables—total capacity and the five dimensions to see whether members have an impact on the levels of capacity of their organizations, controlling for other factors. Finally, a brief analysis was conducted on the relationship between affiliate capacity score and level of production, again controlling for a number of factors. The control factors considered in each of these analyses follow. They were chosen because they are each believed to have a separate influence on the level of capacity of an organization.
° Organization control variables: » age of organization (the number of days since its affiliation with Habitat
International) » size of the organization (represented by the number of houses built since
affiliation) » the organization’s 1999 capacity score » whether the organization has received any technical assistance in the past
three years
Capacity as a Fundamental Objective 25
» the number of full-time staff in the organization » the type of office the organization has » whether the organization has participated in a Habitat/HUD Capacity-
Building grant in the past three years » the number of years in the AmeriCorps* VISTA program
° Community control variables: » median income of the community being served by the organization » the size of the community being served » the number of churches in the community » national regional location
The Interviews
Interviews were conducted with 18 affiliate executive directors to gauge their impressions of the value of having an AmeriCorps* VISTA member serving with them. Interviewees were chosen based on their location, current AmeriCorps* VISTA partnership status and willingness to participate further. The results of the interviews, along with the questions asked, are presented in Part Six. A copy of the interview protocol is included in appendix B.
Capacity as a Fundamental Objective 26
Part Four: Sample Description and Participation Characteristics
In this section, the data from the sample will be presented in two groups. First, the set of affiliates will be portrayed in its entirety by size, age and regional distribution. Second, the organizations’ participation in the AmeriCorps* VISTA program will be detailed. This second section will consider what factors make participation more likely. Many more characteristics and factors are reviewed in Appendix C.
Affiliate Demographics
Annual housing production Several variables, presented in Table 5, record the number of houses built in the years since 1999, the houses planned for 2002 and the total number of houses built. The growth in the annual average of houses built, from 3.8 in 1999 to 4.44 in 2001, is a good sign for Habitat and its five year construction goal of 100,000 houses. During this time, the highest producing affiliates in the sample have increased production by 11 houses per year, from 59 houses to 70. In 2002, the highest number of houses planned for construction is again 70. There are also affiliates in the sample that do not plan to build any houses at all this year.
Table 5: Housing Construction Statistics of Sample Number of Houses Built
Variable Average Median Range Houses Built in 1999 3.8 2 0 to 59 Houses Built in 2000 4.41 2 0 to 64 Houses Built in 2001 4.44 2 0 to 70 Total Houses Built since Affiliation 34.12 14 0 to 650 Houses Planned for 2002 5.9 3 0 to 70
The outlook is not as good when the median production level is considered alongside the increasing average annual construction. For the years 1999 through 2001, half of the affiliates in the sample build two or more houses annually, while the other half built two or less (as demonstrated by the sample median of two). Having high average construction rates compared to median rates indicates that a few affiliates produce a very large number of houses compared to the rest of the sampled group. This is not problematic unless the average increases while the median stays the same. This information may be interpreted in two ways. First, it may be that only a few—the very largest—have increased production while most affiliates have not. It could also be that a very large number of new affiliates are being established each year, most of which are building at low levels while the older ones are increasing their rates of production. Given
Capacity as a Fundamental Objective 27
that more than 215 affiliates have been established since the start of 1998, this explanation is plausible.
The increase to three houses per year for the 2002 planned construction indicates that growth is occurring among the entire sample and not just among a few very large ones. The further growth in average construction with a constant range further suggests that medium-sized affiliates are producing at higher levels. Further evidence of an increase in overall affiliate production is evident in Table 6, which displays the number of affiliates planning to build at which levels in 2002. Whereas half of the affiliates between 1999 and 2001 built about two or more houses, in 2002, more than 60 percent have plans to build three or more. Additionally, only five in the sample do not plan to build any, at two percent of the sample. Even so, the majority of affiliates are at the lowest production level of one to two houses per year, and only five percent plan to build 21 or more. See Table C.3 in Appendix C to compare this data to the actual 1999 construction levels delineated by production level. The comparison demonstrates the pattern of growth is evident at every level of production.
Table 6: 2002 Planned Housing Construction Production Level Number of Affiliates Percentage of Affiliates None 5 1.8%
1–2 houses 113 41.4%
3–4 houses 55 20.1%
5–9 houses 52 19.0%
10–20 houses 34 12.5%
21 or more houses 14 5.1% Total 273 100.0%
Organization age distribution Regarding the age of organizations, the sample matches the distribution of the national set of affiliates well. The average years since affiliation for the sample is 10.5 and for the national set it is 9.5 (see Table C.2 in Appendix C), while the median values are also very similar, at 10 and 9, respectively. Additionally, the range of affiliation dates is virtually identical. The range of the sample, from oldest to newest is April 1978 to May 2001, whereas the national set ranges from April 1978 to August 2001. This information was current as of September 2001. While the age distribution information is important, more relevant to the study is the distribution of total houses built by the age of the affiliate. This can reveal how age, or years since affiliation, is related to levels of production. This distribution is displayed in Figure 1.
0
100
200
300
400
500
600 TotalHousesBuilt
0 5 10 15 20 25
YearsSinceAffiliation
Capacity as a Fundamental Objective 28
Figure1:TotalH ousesBuiltby YearsSince A ffiliation
700
This figure charts the total houses built by the sampled affiliates against their years since affiliation. Each dot—some of which overlap each other—represents one organization. Newer affiliates are to the left of the chart. The chart clearly shows that newer affiliates have lower overall production levels, such that of all affiliates less than ten years old, only two have built a total of 99 or more houses since they were established. Most affiliates fall into the growth pattern—only two (at about 490 and 660 total houses built) are distinct anomalies. A more interesting comment on the figure is that many older affiliates have not yet built 100 houses or more. While it is expected that new affiliates have not yet built many houses, the fact that many older ones have not either suggests that perhaps the relationship between age and the number of houses built is not firm. Age does not equal production, and is not a proxy for it, although they do vary together. This hints at the presence of another factor that influences production to a greater degree than does age.
Regional distribution Affiliates have been grouped into eight administrative regions by HFHI. The regional distribution variables were created because in the Southeast and the West, affiliates coordinate AmeriCorps* VISTA programs at the regional level. These regions have partnerships with AmeriCorps* VISTA, and organizations apply through them to receive members, rather than state offices or the national AmeriCorps* VISTA office. This of course makes getting information about affiliate participation more difficult, but it also enables better planning and coordination than would be possible were each affiliate to work with the Corporation individually. Table 7 shows the regional distribution among the national set of affiliates and the sample. It is clear that the sample accurately reflects the national regional distribution because the affiliates in the sample have similar regional rates to the national set of affiliates. To illustrate, 4.8 percent of affiliates in the sample are located in the West region, a number very close to the percentage of affiliates in the West among the national set (4.6 percent). The national affiliate count is from July/August 2001.
Capacity as a Fundamental Objective 29
Table 7: Count of Organizations by Region
Region States National Count
% of Affiliates
Sample Count
% of Sample
West Arizona, California, Hawaii & Nevada 74 4.6% 13 4.8% Central Atlantic
Wash., D.C., Maryland, North Carolina, South Carolina, Virginia & West Virginia 220 13.6% 41 15.0%
Connecticut, Delaware, Maine, Massachusetts, New Hampshire, New Jersey, New York, Pennsylvania, Rhode Island & Vermont 209 12.9% 29 10.6%
Total 1624* 273 *The national total here includes affiliates outside the study’s location parameters.
Affiliate AmeriCorps* VISTA Program Participation Characteristics
General information on participation Two regressions were run to analyze the factors that are related to program participation; they are presented in Appendix D, in the first section called “AmeriCorps* VISTA Variables”—specifically look at Tables D.1 and D.2. The data will only be summarized here, although some variables receive lengthier descriptions in the following paragraphs. First, two variables were analyzed: having a member at the time of survey completion (‘currently’ had a member) and having had a member at some point in the three years before survey completion. The difference between the two, also described in Appendix D, is in their comprehensiveness. The first only measures whether the organization had a member at the time the survey was completed, while the second includes those organizations and all others that had members between 1999 and 2002, whether or not they ‘currently’ had one.
Four characteristics of organizations that ‘currently’ had a member when the survey was completed were influential: the organization’s age, its community type (rural vs. urban), the size of its full-time staff, and the number of years it had been in the program. Older organizations are very slightly more likely to have had a member and urban-based organizations are 68 percent less likely to have had a member. Each additional staff member increased the odds by 38 percent that the organization had a member, while each additional year in the program increased ‘current’ participation odds by nearly 200 percent. This last variable—years in the AmeriCorps* VISTA program—shows that organizations that have participated longer are more likely to have members. This analysis held for the 1999 capacity score, which was insignificant in the model.
Capacity as a Fundamental Objective 30
For the second variable measuring AmeriCorps* VISTA member sponsorship, organization age was again significant. Of the other variables in the ‘current’ participation measure, none was significant. Instead, the 1999 capacity score, and two regional variables—those that indicate location in the Southeast or Central Atlantic regions—were significant. The odds of having had a member at least one year between 1999 and 2002 increased by five percent for each one point increase in the 1999 capacity score. For the regional variables, they both indicated that that these two regions were much more likely—more than 200 percent more likely—to have AmeriCorps* VISTA members than any other regions between 1999 and 2002.
There is a much larger percentage of AmeriCorps* VISTA program participants, or member sponsors, in the sample surveyed than in the general population of affiliates (37 percent versus 8.5 percent). This mismatch occurred intentionally in order to ensure an adequate sample size of program participants that could be compared to the national set of affiliates. If it were too small, the data could not be considered reliable or representative of the set of sponsors. The result is that very large numbers of both AmeriCorps* VISTA sponsors and non–sponsors (to have a representative comparative sample) are represented in the sample as a whole (Table 4). As was described earlier, 102 affiliates in the sample currently have or have had AmeriCorps* VISTA members in the past three years. Of these 102 affiliate program sponsors, 72 were current sponsors, meaning that they had members when they returned their surveys. Table 8 shows the distribution of length of program participation among all program sponsors in comparison to current non-sponsors (those that have not had a member in the past three years). The table shows that, at the beginning of 2002, six organizations had been program sponsors for one-half of one year, 20 have been in the program for two years, 26 for three years, etc. A few non–sponsors were program participants in 1999 or before; only four of these were represented in the sample. These affiliates were not included as sponsors because the study considered only data since 1999. Program participation among the affiliates ranges between zero and seven years. The average number of years as a sponsor is 2.6 years, whereas the median is higher at three years.
Table 8: Distribution of Years of Program Participation in Sample Years as AmeriCorps* VISTA Program Participant
0 0.5 1 1.5 2 2.5 3 3.5 4 5 6 7 Total Number of Affiliates Sponsors 0 6 16 4 20 2 26 2 9 11 4 2
Non-Sponsors 167 1 1 0 0 0 2 0 0 0 0 0 102171
Participation by affiliate size and age Neither charts nor tables are good ways of representing the data of affiliate age and size. Instead, the regression results were used to determine how AmeriCorps* VISTA program sponsorship varies by the age and size of an affiliate. The results are different for the two variables. The size of an affiliate, as measured by the total number of houses it has built, is not related to whether it has sponsored an AmeriCorps* VISTA member when various other variables are controlled for (location, age of the affiliate, staff size, etc.). The age of the affiliate, however, does matter. Younger affiliates are slightly less likely to
Capacity as a Fundamental Objective 31
participate in the AmeriCorps* VISTA program. This is understandable in that older affiliates are more likely to have a structure and staff that can support a full-time member. However, it is also potentially problematic—smaller affiliates typically are in much greater need of the help a member can provide to the organization. The results of the regressions are displayed in Tables D.1 and D.2 in Appendix D.
Participation by region AmeriCorps* VISTA sponsoring organizations are not distributed evenly across the regions; Table 9 displays the distribution. Nearly 26 percent of all affiliates with AmeriCorps* VISTA members are located in the Central Atlantic states, while only four percent are in the West. Further, many states do not have members serving in Habitat affiliates. These states are: Maryland and the District of Columbia in the Central Atlantic region, Indiana in Mid-America, Texas in the Middle States, Alaska, Idaho, Montana and New Mexico in the Mountain region, Wisconsin, Illinois, Iowa and North Dakota in the Midwest, Connecticut, Delaware, Maine, New Hampshire, Rhode Island and Vermont in the Northeast, and Hawaii in the West. Puerto Rico, the other location in the Southeast, does not have members in its affiliates, either. Sponsorship does vary year to year, however; for example, in late 2002 Indiana will start placing members in Habitat affiliates.
Table 9: Regional Distribution of Member Sponsors Region VISTA Count % of VISTA Affiliates Central Atlantic 26 25.5% Mid-America 16 15.7% Middle States 12 11.8% Mountain 10 9.8% Midwest 9 8.8% Northeast 8 7.8% Southeast 17 16.7% West 4 3.9% Total 102 100.0%
Explaining the regional differences is difficult; it is not due to the number of states in the region or population, or the number of affiliates. It could be due to regional knowledge of the program and age of affiliates. In general, the affiliates with the highest percentages of sponsorship—in the Southeast and Central Atlantic regions—are the oldest and most established. However, in the regression analysis, it was determined that the regional location of an affiliate does not have any bearing on whether that affiliate will sponsor an AmeriCorps* VISTA member, holding all other factors equal. This means that although there are great regional distributional variances, the variance is due to something other than region. Instead, the differences in participation across regions appear to be a result of differences in average affiliate age by region; in other words, some regions have higher participation levels because, on average, they have older affiliates. See Table D.2 for more detailed results regarding the role of region.
23 28 33 38 43 48 53 58 63 68 73 78 83 88 93
TotalCapacity Score
Num berofOrganizations
40
30
20
10
0
39 34 34
27
21 2221 19 18
10
15
2 4 6 1
Capacity as a Fundamental Objective 32
Part Five: Capacity Characteristics
This part of the report relays the analytic regression results of the sample data, focusing particularly on the role of AmeriCorps* VISTA members in capacity-building in their service organizations when controlling for the organizational and environmental factors. Total capacity will be discussed first, followed by sections on the five capacity dimensions—organizational, financial, networking, advocacy and programmatic. Finally, the results regarding the relationship between capacity and production will be presented. Looking ahead, Part Six will introduce the results from the interviews, while Part Seven will combine the information from both sets of data to present recommendations and conclusions. To see more detailed regression results, including tables of the models and discussion of the variables that were not significant, please see Appendix D. Appendix C similarly covers some of the basic descriptive statistics of all of the capacity variables created and analyzed.
Total Capacity Score
First the distribution of the total capacity scores of the sample will be presented, along with a brief discussion of the percent capacity scores. The regression analysis results follow. Table 10 displays the variable relationships in the final model.
Figure2:N um berofO rganizationsby
TotalCapacity Score
Distribution of total capacity scores in sample The total capacity score, as described earlier, incorporates all of the various components of each of the capacity dimensions. A score of 100 was the highest possible. Figure 2 displays the frequencies of scores, grouped in scores of 5 (that is, a score falling between
21 and 25 is displayed as “23”). The highest score in the sample was 91 and the lowest was 22. Both the average and median values of the sample were 57, indicating that the distribution is even between high and low scores. For detailed descriptive data on the distributions of the capacity variables, see Table C.4 in Appendix C. Of the 48 organizations with plans to build more than ten houses in 2002 (recall Table 4 in the report), none achieved a total capacity score equal to or above the recommended score of 93.5 for producers in this range. This indicates that none of the large affiliates is at full capacity according to the scoring system used in this study.
Figure 3 organizes the number of organizations by the percent of the total capacity score believed necessary for successfully achieving the organization’s construction goal in 2002. As described in Part Three, an organization that has this recommended capacity score for its construction level will have a percent score value of at least 1.0, which stands for 100 percent. If an organization has a percent score of 0.75 (75 percent), for example, it falls into the 0.7 grouping on the chart. The majority of affiliates, 152, have capacity levels below the recommended capacity score for their size, while 43 affiliates have a capacity level of at least 1.5 times the recommended amount. Only one affiliate was measured as having less than 50 percent of its recommended score.
Why do over half of the very small organizations have capacity levels above that recommended in the literature and by Habitat? There are three possible reasons for this. First, smaller organizations are younger than larger organizations (although older organizations may also be small), as shown in Figure 1. Because they are newer, these smaller organizations have the advantage of learning from the collective experience of Habitat during the past twenty-five years. There is more knowledge available through HFHI and state and regional offices regarding best practices, organizational needs and planning, structure, etc., so small organizations are able to begin work in better positions than older ones did. As graphed in Figure C.1, newer organizations also typically have higher percent capacity scores than do older organizations. The problem is that it is impossible to know at what level older organizations began.
Capacity as a Fundamental Objective 34
A second possible explanation is that once organizations are building 5 to 9 houses per year, construction takes precedence and making time to improve internal operations, while more critical, is more difficult. Staff members have less time to devote to non-construction activities, which happen to be critical aspects of capacity. One other possible reason is perhaps a minimum level of capacity exists that an organization needs to function, and that level falls above the expected capacity levels of the study. If this is the case, however, fewer of the small organizations should fall below 1.0. There is no evidence from this study for any of the three hypotheses, and all need further research. It is only evident that affiliates building four or fewer houses are likely to exceed their expected and recommended capacity levels.
Regression analysis results of the total capacity score
Table 10: Model Specification of Total Capacity Score
Variable Strength of Relationship to
Total Capacity Estimated Size
of Impact Had a VISTA member in past three years High 3.61*
Organization age (in days) High 0.001* Capacity score in 1999 Very high 0.48****
Received tech assistance in past three years Very high 4.03** Number of full-time staff Very high 1.77****
Has dedicated office space Very high 7.44**** Community median income Very high 0.0001***
The results of the analysis are presented in Table 10. The strength of the relationship tells the reader to what degree you can trust that the relationship actually exists in the set of national affiliates. It is determined by the level of significance specified in the regression results; if it is at least 0.01 for a given variable, the strength of the relationship is very high. At the 0.01 level of significance, one can conclude that the possibility is very small (a one percent chance) that this relationship does not exist in the entire set of domestic affiliates. The “estimated size of impact” is a variable’s correlation coefficient in the model. It indicates how much the total capacity score will increase for each one unit increase in the variable. For example, for each one point increase in the 1999 capacity score, the total capacity score will increase by 0.46 on average, taking the other variables in the model into account. Each of the variables in the table is discussed in the following paragraphs. AmeriCorps* VISTA member presence According to the regression analysis on the sampled affiliates (Table D.1), organizations that had AmeriCorps* VISTA members serving with them in the past three years had total capacity scores nearly four points higher than organizations that did not, holding for the effects of the other factors in the model. This is a significant and meaningful impact. The inclusion of a variable measuring the 1999 capacity score ensures that previous
100
0
20
40
60
80
TotalCapacity Score
0.0 5.0 10.0 15.0 20.0
YearsSinceAffiliation
0
Capacity as a Fundamental Objective 35
levels of capacity have been taken into account. This is critical because one of the main arguments against finding that AmeriCorps* VISTA members have a positive impact on capacity levels is that organizations with higher levels may be more likely to have members in the first place. (In other words, it is the chicken versus the egg argument.) Further, staff size and technical assistance were also considered, two aspects of organizations related to the purpose and function of the AmeriCorps* VISTA program. All of these things point to the member having a significant independent relationship with capacity. Causation is not provable, but it is supported. This conclusion will be further supported by the results of the interviews. Organization age The age of the organization is also significantly related to the organization’s overall capacity level. Table 10 conveys that in the regression analysis, the strength of the relationship between these two variables is high. The estimated impact of organization age on the total capacity score is such that for a one year increase in affiliate age, the capacity score will increase on average by 0.365. On other words, an affiliate that is ten years older than another will have a capacity score that is generally between three and four points higher. Given that the oldest affiliates are only 24 years old, age contributes no more than about 10 points to capacity scores, or 10 percent of the possible score. Figure 4 provides a graphical representation of the relationship; the left-to-right upward pattern shows a gradual increase in capacity as the years since affiliation become greater. At the same time however, the scatter of the data is wide, indicating that organizations vary to a high widely in their levels of capacity even when they were affiliated the same year. This means that the relationship is imperfect—not every older organization will have a higher score than every other younger organization.
Figure4:TotalCapacity Scoreby Years SinceA ffiliation
25.
Organization size The relationship between capacity level and an organization’s size is insignificant when holding for the effects of the other factors. This effect was unexpected. Figure 5 shows that as production increases, so does the capacity score. None of the largest organizations (those with over 100 houses built since affiliation) have scores less than 60, while some
Capacity as a Fundamental Objective 36
of the smallest have scores near 20 (the total range being 22 to 91). This disparity suggests that, at least to some small degree, organization size matters to an organization’s capacity level. However, the figure also shows that some smaller organizations have scores as high as those as the largest—you do not have to be large to have a high score (although you do have to be small to have a low score). Hence, the graph supports the weak relationship between the two variables that appeared in the statistical analysis. Why, however, is the relationship weak? 1999 Capacity score The estimated impact of this variable on the total capacity score is nearly 0.5; in other words, holding for the other factors, a one point increase in the 1999 capacity score equates to nearly a 0.5 increase in the total capacity score (Table 10). For example, an organization with a 1999 capacity score of 40 will have, on average, a total capacity score five points higher than an organization with a 1999 score of 30. In other words, future capacity is partly dependent on the level of capacity now. The 1999 capacity scores ranged from zero to 45 (with a possible high of 49 points); both the average and median values were 27 (Table C.4). Organizations with scores of zero were those that were not yet affiliated with HFHI in 1999 (they did not exist as organizations at the time).
Again, this variable is important to include in the analysis because doing so rules out variations in score among organizations that are based on different capacity levels in the past. For example, if this factor were not considered, it would be possible to argue that the current number of full-time staff does not really matter because staff size is in part determined by the capacity of the organization in the past. When former capacity levels are included in the analysis, it is possible to say unequivocally that the other variables (such as staff size) have independent and significant influence. Technical assistance The survey asked whether organizations had received any technical assistance in the past three years that was not provided to them by HFHI. A total of 153 organizations responded that they had received some (56 percent). Table 10 shows that these organizations had capacity scores four points higher on average than those that did not receive any technical assistance. This result makes sense; it is thus reasonable to conclude that organizations receiving technical assistance have higher capacity scores. Number of full-time staff This factor is very important to capacity in organizations. First, it has a highly significant impact. The analysis results in Table 10 indicate that, holding for the effects of the other variables, as the full-time staff size increases by one, the capacity score increases by 1.7. This means that for each additional staff member, the capacity score increases by two percent of the total possible score. The average number of staff persons per organization is 1.14, while the median is zero—more than half of sampled affiliates (149) have no full-time staff persons. Of these, 53 have part-time staff members instead (this data is shown in Table C.2). The impact of part-time staff was not measured in this analysis. Office space When affiliates are new or small, it can be difficult to find and/or afford dedicated office space outside of a board member’s home from which the organization’s daily work can be done. This is especially true if there are no staff members. However, having dedicated space typically means having space for staff and volunteers, a place to hold
Capacity as a Fundamental Objective 37
meetings and complete the non-construction work; it means having an address, where partner families (current and potential) can get information and donors can learn more about the organization; it offers a permanent place to store documents, and so forth. This “office” factor was included in the analysis to measure the impact of having dedicated work space and its perceived benefits. It proved highly significant, even holding for full-time staff and the age and size of the affiliate (all of which are related to having an office). As shown in Table 10, organizations with dedicated office work space have, on average, a total capacity score that is six and a half points higher than organizations that do not. Community characteristics Several community characteristics were considered as potentially important to the level of capacity of an organization: the organization’s regional location, its size, its median income and the number of churches in the area. Only one of these proved to be significant: the median income of the community served. For each $10,000 increase in area median income, the capacity score of an affiliate increases on average by 1.2 points (Table 10). The greatest impact of income on total capacity occurs in the poorest communities (with median incomes under $10,000), which have, on average, capacity scores about eight points lower than those in the richest communities (with median incomes around $80,000).
Section summary To summarize the above data presentation, an organization’s score on the total capacity index is influenced by several factors, each of which was significant at the 0.05 level:
° Having had an AmeriCorps* VISTA member in the past three years; ° The 1999 capacity score of the organization; ° The age of the affiliate; ° Having received technical assistance in the past three years; ° The number of full-time staff members; ° Having dedicated office space; and ° The median income of the service area.
Capacity Dimensions
In this section, the factors influencing the five capacity dimensions (organizational, financial, networking, advocacy and programmatic) are discussed. Again, the factors fall into two general types, organizational and community. Each of the five dimensions proved to have a dramatically different set of factors that has an impact on its score. However, as with the total capacity analysis, the main issue studied was whether having an AmeriCorps* VISTA member has an impact on the level of capacity in each of the dimensions. Each factor is presented below, noting on which dimensions it has an impact, if any. The tables of the models listing the significant factors of each dimension, along with more discussion of the models themselves, are in Appendix D (Tables D.4 to D.8). Special attention is given to AmeriCorps* VISTA activities associated with each dimension (such as fundraising work and financial capacity). Additionally, Appendix C
Capacity as a Fundamental Objective 38
covers the dimensions’ descriptive statistics and discusses the properties of three of the most important capacity components (having: a strategic plan, an executive director and enough land).
Regression analysis results of the capacity dimensions
AmeriCorps* VISTA presence Having an AmeriCorps* VISTA member during the past three years in the affiliate was significantly correlated only with one of the five capacity dimensions, organizational capacity. For the sample, the impact was such that an organization with a member had on average, holding for the other factors in the model, a 2.2 higher capacity score than organizations without members. The number of years in the program did not have a significant relationship. More relevant to the analysis, however, was a variable that accounted for a member’s work in the area of volunteer management. Work that is considered part of volunteer management includes training, supervising, and recruiting volunteers; running work camps; coordinating special builds and recognition events; and being involved in university or high school campus relations. When members were engaged in such work in their affiliates, those affiliates had higher capacity scores of 2.7 points (see Table D.4). When both the volunteer management work variable and the member presence variable were included, only the volunteer management work one was significant, indicating that having a member working in this area is more important than just having a member.
Of the seven areas of work, none besides volunteer management proved significant, even when related to the capacity dimension. Table 11 at the end of this section lists the seven areas of work. The goal of analyzing the impact of the area in which the member is working was to test the notion that an organization that has a member working in one of the five capacity dimensions would have a higher capacity score in that area. Except for volunteer management, this proved not to be the case. For example, when looking at work related to the financial capacity dimension, two types were considered: fundraising and other financial activities (such as accounting and budgeting). Neither of these had a significant relationship with financial capacity. Similarly, when evaluating programmatic capacity, a variable measuring members’ work in construction activities was included. It was not significant, either. Finally, although significant in the model of organizational capacity, when the volunteer management work variable was included in the models of the other capacity dimensions, it no longer had an impact.
There are four possible explanations for the lack of significant relationships between the four dimensions of capacity other than organizational. First, and most likely, it is possible that AmeriCorps* VISTA members are not influencing capacity in these other dimensions. Because of the nature of capacity in these areas, members’ work may not directly improve the ability of their organizations to achieve their goals in them. Programmatic capacity illustrates this; the importance of land to affiliates accounts for 40 percent of the possible points in this dimension. Members rarely are involved in land acquisition; thus, their impact on this dimension is severely limited. Given that the 100 components were carefully chosen and scored based on the literature’s conclusions of what factors are most important for organization success, it is possible to conclude that staff and board members, rather than AmeriCorps* VISTA members, are involved in the completion of important factors that fall within the other four dimensions. Most
Capacity as a Fundamental Objective 39
organizations, for example, have accounting staff or volunteers, site selection committees, speakers’ boards (to present Habitat information to local groups), etc., to meet their critical needs in the capacity areas of finance, programs and networking. AmeriCorps* VISTA members usually do not have the experience or resources to meet these critical needs, while they do have the ability to make a difference in volunteer management.
Three other possible explanations also need to be mentioned. The first is that the capacity index does not include the full range of capacity components in these four areas. This would be especially problematic for the immediate question of member impact if the components not included are some for which members have greater relevance. One example of this, within the networking capacity dimension, is having a bimonthly or quarterly newsletter. While not recommended as a success factor in the literature, many practitioners highlight its value in maintaining good contact with community members. Because this is one activity in which AmeriCorps* VISTA members may be involved, if it were included as a component of networking capacity, their impact on this dimension could be greater.
Alternatively, the lack of significance could be related to the manner in which the index was constructed. Organizational capacity has a possible score of 55 points, while all of the other capacity dimensions have possible total scores of less than twenty. The smaller point ranges may limit the visibility of members’ impact in the model. This can best be explained by another example. The impact of having an AmeriCorps* VISTA member on organizational capacity was determined to be an increase of 2.2 points. This equates to a four percent increase in that capacity dimension. If one were to assume that a similar percentage increase would occur for the other dimensions, as well, we would expect to see point increases of 0.72 out of 18 points for financial capacity, 0.48 out of 12 points for networking capacity, 0.2 out of 5 points for advocacy capacity, and 0.4 out of 10 points for programmatic capacity. The modeling procedure may simply not pick up these small changes.
Finally, although this is the least likely explanation, it is possible that the number of members working in volunteer management is so much greater than in the other work areas that its impact appears in the data. More members work in this area than any other, as shown in Table 11, but the amount is not so much higher than some of the others to likely account for the difference in impact.
Table 11: Member Activity Participation Activity Area Count Construction 29 Families 35 Finances 14 Fundraising 50 Office Development 37 Public Relations 59 Volunteer Management 68
Capacity as a Fundamental Objective 40
Organization size Even though it was unrelated to the total capacity score, the variable measuring organization size was significantly related to the advocacy and financial dimensions of capacity. The importance of affiliate size to advocacy capacity can be clearly explained. HFHI’s capacity building manual (2000) recommends that once organizations have reached the stage of “Neighborhood Builder”—building between ten and twenty houses per year—they should be involved with other community groups to address the mission of eliminating poverty housing in the larger society. This is the essence of advocacy work, and is measured in the advocacy capacity score. Because advocacy activities have been emphasized in the past for affiliates that are building a large number of houses, it should be expected that larger affiliates are doing more advocacy work. The model supports such a conclusion. Nonetheless, the impact of size is numerically small; according to the data, its impact is such that on average and holding the other variables constant, an organization that has built 200 houses will have only a 0.34 higher advocacy capacity score than one that has built 100 houses (Table D.7). This simply means that size does not account for much of the difference in advocacy scores between organizations.
Organization size is also significantly related to financial capacity—but not in the expected direction. According to the model, as the number of houses built increases by one, the financial capacity score decreases, on average, by 0.01 (Table D.5). This is a small amount, and suggests that a meaningful differential will exist only between very small and very large producers. To illustrate, it would mean that the very largest organizations (having built more than 200 houses) will have financial capacity scores 2 points lower on average (only 11% of the possible total score) than organizations that have built only ten houses. The negative impact of size on score could be a reflection of a possible reluctance of larger organizations to share their financial budget information (which contributes a possible three points to the score). On the other hand, it could otherwise indicate that larger organizations, which have more staff and administrative costs, have a more difficult time keeping these at a low percentage of total expenditures (the measure of which contributed two points). This deserves further research. Organization age Also insignificant to the total capacity score, an organization’s age was significant in the models of the networking and programmatic dimensions of capacity (Tables D.6 and D.8). For networking capacity, the model places the impact of the relationship on the score at 0.11 for each one year increase in age; for programmatic capacity, the impact on the score is 0.08 for each one year increase in age. The significance of age to networking capacity may be clearly explained: as organizations get older, they make more contacts and have greater community visibility, increasing their networking abilities. The explanation for the significance of organization age to programmatic capacity is less clear; two different reasons seem possible. First, it would be easy to say that older affiliates simply have more experience. However, this argument would support the significance of affiliate size also, but that did not occur. Secondly, one could follow the argument posed here for networking capacity: because older organizations are better known, they more easily get volunteers and have better land opportunities. This too is
Capacity as a Fundamental Objective 41
weak: one might then conclude that networking capacity should be significantly related to programmatic capacity, and it is not. It appears that more research needs to be done to determine why organization age is related to programmatic success factors, especially since it was not related to the remaining three capacity dimensions. Number of full-time staff The number of full-time staff members was related to several of the capacity dimensions: organizational, financial and programmatic. For each additional staff member that an organization had, its organizational capacity score rose by 0.72, its financial capacity score rose by 0.38 points and its programmatic score by 0.21 points. The percentage increases of these scores, respectively, were 1.3 percent, 2.1 percent and 2.1 percent. The impact of staff is consistent to that of the overall capacity score for all but the advocacy and networking capacity dimensions. Again, more research needs to be done to determine the reasons for the differential influence among the dimensions. See Tables D.4, D.5 and D.8 for more detail on these relationships. 1999 Capacity score Only with the organizational capacity dimension does the 1999 capacity score have a significant relationship (Table D.4). The lack of significance to the other dimensions is probably due to the construction of the measure of the 1999 capacity index: the factors considered are largely those that fall under the dimension of organizational capacity and not those of the others. An increase of one point in the 1999 capacity score corresponds to an increase of 0.30 points in the score for organizational capacity, meaning that an affiliate that had a ten-point higher 1999 capacity score than another affiliate would be expected to have a higher score by three on the organizational capacity dimension. As with total capacity, this result indicates that future organizational capacity is partly dependent on the level of capacity now. Technical assistance Having received technical assistance in the past three years was relevant to the dimensions of organizational capacity and programmatic capacity (Table D.4). It was significant at a level of 0.05 for organizational capacity, and at a level of 0.1 for programmatic capacity. A significance of 0.1 is considered relatively weak, though possible. In this instance, it is better not to throw out a possible relationship than to exclude those that are potentially weak. In regards to the other dimensions, it is possible to receive technical assistance in areas that would be considered related to them (particularly in the areas of fundraising, for example). However, the technical assistance variable did not prove to have an impact on them. This insignificance could again be a result of the lower possible total scores of the other dimensions, limiting the visible impact of this variable in those models. The estimated value of its impact on the organizational capacity dimension’s score was 1.72, or three percent. For programmatic capacity, the impact of technical assistance was modeled at 0.53, or 5.3 percent. Median income of community The only dimension to be revealed as having a relationship with community median income was financial capacity. Logically, the financial capacity dimension should be dependent on the median income of the service area of the organization because it is easier to raise money in wealthier areas. The analysis of this dimension supports this intuitive conclusion. Affiliates in areas with higher median incomes generally have
Capacity as a Fundamental Objective 42
higher capacity scores. The model suggests that the financial capacity point increase is 0.26 points for each $10,000 increase in income (Table D.5). This is a small number, but may highlight the challenges faced by affiliates in poorer communities—they could have a more difficult time building a financial base and maintaining low overhead. This estimated impact is most meaningful when comparing the richest communities to the poorest: with a differential of $70,000 in medial income, the richest communities can be expected to have financial capacity scores nearly two points higher, assuming all other factors are equal, a score that is about ten percent better. Other factors Two other factors—size of the community (or location) and type of office—were significant vis-à-vis their relationships to one of the capacity dimensions. Both of these factors were only important in the analysis of the dimension of networking capacity (Table D.6). The significance of these factors is somewhat peculiar given their lack of importance for the other capacity dimensions. The impact of community type is such that affiliates in urban areas (cities and suburbs) have higher networking capacity than affiliates in rural locales, even holding for the age of the organization and the other effects. This is perhaps because larger communities are more likely to have better opportunities to work with other organizations (an organization was accorded five points for being a member of a community network). Even so, the point value of the impact is small at 0.88 per one point increase in the location score (the scoring of this variable is shared in Table C.1 in Appendix C).
The impact of whether the organization has dedicated office space is large: an organization with an established office has a 1.6 higher networking capacity score on average than those that do not, accounting for 13.3 percent of the total score for networking capacity. An explanation for the significance of type of office is not as forthcoming, however, especially given the lack of significance of other variables that could explain it (size of the organization or staff, for instance) and its lack of relationship to the other capacity dimensions. More research needs to be done to explain this. Interrelationships among the capacity dimensions As Glickman and Servon write (1998, p. 505), the five capacity dimensions are interrelated such that strength or weakness in one will usually carry over to another. The interrelated nature of the dimensions of capacity is born out in the analysis, although none has all of the other four in its model—each is only influenced by two or three of the others. Interestingly, the dimension of programmatic capacity is unrelated to any of the other capacity dimensions. Again, this lack of impact could be due to the role ‘availability of land’ plays in the scoring of the dimension—it is largely unrelated to the other dimensions (although one could argue that having enough land is highly dependent on having enough funding). In Table 12, the dimensions are listed beside those others that were significant in their regression analyses. It is not known why the differences among the models exist.
Section summary To summarize, the score of each dimension was influenced by the following factors:
° organizational: having an AmeriCorps* VISTA member working in volunteer management, the 1999 capacity score, the number of full-time staff, having received technical assistance, and the scores of the financial, networking and advocacy capacity dimensions;
° financial: organization size, the 1999 capacity score, the number of full-time staff, the median income of the area, and the score of the organizational and networking capacity dimensions;
° networking: organization age, the size of the community, its type of office, and the scores of the organizational, financial and advocacy capacity dimensions;
° advocacy: organization size, and the scores of the organizational and networking capacity dimensions; and
° programmatic: organization age, having received technical assistance, and the number of full-time staff.
Capacity and Production
The relationship between these two concepts is at the core of the discussion of capacity. If capacity is the ability of an organization to do what it wants to do, then one hopes that ability is related to output, or there is no reason to study it and improve it. In order to analyze the relationship, a regression model was created comparing twenty-two factors— one of which was the total capacity score—to a production variable, the number of houses planned to be built in 2002. Because these houses have yet to be completed, using ‘houses planned’ is an imperfect measure of production. However, because the planning for each house must be started months ahead of time (the family must be chosen, the land prepared and the materials, volunteers and money found and scheduled), an affiliate knows early what it wants to do, can do and will do. This preparation makes the planned housing a reasonable production goal to use for the purposes of this study. A second reason this measure is suitable for use is related to the timing of the study. Because organizations’ capacity was measured after the 2001 houses were completed, it would not be appropriate to compare capacity to the houses built in 2001. This is due to the reality that for a factor to cause something else to happen, it must occur or exist first. Thus,
Capacity as a Fundamental Objective 44
capacity must come before production, and this study does not measure the capacity that existed in each organization in early 2001. The full results, including a list of all of the factors initially considered and a table detailing the significant variables, are included in Appendix D at Table D.9.
Capacity as measured by the total capacity index is significantly related to production levels, holding for the effects of the other variables in the model. In other words, organizations with higher capacity scores build more houses. This conclusion is promising, and supports others’ work in the area (note LaMore, unpublished, as one example). The model indicates that the impact is small, such that to increase production by one house in a year, the capacity score will generally have to have a corresponding increase of more than 18 points. The total capacity score has a limit of 100, however, implying that the relationship between capacity and production is not the same at low production levels as at high ones. When increasing the number of houses built from two to three, for example, capacity may need to increase by a magnitude of 18 points. This cannot be the case when increasing production from 30 to 31 or 69 to 70. In other words, the number of houses built is not highly dependent on the capacity level of the organization, although it is related to it. This is a critical area of research in understanding the capacity of organizations and deserves greater attention than was possible in this study.
Capacity as a Fundamental Objective 45
Part Six: Interview Results
Eighteen follow-up interviews were held with affiliate executive directors (and one staff AmeriCorps* VISTA supervisor). This amounted to 13 percent of the full AmeriCorps* VISTA sponsor population (as of January 2001) and 16 percent of all survey respondents. After choosing twenty-five organizations randomly to interview, the final pool was chosen with consideration of location, comments on the AmeriCorps* VISTA activity form, and a noted willingness to contribute further. The purpose of these interviews was to determine a) how affiliate leadership perceived how their AmeriCorps* VISTA members have benefited or impaired the work of the organization and b) how they define capacity. While the interviews were not numerous enough to make significant conclusions, their responses were revealing. The following questions were asked in this order:
1. I noted on your survey that you have one (or more) VISTA member(s) working in the areas of ______ and ______. Why did you choose these areas for them to work?
2. What, if anything, is he or she / are they doing that was not being done before they arrived?
3. If you did not have a VISTA member, would this work still not be done, or would someone else be directing these activities? Who would be doing it?
4. Considering the housing production you have planned for this year, if you did not now have a VISTA member in your organization, how would the organization meets its production goals?
5. Would you say the VISTA member has contributed to increased housing production? How? (Probe: Would you have built as many houses this year without the VISTA’s work? Why or why not?)
6. How do you anticipate the work will continue once the VISTA leaves? 7. In what ways has the organization benefited from having a VISTA? Do you
have a specific example? 8. Similarly, in what ways have VISTA members or participation in the VISTA
program been less than helpful to the organization? Have there been problems you have had to resolve?
9. What comes to mind when you hear the word capacity building? 10. How would you define capacity building? Can you give me an example of a
capacity-building activity? 11. In your opinion, how has/have your VISTA member(s) increased the ability of
the organization to achieve its mission? Several things became evident out of these discussions. First, the executive
directors’ definitions of capacity have some common themes. Second, eleven of the eighteen interviewees believed that without the work of the AmeriCorps* VISTA members, their organizations would not have built as many houses. Third, the members
Capacity as a Fundamental Objective 46
were doing work that was not being done (or not being done adequately and effectively) before their arrival. Fourth, one of the biggest problems organization directors face with participation in the AmeriCorps* VISTA program is the replacement of the member once the term is up (but the work must continue). Finally, the problems organizations have faced with members are both personal and programmatic.
Definitions of Capacity Building
The following statements were given in response to question 10, “How would you define capacity building?”
a. Going above and beyond what was done before—instituting new initiatives to do so.
b. Making the organization more efficient for production purposes. c. Building more houses and continuing to do so. d. Increasing the number of houses built and eliminating substandard housing:
helping more people. e. The opportunity to build more houses and expanding programs to do so. f. Finding ways to increase house production. g. Increase housing production by one house each year. h. The ability to do more of what we are now doing and doing it better—to have
more volunteers, to effectively work with more volunteers, to increase corporate sponsors and to improve board development.
i. Increasing our effectiveness as an organization to support building more homes. j. Maximizing what you are doing to produce as much as possible. k. Building at capacity is doing all we possibly can. l. Increasing organizational strength so our mission can be accomplished at a
higher level. m. The ability to manage volunteers effectively. n. Building up needs in office, property, etc., and having things in place to help
build more houses. o. Building as many houses as we can. p. Building as many houses as possible with as many volunteers, families,
community members, churches, etc., as possible. q. Increasing funds and resources that assist the organization to provide more
program services. r. Defining a realistic goal and doing everything the organization can to reach it. Two commonalties are evident among these various definitions: first, the goal is to
build houses, and second, to do that best, something must be increased or improved. These are the two key elements of capacity building: increasing the ability of the organization to achieve its mission. The directors whose comments did not include these two elements have perhaps equated capacity with output. Directors’ references to aspects of their organizations that need growth or improvement indicate a basic understanding of capacity: if they have this or that, they believe they will achieve their mission for the
Capacity as a Fundamental Objective 47
year. The aspects mentioned are organizational effectiveness, program expansion, board development, volunteer recruitment and management, office management, property, community involvement, church support, funds and resources, and goal setting. Every capacity dimension is represented except advocacy.
Even with these commonalties, there was not a widespread understanding among the directors of what is required to best achieve their organizations’ goals—most were quite vague while only three mentioned more than one aspect. Their comments may be simply a reflection of the challenges the organization was facing at the time. As one example, the director who referred to increasing funds and resources as being the key component of capacity building also noted that historically they have had to work diligently to raise funds in many different ways because of the high level of poverty in their service area. There are others, also. The director who said it was necessary to increase the organization’s strength noted that her concerns were with long-term staffing and financing. One organization has historically had a difficult time recruiting volunteers; its director noted effective volunteer management as the key ability in capacity building. There is certainly not a one-to-one relationship between problems faced and organizational capacity needs, but the correspondence that is present reveals that the interviewees relate capacity building to solving existing problems within the organization. This is an important point: while most of the literature focuses on effectiveness, practitioners find themselves addressing current organizational issues. They are less concerned, it seems, with reaching an abstract organization ideal than improving daily functioning. This may be capacity building for them.
One important question to ask is whether directors are using their AmeriCorps* VISTA members in these key capacity-building areas. This is more difficult to answer. Only six directors mentioned specific activities that an organization must do or improve in order to build capacity. Of these, all but one (who mentioned the aspect of goal setting) has had members working in that area. Among all 18 organizations, however, nothing stands out as marking one set of respondents as different from the others. Members are working in all areas regardless of their directors’ grasp of the concept of capacity building. Another question considers whether those respondents that were more specific in their definitions are more or less likely to say that their members have increased housing production. In other words, what is the relationship between capacity definition specificity and perceived AmeriCorps* VISTA impact? In Table 13, a high-specificity response (a ‘2’) was operationalized as having detailed something specific to do within the organization (such as board development), while medium specificity differed from low specificity by a reference to increasing something beyond housing production. It can be argued that low-specificity answers tend to equate capacity with production.
TABLE 13: The relationship between directors’ understanding of capacity and their perception of the impact of their AmeriCorps* VISTA members
Six respondents gave non-specific definitions of capacity when asked (see responses c, d, f, g, k and o on page 49). Table 13 indicates that five of these six believed that their AmeriCorps* VISTA members have made a significant contribution to housing production (as asked in questions 4 and 5). Only one of four of those with very specific definitions of capacity building said that their members have contributed significantly (responses h, m, n and q). Additionally, five of eight semi-specific respondents also said that their members contributed to housing production. One interpretation of these results is that those with a better understanding of capacity building perceive that their members are not directly participating in it. The potential problem with this claim is that the interview asked about members’ impact on production, and not capacity. This explanation would require equating capacity building with production, which their definitions (those that are highly specific) do not appear to do. Even so, it can be argued that production is inherent in the respondents’ definitions of capacity building: it is the goal of every action taken by every actor with respect to the organization.
A second interpretation is possible. One could argue that directors with a better understanding of capacity building are also more likely to understand better the intended role of the member, which is indirect service. While question 5 was really intended to explore the directors’ perceptions of the value of the program to their organizations, perhaps instead it measured the directors’ conception of the role of the AmeriCorps* VISTA member. Perhaps the work of the members in these organizations was not intended to be directly related to production because not all organizational growth directly increases the number of houses built. This realization then places a limit on the direct relationship that can be identified between improvements in capacity and production. There is no direct evidence, however, that the respondents are equating their members’ work to capacity building or even that they consciously intended that the members were to be involved in organizational growth. Responses to other questions in the interviews, however, reveal that staff do see a connection between AmeriCorps* VISTA members and growth in their organizations and production.
AmeriCorps* VISTA Contribution
If one were to define capacity in terms of outcome (or the production of houses), one could conclude from these interviews that AmeriCorps* VISTA members appear to be in the business of capacity building. As stated above, eleven of the eighteen directors believed that their members played a critical role in their housing production, stating that they would not have built as many houses as they did without the members’ contributions. Two others mentioned that their members allowed work to be done more quickly, noting that construction and/or the houses’ transfer to families would have happened more slowly without the work of their members. Member contributions also included increased funding, more volunteers, better family relations, more sponsored houses and expanded operations. All of these things grew the organization in one or more activities. For the smaller organizations especially, the biggest benefit appeared to be having another staff person with whom the day-to-day work could be divided and have it done effectively.
Capacity as a Fundamental Objective 49
The five directors who responded that they did not believe that their AmeriCorps* VISTA members’ work contributed directly to housing production gave three reasons for this. The first was simply that the member was new and had not significantly contributed to the organization’s work up until that time. The second, given by two respondents, was that other factors limited production, such as land or the number of applicants. Because the member was not working in these areas, their work was perceived to be secondary in realizing their housing goals. The third reason was that their work was more foundational in nature. For example, several were involved in developing the organizational structure. Others were building new programs that, while fulfilling the main mission of the organizations—poverty reduction—they were not critical to housing construction. Of these programs, the most often mentioned was family support programs that empowered the homeowners. These latter two answers seem to support the idea that these respondents understand well the indirect function of the AmeriCorps* VISTA member in their organizations.
AmeriCorps* VISTA Work
Questions 1 and 2 were asked in order to determine whether AmeriCorps* VISTA members were fulfilling perceived needs in the affiliate. Exactly half the directors replied that the projects and programs on which the members were working were entirely new. These new areas involved primarily two areas: family support and the restore (thrift store). Three organizations had set their members to creating and maintaining homeowner development programs that included such things as housing maintenance training, budgeting workshops and general education, and mentoring (in one organization, workshops were offered to everyone in the community). Similarly, one member was fully involved with the creation of a restore, while at least two others were managing restores and/or recruiting volunteers for them.
The other half noted that their members were working in areas in which the work was only haphazardly or minimally completed before their arrival. Some of these affiliates had individual volunteers or committees attempting to do the work; in others, the executive director was trying to coordinate it. One director noted that he had to “juggle” volunteer coordination with his other duties. Volunteer coordination was commonly considered a secondary aspect until the member arrived to structure the program. Other improvements have been realized in volunteer and community relations, volunteer recognition and hospitality, and program efficiency and systemization. It was fully apparent that in all areas, members were substantially contributing to their organizations (although some have had previous experiences where this was not so). Additionally, most said that without the member, the work would not ever have been done in the first place. Their work, whether it is completely new or addressing a historically weak area, is meeting definite needs of their organizations.
AmeriCorps* VISTA Replacement
When asked how they anticipated the AmeriCorps* VISTA members’ work would continue once their terms were completed, most of the 18 directors responded that they were not sure what they would do. Eight hoped that a new individual volunteer or a
Capacity as a Fundamental Objective 50
committee would take over the work. Two of these said they were applying for new members, one said they may be able to hire someone, while two others indicated that without a volunteer, the current staff would have to add the work to their own. Three other directors anticipated that taking on the former member’s work by themselves would be their only option. The directors readily admitted this was their least favorite option, but were unsure what else could be done. Five suggested that the increased work load would require hiring additional staff to maintain it. The remaining two had not seriously considered what they would do at the time of the interview. One director whose member had already left indicated that the committee that replaced her is not recruiting and coordinating volunteers as effectively. Another had already hired the member to continue the work, while a third had added work to current staff. There does not seem to be a ready solution to this problem—not one director sounded certain that it would be resolved easily. Interestingly, not one mentioned that the member was ensuring continuity by developing a replacement coordinator.
Working to replace oneself is one of the critical duties of the AmeriCorps* VISTA member, yet one of the most neglected. Members are expected by AmeriCorps* VISTA to help establish a substitute that will coordinate the program when the contract is completed. Because it takes time away from the immediate daily work needs, it typically does not receive much attention. Yet it is apparent from these interviews that, especially as budgets tighten, the member needs to develop some means by which the affiliate can continue the work when they leave. This duty, however, is difficult when there is a multi-year contract and a member is at the start or in the middle of it. Because members assume that another member will follow, there is no perceived need to start training and recruiting for a non-member to take over the position. It seems that this is an incorrect assumption given the risk of potential problems. Typically, there are gaps between members’ service dates, members may not successfully match an organization resulting in early termination or the program may grow beyond the ability of one individual. As this data shows, it is prudent that even the first member in a multi-year contract to begin to build bridges that will result in filling the position once the contract ends for any reason.
Other AmeriCorps* VISTA Problems
Of the eighteen respondents, thirteen (72 percent) responded affirmatively to question 8, which asked whether they had experienced any problems while participating in the AmeriCorps* VISTA program. Of these, seven said that the problem had to do with the persons themselves, three said their problems were programmatic and three others said theirs involved both the persons and the program. Five organizations asked members to leave before their terms were finished; two of which each had two members leave early. Of the personal problems experienced, two directors mentioned that the members were unqualified, another noted a member’s conflict with the religious aspect of Habitat for Humanity, one mentioned she had a member who had stolen from the organization, and another said that the member, who was from the “old guard,” did not share the vision of growth held by the board and the executive director. They noted that there was little to be done in advance with this type of problem, except that perhaps better interviewing and
Capacity as a Fundamental Objective 51
screening might help to distinguish between those who could really help their organizations and those who could hurt them.
The other set of problems perceived by affiliate directors—six of them—was with the AmeriCorps* VISTA program itself. These problems tended to be much more elaborately described than the ‘personal’ problems they experienced. The responses covered multiple areas of programming: 1) member accountability; 2) training/orientation; 3) job restrictions/work statement; 4) reporting requirements; 5) recruiting; 6) reward structure and 7) supervisor training. The problem of member accountability was mentioned several times, indicating that it could be a significant problem across a large number of organizations. It is worth noting that these are problems from the directors’ perspective, and may not be things that can be mitigated given the program guidelines. Some may even be objectives of the program (increasing organization responsibility in recruitment, for example). Each of the seven areas of concern is discussed below.
1. Three of the six directors said that one of their biggest concerns was the way in which AmeriCorps* VISTA members are accountable to two different institutions: AmeriCorps and the affiliate. One director responded that it seemed, with her member and others in her community, that although the member is serving the organization, her allegiance is not to it. The work requirements and guidelines seem to hinder the ability of the organization to use the member as it needs. The second respondent mentioned that her main problem was with confidentiality—she felt that the member, in reporting to another supervisor outside the organization, was sharing things that should have remained within the organization. A third director noted a problem with the member’s role definition: it was difficult to determine whether to view the member as a paid employee or a volunteer. The director asked these questions: a) if the member should be treated as a paid employee, who is in charge given that the organization does not have complete control over payment or job description?; and b) if instead a volunteer, why is there not a greater focus on meeting the needs of the members and the organization and less on the requirements of the program as a whole? Greater discretion was desired.
2. AmeriCorps* VISTA program training and orientation were concerns for two directors. One said that it was irrelevant to the work the member was doing, and that it took a lot of time. From her perspective, there were not any benefits. Another mentioned that it contributed to the split allegiance—upon returning from training, the member did not have the same understanding of her place in the organization as she did beforehand. A value judgment on this statement is discouraged; it depends highly on the point of view and the member’s initial ‘place’. Given the program’s focus on aiding organizations and communities, placing organizational allegiance second could indeed cause problems. At the same time, it is crucial that the mandates of the AmeriCorps* VISTA program are followed to ensure proper use of government funds. Conflict can certainly arise when the two ‘sides’ ask a member to do opposing actions. Often, the member must deal with the issue rather than find her superiors working out the differences between themselves.
Capacity as a Fundamental Objective 52
3. Three directors described their problems with the job description/work plan. These answers were more difficult to understand and did not follow a pattern. One actually said that it was too vague, that it was hard to understand how the affiliate could use the AmeriCorps* VISTA member in the organization. It also made it difficult for the members to know precisely what their duties were. Presumably, this respondent was working through a state placement office that developed a generic job description for the project application; at least this would explain why it was vague. One would assume that the program would not write its own vague work plan.
On the other hand, two others mentioned that the job description was too restrictive, placing the needs of the organization last. This is much more easily understood given the restrictions on what members can do. This created friction between how the members were being used and how they should be used—one respondent said, for example, that the prohibition on doing office work was impractical in an office where the member was working every day. If the phone were to ring or if a thank you letter needed to be written, she would do it, simply because she was there to do it—just as would the executive director. One director said that he quit the AmeriCorps* VISTA program because the program told him the member could not work in the restore they were developing without being a supervisor of some sort, but also that the member should not supervise others. He described it as “a strange situation” that he could apparently do without. While it appears that the directors were attempting to use their members as they were supposed to, all suggested that improved clarification of and more leniency in the job descriptions would improve their situations.
4. One director mentioned that the reporting requirements were burdensome for his small affiliate.
5. The recruiting structure was also deemed problematic. One director, who has been working with the AmeriCorps* VISTA program for four years, perceived that the new online recruiting option created more work for the organizations. She believed that both screening and orientation to the program were not as good as under the former recruiting system. She said that it seemed like newer members, recruited through the online system, understood the AmeriCorps* VISTA program less well than those that had not been recruited online. Another mentioned that screening and placement could be improved to fit members better to organizations and to prevent problems such as theft.
6. One director noted that the AmeriCorps* VISTA program asks individuals to “step out on a mission” and find personal reward in doing so, without much support in the process. He suggested that giving more support—not necessarily financial—to members would greatly improve the program. He said that one thing the AmeriCorps* VISTA program could do is share how organizations might meet the needs of members through non-monetary rewards. He believes that setting up a better local support structure for all members in the area would enhance the program by increasing productivity and reducing the stress of the position (particularly the problem of low pay in high cost areas).
Capacity as a Fundamental Objective 53
7. Finally, the same director who mentioned his concerns with the reward structure also suggested that the program could be improved by better supervisor training, such as a single day annually or weekly state-wide best-practice updates through email from the state coordinating office. He noted that new supervisors do not seem to have a clear idea of the operation, goals and requirements of the program or how best to incorporate the member into the organization, i.e., “what to do with them.”
The interviews, as usually happens, raised more questions than answers. This was particularly true in regards to the perceived problems (are they real problems and what can be done about them?) and the position of the AmeriCorps* VISTA member in the organization and the members’ contributions (are they building something new or sustaining the status quo?). Much more information needs to be gathered in order to interpret these results properly. Suggestions for future research are included in the final section of this report.
Capacity as a Fundamental Objective 54
Part Seven: Conclusions & Recommendations
This study demonstrates that it is possible and effective to design a method to compare one standard of capacity across a large set of organizations. It follows the work of others, particularly Glickman and Servon (2000), which also assesses capacity across a group of similar organizations. Using a capacity index that incorporates elements of success applicable to most organizations, it would indeed even be possible to compare organizations that do not share a common mission. Capacity, in the literature and in practice, refers to the ability of an organization to do what it wants to do. All organizations want to achieve their goals, and individual organizations have the knowledge and expertise to determine what factors most influence their own mission achievement. In this sense, capacity may be determined best by the organization itself. If the scholarship is correct, however, a substantial number of these factors concord with success in the majority of non-profit organizations. Many of these were included in the conception of capacity used in this study. With minor adjustments, this study’s index can be applied across many different types of organizations.
Answers to four questions were sought in this study: ° Do AmeriCorps* VISTA members have an impact on the capacity of their
sponsoring organizations and how much? ° What types of organizations are more likely to participate in the AmeriCorps*
VISTA program? ° What factors other than AmeriCorps* VISTA member presence are equally or
more important in determining the level of capacity of an organization? ° What kind of relationship exists between the capacity of organizations and their
production levels?
Do AmeriCorps* VISTA members have an impact on the capacity of their sponsoring organizations and how much?
The direct answer is yes. Both the survey data and the interview results demonstrated that AmeriCorps* VISTA members have a role in building the capacity of their organizations. The interviews results suggest that they have their most important role in taking on duties and activities that were not completed adequately or effectively (if at all) before their arrival. The majority of respondents implied that their members contributed positively to improving their organizations to a degree that they were able to increase or improve their construction goals. The survey data agrees with this assessment, estimating that the presence of an AmeriCorps* VISTA member had a numerical impact on the total capacity index score of nearly four points. This result is important because it occurred when holding in the model particularly for the 1999 level of capacity, the size of staff, the age and size of the organization, and the occurrence of technical assistance, along with three other factors that were significant. With these controls, considerable support is given to the hypothesis that AmeriCorps* VISTA members have a substantial impact on
Capacity as a Fundamental Objective 55
the capacity of their sponsoring organizations. This should be good news to Habitat affiliates and other organizations that have invested significant amounts in their members.
Further, the analysis supports placing members in the area of volunteer management as a means to help increase the organizational capacity of the organization, although further analysis is required to determine what aspects of the total capacity index are specifically related to a member’s work in this area. The recommendation, then, is that affiliates continue to focus on volunteer management as an area in which AmeriCorps* VISTA members will be especially effective. The Corporation should consider concentrating resources on examining the benefits generated by the work in this area and perhaps should encourage its partner organizations to think about using their members to enhance their volunteer programs.
The study also reveals several problems organization leaders are facing in regards to program participation. The most notable of these is the issue of member replacement. Others included concerns with the training, orientation and recruitment aspects of the program. It is recommended that these issues be further investigated and resolved; these organizations are likely not the only ones that have experienced problems in these areas.
What types of organizations are more likely to participate in the AmeriCorps* VISTA program?
Older organizations are more likely to be program participants. Organizations in smaller communities are less likely to sponsor members, as are organizations that have not participated in the past. Some regions, and specific states, are much more likely to have members according to this sample data. All of these realities suggest that work needs to be done to eliminate some of the disparities in participation. In particular, changes should be considered among those aspects of the program that discourage organizations from applying that may most need the help a member can provide (such as newer organizations). This is a difficult call to make; it is essential that organizations have the resources to support and supervise members in their positions. At the same time, however, it is critical to ensure that the stronger organizations do not have options other than having a member join them. Other ‘weaker’ organizations may need the member more. This recommendation may also apply to Habitat offices that direct and supervise state or regional AmeriCorps* VISTA programs.
What factors other than AmeriCorps* VISTA member presence are equally or more important in determining the level of capacity of an organization?
The number of full-time staff appears to have a very significant relationship with capacity. According to the analysis, each additional staff person corresponds to a 1.7 increase in the total capacity score. It also corresponded to higher scores for the organizational, financial and programmatic capacity dimensions. Some of the responses given in the interviews imply that having enough staff can positively influence the amount of construction and its completion. Two other factors appeared in the model that can be manipulated to the benefit of an organization’s level of capacity. Having an office has a positive impact on the capacity score, as does being the recipient of technical
Capacity as a Fundamental Objective 56
assistance. The combined influence of these two factors is more than a ten point higher capacity score (compared to organizations that did not have them). Recall that all of these values occur while holding for the age and size of the organization, so that even should they vary along with these two aspects, they have an independent influence on capacity. The recommendation, then, is that organizations should work to find dedicated office space, engage others in giving them technical assistance and attempt to bring on more staff in order to improve their ability to achieve their missions.
What kind of relationship exists between the capacity of organizations and their production levels?
Again, according to the analysis of the sample data, organizations with higher capacity levels have higher production levels. This occurs while holding for previous capacity levels, and the age, size and location of the organizations. As mentioned in Part Five, the impact is small, although significant. Further research is recommended to learn what components of capacity correspond to higher production levels to establish which most improve the likelihood of success.
Research Recommendations
In order to advance the theoretical conception and measurement of capacity, it is necessary to do as this study did and apply current constructs to new areas. By applying Glickman and Servon’s (1998) capacity formulation to a set of organizations that had not yet been studied, the specification and utility of capacity as a research concept have been improved. More importantly for those interested in capacity-building activities, national service has now come under scrutiny in the area. The program appears to succeed in its capacity-building mandate. Several questions remain unanswered, however. Some of these have been raised throughout the text. Others not mentioned earlier include:
° what aspects of capacity most influence production; ° why organizations that score above their recommended capacity level are not
building more houses to match their high capacity; ° why certain types of AmeriCorps* VISTA member work appear to influence
capacity levels while others do not; ° whether members’ experience, skills and education also have a bearing on
organizations’ capacity levels; and ° why organizations with certain characteristics are more likely to participate in the
AmeriCorps* VISTA program than those without them.
Undoubtedly, a multitude of other questions have been raised but not considered by this research. Some of these questions will be related to the limitations of the study, which are fully acknowledged and listed in Appendix E. The hope is that others will continue the work started here, improving and expanding upon it in order that all organizations may find themselves better able to achieve the missions they have set before themselves.
Capacity as a Fundamental Objective 57
Appendixes
Capacity as a Fundamental Objective 58
Appendix A: Capacity Index Creation and Scoring: Tables
In this appendix, several tables are presented that were used in the creation and scoring of the total capacity index and the 1999 capacity index. Because of the size and orientation of the tables, their descriptions are provided in these first pages, rather than adjacent to them.
Table A.1 This table lists all of the components considered for inclusion in the capacity index. Those that are in italics are ones that, in one form or another, were chosen. The table is in two parts. Because there were eighteen documents included in the table as ones suggesting and supporting different organizational aspects of success, it needed to be divided into two. The first table has a “Total Support” column, which indicates how many total documents supported that component as an aspect of success. An “r” in this column means that it was referenced by a person, not a document. The second table contains the same list of components, but a different list of literature. In both tables, each “1” in the columns to the right indicates that the document in the column recommends the component. The documents are listed in the references.
Two documents should be highlighted. The first is the HFHI Standards of Excellence, and the second is the HFHI Capacity-building manual. These two were the main sources for the elements of success specifically pertaining to Habitat affiliates. As was described in Part Three, the section on the study methodology, these at times outweighed other components that were well-supported in the literature. At other times, as was also mentioned, their suggestions were too specific to include in the capacity index.
Table A.2 The second table in the appendix is the one used for scoring the current capacity index components and the 1999 capacity components. Each component in the index is listed along with its variable code name. They are not listed in any particular order. The third column lists the total possible score for the component (or, in the gray, the possible score for the capacity dimension highlighted). The components’ possible scores were assigned based on their relative value to the other components in the index and their perceived value in the literature (again, having a strategic plan received the most points—eight—because it was considered the most important component of success). The “100” at the top of the table is the total possible score of the index.
The “Answers’ Scores” columns require elaboration. The numeric values at the top of the columns are the scores to which certain answers on the survey were assigned. For example, “FTE staff and volunteers have been retained for at least 2 years,” the second component listed, has four categories of possible answers to the question, “If you have an ED, how many months has he or she worked for you?” If the answer to the question for variable “return1” (See Table B.1 for correspondence between questions and variable codes) was five months, then it would have received a score of zero. If it were 19 months, it would have been scored as two. The scores were made into formulas for each variable in a Microsoft Excel spreadsheet and applied to each organization’s answers. The scores for some variables are dependent on answers to multiple questions (as for the first component, for example, which also incorporates the answers to “return2”). The system is quite complicated, but reasonable. Some of the scoring differentiations among answer values were based on what was perceived to be necessary at each level of construction. This process was realized most fully in the assignment of scores to the
Capacity as a Fundamental Objective 59
components evaluating leadership. The Habitat capacity-building manual (2000) listed in its tables what type of leadership was believed necessary at each level of construction. Their specifications were copied exactly to differentiate between answers here. They specifically recommend that staff members be in charge of most organization activities once construction is at a level between ten and 20 houses a year. As a result, staff was given the highest capacity score for those leadership areas. Table A.3 further elaborates the correlation between score and construction level for each component.
Table A.3 Organizations were first scored based on their answers, then compared to their recommended capacity score as determined by their planned construction for 2002 (the percent capacity score resulted). Table A.3 lists the variables’ recommended scores for each construction level. “Strtplan”—having a strategic plan—offers one good example. HFHI suggests in its manual that affiliates do not need a long-term strategic plan until they reach a construction level of at least three houses per year. Because the organization can be presumed to know best what its affiliates need to be most successful, I followed this suggestion and marked that affiliates building one to two houses per year did not need a strategic plan. That is why the “1 to 2” column has a zero for having a strategic plan, whereas the others have eight—they need to have a strategic plan. The best way to use this table is for comparing between construction levels within each component. It will be necessary to refer back to Tables A.2 and B.1 in doing so, to determine to what question the variable refers, the range of possible answers and the corresponding scores.
Table A.4 This last table contains the same information as Table A.3, but instead for the 1999 capacity index score (histscor). The variables listed here are also included in Table A.2, at the end. Note that instead of comparing between organizations based on the 2002 level of construction, the 1999 capacity index appropriately differentiates organization size based on the 1999 level of construction (as variable nohs99).
60 Capacity as a Fundamental Objective
Table A.1: Capacity Component Literature Support, Part 1
Components of Capacity Measurement Total
Support
HFHI Standards of Excellence,
2000
HFHI Capacity-building manual,
2000
Bradshaw, Murray & Wolpin,
1992
Fredericksen & London,
2000
Glickman & Servon,
1998
Glickman & Servon,
2000
Green & Greisinger,
1996 Herman & Renz, 1997
Organizational Capacity Volunteers and staff are numerous enough to prevent overload on a small group 5
1
1 100% of board meetings have a quorum 2 1 There is a Nominating Committee to select and train new board members 4 1 1
Board reflects the diversity of the service area 6 1 1 1 Board members maintain some direct volunteer activity 2
1
1 The Board sees its main goal as governance rather than operations 6
1
1 1 Written evaluations are conducted of staff, programs and the board on an annual basis 9 1 1 1 1 The affiliate has a long-range strategic plan in place 13 1 1 1 1 1
1
1 The affiliate has homeowner selection leadership 2 1 1 The affiliate has homeowner support leadership 2 1 1 The affiliate has fund-raising/resource development leadership 5 1 1
1
The affiliate has financial management leadership 4 1 1
1
The affiliate has site selection and construction leadership 3 1 1 The affiliate has volunteer management leadership 3 1 1 1 Personnel policy is in place with job descriptions, work plans and expectations 7 1 1 1 1 The mission (and vision) and goals of the org are clearly stated and accepted by all 10
1
1 1 1 Records are kept to track money, donors and volunteers 5
1
1 Policies and procedures exist for most activities and are used 6 1 1 1 1 There is a distinct delineation of roles between board and staff members 5 1
61 Capacity as a Fundamental Objective
The organization has public relations leadership 1 Provisions are made for staff development and training opportunities 6 1 1
1
1 Low-income persons are represented on the Board 4 1 1 1 The board has at least 12 members 1 1 The affiliate offers competitive compensation and benefits 6
1
1 1 1
Staff are encouraged to be innovative and to show initiative outside the job description 1 FTE staff and volunteers have been retained for at least 2 years 6
1
1 1 1 Hired staff have the education and/or experience to manage effectively 5
1
1 Board members have skills and experience relevant to the organization's needs 3 1 1 The organization has vested executive leadership in one individual, either volunteer or paid (strong needed) 5
1
1 1 Have staff in substantial areas (dep. on production) 4
1
1
There is an office and sufficient equipment available for staff and volunteer use 2
1
1 Financial Capacity The affiliate had a positive fund balance at the end of last year and assets have been growing 5 1 1
1
1 The affiliate is active in searching out new funding sources 5
1
1 Formal financial statements are presented to the board at each meeting for fiscal monitoring 9 1 1 1 1 1 The affiliate's administrative costs are </= between 16-25% of its total annual revenue 2 1 1
The affiliate has a fund-raising plan in place 5 1 1 1 There is an annual budget 7 1 1 1 No single funding source provides for more than 30% of total support 4 1 1
1
1 Stable, long-term operating support has been ensured 8
1
1 1 1 The board is involved in fund-raising 6 1 1 1 1 The affiliate does not use government funds for the construction of houses 1 1
62 Capacity as a Fundamental Objective
An annual independent financial review is conducted (if income > $250,000, an audit) 5 1 1 There is General Liability insurance for at least $1 million 1 1 The affiliate carries builder's Risk and Accidental Medical coverage for volunteers 1 1 The affiliate is on the July 1-June 30 fiscal year 1 1 Written receipts for donations are sent within two weeks of contribution 1 1
The affiliate does not accept contributions that require a violation of the Affiliate Covenant 2 1 1 The funding is grounded in the community, whether cash or in-kind 3
1
Financial resources are spent in a timely, planned and efficient manner 1 Networking Capacity
Members of the affiliate participate in at least one regional Habitat training session annually 3 1 1 The affiliate is networking with nonprofits, businesses and housing entities in the area 9 1 1
1
1 Projects are sponsored by and developed with neighborhood groups 6
1
1 1 Congregational involvement in Habitat is increasing 4 1 1
1
Community recognition of Habitat symbols and purpose is widespread 2
1
1 Reports required by HFHI and others are completed on time 2 1 1 The affiliate participates in triennial reviews and planning sessions with the regional office 3 1 1 The affiliate works with the city and county governments in regards to land use 3
1
1 Advocacy Capacity There is a working and positive relationship with the local or county government 4
1
1 The affiliate regularly reiterates that the poverty housing is a moral issue that needs redressed 1
1
The affiliate has worked with the city or county in developing alternative affordable housing options 4
1
1
63 Capacity as a Fundamental Objective
Programmatic Capacity Brochures/publications reflect Christian identity of organization 2 1 1 The affiliate has a large pool of volunteers from which to draw on construction days r The affiliate has a qualified construction supervisor on site 2 1 Training to volunteers is provided r Delinquent mortgages are resolved quickly with foreclosures started after 6 months 1 1 Your affiliate operates a "ReStore" r Sweat Equity policy requires between 200-500 hours per Partner Family 1 1
Homeowner education sessions are required 1 1 All sweat equity hours are completed prior to occupancy of Habitat home 1 1 Partner Family is assigned meaningful sweat equity tasks 1 1 Title transfer occurs within 6-12 months of completion of house 1 1 Board and committee meetings include a time of prayer/devotional 1 1 Bibles are presented at the home dedication 1 1 The affiliate works with all people who support Habitat, regardless of faith 1 1 Approved Homeowners' incomes fall below 5080% of the area median income 1 1 Mortgage terms are no longer than 30 years 1 1 Monthly house payments are less than 25% of the families' monthly income 1 1 Your affiliate tithes (returns) 10% of all cash contributions to HFHI 1 1 Alternative sources of funding are used for land development 1 Current land holdings will sustain building for two years r Family Support Infrastructure in place 1
1
64 Capacity as a Fundamental Objective
Table A.1: Capacity Component Literature Support, Part 2
Components of Capacity Measurement Herman & Renz, 1999
Herman & Renz, 2000
Honadle, 1981
Knauft, Berger, and Gray, 1991
Mayer, 1983
Nye & Glickman,
2000 Rochester,
2000 Sheehan,
1996 Sidor, 1990 Slesinger,
1991 Organizational Capacity Volunteers and staff are numerous enough to prevent overload on a small group 1 1 1 100% of board meetings have a quorum 1 There is a Nominating Committee to select and train new board members 1 1 Board reflects the diversity of the service area 1 1 1 Board members maintain some direct volunteer activity The Board sees its main goal as governance rather than operations 1 1
1
Written evaluations are conducted of staff, programs and the board on an annual basis 1 1
1 1
1 The affiliate has a long-range strategic plan in place 1 1
1
1
1
1 The affiliate has homeowner selection leadership The affiliate has homeowner support leadership The affiliate has fund-raising/resource development leadership
1
1
The affiliate has financial management leadership 1 The affiliate has site selection and construction leadership 1 The affiliate has volunteer management leadership Personnel policy is in place with job descriptions, work plans and expectations 1 1 1 The mission (and vision) and goals of the org are clearly stated and accepted by all 1
1
1 1 1 1 Records are kept to track money, donors and volunteers
1
1
1
Policies and procedures exist for most activities and are used 1 1 There is a distinct delineation of roles between board and staff members 1 1 1 1
65 Capacity as a Fundamental Objective
The organization has public relations leadership 1 Provisions are made for staff development and training opportunities 1 1 Low-income persons are represented on the Board 1 The board has at least 12 members The affiliate offers competitive compensation and benefits 1 1 Staff are encouraged to be innovative and to show initiative outside the job description 1 FTE staff and volunteers have been retained for at least 2 years 1 1 Hired staff have the education and/or experience to manage effectively 1 1 1 Board members have skills and experience relevant to the organization's needs 1 The organization has vested executive leadership in one individual, either volunteer or paid (strong needed) 1 1 Have staff in substantial areas (dep. on production) 1 1
There is an office and sufficient equipment available for staff and volunteer use Financial Capacity The affiliate had a positive fund balance at the end of last year and assets have been growing 1 The affiliate is active in searching out new funding sources 1 1 1 Formal financial statements are presented to the board at each meeting for fiscal monitoring 1 1 1 1 The affiliate's administrative costs are </= between 16-25% of its total annual revenue The affiliate has a fund-raising plan in place 1 1 There is an annual budget
1
1
1
1 No single funding source provides for more than 30% of total support Stable, long-term operating support has been ensured
1
1 1
1
The board is involved in fund-raising 1 1 The affiliate does not use government funds for the construction of houses An annual independent financial review is conducted (if income > $250,000, an audit) 1 1 1
66 Capacity as a Fundamental Objective
There is General Liability insurance for at least $1 million The affiliate carries builder's Risk and Accidental Medical coverage for volunteers The affiliate is on the July 1-June 30 fiscal year Written receipts for donations are sent within two weeks of contribution The affiliate does not accept contributions that require a violation of the Affiliate Covenant The funding is grounded in the community, whether cash or in-kind 1 1 Financial resources are spent in a timely, planned and efficient manner 1 Networking Capacity
Members of the affiliate participate in at least one regional Habitat training session annually 1 The affiliate is networking with nonprofits, businesses and housing entities in the area
1
1 1 1
1
Projects are sponsored by and developed with neighborhood groups 1 1 1 Congregational involvement in Habitat is increasing 1 Community recognition of Habitat symbols and purpose is widespread Reports required by HFHI and others are completed on time The affiliate participates in triennial reviews and planning sessions with the regional office 1 The affiliate works with the city and county governments in regards to land use 1 Advocacy Capacity There is a working and positive relationship with the local or county government 1 1 The affiliate regularly reiterates that the poverty housing is a moral issue that needs redressed The affiliate has worked with the city or county in developing alternative affordable housing options 1 1
67 Capacity as a Fundamental Objective
Programmatic Capacity Brochures/publications reflect Christian identity of organization The affiliate has a large pool of volunteers from which to draw on construction days The affiliate has a qualified construction supervisor on site 1 Training to volunteers is provided Delinquent mortgages are resolved quickly with foreclosures started after 6 months Your affiliate operates a "ReStore" Sweat Equity policy requires between 200-500 hours per Partner Family Homeowner education sessions are required All sweat equity hours are completed prior to occupancy of Habitat home Partner Family is assigned meaningful sweat equity tasks Title transfer occurs within 6-12 months of completion of house Board and committee meetings include a time of prayer/devotional Bibles are presented at the home dedication The affiliate works with all people who support Habitat, regardless of faith Approved Homeowners' incomes fall below 5080% of the area median income Mortgage terms are no longer than 30 years Monthly house payments are less than 25% of the families' monthly income Your affiliate tithes (returns) 10% of all cash contributions to HFHI Alternative sources of funding are used for land development Current land holdings will sustain building for two years Family Support Infrastructure in place
68 Capacity as a Fundamental Objective
Table A.2: Scoring for Capacity Components (Current & 1999)
The organization has vested executive leadership in one individual, either volunteer or paid (strong needed) execdir 3 NO
IF YES & IF return2
IS 0 OR BLANK
IF YES & IF return2
IS <12
IF YES & IF return2 IS >,=12
FTE staff and volunteers have been retained for at least 2 years return1 3
UNDER 6 MONTHS
6-18 MONTHS
18-24 MONTHS 2+ YEARS
Volunteers and staff are numerous enough to prevent overload on a small group nooffvol 2 10+ 4 to 9
3 OR FEWER
The affiliate has a 3-5 year long-range strategic plan in place strtplan 8 NO YES (8)
Written evaluations are conducted of staff, programs and the board on an annual basis evaluate 4 0 EVALS 1 2 3 4 OR 5 The mission (and vision) and goals of the org are clearly stated and accepted by all mission 5
NOT WELL
PARTLY WELL
VERY WELL
Policies and procedures exist for most activities and are used policies 4 NONE MIN 3 MIN 6 MIN 9 MIN 12 Records are kept to track money, donors and volunteers records 2 NO YES The Board sees its main goal as governance rather than operations govern 3 67-100 34-66 0-33
0 0.5 1 1.5 2 2.5 3 4 5 (8) The affiliate has appropriate leadership in: Homeowner selection ownersel 2
IND VOL, VISTA, ED
EXEC COMM BD COMM STAFF
Homeowner support/relations ownersup 2 EXEC
COMM BD IND VOL, VISTA, ED COMM STAFF
Site selection sitesel 2 NONE VISTA ALL
OTHERS COMM STAFF
Construction planning constcom 2 VISTA EXEC
COMM IND VOL,
BD ED,
COMM STAFF
Volunteer management volmgmt 3 EXEC
COMM BD, ED COMM IND VOL,
VISTA STAFF
Board nominations bdnoms 3 NONE IND VOL, VISTA, ED BD
EXEC COMM STAFF COMM
69 Capacity as a Fundamental Objective
Public relations prcom 2 NONE BD, EXEC
COMM ALL
OTHERS STAFF IND VOL,
EXEC ED, Fundraising/resource development fundrais 2 NONE COMM VISTA, BD COMM STAFF
VISTA, EXEC IND VOL, Financial management finmgmt 3 NONE ED, BD COMM COMM STAFF Financial Capacity 18 The affiliate's administrative costs are below 25% of its total annual revenue ttlcosts 2 DK
MORE THAN 35%
BETWEEN 25 & 35%
UNDER 25%
The organization has an annual budget budget 3
budg01=0 OR
BLANK
budg01>0 AND
budg00=0 OR
BLANK
budg01>0 AND
budg00>0 0 0.5 1 1.5 2 2.5 3 4 5 (8)
The affiliate had a positive fund balance at the end of last year and assets have been growing pstv01 2 NO YES Audit fnlrvw01 3 DK, NO YES Individual donations increase annually indldons 1 DK, NO YES
The affiliate is active in searching out new funding sources actvfund 3 0 1 or 2
MORE THAN 2
Funding comes from a variety of sources fundsrcs 4 0 to 1 2 TO 3 4 TO 6 7 TO 9 10 TO 11 Networking Capacity 12 Projects are sponsored by and developed with neighborhood groups sponsors 3
sponsors/ nohs01 = 0
to .09
sponsors/ nohs01 = .1
to .29
sponsors/ nohs01 = .3
to .49
sponsors/ nohs01 = .5
to 1 Congregational involvement in Habitat is increasing chpartic 3 0 <10 <20 <30 >30 The affiliate is networking with nonprofits, businesses and housing entities in the area network 5 DK, NO YES
Community recognition of Habitat symbols and purpose is widespread recogd 1
NOT AT ALL IN PART
COM-PLETELY
70 Capacity as a Fundamental Objective
Advocacy Capacity 5
The affiliate has worked with the city or county in developing alternative affordable housing options govnet 2 NO YES The affiliate regularly reiterates that the poverty housing is a moral issue that needs redressed moral 1 NO YES
0 0.5 1 1.5 2 2.5 3 4 5 (8) The affiliate knows the percentage of poverty housing in the community or the number that need repaired hsneed 2 NO YES Programmatic Capacity 10
Alternative sources of funding are used for land development landfund 1 NONE
LESS THAN HALF
MORE HALF,
ALL, NO DEV.
REQ'D Current land holdings will sustain building for two years landhold 4 DK, NO YES The affiliate has a qualified construction supervisor on site constsup 2 DK, NO YES
The affiliate offers appropriate recompense to supervisor suptype 1
NOT PAID, VISTA
PART-TIME, PAID
FULL-TIME, PAID
The affiliate has a large pool of volunteers from which to draw on construction days volspool 2
EVERY WEEK, DK 3 WEEKS 2 WEEKS 1 WEEK NEVER
1999 Comparison Capacity (histscor) 49 Strategic Plan stplan99 8 scoring same as for identical current capacity variable Positive fund balance pstv00 2 scoring same as for identical current capacity variable Policies polcis99 4 scoring same as for identical current capacity variable Database record99 2 Scoring same as for identical current capacity variable Financial review fnlrvw99 3 Scoring same as for identical current capacity variable Homeowner selection leadership ownsel99 2 Scoring same as for identical current capacity variable Homeowner support ownsup99 2 Scoring same as for identical current capacity variable Site selection sitsel99 2 Scoring same as for identical current capacity variable
0 0.5 1 1.5 2 2.5 3 4 5 (8) Construction cnstcm99 2 Scoring same as for identical current capacity variable Volunteer management volmg99 3 Scoring same as for identical current capacity variable Board nominations bdnoms99 3 Scoring same as for identical current capacity variable Public relations pr99 2 Scoring same as for identical current capacity variable
71 Capacity as a Fundamental Objective
Fundraising fr99 2 Scoring same as for identical current capacity variable Financial management finmg99 3 Scoring same as for identical current capacity variable
Board time on operational issues govern99 3
IF 0/BLANK OR LESS & govern=
67-100
IF LESS & govern= 34-
66, OR ABOUT
THE SAME &
govern= 67-100
ALL OTHERS
IF MORE & govern=
0-33
House sponsorship growth sponsr99 3
IF 0 OR LESS & nohs99< nohs01
IF ABOUT THE
SAME & nohs99<
nohs01, OR LESS & nohs99= nohs01
ALL OTHERS
IF MORE & a)
nohs99= nohs01 OR b) nohs99>
nohs01
Church participation growth chpart99 3
IF 0 OR LESS & nohs99< nohs01
IF ABOUT THE
SAME & nohs99<
nohs01, OR LESS & nohs99= nohs01
ALL OTHERS
IF MORE & a)
nohs99= nohs01 OR b) nohs99>
nohs01
Capacity as a Fundamental Objective 72
Table A.3: Recommended Scores by Proposed 2002 Production Level Houses Planned for 2002 and Corresponding Recommended Scores
Variable Code 1 to 2 3 to 4 5 to 9 10 to 20 21+ Total
Included in this appendix, after Table B.1, are the survey forms and the interview form. First are the four pages of the formal survey, second is the AmeriCorps* VISTA Activities form, and third is the interview protocol. Table B.1 below identifies what is being measured by each question on the survey forms. They are presented in the same order as on the surveys for easy reference. The variable type refers to the four groups of variables delineated in Part Five when discussing what factors were being considered in the regression analysis. The capacity variables are broken down by their dimensions. Organization and community variables were used to place controls on the data so that the role of having an AmeriCorps* VISTA member on capacity could be clearly and accurately determined. These variables have been considered, in various places, to have their own influence on capacity levels. This was also demonstrated in this study. Not all of the control variables were used in the final analysis for various reasons.
Table B.1: Correspondence of Survey Questions and Variables
Survey Question (in order on survey form) What is being Measured Variable Code
Variable Type
Not on Survey Forms Identification number Nothing—unique ID idnum Date of Affiliation Age of organization affdate organization Region National location (eight variables) __region community On "2001 Survey: Capacity Building in Habitat for Humanity Affiliates" By whom was this survey completed? Source of survey information bywhom organization
Which best characterizes your service community? Size and type of community served location community How many congregations are now in your service area?
The number of congregations in the service area churches community
What value did you use for area median income in 2001? The median income of the area medinc community
Currently, what percentage of families in your service area would you estimate have a total income of less than half the area median income? The rate of poverty in the area poverty community
In 2001, what was the average monthly rental cost for a 2 bedroom apartment?
The rental cost of a two-bedroom apartment rentcost community
How many houses have you build and/or renovated (total)?
The number of total houses built (size of organization) nohsttl organization
How many did you build in 1999? The number of houses built in 1999 nohs99 organization In 2000? The number of houses built in 2000 nohs00 organization In 2001? The number of houses built in 2001 nohs01 organization
How many do you plan to build/renovate in 2002? The number of houses planned for 2002 nohs02 organization
In 2003? The number of houses planned for 2003 nohs03 organization
What types of housing did you build? What is being constructed hstype organization
Did you do any renovation? The incidence of renovation versus new construction renovatn organization
What was the affiliate's average cost of construction for a single-family home? The cost of construction houscost organization
Capacity as a Fundamental Objective 75
Approximately how many applications for housing did you receive in 2001?
The number of families interested in owning Habitat homes in 2001 noapps01 organization
In 2000? The number of families interested in owning Habitat homes in 2000 noapps00 organization
What were your total expenditures on 2001? The total expenditures for 2001 (and knowledge of budget) budg01
financial capacity
In 2000? The total expenditures for 2000 budg00 financial capacity
In 1999? The total expenditures for 1999 budg99 1999 capacity Does the affiliate have separate office space or is work done in someone's home?
Whether the affiliate has dedicated space for work office organization
Do you currently have an Executive Director?
The organization has vested executive leadership in one individual, either volunteer or paid (strong needed) (OC) execdir
organizational capacity
If yes, which best characterizes your Executive Director? The type of executive director edpaid
organizational capacity
If you have an ED, how many months has he or she worked for you?
FTE staff and volunteers have been retained for at least 2 years (OC) return1
organizational capacity
If your current ED is not your first, for how long was your previous one with the affiliate?
The length of time the previous executive director worked return2
organizational capacity
How many part-time staff do you now have doing non-construction work (under 30 hours/week)? The number of part-time staff staffpt organization How many full-time staff do you now have doing non-construction work (more than 30 hours/week)? The number of full-time staff staffft organization How many more volunteers would you like to see involved in office administration, the Board of Directors and/or committees?
Volunteers and staff are numerous enough to prevent overload on a small group (OC) noffvols
organizational capacity
During any of the past three years, were you a recipient of a Habitat/HUD Capacity-Building grant?
Whether the affiliate participated in the grant program hudcapgt organization
Have you received non-Habitat technical assistance or consulting advice in the past three years?
Whether the affiliate received technical assistance in the past three years tagiven organization
If yes, of what kind? What type of TA the affiliate received tatype organization Have you heard of the AmeriCorps* VISTA program?
Whether the leadership of the affiliate knows of the program vknows
AmeriCorps* VISTA
Have you applied to have a VISTA member serve in your affiliate in the past three years?
Whether the affiliate applied to have a VISTA member vappl
AmeriCorps* VISTA
If so, was your proposal approved? Whether the affiliate was accepted in the program vaccept
AmeriCorps* VISTA
To whom did you apply to get a VISTA member? The location of program administration vwhere
AmeriCorps* VISTA
If you did apply, do you currently have a VISTA member?
Whether the affiliate currently had a member vcurrent
AmeriCorps* VISTA
How many years have you been in the VISTA program? The number of years of participation vyears
AmeriCorps* VISTA
How many VISTA members do you have? The number of current members vnum AmeriCorps* VISTA
If you knew about the program, please briefly describe why you chose to apply or not to apply.
The reason for the decision regarding application vwhy
AmeriCorps* VISTA
Do you pay to have a VISTA member? Whether the affiliate is in the cost-share program vcstshar
AmeriCorps* VISTA
How much? How much the affiliate is paying into the program vcost
AmeriCorps* VISTA
Capacity as a Fundamental Objective 76
Do you currently have a strategic plan? The affiliate has a 3-5 year long-range strategic plan in place strtplan
organizational capacity
Did you in 1999? The presence of a strategic plan in 1999 (historic capacity) stplan99 1999 capacity
Do you regularly (annually, for example) conduct performance evaluations on any of the following (mark all):
Written evaluations are conducted of staff, programs and the board on an annual basis evaluate
organizational capacity
How well do you feel that your mission and related goals are clear to and accepted by staff and key volunteers?
The mission (and vision) and goals of the org are clearly stated and accepted by all mission
organizational capacity
Please check in which of the following areas your affiliate has written and board-approved policies and procedures.
Policies and procedures exist for most activities and are used
What percentage of the usual board meeting is spent on day-to-day operations issues?
The Board sees its main goal as governance rather than operations govern
organizational capacity
How does the time spent now compare to that spent during 1999?
The amount of time spent in 1999 on operations issues govern99 1999 capacity
What percentage of all expenditures went toward non-construction costs during the past fiscal year?
The affiliate's administrative costs are below 25% of its total annual revenue ttlcosts
financial capacity
Did your revenues exceed your expenditures during the past fiscal year?
The affiliate had a positive fund balance at the end of last year and assets have been growing
pstv01, pstv00
financial capacity & 1999 capacity (asked twice)
Did/will your affiliate have an independent financial review (such as an audit) for fiscal year 2001?
An annual independent financial review is conducted, or if income is greater than $250,000, an audit fnlrvw01
financial capacity
Did it have an independent financial review for fiscal year 1999?
Whether the affiliate had its finances audited in 1999 fnlrvw99 1999 capacity
Did the amount received from personal donations increase between 1999 and 2001? Individual donations increase annually indldons 1999 capacity
From how many NEW funding sources would you estimate the affiliate has received donations in excess of $1000 in the past six months? (Consider everything EXCEPT individuals' this would include organizations, foundations, businesses, government grants, etc.)
The affiliate is active in searching out new funding sources actvfund
financial capacity
Related to this, please mark which types of funding your affiliate received during the past fiscal year.
Funding comes from a variety of sources fundsrcs
financial capacity
How much of your raw land development was funded through a government grant (e.g. SHOP)?
Alternative sources of funding are used for land development landfund
programmatic capacity
Do you have enough land to cover all construction for the next two years?
Current land holdings will sustain building for two years landhold
programmatic capacity
Is your main site supervisor licensed in construction work?
The affiliate has a qualified construction supervisor on site constsup
programmatic capacity
Which best characterizes him or her? The affiliate offers appropriate recompense to supervisor suptype
programmatic capacity
Assuming one workday a week, how often does the affiliate find itself short of construction volunteers?
The affiliate has a large pool of volunteers from which to draw on construction days volspool
programmatic capacity
Capacity as a Fundamental Objective 77
How well do you feel your organization is prepared to complete the construction planned for 2002?
The leadership's perceived ability of the affiliate to reach its goals capassmnt organization
How many of the houses built in 2001 were fully sponsored by one or more groups (churches, businesses, etc.)?
Projects are sponsored by and developed with neighborhood groups sponsors
networking capacity
Is this more or less than were sponsored in 1999? The degree of sponsorship growth sponsr99 1999 capacity Approximately how many congregations donated to or provided volunteers for your affiliate in 2001?
Congregational involvement in Habitat is increasing chpartic
networking capacity
Is this more or less than had participated in 1999? The degree of growth in congregation involvement chpart99 1999 capacity
Does your affiliate work with or is it a member of any community organizations such as, for example, the United Way, the Chamber of Commerce or an inter-faith group (do not include churches)?
The affiliate is networking with nonprofits, businesses and housing entities in the area network
networking capacity
Has your affiliate participated in a community-wide discussion of a local affordable housing plan?
The affiliate has worked with the city or county in developing alternative affordable housing options govnet
advocacy capacity
Has your affiliate determined how many houses need to be built and/or renovated in your community in order to eliminate poverty housing in the area?
The affiliate knows the percentage of poverty housing in the community or the number that needs repaired hsneed
advocacy capacity
How well do you think the average person in your community understand Habitat's mission?
Community recognition of Habitat symbols and purpose is widespread recogd
networking capacity
Does your affiliate currently publish local poverty and housing statistics in its literature?
The affiliate regularly reiterates that the poverty housing is a moral issue that needs redressed moral
advocacy capacity
This section considers who is coordinating different types of affiliate activities. Please mark, in the left section for January 2002 and in the right for January 1999, what person or set of persons is/was responsible for the decision making in the particular area. Please mark "other" if no one is coordinating such activities in your affiliate.
The affiliate has appropriate leadership in:
organizational capacity & 1999 capacity (each line below was asked for both 2002 and 1999)
(see above) Homeowner Selection ownersel (see above)
Homeowner Support/Relations ownersup (see above) Site Selection sitesel (see above)
Construction Planning constcom (see above)
Financial Management finmgmt (see above)
Volunteer Management volmgmt (see above)
Board Nominations bdnoms (see above)
Public Relations prcom (see above)
Fundraising/Resource Development fundrais (see above)
Capacity as a Fundamental Objective 78
On "VISTA-Sponsoring Affiliate Form: VISTA Activities" In your state, is there a Habitat office that coordinates an AmeriCorps* VISTA Program for the entire state?
The presence of a state coordinating office stvprog
AmeriCorps* VISTA
Please mark the title by which each of your VISTA members works (if you have more than two, write these below):
The title by which the member is addressed in public vtitle
AmeriCorps* VISTA
Has any VISTA member over the past three years coordinated or created programs or activities in the following areas? Please mark which ones.
The types of activities in which the members were engaged at a leadership level:
AmeriCorps* VISTA
Volunteer management vwkvols AmeriCorps* VISTA
Construction vwkconst AmeriCorps* VISTA
Fundraising vwkfr AmeriCorps* VISTA
Finances vwkfincs AmeriCorps* VISTA
Public relations vwkpr AmeriCorps* VISTA
Office development vwkorgdv AmeriCorps* VISTA
Families vwkfams AmeriCorps* VISTA
What other affiliate matters have your VISTA members been involved in?
Other activities in which members were engaged vactothr
AmeriCorps* VISTA
Do you have any comments about the effect the VISTA program has had on your affiliate?
Leadership response to program participation vcomment
AmeriCorps* VISTA
Capacity as a Fundamental Objective 84
Interview Protocol
To be asked of some of the executive directors of organizations that currently have AmeriCorps* VISTA members.
Goal: want to know how supervisor/ED perceives the AmeriCorps* VISTA member has benefited/impaired the work of the organization, their definition of capacity, their perceptions of the AmeriCorps* VISTA program in general for the community… how have they used members to increase their capacity? In what areas of work have they seen the most benefit?
Question order
1. How many VISTA members currently:_______________
2. I noted on your survey that you have one (or more) VISTA member(s) working in the areas of ________________________ and _______________________. Why did you choose these areas for them work?
3. What, if anything, is he/she//are they doing that was not being done before they arrived?
4. If you did not currently have a VISTA member, would this work still not be done, or would someone else be directing these activities? Who would be doing it?
Capacity as a Fundamental Objective 85
5. Considering the housing production you have planned for this year, if you did not now have a VISTA member in your organization, how would the organization meet its production goals?
Date 1:_____ Date 2:_____ Date 3:_____ Name:__________________________________
6. Would you say the VISTA member has contributed to increased housing production? How? (PROBE: Would you have built as many houses this year without the member’s work? Why or why not?)
7. How do you anticipate the work will continue once the VISTA leaves?
8. In what ways has the organization benefited from having a VISTA? Do you have a specific example?
9. Similarly, in what ways have VISTA members or participation in the VISTA program been less than helpful to/have not helped the organization? Have there been problems you have had to resolve? (FOLLOW WITH EXAMPLES IF NECESSARY)
10. What comes to mind when you hear the word capacity-building?
Capacity as a Fundamental Objective 86
11. How would you define capacity building? Can you give me an example of a capacity-building activity?
12. In your opinion, how has your VISTA member(s) increased the ability of the organization to achieve its mission?
x
Capacity as a Fundamental Objective 87
Appendix C: Non-Regression Data
Affiliate Demographics
In order to gain a better understanding of the organizations themselves, it is worthwhile to draw a picture of the sample, describing its characteristics as a whole. Part Four contains descriptions of several of these characteristics. The purpose of this appendix is to expand upon some of this data and to display other characteristics (such as location) not discussed earlier.
Type of community The question on the survey about location asked the respondent to mark in which type(s) of area(s) their affiliate worked. The six categories were: Central city, Suburban city, City without suburbs (pop>50,000), Small town (pop<50,000)/rural, single county and multiple counties. More than one response was possible. For the regression, these were first divided up into similar population groups, as shown in Table C.1. The second step involved making location a dichotomous variable indicating rural or urban location (consisting of all answers marked with a two, three or four). Because it is an ordinal variable (the exact population was not requested), it is not possible to use in the full four-point form in the regressions. Using it as a dichotomous, two-answer variable enables it to be used in the analysis. With this division, 32 percent of positive respondents (not counting the “No Answer” column) are located in rural areas. For multiple responses, the location with the largest population on average was marked. For example, if an affiliate marked both “Central city” and “Single county” it received a “4” for Central city. Breaking it down to this level allows some investigation into the types of communities in which affiliates are location. In the sample, 87 marked that their organizations worked in one or more whole counties (not on table). Note that the majority of affiliates in the sample are in the smaller half of communities (although these are not necessarily rural). This cannot be checked against Habitat data to compare its match to the full set of organizations. However, it is generally acknowledged that the majority of the organizations are in smaller communities.
Table C.1: Count of Organizations by Location Location (1 point) (2 points) (3 points) (4 points)
Total No Answer Small Town/Rural
Suburban City OR Single County
City Without Suburbs OR Multi-County Central City
Total 3 86 99 48 37 273
Other characteristics Table C.2 lists information about several other important characteristics. Affiliate age is discussed in Part Four.
Capacity as a Fundamental Objective 88
Table C.2: General Characteristics’ Descriptive Statistics
Variable Average Median Range Count of “Yes”
% “Yes” in Sample
Affiliate age (sample) 11/91 4/92 4/78 to 5/01
Affiliate age (national) 12/92 4/93 4/78 to 7/01
Number of full-time staff 1.14 0 0 to 17
Number of part-time staff 0.72 0 0 to 9
Paid executive director 145 53.11% Received tech. assistance 153 56.04% Has dedicated office space 210 76.92% Cost of building one house $47,780 $45,000 $5000 to 170,000 n=264 (9 non-responses)
HUD capacity grant 61 22.34% Median income of area $40,006 $40,900 $7000 to $85,000 n= 206 (67 non-responses)
Number of area churches 158 100 8 to 5000 n= 244 (29 non-responses)
As of January 2002, 149 organizations did not have any full-time non-construction staff while 154 did not have any part-time non-construction staff. The overlap between the two variables reveals that 97 organizations did not have any paid staff at all, while 53 others had only part-time, ranging from one to five persons. Finally, 67 organizations have both full-time and part-time non-construction staff. Regarding the type of executive director, 145 organizations pay their executive directors for either part-time or full-time work. Of these, only 29 are part-time. Looking also at Table C.6, there are only fourteen volunteer executive directors. Organizations were more likely than not to have received technical assistance in the past three years, with 56 percent marking that they had received it. Participation in the HFHI-HUD Capacity Building for Community Development and Affordable Housing grant program was much lower, with only 61 organizations in the sample having been participants at some point in the past three years. This program provides funds both to organizations for technical assistance, staffing, training and to general programs for operational support (HFHI, 2002). The average cost of building one home for affiliates was $47,780. The mean value is close to this. The range, however, is quite large. With three affiliates with the high value of $170,000, it is apparent that the high cost of construction means that some communities find it more difficult to raise funds and build houses than others. Finally, 210 organizations have dedicated office space (not in someone’s home) in which they perform organizational work. This is a very high rate at 77 percent.
Along with type of location, two other community characteristics were considered. Including these variables in the analysis proved problematic, even though necessary. Many respondents (67 for median income of service area) did not record this information. Gathering it through published data really was not a viable option—most service areas are ill-defined. For example, an affiliate may build in only parts of a county even though it is “X County HFH”, or it may represent a city and its environs as in “Y Area HFH.” It was believed to be best to let the organizations report this data, although its accuracy is debatable; it certainly is not complete. In any case, the reported average median income was $40,006, and the median value of the set of median incomes reported was $40,900. The proximity of the average and median values means that neither the high nor low end is over-represented. This value was believed to be easily attained since affiliates must determine eligibility requirements based on it. The validity of the reported data, thus, is probably high. The church data is most likely much less accurate. The best way to represent this is to remark on the answers given by the same affiliate that turned in two surveys (one by the president and the other by the executive director). The two answers varied by 10 percent. For any single person, it is probably difficult to calculate how many religious
Capacity as a Fundamental Objective 89
institutions exist in a given community. Several affiliates were not even able to write how many they had worked with over the past year, thought to be a much easier number to report. The data reported for the number of churches in the community served had an average value of 158, a median value of 100 and a range of 8 to 5000.
Number of houses built Much of this data was presented in Part Four. However, it is also necessary to compare the national housing data to that provided through the sample, to determine the accuracy of the later. Table C.3 presents this comparison for 1999.
Table C.3: Housing Construction in 1999 Number & Percentage of Affiliates
HFHI Sample VISTA Sponsors Construction Level Number Percent Number Percent Number Percent None 365 23.98% 32 12.26% 7 6.86%
1-4 834 54.80% 175 67.05% 64 62.75%
5-9 216 14.19% 27 10.34% 13 12.75%
10-20 76 4.99% 22 8.43% 15 14.71%
21+ 31 2.04% 5 1.92% 3 2.94%
Total 1522 261 102
The HFHI data comes from the capacity building manual (2000, p. 9). Nearly a quarter of all affiliates in 1999 did not build any houses. More than 75 percent built fewer than five. Only 31 built more than 20, and of these, only three had construction numbers above 50. In the sample taken for this study, the data for 1999 differs significantly. There are two possible reasons for this. First, respondents may not correctly recall the number of houses built in 1999. This could be an issue especially for individuals who are new to their organizations. While a believable reason for a general study that requests recalled information, it is probably not accurate for this set of organizations. Annual production is one of the statistics of which affiliates keep track diligently. The second reason is more complex, but more plausible. It can be argued that the high response rate of AmeriCorps* VISTA sponsors skews the frequencies of the various construction levels. Looking at the distribution among these affiliates, it is evident that it is different from that of the national set of affiliates. Because program sponsors are overrepresented in the sample, their higher production rates may pull the overall sample rates in that direction.
Descriptive Statistics: Capacity Variables
Table C.4 lists all of the capacity variables used in the study. The total capacity score was discussed in Part Five. The others in the table are discussed in order. Table C.5 presents data on the capacity dimensions, while Table C.6 presents some capacity dimensions worth specific mention.
Capacity as a Fundamental Objective 90
Table C.4: Capacity Measurement Descriptive Statistics Measurement Average Median Range Total Possible Score Total Capacity Score 56.95 57.0 22 to 91 100
Percent Recommended Score 1.05 0.94 .49 to 2.29
1999 Capacity Score 26.83 26.5 0 to 45 49
1999 Percent Recommended Score 1.58 1.6 0 to 3.28
1999/2001 Comparison Score 31.55 32.0 11.5 to 48 49
Capacity Growth Since 1999 0.37 0.1 -0.561 to 15
Percent capacity score The percent of the recommended level of capacity that is present in an affiliate has a mean value of 1.05 (105 percent) and a median value of 0.94 (94 percent), demonstrating that the average organization has the capacity believed to be needed to build at its production level. Again, the scores believed adequate at each building level are:
° 1 – 2 houses planned for 2002: a score of 34.5 on the capacity index; ° 3 – 4 houses: 61.5; ° 5 – 9 houses: 81; ° 10 – 20 houses: 93.5; ° 21+ houses: 100. Figure C.1 shows the distribution of the percent score against the planned 2002 construction.
Small organizations are much more likely to achieve their recommended level of capacity than are larger organizations. In fact, no affiliate building five or more houses in 2002 has a capacity score equal to or greater than its recommended capacity score (equal to or greater than 1.0 on the chart). This means that, assuming the capacity index is accurate in its depiction of what organizations need to be successful, all organizations building five or more houses this year do not have one or more of the components they need to be most successful—this does not mean that they will not achieve their goals. It most likely means that organizations therefore will be less efficient and more stressed, and only possibly miss their construction goals for 2002 (depending on what aspects of capacity they are missing). Perhaps this is why 187 organizations marked that they were less than completely sure they would be able to achieve their construction goals for the year, as described in Table C.7.
1999 Capacity score Two variables included in Table C.4 were used to measure and explain the 1999 capacity level: the 1999 capacity score and the 1999 percent recommended capacity score. This first variable is an index measure of the 1999 capacity score. It also is based on organization size. Along with the discussion in the report on the 1999 capacity score, Table A.4 and the accompanying text describe the components included in the index and the scoring system. It had a total possible score of 49, while answers ranged from zero to 45 (some organizations that did not exist at that time have a score of zero). The average and median scores were essentially identical, and are at 55 percent of the total possible score. The 1999 percent recommended score is a created measure, made by dividing the 1999 capacity score by the recommended score, as determined by the organization’s production in 1999. The descriptive statistics for this variable, shown in Table C.4, indicate that a much larger percentage of organizations fall above the recommended score by size of organization on this measure than on the percent total capacity score. Its range is much larger, also. Comparisons beyond that should be discouraged, however, because they do not measure the same set of components. The 1999 capacity score was not meant to be a complete variable; its use is primarily to ensure that some degree of control for changes over time was included in the model. The variable called the 1999/2001 comparison score (current capacity as defined by the 1999 capacity score index) was created to correspond with the 1999 capacity score, and thus contains the same components and the same scoring methods. When the two are compared, a measure of exact capacity growth over time is created: the percent of change in capacity since 1999. The average organization grew in score by 37 percent, although the median was 10 percent, the difference between the two values is accounted for in the large range. Some organizations actually experienced negative growth. Those with the highest scores are the newest: because they did not exist at the time, their growth rates outran those of established organizations.
Capacity as a Fundamental Objective 92
Capacity dimensions The average and median scores and the score ranges of the sample are listed for all of the capacity dimensions in Table C.5. While the information provided is mostly self-explanatory, two items in particular deserve mention. First, the networking and advocacy capacity scores have large ranges matching the ranges for the capacity scores themselves because, for these two variables only, it was possible to have an expected/recommended score of zero. As with the other percent score variables, recommended score distributions were created for each of the dimensions. These are shown in Table A.3. Organizations building only 1-2 houses per year, in the index used here, are not expected to have any networking or advocacy capacity. Thus, if they are incorporating some of these qualities into their organizations, they will have percent scores that, instead of being divided by zero, are divided by one (since division by 0 is not possible, dividing by one gives the percentage score above zero). For example, an affiliate with an advocacy capacity score of five but that is expected to have a score of zero essentially has 500% of its recommended capacity level. Second, the average and median scores for financial and programmatic capacity are below 1.0, indicating that organizations on average do not have the full set of qualities they are recommended to have in these areas.
Table C.5: Capacity Dimension Descriptive Statistics Measurement Average Median Range Total Possible Score Organizational Capacity (OC) 33.64 34.0 12 to 52 55
OC Percent Score 1.2 1.06 0 to 2.91
Financial Capacity (FC) 10.74 11.0 0 to 18 18
FC Percent Score 0.87 0.85 0 to 1.6
Networking Capacity (NC) 6.19 6.0 0 to 11.5 12
NC Percent Score 2.28 1.0 0 to 11.5
Advocacy Capacity (AC) 1.56 2.0 0 to 5 5
AC Percent Score 1.23 1.0 0 to 5
Programmatic Capacity (PC) 4.81 4.5 0 to 10 10
PC Percent Score 0.62 0.58 0 to 1.5
Capacity components Three critical capacity components within these dimensions also merit discussion, and are shown in Table C.6. The first is having a strategic plan. Of the 273 affiliates that returned their surveys, 174 marked that they had a three to five year strategic plan. This is a marked increased over 1999, when only 113 of these same affiliates said they had a strategic plan. Even with the increase, less than two-thirds have one currently. If scholars are correct, implementing strategic plans, even for the smallest organizations that typically are not thought to need them, markedly improves organizations’ ability to achieve their missions. Similarly, regarding having an executive director, fewer than 60 percent of organizations sampled replied that they had one. These leaders may be full or part-time, paid or volunteer; the type of director is less significant than his or her presence in the organization. The importance of these two factors to mission achievement needs to be stressed, particularly to organizations that may not feel an immediate need in these areas. One of the most interesting comments in the HFHI capacity-building manual (2000) is that “most affiliates interviewed stated that, in retrospect, they should have implemented their organizational changes sooner. Not one affiliate indicated that it was done too early” (p. 6). Finally, the amount of land available for construction is also an important capacity component.
Capacity as a Fundamental Objective 93
Only 42 percent of affiliates have enough land to cover construction for the next two years. As mentioned in the body of the report, the lack of land is one of the most critical issues affiliates face.
Table C.6: Critical Capacity Components Variable Mean Median Range Positive Count % of Sample Has a strategic plan 0.64 1 0 to 1 174 63.74%
Had a strategic plan in 1999 0.41 0 0 to 1 113 41.39%
Has an executive director 159 58.24% Has land for two years of construction 116 42.49%
Capacity self-assessment One survey question asked respondents “How well do you feel your organization is prepared to complete the construction planned for 2002?” The set of responses is listed in Table C.7. The majority of affiliates, 187, marked that they had at least some concerns that the construction would not be completed as planned. Of these, however, only 31 answered that they had considerable concerns. This matches the general assessment made of total capacity in the sample: while some organizations have low scores for their size, none is less than 50 percent. The average, again, was over 1.0 (due to the large number of small organizations). Most affiliates seem to know that they are reasonably able to achieve their production goals for the year.
Table C.7: Respondents' Assessment of Organizations' Ability to Reach 2002 Construction Goals
No response 2
Do not anticipate meeting goal 4
Many concerns: will be difficult 27
Some concerns: may be difficult 156
No concerns: will not be difficult 84
Total 273
Capacity as a Fundamental Objective 94
Appendix D: Regression Results
This appendix discusses the results of the survey data statistical regressions. Three sets of questions were asked:
1. Is it possible to determine common characteristics of affiliates that all have AmeriCorps* VISTA members? Which are positively associated with having a member?
2. How does having a member correlate with capacity scores? With other organization characteristics?
3. How does capacity level relate to production? How does AmeriCorps* VISTA participation fit into such a model?
Three sets of variables were analyzed to answer these questions: AmeriCorps* VISTA variables, capacity variables and a production variable, nohs02. The variables discussed in the rest of this Appendix are listed below. Their answer ranges and corresponding scores are listed in Appendix A in Table A.2. The activities included in each of the seven AmeriCorps* VISTA member work areas are listed in Appendix B on the “VISTA-Sponsoring Affiliate Form: VISTA Activities” questionnaire. The factors analyzed are called by their code names throughout the Appendix to shorten the report and to make reference and comparison easier.
Variables in Analysis
Capacity variables ° total capacity score ° total capacity score divided by the recommended capacity score for the size of the
affiliate
° organizational capacity dimension score
° financial capacity dimension score
° networking capacity dimension score
° advocacy capacity dimension score
° programmatic capacity dimension score
° 1999 capacity score
AmeriCorps* VISTA variables ° yes/no: an affiliate had a member in the past three years
° yes/no: an affiliate had a member when the survey was returned
° the number of years the affiliate has participated in the program
° member working in volunteer management ° member working in family relations/support ° member working in organizational development ° member working in fundraising
° member working in finances
° member working in public relations
° member working in construction
Capacity as a Fundamental Objective 95
Community variables ° the median income or the level of poverty in the area ° the size/type of community ° seven dummy variables that indicates national regional location (see Table 4 for regions) ° the number of churches in the area
Organization variables ° affiliation date (the days since affiliation with HFHI) ° organization size (the number of total houses built over time) ° number of houses planned for construction in 2002 ° number of houses built in 2001 ° whether the affiliate has an office outside of someone’s home ° whether the organization has received a HUD capacity-building grant in the past three
years ° whether the organization has received non-Habitat technical assistance in the past three
years ° the number of full-time staff employed by the organization
AmeriCorps* VISTA Variables
Three AmeriCorps* VISTA program participation variables were used in the study. Each one measures slightly different qualities: the affiliate having an AmeriCorps* VISTA member at the time the survey was completed, the affiliate having a member in the past three years and the number of years the affiliate has participated in the AmeriCorps* VISTA program. These first two variables are described below along with a discussion of the organizational and community qualities that are related to them. Regression analysis was not conducted with the number of participation years as a dependent variable because none of the potentially related variables reliably predates its occurrence.
Logistic regression models were used to analyze both AmeriCorps* VISTA variables because they are dichotomous. A WALD score was generated in this process to test the overall statistical significance of the model, while chi-square values were used to determine the significance of individual variables. The logistic regression produces non-standard parameter estimates of the log of the odds ratio of the likelihood of the dependent variable occurring. When transformed through basic calculations, a measure of the percent change in the odds for a unit increase in the variable is produced—the estimated odds ratio. In other words, it produces a number that states that for each increase of one in the independent variable the odds of the dependent variable being positive (or “1”) change by a certain percentage. These percentages are listed in the table below next to the odds ratio. If the odds ratio is less than one, the odds of the event occurring are actually reduced, while if greater than one, they are increased. If it is one, the percentage change in the odds is zero. The nature of the logistic regression analysis means that the results are non-linear: at one value of X (the independent variable) the odds of Y (the dependent variable) occurring will be different than at another value of X. These changes in odds are represented in the confidence limits—the lower limit corresponds to smaller values of the variable as the upper limit does to larger values. This is the reason for calling the odds ratio estimate a point estimate—it can be considered a sort of average across all values.
Capacity as a Fundamental Objective 96
AmeriCorps* VISTA member present at survey completion An organization received a score of 1 if it had an AmeriCorps* VISTA member when it completed the survey and a 0 if it did not (for the variable vcurrent); 72 of the 273 valid responses assigned a “1”. In other words, 72 affiliates had AmeriCorps* VISTA members at the time they completed their surveys. Initially, ‘having a member when the survey was completed’ (or ‘currently’ in the rest of the text) was initially checked for being related to 18 variables: the ten community variables (of which seven were regional measures), all of the organization variables except 2001 and 2002 construction, the 1999 capacity score and the number of years in the AmeriCorps* VISTA program. Four of these were significant in the final model: the age of the affiliate, its community type, the number of full-time staff and the number of years in the AmeriCorps* VISTA program. The age of the affiliate and the number of years in the program were expected to have significant positive relationships to ‘currently’ having a member while no expectation either way was held for the other two. Roughly 58 percent of the variation in the dependent variable is explained by this model; the model itself is highly significant and as a whole is not a chance representation of the relationships among the variables.
Regarding affiliate age, with an odds ratio equal to one, the model estimates that on average the age of the affiliate has no percentage influence on the likelihood that it had an AmeriCorps* VISTA member when the survey was completed. It is possible to have a very weak or even nonexistent relationship that is statistically significant—it means that even though one variable does not have a substantial numerical impact on another variable, this minimal impact is still not likely to have occurred by chance and is therefore present in the larger set of affiliates. The data, however, does suggest that a weak relationship exists between affiliate age and program participation as defined in vcurrent. The confidence limits of the estimate intimate that older affiliates will be very slightly more likely to ‘currently’ have a member (with an upper limit of 1.001), or that larger values of X (measured by the number of days since becoming affiliated with HFHI) correspond with a 0.1 percent increase in the odds of ‘currently’ having a member. This is an important demographic to understand; younger affiliates generally have a greater need for staff support while not having the funds to hire them. The AmeriCorps* VISTA program does not appear to be meeting this need.
Table D.1: Model Specification of ‘Currently’ Having a Member
Variable % Change in
Odds Odds Ratio
Point Estimate 95% Confidence
Limits p (ChiSq) Organization age 0% 1.00 1.000-1.001 0.0439 Community type -68% 0.32 0.14-0.77 0.0112
Number of full-time staff 38% 1.38 1.11-1.76 0.0043 Years in VISTA program 203% 3.03 2.75-4.04 <0.0001
Similarly, it is important to recognize that those organizations that have had an AmeriCorps* VISTA member in the past are more likely to have them now. The odds ratio point estimate for the number of years in the AmeriCorps* VISTA program indicates that for each additional year of program participation, the likelihood that an affiliate ‘currently’ has a member increases by 200 percent. To illustrate, an affiliate in the program for three years is roughly 400 percent more likely to ‘currently’ have a member than an affiliate that stated it has a participation time of one year. This suggests that affiliates that have not participated in the program in the past may have a more difficult time competing for the limited number of AmeriCorps* VISTA slots allocated to
Capacity as a Fundamental Objective 97
Habitat affiliates. It may also indicate that affiliates are perhaps not leaving the program as envisioned, a conclusion also supported by the upper confidence limit of the estimate: as the number of years in the program increases, so do the odds of having a member.
The community type variable distinguishes between two types: rural and urban (including suburban). As discussed in Part Four, the model indicates that as the unit value increases by one (going from rural to urban), there is a 68 percent drop in the odds that an affiliate had a member when the survey was completed. The description of this data is presented in Appendix C alongside Table C.1. The odds ratio of number of full-time staff indicates that as staff size increases by one, the odds of participation in the VISTA program increase by 38 percent. This reality is mirrored in one survey respondent’s comment to why they did not apply for the program, “we do not have the staff to supervise a VISTA person.” Adequate supervision is now a common requirement for participation in the program.
Fourteen variables were insignificant in the model. The 1999 capacity score was first included and then kept because part of the goal of the modeling process was to determine whether the ‘current’ level of capacity of the organization was related to ‘currently’ having a member. It is not possible to make a conclusion about this relationship without considering former levels of capacity—there must be a baseline against which change can be measured. It was subsequently left in this model for control purposes even though insignificant; the model’s other variables’ estimates of impact are therefore all controlled by former capacity levels. The lack of any regional significance indicates that there are no areas in the U.S. among Habitat affiliates that are more likely to ‘currently’ have AmeriCorps* VISTA members than others; this is important to note given the concentration of affiliates in the Central Atlantic and Mid-America regions and the disparate distribution of program participation among regions, as presented in Table 7 in the report. Additionally, neither organization size (as measured by the total number of houses it has built) nor community wealth increases the likelihood that an affiliate had an AmeriCorps* VISTA member when it returned the survey. Interestingly, community wealth does matter for the next AmeriCorps* VISTA participation measurement variable.
Having had an AmeriCorps* VISTA member during the past three years An organization received a “Yes” for the program participation variable VISTA if it met two qualifications: first, it had applied to have an AmeriCorps* VISTA member in the past three years, and second, it had been assigned a member for at least part of one year during this time (even if it did not currently have a member). However, because multiple applications are possible over time, this did not rule out organizations that sponsored members previous or contiguous to three years ago. Fortunately, this aspect is controlled for to some degree with the inclusion of the 1999 capacity score. Nonetheless, this decision rule does ensure that the variable ‘has had a member in the past three years’ counts as positive only those organizations that have had members since 1999, the number of which is 102 (of 273).
The same eighteen variables included in the analysis of ‘currently’ having an AmeriCorps* VISTA member were used in the initial model for this program participation variable. Of these, four remained statistically significant throughout the analysis, as shown in Table D.2: affiliate age, the 1999 capacity score, and two regional location variables representing the Southeast and Central Atlantic regions. Holding the other variables constant, the age of the affiliate has a very similar influence on the likelihood of having had a member in the past three years as it did on ‘currently’ having a member—younger affiliates are less likely to have them.
The 1999 capacity score was significant in this equation as it was not in that measuring ‘current’ program participation. This implies that capacity levels do influence whether organizations will have AmeriCorps* VISTA members, at least over the long-term (which this variable measures).
Capacity as a Fundamental Objective 98
Table D.2: Model Specification of Having a Member in Past Three Years
Variable % Change in
Odds Odds Ratio
Point Estimate 95% Confidence
Limits p (ChiSq) Organization age 0% 1.00 1.000-1.001 0.0312
Central Atlantic Region 311% 4.11 1.96-8.64 0.0002
WALD Score: 32.92 R-Sq: 0.19
p (ChiSq): <0.0001 Testing VISTA = 1
Capacity Variables
Six different capacity variables were analyzed: total capacity score and the five capacity dimensions: organizational, financial, networking, advocacy and programmatic. Because each one emphasizes a different aspect of capacity, a more complex picture of the relationship between participation in the AmeriCorps* VISTA program and affiliate capacity levels is possible when all are analyzed. Each of the models is described below. Because all are forms of capacity, the same explanatory variables were used to analyze each of them, although it will be apparent that different combinations of these variables matter for different types and forms of capacity.
Note that the concept of capacity incorporates a large number of variables that may themselves be considered determining factors in certain situations, particularly when evaluating outcomes. Often organizational characteristics such as having an executive director or a strategic plan can be used to determine what qualities an organization needs to be successful. In the case of capacity, however, these are generally considered inherent qualities. They are assumed to be important for the overall success of the organization—based on other studies that mark them so— and thus were incorporated into the index instead of used as control factors for its variance. Because of this, the control variables for level of capacity are few: they are those listed above as community and organizational characteristics.
Of course, the main purpose of the analysis is to determine if there is a correlation between AmeriCorps* VISTA program participation and affiliate capacity level, so the measures of participation must be incorporated. In this analysis, the variables that measure whether the organization had a member in the past three years (VISTA) and the number of years in the program (vyears) were used. When looking at the capacity dimensions, variables indicating in which activities AmeriCorps* VISTA members are involved in their affiliates were also included in the analysis.
Total capacity score This is the only capacity variable used that measures the entire scope of capacity-related organization activities. It has the greatest variability in score because of this. The initial model included nineteen explanatory variables: the community characteristics (including the seven regional variables), the organization control variables, and two AmeriCorps* VISTA program participation measures (having had a member over the past three years and the number of years in the program). Seven variables proved to have significant relationships with the total capacity score, as listed in Table D.3 (and discussed in Part Five of the report).
Capacity as a Fundamental Objective 99
The impact of AmeriCorps* VISTA program participation The significance of the program participation variable that indicates whether an affiliate has had a member in the past three years means that, controlling for all the other organizational and community characteristics in the model, including former capacity levels, higher total capacity scores correlate with participation in the AmeriCorps* VISTA program. Determining this impact was the central goal of this project, making this conclusion very important. It is difficult to conclude absolutely from the survey data whether having a member actually increases capacity— VISTA presence could be the result of higher capacity levels instead. There is, therefore, some truth to the conclusion: organizations do need to have certain qualities in order to be accepted into the AmeriCorps* VISTA program (some supervisors require organizations to have strategic plans, for example) and then to support the members during their service. However, there is a lot of latitude concerning the nature of these qualities in the way the program is administered. In reality, every program varies in terms of staff size and duties, programs offered, funding options, community size, etc., such that it is difficult to say that one type of organization consistently receives AmeriCorps* VISTA members over another type. While some of these patterns are evident in the data from this study, none of these is absolute—organizations do not fall into neat categories. The variety inherent in the set of organizations supports the hypothesis that members do contribute to higher levels of capacity in their organizations. This conclusion is supported further by the significance of the other variables in the model and the results of the interviews conducted with executive directors.
Other related variables Only one community characteristic, the median income of the area, showed significance in the model. Although the estimated impact is small, affiliates in wealthier communities on average have higher capacity scores. None of the regional variables was statistically significant, indicating that when holding for all other variables, affiliate capacity scores do not vary by national regional location. Neither the number of churches in the community nor the community type (rural or urban) mattered when the effects of the other variables were considered.
As discussed in Part Five, several organization characteristics are positively and significantly related to the capacity level of an organization. These are: age of the affiliate, the number of full-time staff, whether the organization has dedicated office space, whether the organization has received technical assistance in the past three years, and the 1999 capacity score (listed above as a capacity variable). The affiliate size, as operationalized by the number of total houses built, was never significant and did not change the rest of the model parameter estimates when it was removed. The importance of the five variables measuring organizational characteristics is easily explained. First, regarding organization age, generally older affiliates have more experience and thus more capacity. Second, the 1999 capacity score also has a significant relationship with total capacity score. Organizations with higher levels of capacity in the past generally have higher levels now. Similarly, having more staff corresponds with having a higher score on the total capacity measure.
Having an office is also related to high capacity levels; organizations with designated office space on average will have a 7.4 point higher capacity score. While one cannot say that having an office objectively causes higher capacity, certainly it enables organizations to perform their duties more easily and efficiently. It is often featured in other capacity literature as an organizational necessity. Finally, the relevance of the technical assistance variable shows that participating in at least one technical assistance activity during the past three years is related to higher capacity levels. Again, to say that it is a causal relationship is questionable, but the goal of assistance is to create positive change in organizations. Because the incidence of technical assistance ostensibly occurred before the capacity score was determined (and controlling for previous capacity levels through the 1999 capacity score), one can avoid concluding from this
Capacity as a Fundamental Objective 100
data that higher capacity levels lead organizations to engage in technical assistance activities (although it may also be true).
Table D.3: Model Specification of Total Capacity Score Variable Parameter Estimate Standard Error p (alpha = 0.05)
VISTA program participant 3.61 1.42895 0.0121 1999 capacity score 0.48 0.08327 <0.0001
Organization age 0.001 0.00045 0.0296 Technical assistance received 4.03 1.30447 0.0022
Number of full-time staff 1.77 0.34764 <0.0001 Type of office space 7.44 1.66767 <0.0001
Median income of service area 0.0001 0.00003 0.0002 Intercept 25.46 2.59028 <0.0001
F: 49.04 Adj. R-Sq: 0.55 p: <0.0001
Condition Index*: 12.67 Specification Test*: p = 0.19 > ChiSq *See the end of the appendix for a description of the condition index and specification test.
Originally, both AmeriCorps* VISTA program participation measures were included in the analysis of total capacity score. This proved to be undesirable due to the strength of their relationship. A measure of the degree of co-variance between two variables, the Pearson correlation coefficient value, indicates high collinearity (perfect collinearity exists when a unit change in one variable causes a one unit change in a second) when it is above 0.80. The Pearson coefficient was 0.794 between having had a member in the past three years and the total number of years in the program. This makes their concurrent use somewhat questionable because, if they vary similarly, they could be measuring the same thing, thereby obscuring the separate impact of both. Thus, it was necessary to remove one or the other to clarify the model even though both showed a degree of significance. The final removal of ‘number of years in the program’ (vyears) from the model created more than 0.02 change in the estimate of only one variable, ‘program participation in the past three years’ (VISTA). Its parameter estimate dropped from a value of 4.63 (p=0.0352) to 3.77 (p=0.0082). It did not change the adjusted R-squared value but did increase the F-score by four. Because of these factors, not accounting for the number of years in the program was considered more correct.
Capacity Dimensions
In general, the AmeriCorps* VISTA measurement variables do not appear to contribute significantly to the variance of the scores of the five capacity dimensions: organizational, financial, networking, advocacy and programmatic. The dimension with which program participation has a significant relationship, organizational capacity, has the greatest variability with a possible score of 55. The other dimensions range only between five and 18. This smaller score variability could possibly contribute to the insignificance of a large number of the variables and augment the significance of those that are important in the models (further discussion in Part Five is available on this issue).
Capacity as a Fundamental Objective 101
Organizational Capacity
The initial model for organizational capacity (OC) included nineteen variables: the organizational and community variables listed above (except region the 2001 and 2002 construction), the 1999 capacity score, the four other capacity dimension variables, and several AmeriCorps* VISTA participation variables, including member work in the areas of family support, organizational development and volunteer management. Of these, seven remain in the final model, as displayed in Table D.4. The first six listed are discussed in Part Five of the report.
This model highlights the significance of an AmeriCorps* VISTA presence in affiliates. It suggests that, holding the other six variables equal, an organization that has an AmeriCorps* VISTA member working in the area of volunteer management will, on average, have a 2.73 higher organizational capacity score than an organization that does not, which equates to a 5.0 percent difference in score (the maximum score being 55).
Table D.4: Model Specification of the Organizational Capacity Dimension Variable Parameter Estimate Standard Error p (alpha = 0.05)
VISTA in volunteer mgmt. 2.73 0.88349 0.0022 1999 capacity score 0.30 0.04817 <0.0001
Advocacy capacity 0.78 0.24988 0.0019 Number of full-time staff 0.72 0.19465 0.0003 Tech. assistance received 1.72 0.76435 0.0254
Intercept 14.05 1.52286 <0.0001
F: 50.97 Adj. R-Sq: 0.56 p: <0.0001
Condition Index: 12.59 Specification Test: p = 0.48 > ChiSq
Financial capacity Most of the same variables were again analyzed against the dimension of financial capacity. As with the other dimensions, variables measuring the work of AmeriCorps* VISTA members were included to see if they correlated significantly with financial capacity. The full model contained the following twenty variables: the organizational and community variables listed above (except region the 2001 and 2002 construction), the 1999 capacity score, the four other capacity dimension variables, and several AmeriCorps* VISTA participation variables, including member work in the areas of fundraising, organizational finances, organizational development and volunteer management. Of these, six were significant, none of which was an AmeriCorps* VISTA variable.
Capacity as a Fundamental Objective 102
Table D.5: Model Specification of the Financial Capacity Dimension Variable Parameter Estimate Standard Error p (alpha = 0.05)
Condition Index: 13.65 Specification Test: p = 0.50 > ChiSq
The relationships between financial capacity and the dimensions of organizational and networking capacity are again demonstrated in this model. The 1999 capacity score was not significant; why it was so is hard to surmise—one would expect that higher overall capacity scores in the past would be related to higher financial capacity scores now. This did not prove to be the case, however—one possible explanation is that all organizations have worked to improve their financial standing in recent years as funding issues have come to the fore, making past differences less relevant. The information on organization size and the area median income is presented in Part Five.
Networking capacity The dimension of networking capacity did not have organization size as a significant explanatory variable as did financial capacity. Table D.6 lists the details of the model. Again, the analysis originally consisted of testing the relationships to this capacity dimension of the four other dimensions, the 1999 capacity score, the organizational and community characteristics and having a member working in public relations. The age of the affiliate, its location (rural versus urban) and whether it had dedicated office space were the three non-capacity variables that were significant in the model. The only other variables showing significance were the measures of the dimensions of organizational, financial and advocacy capacity. As with the other dimensions, these relationships are discussed in Part Five.
Capacity as a Fundamental Objective 103
Table D.6: Model Specification of the Networking Capacity Dimension Variable Parameter Estimate Standard Error p (alpha = 0.05)
Advocacy capacity 0.28 0.10976 0.0116 Organization age 0.0003 0.00011 0.0042
Type of community (rural/urban) 0.88 0.35407 0.0134
Type of office 1.56 0.42185 0.0003 Intercept -2.09 3.87721 0.0017
F: 34.75 Adj. R-Sq: 0.43 p: <0.0001
Condition Index: 14.49 Specification Test: p = 0.52 > ChiSq
Advocacy capacity Only three of the nineteen variables modeled for advocacy capacity were ever significant at even a low to medium level of significance (alpha = 0.1): organization size and the dimensions of organizational and networking capacity. Given the other models’ indications about the significant relationships between the capacity dimensions, that two of them were also significant here was not surprising. It further illustrates that the dimensions’ scores rise and fall together— whether these relationships are causative or simply correlative is unknown. Further tests are required to determine the exact nature of the interrelationships of the dimensions, especially since programmatic capacity, as discussed in the report, does not have a significant relationship to any of the others. They interact quite strongly with each other—separating out the role of each in the others may well be impossible. The role and significance of organization size is discussed in Part Five of the report.
Table D.7: Model Specification of the Advocacy Capacity Dimension Variable Parameter Estimate Standard Error p (alpha = 0.05)
Condition Index: 11.19 Specification Test: p = 0.07 > ChiSq
Programmatic capacity The model of the programmatic capacity dimension exhibits some relationships unlike those of the other capacity dimensions. Most importantly, no other dimension significantly correlates with this one. Of the nineteen variables considered (including two measuring having members
Capacity as a Fundamental Objective 104
working in the construction and family support areas), only the age of the affiliate and the number of full-time staff are significantly related to programmatic capacity. The 1999 capacity score was insignificant, as was the organization size. This latter non-relationship was unexpected— organizations that are producing a larger number of houses would ostensibly have better capacity in the areas that directly involve housing production. Instead, its insignificance to programmatic capacity probably reflects all affiliates’ need for land (4 of the 10 possible programmatic capacity points are given for having enough land to maintain construction for the next two years). Only 116 of the 273 affiliates responding to the survey (42 percent) marked that they had enough land for future construction.
The age of the affiliate does have a positive relationship with the programmatic capacity score, however, indicating that for each one year increase in age, the capacity score increases on average by 0.082 (365 multiplied by 0.00023), controlling for the effects of the other variables. This means that, on average, an organization that is about twelve years older will have a programmatic capacity score one point higher, a 10 percent difference. The impact of full-time staff is larger: for every increase of one in the number of full-time staff, the score on average increases by 0.21. Similarly, although not significant at the strict 0.05 level, having received technical in the past three years has a potentially strong influence on the programmatic capacity score. See Part Five for more discussion of these relationships.
Table D.8: Model Specification of the Programmatic Capacity Dimension Variable Parameter Estimate Standard Error p (alpha = 0.05)
Number of full-time staff 0.21 0.07676 0.0065 Organization age 0.00023 0.00010 0.0257
Tech. assistance received 0.53 0.29720 0.0765 Intercept 3.44 0.39261 <0.0001
F: 10.59 Adj. R-Sq: 0.096 p: <0.0001
Condition Index: 6.52 Specification Test: p = 0.41 > ChiSq
Production Variable: Number of Houses Planned for 2002
The variable nohs02 measures the proposed housing construction for the current year, 2002. It is used here as a proxy for production. The reasons for this are discussed in Part Five. Nineteen variables were tested for relationships in its regression model. These included: having a member in the past three years, the number of years in the AmeriCorps* VISTA program, the total capacity score and the 1999 capacity score, the number of houses built in 2001, and all of the organizational and community characteristics. The first regression revealed three significant variables: the total capacity score, the percentage capacity score, the number of houses built in 2001 and the Mid-America regional affiliate location. Even after removing several other insignificant variables, these same three remained significant throughout the analysis. The 2001 construction was included as a critical control variable, explaining nearly 50 percent of the model on its own. Intuitively, the number of houses built last year should correlate to the number built this year and thus must be controlled for, although its causative effects are meaningless. As shown in the model, there is nearly a one-to-one relationship between the production levels of 2001 and 2002 (for each one house built in 2001, the number of houses built in 2002 increases by
Capacity as a Fundamental Objective 105
0.94). Organization age remained in the model because of its valuable control properties, even though it is highly insignificant. The variables measuring the number of full-time staff and the median income of the area, although insignificant, also remain in the model because of their control value are.
The significance of the total capacity score is good news for scholars and practitioners hoping to establish that capacity levels are relevant for production. This data supports this relationship between capacity and production. The level of significance strongly suggests that this relationship is likely to be present in the full set of organizations. In this study, however, with the sample available, the impact is small. For each increase of one point in total score, the number of houses built increases, on average holding for the effects of the other variables, by only 0.046. This means that the capacity score would have to increase by 21.7 points to increase by one the number of houses built annually, holding equal all other variable values. If capacity were all that mattered, given the range of capacity levels in this study (22 to 91) and this level of impact on production, one would expect to see those organizations with the highest capacity scores producing only about four houses more than those at the lowest levels. This is obviously not the case.
Table D.9: Model Specification of Production (Number of Houses Planned in 2002) Variable Parameter Estimate Standard Error p (alpha = 0.05)
Total capacity score 0.046 0.01340 0.0008 2001 houses built 0.94 0.03512 <0.0001
Mid-America region -1.10 0.42144 0.0094 Organization age 0.00014 0.00012 0.2181
Number of full-time staff 0.20 0.12521 0.1199 Median income of area 0.00001 0.00001 0.2239
Intercept -1.76 0.72161 0.0152
F: 455.05 Adj. R-Sq: 0.91 p: <0.0001
Condition Index: 14.00 Specification Test: p = 0.15 > ChiSq
One other variable was significant in the model besides the total capacity score and the number of houses built in 2001. The Mid-America regional variable marks affiliates that are located in Indiana, Kentucky, Ohio and Tennessee. Based on the value and direction of the parameter estimate, affiliates in these states build one less house on average than all other affiliates in the nation. No other regional variables were significant. Why this particular region should, as a whole, be building fewer houses across affiliates is unknown; an answer cannot even be speculated. It is not due to the age or size of the organizations, for these are controlled in the model. It is probably not either the potentially largely rural location, because community type was highly insignificant in the model.
The Condition Index Test and Specification Test
In many of the tables two pieces of analysis are displayed. The first is called the Condition Index. This is a test that measures the degree to which the variables in the model are related to each other. If the value is above 80, it may indicate that two or more variables in the model vary so similarly (exhibit multicollinearity) that when both are included, the results do not reflect the true impact of the variables. As one of several tests measuring this effect, if it alone is high, the problem is small. However, if the Condition Index is high and several other tests also indicate multicollinearity, then the problem is large. Typically, when it is a large problem, it is
Capacity as a Fundamental Objective 106
appropriate to remove one of the offending variables (having similar variance means that they essentially measure the same concept so one can be removed and the effect on the model is the same). The test results were included to show that multicollinearity is not a problem in the analysis.
The second item is called the Specification Test. It is the equivalent to the White’s Test for homoskedasticity in the statistics program used here. This measures the degree to which the error in the estimated value stays the same no matter the score for a particular variable (the heteroskedasticity of the model). If it is below 0.05, there are concerns that the model is not fit. Solutions include, again, removing or adding variables, changing the form of the model, or adding data. Again, as should be apparent, none of the models exhibits a problematic score on this test, indicating that heteroskedasticity was not a problem in the models.
Capacity as a Fundamental Objective 107
Appendix E: Limitations of Study
There are four limitations to the comprehensiveness, generalizability and validity of this study. While none prevents significant and valid conclusions from being made from the sampled data, they do urge caution when making sweeping statements.
1. The need to keep the index to a reasonable size and the use of a survey as the main measurement instrument potentially has limited the validity of the index in its representation of the abilities needed for an organization to be successful (the study by LaMore (unpublished), for example, used a thirty-one page survey). Naturally, not all factors for success could be included; they are not all even known. Improvements are certainly welcome in this area. At the same time, however, there is confidence in the propriety of using the number and quality of literary references as the measure of a characteristic’s importance, particularly because those reviewed typically were investigating several different qualities. None considered using only one indicator.
2. The exclusive focus on Habitat for Humanity affiliated organizations limits the generalizability of the sample conclusions. It could be argued that the results are only applicable to this set of organizations. However, generalization to other types of housing organizations may be considered. Further research would need to be conducted to determine its applicability to this larger set of organizations.
3. Likewise, because abilities needed for success differ to some degree across types of organizations and service areas, the capacity index used herein is not completely applicable to a wide set of various types. This is especially true regarding the programmatic capacity dimension components.
4. As with all sample data, it is possible that the sample does not accurately reflect the population of organizations. Even though the response rate of 51 percent is reasonably respectable for a mail survey, it may be that non-respondents are markedly different from respondents. Given that two sets of organizations were combined into even though they were sampled differently (the entire group of AmeriCorps* VISTA sponsors were surveyed while only a random sample of non-sponsors was included), the disparate response rates between the two groups may have skewed the overall picture. This was necessary to do, however, to ensure that an adequate number of AmeriCorps* VISTA sponsors were included for comparison against the larger set of non-sponsors. Attempts were made to compare the sampled set to the national set of affiliates, but along at least one known quality (the level of construction in 1999—see Appendix C), the sample data did not match the national data. In other aspects (regional location and age) there was concord.
Bradshaw, P., Murray, V., & Wolpin, J. (1992). Do nonprofit boards make a difference? an exploration of the relationships among board structure, process, and effectiveness. Nonprofit & Voluntary Sector Quarterly, 21, 227–249.
Corporation for National Service. (1995). Selection of AmeriCorps* VISTA sponsors and projects; guidelines. Federal Register, 60, FR 7172.
Corporation for National & Community Service. (1998). Project progress report: AmeriCorps* VISTA. (CNCS Form 1433). Washington, D.C.: Author.
―. (2001). Step-by-step: a Guide to partnering with AmeriCorps* VISTA. Washington, D.C.: Author.
Congressional Statement of Purpose, Ch. 66: National Volunteer Antipoverty Programs: Volunteers in Service to America, Domestic Volunteer Service Act. 42 U.S.C. §4951. 2002.
De Vita, C. & Fleming, C. (Eds.). (1991). Building capacity in nonprofit organizations. Washington, D.C.: The Urban Institute.
Draper, L. (2000). How to ‘do’ capacity building. Foundation News & Commentary, 41 (5), 32– 36.
Fredericksen, P. & London, R. (2000). Disconnect in the hollow state: the pivotal role of organizational capacity in community-based development corporations. Public Administration Review, 60, 230–239.
Gargan, J. (1981). Consideration of local government capacity. Public Administration Review, 41, 649–658.
Capacity as a Fundamental Objective 109
Glickman, N.J. & Servon, L.J. (1998). More than bricks: five components of community development corporation capacity. Housing Policy Debate, 9, 497–539.
―. (2000). By the numbers: measuring community development corporations’ capacity. (Report to the Ford Foundation). New Brunswick, NJ: Center for Urban Policy Research. Retrieved September, 2001, from http://policy.rutgers.edu/cupr/ford/btn.pdf
Green, J. & Griesinger, D. (1996). Board performance and organizational effectiveness in nonprofit social services organizations. Nonprofit Management & Leadership, 6, 381–402.
Gubbels, P. & Koss, C. (2000). From the roots up: strengthening organizational capacity through guided self-assessment; World Neighbors field guide: capacity building. Oklahoma City: World Neighbors. Search at: www.wn.org
Habitat for Humanity International. (2000a). A Model for affiliate capacity building: a manual. Americus, GA: Author.
―. (2000b). Standards of excellence (evaluation worksheet). Americus, GA: Author.
―. (2001a). Reflections on capacity (handout). Americus, GA: Author.
―. (2001b). September 2001 HFH external directory of all United States affiliates. (Report ID #Aff210). Americus, GA: Author.
―. (2002). Capacity building: investing in the future; Habitat for Humanity and the Capacity Building Fund. Retrieved June, 2002, from http://www.habitat.org/gov/cb.html
Herman, R.D. & Renz, D.O. (1997). Multiple constituencies and the social construction of nonprofit organization effectiveness. Nonprofit & Voluntary Sector Quarterly, 26, 185–206.
―. (2000). Board practices of especially effective and less effective local nonprofit organizations. American Review of Public Administration, 30, 146–160.
Honadle, B. (1981). A Capacity-building framework: a search for concept and purpose. Public Administration Review, 41, 575–580.
Capacity as a Fundamental Objective 110
―. (1986). Defining and doing capacity building: perspectives and experiences. In Honadle, B. & Howitt, A. (Eds.), Perspectives on management capacity building (pp. 9–23). Albany: State University of New York.
Housing Assistance Council. (2000). A Nonprofit capacity self-assessment workbook for rural community-based housing organizations. Retrieved April, 2001, from http://www.ruralhome.org/pubs/workbooks/saworkbook/contents.htm
Knauft, E., Berger, R. & Gray, S. (1991). Profiles of excellence: achieving success in the nonprofit sector. San Francisco: Jossey-Bass.
LaMore, R. (n.d). Affordable housing development: relating capacity to production. (Unpublished).
Letts, C.W., Ryan, W.P., & Grossman, A. (1999). High performance nonprofit organizations: managing upstream for greater impact. New York: John Wiley & Sons.
Mayer, N. (1983). How neighborhood development organizations succeed and grow. In Clay, P. & Hollister, R. (Eds.), Neighborhood policy and planning (pp. 151–164). Lexington, MA: Lexington Books, D.C. Heath & Co.
Nye, N. & Glickman, N.J. (2000). Working together: building capacity for community development. Housing Policy Debate, 11, 163–198.
Rochester, C. (1999). A Handbook for small voluntary agencies: building the capacity of small voluntary agencies. London: Centre for Voluntary Organisations, London School of Economics & Political Science. Retrieved September, 2001, from http://www.lse.ac.uk/Depts/ccs/pdf/handbook_for_small_voluntary_agencies.pdf
Sheehan, Jr., R. (1996). Mission accomplishment as philanthropic organization effectiveness: key findings from the Excellence in Philanthropy Project. Nonprofit & Voluntary Sector Quarterly, 25, 110–123.
Sidor, J. (1990). Assessing community-based organization capacity. Washington, D.C.: National Congress for Community Economic Development.
Slesinger, L. (1991). Self-assessment for nonprofit governing boards: questionnaire for board members. Washington, D.C.: National Center for Nonprofit Boards.
Capacity as a Fundamental Objective 111
USAID Center for Development Information and Evaluation. (2000). Measuring institutional capacity. TIPS: Recent practices in monitoring and evaluation, (Vol. 15). Retrieved November, 2001, from www.dec.org/pdf_docs/pnacg612.pdf & Annexes: www.dec.org/pdf_docs/pnacg624.pdf


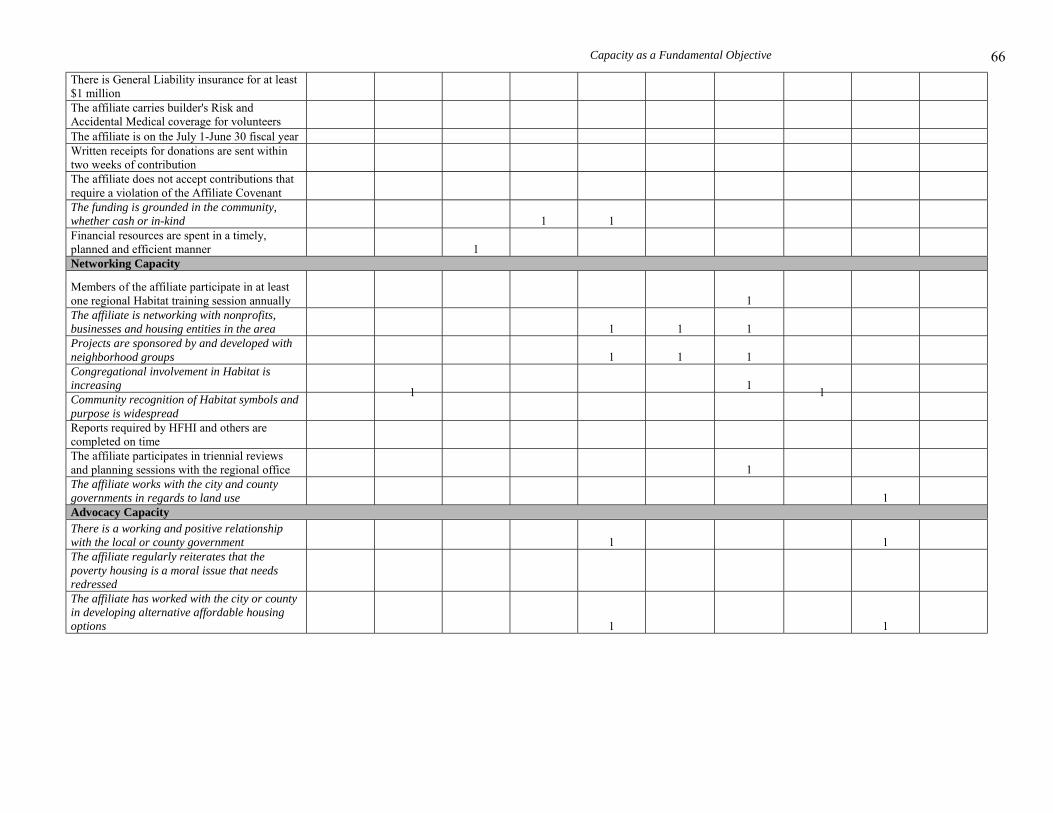


![[PPT]Implementation of the Fundamental Five - Grand … · Web viewFrame the lesson Frame the Lesson Objective Product Objective By knowing where you intend to go, you increase the](https://static.documents.pub/doc/80x56/5aeecc187f8b9a572b8d34f8/pptimplementation-of-the-fundamental-five-grand-viewframe-the-lesson-frame.jpg)


