Live Webcast Hosted By: Jeffrey Sherman, CFA Deputy Chief Investment Officer Portfolio Manager DoubleLine Shiller Enhanced CAPE® (DSEEX/DSENX) DoubleLine Shiller Enhanced International CAPE® (DSEUX/DLEUX) November 14, 2017 CAPE®: Building Blocks for a Global Equity Allocation
Transcript
Live Webcast Hosted By:
Jeffrey Sherman, CFA Deputy Chief Investment Officer Portfolio Manager
DoubleLine Shiller Enhanced CAPE®(DSEEX/DSENX)DoubleLine Shiller Enhanced International CAPE®(DSEUX/DLEUX)
November 14, 2017
CAPE®: Building Blocks for a Global Equity Allocation
DoubleLine CAPE® Webcast 11-14-2017 1
Fund Offerings
Retail and Institutional ClassNo Load Mutual Fund
Retail Inst.N-share I-share
Ticker DSENX DSEEXMin Investment $2,000 $100,000Min IRA Investment $500 $5,000Gross Expense Ratio 0.89% 0.64%
DoubleLine ShillerEnhanced CAPE®
The funds’ investment objectives, risks, charges and expenses must be considered carefully before investing. The statutory and summary prospectuses contain this and other important information about the investment company, and may be obtained by calling 1 (877) 354-6311/1 (877) DLine11, or visiting www.doublelinefunds.com. Read carefully before investing.1. The Advisor has contractually agreed to waive a portion of fees and reimburse expenses through December 21, 2018.Mutual fund investing involves risk; Principal loss is possible. Investments in debt securities typically decrease when interest rates rise. This risk is usually greater for longer-term debt securities. Investments in lower-rated and non-rated securities present a greater risk of loss to principal and interest than higher rated securities. Investments in asset-backed and mortgage-backed securities include additional risks that investors should be aware of including credit risk, prepayment risk, possible liquidity and default as well as increased susceptibility to adverse economic developments. Investments in foreign securities, which involve political, economic, and currency risks, greater volatility, and differences in accounting methods. These risks are greater for investments in emerging markets. The Fund may use certain types of exchange traded funds or investment derivatives. Derivatives involve risks different from, and in certain cases, greater than the risks presented by more traditional investments. Derivatives may involve certain costs and risks such as liquidity, interest rate, market, credit, management and the risk that a position could not be closed when most advantageous. Investing in derivatives could lose more than the amount invested. ETF investments involve additional risks such as the market price trading at a discount to its net asset value, an active secondary trading market may not develop or be maintained, or trading may be halted by the exchange in which they trade, which may impact a fund's ability to sell its shares. The Fund may use leverage which may cause the effect of an increase or decrease in the value of the portfolio securities to be magnified and the fund to be more volatile than if leverage was not used.Opinions expressed are subject to change at any time, are not forecasts and should not be considered investment advice.Fund holdings and sector allocations are subject to change and are not a recommendation to buy or sell any security.Diversification does not assure a profit or protect against loss in a declining market.DoubleLine Funds are distributed by Quasar Distributors, LLC.While the Funds are no-load, management fees and other expenses still apply. Please refer to the prospectus for further details.
Retail and Institutional ClassNo Load Mutual Fund
Retail Inst.N-share I-share
Ticker DLEUX DSEUXMin Investment $2,000 $100,000Min IRA Investment $500 $5,000Gross Expense Ratio 1.29% 1.04%Net Expense Ratio1 0.91% 0.66%
DoubleLine Shiller Enhanced International CAPE®
DoubleLine CAPE® Webcast 11-14-2017 2
DSEEX Standardized Performance
Performance data quoted represents past performance; past performance does not guarantee future results. The investment return and principal value of an investment will fluctuate so that an investor's shares, when redeemed, may be worth more or less than the original cost. Current performance of the fund may be lower or higher than the performance quoted. Performance data current to the most recent month-end may be obtained by calling 213-633-8200 or by visiting www.doublelinefunds.com. The performance information shown assumes the reinvestment of all dividends and distributions.
Performance data quoted represents past performance; past performance does not guarantee future results. The investment return and principal value of an investment will fluctuate so that an investor's shares, when redeemed, may be worth more or less than the original cost. Current performance of the fund may be lower or higher than the performance quoted. Performance data current to the most recent month-end may be obtained by calling 213-633-8200 or by visiting www.doublelinefunds.com. The performance information shown assumes the reinvestment of all dividends and distributions.1. The Advisor has contractually agreed to waive a portion of fees and reimburse expenses through December 21, 2018.
Jeffrey Gundlach – December 12, 2017Total Return Bond Fund WebcastGo to www.doublelinefunds.com, Home page under “Webcasts”2017 Webcast Schedule to register1:15 pm PDT/4:15 pm EDT
Jeffrey Gundlach – January 12, 2018Just Markets 2018 WebcastGo to www.doubleline.com, Home page under “Webcasts”2018 Webcast Schedule to register1:15 pm PDT/4:15 pm EDT
• The DoubleLine Shiller Enhanced CAPE® Strategy creates “Double Value” for investors when combining two unique sources of value:
– The Shiller Barclays CAPE® U.S. Sector Index attempts to shift portfolio exposures to the “cheapest” sectors of the U.S. large cap equity market
– DoubleLine’s Fixed Income strategy strives to shift its exposures to the “cheapest” sectors of the fixed income markets.
• Both strategies offer a value play in their respective markets, and when combined investors receive “Double Value.”
DoubleLine CAPE® Webcast 11-14-2017 7
DoubleLine Shiller Enhanced CAPE® Structure
DoubleLine ShillerEnhanced CAPE®
Smart AlphaDoubleLine
Actively Managed Fixed Income
Portfolio
Smart BetaShiller Barclays
CAPE® US Sector TR USD Index
Initial Investment
* A portion of the Initial Investment may be pledged as collateral under the swap** Market fluctuations may preclude full $1 for $1 exposure between the swaps and the fixed income portfolio
• The distinct structure of the DoubleLine Shiller Enhanced CAPE® Strategy allows investors to simultaneously access returns of the equity markets and fixed income markets. By using an equity index swap, $1 invested in the strategy provides approximately $1 of exposure to each market.
DoubleLine CAPE® Webcast 11-14-2017 8
What is Double Value?
For definitions, please see the Appendix.
• The DoubleLine Shiller Enhanced International CAPE® Strategy creates “Double Value” for investors when combining two unique sources of value:
– The Shiller Barclays CAPE® Europe Sector Net Index attempts to shift portfolio exposures to the “cheapest” sectors of the European large and mid cap equity market
– DoubleLine’s Fixed Income strategy strives to shift its exposures to the “cheapest” sectors of the fixed income markets.
– As with the U.S. version both strategies offer a value play in their respective markets, and when combined investors receive “Double Value.”
DoubleLine CAPE® Webcast 11-14-2017 9
DoubleLine Shiller Enhanced
International CAPE®
DoubleLine Actively Managed
Fixed Income Portfolio
Shiller Barclays CAPE® Europe
Sector Net Index
Initial Investment
* A portion of the Initial Investment may be pledged as collateral under the swap** Market fluctuations may preclude full $1 for $1 exposure between the swaps and the fixed income portfolio
DoubleLine Shiller Enhanced International CAPE®
DoubleLine CAPE® Webcast 11-14-2017 10
TAB IIU.S. Macroeconomic Landscape
DoubleLine CAPE® Webcast 11-14-2017 11
U.S. Conference Board Leading Economic IndicatorsDecember 31, 1986 to September 30, 2017
• U.S. economy still appears to be undergoing expansion
Source: Bloomberg, DoubleLineMoM: Month-over-monthConference Board U.S. Leading Index (LEI): An index published monthly by the Conference Board used to predict the direction of global economic movements in the months to come. It is made up of 10 economic components, whose changes tend to precede changes in the overall economy.
DoubleLine CAPE® Webcast 11-14-2017 12
U.S. Unemployment Rate vs. 12mo Simple Moving AvgJanuary 1, 1948 to September 30, 2017
Source: Bloomberg, DoubleLineMov. Avg. spread: Moving Average SpreadU-3 Rate: Official unemployment rate per the ILO definition occurs when people are without jobs and they have actively looked for work within the past four weeks.
TAB IIISmart Beta: Shiller Barclays CAPE® U.S. Sector Index
DoubleLine CAPE® Webcast 11-14-2017 15
Shiller Barclays CAPE® U.S. Sector Index
DoubleLine ShillerEnhanced CAPE®
DoubleLine Actively Managed
Fixed Income Portfolio
Shiller Barclays CAPE® US Sector
TR USD Index
Initial Investment
* A portion of the Initial Investment may be pledged as collateral under the swap** Market fluctuations may preclude full $1 for $1 exposure between the swaps and the fixed income portfolio
DoubleLine CAPE® Webcast 11-14-2017 16
Country Exposure:Shiller Barclays CAPE® US Sector Index
• The Shiller Barclays CAPE® US Sector Index captures large cap companies across the 10 S&P 500 sectors
Source: Wikimedia
DoubleLine CAPE® Webcast 11-14-2017 17
What is the CAPE® Ratio?
Inflation = the rate of change of prices calculated on a monthly or annual basis.P/E = Price Earnings Ratio is the valuation ratio of a company’s market value per share divided by the company’s earnings per share (EPS).Shiller Barclays CAPE US Sector TR USD Index incorporates the principles of long-term investing distilled by Dr. Robert Shiller and expressed through the CAPE® (Cyclically Adjusted Price Earnings) ratio (the “CAPE® Ratio”). It aims to identify undervalued sectors based on a modified CAPE® Ratio, and then uses a momentum factor to seek to mitigate the effects of potential value traps. You cannot invest directly in an index.
• Acclaimed value investors Benjamin Graham and David Dodd noted in Security Analysis that equity valuations tend to follow a business cycle of 3-7 years
• The CAPE® Ratio was formulated in the seminal 1988 piece1 from Professor Robert Shiller and John Campbell.
• The CAPE® ratio seeks to assess longer term equity valuation by using an inflation adjusted earnings horizon that is 10 times longer than the traditional P/E measure
• Similar to the traditional P/E the CAPE® can be applied to a portfolio of equities, a sector or a broad based index
1. Campbell, J. Y., and R. J. Shiller, “Stock Prices, Earnings, and Expected Dividends,” Journal of Finance, 43:3, 661-76, 1988
DoubleLine CAPE® Webcast 11-14-2017 18
• To account for idiosyncratic differences between sectors where CAPE® Ratios have historically been of different magnitudes one can construct a Relative CAPE® Ratio
• This may allow investors to compare sector valuations on a level playing field
• The Relative CAPE® Ratio is used to compare relative valuation among equity sectors
Relative CAPE® Indicator
Source: Changing Times, Changing Values: A Historical Analysis of Sectors within the US Stock Market 1872-2012, Oliver D. Bunn and Robert J. Shiller, September 4, 2012.Data Updated through 2016 from Barclays.Any data on past performance, modelling or back-testing contained herein is no indication as to future performance. See Historical Index Performance Disclaimer.Shiller Barclays CAPE US Sector TR USD Index incorporates the principles of long-term investing distilled by Dr. Robert Shiller and expressed through the CAPE® (Cyclically Adjusted Price Earnings) ratio (the “CAPE® Ratio”). It aims to identify undervalued sectors based on a modified CAPE® Ratio, and then uses a momentum factor to seek to mitigate the effects of potential value traps. You cannot invest directly in an index.Please see the Appendix for Historical Index Performance Disclaimer.
0.0
0.2
0.4
0.6
0.8
1.0
1.2
1.4
1.6
1.8
2.0
Aug 02 Aug 04 Aug 06 Aug 08 Aug 10 Aug 12 Aug 14 Aug 16
Utilities Technology0
10
20
30
40
50
60
Aug 02 Aug 04 Aug 06 Aug 08 Aug 10 Aug 12 Aug 14 Aug 16
Utilities Technology
DoubleLine CAPE® Webcast 11-14-2017 19
Shiller Barclays CAPE® U.S. Sector IndexSector Selection Rules
Source: DoubleLine, BarclaysCAPE = Cyclically Adjusted Price Earnings Shiller Barclays CAPE U.S. Sector Index = Shiller Barclays CAPE US Sector TR USD Index incorporates the principles of long-term investing distilled by Dr. Robert Shiller and expressed through the CAPE® (Cyclically Adjusted Price Earnings) ratio (the “CAPE® Ratio”). It aims to identify undervalued sectors based on a modified CAPE® Ratio, and then uses a momentum factor to seek to mitigate the effects of potential value traps. You cannot invest directly in an index.
Shiller Barclays CAPE® U.S. Sector TR USD Index
10 U.S. Sectors (per table to the right)
Examine 30 years of index values and earnings for 10 U.S. Sectors
Relative CAPE® Ratio for Each Sector
Select 5 most undervalued sectors based on Relative CAPE® Ratio
Value Trap Filter
Remove the sector with the lowest 12‐month total return of undervalued sectors
Ranking
Equally weight the 4 remaining undervalued sectors
Shiller Barclays CAPE® U.S. Sectors
Consumer Discretionary
Consumer Staples
Energy
Financials
Healthcare
Industrial
Materials
Real Estate
Technology
Utilities
DoubleLine CAPE® Webcast 11-14-2017 20
Relative CAPE® Ratio for Value InvestingU.S. Sectors
• The Shiller Barclays CAPE® U.S. Sector Index uses the Relative CAPE® Ratio to select the most undervalued sectors in the market
Source: Barclays, DoubleLineIn the chart, the vertical axis represents the Relative CAPE® Ratio. For definitions, please see the Appendix section of thispresentation. For illustrative purposes only. Any data on past performance, contained herein is no indication as to future performance.
0.20
0.40
0.60
0.80
1.00
1.20
1.40
1.60
1.80
2.00
Re
lati
ve C
AP
E® R
atio
Sep
tem
be
r 2
01
2 -
Sep
tem
be
r 2
01
7
Energy Materials Industrials Consumer DiscretionaryConsumer Staples Health Care Financials UtilitiesTechnology Real Estate
Real Estate
Discretionary
UtilitiesMaterials
Financials
Industrials
StaplesEnergy
Technology
Health Care
DoubleLine CAPE® Webcast 11-14-2017 21
• Portfolio weights are reconstituted on a monthly basis using the Relative CAPE® Ratio
Historical Sector Rotation of Shiller Barclays CAPE® U.S. Sector Total Return Index
Source: Barclays, DoubleLine. Shiller Barclays CAPE ®US Sector TR USD Index incorporates the principles of long-term investing distilled by Dr. Robert Shiller and expressed through the CAPE® (Cyclically Adjusted Price Earnings) ratio (the “CAPE® Ratio”). It aims to identify undervalued sectors based on a modified CAPE® Ratio, and then uses a momentum factor to seek to mitigate the effects of potential value traps. You cannot invest directly in an index. Please see the Appendix for index definitions.
Consumer Discretionary
Consumer Staples
Energy
Financials
Healthcare
Industrials
Materials
Technology
Utilities
Real Estate
Shill
er B
arcl
ays
CA
PE®
Sec
tor
Exp
osu
res
Oct
ob
er 2
01
3 -
Sep
tem
ber
20
17
DoubleLine CAPE® Webcast 11-14-2017 22
Why DoubleLine Chooses Shiller Barclays CAPE® U.S. Sector Total Return Index Over Traditional Equity Indices?
• Identifies and invests in relatively undervalued equity sectors
• Does not rely on subjective forecasts
• Uses a long term estimate of value, avoiding short term bias
• Is based on the rigorous research of Professor Robert Shiller and John Campbell
– Which in turn is based upon the value investing principles of Benjamin Graham & David Dodd
• We believe it is an intelligent alternative to capitalization weighted portfolios (S&P 500®)
Source: Barclays, DoubleLinePlease see the Appendix for definitions.
DoubleLine CAPE® Webcast 11-14-2017 23
Performance of Shiller Barclays CAPE®U.S. Sector Total Return Index
Source: Barclays, DoubleLine, BloombergPast Performance is no guarantee of future results.Please see the Appendix for definitions.
Shiller Barclays CAPE® US Sector Index S&P 500 Index
Annualized Geometric Return 14.63% 12.38%Annualized Standard Deviation 12.16% 12.12%Annualized Sharpe Ratio 1.16 1.00
$0.90
$1.00
$1.10
$1.20
$1.30
$1.40
$1.50
$1.60
$1.70
$1.80
Gro
wth
of
1 D
olla
rO
cto
be
r 3
1, 2
01
3 -
No
vem
be
r 1
3, 2
01
7
Shiller Barclays CAPE® US Sector Index
S&P 500 Index
DoubleLine CAPE® Webcast 11-14-2017 24
TAB IVFixed Income Portfolio
DoubleLine CAPE® Webcast 11-14-2017 25
DoubleLine ShillerEnhanced CAPE®
DoubleLine Actively Managed
Fixed Income Portfolio
Shiller Barclays CAPE® US Sector
TR USD Index
Initial Investment
* A portion of the Initial Investment may be pledged as collateral under the swap** Market fluctuations may preclude full $1 for $1 exposure between the swaps and the fixed income portfolio
Fixed Income Portfolio
DoubleLine CAPE® Webcast 11-14-2017 26
Fixed Income Investment Process
Investment Outlook
ImplementationEconomic Discussions
• Asset Allocation Committee holds a monthly meeting. Account review and market sector chartbook are evaluated.
• Fixed Income Asset Allocation Chart Book reviews portfolio characteristics, return analysis, and risk measures.
• Fixed Income Asset Allocation Chartbook graphically depicts historical asset class spreads and relative growth trends in the global fixed income market place.
• Macro economic group discussion of interest rates, currencies, commodities, yield curve, spread and general fixed income market analysis.
• Sectors with opportunities are identified based on the portfolio manager’s assessment of their respective sector’s outlook and sector attractiveness relative to other asset classes.
• Strategy risks are reviewed.
• The Committee proposes asset allocation changes. The Committee Chairman makes the final asset allocation decision.
• Sector teams review client guidelines and are responsible for security selection.
• The Asset Allocation Fixed Income team monitors implementation and performs portfolio analytics.
DoubleLine CAPE® Webcast 11-14-2017 27
Broad Opportunity Set DoubleLine's portfolio management team believes the most reliable way to enhance returns is to attempt to exploit inefficiencies within the subsectors of the fixed income market while maintaining active risk management constraints.
Implementation of portfolio asset allocation decisions are made by experienced teams incorporating all their research. These portfolio managers purchase securities within their respective sectors under an integrated risk management framework overseen by the DoubleLine risk management team.
Proposed allocation subject to change without notice.
Tactical Asset Allocation Breakdown
Emerging Markets
Corporate Debt
Collateralized Loan
Obligations (CLOs)
Emerging Markets
Sovereign Debt
International Sovereign
Debt
Global High Yield
Corporate Debt
Global Investment-
Grade Corporate
Debt
Asset-Backed
Securities
Commercial Mortgage-
Backed Securities
Residential Mortgage-
Backed Securities
U.S. Government
Securities
Bank Loans
Fixed Income Asset Allocation
Team
Infrastructure Debt
DoubleLine CAPE® Webcast 11-14-2017 28
Smart Alpha Short-Intermediate Sleeve• The fixed income portfolio has generated a relatively consistent return in addition to the returns
derived from the Shiller Barclays CAPE® index • This consistency, as opposed to chunky sources of alpha, is what distinguishes the DoubleLine
double value propositionDoubleLine Shiller Enhanced CAPE® Fixed
Income PortfolioBloomberg Barclays U.S. Aggregate 1-3 Year
Index
Annualized Geometric Return 3.03% 0.96%
Annualized Standard Deviation 1.16% 0.68%
Sharpe Ratio 2.35 1.01
Source: DoubleLinePerformance data quoted represents past performance; past performance does not guarantee future results. The investment return and principal value of an investment will fluctuate so that an investor's shares, when redeemed, may be worth more or less than the original cost. Current performance of the fund may be lower or higher than the performance quoted. Performance data current to the most recent month-end may be obtained by calling 213-633-8200 or by visiting www.doublelinefunds.com. The performance information shown assumes the reinvestment of all dividends and distributions.
$0.90
$0.95
$1.00
$1.05
$1.10
$1.15
Gro
wth
of
1 D
olla
rO
cto
be
r 3
1, 2
01
3 -
Oct
ob
er
31
, 20
17
DoubleLine Shiller Enhanced CAPE Fixed Income Portfolio
• Strives to be broadly diversified across fixed income sectors
Source: DoubleLine. The credit quality of a particular security or group of securities does not ensure the stability or safety of the overall portfolioFixed Income portfolio sector allocation is as of October 31, 2017. Subject to change without notice.
Duration 1.5
Cash5.4%
U.S. Government17.3%
Agency RMBS3.1%
Non-Agency RMBS12.9%
Asset-Backed Securities
7.6%Commercial MBS
12.8%
Collateralized Loan Obligations
13.2%
Bank Loans8.2%
Investment Grade Corporate
10.9%
Emerging Markets8.7%
DoubleLine CAPE® Webcast 11-14-2017 30
DSEEX Fixed Income Portfolio - Ratings Distribution
Source: DoubleLine. The credit quality of a particular security or group of securities does not ensure the stability or safety of the overall portfolioFixed Income portfolio ratings distribution is as of October 31, 2017. Subject to change without notice.
Cash5.4%
Government17.3%
Agency3.1%
Investment Grade50.0%
Below Investment
Grade14.5%
Unrated9.7%
DoubleLine CAPE® Webcast 11-14-2017 31
-20%
0%
20%
40%
60%
80%
100%
International Emerging
High Yield Credit
Bank Loans
Collateralized Loan Obligations
Asset-Backed Securities
Non-Agency Mortgage-Backed Securities
Commercial Mortgage-Backed Securities
Investment Grade Credit
Agency Mortgage-Backed Securities
U.S. Government
Cash
DSEEX Fixed Income PortfolioHistorical Sector Allocations
Source: DoubleLineFixed Income portfolio Statistics as of October 31, 2017 and are subject to change without notice and should not be considered a recommendation to buy or sell any security.HY = High Yield; CLO = Collateralized Loan Obligation; ABS = Asset-Backed Securities; RMBS = Residential Mortgage-Backed Securities; CMBS = Commercial Mortgage-Backed SecuritiesIG = Investment Grade
DoubleLine CAPE® Webcast 11-14-2017 32
DSEEX Fixed Income Portfolio – Duration• Portfolio duration is 1.5 years
Source: DoubleLine. Fixed Income portfolio duration allocation and overall duration is as of October 31, 2017 and is subject to change without notice.
0
1
2
3
4
5
6
7
Du
rati
on
(Ye
ars)
N
ove
mb
er 3
0, 2
01
3 -
Oct
ob
er 3
1, 2
01
7
Bloomberg Barclays U.S. Aggregate Duration
Bloomberg Barclays U.S. 1-3 Yr Aggregate Duration
DSEEX Fixed Income Portfolio Representative Account Duration
* A portion of the Initial Investment may be pledged as collateral under the swap** Market fluctuations may preclude full $1 for $1 exposure between the swaps and the fixed income portfolio
DoubleLine Shiller Enhanced CAPE®
DoubleLine CAPE® Webcast 11-14-2017 35
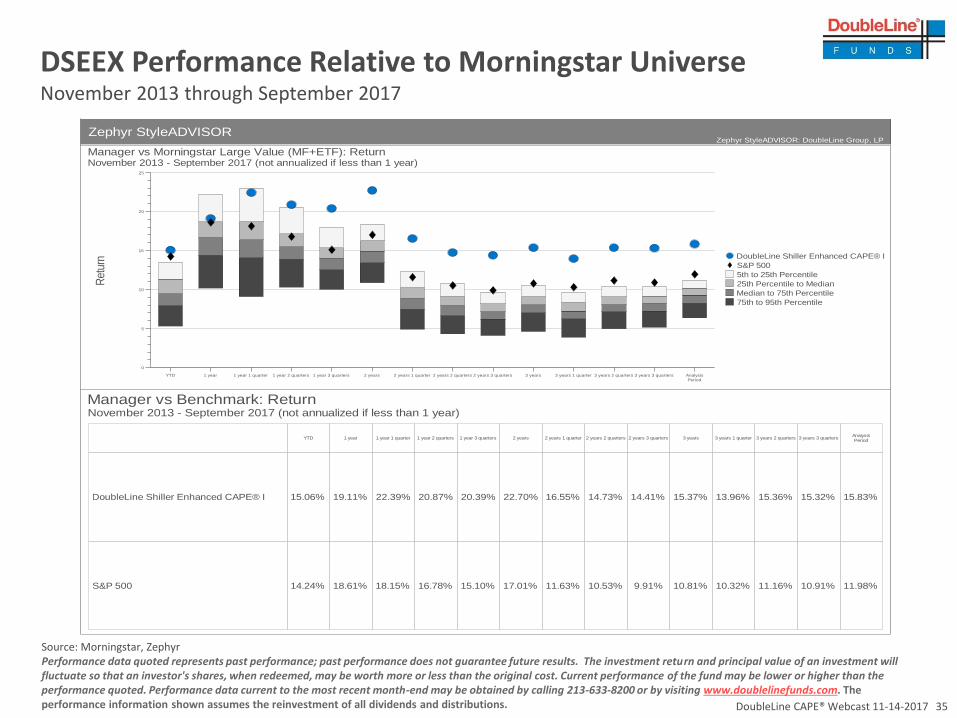
DSEEX Performance Relative to Morningstar UniverseNovember 2013 through September 2017
Source: Morningstar, ZephyrPerformance data quoted represents past performance; past performance does not guarantee future results. The investment return and principal value of an investment will fluctuate so that an investor's shares, when redeemed, may be worth more or less than the original cost. Current performance of the fund may be lower or higher than the performance quoted. Performance data current to the most recent month-end may be obtained by calling 213-633-8200 or by visiting www.doublelinefunds.com. The performance information shown assumes the reinvestment of all dividends and distributions.
Manager vs Morningstar Large Value (MF+ETF): ReturnNovember 2013 - September 2017 (not annualized if less than 1 year)
Ret
urn
0
5
10
15
20
25
YTD 1 year 1 year 1 quarter 1 year 2 quarters 1 year 3 quarters 2 years 2 years 1 quarter 2 years 2 quarters 2 years 3 quarters 3 years 3 years 1 quarter 3 years 2 quarters 3 years 3 quarters AnalysisPeriod
DoubleLine Shiller Enhanced CAPE® I
S&P 500
5th to 25th Percentile
25th Percentile to Median
Median to 75th Percentile
75th to 95th Percentile
Manager vs Benchmark: ReturnNovember 2013 - September 2017 (not annualized if less than 1 year)
DoubleLine Shiller Enhanced CAPE® I
S&P 500
YTD 1 year 1 year 1 quarter 1 year 2 quarters 1 year 3 quarters
Manager vs Morningstar Large Value (MF+ETF): Sharpe RatioNovember 2013 - September 2017 (not annualized if less than 1 year)
Sharp
e R
atio
0.00
0.50
1.00
1.50
2.00
2.50
3.00
3.50
4.00
YTD 1 year 1 quarter 1 year 2 quarters 1 year 3 quarters 2 years 2 years 1 quarter 2 years 2 quarters 2 years 3 quarters 3 years 3 years 1 quarter 3 years 2 quarters 3 years 3 quarters AnalysisPeriod
DoubleLine Shiller Enhanced CAPE® I
S&P 500
5th to 25th Percentile
25th Percentile to Median
Median to 75th Percentile
75th to 95th Percentile
Manager vs Morningstar Large Value (MF+ETF): Sharpe Ratio RankNovember 2013 - September 2017 (not annualized if less than 1 year)
• Compared to other developed markets, MSCI Europe looks favorably priced using the Shiller CAPE® ratio
Source: Morgan Stanley Research, MSCI, FTSE, S&P, OECD, Various National Sources, Global Financial Data, S&P, Robert ShipperNotes: Normalized PE = Price/Normalized EPS. Normalized EPS = Current Book Value x Long-Term Average ROE. Shiller PE defines as inflation adjusted Price-to-10Y EPS = Earnings Per Share
DoubleLine CAPE® Webcast 11-14-2017 39
MSCI Europe Forward Price to Earnings and Price to Book
• Using traditional valuation metrics European equities look favorably priced relative to history
Source: Morgan Stanley Research, MSCI, FTSE, S&P, OECD, Various National Sources, Global Financial Data, S&P, Robert ShipperNotes: Normalized PE = Price/Normalized EPS. Normalized EPS = Current Book Value x Long-Term Average ROE. Shiller PE defines as inflation adjusted Price-to-10Y Average EPS; ROE: Return on Equity
DoubleLine CAPE® Webcast 11-14-2017 40
Stoxx 600 Earnings Per Share Percentage Growth Estimates
• Earnings estimates for the remainder of 2017 and 2018 look supportive of the European equity market
Source: BAML, European Equity Strategy Team. EPS Estimates over the course of a year.Earnings growth is not representative of the fund’s future performanceEPS: Earnings per shareStoxx 600: Stoxx 600 Europe 600 Price Index - The STOXX Europe 600 Index is derived from the STOXX Europe Total Market Index (TMI) and is a subset of the STOXX Global 1800 Index. With a fixed number of 600 components, the STOXX Europe 600 Index represents large, mid and small capitalization companies across 18 countries of the European region.
DoubleLine CAPE® Webcast 11-14-2017 41
MSCI U.S. and MSCI Europe Profit Margins
• Margins continue to improve in the both the Eurozone and the U.S.
Source: Minack Advisors
DoubleLine CAPE® Webcast 11-14-2017 42
Purchasing Manufacturing Index
• European PMI continues to be resilient, exhibiting a region-wide growth trend
Source: Bloomberg, Markit, DoubleLinePMI: Purchasing Manufacturing Index
Nov Dec Jan Feb Mar Apr May Jun Jul Aug Sep Oct Nov Dec Jan Feb Mar Apr May Jun Jul Aug Sep Oct Nov Dec Jan Feb Mar Apr May Jun Jul Aug Sep Oct
TAB VIIShiller Barclays CAPE® Europe Sector Net Index
DoubleLine CAPE® Webcast 11-14-2017 44
DoubleLine Shiller Enhanced
International CAPE®
DoubleLine Actively Managed
Fixed Income Portfolio
Shiller Barclays CAPE® Europe
Sector Net Index
Initial Investment
* A portion of the Initial Investment may be pledged as collateral under the swap** Market fluctuations may preclude full $1 for $1 exposure between the swaps and the fixed income portfolio
Shiller Barclays CAPE® Europe Sector Net Index
DoubleLine CAPE® Webcast 11-14-2017 45
Country Exposures:Shiller Barclays CAPE® Europe Sector Net Index
• The Shiller Barclays CAPE® Europe Sector Net Index captures large and mid cap companies across the 15 Developed Market* countries in the MSCI Europe Index
Source: DoubleLine*Developed Market countries in Europe include: Austria, Belgium, Denmark, Finland, France, Germany, Ireland, Italy, the Netherlands, Norway, Portugal, Spain, Sweden, Switzerland and the UK
DoubleLine CAPE® Webcast 11-14-2017 46
Shiller Barclays CAPE® Europe Sector Net IndexSector Selection Rules
Source: DoubleLine, Barclays*Due to data limitations current relative CAPE® includes 226 months (18 years) and will expand each month until it includes 360 months (30 years) of data.At this point the relative CAPE® will no longer expand but will contain the most recent rolling 360 months of data.
Shiller Barclays CAPE® Europe Sector Net Index
10 European Sectors (per table to the right)
Examine 18* years of index values and earnings for 10 European Sectors
Relative CAPE® Ratio for Each Sector
Select 5 most undervalued sectors based on Relative CAPE® Ratio
Momentum
Remove the sector with the lowest 12‐month momentum for selected sectors
Ranking
Equal weight in 4 favored, undervalued sectors with most positive price momentum
Shiller Barclays CAPE® Europe Sectors
Consumer Discretionary
Consumer Staples
Energy
Financials
Healthcare
Industrial
Information Technology
Materials
Telecommunications
Utilities
DoubleLine CAPE® Webcast 11-14-2017 47
Relative CAPE® Ratio for Value InvestingEuropean Sectors
• The Shiller Barclays CAPE® Europe Sector Net Index uses the Relative CAPE® Ratio to select the most undervalued sectors in the European large cap equity market
Source: DoubleLine, Barclays
DoubleLine CAPE® Webcast 11-14-2017 48
TAB VIIIDoubleLine Shiller Enhanced International CAPE® Fixed Income Portfolio
DoubleLine CAPE® Webcast 11-14-2017 49
DoubleLine Shiller Enhanced
International CAPE®
DoubleLine Actively Managed
Fixed Income Portfolio
Shiller Barclays CAPE® Europe
Sector Net TR USD Index
Initial Investment
* A portion of the Initial Investment may be pledged as collateral under the swap** Market fluctuations may preclude full $1 for $1 exposure between the swaps and the fixed income portfolio
Fixed Income Portfolio (International CAPE®)
DoubleLine CAPE® Webcast 11-14-2017 50
Smart Alpha Short-Intermediate Sleeve• The fixed income portfolio has generated a relatively consistent return in addition to the returns
derived from the Shiller Barclays CAPE® Europe Sector Net Index • This consistency, as opposed to chunky sources of alpha, is what distinguishes the DoubleLine
double value propositionDoubleLine Shiller Enhanced CAPE® Fixed
Income PortfolioBloomberg Barclays U.S. Aggregate 1-3 Year
Index
Cumulative Return 2.07% 1.05%
Annualized Standard Deviation 0.37% 0.44%
Source: DoubleLinePerformance data quoted represents past performance; past performance does not guarantee future results. The investment return and principal value of an investment will fluctuate so that an investor's shares, when redeemed, may be worth more or less than the original cost. Current performance of the fund may be lower or higher than the performance quoted. Performance data current to the most recent month-end may be obtained by calling 213-633-8200 or by visiting www.doublelinefunds.com. The performance information shown assumes the reinvestment of all dividends and distributions.
$0.98
$0.99
$1.00
$1.01
$1.02
$1.03
Gro
wth
of
1 D
olla
rD
ece
mb
er
31
, 20
16
-O
cto
be
r 3
1, 2
01
7
DoubleLine Shiller Enhanced International CAPE Fixed Income Portfolio
• Strives to be broadly diversified across fixed income sectors
Source: DoubleLine. October 31, 2017 statistics are preliminary, subject to change without notice.
Duration 1.4
Cash16.4%
U.S. Government16.7%
Agency RMBS2.4%
Non-Agency RMBS15.2%
Asset-Backed Securities
13.5%
Collateralized Loan Obligations
14.9%
Bank Loans4.6%
Investment Grade Corporate
7.8%
High Yield Corporate
0.1%
Emerging Markets
8.4%
DoubleLine CAPE® Webcast 11-14-2017 52
DSEUX Fixed Income Portfolio - Ratings Distribution
Source: DoubleLine. The credit quality of a particular security or group of securities does not ensure the stability or safety of the overall portfolioOctober 31, 2017 statistics are preliminary, subject to change without notice.
Cash16.4%
Government16.7%
Agency2.4%
Investment Grade46.9%
Below Investment Grade6.4%
Unrated Securities11.2%
DoubleLine CAPE® Webcast 11-14-2017 53
DSEUX Fixed Income PortfolioHistorical Sector Allocations
Source: DoubleLineFixed Income portfolio Statistics as of October 31, 2017 and are subject to change without notice and should not be considered a recommendation to buy or sell any security.HY = High Yield; CLO = Collateralized Loan Obligation; ABS = Asset-Backed Securities; RMBS = Residential Mortgage-Backed Securities; CMBS = Commercial Mortgage-Backed SecuritiesIG = Investment Grade
0%
10%
20%
30%
40%
50%
60%
70%
80%
90%
100%
Emerging Markets
High Yield
Bank Loans
Collateralized Loan Obligations
Asset-Backed Securities
Non-Agency MBS
Investment Grade Corporates
Agency RMBS
Government
Cash
DoubleLine CAPE® Webcast 11-14-2017 54
DSEUX Fixed Income Portfolio – Duration• Portfolio duration is 1.4 years
Source: DoubleLine. Fixed Income portfolio duration allocation and overall duration is as of October 31, 2017 and is subject to change without notice.
0
1
2
3
4
5
6
7
Du
rati
on
(Ye
ars)
D
ece
mb
er 3
1, 2
01
6 -
Oct
ob
er 3
1, 2
01
7
Bloomberg Barclays U.S. Aggregate Duration
Bloomberg Barclays U.S. 1-3 Yr Aggregate Duration
DSEUX Fixed Income Portfolio Representative Account Duration
DoubleLine CAPE® Webcast 11-14-2017 55
TAB IXDoubleLine Shiller Enhanced International CAPE® Performance
DoubleLine CAPE® Webcast 11-14-2017 56
DoubleLine Shiller Enhanced
International CAPE®
DoubleLine Actively Managed
Fixed Income Portfolio
Shiller Barclays CAPE® Europe
Sector Net Index
Initial Investment
* A portion of the Initial Investment may be pledged as collateral under the swap** Market fluctuations may preclude full $1 for $1 exposure between the swaps and the fixed income portfolio
DoubleLine Shiller Enhanced International CAPE®
DoubleLine CAPE® Webcast 11-14-2017 57
DSEUX Performance
DSEUX MSCI Europe USD Net
Cumulative Return 19.75% 22.37%
Standard Deviation 9.40% 9.37%
Source: DoubleLine, Bloomberg
Performance data quoted represents past performance; past performance does not guarantee future results. The investment return and principal value of an investment will fluctuate so that an investor's shares, when redeemed, may be worth more or less than the original cost. Current performance of the fund may be lower or higher than the performance quoted. Performance data current to the most recent month-end may be obtained by calling 213-633-8200 or by visiting www.doublelinefunds.com. The performance information shown assumes the reinvestment of all dividends and distributions.
DefinitionsAlpha - A measure of performance on a risk-adjusted basis. Alpha takes the volatility (price risk) of a mutual fund and compares its risk-adjusted performance to a benchmark index.Beta - Beta is the measure of a mutual funds' volatility in relation to the market. By definitions, the market has a beta of 1.0, and individual mutual funds are raked according to how much they deviate from the market. A beta of above 1.0 means the fund swings more than the market. If the fund moves less than the market, the beta is less than 1.0.Standard Deviation - A measure of the variation or dispersion of a set of data from its mean or expected/budgeted value. A low standard deviation indicates that the data points tend to be very close to the mean, whereas a high standard deviation indicates that the data is spread out over a large range of values. A measure of an investment's volatility.Geometric Return - The average of a set of products, the calculation of which is commonly used to determine the performance results of an investment or portfolio. Technically defined as "the 'n'th root product of 'n' numbers.”Duration - A measure of the sensitivity of the price of a fixed income investment to a change in interest rates, expressed as a number of years. Weighted-Average life (WAL) - The average number of years for which each dollar of unpaid principal on a loan or mortgage remains outstanding.S&P 500®® = The S&P 500® is a free-float capitalization-weighted index published since 1957 of the prices of 500 large-cap common stocks actively traded in the United States.Shiller Barclays CAPE® US Sector Index (Total Return)= Shiller Barclays CAPE US Sector Index (Total Return) was launched on September 2012 (“Index”). Any provided performance information relating to a period prior to that date is hypothetical. The Index methodology is available for review upon request. Barclays Bank PLC ("Barclays") or an affiliate of Barclays prepared the provided performance information (including the hypothetical performance information), is the index sponsor for the Index and potentially is the counterparty to a transaction referencing the Index. It is in Barclays interest to demonstrate positive pre-inception index performance. The pre-inception index performance is included from the period from Feb 1988 to September 2012. The index data reflects a cost of 0.28% per annum that is incorporated into the Index formula. The performance information, however, does not reflect any additional fees that may be paid by counterparty to a transaction referencing the Index that may be agreed between the parties thereto. Fees are not reflected in the provided Index performance information. Shiller Barclays CAPE® Ratio= CAPE® stands for Cyclically Adjusted Price-Earnings. The CAPE® Ratio is a valuation metric that takes the current price of an equity or index divided by its inflation adjusted average of ten years of earnings. Correlation A correlation coefficient is a measure of the interdependence of two random variables that ranges in value from -1 to +1, indicating perfect negative-correlation at -1, absence of correlation at zero and perfect positive-correlation at +1.You cannot invest directly in an index.Bloomberg Barclays U.S. Aggregate Bond Index - The Barclays U.S. Aggregate Index represents securities that are SEC-registered, taxable, and dollar denominated. The index covers the US investment grade fixed rate bond market, with index components for government and corporate securities, mortgage pass-through securities, and asset-backed securities. These major sectors are subdivided into more specific indices that are calculated and reported on a regular basis.Annualized Mean Return: An annualized total return is the geometric average amount of money earned by an investment each year over a given time period. It is calculated as a geometric average to show what an investor would earn over a period of time if the annual return was compounded.Morgan Stanley Capital International Europe Index: An index that captures large and mid-cap representation across 15 Developed Markets (DM) countries in Europe (DM countries in Europe include: Austria, Belgium, Denmark, Finland, France, Germany, Ireland, Italy, the Netherlands, Norway, Portugal, Spain, Sweden, Switzerland and the UK). With 446 constituents, the index covers approximately 85% of the free float-adjusted market capitalization across the European Developed Markets equity universe.Investment Grade: A level of credit rating for stocks regarded as carrying a minimal risk to investors. Ratings are based on corporate bond model. The higher the rating the more likely the bond will pay back par/100 cents on the dollar.Below Investment Grade: A term indicating that a security is rated below investment grade. These securities are seen as having higher default risk or other adverse credit events, but typically pay higher yields than better quality bonds in order to make them attractive. They are less likely to pay back 100 cents on the dollar.Shiller Barclays CAPE® Europe Sector Net TR USD Index: An index that incorporates the principles of long-term investing distilled by Dr. Robert Shiller and expressed through the CAPE® (Cyclically Adjusted Price Earnings) ratio (the “CAPE® Ratio”). The classic CAPE® Ratio assesses equity market valuations and averages ten years of reported earnings to account for earnings and market cycles. Each month, the Index’s methodology ranks ten sectors within the European equity markets based on a modified CAPE® Ratio and a twelve-month price momentum factor.Bloomberg Barclays US 1-3yr Aggregate Bond Index - This index is the 1-3 Yr component of the U.S. Aggregate index. The Bloomberg Barclays U.S. Aggregate Index represents securities that are SEC-registered, taxable, and dollar denominated. The index covers the U.S. investment grade fixed rate bond market, with index components for government and corporate securities, mortgage pass-through securities, and asset-backed securities. These major sectors are subdivided into more specific indices that are calculated and reported on a regular basis.
DoubleLine CAPE® Webcast 11-14-2017 59
DefinitionsConference Board U.S. Leading Index (LEI): Leading indicators include economic variables that tend to move before changes in the overall economy. These indicators give a sense of the future state of an economy.Gross Domestic Product (GDP): The market value of all final goods and services produced within a country in a given period. GDP is considered an indicator or metric of a country’s standard of living.ISM Manufacturing PMI: An index made up of data from 300 manufacturing firms collected by the Institute of Supply Management (ISM). It indicates the economic health of the manufacturing sector.ISM Services PMI: An index made up of data from 400 non-manufacturing firms collected by the Institute of Supply Management (ISM). 2s10s: Chicago Fed National Activity Index: The Chicago Fed National Activity Index is a monthly index designed to gauge overall economic activity and related inflationary pressure.2s10s: The spread between the 2-year and 10-year U.S. yield.Price-to-Book: A ratio used to compare a stock's market value to its book value. It is calculated by dividing the current closing price of the stock by the latest quarter's book value per share. A lower P/B ratio could mean that the stock is undervalued.Price-to-Earnings: The ratio for valuing a company that measures its current share price relative to its per-share earnings. The price-earnings ratio is also sometimes known as the price multiple or the earnings multiple. PMI - Purchasing Managers Index: An indicator of the economic health of the manufacturing sector. The PMI is based on five major indicators: new orders, inventory levels, production, supplier deliveries and the employment environment. The purpose of the PMI is to provide information about current business conditions to company decision makers, analysts and purchasing managers.
DoubleLine CAPE® Webcast 11-14-2017 60
Barclays Bank PLC and its affiliates (“Barclays”) is not the issuer or producer of DoubleLine Shiller Enhanced International CAPE ® or DoubleLine Shiller Enhanced CAPE ® (the “Funds”) and Barclays has no responsibilities, obligations or duties to investors in the Funds. The Shiller Barclays CAPE® Europe Sector Net TR Index and the Shiller Barclays CAPE® US Sector USD Index (the “Indices”) are trademarks owned by Barclays Bank PLC and licensed for use by the Funds. While the Funds may execute transaction(s) with Barclays in or relating to the Indices, Fund investors acquire interests solely in the Fund and investors neither acquire any interest in the applicable Index nor enter into any relationship of any kind whatsoever with Barclays upon making an investment in such Fund. The Funds are not sponsored, endorsed, sold or promoted by Barclays and Barclays makes no representation regarding the advisability of the Funds or use of the Indices or any data included therein. Barclays shall not be liable in any way to either Fund, investors or to other third parties in respect of the use or accuracy of the Index or any data included therein.
The Shiller Barclays CAPE® Index Family (the “Index Family”) has been developed in part by RSBB-I, LLC, the research principal of which is Robert J. Shiller. RSBB-I, LLC is not an investment advisor and does not guarantee the accuracy and completeness of the Index Family or any data or methodology either included therein or upon which it is based. RSBB-I, LLC shall have no liability for any errors, omissions or interruptions therein and makes no warranties expressed or implied, as to the performance or results experienced by any party from the use of any information included therein or upon which it is based, and expressly disclaims all warranties of the merchantability or fitness for a particular purpose with respect thereto, and shall not be liable for any claims or losses of any nature in connection with the use of such information, including but not limited to, lost profits or punitive or consequential damages even, if RSBB-I, LLC is advised of the possibility of same.
Barclays Disclaimer
DoubleLine CAPE® Webcast 11-14-2017 61
Disclaimer
Important Information Regarding This ReportThis report was prepared as a private communication and was not intended for public circulation. Clients or prospects may authorize distribution to their consultants or other agents.
Issue selection processes and tools illustrated throughout this presentation are samples and may be modified periodically. Such charts are not the only tools used by the investment teams, are extremely sophisticated, may not always produce the intended results and are not intended for use by non-professionals.
DoubleLine has no obligation to provide revised assessments in the event of changed circumstances. While we have gathered this information from sources believed to be reliable, DoubleLine cannot guarantee the accuracy of the information provided. Securities discussed are not recommendations and are presented as examples of issue selection or portfolio management processes. They have been picked for comparison or illustration purposes only. No security presented within is either offered for sale or purchase. DoubleLine reserves the right to change its investment perspective and outlook without notice as market conditions dictate or as additional information becomes available. This material may include statements that constitute “forward-looking statements” under the U.S. securities laws. Forward-looking statements include, among other things, projections, estimates, and information about possible or future results related to a client’s account, or market or regulatory developments.
Important Information Regarding Risk FactorsInvestment strategies may not achieve the desired results due to implementation lag, other timing factors, portfolio management decision-making, economic or market conditions or other unanticipated factors. The views and forecasts expressed in this material are as of the date indicated, are subject to change without notice, may not come to pass and do not represent a recommendation or offer of any particular security, strategy, or investment. Past performance is no guarantee of future results.
Important Information Regarding DoubleLineIn preparing the client reports (and in managing the portfolios), DoubleLine and its vendors price separate account portfolio securities using various sources, including independent pricing services and fair value processes such as benchmarking.
To receive a complimentary copy of DoubleLine’s current Form ADV (which contains important additional disclosure information), a copy of the DoubleLine’sproxy voting policies and procedures, or to obtain additional information on DoubleLine’s proxy voting decisions, please contact DoubleLine’s Client Services.
DoubleLine CAPE® Webcast 11-14-2017 62
Important Information Regarding DoubleLine’s Investment StyleDoubleLine seeks to maximize investment results consistent with our interpretation of client guidelines and investment mandate. While DoubleLine seeks to maximize returns for our clients consistent with guidelines, DoubleLine cannot guarantee that DoubleLine will outperform a client's specified benchmark or the market or that DoubleLine’s risk management techniques will successfully mitigate losses. Additionally, the nature of portfolio diversification implies that certain holdings and sectors in a client's portfolio may be rising in price while others are falling; or, that some issues and sectors are outperforming while others are underperforming. Such out or underperformance can be the result of many factors, such as but not limited to duration/interest rate exposure, yield curve exposure, bond sector exposure, or news or rumors specific to a single name.DoubleLine is an active manager and will adjust the composition of client’s portfolios consistent with our investment team’s judgment concerning market conditions and any particular sector or security. The construction of DoubleLine portfolios may differ substantially from the construction of any of a variety of bond market indices. As such, a DoubleLine portfolio has the potential to underperform or outperform a bond market index. Since markets can remain inefficiently priced for long periods, DoubleLine’s performance is properly assessed over a full multi-year market cycle.
Important Information Regarding Client ResponsibilitiesClients are requested to carefully review all portfolio holdings and strategies, including by comparing the custodial statement to any statements received from DoubleLine. Clients should promptly inform DoubleLine of any potential or perceived policy or guideline inconsistencies. In particular, DoubleLine understands that guideline enabling language is subject to interpretation and DoubleLine strongly encourages clients to express any contrasting interpretation as soon as practical. Clients are also requested to notify DoubleLine of any updates to Client’s organization, such as (but not limited to) adding affiliates (including broker dealer affiliates), issuing additional securities, name changes, mergers or other alterations to Client’s legal structure.
Morningstar DisclosuresMorningstar rankings represent a fund's total-return percentile rank relative to all funds that have the same Morningstar category. The highest percentile rank is 1 and the lowest is 100. It is based on Morningstar total return, which includes both income and capital gains or losses and is not adjusted for sales charges or redemption fees. Morningstar Rankings (Absolute) represent a fund's total-return rank relative to all funds that have the same Morningstar Category. The highest rank is 1 and the lowest is based on the total number of funds ranked in the category. Past performance is not a guarantee of future results.
DoubleLine® is a registered trademark of DoubleLine Capital LP.
Jeffrey Sherman, CFA Deputy Chief Investment Officer Portfolio Manager
DoubleLine Shiller Enhanced CAPE®(DSEEX/DSENX)DoubleLine Shiller Enhanced International CAPE®(DSEUX/DLEUX)
November 14, 2017
CAPE®: Building Blocks for a Global Equity Allocation
DoubleLine CAPE® Webcast 11-14-2017 64
Announcements
Jeffrey Gundlach – December 12, 2017Total Return Bond Fund WebcastGo to www.doublelinefunds.com, Home page under “Webcasts”2017 Webcast Schedule to register1:15 pm PDT/4:15 pm EDT
Jeffrey Gundlach – January 12, 2018Just Markets 2018 WebcastGo to www.doubleline.com, Home page under “Webcasts”2018 Webcast Schedule to register1:15 pm PDT/4:15 pm EDT