10
GE Capital Investment intentions and business sentiment based on a survey of 3,400 senior business decision makers across Europe, the US and Australia. 2015 Capex Barometer

GE Capital
Investment intentions and business sentiment based on a survey of 3,400 senior business decision makers across Europe, the US and Australia.
2015
Capex Barometer

In 2015, even as the global economy remains in a state of uncertainty with market volatility expected to continue for the foreseeable future, growth is firmly back on the agenda.
The challenge facing business leaders across the world is where to focus investment to drive this growth.
Against this backdrop, we launch the 2015 GE Capital Capex Barometer – a timely gauge of investment and employment intentions of SME business leaders across the world over
the coming 12 months.
The enduring interest in this research is highlighted by its expansion over the last five years from initially surveying a few hundred decision makers across key Western European markets (France, Italy, Germany and the UK) to a truly compelling and
authoritative piece of research. Indeed, this year we gauge the confidence and capital expenditure investment and employment intentions of several thousand decision makers across nine global markets, including, for the first time, the USA and Australia.
The findings show that across Europe the story is one of stabilisation, with small businesses in countries most affected by the recession now reporting the highest levels of optimism and employment intentions since the survey began. After two years of increasing investment in hardware and software, European businesses are entering the skills investment phase of the Capex lifecycle – fuelling productivity as companies prepare for further growth. Similarly, in Australia and the US, optimism and employment intentions are high. The research also explores opportunities for exports revealing that businesses are looking further than their home market to drive growth.
This year the report has also been expanded to include the increasingly important mid-market alongside small businesses. Mid-markets companies collectively represent roughly 2% of total private companies but provide around a third of private sector GDP and employment in the economies in which they operate.
We hope you enjoy reading the 2015 research findings.
GE Capital International
GE Capital
2
Capex Barometer
17 Spotlight on USA & Australia
18 Methodology & Glossary
Contents Foreword
06 Europe
06 At a Glance
05 Research Highlights
09 Growth and Business Sentiment
10 Investment Intentions
12 Employment Intentions
14 Investment Drivers
16 Financial Preferences
03 Foreword

Capex Barometer
5
GE Capital
4
UNITED KINGDOM
GERMANYFRANCE
HUNGARYPOLAND
CZECH REPUBLIC
ITALY
UNITED STATES OF AMERICA
AUSTRALIA
Research Highlights
NET BUSINESS CONFIDENCE ACROSS EUROPE IS AT A RECORD
39% (VS. 71% IN THE USA AND 50% IN AUSTRALIA)
56% OF EUROPEAN SMALL BUSINESSES GREW THEIR REVENUES OVER THE PAST 12 MONTHS
EUROPEAN SMALL BUSINESSES PLAN TO CREATE A RECORD
3.6 MILLION JOBS (VS. 2.4 MILLION IN 2014)
MANUFACTURING EQUIPMENT IS SET TO DRIVE SPEND ACROSS EUROPE -
€165 BILLION; FOLLOWED BY COMMERCIAL VEHICLES (€125 BILLION) IT HARDWARE (€41 BILLION) IT SOFTWARE (€28 BILLION) AND OFFICE EQUIPMENT (€22 BILLION)
SMALL BUSINESSES IN THE USA PLAN TO MAKE THE MOST SIGNIFICANT INVESTMENT IN CAPEX SPENDING – THE EQUIVALENT
OF €107,000 PER SME, FOLLOWED BY €93,000 IN AUSTRALIA AND €70,000 IN EUROPE
MID-MARKET EXPORTS – EUROPEAN MID-MARKET COMPANIES ARE
47% MORE LIKELY THAN EUROPEAN SMALL BUSINESSES TO HAVE GROWN OVERSEAS REVENUES IN THE PAST YEAR
26% OF SMALL BUSINESSES ACROSS EUROPE HAVE LOST INCOME DUE TO OUT-OF-DATE EQUIPMENT TOTALLING €57 BILLION
THE TOP DRIVER OF CAPEX INVESTMENT ACROSS EUROPE IS ‘UPGRADING EXISTING EQUIPMENT TO ENHANCE EFFICIENCY AND PRODUCTIVITY’ (48%) – ALSO THE TOP DRIVER IN THE USA (54%) AND AUSTRALIA (60%)
INTENDED CAPEX INVESTMENT IS DOWN
8% ACROSS EUROPE TO
€381 BILLION AS BUSINESSES ENTER THE SKILLS INVESTMENT PHASE OF THE CAPEX LIFECYCLE
ACROSS EUROPE, SMALL BUSINESSES GLOBALLY ARE MOST LIKELY TO USE A HIGH STREET BANK TO FINANCE NEW EQUIPMENT (68%), CLOSELY FOLLOWED BY FINANCE FROM A MANUFACTURER (66%) OR A LEASING PROVIDER (64%)
CZECH REPUBLIC
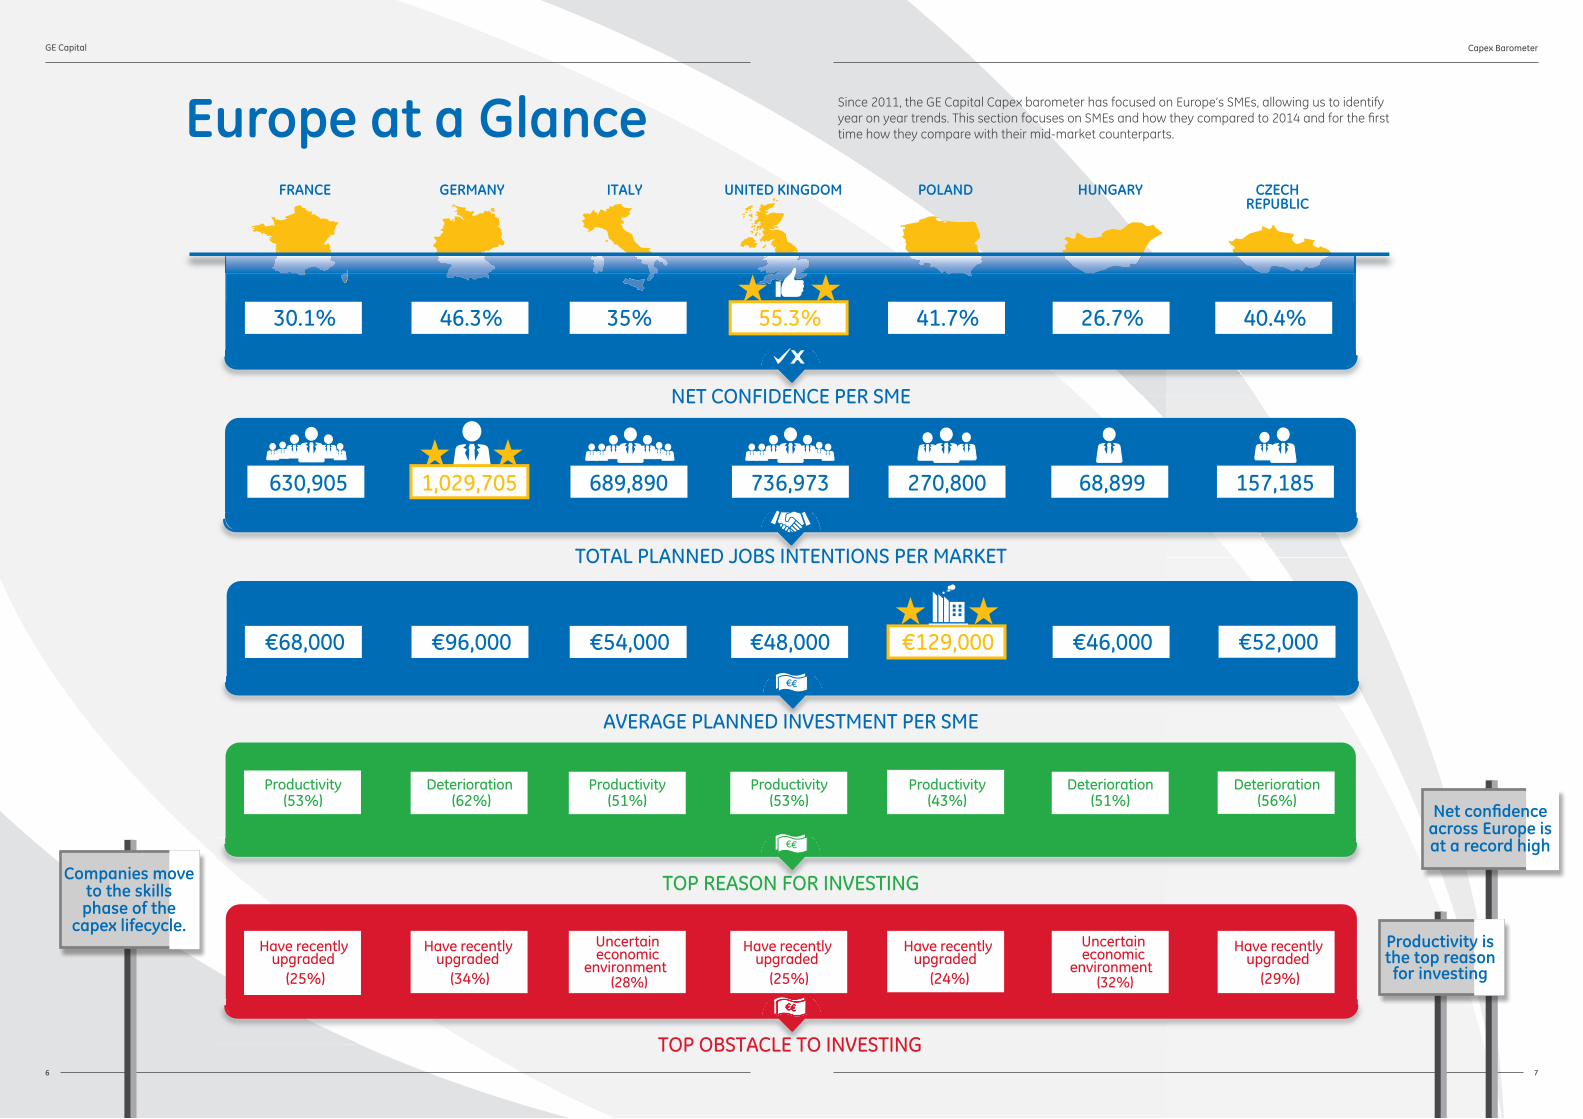
157,185 630,905 689,890 270,800 68,899736,9731,029,705
FRANCE GERMANY ITALY POLAND HUNGARYUNITED KINGDOM
€52,000€68,000 €96,000 €54,000 €129,000 €46,000€48,000
30.1% 46.3% 35% 41.7% 26.7% 40.4%55.3%
TOP OBSTACLE TO INVESTING
TOP REASON FOR INVESTING
Productivity(53%)
Productivity(51%)
Productivity(53%)
Deterioration(51%)
Deterioration(56%)
Productivity(43%)
Deterioration (62%)
Have recently upgraded
(25%)
Uncertain economic
environment (28%)
Have recently upgraded
(34%)
Have recently upgraded
(25%)
Have recently upgraded
(24%)
Have recently upgraded
(29%)
Uncertain economic
environment (32%)
TOP OBSTACLEE TTO INVESTING
TOTAL PLANNED JOBS INTENTIONS PER MARKET
AVERAGE PLANNED INVESTMENT PER SME
NET CONFIDENCE PER SME
Capex Barometer
7
GE Capital
6
Europe at a Glance Since 2011, the GE Capital Capex barometer has focused on Europe’s SMEs, allowing us to identify year on year trends. This section focuses on SMEs and how they compared to 2014 and for the first time how they compare with their mid-market counterparts.
Companies move to the skills phase of the
capex lifecycle.
Net confidence across Europe is at a record high
Productivity is the top reason for investing

Capex Barometer
9
GE Capital
8
Confidence is at record levels among European small businesses after a year in which most small and mid-market businesses grew their revenues.
The UK has the highest proportion of small companies that achieved growth in revenues in the past year, closely followed by Germany and the Czech Republic. Overall, European mid-market companies are more likely to have seen growth than their smaller counterparts – a trend most notable in the UK, Italy, France and the Czech Republic. With export growth, Italy leads the way with 46% of small businesses reporting growth in overseas revenues over the past 12 months, followed by France with 43% and Poland with 37%.
Amid the Eurozone, mid-market companies are 47% more likely than their smaller counterparts to have grown overseas revenues in the past 12 months. With the IMF recently predicting that GDP growth in the USA will reach 3.6% in 2015 – outpacing the global economy – and China’s immense spending power as the world’s largest economy, there are opportunities further afield. Perhaps driven by positive growth in revenues, net confidence among small businesses across Europe is at a record 39%, whilst mid-market companies are feeling even more bullish.
Growth and Business Sentiment
A year of growth
% SMEs reporting overseas revenue growth% MM reporting overseas revenue
61%
34%66%
51%
% MM reporting revenue growth% SMEs reporting revenue growth
54%
37%55%
56%
57%
22%67%
40%
54%
26%62%
34%
59%
30%61%
38%
54%
46%66%
61%
54%
43%66%
59%
UK
PL
CZ
HU
GE
IT
FR
Well-founded confidence
30%49%
SME net confidence 2015 MM net confidence
46%50%
35%54%
55%64%
40%47%
27%32%
42%57%
+7%
-3%
SME net confidence vs. 2014
+1%
+17%
+1%
+4%
+17%
UK
PL
CZ
HU
GE
IT
FR
With the IMF forecasting UK GDP growth of 2.7% in 2015, it is perhaps unsurprising that the UK’s small and mid-market businesses are feeling the greatest confidence. However, like Germany and Poland who are the next most confident markets, there is not much change from 2014. Small businesses in Italy and Hungary have had significant increases in confidence since 2014 and France has continued to increase in confidence after seeing a larger jump between 2013 and 2014.
The positive outlook in Italy could be clarified by a raft of encouraging economic indicators published around the time of the survey, including increases in manufacturing and industrial production and expectations that quantitative easing will be a welcome boost to the economy1. Meanwhile, the Central Bank of Hungary’s Quarterly Report on Inflation in December 2014 anticipated that the dynamic 3.3% growth in the economy in the previous year would continue, although at a more moderate rate of 2.4% in 2015. This could be why some of the countries most affected by the recession are now ‘bouncing back’, creating a more stable European bloc.
1Financial Times – 8th February, 2015: http://www.ft.com/cms/s/0/9595b1da-ad4b-11e4-a5c1-00144feab7de.html?siteedition=uk#axzz3Vsftrxer

Capex Barometer
11
GE Capital
10
Investment IntentionsCASE STUDY
Established by three entrepreneurs in 2011, Berry Telecom is a young, vi-brant, fast-growing business-to-busi-ness telecoms reseller covering the whole of the UK. The company sup-plies, installs and provides customer support for Samsung telephone sys-tems as well as offering high quality voice line systems to the SME market. During the past 12 months the com-pany has achieved significant growth in equipment, leasing, network and maintenance sales, driven by its focus on hiring new staff and prod-uct innovation. The company also introduced a new fleet of branded vehicles for its engineers, high quality sales training, and software to ensure control over customer billing. In a competitive market dominated by large players, Berry is now con-centrating on raising awareness of its offering and tapping into the new customer appetite for leasing tele-phone equipment. The primary focus of the business is both to hire new staff and to engage and empower its people to deliver a high quality customer experience, which it does by offering a range of incentives and rewards. Jo-Anne Udy, Finance Director at Berry Telecom, said: “We are looking forward to another exciting year building and strengthening our team to successfully deliver our business’ goals. Investment in talent develop-ment is the key to delivering not only the right products, but the best possi-ble service that will truly set us apart from competitors. This is backed up by the large number of referrals we receive that confirms our customers are happy and willing to recommend us to their peers; an area which is extremely important to us.”
After two years of stable or increasing spending in most of the European countries surveyed, total capex spending intentions across Europe have softened to €381 billion for the year ahead, down from €414 billion in 2014.
This suggests a ‘Capex lifecycle’ whereby businesses invest strategically on equipment, both hardware and software, before turning their attention to hiring people, ensuring they have the right skills to deliver growth and gain a return on their investment. Over the past two years, German small businesses have consistently led the way with robust capital expenditure and this remains the case in 2015 – ahead of France and Italy.
Total planned investment in the three Central and Eastern European markets has fallen compared to 2014, albeit from a lower starting point. However, Poland has taken Germany’s crown for the highest planned investment per SME, planning to spend on average €129,000 per SME (up 13%) vs. €96,000 per German SME (down 17%). In January, the European Bank for Reconstruction and Development predicted that Poland would largely escape the impact of a shrinking Russian economy and grow by 2.6% in the coming year, largely due to strong domestic demand .
Unsurprisingly, mid-market companies plan to invest more per company than small businesses, although small businesses (due to their larger number) contribute the greater share of total investment. On this measure, the UK’s mid-market plans to spend more per company than any other Western European country surveyed.
Investment intentions over the next 12 months (€bn)
Planned investment over the next 12 months per company
7 -24%
24 -19%
Total SME investment €bnTotal MM investment €bnvs. 2014 (% difference)
129
17GE
-5%
34IT
+33%80
8121
FR-10%
49
23UK
-36%
12CZ -10%
HU
PL
129,000
PL
584,000
FR
52,000
CZ HU
96,000
831,000
GE
48,000
822,000
UK
544,000
54,000
IT
Av. Investment per SME €
Av. Investment per MM €
+13%
vs. 2014 (% difference)
-17%
68,000
-10%-35%+2% -12%
46,000
-15%
Investment intentions by asset type (€bn)
Further supporting the trend towards people and productivity, there is an increase in planned investment this year on commercial vehicles in France, Germany, Italy and Hungary.
German, Italian and Hungarian small businesses plan to increase investment on IT Hardware and Office Equipment, while IT software is a bigger focus in Germany, Poland and Hungary than it was at the start of 2014.
Berry Telecom
CommercialVehicles
OfficeEquipment
ITHardware
ITSoftware
Manufacturing
PL
HU
GE
FR
UK
CZ
IT
42.7
36.5
20.4
26.2
7.95.2
10.88.1 7.9
4.4
26.2
36.3
17.5
24.7
4.7 5.3 6.18.4
5.6 5.4
21.217.8
24.9
16.2
6.52.6
12.9
6.810.0
5.1
6.7 6.23.7 3.4
0.6 0.6 1.4 1.1 1.0 0.8
5.93.0 2.0 2.2
0.2 0.5 0.7 0.8 0.4 0.6
15.311.3
9.27.2
1.3 1.7 2.5 2.4 1.7 1.8
66.5
54.2
43.244.7
5.6 6.5
12.713.3
8.110.0
2014 2015

Capex Barometer
13
GE Capital
12
POLAND
UNITEDKINGDOM
FRANCE
CZECHREPUBLIC
JOB CREATION
NEW
GERMANY
ITALY
1,029,705+15.7% vs. 2014
736,973+11.5% vs. 2014
689,890+322.5% vs. 2014
630,905+111.2% vs. 2014
270,800+15.2% vs. 2014
157,185+10.1% vs. 2014
68,899+33.3% vs. 2014
HUNGARY
Employment Intentions
3.58 million jobs are expected to be created in the next 12 months by small businesses in the seven European markets surveyed. A 47% increase on the 2.44 million jobs planned last year, once again suggesting overall stability and an appetite for growth. German small businesses plan to hire 16% more than last year and more than any other European market. Small businesses in the UK also plan to increase their headcounts by record numbers – this year by 736,973. Italy and France employment intentions appear strong with both countries planning on an increase in headcounts. On average mid-market companies are more likely to be planning a net increase in jobs than small businesses (59% vs. 50%) and they are set to make a significant contribution to employment.
Companies are focused on hiring
the right skills
Y-O-Y ComparisonItaly +323% vs. 2014
France +111 vs. 2014
Germany +16 vs. 2014
United Kingdom
+11 vs. 2014
Czech Republic
+10 vs. 2014
Hungary +33 vs. 2014
Poland +15 vs. 2014
CASE STUDIES
Sanatmetal is a 100% Hungarian-owned middle-sized company which develops, manufactures and sells traumatological, spine surgical, dental, veterinary implants and joint replacement (hip and knee) prostheses.
Demand for the company’s products has been growing at a rate of 20% in recent years with increased demand in the orthopaedic and spine therapeutics market.
A market leader in Hungary, currently 70% of revenues come from exports to 35 countries around the world. To keep up with demand the company has restructured its organisational and operating models, which included the establishment of production joint ventures in markets such as Mexico, Russia and the Middle East.
Throughout 2015 they will focus on five key areas of investment: IT, sales and marketing, research and development, organisational development and growing production capacity. Investments will also involve the expansion of the headquarters in Eger and through investment in R&D, the development of a new diagnostic product used in the prevention of stroke and sudden cardiac death cases.
Sanatmetal Ltd
Since 1987, the family-operated company has developed into one of the most significant processing plants for corrugated paper in north western Germany.
More than 130 million m² untrimmed sizes on 13 production lines are manufactured and delivered to over 1,000 customers by 250 employees. The company achieved revenues of €60 million in 2014.
Corrugated paper accounts for almost 70% of transport packaging – and has done so for many years. Moreover this sort of packaging, with its renewable resources, is recyclable and contributes to a balanced carbon footprint.
The company has established itself in the market with pioneering investments. An example of this is the fully automatic high rack warehouse, with its capacity of more than 15.000 pallets, which strongly contributes to the company’s success. In 2014 a processing machine with 6-color-print was put into operation and accounts for the gradually increasing demand for high-quality printed cardboards.
In order to continually fulfil the demands of the market and to generate further growth, investment in another processing machine has been approved for 2015. The machine will be launched in autumn 2015 and will further enhance the product range. Furthermore, the capacity of the fully automatic high rack is going to be upgraded to 5,000 spaces with completion scheduled for July 2015.
Zerhusen Kartonagen expects to see a significant increase in revenue due to these investments and a stable or increased market position. The order pipeline is currently excellent and implies a continuation of the dynamic growth seen over the past years.
Zerhusen

Capex Barometer
15
GE Capital
14
TOP THREE KEY MOTIVATING FACTORS FOR SMES 2015
TOP THREE BARRIERS TO SME INVESTMENT 2015
KEY
ITALYProductivity (51%)Deterioration (35%)New orders (32%)
Uncertain economic environment (28%)Lack of affordable finance (18%)Have recently upgraded (15%)
Investment DriversUpgrading existing equipment to enhance efficiency and productivity is once again the single biggest reason for investment for European small businesses (48%), followed by ‘deterioration of existing equipment’ (45%) and ‘building capacity to service new growth in orders’ (26%). Also, across all European markets small businesses are more likely to be investing for growth in their domestic markets rather than overseas.
The pattern across individual markets is broadly the same as 2014. Interestingly, we also asked companies about ‘missed opportunities’ – defined as new business wins or sales opportunities lost due to
outdated or inefficient equipment over the past year. Although ‘deterioration of existing equipment’ remains one of the top three reasons for investment among SMEs, the total estimated loss of income across Europe has fallen from almost €63 billion to €57 billion, suggesting that in some markets the need to invest for this reason may be softening.
Meanwhile, investing in new types of equipment to support diversification into new product lines is a bigger priority for French small businesses than it was in 2014 and small businesses in Italy are more likely than others to cite this as their top reason for investing (15%).
Top three key motivating factors for SMEs 2015
For barriers to investment there is a noticeable change as ‘having recently upgraded’ is now the number one barrier (25%), replacing concerns about an uncertain economic environment’ (23%), which have continued to dispel after a large fall between 2013 and 2014 surveys. This is certainly the case in Germany, France and the UK.
There are some exceptions to this trend, notably in Italy where economic uncertainty is more frequently cited as a barrier to growth compared with 12 months ago (28% vs. 16%) and in Poland, Hungary and the Czech Republic where the level of concern remains broadly the same.
Across Europe, a lack of affordable finance is the single biggest barrier for 16% of small businesses and 13% of mid-market companies – but more than half of all small and mid-market companies do not see this as a barrier at all.
Recent upgrades allow companies
to focus on people
GERMANYDeterioration (62%)Productivity (40%)New orders (25%)
Have recently upgraded (34%)Uncertain economic environment (16%)Lack of affordable finance (12%)
POLANDProductivity (43%)New orders (32%)Deterioration (31%)
Have recently upgraded (24%)Uncertain economic environment (22%)Lack of affordable finance (16%)
CZECH REPUBLICDeterioration (56%)Productivity (51%)New orders (29%)
Have recently upgraded (29%)Lack of affordable finance (20%)Uncertain economic environment (19%)
HUNGARYDeterioration (51%)Productivity (44%)New orders (25%)
Uncertain economic environment (32%)Have recently upgraded (22%)Lack of affordable finance (13%)
UNITED KINGDOMProductivity (53%)Deterioration (47%)New orders (24%)
Have recently upgraded (25%)Uncertain economic environment (20%)Lack of affordable finance (16%)
FRANCEProductivity (53%)Deterioration (34%)New product lines (17%)
Have recently upgraded (25%)Uncertain economic environment (23%)Lack of affordable finance (16%)

Capex Barometer
17
GE Capital
16
Financing Preferences
Across Europe, 59% of small businesses are most likely to buy equipment outright using company capital; while 52% would prefer to lease it through a vendor agreement or structured finance, and 49% would prefer to fund it through a bank loan. Although small businesses in Poland, Hungary and the Czech Republic are more likely to use finance from the EU or their local or national governments, than small businesses in Western Europe.
When choosing a finance provider, 68% of European small businesses say they would use a traditional high street bank; 66% say they would take finance from a manufacturer and 64% would use a specialist leasing provider. In most countries there has been a fall in the number of small businesses using traditional high street banks. Those in Germany, France and the Czech Republic are significantly more likely than they were last year to use finance from a specialist lender or manufacturer. In the case of peer-to-peer lending, there has been very little growth since 2014 and the number of small businesses saying they would use this source of finance has fallen noticeably in the UK.
Top 5 finance providers vs. 2014
France Germany Italy United Kingdom Czech Republic Hungary Poland
High street bank (74%) -10%
High street bank (82%) +2%
Specialist lender / leasing provider
(70%) +5%
High street bank (69%) –8%
High street bank (71%) -7%
Government / EU (75%) -10%
Government / EU (63%) -15%
Manufacturer (65%) +8%
Manufacturer (77%) +16%
Manufacturer (67%) +4%
Manufacturer (67%) +2%
Manufacturer (69%) +15%
High street bank (56%) –10%
Manufacturer (63%) -8%
Specialist lender / leasing provider
(62%) +13%
Specialist lender / leasing provider
(75%) +24%
High street bank (60%) -13%
Specialist lender /leasing provider
(64%) -2%
Specialist lender / leasing provider
(66%) +13%
Manufacturer (56%) -3%
Specialist lender / leasing provider (63%) No change
P2P lender (37%) +3%
Government / EU (31%) -20%
Government / EU (48%) -15%
Government / EU (34%) -35%
Government / EU (51%) -8%
Specialist lender / leasing provider
(47%) +4%
High street bank (62%) -5%
Government / EU (34%) -2%
P2P lender (17%) -3%
P2P lender (27%) -6%
P2P lender (28%) -14%
P2P lender (14%) +1%
P2P lender (17%) -2%
P2P lender (25%) +4%
CASE STUDY
French company Novae Aerospace is in the aerospace sector specializing in metal assembly activities from production and integrated manufacturing to machining, surface treatment and painting. Located in Prunay near Reims, the company is at the forefront of innovation and works with large outsourcers internationally.
Novae Aerospace is seeing an intense increase in production rates, while contributing to customers sustainable competitiveness. To continue to support customer needs, Novae Aerospace is continually adapting a development strategy with further
investment in materials. To achieve this, they have developed an innovative business model focused on ‘best cost’ innovative production solutions and investing in people, with special attention on evolving the skills of its employees.
Cédric Taveau, CEO of Novae Aerospace, added: “We invested between 2012 and 2014 on the means of production for us to ensure the reliability of our mechanical and boiler assembly parts. The target until 2016 will be to reinforce the investment in our assembly activities, including setting up of automatic machines for riveting, and also the alignment of our factory to optimizing operation and workstation ergonomic standards.”
Novae Aerospace
Spotlight on USA & Australia
For the first time, the GE Capital Capex Barometer has surveyed SMEs and mid-market companies in the USA and Australia. The below summarises the key findings from these crucial markets.
United StatesGE Capital’s Capex Barometer finds that the United States is clearly leading the way compared with the other countries surveyed. Although recent reports have indicated that business spending
and investment is failing to catch up to consumer spending and sentiment, with the US Commerce Department saying that non- defence capital goods orders have declined,2 the Barometer shows that American SMEs are planning to invest heavily over the year ahead. The United States is significantly ahead of European markets on capital expenditure: American SMEs plan to invest the equivalent of €107,000 per SME on capital expenditure; compared to €93,000 in Australia and €70,000 in Europe.
The estimated total planned SME capex investment over the next 12 months is €534 billion. The majority (47%) of this investment is focused on manufacturing equipment (€251 billion), while a quarter (23%) of total investment will be spent on commercial vehicles (€124 billion). The top driver of capex investment is ‘upgrading existing equipment to enhance efficiency and productivity.’
With almost three-quarters of American SMEs reporting revenue growth over the past year, business decision-makers are reporting
the highest levels of confidence of all nine markets surveyed, with over 70% of SMEs reporting that they are optimistic about the future. Similarly the mid-market within the United States, are reporting strong growth, with 81% reporting revenue growth over the past year and 58% report overseas revenue growth. The US mid-market also plans to spend a much higher amount per company than in any of the nine markets surveyed at €766,000.
Looking at employment intentions, over half (59%) of American SMEs are planning to increase their headcount over the next 12 months, adding a total of 6.4 million jobs, almost double the 3.6 million jobs planned across the seven European markets. However over 1 in 5 (21%) American SMEs cite economic uncertainty as the biggest barrier to future investment, while 42% of US SMEs say that they lost out on sales due to old and inefficient equipment, on average by €15,460 each.
It appears that American SMEs are open to leasing as a preferred financing method, with over half (58%) saying that leasing the equipment via a vendor agreement or structured finance is a preferred option. American SMEs also tend to prefer to get financing from a manufacturer over a traditional local ‘high street’ bank.
2US Commerce Department, March 2015: http://www.cnbc.com/id/102533136
Australia As one of the biggest mining economies in the world, Australia has been hit hard by the recent commodity price slump.3 While the major mining firms are growing sluggishly, Australia’s SMEs
share the same buoyant outlook as Europe.
The country’s SMEs and mid-market businesses are both growing slightly faster than their European counterparts with 58% and 68% reporting revenue growth respectively compared to an average of 56% and 63% in the EU7.
The gap between SMEs and mid-market firms continues when we look at confidence. Mid-market businesses in Australia are nine percentage points more confident than SMEs. The statistics chime with National Australia Bank’s latest SME survey which shows a broadly positive outlook amongst SME’s but one which is a fair way behind mid-market businesses as the smallest businesses struggle to manage their cash flow.4
Overall, SMEs in Australia still intend to invest €75 billion in the next twelve months, with over half of that (€38.1 billion) being put into
manufacturing, and a further €20.5 billion in commercial vehicles. Much like Europe, the majority of Australian SMEs (60%) say they are upgrading existing equipment to enhance efficiency and productivity. There still remains work to be done with old and inefficient equipment costing Australian SMEs on average €6,900 each last year. For those SMEs who haven’t recently upgraded, the main barriers to investment are economic uncertainty (22%) and lack of affordable finance (15%). This may be the reason that the vast majority (71%) of Australian SMEs prefer to finance investment with existing company capital.
While investment intentions are relatively positive, hiring intentions in Australia do not quite match those in Europe, with 40% of the SME’s surveyed saying they will increase their headcounts in the next 12 months by approximately 321,000 new jobs compared to the European average of 50%.
3The Australian Business Review - 1st April 2015, http://www.theaustralian.com.au/business/mining-energy/mining-stocks-hit-as-iron-ore-price-slump-continues/sto-ry-e6frg9df-1227287330356 National
4Australia Bank, http://business.nab.com.au/quarterly-sme-survey-december-quar-ter-2014-9696/
GE Capital
18
Methodology
Overview of research approach and methodologyGE Capital’s Capex Barometer is an international survey of over 3,400 senior executives, designed to provide an ongoing view of expected capital investment and employment intentions, as a key indicator of business confidence and appetite for growth. For the first time, the survey includes mid-market companies, defined as businesses with an annual revenue /turnover of approximately €5m - €1bn depending on the market, and has been expanded beyond Europe to cover a total of nine markets: Australia, Czech Republic, France, Germany, Hungary, Italy, Poland, UK and the USA. The research was compiled for GE Capital by Millward Brown’s corporate practice.
• Survey designed by the Corporate Research practice of Millward Brown (London) in Q1 2015
• Fieldwork was completed between 13th January and 16th February 2015.
• Interviews were conducted online (except in Australia, Czech Republic, Hungary, and UK where online was supplemented by telephone interviewing)
• All individual respondents had decision making responsibility for the asset areas covered by the report
• Total market figures were calculated by looking at the responses in each country and then multiplying this to match the wider SME / MM market in the respective country using the most recent published data. The primary sources of statistical information are:
- The European Commission’s SME Performance Review – with data provided by DIW (German Institute for Economic Research) - UK: Department for Business, Innovation and Skills and Office of National Statistics - Italy: The Italian National Institute for Statistics - France: National Institute of Statistics and Economic Studies
- Germany: Federal Statistical Office; WirtschaftsWoche - Hungary: Hungarian Central Statistical Office - Czech Republic: Czech Statistical Office - Poland: Central Statistical Office of Poland - USA: Bureau of Labour Statistics - Australia: Australian Bureau of Statistics
• Mid-market statistics for the UK, France, Germany, Italy, the USA and Australia are drawn from research conducted as part of GE Capital’s ongoing programme of mid-market research. This is conducted in co-operation with a number of leading academic institutions including:
- Warwick Business School - HEC Paris - The Institut für Mittelstandsforschung (IfM) Bonn - National Centre for The Middle Market, Ohio State University - University of Padova - Australian Graduate School of Management
• Approximately 379 companies were surveyed per market, of which at least 100 were mid- market companies (within GE Capital’s definition)
• Of the 3400 companies’ surveyed, based on headcount, 2579 of these were SME’s and based on revenue, 1199 were mid-market companies Of these 747 are classified as SME’s and mid-market companies.
• Figures were collected in local currency and converted to EUR euros. The respective source data for this is the historical exchange rate database at XE.com and Eurostat’s Harmonised CPI database available at: http://ec.europa.eu eurostat/inflation-dashboard/. Data prior to Q1 2015 is quoted in ‘today’s prices’ i.e. they have been adjusted to take account of exchange rate and inflation (CPI) fluctuations so as to provide a like for like comparison.
Disclaimer Caution concerning forward-looking statements
This document contains “forward-looking statements”- that is, statements related to future, not past, events. In this context, for ward-looking statements often address our expected future business and financial performance and financial condition, and often contain words such as “expect,” “anticipate,” “intend,” “plan,” believe,” “seek,” “see,” or “will.” Forward-looking statements by their nature address matters that are, to different degrees, uncertain. For us, particular uncertainties that could cause our actual results to be materially different than those expressed in our forward-looking statements include, without limitation: the level of demand and financial performance of the major industries we serve; the impact of regulation and regulatory, investigative and legal proceedings and legal compliance risks; strategic actions, including acquisitions and dispositions and our success in integrating acquired businesses; and numerous other matters of national, regional and global scale, including those of a political, economic, business and competitive nature.
These uncertainties may cause our actual future results to be materially different than those expressed in our forward-looking statements. We do not undertake to update our forward looking statements.
Important noticeAll information in this report is verified to the best of the author’s and the publisher’s ability. Neither we, nor the General Electric Company, our employees or our representatives assume liability for any errors or omissions contained therein, nor for any losses arising directly or indirectly from reliance on it. Furthermore the details and information herein do not constitute tax advice, accounting advice, financial advice or legal advice on our part. Recipients of this report are advised to seek their own professional advice. The information contained herein neither constitutes an acceptance nor an obligation on our part to provide financial or other services through a GE Capital affiliate to a person or company. Any transaction requires such GE Capital affiliate ultimate approval and the signing of final documents deemed satisfactory to both parties. We nor such GE Capital Affiliate guarantees or promises any earnings or income. © 2015 General Electric Company. All rights reserved. Neither this publication nor any part of it may be reproduced, stored in a retrieval system or transmitted in any form or by any means, electronic, mechanical, photocopying, recording or otherwise, without the prior permission of General Electric Company. GE Capital EMEA Services Limited.Registered Address:The Ark, 201 Talgarth Road, London W6 8BJ, United Kingdom.Registered in England and Wales No. 00244759www.gecapital.eu


