Capillary Loss and Leakage after Five Years of Intensified Insulin Treatment in Patients with Insulin-dependent Diabetes Mellitus PER REICHARD, MD, PhD, JAAN SULE, MD, URBAN ROSENQVIST, MD, PhD Abstract: Ninety-six patients with insulin-dependent diabetes mellitus were ran- domized to intensified conventional treatment (n=44) or regular treatment (n=52) programs and followed for 5 years. Hemoglobin A1c was reduced from 9.5% ± 0.1% to 7.2% ± 0.1% in the intensified conventional treatment group and from 9.4% ± 0.2% to 8. 7% ± 0.1% in the regular treatment group (mean ± standard error) (P < 0.001 ). Capillary loss and leakage of fluorescein as evaluated with fluorescein angiography increased significantly in the regular treatment group (P < 0.05; P < 0.01) but not in the intensified conventional treatment group. Capillary loss (P < 0.01) and leakage (P < 0.001) were related to metabolic control as measured by Hb A 1 c but not to duration of diabetes or smoking habits. Capillary loss (P < 0.05) but not leakage was related to the initial diastolic blood pressure. Ophthalmology 1991; 98:1587-1593 It has not been previously shown that diabetic retinop- athy can be influenced by improved blood glucose con- trol. I-s To examine the relationship between metabolic control and microvascular complications, including ret- inopathy, the Stockholm Diabetes Intervention Study 6 (SDIS) was started in 1982 as a 5-year study. - 8 The results after 5 years showed that improved blood glucose control retarded retinopathy, nephropathy, and peripheral neu- ropathy.8 Retinopathy was primarily studied with color fundus photographs. Originally received: October 22. 1990. Revision accepted: June 19, 1991. From the Departments of Internal Medicine II and Ophthalmology, Si:id- ersjukhuset, the Stockholm County Council Teaching Center for Diabetes (LUCD), Stockholm, Sweden. Supported by the Swedish division of NOVO-Nordisk Inc, Boehringer- Mannheim Scand, Inc, and the Swedish Medical Research Council (06615). Reprint requests to Per Reichard, MD, PhD, Department of Internal Medicine II, Si:idersjukhuset, s-118 83 Stockholm, Sweden. It has been argued that the progression of mild reti- nopathy can be better followed with fluorescein angiog- raphy.9 This article presents the results of angiographic studies performed in the SDIS at the baseline and after 5 7 years, but not at the interim follow-up visits. 6 · METHODS Ninety-six patients with insulin-dependent diabetes mellitus were followed for 5 years. At baseline, all patients had nonproliferative retinopathy, normals-creatinine, and high blood glucose levels, as judged by their physi- cian.6-8 All patients were randomized with closed identical envelopes to intensified conventional treatment (n=44) or regular treatment (n=52) programs. Data about the two groups are given in Table 1. The two groups did not differ with regard to sex, duration of diabetes, postpubertal duration of diabetes, body mass index, blood pressure, smoking habits, alcohol consumption, or initial micro- vascular complications. The treatment regimens have been described elsewhere. 6 - 8 The intensified conventional 1587
Transcript
Capillary Loss and Leakage after Five Years of Intensified Insulin Treatment in Patients with Insulin-dependent Diabetes Mellitus PER REICHARD, MD, PhD, JAAN SULE, MD, URBAN ROSENQVIST, MD, PhD
Abstract: Ninety-six patients with insulin-dependent diabetes mellitus were randomized to intensified conventional treatment (n=44) or regular treatment (n=52) programs and followed for 5 years. Hemoglobin A1c was reduced from 9.5% ± 0.1% to 7.2% ± 0.1% in the intensified conventional treatment group and from 9.4% ± 0.2% to 8.7% ± 0.1% in the regular treatment group (mean ± standard error) (P < 0.001 ). Capillary loss and leakage of fluorescein as evaluated with fluorescein angiography increased significantly in the regular treatment group (P < 0.05; P < 0.01) but not in the intensified conventional treatment group. Capillary loss (P < 0.01) and leakage (P < 0.001) were related to metabolic control as measured by Hb A1c but not to duration of diabetes or smoking habits. Capillary loss (P < 0.05) but not leakage was related to the initial diastolic blood pressure. Ophthalmology 1991; 98:1587-1593
It has not been previously shown that diabetic retinopathy can be influenced by improved blood glucose control. I-s To examine the relationship between metabolic control and microvascular complications, including retinopathy, the Stockholm Diabetes Intervention Study
6(SDIS) was started in 1982 as a 5-year study. -8The results after 5 years showed that improved blood glucose control retarded retinopathy, nephropathy, and peripheral neuropathy.8 Retinopathy was primarily studied with color fundus photographs.
Originally received: October 22. 1990. Revision accepted: June 19, 1991.
From the Departments of Internal Medicine II and Ophthalmology, Si:idersjukhuset, the Stockholm County Council Teaching Center for Diabetes (LUCD), Stockholm, Sweden.
Supported by the Swedish division of NOVO-Nordisk Inc, BoehringerMannheim Scand, Inc, and the Swedish Medical Research Council (06615).
Reprint requests to Per Reichard, MD, PhD, Department of Internal Medicine II, Si:idersjukhuset, s-118 83 Stockholm, Sweden.
It has been argued that the progression of mild retinopathy can be better followed with fluorescein angiography.9 This article presents the results of angiographic studies performed in the SDIS at the baseline and after 5
7 years, but not at the interim follow-up visits.6·
METHODS
Ninety-six patients with insulin-dependent diabetes mellitus were followed for 5 years. At baseline, all patients had nonproliferative retinopathy, normals-creatinine, and high blood glucose levels, as judged by their physician.6-8 All patients were randomized with closed identical envelopes to intensified conventional treatment (n=44) or regular treatment (n=52) programs. Data about the two groups are given in Table 1. The two groups did not differ with regard to sex, duration ofdiabetes, postpubertal duration of diabetes, body mass index, blood pressure, smoking habits, alcohol consumption, or initial microvascular complications. The treatment regimens have been described elsewhere.6-8The intensified conventional
1587
OPHTHALMOLOGY • OCTOBER 1991 • VOLUME 98 • NUMBER 10
Table 1. Intensified Conventional Treatment and Regular Treatment Groups at Entry into the Study
No. (Male/Female)
Intensified Conventional Treatment All : 44 (22/22) Loss: 25 (13/12)
BMI = body mass index; All = all patients followed for 5 years; Loss ± Standard error.
treatment group received education and close tutoring by frequent visits and telephone contacts, and they used blood glucose tests and, in most cases, three to six insulin injections daily. Insulin pumps were not used.
Hb A1c (normal range, 3.9% to 5.7%) was measured as described previously.6- 8 The value during the study is the mean of 14 values taken approximately every fourth month between 6 and 60 months.
Retinopathy was evaluated with color fundus photographs, with the retina divided into six fields (disc, macula, upper temporal, lower temporal, upper nasal, and lower nasal) and with a 40° angle lens.
For grading, the ETDRS standard photographs and a modified version ofthe ETDRS classification10 were used.6
The grader was unaware of the identity of the individual patients. Each of the six photographic fields was graded according to the ETDRS10 with regard to red spots, hard exudates, soft exudates, intraretinal microvascular abnormalities, and proliferative changes. Each eye received a retinopathy level according to the following definitions: Level 1: only microaneurysms, Level 2: microaneurysms and hard exudates, the summary
grade for soft exudates not more than 2 and for IRMA not more than 1;
Level 3: more than level 2 but less than level4; Level 4: microaneurysms and hard exudates, the added
summary grades for soft exudates and IRMA at least 10, or at least 6 if2 or more for IRMA or IRMA alone at least 4;
Level 5: microaneurysms, hard exudates, soft exudates, the summary grade for IRMA at least 6;
Level 6: new vessels and/or fibrous proliferations and/or photocoagulation performed.
The mean level for both eyes was used for analysis, 6
which means that the retinopathy for each patient was classified on a 12-grade ordinal scale from 0.5 to 6.0 with increments of0.5 units. This classification was reproducible, which was demonstrated by the re-analysis of 16 photographic sets after 18 months. Fourteen sets received exactly the same level, one set one level less and one set one level more.6 The classification is more sensitive than the ETDRS classification within the nonproliferative
Duration Insulin Dose BMI (yrs) Age (yrs) (IU/kg) (kg/m2
= the patients evaluated for capillary loss with fluorescein angiography. Mean
range because it measures retinopathy in all six fields, whereas the grade given by the ETDRS classification depends very much on retinopathy in the worst field. Our classification has the same number of grades in the nonproliferative range as the ETDRS. The difference in sensitivity is shown by the fact that at entry 98% of our patients had level 30 to 40 according to the ETDRS grading system, and, after 5 years, 99% of the patients had either level 30 to 40 or proliferative retinopathy. The greater range of values when our classification was used will be shown in the Results section. The results from our classification correlated with those received when the ETDRS classification was used (Spearman's p, 0.86 to 0.93 for various analyses).7
Fluorescein angiography was performed using a Canon CF 60 Z wide-angle fundus camera. Photographs were obtained, starting approximately 10 seconds after the injection of 10 ml of 10% sodium fluorescein into an antecubital vein, at 1- to 2-second intervals during the early phase, regularly during midphase, and after more than 3 minutes during the late phase. Primarily we studied the eye that showed the most advanced retinopathy at funduscopy performed by a specialist ophthalmologist at the baseline examination. This eye was then examined again after 5 years with regard to capillary loss and it was defined as the "first eye" when capillary leakage was studied. Stereo angiograms were not used. The grader had color photographs at his disposal, obtained before the angiogram at the same photographic session, to differentiate between leakage and window defects on the angiogram. Patients with a history of allergy were excluded from the angiography (seven patients from each group).
For analysis, we manufactured a grid according to the instructions in the ETDRS manual10; the radius of the innermost circle corresponding to 500 ~m in the fundus of an average eye (lfJ disc diameter), the radius of the second circle to 1500 ~m ( 1 disc diameter), and the radius of the third circle to 3000 ~m. Hence, we determined the appropriate size of the grid, with respect to the degree of magnification produced by the fundus camera.
All the fluorescein angiograms were graded by one of us (JS) in a masked fashion, the grader being unaware of the identity of the patient and the date of the angiogram.
1588
REICHARD et al • CAPILLARY LOSS AND LEAKAGE
Table 2. Retinopathy Level on Fundus Photographs at Entry and After 5 Years in the Intensified Conventional Treatment and
The analysis was made after the completion of the five year study, and the angiograms were presented to the grader in random order.
The angiograms were graded according to the ETDRS protocol10 for capillary loss and leakage in the eye primarily studied (the "first eye"), and for leakage in the fellow eye. Capillary loss was judged from early phase photographs as either none (level 0), questionable (level 1), mild (level2), moderate (level3), severe (level4), completely destroyed (level5), or cannot grade. This was done separately in each of the ten subfields of field 2F and in field 1 F. Leakage was judged from mid- and late-phase photographs as either none (level 0), questionable (level 1), mild (level 2), moderate (level 3), severe (level 4), or cannot grade, separately in each ofthe 10 subfields offield 2F. The mean retinopathy level ofeach patient equals the mean value of all the graded subfields.
As already stated, seven patients from each group had no angiograms performed because of known allergy. Excluded from the study were angiograms of 12 intensified conventional treatment and 13 regular treatment patients with regard to capillary loss; 2 intensified treatment and 3 regular treatment patients with regard to leakage in the first eye; and 2 intensified treatment and 5 regular treatment patients with regard to leakage in the second eye. Exclusion was due either to intensive photocoagulation, which made evaluation of capillary loss impossible after 5 years (3 intensified treatment and 2 regular treatment patients) or to poor photographic quality ("cannot grade").
Scatter argon laser photocoagulation was performed immediately in eyes with proliferative changes, regardless of whether these appeared on the disc or elsewhere.
The urinary albumin excretion rate was studied in 24hour urine collections as already described.6- 8 The patients were classified in the following way on the basis of the urinary albumin excretion rate (UAER)6•11
Peripheral nerve function was studied in the dominant leg and with temperature control.6- 8 We measured the
motor nerve conduction velocities of the tibial and peroneal nerves, the sensory nerve conduction velocity and the amplitude of the nerve action potential of the sural nerve, and the vibration threshold and the thermal threshold on the foot. 6- 8•12- 14 Neuropathy was diagnosed when two independent neurophysiological measures were abnormal.8
•15
The statistical relationship between the various measures was analyzed. In a multivariate analysis, capillary loss, leakage of fluorescein in the first eye, and leakage in the second eye were related to Hb A1c at entry into the study, mean Hb A1c during the study, duration ofdiabetes, initial diastolic blood pressure (continuous values given as mmHg), and smoking habits (dichotomized as smoker/ not smoker at baseline).
STATISTICAL METHODS
Values are given as mean ± standard error when nothing else is stated. Parametric tests were made with a twotailed t test for the analysis ofHb A1c values. Comparisons ofvalues for complications at entry and after 5 years primarily concerned ordinal data (retinopathy levels on fundus photographs or fluorescein angiograms, urinary albumin excretion levels) or continuous data with a skewed distribution (urinary albumin excretion rates) and were therefore made with a two-sided Wilcoxon signed rank test. The frequency of neuropathy was compared with chi-square analysis. Correlations were calculated with Spearman's method. Stepwise multiple linear regression was used in the multivariate analyses.
The study protocol was approved by the Ethics Committee of the Karolinska Institute. The patients gave their informed consent before participating in the study.
RESULTS
Hb A1c was reduced from 9.5% ± 0.2% to 7.2% ± 0.1% in the intensified conventional treatment group and from 9.4% ± 0.2% to 8.7% ± 0.1% in the regular treatment group (difference between the groups significant at p < 0.001).
Retinopathy, as evaluated with fundus photographs, did not differ between the groups at baseline, while the distribution of retinopathy levels showed higher values in the regular treatment group after 5 years, as has already been reported.8 The distribution between levels of retinopathy at baseline and after five years are shown in Table 2. As was previously established, 8 retinopathy increased in both groups.
In a previous publication, 8 we showed that urinary albumin excretion (P < 0.05), the development ofmanifest nephropathy (P < 0.01), and neuropathy (P < 0.01) were significantly retarded by the lower blood glucose levels achieved by the patients of the group receiving intensified conventional treatment. A summary of these results is shown in Table 3.
1589
OPHTHALMOLOGY • OCTOBER 1991 • VOLUME 98 • NUMBER 10
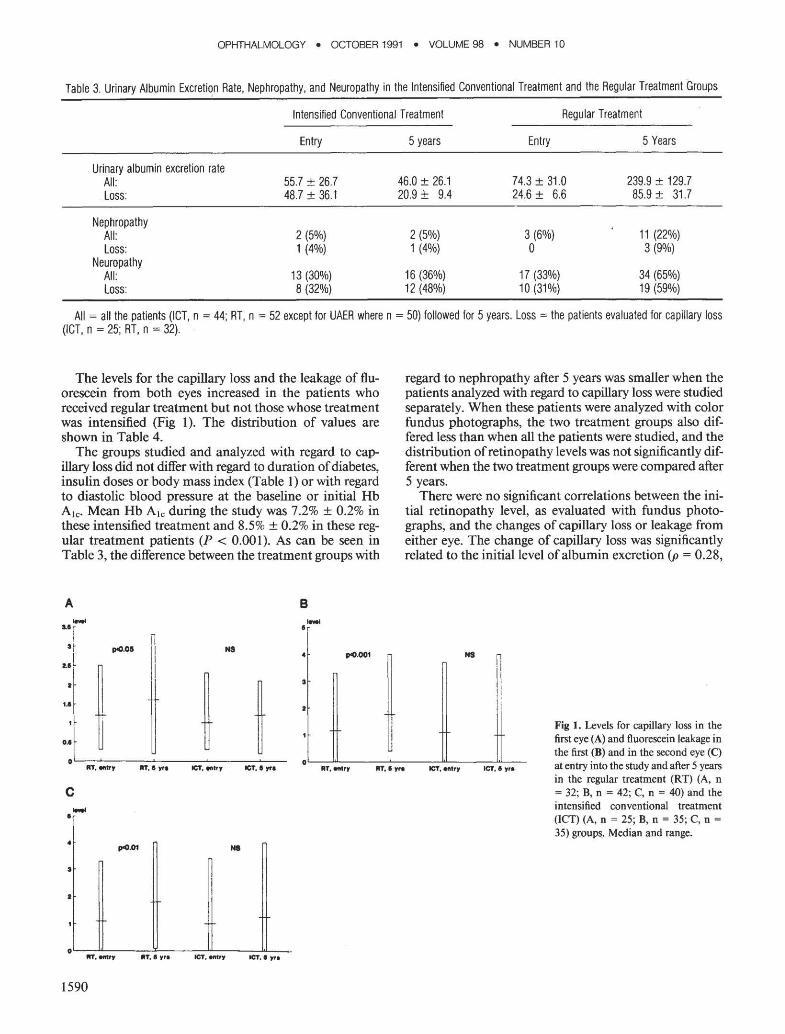
Table 3. Urinary Albumin Excretiqn Rate. Nephropathy, and Neuropathy in the Intensified Conventional Treatment and the Regular Treatment Groups
All = all the patients (ICT. n = 44; RT, n =52 except for UAER where n =50) followed for 5 years. Loss = the patients evaluated for capillary loss (ICT, n = 25; RT, n = 32).
The levels for the capillary loss and the leakage of fluorescein from both eyes increased in the patients who received regular treatment but not those whose treatment was intensified (Fig 1 ). The distribution of values are shown in Table 4.
The groups studied and analyzed with regard to capillary loss did not differ with regard to duration ofdiabetes, insulin doses or body mass index (Table 1) or with regard to diastolic blood pressure at the baseline or initial Hb Ate· Mean Hb Ate during the study was 7.2% ± 0.2% in these intensified treatment and 8.5% ± 0.2% in these regular treatment patients (P < 0.00 l ). As can be seen in Table 3, the difference between the treatment groups with
A- B-u r lr I n
~.011 'I N8 ~.001
II
~ i t
regard to nephropathy after 5 years was smaller when the patients analyzed with regard to capillary loss were studied separately. When these patients were analyzed with color fundus photographs, the two treatment groups also differed less than when all the patients were studied, and the distribution ofretinopathy levels was not significantly different when the two treatment groups were compared after 5 years.
There were no significant correlations between the initial retinopathy level, as evaluated with fundus photographs, and the changes of capillary loss or leakage from either eye. The change of capillary loss was significantly related to the initial level of albumin excretion (p = 0.28,
NS
Fig I . Levels for capillary loss in the first eye (A) and fluorescein leakage in the first (B) and in the second eye (C)
oL-~L-----~------~----~L---RT, I Ytl ICT, •try ICT, I"" JIIT, entry ItT, I yra ICT, entry at entry into the study and after 5 years
in the regular treatment (RT) (A, n c = 32; B, n = 42; C, n = 40) and the
intensified conventional treatment• - (ICT) (A, n = 25; B, n = 35; C, n =
35) groups~ Median and range.• N8
I
•
0~~~----~-----=~----~~--"'· entry ItT, I yre ICT, entry ICT, 1 'tfl
1590
REICHARD et al • CAPILLARY LOSS AND LEAKAGE
Table 4. Distribution of Scores on Fluorescein Angiography with Regard to Capillary Loss, Leakage in the First Eye, and Leakage in the Second
Eye in the Intensified Conventional Treatment Group and the Regular Treatment Group at Entry to the Study and after 5 Years
Leakage in the first eye 0-0.9 16 14 18 7 1-1.9 10 14 14 20 2-2.9 8 3 8 8 3 1 4 3 8
Leakage in the second eye 0-0.9 16 14 17 6 1-1.9 10 13 14 17 2-2.9 6 2 8 13 3 2 5 1 4
P < 0.05) but not to neuropathy. The significant correlations between angiographic results and retinopathy as studied with color photographs, UAER, and neuropathy are shown in Table 5. The angiographic measures generally correlated with the results from the photographic studies with regard to retinopathy and also to most of the measures concerning neuropathy. Table 6 shows that there was a weak correlation between the changes offluorescein leakage and the changes of retinopathy on fundus photographs. We found no such correlation between changes with regard to capillary loss and photographic retinopathy.
In the multivariate analyses, capillary loss was independently related to mean Hb Ate during the study (P < 0.01) and initial diastolic blood pressure (P < 0.05) (R2 = 0.20, P < 0.001) but not to Hb Ate at entry, diabetes duration or smoking habits. Leakage of fluorescein in the first eye was related only to mean Hb Ate during the study (R2 = 0.27, P < 0.001). In the second eye, leakage was related to both initial Hb A1e (P < 0.05) and to Hb Ate during the study (P < 0.01) (R2 = 0.25, P < 0.001).
Altogether, 25 patients developed proliferative retinop~ athy during 5 years. The development ofproliferative retinopathy was related to the initial values for retinopathy as studied with fundus photographs (p = 0.33), albumin excretion rate (p = 0.23), the existence of neuropathy (p = 0.44), capillary loss (p = 0.44), and capillary leakage (p = 0.37). Ofthe 16 patients who developed proliferative retinopathy and who had acceptable initial photographs with regard to capillary loss, 10 (63%) had a level for capillary loss of less than 2.0.
This was the case for 43 of 4 7 patients (91%) who did not develop proliferative retinopathy. Proliferative retinopathy was never diagnosed with fluorescein angiography when it was not seen also on the color fundus photographs.
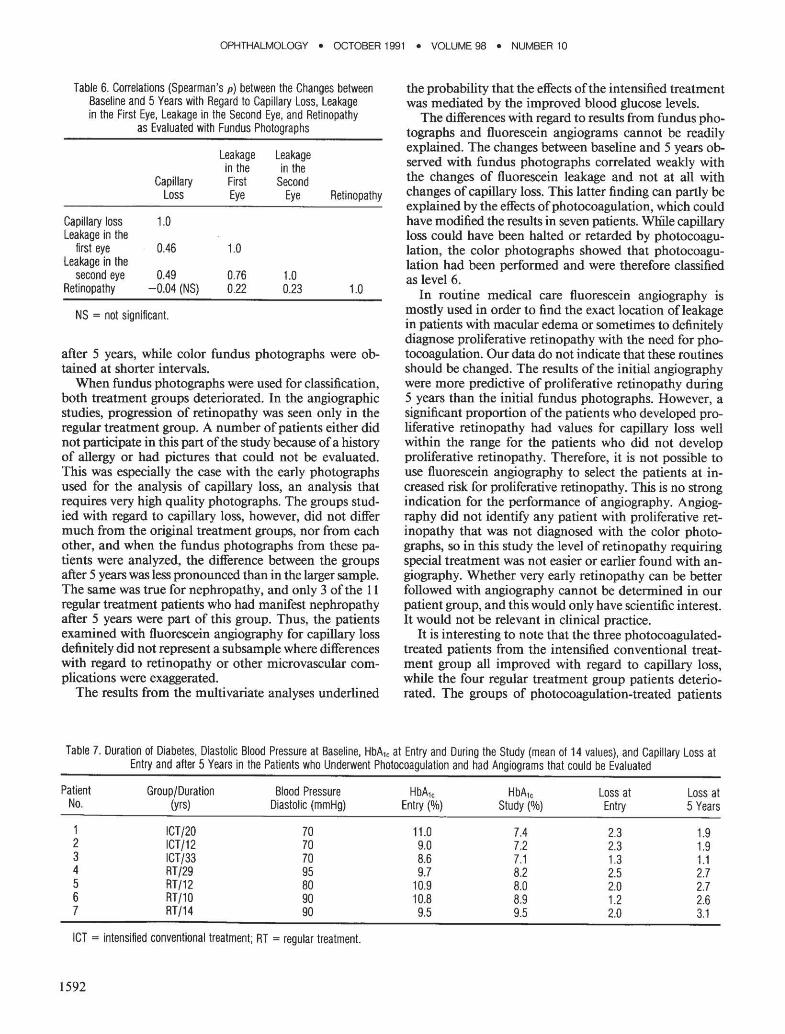
When the patients who underwent photocoagulation between the 2 examinations and still had angiograms that could be graded after 5 years were studied separately, the 3 intensified conventional treatment patients all improved with regard to capillary loss, while the 4 regular treatment patients deteriorated (Table 7). The two groups differed at baseline with regard to diastolic blood pressure.
DISCUSSION
Fluorescein angiography is a sensitive method for the quantification of diabetic retinopathy.9 In the SDIS, we performed fluorescein angiography at the baseline and
Table 5. Significant Correlations (Spearman's p) between the Results from Fluorescein Angiography and Retinopathy as Evaluated with Fundus Photographs, Urinary Albumin Excretion Rate Level, and Neuropathy at Entry to the Study and after 5 Years
Urinary Albumin Urinary Albumin Retinopathy Retinopathy Excretion Rate Excretion Rate Neuropathy Neuropathy
at Entry at 5 Years Entry at 5 Years at Entry at 5 Years
OPHTHALMOLOGY • OCTOBER 1991 • VOLUME 98 • NUMBER 10
Table 6. Correlations (Spearman's p) between the Changes between Baseline and 5 Years with Regard to Capillary Loss, Leakage in the First Eye, Leakage in the Second Eye, and Retinopathy
after 5 years, while color fundus photographs were obtained at shorter intervals.
When fundus photographs were used for classification, both treatment groups deteriorated. In the angiographic studies, progression of retinopathy was seen only in the regular treatment group. A number of patients either did not participate in this part of the study because ofa history of allergy or had pictures that could not be evaluated. This was especially the case with the early photographs used for the analysis of capillary loss, an analysis that requires very high quality photographs. The groups studied with regard to capillary loss, however, did not differ much from the original treatment groups, nor from each other, and when the fundus photographs from these patients were analyzed, the difference between the groups after 5 years was less pronounced than in the larger sample. The same was true for nephropathy, and only 3 ofthe 11 regular treatment patients who had manifest nephropathy after 5 years were part of this group. Thus, the patients examined with fluorescein angiography for capillary loss definitely did not represent a subsample where differences with regard to retinopathy or other microvascular complications were exaggerated.
The results from the multivariate analyses underlined
Table 7. Duration of Diabetes, Diastolic Blood Pressure at Baseline, HbA1,
the probability that the effects of the intensified treatment was mediated by the improved blood glucose levels.
The differences with regard to results from fundus photographs and fluorescein angiograms cannot be readily explained. The changes between baseline and 5 years observed with fundus photographs correlated weakly with the changes of fluorescein leakage and not at all with changes ofcapillary loss. This latter finding can partly be explained by the effects ofphotocoagulation, which could have modified the results in seven patients. Wliile capillary loss could have been halted or retarded by photocoagulation, the color photographs showed that photocoagulation had been performed and were therefore classified as level6.
In routine medical care fluorescein angiography is mostly used in order to find the exact location of leakage in patients with macular edema or sometimes to definitely diagnose proliferative retinopathy with the need for photocoagulation. Our data do not indicate that these routines should be changed. The results of the initial angiography were more predictive of proliferative retinopathy during 5 years than the initial fundus photographs. However, a significant proportion of the patients who developed proliferative retinopathy had values for capillary loss well within the range for the patients who did not develop proliferative retinopathy. Therefore, it is not possible to use fluorescein angiography to select the patients at increased risk for proliferative retinopathy. This is no strong indication for the performance of angiography. Angiography did not identify any patient with proliferative retinopathy that was not diagnosed with the color photographs, so in this study the level of retinopathy requiring special treatment was not easier or earlier found with angiography. Whether very early retinopathy can be better followed with angiography cannot be determined in our patient group, and this would only have scientific interest. It would not be relevant in clinical practice.
It is interesting to note that the three photocoagulatedtreated patients from the intensified conventional treatment group all improved with regard to capillary loss, while the four regular treatment group patients deteriorated. The groups of photocoagulation-treated patients
at Entry and During the Study (mean of 14 values), and Capillary Loss at Entry and after 5 Years in the Patients who Underwent Photocoagulation and had Angiograms that could be Evaluated
Patient Group/Duration Blood Pressure HbA1, HbA1, Loss at Loss at No. (yrs) Diastolic (mmHg) Entry(%) Study(%) Entry 5 Years
were small and not completely comparable at baseline. However, the results could imply that the effects of photocoagulation are better in patients who also improve their blood glucose control, but further studies, specifically directed at analyzing this issue, are warranted.
Diabetic retinopathy, as measured with fluorescein angiography, was retarded by intensified conventional insulin treatment during 5 years. This confirms our previous results8 and underlines our conclusion: every patient with insulin-dependent diabetes mellitus should be offered modern insulin treatment, including educational as well as technical measures, to achieve only moderately elevated blood glucose levels.
REFERENCES
1. The DCCT Research Group. Are continuing studies of metabolic con
trol and microvascular complications in insulin-dependent diabetes
mellitus justified? The Diabetes Control and Complications Trial. N
Engl J Med 1988; 318:246-50. 2. Lauritzen T, Frost-Larsen K, Larsen HW, Decker LT. Effect of 1 year
of near-normal blood glucose levels on retinopathy in insulin-dependent
diabetes. Lancet 1983; 1:200-4. 3. The KROC Collaborative Study Group. Blood glucose control and the
evolution of diabetic retinopathy and albuminuria. N Engl J Med 1984;