Contents Inflation 3 Government Bonds 3 Inflation-Linked Government Bonds 4 Investment Grade Corporate Bonds 5 US High Yield Debt and Emerging Market Debt 5 Equities 6 Private Equity 7 Real Estate 7 Hedge Funds 8 Volatility 9 Correlations 10 Capital Market Assumptions Methodology 11 Capital Market Assumptions As of December 31, 2012 Bond returns are driven by more than the yield to maturity When bond investments are managed on an ongoing basis, portfolio returns will be impacted by many factors in addition to the initial yield. The expected path of yields and shape of yield curves in future will also have a strong bearing on portfolio returns. When investors contemplate the return prospects for bond investments, a natural starting point is the yield to maturity. If a bond is held until it matures, rather than being managed as part of an ongoing portfolio, then this yield is exactly the return a bond investor will earn (money-weighted rate of return). However, in practical terms not many investors invest on this basis. Portfolios that are managed on an ongoing basis, whether passively or actively, will tend to exhibit relatively stable durations over time, rather than declining as would be the case with a buy and hold investment. Investors who are fixated on the initial yield at which they invest are ignoring other variables which can have a significant impact on their future returns. In particular, investors are exposed to the path that yields take in future rather than solely the yield at which they invest at the outset. For example, because of the inverse relationship between yields and prices, rising yields will normally lead to capital losses on bond investments. An assessment of the long term return prospects for bonds must therefore have reference to future yield levels and, for that, we can turn to information included in the yield curve. At its most basic level, the yield curve is a representation of the current market price of future interest rates. For example, the 2 year yield can be decomposed into the 1 year yield and they yield applicable between the end of year 1 and the end year 2. Using the US as an example, at 31 December, the 1 year and 2 year duration Treasury yields were 0.2% and 0.3% respectively. From this we can calculate that the market is pricing the 1 year yield to be 0.2% over the first year but increase to 0.4% over the second year: (1 + 0.2%) * (1 + 0.4%) = (1+ 0.3%)2. Researchers continue to debate whether what is priced into the yield curve truly reflects pure market expectations for future spot rates, or if investor-specific preferences can cause the curve to drift from those expectations. Such a discussion, while worthwhile, is beyond the scope of this article.
Transcript
ContentsInflation 3
Government Bonds 3
Inflation-Linked Government Bonds 4
Investment Grade Corporate Bonds 5
US High Yield Debt and Emerging Market Debt 5
Equities 6
Private Equity 7
Real Estate 7
Hedge Funds 8
Volatility 9
Correlations 10
Capital Market Assumptions Methodology 11
Capital Market AssumptionsAs of December 31, 2012
Bond returns are driven by more than the yield to maturity
When bond investments are managed on an ongoing basis, portfolio returns will be impacted by many factors in addition to the initial yield. The expected path of yields and shape of yield curves in future will also have a strong bearing on portfolio returns.
When investors contemplate the return prospects for bond investments, a natural starting point is the yield to maturity. If a bond is held until it matures, rather than being managed as part of an ongoing portfolio, then this yield is exactly the return a bond investor will earn (money-weighted rate of return).
However, in practical terms not many investors invest on this basis. Portfolios that are managed on an ongoing basis, whether passively or actively, will tend to exhibit relatively stable durations over time, rather than declining as would be the case with a buy and hold investment. Investors who are fixated on the initial yield at which they invest are ignoring other variables which can have a significant impact on their future returns.
In particular, investors are exposed to the path that yields take in future rather than solely the yield at which they invest at the outset. For example, because of the inverse relationship between yields and prices, rising yields will normally lead to capital losses on bond investments. An assessment of the long term return prospects for bonds must therefore have reference to future yield levels and, for that, we can turn to information included in the yield curve.
At its most basic level, the yield curve is a representation of the current market price of future interest rates. For example, the 2 year yield can be decomposed into the 1 year yield and they yield applicable between the end of year 1 and the end year 2. Using the US as an example, at 31 December, the 1 year and 2 year duration Treasury yields were 0.2% and 0.3% respectively. From this we can calculate that the market is pricing the 1 year yield to be 0.2% over the first year but increase to 0.4% over the second year: (1 + 0.2%) * (1 + 0.4%) = (1+ 0.3%)2. Researchers continue to debate whether what is priced into the yield curve truly reflects pure market expectations for future spot rates, or if investor-specific preferences can cause the curve to drift from those expectations. Such a discussion, while worthwhile, is beyond the scope of this article.
A steeply upward sloping yield curve like we have at present implies that the market is pricing yields to rise significantly over time. Although the example we have given relates to pricing for the 1 year yield, we can construct similar calculations to assess what is priced in for the future path of a much wider range of yields, something far more relevant for pension plans and bond investors. Using the US as an example again, although the 5 year duration Treasury yield was only 0.7% at the end of 2012 and the 15 year duration yield was only 2.6%, the yield curve is pricing in significant increases in both of these over the next 10 years. Both are expected to reach around 4% by the end of 2023. This significant increase has major implications for the returns that bond investors are likely to earn over the next 10 years.
� If yields rise over time as is priced into the market, then bond investors are likely to suffer capital losses on their bond investments.
� Assuming that they maintain a portfolio with a broadly stable duration, when the yield curve is upward sloping, as it is at present, investors will also earn a gain by selling shorter dated bonds and buying longer dated bonds when rebalancing their portfolio (the ‘roll’ return).
� While rising yields lead to capital losses on existing investments, new investments can benefit from these higher yields through relatively higher returns in future years.
Therefore, what matters for bond investors is not just the level of yields today and in future but also the slope of the yield curve in future. The complex interaction between these variables will have a significant impact
on returns that investors are likely to earn. The charts at the bottom of this page decompose our 5 year duration and 15 year duration government bond return assumptions for a range of markets into these components (based on our standard 10 year projection period).
As the charts below demonstrate, investors in short duration bonds are assumed to earn a return much higher than the current yield to maturity because of the anticipated ability to reinvest at higher yields in future. This more than offsets any capital losses which are expected to arise through yields rising. Conversely, longer duration bonds will experience larger capital losses when yields rise, meaning that these return assumptions are close to or below the initial yield.
Investors who concentrate only on the yield to maturity may therefore be unaware that this measure could materially understate the long term returns that can be earned by a short duration bond portfolio at this point in time. Investors in longer duration bonds are less fortunate and in some cases the yield to maturity could, in fact, overstate the long term return potential of these investments. The return will only be exactly equal to the yield to maturity if the bonds are “bought and held” and even then, it will only be the overall return that will be obtained over the whole period rather than the return over any individual year.
One thing is clear, unless bond investments are being held on a buy and hold basis, the yield to maturity only tells part of the story when considering the long term return prospects for bond investments. To see the whole picture, investors need to develop an appreciation, not just of existing yields, but also the level and shape of the yield curve in future.
5yr Duration Government Bonds10yr Projection Period
15yr Duration Government Bonds10yr Projection Period
-1.0%
-0.5%
0.0%
0.5%
1.0%
1.5%
2.0%
2.5%
INITIAL YIELD
US
CAPITAL LOSS ROLL RETURN INCREASINGYIELD
OVERALLRETURN
ASSUMPTION
INITIAL YIELD CAPITAL LOSS ROLL RETURN INCREASINGYIELD
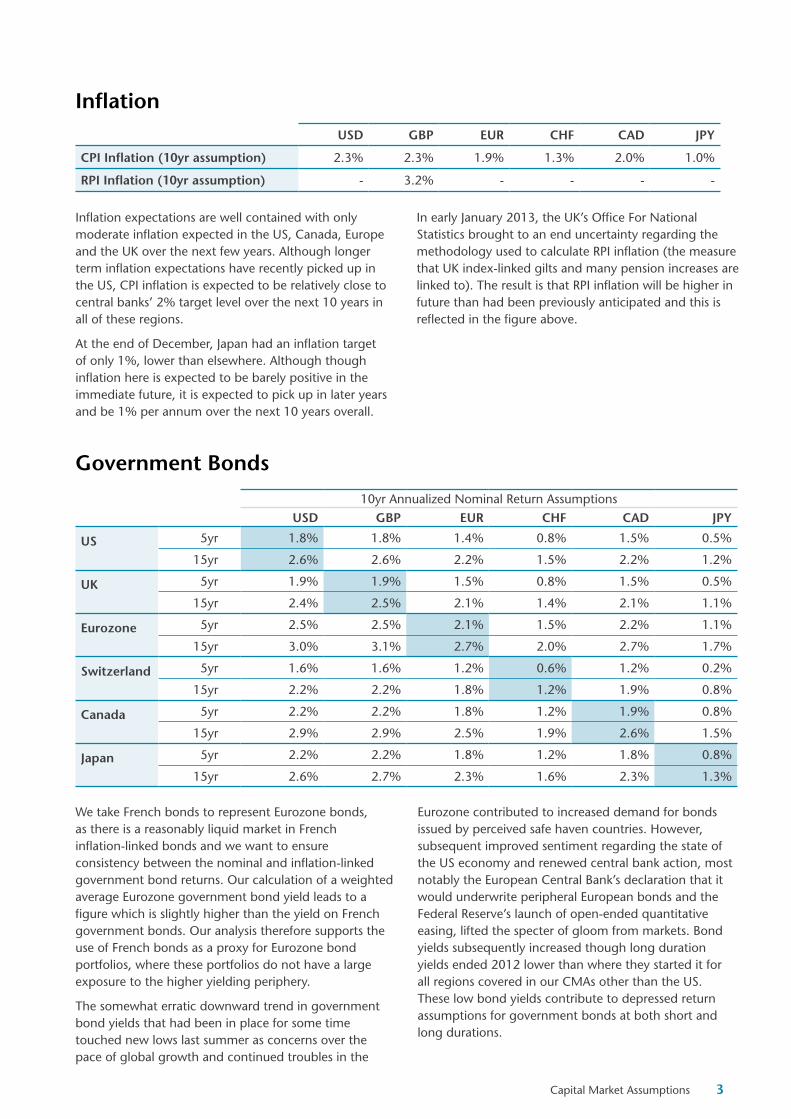
Inflation expectations are well contained with only moderate inflation expected in the US, Canada, Europe and the UK over the next few years. Although longer term inflation expectations have recently picked up in the US, CPI inflation is expected to be relatively close to central banks’ 2% target level over the next 10 years in all of these regions.
At the end of December, Japan had an inflation target of only 1%, lower than elsewhere. Although though inflation here is expected to be barely positive in the immediate future, it is expected to pick up in later years and be 1% per annum over the next 10 years overall.
In early January 2013, the UK’s Office For National Statistics brought to an end uncertainty regarding the methodology used to calculate RPI inflation (the measure that UK index-linked gilts and many pension increases are linked to). The result is that RPI inflation will be higher in future than had been previously anticipated and this is reflected in the figure above.
10yr Annualized Nominal Return Assumptions
USD GBP EUR CHF CAD JPY
US 5yr 1.8% 1.8% 1.4% 0.8% 1.5% 0.5%
15yr 2.6% 2.6% 2.2% 1.5% 2.2% 1.2%
UK 5yr 1.9% 1.9% 1.5% 0.8% 1.5% 0.5%
15yr 2.4% 2.5% 2.1% 1.4% 2.1% 1.1%
Eurozone 5yr 2.5% 2.5% 2.1% 1.5% 2.2% 1.1%
15yr 3.0% 3.1% 2.7% 2.0% 2.7% 1.7%
Switzerland 5yr 1.6% 1.6% 1.2% 0.6% 1.2% 0.2%
15yr 2.2% 2.2% 1.8% 1.2% 1.9% 0.8%
Canada 5yr 2.2% 2.2% 1.8% 1.2% 1.9% 0.8%
15yr 2.9% 2.9% 2.5% 1.9% 2.6% 1.5%
Japan 5yr 2.2% 2.2% 1.8% 1.2% 1.8% 0.8%
15yr 2.6% 2.7% 2.3% 1.6% 2.3% 1.3%
Government Bonds
We take French bonds to represent Eurozone bonds, as there is a reasonably liquid market in French inflation-linked bonds and we want to ensure consistency between the nominal and inflation-linked government bond returns. Our calculation of a weighted average Eurozone government bond yield leads to a figure which is slightly higher than the yield on French government bonds. Our analysis therefore supports the use of French bonds as a proxy for Eurozone bond portfolios, where these portfolios do not have a large exposure to the higher yielding periphery.
The somewhat erratic downward trend in government bond yields that had been in place for some time touched new lows last summer as concerns over the pace of global growth and continued troubles in the
Eurozone contributed to increased demand for bonds issued by perceived safe haven countries. However, subsequent improved sentiment regarding the state of the US economy and renewed central bank action, most notably the European Central Bank’s declaration that it would underwrite peripheral European bonds and the Federal Reserve’s launch of open-ended quantitative easing, lifted the specter of gloom from markets. Bond yields subsequently increased though long duration yields ended 2012 lower than where they started it for all regions covered in our CMAs other than the US. These low bond yields contribute to depressed return assumptions for government bonds at both short and long durations.
Capital Market Assumptions 3
However, as described in the lead article to this publication, our return assumptions for government bonds over the next 10 years do not depend solely on the yield at the end of the quarter because they relate to bond portfolios which are rebalanced on an annual basis to maintain duration and hence the future path of yields also has an impact.
Yield curves price in bond yields rising after a period of time at low levels. This impacts our bond return assumptions in a number of ways. Two of the major impacts are that increasing yields lead to capital losses on bond investments (with longer duration bonds suffering larger losses than shorter duration bonds) but this also allows bond investors to benefit from re-investment at higher yields throughout the projection period. This is why the return assumptions for 5 year duration bonds are all higher than the corresponding yields to maturity, as future reinvestment is projected to be at higher yields than currently available.
The troubles facing the Eurozone have led to a divergence between Eurozone government bond yields and those in the other major markets. When the crisis temperature increased in the Eurozone, Eurozone yields increased relative to elsewhere, with these yields incorporating an additional Eurozone ‘risk premium’ that investors demanded to compensate them for the additional risks of investing in the region. The European Central bank’s statements last autumn reassured investors and part of this risk premium has since been eroded, leading to relatively strong performance from these bonds and falls in Eurozone yields at a time when they were rising elsewhere. Following these relative movements, Eurozone government bond yields and return assumptions are now once again broadly in line with those for the US, Canadian and UK markets.
Inflation-Linked Government Bonds
We have taken French bonds to represent Eurozone bonds, partly because there is a reasonably liquid market in French inflation-linked bonds. Our analysis of nominal government bonds also suggests that French bonds are a reasonable proxy for Eurozone government bonds so we make the same assumption here for consistency. The bonds represented are linked to Eurozone inflation.
We formulate return assumptions for 10 year US and Eurozone inflation-linked government bonds rather than 15 year bonds. This is because we think that the absence of inflation-linked bonds at the longest durations in these markets can lead to misleading 15 year bond return assumptions. We also no longer publish a 5 year duration Canadian inflation-linked government bond assumption due to the lack of short duration bonds in this market.
10yr Annualized Nominal Return Assumptions
Duration USD GBP EUR CHF CAD JPY
US 5yr 1.7% 1.7% 1.3% 0.7% 1.4% 0.4%
10yr 1.6% 1.7% 1.3% 0.6% 1.3% 0.3%
UK 5yr 2.5% 2.6% 2.2% 1.5% 2.2% 1.2%
15yr 2.0% 2.0% 1.6% 1.0% 1.7% 0.7%
Eurozone 5yr 2.5% 2.5% 2.1% 1.5% 2.2% 1.1%
10yr 2.3% 2.3% 1.9% 1.2% 1.9% 0.9%
Canada 5yr - - - - - -
15yr 1.8% 1.9% 1.5% 0.8% 1.5% 0.5%
A similar story overall holds for inflation-linked as for nominal government bonds, with low yields driving low return assumptions in all four regions. Interestingly, while nominal government bond yields have been on a rising trend since last summer, the same has not been true of real yields on inflation-linked bonds. This has led to increases in breakeven inflation (the difference in yield between nominal and inflation-linked bonds of equivalent duration). As inflation expectations have not increased to the same extent, this increase in breakeven inflation instead reflects an increase in inflation risk premia.
A second factor influencing inflation-linked bond return assumptions is inflation expectations. In this respect, returns from UK index-linked gilts benefit in relative terms compared with the other markets by virtue of the fact that returns on these bonds are linked to UK RPI inflation. This has an impact because other regional inflation-linked bond returns are linked to CPI inflation and this is assumed to be much lower than UK RPI inflation.
4 Aon Hewitt | Proprietary and Confidential
Investment Grade Corporate Bonds
Corporate bond returns depend on both a government yield component and a credit spread component but also take account of losses arising from defaults and bonds being downgraded.
In absolute terms, corporate bond return assumptions are at depressed levels relative to what investors will have experienced historically as a result of low yields and low return expectations for the underlying government bond component.
After having peaked in the first half of 2012, corporate bond credit spreads have subsequently been on a declining trend and this has reduced the premium that corporate bonds are assumed to earn over government bonds. More recently it also means that although return expectations for government bonds have increased somewhat, corporate bonds return assumptions have remained relatively unchanged as higher government yields have been offset by lower credit spreads.
US High Yield Debt and Emerging Market Debt US high yield debt is assumed to return 3.9% per annum over the next 10 years. Recent downward moves in high yield credit spreads have reduced them below historic average levels, low relative to an expected increase in default expectations in future years. As with investment grade corporate bonds, low return expectations for the underlying government bond component hold back our high yield debt return assumption over the next 10 years.
We assume that US dollar denominated emerging market debt will return 3.7% per annum over the next 10 years. As with US corporate bonds and high yield debt, the return assumption for emerging market debt is typically expressed as a ‘spread’ over US Treasury bonds. These spreads have moved directionally in line with high yield spreads over 2012, falling sharply across the year overall. As with other bond assets, low US government yields are a drag on return expectations for US dollar denominated emerging market debt.
Capital Market Assumptions 5
Equities
The earnings growth component of our equity return assumptions comprises both near term and longer term elements. While our Capital Market Assumptions process typically involves using consensus inputs, for some time we have believed that the consensus of analysts’ forecasts has been unrealistically optimistic regarding near term earnings growth prospects. Unlike analysts, against a backdrop of weak global growth we do not expect company profit margins to increase from their already elevated levels. For this reason, we have developed our own in-house corporate earnings paths which have led to lower growth assumptions than forecast by the consensus. For the major developed markets, we assume negative or barely positive real (after inflation) earnings growth over the 2012 – 2015 period. Not being influenced by short-term market sentiment, our near term earnings growth assumptions have been relatively stable overall during recent quarters, in contrast to consensus expectations which have varied far more.
In the long term, we assume that companies’ earnings growth is related to GDP growth. Crucially, as described in detail in the lead article to the 31 March 2012 Capital Market Assumptions, we do not assume a one-to-one relationship between a country’s growth rate and the long term earnings growth potential of companies listed on the stock market within that country. We do this because many companies are international in nature and derive earnings from regions outside of where they have
10yr Annualized Nominal Return Assumptions
USD GBP EUR CHF CAD JPY
US 7.7% 7.7% 7.3% 6.6% 7.3% 6.2%
UK 8.2% 8.3% 7.8% 7.2% 7.9% 6.8%
Europe ex UK 7.7% 7.7% 7.3% 6.6% 7.4% 6.3%
Switzerland 7.7% 7.7% 7.3% 6.6% 7.3% 6.2%
Canada 7.9% 8.0% 7.5% 6.9% 7.6% 6.5%
Japan 7.7% 7.7% 7.3% 6.7% 7.4% 6.3%
Emerging Markets 8.9% 9.0% 8.5% 7.9% 8.6% 7.5%
a stock market listing. An implication is that European company earnings have only about a 50% direct exposure to developments in the Eurozone and similarly, investors in non-European equity markets should not consider themselves insulated from events there either. It is also notable that emerging markets are an important driver of profits earned in the developed world.
UK equities have a noticeably higher return assumption than the other developed markets. The main reason for this is that this equity market is currently the ‘cheapest’ of the developed markets in valuation terms (see lead article to 31 December 2011 Capital Market Assumptions for further information on our approach to setting equity return assumptions). As at 31 December, UK equities were trading on a multiple of less than 12 times our 2013 earnings assumption. In contrast, US equities were valued at nearer 14 times our 2013 earnings assumption. Investors in UK equities are therefore paying less for expected future earnings, which raises the return assumption for the UK market relative to elsewhere.
Emerging market equities have a higher return assumption than the developed markets, reflecting the greater long term growth potential of this sector of the market. Of course, emerging market companies also depend on the growth of the developed world so this assumption is not decoupled from the developed world assumptions.
6 Aon Hewitt | Proprietary and Confidential
Private EquityWe assume that global private equity will return 9.9% per annum over the next 10 years in US dollar terms. The assumption represents a diversified private equity portfolio with allocations to leveraged buyouts (LBOs), venture capital, mezzanine and distressed investments. Return expectations for these different strategies depend on different market factors. For example, distressed investments are influenced by the outlook for high yield debt. Similarly, LBO returns are influenced by the outlook for equity markets as well as the cost of the debt used to finance these LBOs. The current low interest rate environment is therefore beneficial for LBO investors. Notwithstanding this, whereas in the past leverage has
been a big driver of private equity returns, particularly for LBOs, in future the ability of managers to add value through operational improvements will become more important.
On our analysis, the median private equity fund manager has historically performed in line with the median quoted equity manager, but high performing private equity managers have performed significantly better. Our assumption incorporates the level of manager skill (‘alpha’) associated with such a high performing manager. This contrasts with our other equity return assumptions where no manager alpha is assumed.
Real Estate
The US currently offers the highest real estate return assumption of all of the markets covered in our Capital Market Assumptions. Although capital values have recovered from their lows, this market continues to benefit from a healthy rental yield and a relatively robust outlook for rental growth.
This can be contrasted with the Canadian market where, although the rental outlook is reasonably positive, this market offers a lower rental yield as capital values did not fall to the same extent as the US. This results in a lower return assumption.
In Europe, the economic difficulties facing the region continue to put downward pressure on capital values. This raises rental yields, putting upward pressure on long term return prospects, although the structure of the European real estate market means that rental yields remain lower than available in other regions. In addition, unlike equity markets, which benefit from their international exposure, real estate is much more closely tied to the fortunes of the region in question. This means that that this region offers the weakest rental growth
10yr Annualized Nominal Return Assumptions
USD GBP EUR CHF CAD JPY
US 7.5% 7.5% 7.1% 6.4% 7.2% 6.1%
UK 7.3% 7.3% 6.9% 6.2% 7.0% 5.9%
Europe ex UK 6.6% 6.6% 6.2% 5.5% 6.2% 5.2%
Canada 6.7% 6.8% 6.3% 5.7% 6.4% 5.3%
outlook, which will act as a drag on future returns. Overall, although rising rental yields have led to the long term return prospects for Europe ex UK real estate rising relative to elsewhere, this region continues to offer the lowest return assumption of those covered in our Capital Market Assumptions.
Our assumptions here are in respect of a large fund which is capable of investing directly in real estate. The assumptions relate to the broad real estate market in each region rather than any particular market segment. Our analysis allows for the fact that real estate is an illiquid asset class and revaluations can be infrequent, leading to lags in valuations compared with trends in underlying market values. While our real estate assumptions do not include any allowance for active management alpha or active management fees, there is an allowance for the unavoidable costs associated with investing in a real estate portfolio. These include real estate management costs, trading costs and investment management expenses.
Capital Market Assumptions 7
Hedge FundsOur fund of hedge funds return assumption is 5.3% per annum in US dollar terms. We formulate this by combining the return assumptions for a number of representative hedge fund strategies. As with private equity, this assumption includes allowances for manager skill and related fees (including the extra layer of fees at the fund of funds level), but unlike private equity, this is for the average fund of funds in the hedge fund universe rather than for a high performing manager.
The individual hedge fund strategies we model as components of our fund of hedge funds’ assumption are equity long/short, equity market neutral, fixed income arbitrage, event driven, distressed debt, global macro and managed futures. Our modeling of these strategies includes an analysis of the underlying building blocks of these strategies. For example, we take into account the fact that equity long/short funds are sensitive to equity market movements. In practice the sensitivity of equity
long/short funds to equity markets can vary substantially by fund with some behaving almost like substitutes for long only equity managers, while others retain a much lower exposure. Our assumptions are based on our assessment of the average sensitivity across the entire universe of equity long/short managers.
Given the nature of the asset class, our hedge fund return assumptions are more stable than, for example, our US equity return assumption. Nonetheless, the strategies are impacted by changes to the other asset class assumptions. For example, most hedge funds are ‘cash+’ type investments to a greater or lesser extent. Therefore, the fact that the return that can be assumed for cash has fallen to very low levels has had a negative impact on hedge fund return assumptions. Similarly, a lower high yield debt return assumption has also had a corresponding impact on the return assumption for distressed debt focused strategies.
8 Aon Hewitt | Proprietary and Confidential
Volatility
Our volatility assumptions are forward looking (while also having regard to history) and the volatilities in the table above are representative for each asset class over the projection period. In practice, we have a more complex set of volatility assumptions with, for example, volatilities varying over time. For illiquid asset classes, such as real estate, de-smoothing techniques are employed. All volatilities shown above are in local currency terms. For emerging market equities, global private equity and global fund of hedge funds the local currency is taken to be USD.
As a result of continued global imbalances and uncertainty over the economic outlook, including inflation, we believe that volatility is likely to be at elevated levels relative to history. This is reflected in the assumptions above. While we assume that the volatility of ‘risky’ assets, such as equities, will be at historically high levels over the next few years, we also assume that it will decline over time.
15yr Inflation-Linked Government Bonds 9.0%
15yr Government Bonds 11.0%
10yr Investment Grade Corporate Bonds 9.0%
Real Estate 16.0%
US High Yield 14.0%
Emerging Market Debt (USD denominated) 12.0%
UK Equities 22.5%
US Equities 21.0%
Europe ex UK Equities 22.5%
Japan Equities 22.5%
Canada Equities 22.5%
Switzerland Equities 22.5%
Emerging Market Equities 31.5%
Global Private Equity 29.0%
Global Fund of Hedge Funds 8.0%
High assumed volatility is also consistent with implied volatilities priced into option contracts (a measure of the market’s expectations for volatility over the life of the option) which remain at elevated levels. Implied option volatilities can be influenced by many factors unrelated to volatility, for example the supply/demand dynamics of the option market. Nonetheless we believe that they do provide useful forward looking information which we take account of when setting our assumptions.
Please note that due to the level of yields and shape of the yield curve in Canada, Japan and Switzerland, lower volatility assumptions apply to bond investments in these markets.
Capital Market Assumptions 9
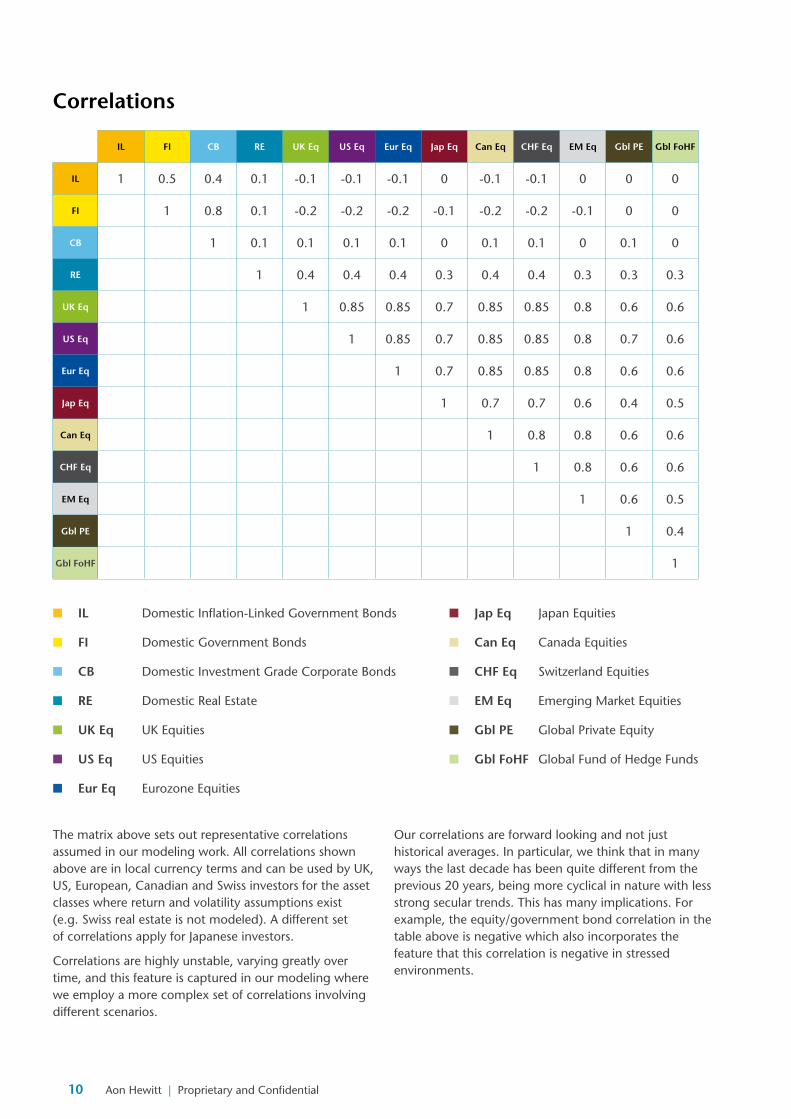
IL FI CB RE UK Eq US Eq Eur Eq Jap Eq Can Eq CHF Eq EM Eq Gbl PE Gbl FoHF
The matrix above sets out representative correlations assumed in our modeling work. All correlations shown above are in local currency terms and can be used by UK, US, European, Canadian and Swiss investors for the asset classes where return and volatility assumptions exist (e.g. Swiss real estate is not modeled). A different set of correlations apply for Japanese investors.
Correlations are highly unstable, varying greatly over time, and this feature is captured in our modeling where we employ a more complex set of correlations involving different scenarios.
n IL Domestic Inflation-Linked Government Bonds
n FI Domestic Government Bonds
n CB Domestic Investment Grade Corporate Bonds
n RE Domestic Real Estate
n UK Eq UK Equities
n US Eq US Equities
n Eur Eq Eurozone Equities
n Jap Eq Japan Equities
n Can Eq Canada Equities
n CHF Eq Switzerland Equities
n EM Eq Emerging Market Equities
n Gbl PE Global Private Equity
n Gbl FoHF Global Fund of Hedge Funds
Our correlations are forward looking and not just historical averages. In particular, we think that in many ways the last decade has been quite different from the previous 20 years, being more cyclical in nature with less strong secular trends. This has many implications. For example, the equity/government bond correlation in the table above is negative which also incorporates the feature that this correlation is negative in stressed environments.
10 Aon Hewitt | Proprietary and Confidential
Capital Market Assumptions Methodology
OverviewAon Hewitt’s Capital Market Assumptions are our asset class return, volatility and correlation assumptions. The return assumptions are ‘best estimates’ of annualized returns. By this we mean median annualized returns – that is, there is a 50/50 chance that actual returns will be above or below the assumptions. The assumptions are long term assumptions, based on a 10 year projection period and are updated on a quarterly basis.
Material UncertaintyGiven that the future is uncertain, there is material uncertainty in all aspects of the Capital Market Assumptions and the use of judgment is required at all stages in both their formulation and application.
Allowance For Active ManagementThe asset class assumptions are assumptions for market returns, that is we make no allowance for managers outperforming the market. The exceptions to this are the private equity and hedge fund assumptions where, due to the nature of the asset classes, manager performance needs to be incorporated in our Capital Market Assumptions. In the case of hedge funds we assume average manager performance and for private equity we assume a high performing manager.
InflationWhen formulating assumptions for inflation, we consider consensus forecasts as well as the inflation risk premium implied by market break-even inflation rates.
Government BondsThe government bond assumptions are for portfolios of bonds which are annually rebalanced (to maintain constant duration). This is formulated by stochastic modeling of future yield curves.
Inflation-Linked Government BondsWe follow a similar process to that for nominal government bonds, but with projected real (after inflation) yields. We incorporate our inflation profiles to construct nominal returns for inflation-linked government bonds.
Corporate BondsCorporate bonds are modeled in a similar manner to government bonds but with additional modeling of credit spreads and projected losses from defaults and downgrades.
Other Fixed IncomeEmerging market debt and high yield debt are modeled in a similar fashion to corporate bonds by considering expected returns after allowing for losses from defaults and downgrades.
EquitiesEquity return assumptions are built using a discounted cashflow analysis. Forecast real (after inflation) cashflows payable to investors are discounted and their aggregated value is equated to the current level of each equity market to give forecast real (after inflation) returns. These returns are then converted to nominal returns using our 10 year inflation assumptions.
Private EquityWe model a diversified private equity portfolio with allocations to leveraged buyouts, venture capital, and mezzanine and distressed investments. Return assumptions are formulated for each strategy based on an analysis of the exposure of each strategy to various market factors with associated risk premia.
Real EstateReal estate returns are constructed using a discounted cashflow analysis similar to that used for equities, but allowing for the specific features of these investments such as rental growth.
Hedge FundsWe construct assumptions for a range of hedge fund strategies (e.g. equity long/short, equity market neutral, fixed income arbitrage, event driven, distressed debt, global macro, managed futures) based on an analysis of the underlying building blocks of these strategies.
We use these individual strategies to formulate a fund of hedge funds’ assumption which is quoted in the Capital Market Assumptions.
Currency MovementsAssumptions regarding currency movements are related to inflation differentials.
VolatilityAssumed volatilities are formulated with reference to implied volatilities priced into option contracts of various terms, historical volatility levels and expected volatility trends in future.
CorrelationsOur correlation assumptions are forward looking and result from in-house research which looks at historical correlations over different time periods and during differing economic/investment conditions, including periods of market stress. Correlations are highly unstable, varying greatly over time. This feature is captured in our modeling.
Capital Market Assumptions 11
SB37
47
About Aon Hewitt
Aon Hewitt is the global leader in human resource consulting and outsourcing solutions. The company partners with organizations to solve their most complex benefits, talent and related financial challenges, and improve business performance. Aon Hewitt designs, implements, communicates and administers a wide range of human capital, retirement, investment management, health care, compensation and talent management strategies. With more than 29,000 professionals in 90 countries, Aon Hewitt makes the world a better place to work for clients and their employees.
For more information on Aon Hewitt, please visit www.aonhewitt.com.
Disclaimer
This document has been produced by the Global Investment Consulting of Aon plc. Nothing in this document should be treated as an authoritative statement of the law on any particular aspect or in any specific case. It should not be taken as financial advice and action should not be taken as a result of this document alone. Consultants will be pleased to answer questions on its contents but cannot give individual financial advice. Individuals are recommended to seek independent financial advice in respect of their own personal circumstances.
Aon plc
Registered No: 07876075
Registered Office: 8 Devonshire Square, London EC2M 4PL, United Kingdom