91
2016 Capital Markets Day 1

2016
Capital Markets Day
1

BENCHMARK CAPITAL MARKETS DAY 2016
2
13.00 – 13.05
13.05 – 13.20
13.20 – 13.35
13.35 – 14.10
14.30 – 15.30
15.30 – 16.15
16.15 – 16.25
Introduction and Welcome (Alex Hambro)
Panel 1: The Macro Environment
Panel 2: The Aquaculture Business
Panel 3: Benchmark’s Technology Centre – Part 1
Break
Panel 3: Benchmark’s Technology Centre – Part 2
Panel 4: Financial Model and Capital Structure
Panel 5: The Way Forward
Networking

PANEL 1
The macro environment
Roland Bonney, Chief Operating Officer
3

of our planet is covered by land
4
is occupied by agriculture
From this
Fisheries & aquaculture are the only industries that can
utilise the remaining
of our food is produced from this small section of the
earth’s surface
98%
Source: Rabobank
12%71%29%
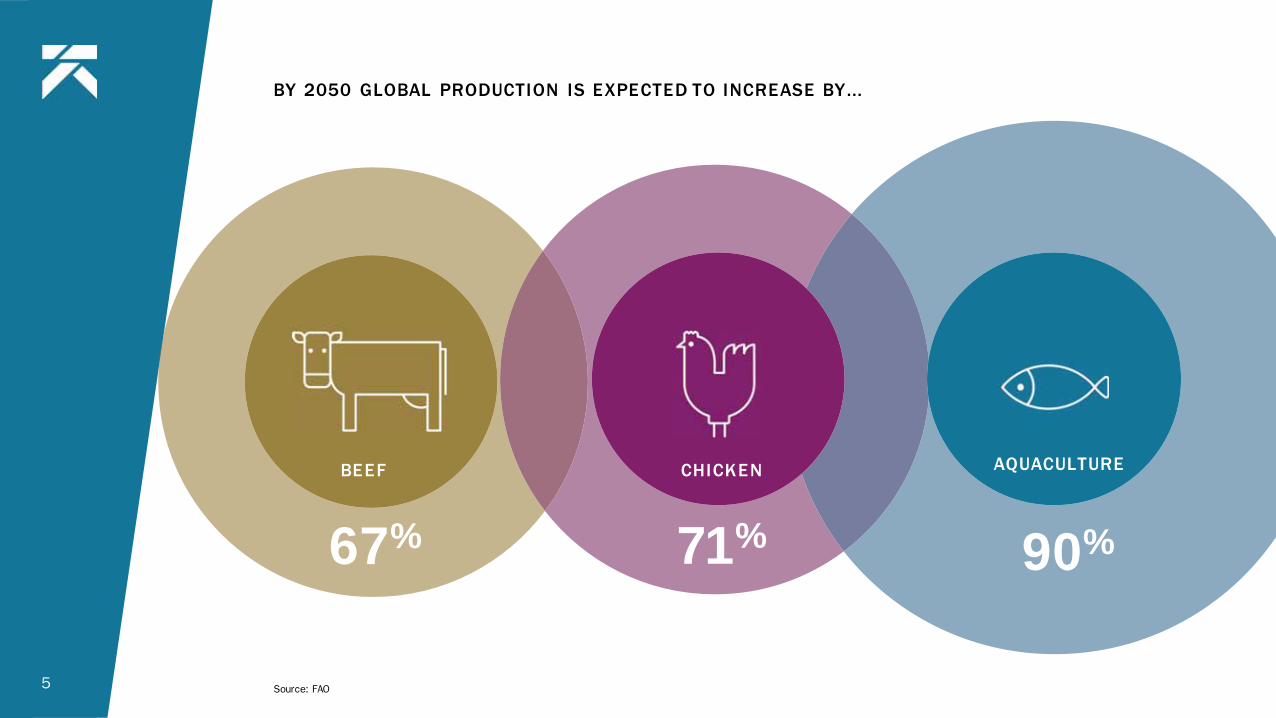
BY 2050 GLOBAL PRODUCTION IS EXPECTED TO INCREASE BY...
5
67% 71%
CHICKEN
90%
AQUACULTUREBEEF
Source: FAO

6
JACQUES COUSTEAU, OCEANOGRAPHER
"We must plant the sea and herd its animals using the sea as farmers instead of hunters. That is what civilization is all about — farming replacing hunting.”
Source: Historical data 1950-2010: FAO 2014. “FishStatJ.” Rome: FAO. Projections 2011-20150: Calculated at WRI, assumes 10 per cent reduction in wild fish catch between 2010 and 2050, and linear growth of aquaculture production at an additional 2 million tons per year between 2010 and 2050
Farmed fish production has exceeded beef production
Seafood supply — all growth will come from aquaculture
Source: EPI based on FAO, USDA: Earth Policy Institute

AQUACULTURE SECTOR IS THE MOST EFFICIENT CONVERTER OF COMMODITY RAW MATERIALS
7
Processing low value
raw material
High quality, highly desirable protein
Source: Rabobank

DISEASE CONSTRAINS SUPPLY
YOY change in global farmed Atlantic Salmon supply and forecast (%)
Rabobank, Kontali, Subsecretaría de Pesca 20168

ANIMAL HEALTH AND HUMAN HEALTH ARE INTRINSICALLY LINKED
There are 15 WHO critically or medically important antibiotics, a number of which are still routinely used in agriculture and aquaculture
One Health
c.60% of all human diseases and 75% of all emerging infectious diseases are zoonotic (passed between humans and animals)
13 deadliest of these diseases kill 2.2 million people a year
Benchmark’s genetics, vaccines and probiotics provide a solution to the problem of antibiotic use in animal production
9 Source: Grace, D. et al (2012) Mapping of poverty and likely zoonoses hotspots.

MEDICALISATION OPPORTUNITY
Annual Consumption (Million Metric Tons)
10 Source: Zoetis reports 2016, UN FAO, USDA 1- Defined as estimated production animal population receiving medicines and vaccines

TECHNOLOGICAL OPPORTUNITY
Source: USDA, FAOSTAT
% production modernised by sector
11

OUR OPERATIONS
‘Hands in the water’ —global presence, local reach
R&D facilities and farms
Diagnostic laboratories
Commercial services
Manufacturing/production
12

Aquaculture is the new agriculture
The blue revolution is a technological revolution requiring:
Informed management
Robust genetics
Advanced early stage nutrition
Health products
Benchmark is at the forefront of the
blue revolution
HEALTHY FISH, HEALTHY PEOPLE,
HEALTHY PLANET
13

PANEL 2
Aquaculture businessThe new agri business
Malcolm Pye, Chief Executive Officer
14 Image: Benchmark’s Tilapia Hatchery, Miami
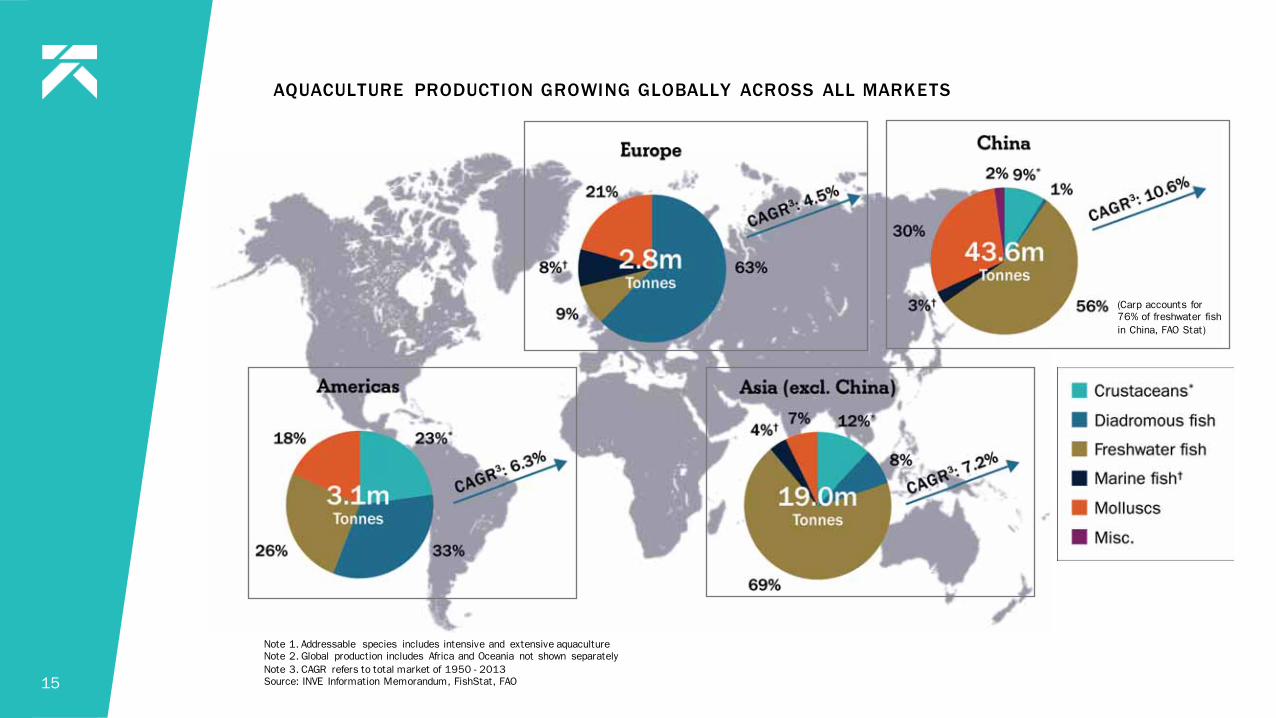
AQUACULTURE PRODUCTION GROWING GLOBALLY ACROSS ALL MARKETS
15
Note 1. Addressable species includes intensive and extensive aquacultureNote 2. Global production includes Africa and Oceania not shown separately
Note 3. CAGR refers to total market of 1950 - 2013Source: INVE Information Memorandum, FishStat, FAO
(Carp accounts for 76% of freshwater fish
in China, FAO Stat)

THE KEY MARKETS: SALMON
70% of world’s salmon production
is farmed
10.7 bn USD global market
The market for Atlantic salmon has,
on average, increased by:
6.2% in all markets the last 10
years
8.6% in the last 20 years
Largest producing countries —
Norway, Chile, Scotland, Canada
Higher growth requires progress
in:
technology
improved industry regulations
intercompany cooperationSource: (MH,2016)
Major Salmon Producers
Marine Harvest
Salmar
Lerøy
Mitsubishi
Cooke Aquaculture
Empresas Aquachile
Salmones Multiexport
Pesquara Los Fiordos
The Scottish Salmon Co
Bakkafrost
Grieg Seafood
Cermaq
16

THE KEY MARKETS: TILAPIA
Global tilapia production has
increased by 11 per cent annually over
the past decade
Industry has an estimated value of
6.7bn USD*
Very extensive and fragmented
industry
China accounts for a third of
all production, Latin America also
seeing growth
Road to maturity will be long,
technological improvements will help as well as more intensive professional
and consolidating management
High need for good seedSource: Food and Agriculture Organization of the United Nations, Rabobank, 2014
Major Tilapia Producers
JAPFA
Golden Springs
CP
Lake Harvest
ACI group
Copacol
Netuno
Copisces
Geneseas
INDPESCA
West Coast Waterbase
AQUAFARM
Grobest / Nakhonpanom
Kornkiart /Kampeangpetch
TRAPIA
17

THE KEY MARKETS: SHRIMP
World shrimp market: 15 Bn USD
Expected to grow 5 - 10 fold by 2050
Slow recovery from EMS
Financially weak producers after many
EMS years, high need for investors
Industrialisation and investments for
better husbandry and daily management,
as well as in advanced technologies and
stronger genetics, will help growth
Main recovery expected from Asian countries (China, Thailand, Vietnam,
Indonesia, India)Sources: FAO (2016) for 1995-2011; FAO (2016) and GOAL (2014) for 2012-2014; GOAL (2016) for 2014-2018
Shrimp aquaculture production by world region: 1995-2018
18
Major Shrimp Producers
BIM
DAC LOC
THONG THUAN
SEAFARMS Group
Agrobest
Blue Archipelago
Aquacards
CP Farms
Nukul Farm
BMR Group
Vaisakhi Group
CPP Lampung
Pesquera Santa Priscila
Omarsa
Expalsa
Granjas Marinas
Deli
CAMANICA
CAMACO

WHAT TECHNOLOGY IS NEEDED SUCCEED
19
Innovation across the entire value chain
Solutions that the end customer will support
Building long-term value
TechnologiesBMK
Competitors
1 2 3 4 5
Veterinary services
Diagnostic laboratories
Pharmaceuticals, vaccines & biocides
Genetic programmes & breeding stock
Specialist, advanced nutrition
Species
Salmon
Tilapia/Catfish
Sea Bass/Sea Bream
Shrimp
Emerging species e.g. grouper
Animal Health* $400m
Breeding & Genetics*
Shrimp: $500mSalmon: $110mTilapia: $316m1
Early Stage Nutrition*
$250m
* Management estimates1 Source: Inocap

BENCHMARK: WORLD-LEADING INTEGRATED AQUACULTURE TECHNOLOGY PROVIDER
Biological control is the key driver for financial performance for farmers
Harnessing best expertise
Deploying cutting edge technologies
Embedded alongside our customers
20

PANEL 3
Benchmark Technology Centre
21
Image: Benchmark’s Vaccine Manufacturing Facility, Braintree UK

Knowledge services — for informed management
Hamish Rodger, FVG Global Managing Director
22

Understanding the threats and determining livestock performance (health, genetics and nutrition) to best interpret and apply management practices
Fish Vet Group (FVG) — clinical & diagnostic services
FAI — aquaculture R&D facilities
Technical Publishing — industry training and best practice techniques
WHAT DO WE MEAN BY KNOWLEDGE SERVICES
23
Knowledge Services

Harnessing best expertiseCreating the best insight through globally
recognised specialists
STRATEGY
24
Knowledge Services
Deploying cutting edge technologiesTaking aquaculture diagnostics into the
digital age
Developing software platforms for tracking,
clinical management and analysis
Embedded alongside our customersIntegrated health management — involved
in decision making with companies
At coalface of aquaculture industry

COMPETENCIES REQUIRED TO DELIVER OUR STRATEGY
Fish Vet Group
>75 veterinarians and fish health professionals
Leading expertise in
diagnostic histopathology
Many global specialists
Unique ability to identify and consult on
aquaculture disease e.g.
shrimp in South East Asia
25
Knowledge Services

FVG Norge
Oslo, Norway
FVG Asia
Bangkok, Thailand
FVG Brazil
Natal, Brazil
LOCATION & FACILITIES— FISH VET GROUP
26
Knowledge Services
FVG Ltd.
Inverness, Scotland
FVG Ireland
Galway, Ireland
FVG Inc.
Portland, USA
FVG Chile
Puerto Montt, Chile

At the front line
Prescribing veterinary surgeons in key markets
Involvement across supply chain
(farming, feed, pharma, processors)
First responder with diagnostics
First mover advantage in identification of new disease
challenges
CAPACITIES CLINICAL & DIAGNOSTICS
27
Knowledge Services
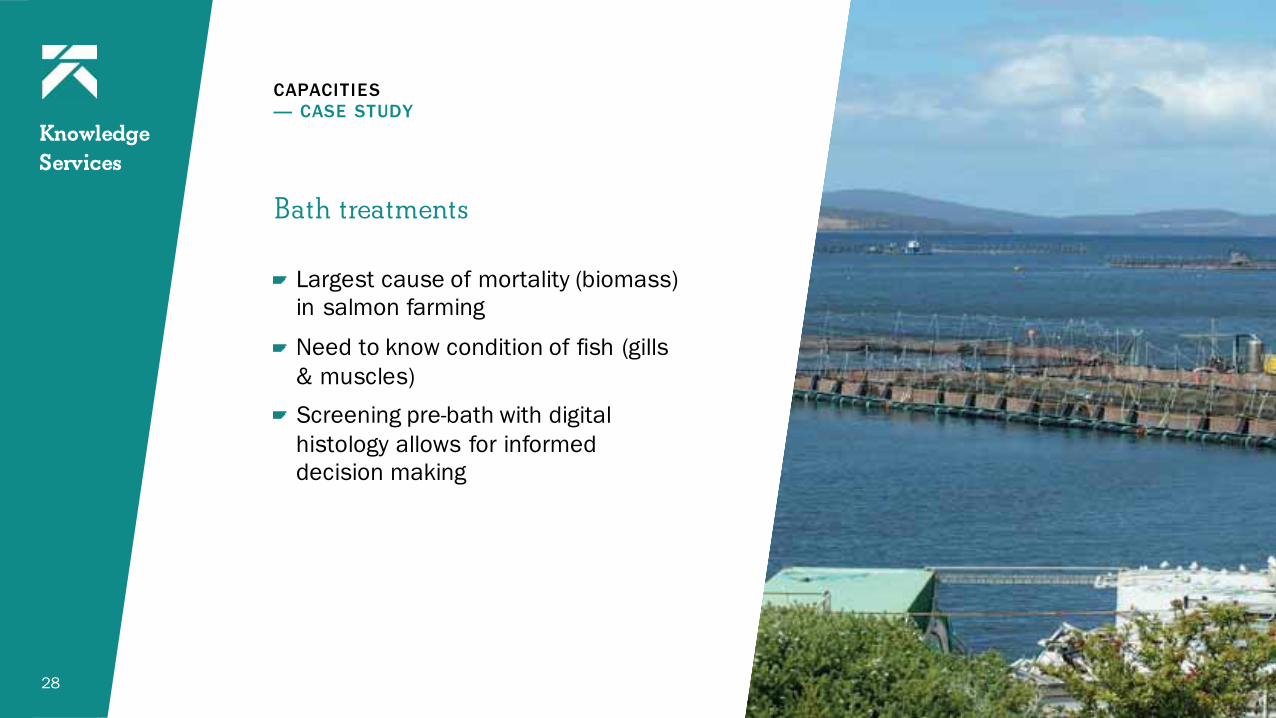
Bath treatments
Largest cause of mortality (biomass) in salmon farming
Need to know condition of fish (gills
& muscles)
Screening pre-bath with digital
histology allows for informed decision making
CAPACITIES— CASE STUDY
28
Knowledge Services

CAPABILITIES— AQUACULTURE R&D FARMS
40% of Benchmark’s animal health pipeline is currently exclusively being developed at our in-house facilities
Ardtoe, Scotland
Aquaculture trials
unit and cold water
challenge unit
29
Knowledge Services
eloped ies
Chonburi, Thailand (x2)
Shrimp and tilapia
nutritional trials unit
Warm water challenge
trial unit
Jaboticabal, Brasil
Tilapia trials unit
Pisa, Italy
Warm water
nutritional trials
Miami, US
Tilapia trials unit

Knowledge services is driving our pipeline
First mover advantage in disease
identification
Consolidating relationships with our
clients
Provides scientific advice and
technical support to our customers
BENEFITS TO OUR CUSTOMERS/MARKETS
30
Knowledge Services
All farming starts with a choice of genetics
Jan-Emil Johannessen, Managing Director,
SalmoBreed
31
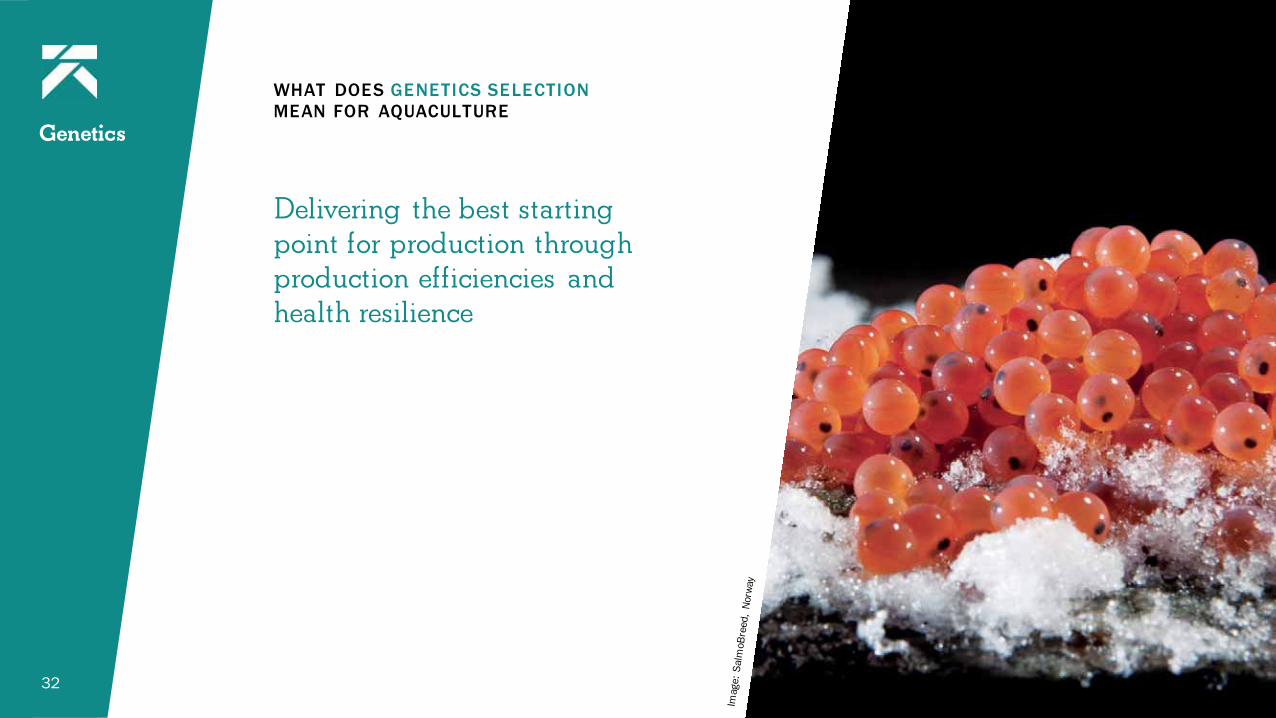
Delivering the best starting point for production through production efficiencies and health resilience
WHAT DOES GENETICS SELECTION MEAN FOR AQUACULTURE
32
Genetics

WHAT DOES GENETIC SELECTION MEAN FOR AQUACULTURE— EXAMPLE TRAIT SELECTION FOR ATLANTIC SALMON
Disease resistance is now in addition key criteria for trait selection, together with production efficiency and flesh quality
33
Genetics

Harnessing best expertiseBest qualified aquaculture genetics team in the world
World’s largest genetics company on selective breeding
programs for all aquaculture species
STRATEGY
34
Deploying cutting edge technologiesUtilising modern genetic tools e.g. genomic
selection for within family breeding
Utilising existing technologies and developing new
solutions to transfer into new species
Land based biosecure production — all year round delivery and back up facilities
Embedded alongside our customersCustomer led approach to delivery of all products
and services
Forming strategic partnerships with leading
companies on their breeding facilities and genetics
Genetics

COMPETENCIES REQUIRED TO DELIVER OUR STRATEGY — R&D PROGRAMMES
Genetics
35
Atlantic salmon
Nile tilapia
Red tilapia
Nile, red & blue tilapia
Nile & red tilapia
P. vannamei
Turbot
Atlantic salmon, cohosalmon and rainbow trout
Atlantic salmon & rainbow trout
Atlantic cod
Sea bass & sea bream
Rohu carp
P. monodon
P. chinensis
Pangasius
25 applied programs for 15 species in 15 countries
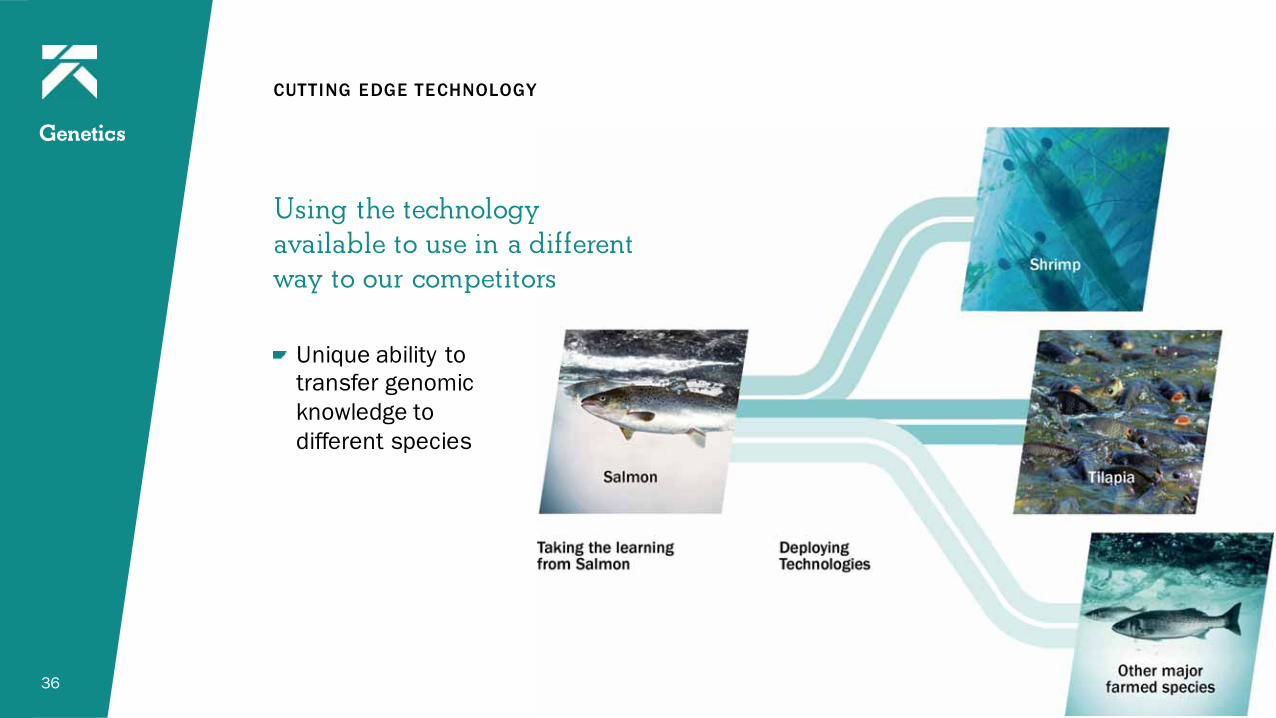
CUTTING EDGE TECHNOLOGY
Using the technology available to use in a different way to our competitors
Unique ability to transfer genomic
knowledge to
different species
36
y different rs
Genetics

CAPACITIES — LOCATION & FACILITIES— SALMON, ICELAND
Highly biosecure land based production
Utilising Iceland’s unique geology and geothermic freshwater/seawater sources
Total capacity: 200 M ova
OIE Compartment approval – currently the only
company in the world authorised to exportAtlantic Salmon ova to Chile
Sales to Norway, Scotland, Faroe Islands, Chile and other markets with year-round delivery
37
Genetics

CAPACITIES — LOCATION & FACILITIES— SALMON, SALTEN NORWAY
Land based salmon egg production facility
Year round biosecure production
Production capacity 150m eggs per year (37.5% uplift on current) and replace contract production
Structured as a JV with Salten Stamfisk(established salmon producer)
JV formed and construction has commenced in Autumn 2016
38
Genetics

CAPACITIES — LOCATION & FACILITIES— SHRIMP, COLUMBIA
Specific pathogen resistant (SPR) shrimp breeding programme
P.vannemei shrimp has taken over as (by far) largest commercial species world wide
Established genetics programme and
broodstock
Strong synergy with INVE – routes to market already in place
Supplying a resilient, commercially viable strain of shrimp to the global market for the
first time
39
Genetics

CAPACITIES — LOCATION & FACILITIES— TILAPIA, NORTH AMERICA
Family breeding programme
Spring Tilapia brand
Nucleus in Florida/US
Multipliers in Mexico, Brazil and El-Salvador
Distributing world-leading tilapia strain to Asia
for the first time
40
Genetics

Biological control for sealice
Indicative of Benchmark’s commitment to environmentally sustainable treatment options
Over 2m lumpfish
CAPACITIES — LOCATION & FACILITIES— LUMPSUCKERS, SCOTLAND & ICELAND
41
Genetics

COMPETENCIES REQUIRED TO DELIVER OUR STRATEGY— COMMERCIAL PARTNERSHIPS, PRODUCTS & ROUTES TO MARKET
Genetics
42

BENEFITS TO CUSTOMERS/MARKETS— EXAMPLE QTL IPN
43Source: Veterinary Institute NorwayFigures for non-notifiable diseases are based on data
samples tested by the Norwegian Veterinary Institute
Incidence of IPN in farmed salmonids 2009–2011 (Veterinary Institute Norway)
IPN was reduced 85% when QTL IPN ova was introduced
Genetics

BENEFITS TO CUSTOMERS/MARKETS — EXAMPLE SLAUGHTER WEIGHT
Slaughter weight increase over 2kg in only 4 generations for SalmoBreed
44
Genetics

BENEFITS TO CUSTOMERS/MARKETS
Turning more production into high value product
— excellent cost benefit ratio
Ability to create bespoke solutions for clients
45
Genetics

Healthy growth drives efficiency
John Marshall, Technical Director Animal Health
46

WHAT DOES HEALTH MEAN FOR AQUACULTURE
A healthy animal delivers healthy growth
Disease and parasites are the largest restriction on the growth of Aquaculture.
Only limited progress has been made using conventional technologies
Benchmark has invested in new healthcare technologies to solve the major disease problems, allowing growth of established and emerging Aquaculture production species
Health
47
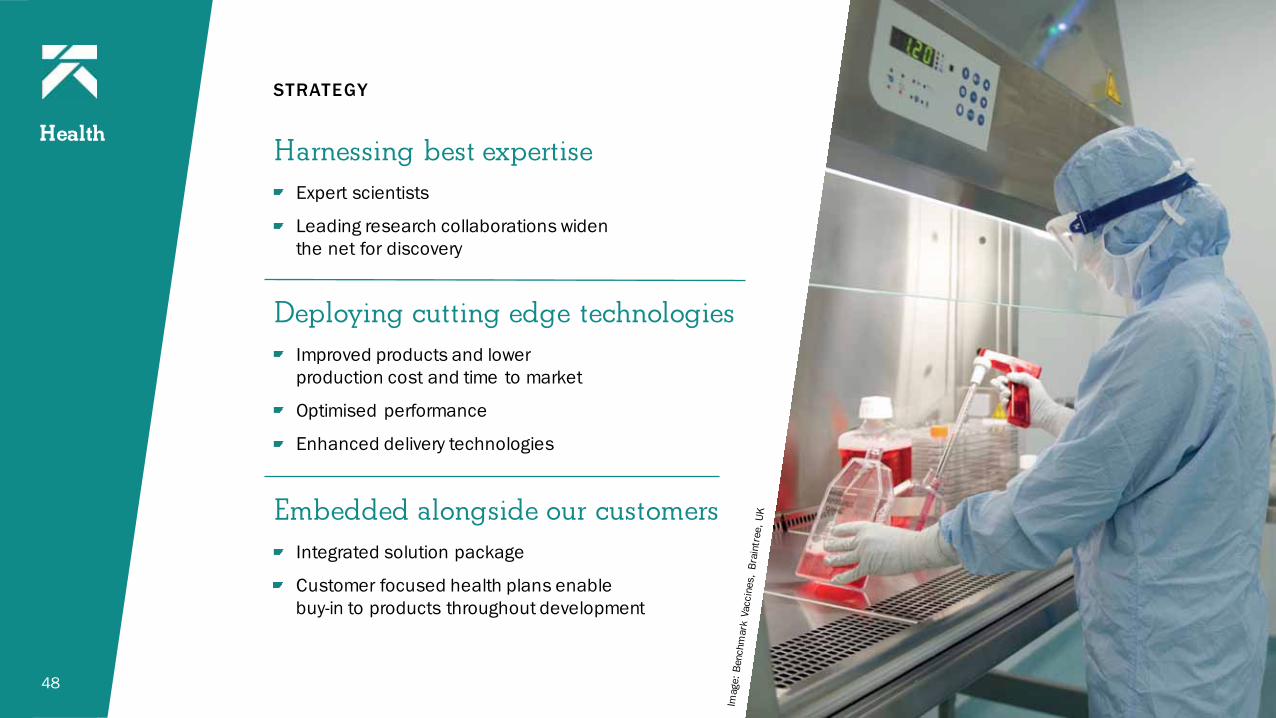
Harnessing best expertiseExpert scientists
Leading research collaborations widen
the net for discovery
STRATEGY
48
Deploying cutting edge technologiesImproved products and lower
production cost and time to market
Optimised performance
Enhanced delivery technologies
Embedded alongside our customersIntegrated solution package
Customer focused health plans enable
buy-in to products throughout development
Health

Health
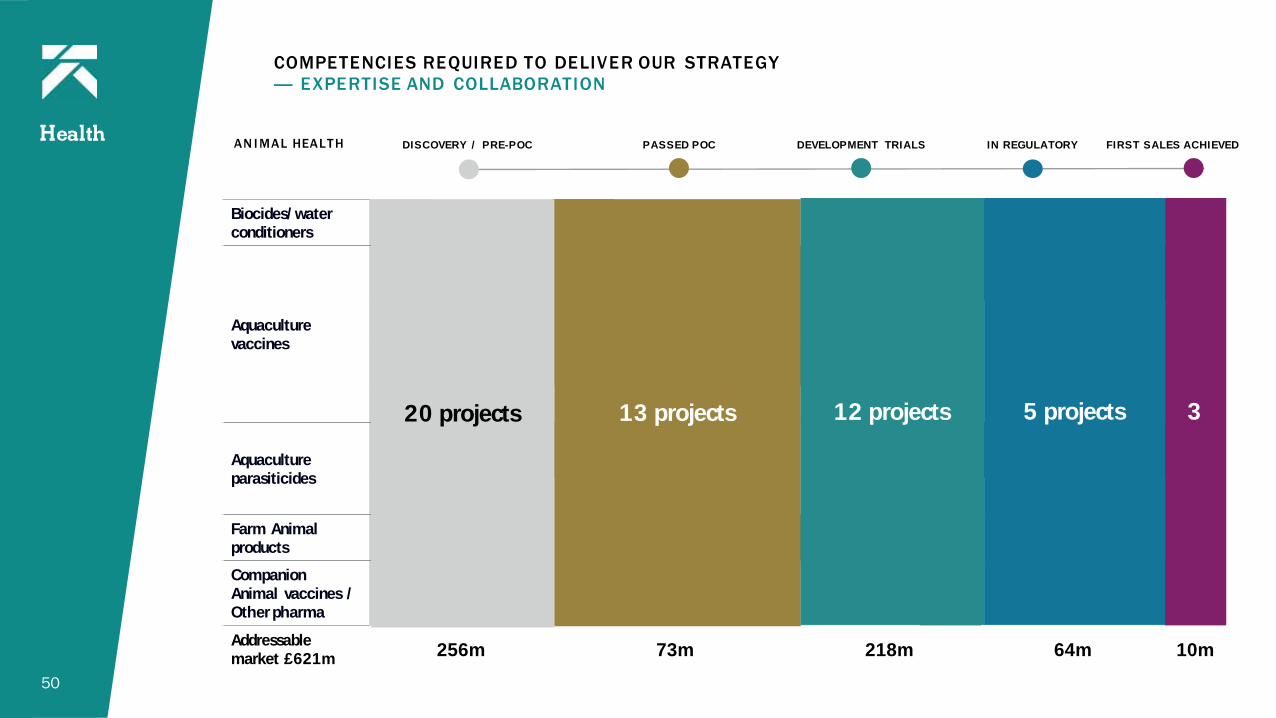
COMPETENCIES REQUIRED TO DELIVER OUR STRATEGY— EXPERTISE AND COLLABORATION
49
AN IMAL HEALTH DIS C OVERY / P RE- P OC P A S S ED P OC DEVEL OP MENT T RIA L S IN REGU L A T ORY FIRS T S A L ES A C HIEVED
Biocides/water conditioners
PAQ0045m
EAQ0042m
EAQ002Pre-Stock
Rapid25m
Aquaculture vaccines
VAQ00615m
VAQ01725m
VAQ0248m
VAQ0026m
VAQ0052m
VAQ0073m
VAQ0048m
VAQ019Advantign
BC 1m
VAQ0202m
VAQ012FryShield IPN
8m
VAQ016MariMark N
6m
VAQ0258m
VAQ0318m
VAQ03210m
VAQ0101m
VAQ0113m
VAQ01510m
VAQ02925m
VAQ0213m
VAQ0228m
VAQ028Marime Flip
3m
VAQ0334m
VAQ03410m
VAQ0356m
VAQ0035m
VAQ0092m
VAQ0083m
VAQ0365m
Aquaculture parasiticides
PAQ01610m
PAQ02110m
PAQ02211m
PAQ0079m
PAQ0175m
PAQ00910m
PAQ01810m
PAQ010KleenKoi
5m
PAQ008Ectosan25m
PAQ014Salmosan
USA1m
PAQ006Salmosan
Bass/Bream1m
PAQ0151m
PAQ0248m
Farm Animal products
VTS0066m
VTS0031m
VTS0072m
PAQ0233m
CompanionAnimal vaccines / Other pharma
VCO002CAD55m
VTS009Sweet Itch
50m
VCO001Hypocat165m
NAQ001Phylavive
3m
Addressable market £621m 256m 73m 218m 64m 10m
Health
COMPETENCIES REQUIRED TO DELIVER OUR STRATEGY— EXPERTISE AND COLLABORATION
50
AN IMAL HEALTH DIS C OVERY / P RE- P OC P A S S ED P OC DEVEL OP MENT T RIA L S IN REGU L A T ORY FIRS T S A L ES A C HIEVED
Biocides/water conditioners
PAQ0045m
EAQ0042m
EAQ002Pre-Stock
Rapid25m
Aquaculture vaccines
VAQ00615m
VAQ01725m
VAQ0248m
VAQ0026m
VAQ0052m
VAQ0073m
VAQ0048m
VAQ019Advantign
BC 1m
VAQ0202m
VAQ012FryShield IPN
8m
VAQ016MariMark N
6m
VAQ0258m
VAQ0318m
VAQ03210m
VAQ0101m
VAQ0113m
VAQ01510m
VAQ02925m
VAQ0213m
VAQ0228m
VAQ028Marime Flip
3m
VAQ0334m
VAQ03410m
VAQ0356m
VAQ0035m
VAQ0092m
VAQ0083m
VAQ0365m
Aquaculture parasiticides
PAQ01610m
PAQ02110m
PAQ02211m
PAQ0079m
PAQ0175m
PAQ00910m
PAQ01810m
PAQ010KleenKoi
5m
PAQ008Ectosan25m
PAQ014Salmosan
USA1m
PAQ006Salmosan
Bass/Bream1m
PAQ0151m
PAQ0248m
Farm Animal products
VTS0066m
VTS0031m
VTS0072m
PAQ0233m
CompanionAnimal vaccines / Other pharma
VCO002CAD55m
VTS009Sweet Itch
50m
VCO001Hypocat165m
NAQ001Phylavive
3m
Addressable market £621m 256m 73m 218m 64m 10m
20 projects 13 projects 12 projects 5 projects 3

’First Sea Bass Noda virus vaccine’
Top disease affecting seabass production
Produced with new BMK cell line
Scope to extend this technology to other species
Currently in commercial field trials, positive results
MA
“There are more Sea Bass in
Europe and Turkey than Salmon in
Norway.”
COMPETENCIES REQUIRED TO DELIVER OUR STRATEGY
51
HealthEXAMPLE: MARIMARK N

COMPETENCIES REQUIRED TO DELIVER OUR STRATEGY— CUTTING EDGE TECHNOLOGIES CHANGE THE OPPORTUNITY
An example of what options the BMK healthcare technologies enables e.g. Sea Bass market
52
Health
Disease Stage of production affected Development Vaccine Medicine
Noda Virus Nursery, transfer, grow out MariMark N (injection) Salmosan Vet (bath)
Vibriosis Nursery, transfer, grow out MariMark NV (injection/immersion)
PAQ009 (oral)
Pasturellosis Nursery, transfer, grow out MariMark NVP (injection/immersion/oral)

‘The new Sea lice treatment ‘Class’ with no environmental impact
Effective against ALL resistant sealice
Fully contained treatment
No environmental ‘risk’
API and final product manufacture secured
COMPETENCIES REQUIRED TO DELIVER OUR STRATEGY
53
HealthPPRODUCT PIPELINE: ECTOSAN

‘Most advanced pond preparation biocide’
More efficacious than current treatments (predatory species and disease hosts)
Faster action & reduced persistence increases production
First targets Thailand, Vietnam, Ecuador
Providing a pro-active solution to a more responsible industry
COMPETENCIES REQUIRED TO DELIVER OUR STRATEGY
54
Health
PPRODUCT PIPELINE: PRESTOCK RAPID / SANOCARE PREP

Leading Streptococcus vaccine
Streptococcus accounts for more fish deaths than any other disease
Flexible product with both S. agalactiae &
S. iniae serotypes covered
Flexible offer by region
KA approach with INVE key to rapid market penetration
COMPETENCIES REQUIRED TO DELIVER OUR STRATEGY
55
Health
— Regional prevalence
PPRODUCT PIPELINE: MARIMARK STREP

COMPETENCIES REQUIRED TO DELIVER OUR STRATEGY— LEVERAGING THE TECHNOLOGIES
56
Health
Technologies are transferable between species
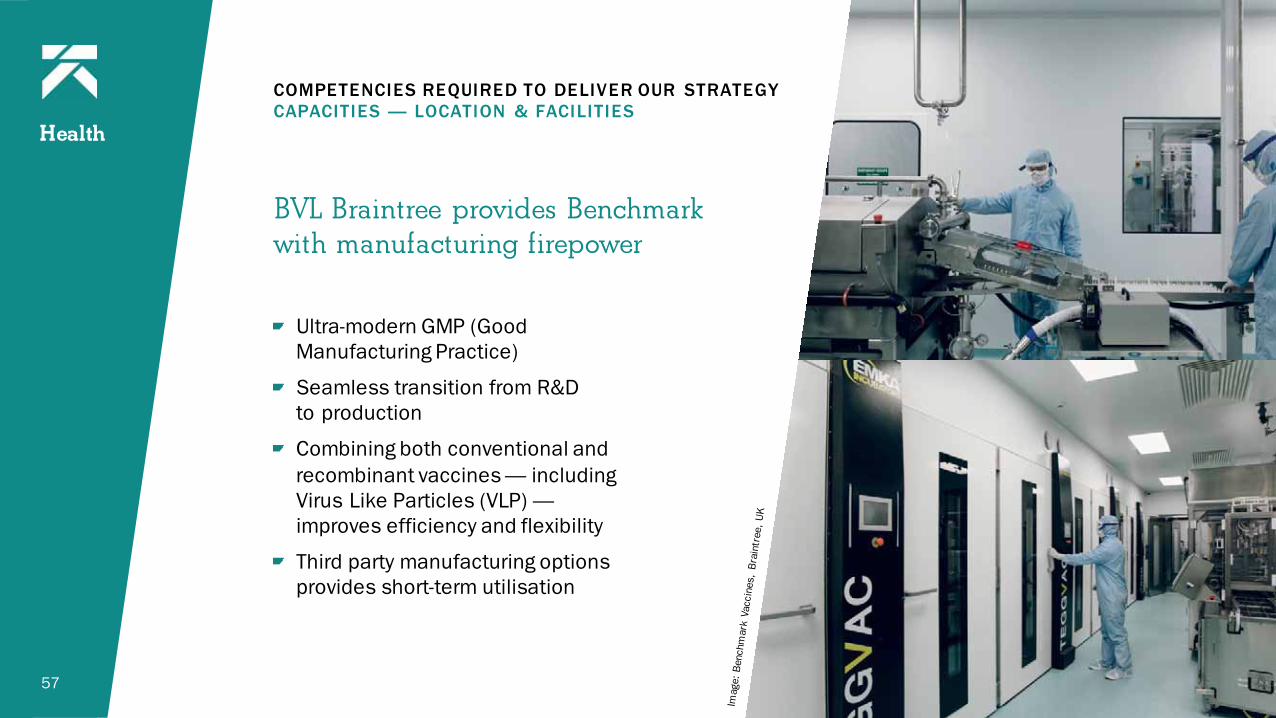
BVL Braintree provides Benchmark with manufacturing firepower
Ultra-modern GMP (Good Manufacturing Practice)
Seamless transition from R&D to production
Combining both conventional and
recombinant vaccines — including Virus Like Particles (VLP) —improves efficiency and flexibility
Third party manufacturing options provides short-term utilisation
COMPETENCIES REQUIRED TO DELIVER OUR STRATEGYCAPACITIES — LOCATION & FACILITIES
57
Health

Caring for growth requires optimal nutrition
Philippe Legér, CEO INVE Aquaculture
58

Drives performance and consistency of successful aquaculture production
By knowing, understanding, and inducing key biological processes that unlock the innate potential of survivability, development and growth.
Our innovations have resulted in breakthroughs and continued improvements in performance in ever more challenging conditions
Nutrition and Health — Advanced Nutrition — go hand in hand in achieving this … along with Genetics we will leap forward the advancements.
WHAT DOES ADVANCED NUTRITION MEAN FOR AQUACULTURE
59
Advanced Nutrition

Harnessing best expertiseFor creating and providing hi-tech, performing and cost
effective nutritional and health solutions and become our
customer’s preferred partner
STRATEGY
60
Deploying cutting edge technologiesINVE employs a mmultidisciplinary approach
Embedded alongside our customersINVE ppioneered early life stage nutrition and innovated
hatchery nutrition hand-in-hand with forerunners of
marine fish and shrimp farming
Customer partnership along with the best expertise
resulted in customer loyalty and market leadership
Advanced Nutrition

Distinctive competence:
---market driven, science based
Market intel from the front line reveals actual needs
33 yrs of in-house expertise & collaborationswith 25 centers of excellence
Scientific expertise & ’hands in the water’
approach delivers bespoke solutions
Product Life Cycle Management program encourages collaboration from ideation to product delivery
COMPETENCIES REQUIRED TO DELIVER OUR
STRATEGY — INNOVATIVE LEADERSHIP
61
Advanced Nutrition

Distinctive competence
— first line presence
Local support and expert advice in all key markets
Offering full & balanced product portfolio
Service level agreements
Key Account management
Tools for CRM, market intel, marketing,
knowledge-sharing platform
Resulting in long-term partnerships
COMPETENCIES REQUIRED TO DELIVER OUR
STRATEGY — CUSTOMER PARTNERSHIP
62
Advanced Nutrition

Distinctive competence
— Consistent quality and efficiency
High-end products through state-of-the-art manufacturing equipment
Certified manufacturing standards: GMP, HACCP, Global GAP
Total quality management leading to
consistent high quality manufacturing
Manufacturing Efficiency resulting in hi-throughput, lower cost and shorter lead times
Efficient supply chain resulting in reliable supply, lower inventories
COMPETENCIES REQUIRED TO DELIVER OUR
STRATEGY — OPERATIONAL EXCELLENCE
63
Advanced Nutrition

Distinctive competence
-- Strong team, strong culture
Driven by longstanding and lived core values of believing, enthusiasm, pragmatism and having fun
Bringing together culturally diverse teams seamlessly
Attracting and retaining good people in a learning organization
COMPETENCIES REQUIRED TO DELIVER OUR
STRATEGY — PEOPLE EXCELLENCE
64
Advanced Nutrition

INVE Technologies, Belgium
R&D HQ for AAN Division
Central product development
Management of collaborative R&D programs
IPR office
CAPACITIES — LOCATIONS AND FACILITIES
INNOVATION
65
Advanced Nutrition

IARC, marine fish testing center, Italy
Real-scale testing center for marine fish hatchery feeds & health products
Developing instructions for use
Developing feeding protocols
Training center for staff and customers
CAPACITIES — LOCATIONS AND FACILITIES
INNOVATION
66
Advanced Nutrition

ITARC, shrimp testing center, Thailand
Real-scale testing center for shrimp hatchery feeds & health products
Developing instructions for use
Developing feeding protocols
Training center for staff and customers
CAPACITIES — LOCATIONS AND FACILITIES
INNOVATION
67
Advanced Nutrition

CAPACITIES – LOCATIONS AND FACILITIES
OPERATIONS AND SUPPLY CHAIN
68
INVE Thailand, Pichit, Thailand
Main production center
State-of-art facilities 2000
Produces all INVE products
INVE Aquaculture Inc., SLC, UT, U.S.A.
Artemia harvesting & processing COOP SLB
Feeds & Health
products final
processing for
LATAM markets
Production facilities
Inventories
TIAC, Tianjin, China
Probiotics formulating & mixing
Artemia processing
Advanced Nutrition

69
Fernando Marino Pinzón MirandaOwner FITMAR, Mexico
“Working with optimized protocolsgives us the stable results we need.”
BENEFITS TO OUR CUSTOMERS / MARKETS
INVE’s shrimp hatchery feeds drive consistency & profitability
Advanced Nutrition

INVE’s shrimp hatchery feeds drive consistency & profitability
BENEFITS TO OUR CUSTOMERS / MARKETS
70
Benefits for farmers using FRiPPAK feeds increased by 2,464 USD per million PLs produced.
1a production unit produces 1 million PL10 per run
Absolute values ($/production unit/year)
Cost item Protocol
Standard INVE
Total costs 18,459 17,212
Total revenue 29,200 30,417
Total margin 10,741 13,205
Production runs/year 14.6 15.2
Advanced Nutrition

71
Mr. Van Thanh LuongCEO Viet-Uc Group, Vietnam
“Mastering the hatchery stage hasbeen the first step towards achievingbetter grow-out results.”
BENEFITS TO OUR CUSTOMERS / MARKETS
INVE’s probiotics drive profitability in the shrimp nursery & farms:
Advanced Nutrition

BENEFITS TO OUR CUSTOMERS / MARKETS
72
Benefits for farmers using Sanolife PRO-W increased by 3,491 USD per million PLs produced.
INVE’s probiotics drive profitability in the shrimp nursery & farms:
Benefit per 1 million PLs
SanolifePRO-w
Product A Product B
Producer Competitor A Competitor B
Price per Kg 45 USD 35 USD 8 USD
Application 200g/ha 1,250g/ha 1,500g/ha
Price per application
9 USD/ha 43.75 USD/ha 12 USD/ha
Advanced Nutrition

73
Ramon AmaralExecutive director
Tilapia Ambar Amaral Group, Brazil
“By controlling the entire value chain from hatchery to processing and marketing, we build our success on rigorous product quality.”
BENEFITS TO OUR CUSTOMERS / MARKETS
INVE’s probiotics drive profitability in Tilapia nursery & farms:
Advanced Nutrition

74
BENEFITS TO OUR CUSTOMERS / MARKETS
Advanced Nutrition
+5-10% > + 10%
INVE’s probiotics drive profitability in Tilapia nursery & farms:
Fig 2. FCR in tilapia. Harvest after 180 days.
Sanolife PRO-W at 200g/Ha and Sanolife PRO-F at 2g/Kg feed
Fig 1. Growth rate of tilapia Sanolife PRO-F at 2g/Kg feed

75
BENEFITS TO OUR CUSTOMERS / MARKETS
INVE’s probiotics drive profitability in Tilapia nursery & farms:
Advanced Nutrition
> + 10%
Fig 2. FCR in tilapia. Harvest after 180 days.
Sanolife PRO-W at 200g/Ha and Sanolife PRO-F at 2g/Kg feed
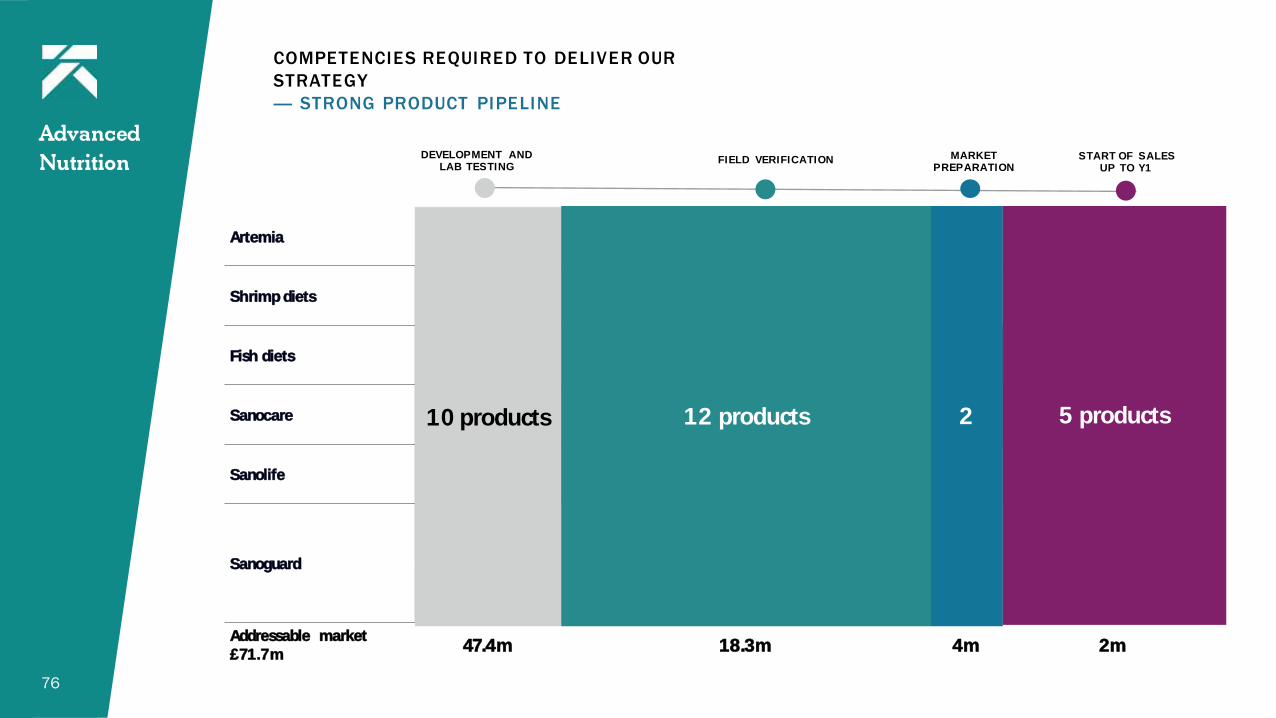
COMPETENCIES REQUIRED TO DELIVER OUR
STRATEGY
— STRONG PRODUCT PIPELINE
76
AArtemiaHHi-5 TOL Artemia
3.8m
Hi5 GSLArtemia
0.3m
Shrimp dietsArtemia replacement
shrimp SmART-S22.8m
Shrimp Breed Conditioner
TBD
ThalapurTBD
Fish dietsArtemia replacement
fish SmART_F7m
Easy Dry Selco0.4m
Natura 503m
S.PRESSO0.6m
ROBOOST0.4m
LANSY BREED0.3m
Sanocare STREP Tilapia2.7m
OFF Flavour3.3m
EMS Phage7.6m
BMK PRESTOCK RapidBAH
FIT1m
Sanolife PRO-F EFSA1.5m
BIOFLOC0.1m*
PRO-2+3.2m
PRO-F+0.4m
PRO-S FMC+0.1m
PRO-F FMC+0.3m
PRO-W+2.2m
GUT0.2m
PRO-TAB0.5m
Sanoguard
S.PAK BlackTBD
ROBUST FISH1.5m
IMMUNO MIXTBD
S.PAK Nurse8.5m
Addressable market £71.7m 47.4m 18.3m 4m 2m
DEVEL OP MENT A ND L A B T ES T ING
FIEL D VERIF IC A T ION MA RK ET P REP A RA T ION
S T A RT OF S A L ES U P T O Y1
10 products 12 products 2 5 products
Advanced Nutrition

COMPETENCIES REQUIRED TO DELIVER OUR
STRATEGY
— STRONG PRODUCT PIPELINE ARTEMIA REPLACEMENT
77
Advanced Nutrition
Global artemia resources fully tapped
Increasing demand
Need for artemia replacement
Today: INVE Best Balance
Tomorrow: FULL REPLACEMENT
Historical data global artemia supply (kg)
Live Food Control (LFC)
Artemia = 35% (3,5 kg/mioPL)
Test protocol
Artemia = 5% (0,5 kg/mioPL)
+ 95% replacement diet
Status R&D
500,000
1,000,000
1,500,000
2,000,000
2,500,000
3,000,000
3,500,000
19
85
–19
86
19
87
–19
88
19
89
–19
90
19
91
–19
92
19
93
–19
94
19
95
–19
96
19
97
–19
98
19
99
–20
00
20
01
–20
02
20
03
–20
04
20
05
–20
06
20
07
–20
08
20
09
20
10
20
11
–20
12
20
13
20
14
20
15
20
16
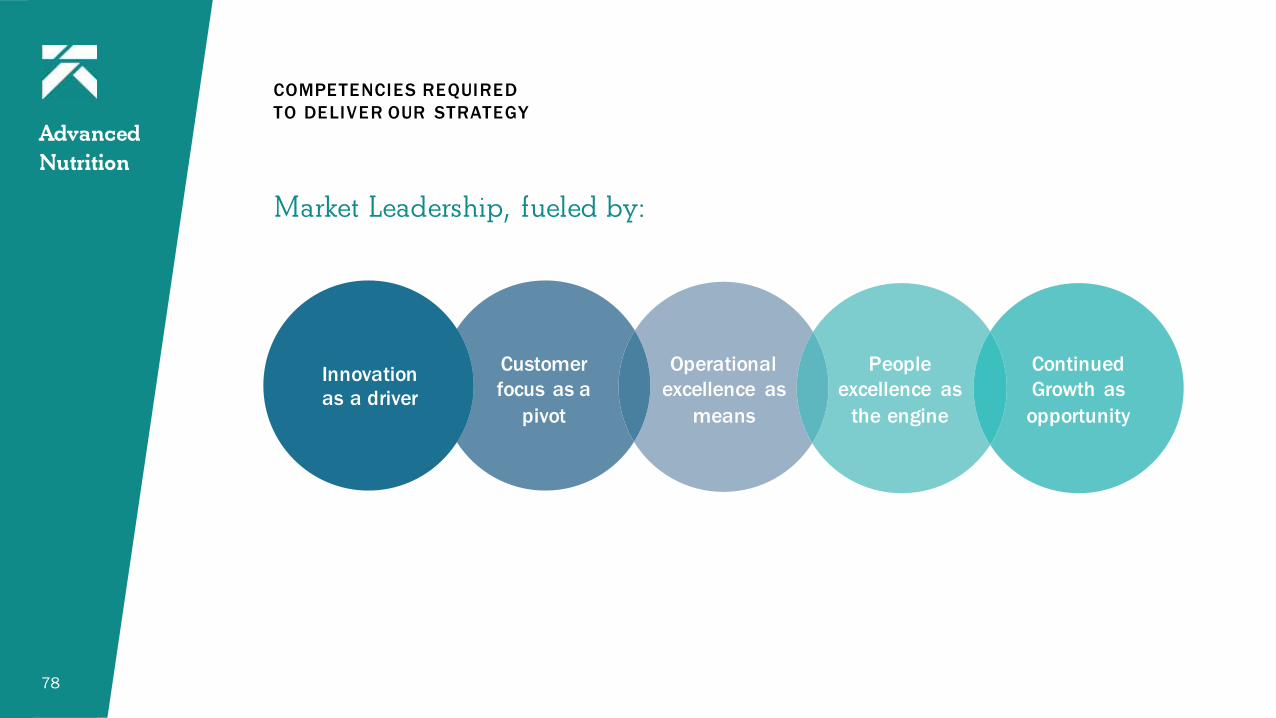
Market Leadership, fueled by:
COMPETENCIES REQUIRED
TO DELIVER OUR STRATEGY
78
Innovation as a driver
Customer focus as a
pivot
Operational excellence as
means
People excellence as
the engine
Continued Growth as
opportunity
Advanced Nutrition

PANEL 4
Financial model and capital structure
Mark Plampin, Chief Financial Officer
79Image: Benchmark’s Vaccine Manufacturing Facility, Braintree UK

FINANCIAL MODEL
Biological control is the key driver for financial performance of farmers
80
Example issues and scale of their economic impact
on producers
$4bnAntibiotics use in
aquaculture
$1bnEarly mortality syndrome in
shrimp
$500mSealice in salmon

FINANCIAL MODEL – CUSTOMER ENGAGEMENT
Direct engagement with customers in developed markets
Trade through distributors in developing / fragmented markets
Good customer spread – top 20 customers account for around 50% of sales
Key account management process is central to
leveraging market position
81
Customer type by number of customers
Customer type by annual sales valueannual sales value

FINANCIAL MODEL – CASH FLOW
Gross margins typically 50% to 75%
EBITDA margin progression expected:
FY17 consensus 10%
Long term (3 to 5 years) 20% to 25% through top line synergies and operating leverage
Further growth beyond this as rate of product launches increases
EBITDA will increasingly convert to cash:
Short term Adjusted EBITDA to FCF* conversion rate c. 30% due to R&D
Working capital balances tend to grow in line with top line growth
Long term expected to be c. 60%
82* Adjusted EBITDA to Free Cash Flow = pre Exceptionals
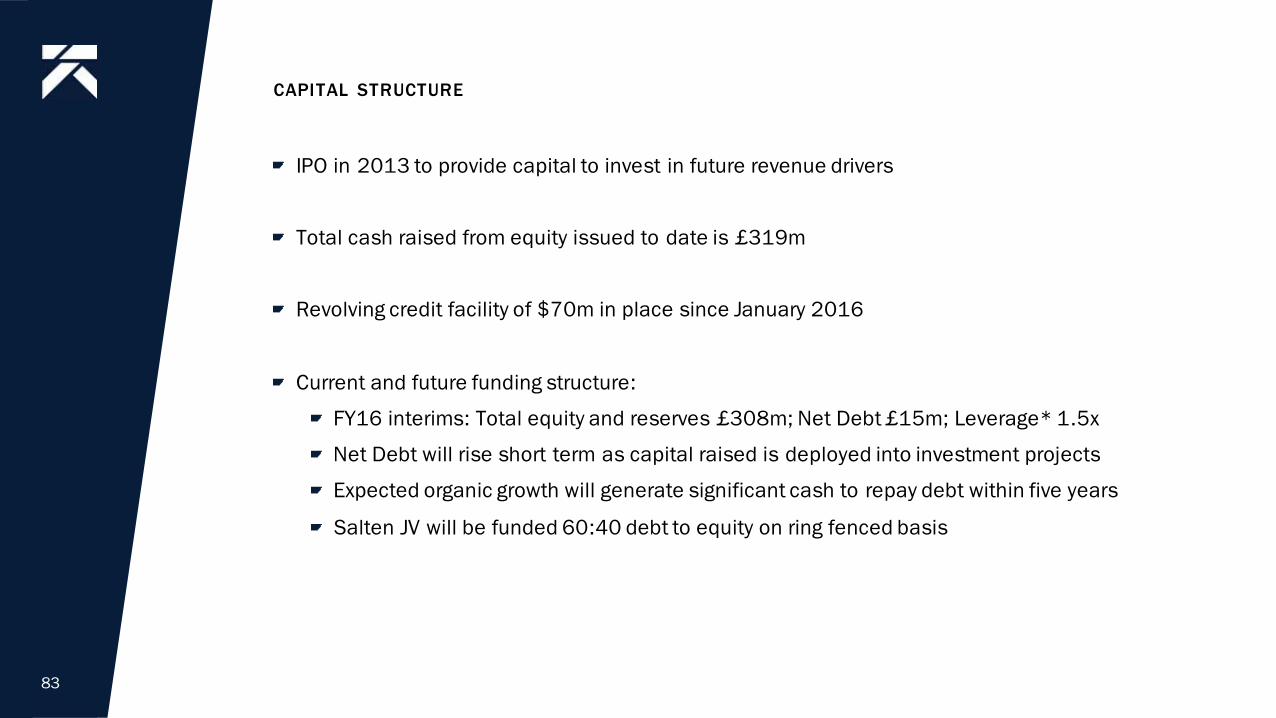
CAPITAL STRUCTURE
IPO in 2013 to provide capital to invest in future revenue drivers
Total cash raised from equity issued to date is £319m
Revolving credit facility of $70m in place since January 2016
Current and future funding structure:
FY16 interims: Total equity and reserves £308m; Net Debt £15m; Leverage* 1.5x
Net Debt will rise short term as capital raised is deployed into investment projects
Expected organic growth will generate significant cash to repay debt within five years
Salten JV will be funded 60:40 debt to equity on ring fenced basis
83
INVESTMENT APPROACH
Capital allocation process:
annual budget and half year reforecast
3 year strategic plans
investment appraisal and funding review approved by the board for all material projects
Business case including 10 year financial projections
Benchmark’s ROI approach:
IRR above WACC
ROIC year 3 or 4 above WACC
Ongoing management and monitoring:
Specific manager appointed to each project
Regular M&A integration report to Operations Board (division heads plus Exec)
Monthly report to board on integration and capital projects
Quarterly report to board on R&D projects
84

85
INVESTMENT APPROACH — LAST 3 YEARS FOCUS ON M&A AND R&D
INVESTMENT APPROACH
Future investment:
M&A – focus on bolt-ons
R&D:
> 65% of R&D investment is in aquaculture
% of sales c. 12% FY16 & FY17 reducing to sub 10% long term
Production capacity:
focus on Breeding & Genetics / vaccines
ownership versus outsourcing
91

THE BENCHMARK INVESTMENT CASE
High growth markets – significant exposure to emerging aqua industry and developing countries
High margin business – focus on upstream parts of the value chain
Barriers to competition – integrated supply chain, strong IP and market leading position
Scalable – market leading aquaculture distribution network
First mover advantage – demand pull from unique integrated genetics, health and nutrition
Catalyst for market growth – Benchmark’s solutions unlock production constraints and profitability
87

PANEL 5
The Way Forward
Malcolm Pye, Chief Executive Officer
88

Benchmark has built:
The opportunity
The platform
The technology
The team
To grow our sustainable business
and deliver sustainable
shareholder returns
THE ROAD MAP AND WAY FORWARD
89

Benchmark is securing our position at the heart of the blue revolution — driving shareholder value as the industry grows

IMPORTANT NOTICE
This presentation has been prepared by Benchmark Holdings plc (the
"Company") in connection with a capital markets day held on 29
November 2017.
This presentation does not constitute a prospectus or an admission
document relating to the Company, nor does it constitute or form part of
any offer or invitation to purchase, sell or subscribe for, or any solicitation
of any such offer to purchase, sell or subscribe for, any securities in the
Company nor shall this presentation or any part of it, or the fact of its
distribution, form the basis of, or be relied on in connection with, any
contract for the same.
No reliance may be placed, for any purposes whatsoever, on the
information contained in this presentation or on its completeness. No
representation or warranty, express or implied, is given by or on behalf of
the Company, Numis Securities Limited ("Numis") or any of their
respective directors, partners, officers, employees, advisers or any other
persons as to the accuracy, fairness or sufficiency of the information or
opinions contained in this presentation and none of the information
contained in this presentation has been independently verified by any
person, including Numis. Save in the case of fraud, no liability is
accepted for any errors, omissions or inaccuracies in such information or
opinions.
This presentation is being made only in the United Kingdom and is
directed only at (i) persons having professional experience in matters
relating to investments, i.e. investment professionals within the meaning
of Article 19(5) of the Financial Services and Markets Act 2000 (Financial
Promotion) Order 2005, as amended (the "FPO"), (ii) persons in the
business of disseminating information within the meaning of Article 47 of
the FPO and (iii) high net-worth companies, unincorporated associations
and other bodies within the meaning of Article 49 of the FPO and (iv)
persons to whom it is otherwise lawful to make the presentation. The
investment or investment activity to which this presentation relates is
available only to such persons and will be engaged in only with such
persons. Persons who fall outside categories (i) - (iii) above must check
that they fall within category (iv). If they do not, they may not attend this
presentation. Any person who does not fall within categories (i) - (iv)
above may not rely on or act upon the matters communicated at this
presentation. Any person falling outside categories (i) - (iv) who has
received any document forming part of this presentation must return it
immediately.
Neither this presentation nor any copy of it may be (i) taken or
transmitted into the United States of America, (ii) distributed, directly or
indirectly, in the United States of America or to any US person (within the
meaning of regulations made under the Securities Act 1933, as
amended), (iii) taken or transmitted into or distributed in Canada,
Australia, the Republic of Ireland or the Republic of South Africa or to any
resident thereof, or (iv) taken or transmitted into or distributed in Japan
or to any resident thereof. Any failure to comply with these restrictions
may constitute a violation of the securities laws or the laws of any such
jurisdiction. The distribution of this document in other jurisdictions may
be restricted by law and the persons into whose possession this
document comes should inform themselves about, and observe, any such
restrictions.
This presentation is confidential and must not be copied, reproduced,
published, distributed, disclosed or passed to any other person at any
time without the prior written consent of the Company.


