184
CAPITAL MARKETS DAY February 28, 2019

CAPITAL MARKETS DAY
February 28, 2019

28/02/2019 2ENGIE 2019
11:00 – 12:15
2018 performance
Strategic orientation
Capital allocation & medium-term guidance
12:15 – 1:00
1:00 – 2:30
2:30 – 3:30
Shankar KRISHNAMOORTHY
Paulo ALMIRANTE
Gwenaelle HUET
Franck BRUEL
p. 86
p. 107
p. 126
p. 156
Operational plans by business line
Buffet lunch
Q&A and closing remarks
Judith HARTMANN
Isabelle KOCHER
p. 3
p. 27
Judith HARTMANN p. 59
1
2
3
4
5
7
6
Tab

JudithHARTMANNEVP, Chief Financial Officer
2018 PERFORMANCE
28/02/2019 4ENGIE 2019
NRIGS GUIDANCE ACHIEVED
SOLID ORGANIC GROWTHDESPITE NUCLEAR HEADWIND
SOUND OPERATING CASH GENERATIONAND STRONG FINANCIAL STRUCTURE
28/02/2019 5ENGIE 2019
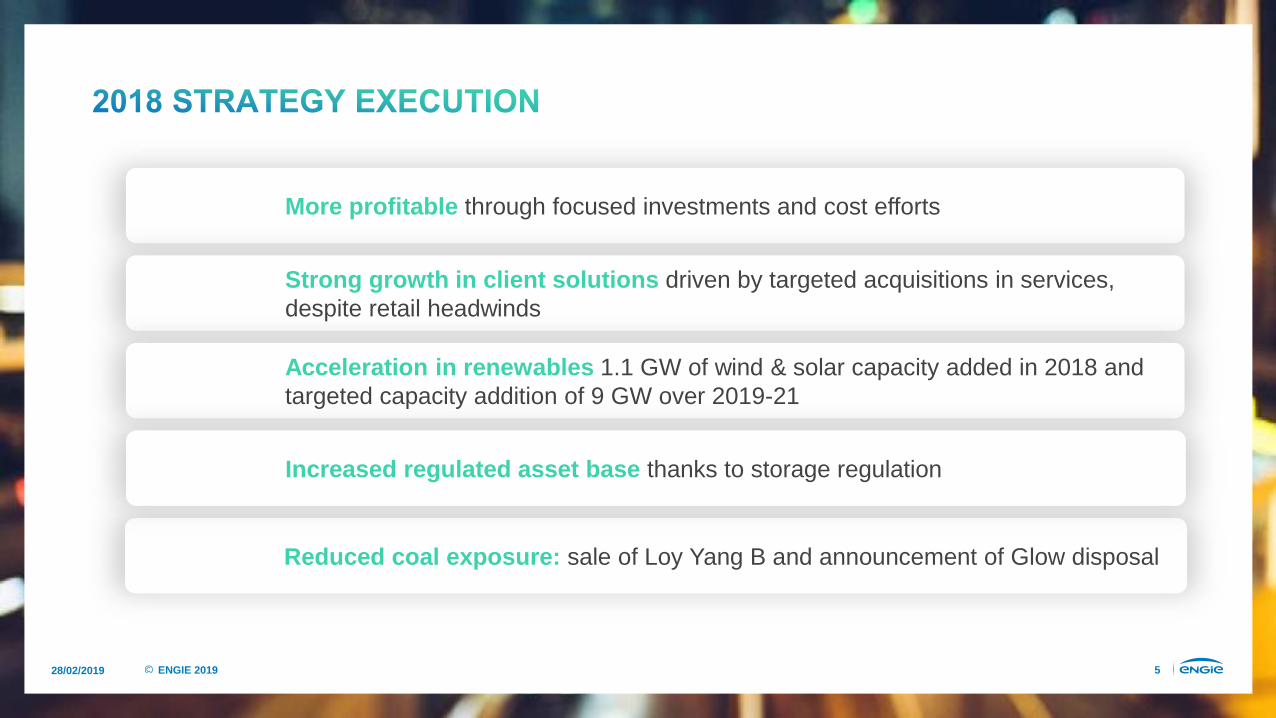
More profitable through focused investments and cost efforts
Strong growth in client solutions driven by targeted acquisitions in services,despite retail headwinds
Acceleration in renewables 1.1 GW of wind & solar capacity added in 2018 and targeted capacity addition of 9 GW over 2019-21
Reduced coal exposure: sale of Loy Yang B and announcement of Glow disposal
Increased regulated asset base thanks to storage regulation

28/02/2019 6ENGIE 2019 (1) FY 2017 restated for IFRS 5, 9 and 15 treatments (3) excl. E&P and LNG(2) Including share in net income of associates (4) Cash Flow From Operations = Free Cash Flow before Maintenance Capex
EBITDA
2018 FY RESULTS – In €bn Actual∆
Gross(1)∆
Organic (1)
COI(2)
NRIgs(3)
NIgs
CFFO(4)
9.2
5.1
2.46
1.0
7.3
0%
-1%
+10%
-22%
-1.2
+5%
+5%
+17%

28/02/2019 7ENGIE 2019
9.2
EBITDA 2017 FX - ScopePoint de passage Nuke Prix volume Lean Other EBITDA 2018
(0.4)+0.3
FX & Scope
FX: (0.3)Scope: (0.1)
8.8
Lean(2)
(0.7)
Nuclear Price(2) Volume(2)
+0.2 +0.3 +0.3
Other(2)
GEM
EBITDA9M 2017
EBITDA2018
EBITDA2017(1)
9.2
BENELUX
EUROPE excl. France & Benelux
LATIN AMERICA
+5%
Volume: (0.7)Price: (0.1)Other: +0.1
NORTH AMERICA
INFRASTRUCTURES EUROPE
OTHER
FRANCE
AFRICA/ASIA
(1) FY 2017 restated for IFRS 5, 9 and 15 treatments (2) Effects excluding nuclear(3) Organic variation
RenewablesGas midstreamStorage
By reportable segment(3)
In €bn

28/02/2019 8ENGIE 2019
o/w Nuke +0.1
FY 2018
2.8
3.9
2.4
o/w Nuke -0.5
FY 2017(2)
2.2
3.8
2.5
0.8 0.5
(1) Gross figures excluding unallocated corporate costs and non-core sold(2) FY 2017 restated for IFRS 5, 9 and 15 treatments
EBITDA(1) - In €bn, unaudited figures
GENERATION - MERCHANT
GENERATION - RES & THERMAL CONTRACTED
NETWORKS
CLIENT SOLUTIONS +9%
+4%
+9%
-29%
28/02/2019 9ENGIE 2019
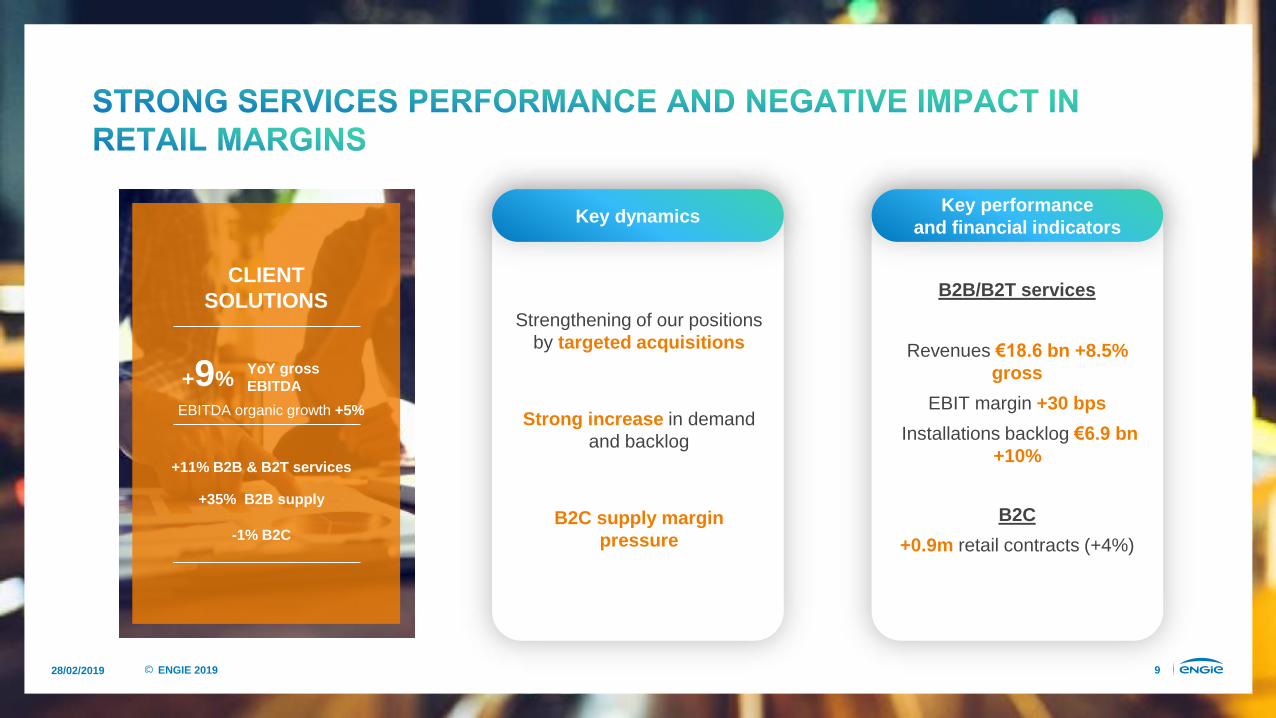
Strengthening of our positionsby targeted acquisitions
Strong increase in demand and backlog
B2C supply margin pressure
B2C
+0.9m retail contracts (+4%)
B2B/B2T services
Revenues €18.6 bn +8.5% gross
EBIT margin +30 bps
Installations backlog €6.9 bn+10%
CLIENTSOLUTIONS
+9% YoY gross EBITDA
+11% B2B & B2T services
+35% B2B supply
-1% B2C
EBITDA organic growth +5%
Key dynamicsKey performance
and financial indicators
28/02/2019 10ENGIE 2019
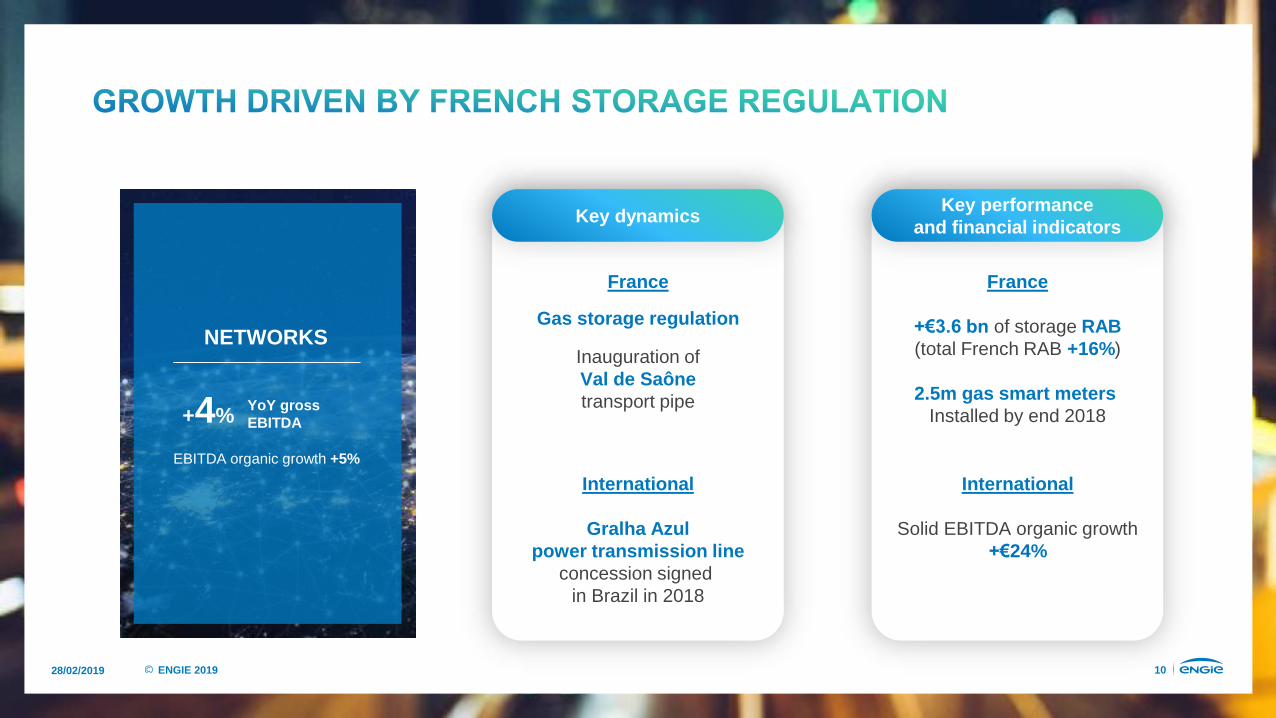
NETWORKS
+4% YoY gross EBITDA
EBITDA organic growth +5%
Key dynamicsKey performance
and financial indicators
France
Gas storage regulation
Inauguration of Val de Saônetransport pipe
France
+€3.6 bn of storage RAB(total French RAB +16%)
2.5m gas smart metersInstalled by end 2018
International
Gralha Azulpower transmission line
concession signedin Brazil in 2018
International
Solid EBITDA organic growth +€24%
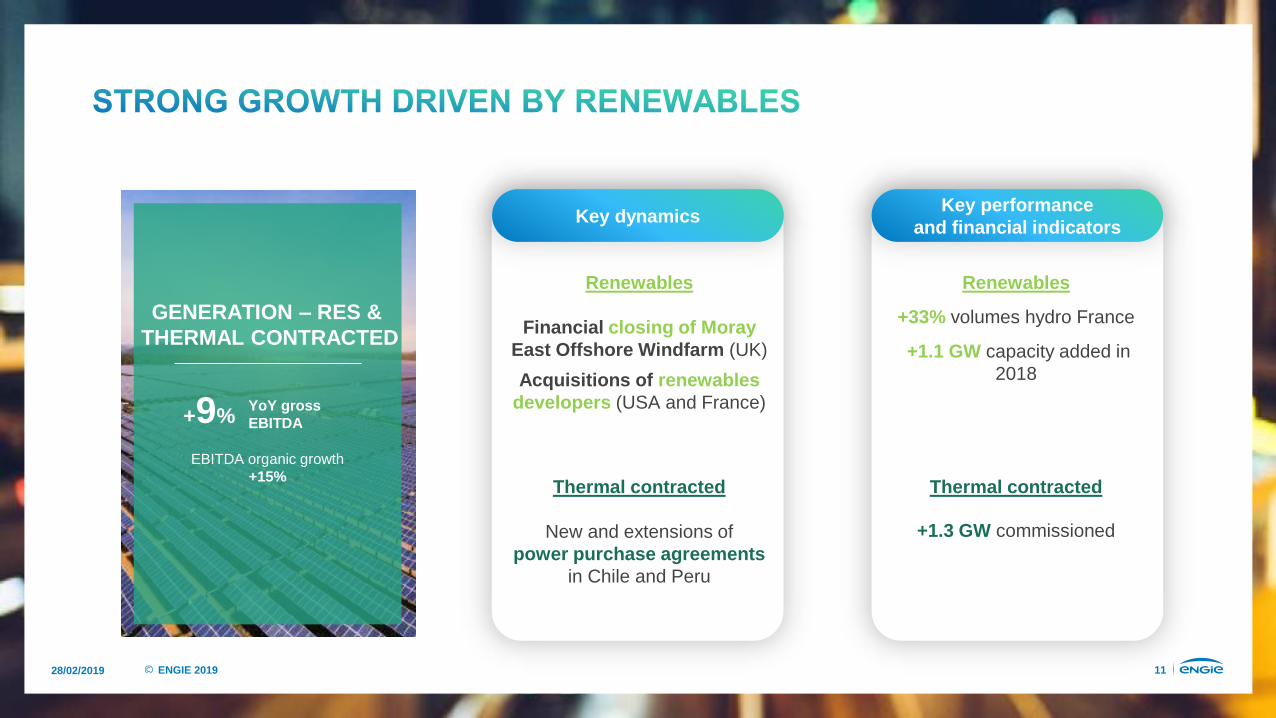
28/02/2019 11ENGIE 2019
Key dynamicsKey performance
and financial indicators
GENERATION – RES & THERMAL CONTRACTED
+9% YoY gross EBITDA
EBITDA organic growth +15%
Renewables
Financial closing of Moray East Offshore Windfarm (UK)
Acquisitions of renewables developers (USA and France)
Renewables
+33% volumes hydro France
+1.1 GW capacity added in 2018
Thermal contracted
New and extensions ofpower purchase agreements
in Chile and Peru
Thermal contracted
+1.3 GW commissioned

28/02/2019 12ENGIE 2019
GENERATION –MERCHANT
-29% YoY gross EBITDA
Significant unplanned nuclear outages
Positive portfolio effecton thermal power production
Dynamic management of optionality in the gas supply
portfolio
52% availability rateat Belgian nuclear plants
-€2/MWh lower achieved price on nuclear power production
Key dynamicsKey performance
and financial indicators

28/02/2019 13ENGIE 2019
NRIgs 2018 €2.4bn
MtM below COI (0.2)
Impairments (1.8)
Restructuring costs (0.2)
Capital gains (0.3)
Others(4) +1.1
NIgs 2018 €1.0bn
2018 2017(1) ∆ yoy
EBITDA €9.2bn €9.2bn +0.0
D&A and others (4.1) (4.0) (0.1)
COI(2) €5.1bn €5.2bn (0.0)
Net interest expense (3) (1.2) (1.2) (0.0)
Income tax (0.9) (1.1) +0.2
Minorities & Other (0.8) (0.7) (0.0)
NRIgs continued €2.5bn €2.2bn +0.2
NRIgs discontinued €(0.0)bn €0.3bn (0.3)
NRIgs €2.4bn €2.5bn (0.1)
(1) FY 2017 restated for IFRS 5, 9 and 15 treatments(2) After share in net income of associates(3) Cost of net debt + unwinding of discount on long-term provisions(4) Mainly coming from capital gains from E&P and LNG disposals (Group share)
From EBITDA to NRIgs From NRIgs to NIgs
28/02/2019 14ENGIE 2019
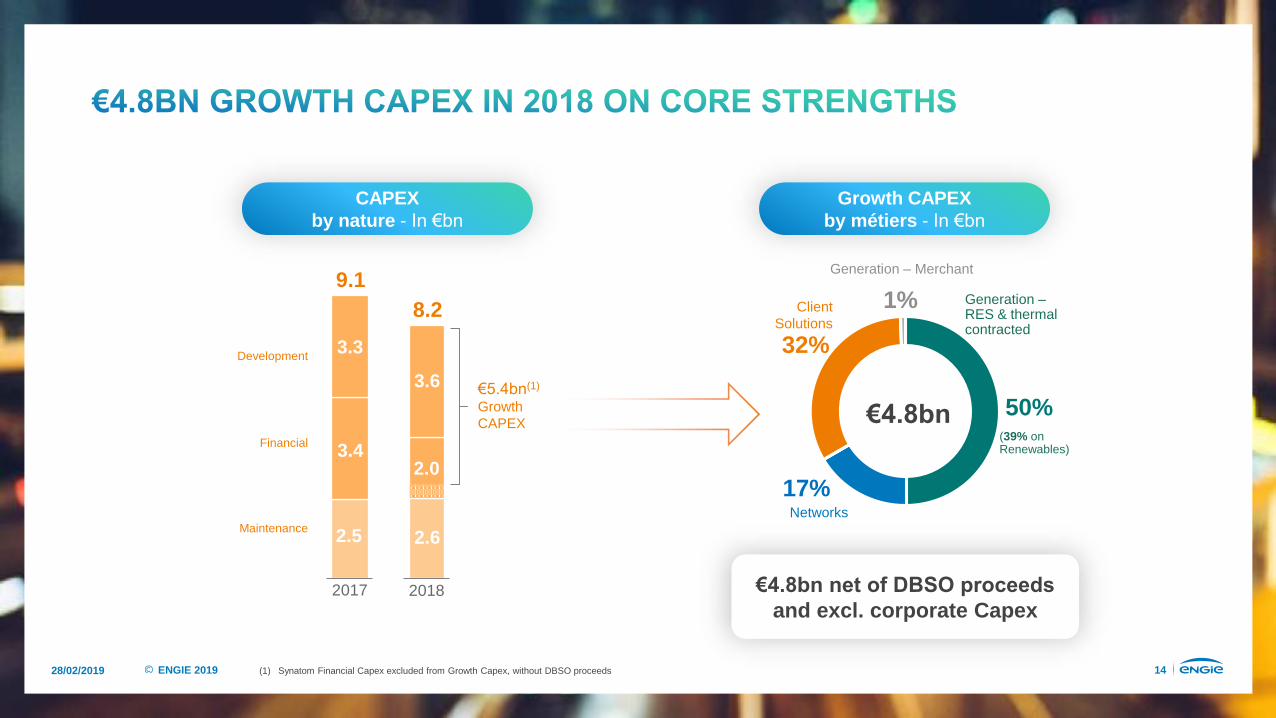
Maintenance
Financial
2017 2018
3.6
2.0
2.6
9.18.2
Development
2.5
3.4
3.3
€5.4bn(1)
GrowthCAPEX
50%
17%
32%
1% Generation –RES & thermalcontracted
Networks
(39% onRenewables)
Client Solutions
Generation – Merchant
€4.8bn
€4.8bn net of DBSO proceeds
and excl. corporate Capex
CAPEX by nature - In €bn
Growth CAPEXby métiers - In €bn
(1) Synatom Financial Capex excluded from Growth Capex, without DBSO proceeds

28/02/2019 15ENGIE 2019
R O C E p ( 1 )
CLIENT SOLUTIONS(2)
GENERATION - RES & THERMAL CONTRACTED
NETWORKS
10.4% 12.2%
10.3% 12.8%
7.3% 7.7%
ENGIE 6.5% 7.4%
2015 2018
€1.0bn COI contribution as
from 2019
€1.3bn net cost savingsat EBITDA level
(1) See detailed calculation in the appendices(2) Including supply(3) €13.7bn of contributive Capex out of €14.2bn Growth Capex
-€0.8bn 2018 COI impact vs 2015
-€0.8bn 2018 COI impact vs 2015
ROCEp(1)
Scope impact Nuclear impact
CAPEX 2016-18(3) Lean 2018

28/02/2019 16ENGIE 2019
In 2018, S&P confirmed its A-/A-2 rating and revised its outlook from negative to stable; Moody’s also confirmed its A-2 rating with stable outlook
Dec 15 Dec 16 Dec 17 Dec 18
2.32.3(1)2.4(1)
3.8(2)4.03.7
2.5
Economic Net Debt / EBITDA
Financial Net Debt / EBITDA
27.7
24.8
22.521.12.99%
2.78%2.63%
2,4
2,9
3,4
3,9
4,4
Dec 15 Dec 16 Dec 18Dec 17
2.68%
(1) Net debt pro forma E&P interco debt(2) Figures restated for LNG midstream and upstream activities classified as discontinued operations as from March 2018 (IFRS 5)(3) Leases commitments included in economic net debt are restated in EBITDA (for ca. €0.5bn), reflecting the implementation of IFRS 16 from 2019 onwards
3.7(3)
Financial net debt & cost of gross debt - In €bn

28/02/2019 17ENGIE 2019
2018 2019e
2.46(1)2.5-2.7(2)
2018 2019e
9.7(1) 9.9-10.3(2)
65-75% pay-out ratio on NRIgs
Financial net debt / EBITDA ≤2.5x“A” category rating
Net recurring income Group share - In €bn
EBITDA indication - In €bn
Dividend for 2019
Leverage & rating(3)
(1) Without E&P and LNG contributions, restated for IFRS16 treatment (€0.5 bn at EBITDA level, negligible at NRIgs level)(2) Main assumptions: average weather in France, full pass through of supply costs in French regulated gas tariffs, no major regulatory and macro-economic changes, market commodity prices as of 12/31/2018,
average forex for 2019: €/$: 1.16; €/BRL: 4.31, no significant impacts from disposals not already announced(3) The debt forecasts assume no change in the existing Belgian nuclear provision legal and regulatory framework.

28/02/2019 18ENGIE 2019
ADDITIONAL MATERIAL

28/02/2019 19ENGIE 2019 (1) Net Capex = gross Capex– disposals (cash and scope impact on net debt)
Restructuring& others
Cash generated from operations before income tax and WCR
EBITDA2018
Taxcash
expenses
WCRNetfinancial
expenses
(0.8)(0.8)
(0.6)
9.2
7.3
CFFO2018
CASH EQUATION
8.5
5.8
0.2
€1.7bn Dividends
€0.8bn Dividends to minorities
€0.1bn Hybrids coupon
€3.1bn Net Capex(1)
In €bn

28/02/2019 20ENGIE 2019
Power margins
Gas margins
+0.0
B2C
+0.1
B2B & B2Tservices
2.4+0.1
0.7+0%
0.2 +38%
1.5+4%
B2B supply
Market opening in Mexico
GEM
Energy services in France
(volumes & Margins)
UK (Keepmoat)
Restated for FX
&Scope
2.3
B2B & B2T services
B2B supply
B2C
EBITDA2018
EBITDA2017
In €bn, % yoy organic
CLIENT SOLUTIONS

28/02/2019 21ENGIE 2019
3.9+0.1 (0.0)
Transport & Regas
Storage Distribution
0.4 +24%
3.5+3%
Restated for FX
&Scope
3.7 +0.0
Power transmission
Infrastructure Europe
International
EBITDA2018
+0.1
GRT gaz HB conversion contract
Latam tariffs
Commissioning
Latam tariffs
Temperatures
Storage regulation
in France
Other networks
Chile
+0.0
EBITDA2017
NETWORKS
In €bn, % yoy organic

28/02/2019 22ENGIE 2019
2.3
+0.1
Lean
Prices
2.8+0.6
VolumesRenewables
Thermal contracted
1.1+4%
1.6+25%
Better hydrology in France
Assets commissioning & DBpSO
margins
Brazil hydro
Brazil spot prices
France hydro achieved prices
End of high margin PPA in Peru
Restated for FX
&Scope
Other
(0.0)
(0.2)
EBITDA2018
EBITDA2017
GENERATION - RES & THERMAL CONTRACTED
In €bn, % yoy organic

28/02/2019 23ENGIE 2019
+0.40.5
(0.7)
Restated for FX,Scope
&Nuclear
tax
0.8
(0.05)
Nuclear
GEM
Generation & Other
Prices
Volumes (unplanned outages)
Gas supply portfolio LTC renegotiation
Accounting effect
EBITDA 2018EBITDA 2017
In €bn, % yoy organic
GENERATION - MERCHANT

28/02/2019 24ENGIE 2019
o/w Nuke -0.3
FY 2018
2.1
2.4
1.7
o/w Nuke -1.1
FY 2017
1.6
2.2
1.8
-0.1 -0.3
(1) Gross figures excluding unallocated corporate costs and non-core sold
COI(1) - In €bn, unaudited figures
GENERATION - MERCHANT
GENERATION - RES & THERMAL CONTRACTED
NETWORKS
CLIENT SOLUTIONS +8%
+5%
+12%
N/A

28/02/2019 25ENGIE 2019
9.29.9-10.3+0.7
Scope in
(0.1)
EBITDA2018
EBITDA2019
(0.0) +0.2 +0.2(0.5)
EBITDA2018
Restated
FX
9.1 +0.1(0.1)
RES Networks Client Solutions
Thermal &Nuclear
Merchant
Scopeout(2)
FRANCE
OTHER
+0.5
IFRS 16 GEM, Corporate
& other
REST OF EUROPE
LATIN AMERICA
USA & CANADA
MIDDLE EAST AFRICA ASIA PACIFIC
(1) Main assumptions: average weather in France, full pass through of supply costs in French regulated gas tariffs, no major regulatory and macro-economic changes, market commodity prices as of 12/31/2018, average forex for 2019: €/$: 1.16; €/BRL: 4.31, no significant impacts from disposals not already announced.
(2) Scope impact of disposals already announced(3) Gross variations
By business line - In €bn By reportable segment(3)

CAPITAL MARKETS DAY
February 28, 2019

IsabelleKOCHERChief Executive Officer, ENGIE
STRATEGIC ORIENTATION

28/02/2019 28ENGIE 2019
OUR STORY SO FAR
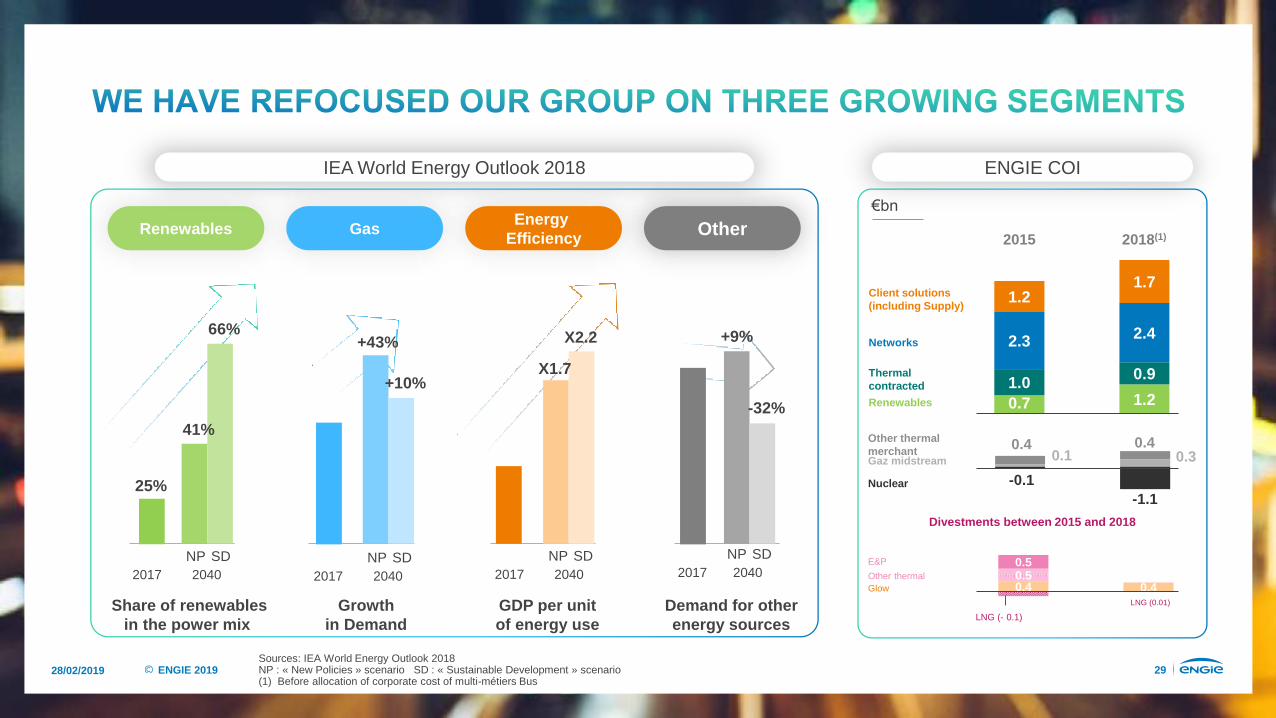
28/02/2019 29ENGIE 2019
Growthin Demand
GDP per unit of energy use
Demand for otherenergy sources
Share of renewables in the power mix
Renewables GasEnergy
Efficiency Other
25%
2017 2040NP SD
41%
66%
+10%
+43% X2.2
X1.7
-32%
+9%
2017 2040NP SD
2017 2040NP SD
2017 2040NP SD
0.4 0.40.50.5
0.7 1.21.0 0.9
2.3 2.4
1.21.7
2015 2018(1)
Client solutions (including Supply)
Networks
Thermalcontracted
Renewables
0.40.1 0.3
0.4Gaz midstream
Other thermalmerchant
Nuclear
-1.1-0.1
Glow
LNG (- 0.1)
Other thermal
LNG (0.01)
Divestments between 2015 and 2018
E&P
IEA World Energy Outlook 2018 ENGIE COI
€bn
Sources: IEA World Energy Outlook 2018NP : « New Policies » scenario SD : « Sustainable Development » scenario(1) Before allocation of corporate cost of multi-métiers Bus

28/02/2019 30ENGIE 2019
Off-grid market leader in Africa
~300k customers
#1 in microgrids in the world (EPS)
Floating offshore (Portugal and France)
Rooftop solar(green yellow)
Hydrogen H2 Mobility, GRHYD power to gas
project
Public Lighting1.5M lighting points
managed
#1 cooling networks in the world
Green Corporate PPA Spain, USA, Norway
Wind offshore UK, Belgium, France
#1 in biomethane in France
2.5M gas smart meters in France
#2 in charging points worldwide (EV box)
We have built a development platform for Renewables
We have reinforced leadership in Client Solutions
We have strong Networks positioning in France & LatAm
CENTRAL EMERGING
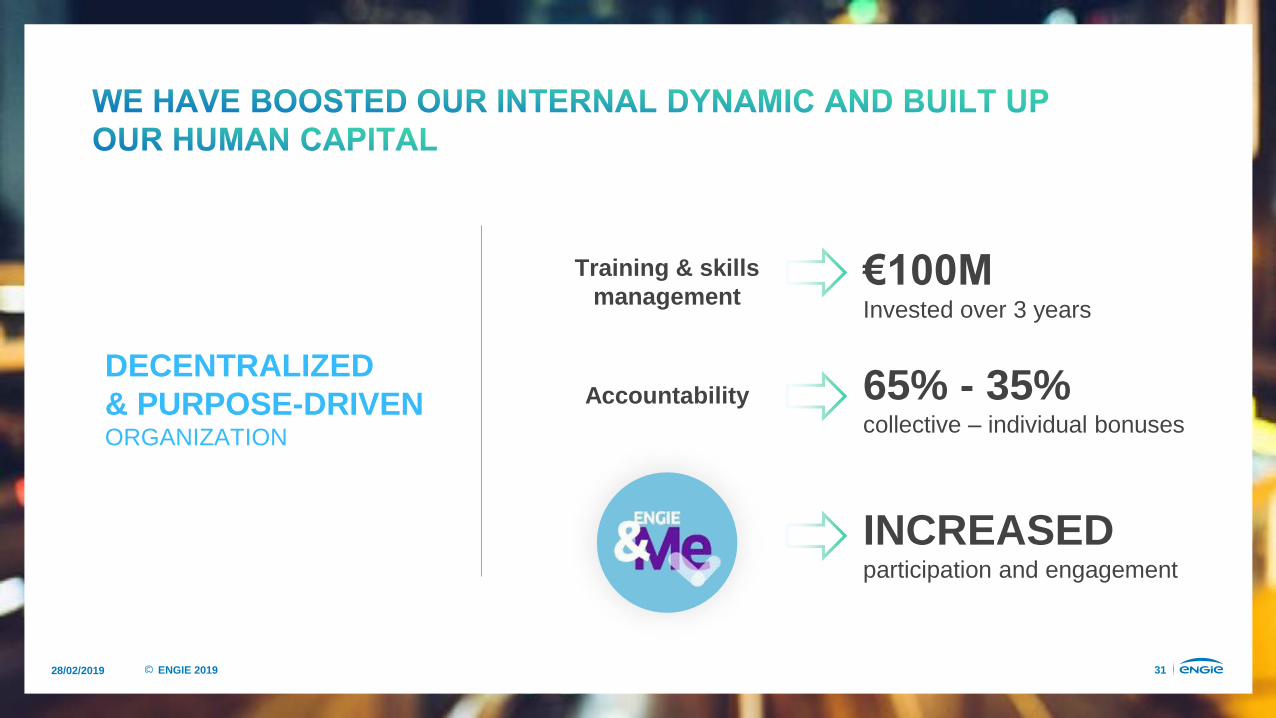
28/02/2019 31ENGIE 2019
€100MInvested over 3 years
65% - 35% collective – individual bonuses
INCREASEDparticipation and engagement
Training & skillsmanagement
AccountabilityDECENTRALIZED & PURPOSE-DRIVENORGANIZATION

28/02/2019 32ENGIE 2019
COI
Organic growth YoY (%)
-8%
-3%
-14%
+2%
+5%
X%
2013 2014 2015
2016 2017 2018
+5%

28/02/2019 33ENGIE 2019
CO2 emissions
from 2012 to 20181.5 Million Power Green offer in France
A list-56%INVESTORS
CLIENTS
EMPLOYEES
DJSI index+13 points
most 500 valuablebrands 2019
82%believe strongly in the productsand services ENGIE provides

28/02/2019 34ENGIE 2019
Contracted / regulated
ROCEp(3)
EBITDA yoyorganic growth(1)
Low CO2
EBITDA Client Solutions (€bn)(2)
93%
7.4%
+5%
93%
2.4
+36%
Faster growing
More profitableROCEp increase in all activities ex-nuclear
Less risky
Cleaner
Client Solutions orientedStrong growth even if below target (+50%)
71%
6.5%
-9%
75%
2015
✓
✓
✓
✓
✓
1.8
(1) Organic growth 2015 vs 2014 and 2018 vs 2017(2) Including supply before corporate cost allocation(3) See appendix for calculation

28/02/2019 35ENGIE 2019
WHAT THE MARKET TELLS US

28/02/2019 36ENGIE 2019
Over
15,000people
70countries
13,476posts
16,600reactions

28/02/2019 37ENGIE 2019
…A SECOND WAVE HAS STARTED…

28/02/2019 38ENGIE 2019
DECARBONIZATION DECENTRALIZATIONDIGITALIZATION
IndustriesLocal
Authorities

28/02/2019 39ENGIE 2019
Sources: RE100, SBT, CDP, BPI France, Havas media, WWF, Amis de la Terre, IPSOS
PRESSURE TO ACT IS INCREASING
NGOs denouncing the financing of fossil fuel
Philippines, US (NYC), Netherlands: oil companies
called to court hearings in climate-related cases
38% of Australians changed brand preference due to CSR
positioning
In France, ~30,000 students from leading universities signed “green
manifesto” to decline jobs at
companies with poor sustainability
500+ companies taking SBT actions
7,000 companies sharing their data: doubling since 2010
H1 2018: +70% in France (€350M) mostly for companies
150+ companies certified
COMPANIES ARE TAKING INITIATIVES

28/02/2019 40ENGIE 2019
switzerland
Renewable combined heat & power plant
Investment by ENGIE
Supply 17,500 households with cleaner electricity
28/02/2019 41ENGIE 2019
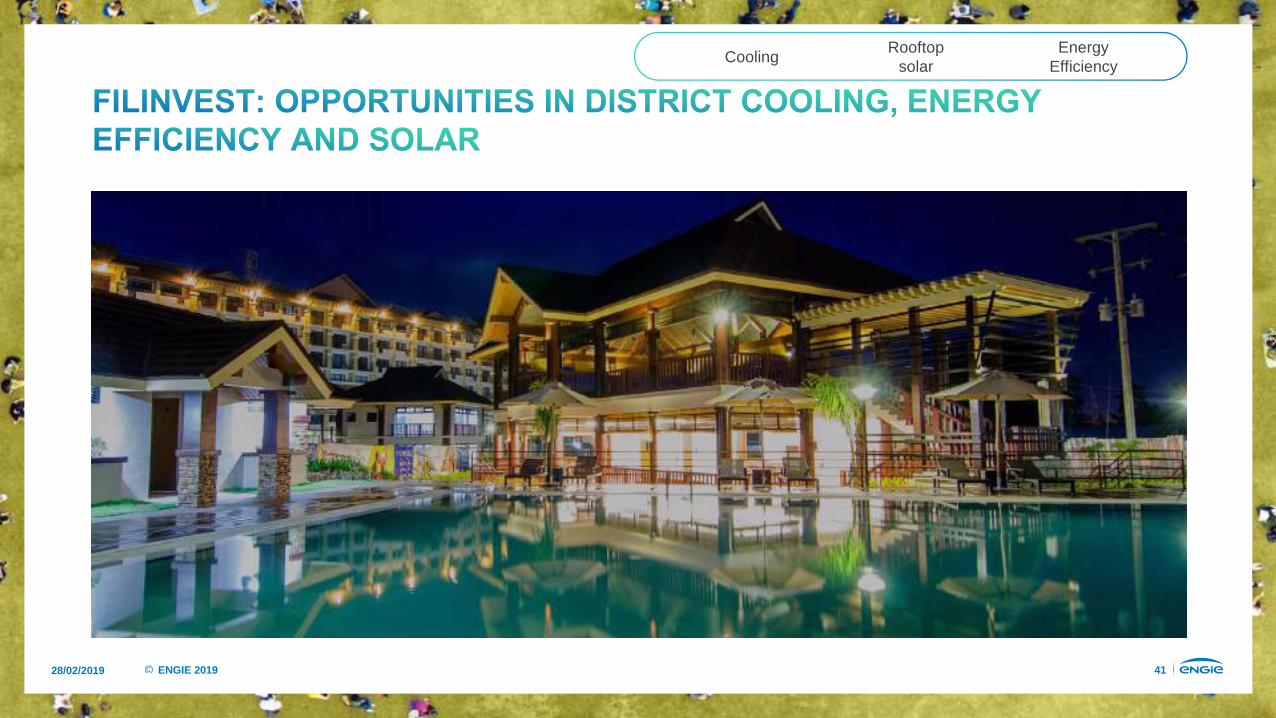
Philippines
CoolingRooftop
solarEnergy
Efficiency

28/02/2019 42ENGIE 2019
usa
Walmart’s ambition: operating with 100% renewable energy
150 MW Virtual PPA
Windfarm in South Dakota

28/02/2019 43ENGIE 2019
PRESSURE TO ACTIS INCREASING
2019: 2M+ signatures
2019: students protesting for climate action in the EU and US
2018: Ugandan government sued by young citizens for inaction on climate change
2018: Gilets Jaunes
Since 2012: 10% CO2 emission reduction in 27 cities
2017: 12 large cities to ban diesel by 2030
2018: 40+ cities committing to 0 waste by 2050
2017: 30 US states heading towards 50% RES by 2030
LOCAL AUTHORITIES ARE TAKING THE LEAD
Sources: clientearth.com; C40, Forbes

28/02/2019 44ENGIE 2019
france
30% green gas by 2030Circular
economy Adaptation of gas
infrastructure

28/02/2019 45ENGIE 2019
USA
Investment by ENGIE with 50 year contract
Building retrofit program
Green power generation & electric vehicles
28/02/2019 46ENGIE 2019
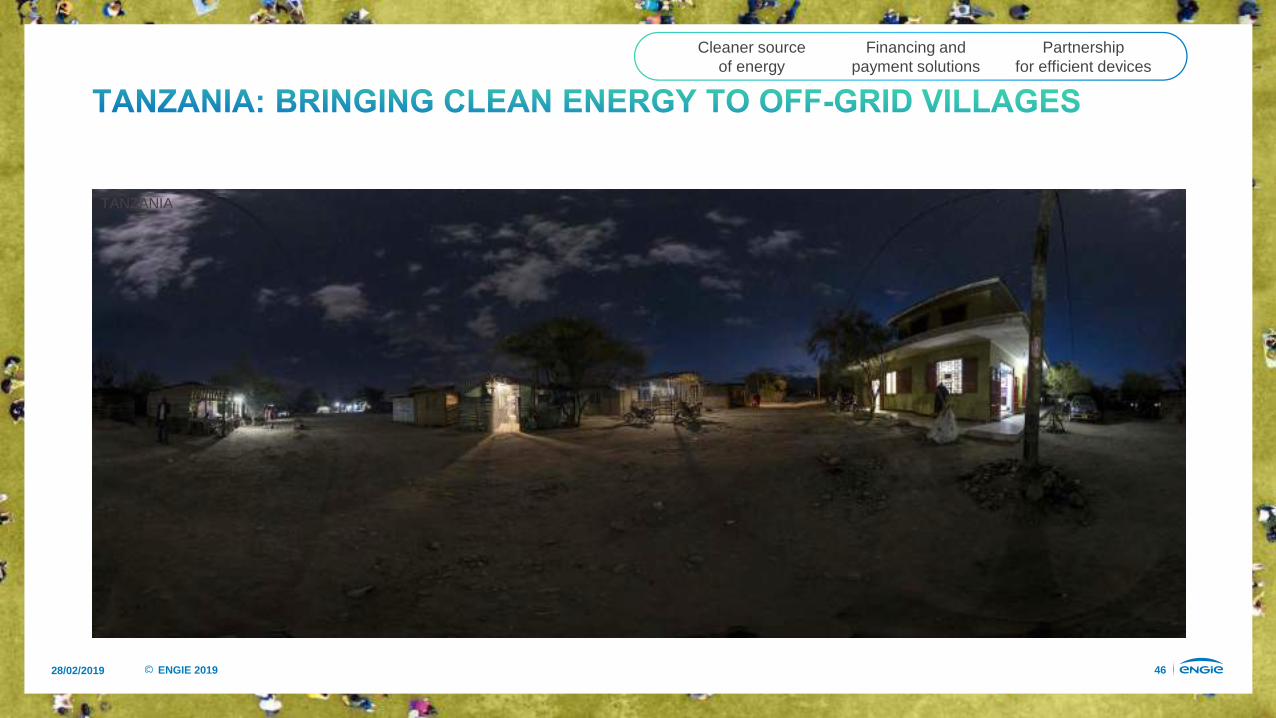
TANZANIA
Cleaner source of energy
Financing and payment solutions
Partnership for efficient devices

28/02/2019 47ENGIE 2019
STRENGTHENS CLIENTS CORE MISSION
FINANCED COST EFFECTIVE
Zero-Carbon Transition
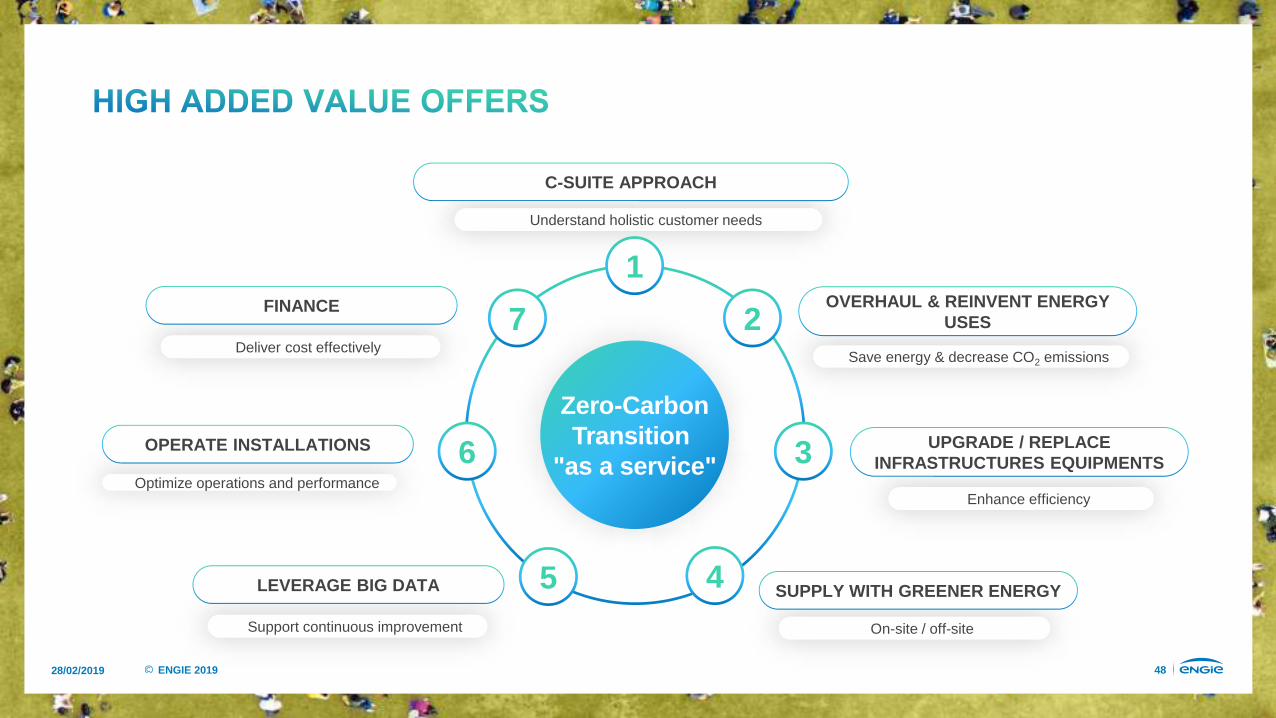
28/02/2019 48ENGIE 2019
Understand holistic customer needs
C-SUITE APPROACH
Save energy & decrease CO2 emissions
Enhance efficiency
On-site / off-siteSupport continuous improvement
Zero-CarbonTransition
"as a service"
1
2
3
45
OVERHAUL & REINVENT ENERGY USES
UPGRADE / REPLACE INFRASTRUCTURES EQUIPMENTS
SUPPLY WITH GREENER ENERGYLEVERAGE BIG DATA
6
7
Optimize operations and performance
OPERATE INSTALLATIONS
Deliver cost effectively
FINANCE

28/02/2019 49ENGIE 2019
BE THE WORLD LEADER IN ZERO-CARBON TRANSITION
"AS A SERVICE"
OUR AMBITION

28/02/2019 50ENGIE 2019
Design – Build – Run – Finance
RENEWABLESNETWORKS
GENERATION & SUPPLY
CLIENT SOLUTIONS
On site presence and close relationships with 30,000 clients
INFRASTRUCTURE DNA
CLIENT SOLUTIONS DNA

28/02/2019 51ENGIE 2019
Zero-CarbonTransition
"as a service"
Tailor-madeHigh-techFinanced
RENEWABLESNETWORKS
GENERATION & SUPPLY
CLIENT SOLUTIONS

28/02/2019 52ENGIE 2019
CLIENT SOLUTIONSAsset-based solutions a rising proportion of CS COI
Commoditized service offer
RENEWABLESSophisticated technologies,50% new RES projects dedicated to specific clients by 2021
Commoditized renewables
NETWORKSGrowth in dynamic development markets
Attractive returns & cash flows
Priority to convert gas infrastructure to green gas
GENERATION & SUPPLYBack to normal operations for nuclear
BtoC supply limited to current country footprint
Further reduction in thermal capacity led by continuing disposals of coal generation
Zero-CarbonTransition
"as a service"
Tailor-madeHigh-techFinanced
RENEWABLESNETWORKS
GENERATION & SUPPLY
CLIENT SOLUTIONS

28/02/2019 53ENGIE 2019
20 30countries urban areas
500Global companies

28/02/2019 54ENGIE 2019
A decentralizedorganization:24 business units
BUSINESS LINE - CLIENT SOLUTIONS
BUSINESS LINE - NETWORKS
BUSINESS LINE - RENEWABLES
BUSINESS LINE - THERMAL
4 business lines
Simplified reporting

28/02/2019 55ENGIE 2019
Deployment for all asset-based activities, including DBpSOmodels successfully developed in RES & Thermal
FINANCING SYNDICATION
Scale up software content in our solutions to differentiate us as the leading proprietary energy software provider
DIGITAL ACCELERATION
C-suite approach to help clients build their own tailored zero-carbon strategy
Cost-efficient, trackable and consistent with their sustainability ambitions
STRATEGY DESIGN
DevelopmentD
B
pS
O
Build
partial Sell
Operate

28/02/2019 56ENGIE 2019
63% 13%21% < 3%NetworksClient
SolutionsRenewables, Generation
Other
160,000 employees
Highly skilled resources
50% femalemanagers by 2030
10% of ENGIE’s French
staff will be apprentices by 2022
80% of employees to receive annual training
by 2022
28/02/2019 57ENGIE 2019
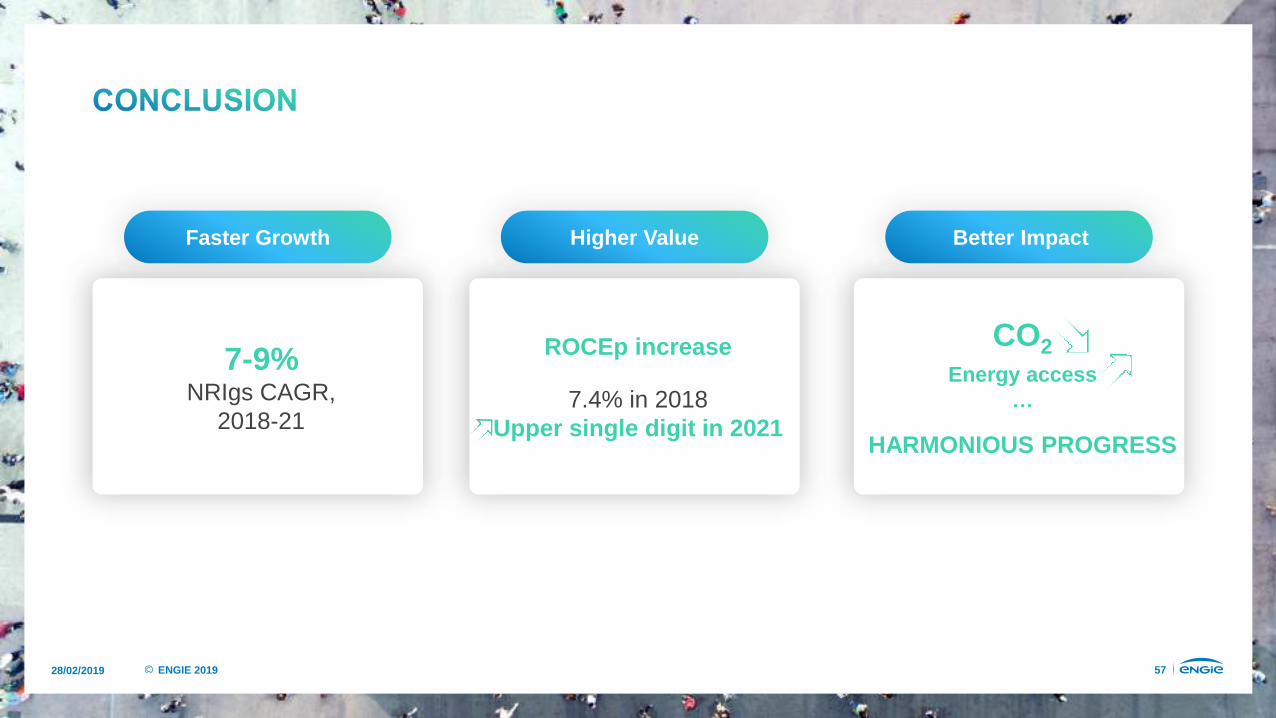
7-9% NRIgs CAGR,
2018-21
Faster Growth Higher Value Better Impact
ROCEp increase
7.4% in 2018 Upper single digit in 2021
CO2Energy access
…
HARMONIOUS PROGRESS

CAPITAL MARKETS DAY
February 28, 2019

CAPITAL ALLOCATION &
MEDIUM-TERM GUIDANCE
JudithHARTMANNEVP, Chief Financial Officer

28/02/2019 60ENGIE 2019
ACCELERATE GROWTH
TARGETED INVESTMENTS
ACTIVE PORTFOLIO MANAGEMENT
OPTIMIZED CAPITAL
ALLOCATION
ENERGY EFFICIENCY
CONTINUED LEADERSHIP IN ENERGY TRANSITION
GASRENEWABLES

28/02/2019 61ENGIE 2019
ALIGNMENT TO ENGIE’S STRATEGY
Focus on core geographies to build leadership at scale
Bias towards sophisticated solutions, conducive
to profitability
Differentiation over distinct time horizons
28/02/2019 62ENGIE 2019
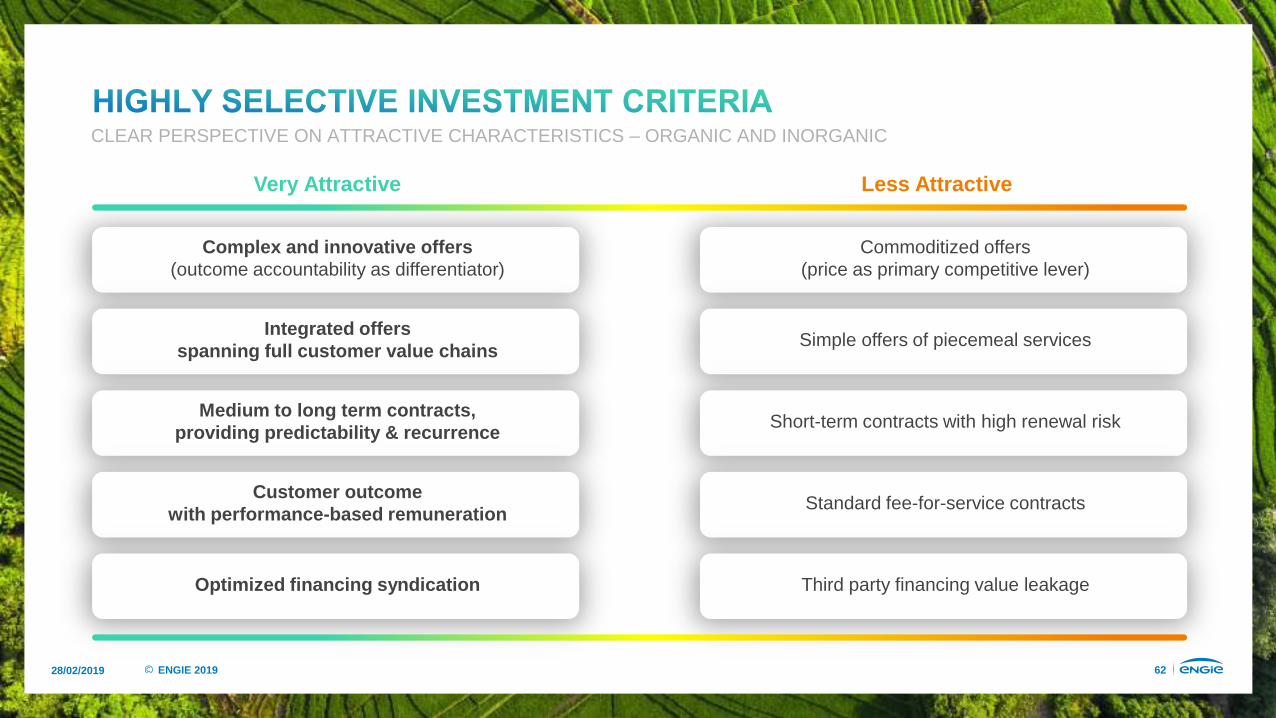
CLEAR PERSPECTIVE ON ATTRACTIVE CHARACTERISTICS – ORGANIC AND INORGANIC
Complex and innovative offers(outcome accountability as differentiator)
Integrated offers spanning full customer value chains
Medium to long term contracts, providing predictability & recurrence
Customer outcomewith performance-based remuneration
Optimized financing syndication
Commoditized offers (price as primary competitive lever)
Simple offers of piecemeal services
Short-term contracts with high renewal risk
Standard fee-for-service contracts
Third party financing value leakage
Less AttractiveVery Attractive

28/02/2019 63ENGIE 2019
PRIORITIZE 20 COUNTRIES
AND 30 EMERGING
MARKET URBAN AREAS
Acceleration of demandfor sophisticated solutions
ARCHETYPE 1
•Early stage•in energy transition
ARCHETYPE 2
•High growth•in energy infrastructure
ARCHETYPE 3
EXIT 20 COUNTRIES IN THE NEXT
3 YEARS

28/02/2019 64ENGIE 2019
ARCHETYPE 1
• Moderate growth• Well-equipped energy infrastructures• Mature energy consumption • Strong environmental awareness
MARKET CHARACTERISTICS
• Conversion to green energy• Infrastructures renewal• Increased focus on sustainability
CUSTOMER PRIORITIES
Western Europe, North America,Australia and Singapore
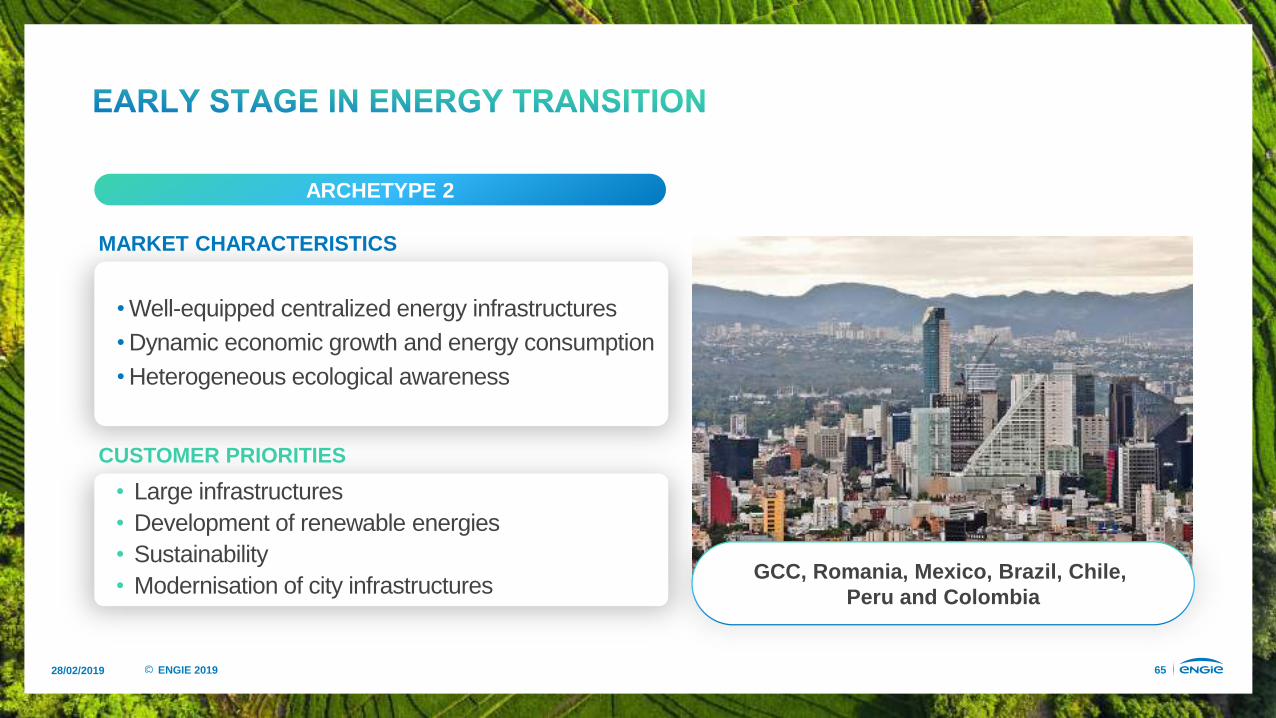
28/02/2019 65ENGIE 2019
GCC, Romania, Mexico, Brazil, Chile, Peru and Colombia
ARCHETYPE 2
MARKET CHARACTERISTICS
CUSTOMER PRIORITIES
• Well-equipped centralized energy infrastructures• Dynamic economic growth and energy consumption• Heterogeneous ecological awareness
• Large infrastructures • Development of renewable energies• Sustainability• Modernisation of city infrastructures
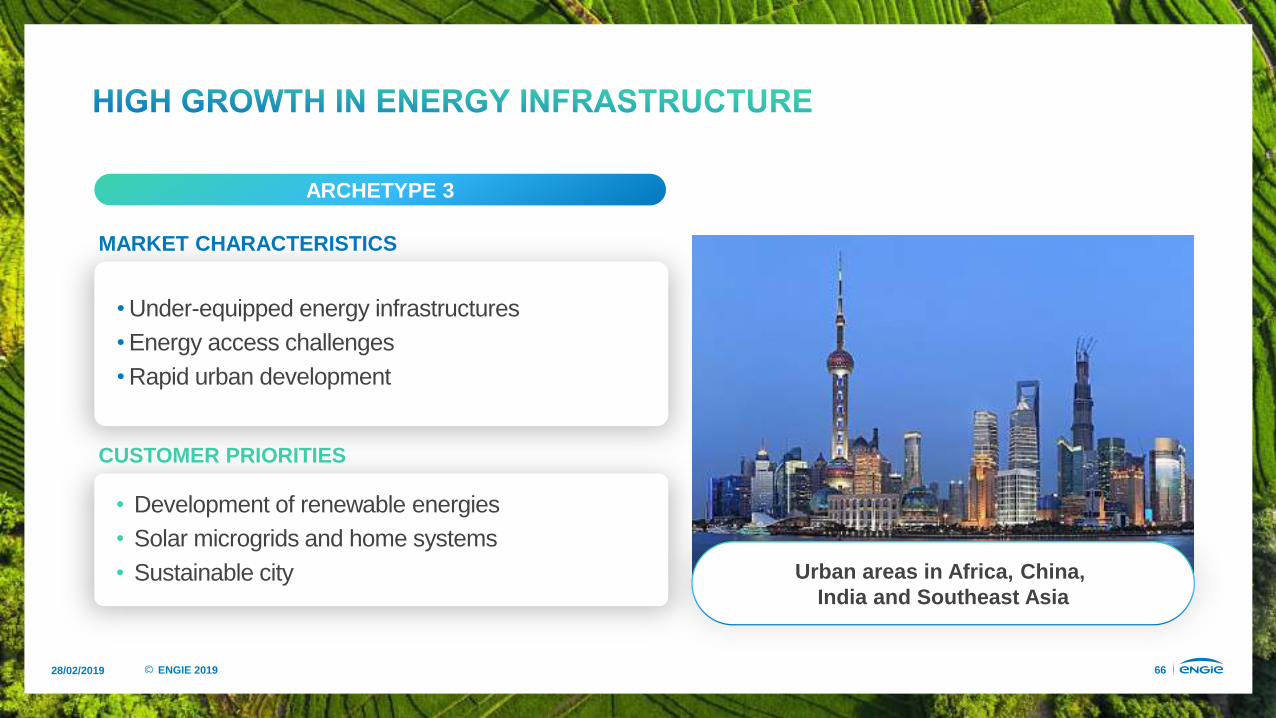
28/02/2019 66ENGIE 2019
Urban areas in Africa, China, India and Southeast Asia
ARCHETYPE 3
MARKET CHARACTERISTICS
CUSTOMER PRIORITIES
• Under-equipped energy infrastructures• Energy access challenges• Rapid urban development
• Development of renewable energies• Solar microgrids and home systems• Sustainable city

28/02/2019 67ENGIE 2019
Client solutions, solar, onshore wind,
international networks
Offshore wind,asset-based
solutions
New technologies:floating offshore,
green gas
COI
LONG-TERMInvestments
MID-TERMInvestments
SHORT-TERMInvestments
BUSINESS AS USUAL
TimeNOW T+3 T+5 T+7
Generation and asset-light
services, nuclear recovery
28/02/2019 68ENGIE 2019
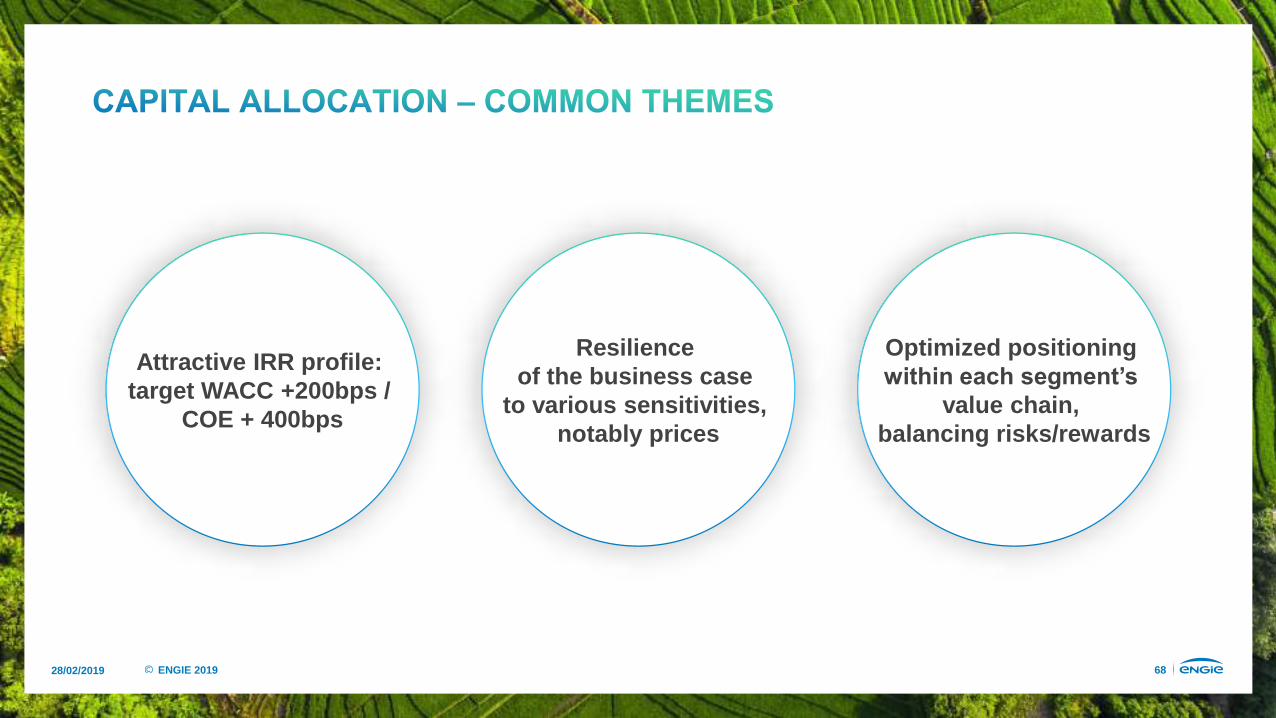
Attractive IRR profile: target WACC +200bps /
COE + 400bps
Optimized positioning within each segment’s
value chain, balancing risks/rewards
Resilience of the business case
to various sensitivities, notably prices

28/02/2019 69ENGIE 201928/02/2019 69ENGIE 2019
CLARITY IN REPORTING
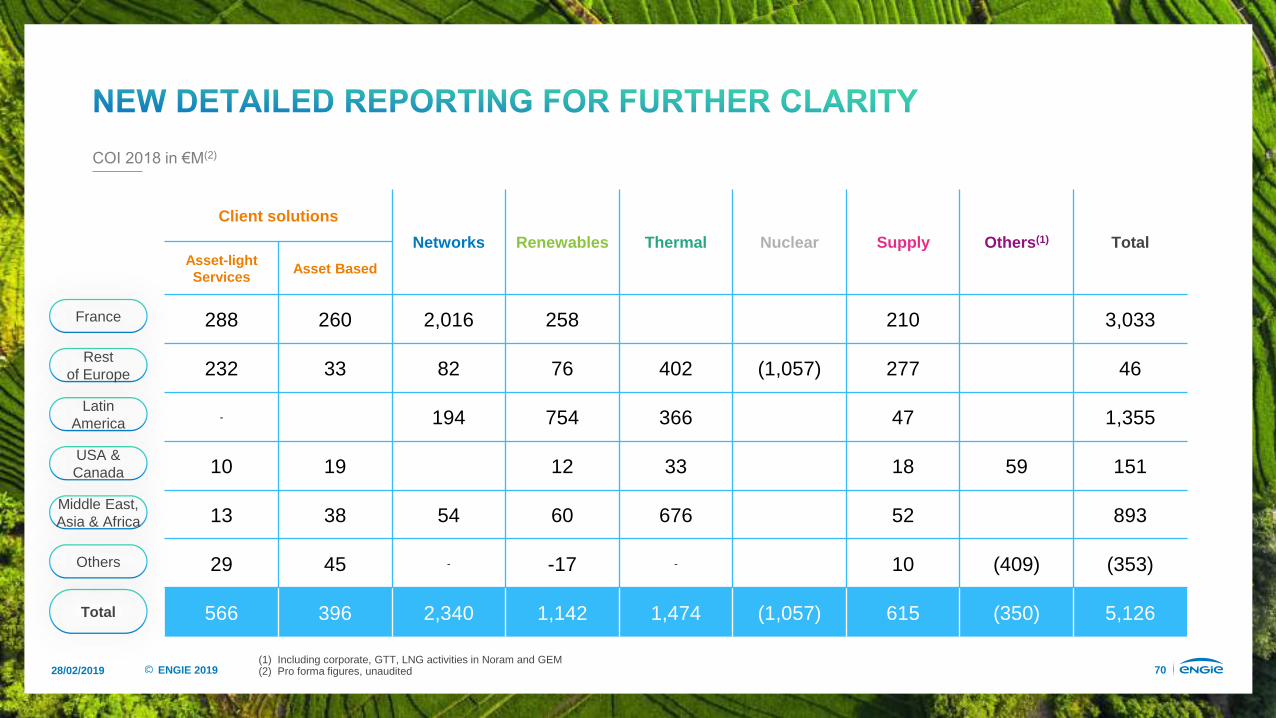
28/02/2019 70ENGIE 2019
Client solutions
Networks Renewables Thermal Nuclear Supply Others(1) TotalAsset-lightServices
Asset Based
288 260 2,016 258 210 3,033
232 33 82 76 402 (1,057) 277 46
- 194 754 366 47 1,355
10 19 12 33 18 59 151
13 38 54 60 676 52 893
29 45 - -17 - 10 (409) (353)
566 396 2,340 1,142 1,474 (1,057) 615 (350) 5,126
France
Rest of Europe
Latin America
USA & Canada
Total
Others
Middle East, Asia & Africa
COI 2018 in €M(2)
(1) Including corporate, GTT, LNG activities in Noram and GEM(2) Pro forma figures, unaudited

28/02/2019 71ENGIE 2019
2016-2018
2019
Client solutions
Low CO2 Power Generation
RES + Thermal contracted
Thermal Merchant
Global Networks
Infrastructures UpstreamOthers
Client solutions
Networks Renewables Thermal Nuclear Others1
Asset-lightservices
AssetBased
Supply
B2B supply + B2CB2B/B2T
services
B2B B2T B2C

28/02/2019 72ENGIE 2019
2016-2018
2019
Client solutions
Low CO2 Power Generation
RES + Thermal contracted
Thermal Merchant
Global Networks
Infrastructures Upstream
Client solutions
Networks Renewables Thermal Nuclear Others1
Asset-lightservices
AssetBased
Supply
B2B B2T B2C
Others

28/02/2019 73ENGIE 2019
2016-2018
2019
Client solutions
Low CO2 Power Generation
RES + Thermal contracted
Thermal Merchant
Global Networks
Infrastructures UpstreamOthers
Client solutions
Networks Renewables Thermal Nuclear Others(1)
Asset-lightservices
AssetBased
Supply
B2B B2T B2C
(1) Others include BUs’ corporate costs for 2015-2018; reallocated to business lines from 2019 onwards

28/02/2019 74ENGIE 201928/02/2019 74ENGIE 2019
KEY EXTERNAL & OPERATIONAL ASSUMPTIONS

28/02/2019 75ENGIE 2019
Market Prices (1) 58 54 50
2019 2020 2021
3642
46
Hedgedvol., %
77 62 31
FOREX Achieved PricesEuropean outright
Weather Conditions
OVER 2019-2021
EUR-USD @ ~1.20
EUR-BRL @ ~4.42
In €/MWh
Normalized conditions in France: gas distribution and energy supply
normalized hydro production
Hydrology in Brazil to improve by 2021
(1) Based on end december 2018 forward prices

28/02/2019 76ENGIE 2019
Full pass through of supply costs in French regulated gas & power
tariffs
Review of regulatory returns of our French
infrastructures business in 2020-21
30% in 2019 reducing by c. 200bps in 2021
NETWORKS NUCLEAR CONSUMER EFFECTIVE TAX RATE
Belgium nuclear availability
78%/79%/93%(1)
for 2019/2020/2021
CONTINGENCIES ON BELGIAN OPERATIONS
2020 2021€0.15bn €0.2bn
(1) Based on reactors availabilities as published on REMIT

28/02/2019 77ENGIE 201928/02/2019 77ENGIE 2019
MEDIUM TERM INDICATIVE EXPECTATIONS & GUIDANCE

28/02/2019 78ENGIE 2019
OPERATING CASH FLOW RISING WITHIN THE RANGE OF €6.5-8.5BN PER YEAR
€~20bn60% growth / development
CLIENT SOLUTIONS
RENEWABLES
NETWORKS
THERMAL & SUPPLY
€2.3 - 2.8bn
€4.0 - 5.0bn
€3.0 - 3.3bn
€1.0 - 1.2bn
CUMULATIVE €~11-12BN GROWTH CAPEX 2019-21(2)CUMULATIVE CAPEX 2019-21(1)
~€6.0bn
ASSET DISPOSALS 2019-21
(1) Excl. Synatom financial Capex(2) Nuclear investments are included in maintenance Capex, net of DBpSO proceeds

28/02/2019 79ENGIE 2019
NET COI IMPROVEMENT
€800M
BY 2021
COST REDUCTION REVENUE ENHANCEMENT
PROCUREMENTCategory management, pooling,
insourcing, spending centralization & standardization
DIGITALIZATION CRM, process engineering and automation, asset optimization
SHARED SERVICES CENTER
Coverage and optimization
INDUSTRIAL ASSETS PERFORMANCE IMPROVEMENT
Asset and networks availability, efficiency
IMPROVED & NEW SERVICES OFFERING

28/02/2019 80ENGIE 2019
6.5 - 8.5% Upper single digit3.5 - 6.0%
2018 20215.1
GREATER CAPITAL EFFICIENCY DRIVING OPERATING LEVERAGE
COI(2) CAGR€Bn
2018 20215.1
ROCEp
7.4%
(1)
EBITDA CAGR
2018 2021
(1) See FY 2018 appendices for detailed calculation(2) Including share in net income of associates

28/02/2019 81ENGIE 2019
11 - 14%
8 - 11%
• Revenue 2018-21 CAGR of 4-7%
• Addition of c. 9GW of capacity by 2021, increasingly client contracted
1.0
1.1
THERMAL (6)% - (3)%(1) • Continue optimizing portfolio, exit from a numberof assets over time1.1(1)
n.a. • Stem losses and COI neutrality by 2021(1.1)NUCLEAR
CLIENT SOLUTIONS
RENEWABLES
(4)% - (1)% • French regulatory return review in 2020-21, international growth opportunities2.3NETWORKS
BUSINESS 18 COI (€bn) COI CAGR 18-21 KEY DRIVERS
= • Flat outlook0.6SUPPLY
(1) excluding Glow
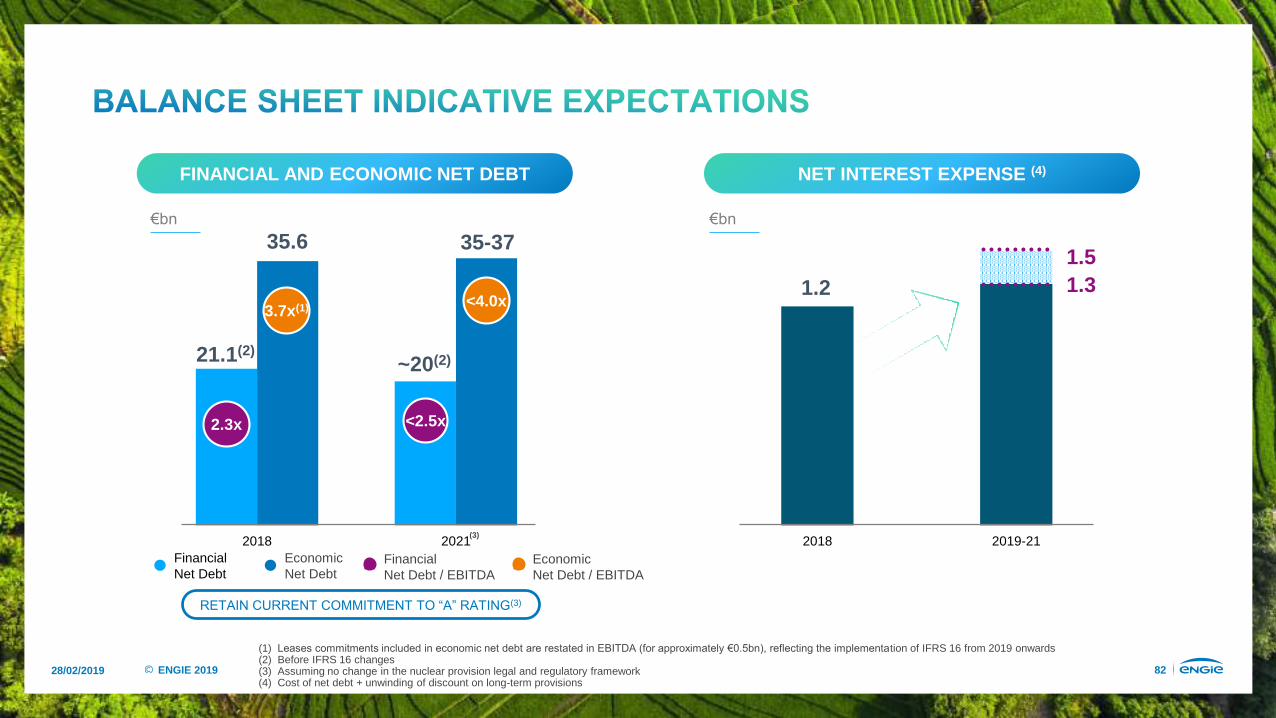
28/02/2019 82ENGIE 2019
2018 2019-21
1.31.5
1.2
2018 2021
21.1(2)~20(2)
35.6 35-37
FINANCIAL AND ECONOMIC NET DEBT NET INTEREST EXPENSE (4)
€bn €bn
Financial Net Debt
Economic Net Debt
Financial Net Debt / EBITDA
Economic Net Debt / EBITDA
<2.5x2.3x
3.7x(1) <4.0x
(3)
RETAIN CURRENT COMMITMENT TO “A” RATING(3)
(1) Leases commitments included in economic net debt are restated in EBITDA (for approximately €0.5bn), reflecting the implementation of IFRS 16 from 2019 onwards(2) Before IFRS 16 changes(3) Assuming no change in the nuclear provision legal and regulatory framework(4) Cost of net debt + unwinding of discount on long-term provisions

28/02/2019 83ENGIE 2019
2018 New policy2018 2021
65-75% Payout Ratio(1)€2.5bn €0.75
per share
NET RECURRING INCOME GROUP SHARE
DIVIDEND POLICY
(1) Dividend as a % of net recurring result group share

28/02/2019 84ENGIE 2019
DISCIPLINED CAPITAL ALLOCATION PRINCIPLES TO DELIVER ATTRACTIVE RETURNS
GEOGRAPHIC REFOCUS TOWARDS 20 COUNTRIES AND 30 EMERGING MARKET URBAN AREAS
NRIGS GROWTH OF 7-9%
ATTRACTIVE DIVIDEND POLICY: 65-75% PAYOUT RATIO(1)
(1) Out of Net Recurring Income group share

CAPITAL MARKETS DAY
February 28, 2019

ShankarKRISHNAMOORTHYExecutive Vice President
INDUSTRY GROWTH DRIVERS AND SEGMENTATION CRITIQUE
28/02/2019 87ENGIE 2019
WHERE IS THE POWER SECTOR GOING?

28/02/2019 88ENGIE 2019
20 000
25 000
30 000
35 000
40 000
45 000
2017 2025 2030 2035 2040
(TWh)
+ 45%Power generation
CAGR: 1.6%
45,000
40,000
35,000
30,000
25,000
20,000
Source: IEA, World Energy Outlook, Sustainable Development Scenario
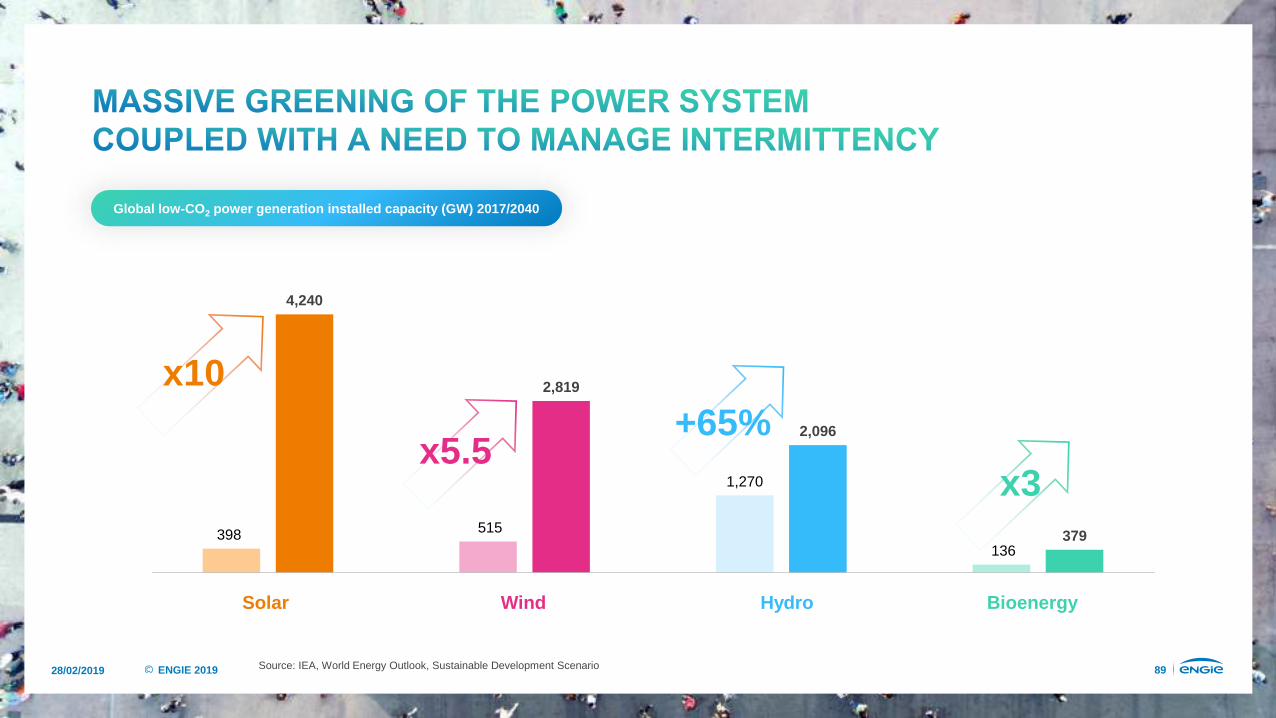
28/02/2019 89ENGIE 2019
398 515
1,270
136
4,240
2,819
2,096
379
0
500
1 000
1 500
2 000
2 500
3 000
3 500
4 000
4 500
Solar Wind Hydro Bioenergy
Global low-CO2 power generation installed capacity (GW) 2017/2040
x10+65%
x5.5x3
Source: IEA, World Energy Outlook, Sustainable Development Scenario

28/02/2019 90ENGIE 2019
Electricity generation CAGR: 2%
(GW)6 000
7 000
8 000
9 000
10 000
11 000
12 000
13 000
14 000
15 000
16 000
20 000
25 000
30 000
35 000
40 000
45 000
50 000
2017 2025 2030 2035 2040
(TWh)
+ 45%Power generation
CAGR: 1.6%
+ 100%Power capacity
CAGR: 3.3%
65,000
55,000
45,000
35,000
25,000
15,000
13,000
12,000
11,000
10,000
9,000
8,000
Source: IEA, World Energy Outlook, Sustainable Development Scenario
28/02/2019 91ENGIE 2019
Complex segments emerging that needto consider more than price to be successful
Phenomenal growth
Lower barriers to entry

28/02/2019 92ENGIE 2019
WHAT’S HAPPENINGON THE CLIENT SIDE?

28/02/2019 93ENGIE 2019
LEDs
5xas efficient as incandescent light bulbs
50%moreefficient than individual heating systems
30%moreefficient than standard ones
3x as efficient as they were 20 years ago
50%moreefficient than individual units
25%moreefficient than separateelectricity plus boilers
Air Conditioners District Cooling Cogeneration Units
District HeatingIn-Home Condensation Boilers
Sources: DoE (US), Lennox, UN, IEA, ADEME, Carbon Trust

28/02/2019 94ENGIE 2019
On-Site Energy
Generation & Storage DBFMO*
Energy Performance
Contract
Intelligent Building Energy
Management & Automation
Strategic Portfolio Guidance
Large Off-Site Wind & Solar Procurement
RetailChoice
Procurement
Building Retrofitting
Energy AuditLighting
RetrofittingTraditional energyefficiency solutions
Energy as-a-service solutions
Source : Navigant Research(1) Design, Build, Finance, Maintain, Operate

28/02/2019 95ENGIE 2019
Emergence of “as a service” models
Faster phasing out of energy-consuming equipment

28/02/2019 96ENGIE 2019
WHAT ARE THE WINNING "AS A SERVICE"
BUSINESS MODELS?

28/02/2019 97ENGIE 2019
BackupPower
IncreasedPV Self-
Consumption
DemandCharge
Reduction
Time-of-UseBill
Management
BlackStart
EnergyArbitrage Spin
Non-SpinReserve
FrequencyRegulation
VoltageSupport
ResourceAdequacy
TransmissionCongestion
Relief
TransmissionDeferral
DistributionDeferral
Batteries can provideup to 13 services
to 3 stakeholder groups
Source: Rocky Mountain Institute
28/02/2019 98ENGIE 2019
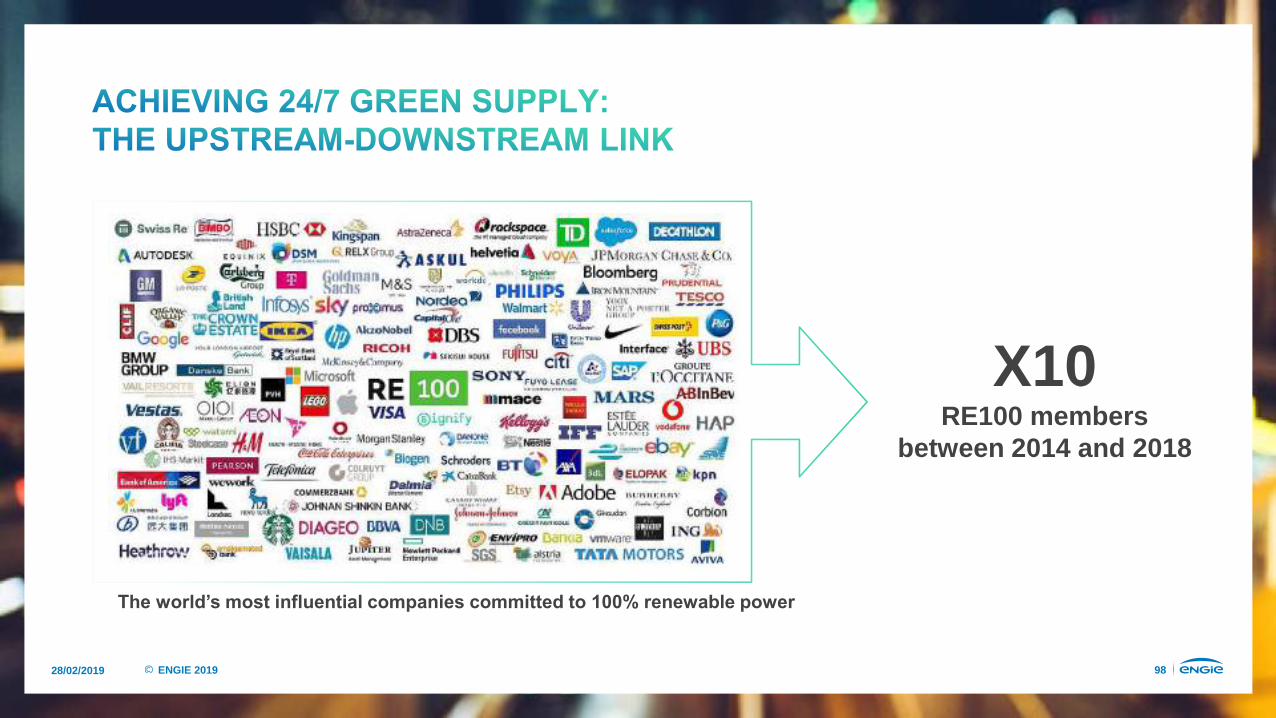
X10RE100 members
between 2014 and 2018
The world’s most influential companies committed to 100% renewable power
28/02/2019 99ENGIE 2019
Value in upstream-downstream link
Value in being able to provide integrated solutions

28/02/2019 100ENGIE 2019
WILL WE MAKE OUR PLANET GREAT AGAIN WITH GAS?

28/02/2019 101ENGIE 2019
GLOBAL GAS DEMAND (BCM) 2017/2040
+42%+12%
GLOBAL GAS POWER INSTALLED CAPACITY (GW) 2017/2040
3,752
4,184
3 500
3 600
3 700
3 800
3 900
4 000
4 100
4 200
4 300
1,695
2,406
0
500
1 000
1 500
2 000
2 500
3 000
Source: IEA, World Energy Outlook, Sustainable Development Scenario
28/02/2019 102ENGIE 2019
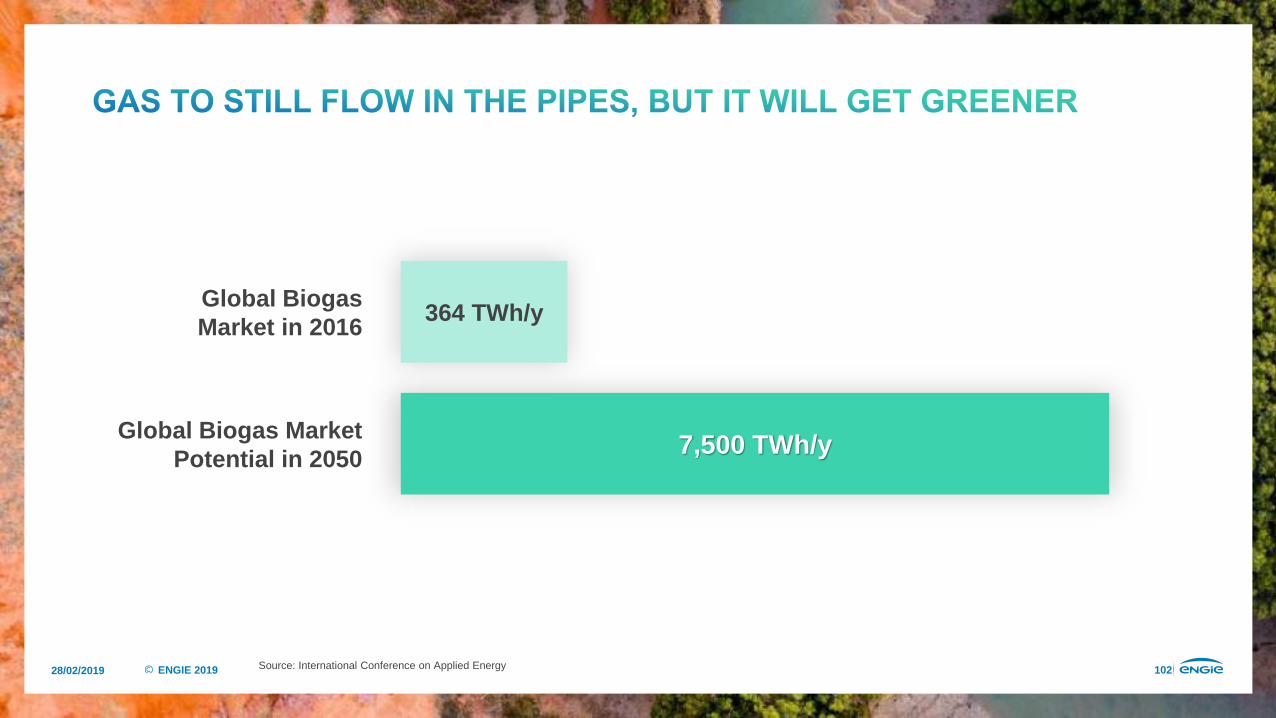
364 TWh/y
7,500 TWh/y
Global BiogasMarket in 2016
Global Biogas MarketPotential in 2050
Source: International Conference on Applied Energy

28/02/2019 103ENGIE 2019
Feedstock for industry
Energy for industry
Heat & Power forbuildings
Power generation
Other
Transportation
Small-scale industrial uses
Large-scale industrial uses
Global Hydrogen Marketin 2018
Global Hydrogen Marketin 2050incl.75% green H2
550 Mtpa55 Mtpa x10
Source: Hydrogen Council

28/02/2019 104ENGIE 2019
Greener gas to still flow in the pipes, and will be more integrated with power

28/02/2019 105ENGIE 2019
Integrated Upstream-
DownstreamModels
Tailor-MadeGreen Energy
Solutions
Cookie-Cutter Renewable
Plants
SeparatedUpstream & Downstream
Models
Risk Sharing, Complexity &
Long-TermCommitment
Short-TermService
Contracts
CAPITAL MARKETS DAY
February 28, 2019

Paulo ALMIRANTEExecutive Vice President Chief Operating Officer
SOLID EARNINGS COMBINED WITH OPTIONALITY VALUE

28/02/2019 108ENGIE 2019
Gas and Power
Networks
Thermal Contracted
Energy Markets Europe

28/02/2019 109ENGIE 2019
STRONG REGULATED NETWORKS AND
CONTRACTED GENERATION

28/02/2019 110ENGIE 2019
Global Presence 2018
A LEADING POSITION IN GAS NETWORKS IN FRANCE,COMPLETED BY A GROWING INTERNATIONAL PRESENCE
OTHER
€0.1bnRAB/CE 2018(1)
COI 2018
COI 2021
€2.3bn
€2.0-2.2bn
LATAM
€1.3bnEUROPE
€28.7bn
90% of RAB/CE is located in France
Networks accounted for 45% of Group COI in 2018
Zero-CarbonTransition
"as a service"
Tailor-madeHigh-techFinanced
RENEWABLESNETWORKS
GENERATION & SUPPLY
CLIENT SOLUTIONS
NETWORKSAttractive returns & cash flows
(1) RAB/CE 01/01/18 @ 100%
28/02/2019 111ENGIE 2019
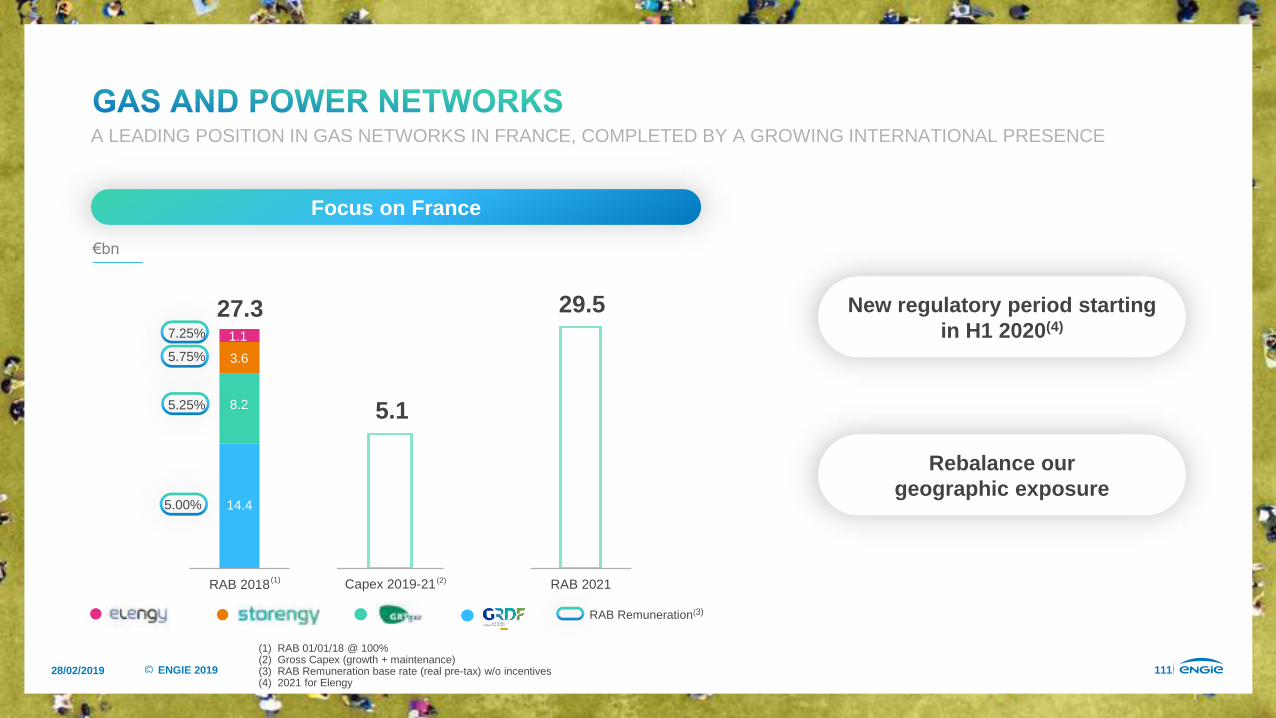
Focus on France
A LEADING POSITION IN GAS NETWORKS IN FRANCE, COMPLETED BY A GROWING INTERNATIONAL PRESENCE
5.1
Capex 2019-21
29.5
RAB 2021
27.3
RAB 2018
8.2
14.4
1.1
5.25%
5.00%
5.75%
7.25%
3.6
(2)
RAB Remuneration(3)
€bn
New regulatory period starting in H1 2020(4)
Rebalance our geographic exposure
(1)
(1) RAB 01/01/18 @ 100%(2) Gross Capex (growth + maintenance)(3) RAB Remuneration base rate (real pre-tax) w/o incentives(4) 2021 for Elengy

28/02/2019 112ENGIE 2019
under negotiation4,500 km
auctions in Brazil6,000 km/y
under construction1,000 km
O&MIndustrial Expertise
~100% Engie
LTC
OWNERSHIPFinancialplatform
<50% Engie
~ RAB
Opportunistic approach
Complex projects with industrial expertise
Financial discipline is key
Zero CarbonTransition
"as a service"
Tailor-madeHigh-techFinanced
RENEWABLESNETWORKS
GENERATION & SUPPLY
CLIENT SOLUTIONS
NETWORKSGrowth in dynamic development markets
INTERNATIONAL GROWTH OPPORTUNITIES LEVERAGING OUR RECOGNIZED TRACK RECORD AS AN INDUSTRY PLAYER

28/02/2019 113ENGIE 2019
INTERNATIONAL GROWTH OPPORTUNITIES LEVERAGING OUR RECOGNIZED TRACK RECORD AS AN INDUSTRY PLAYER
€0.3bnGreen gas related investments
in networks 2019-2021
30 MWGrid scale storage
Operation & construction
Networks in the Energy Transition
Power and gas networks will continue to grow
We are an industrial partner of choice
NETWORKSPriority to convert gas infrastructure to green gas
Zero CarbonTransition
"as a service"
Tailor-madeHigh-techFinanced
RENEWABLESNETWORKS
GENERATION & SUPPLY
CLIENT SOLUTIONS

28/02/2019 114ENGIE 2019
Global presence 2018(1)
LIMITED PPA TERMINATION IMPACT BEFORE 2025 WHILST WE CONTINUE TO REDUCE OUR EXPOSURE TO COAL
Gas
OTHER
4.5 GW
2.3 GW
LATAM
1.9 GW
1.9 GWCoal
€0.8bn
€0.5-0.6bn
COI 2018(2)
COI 2021
Increase performance and digitalization
COI reduction related to divestments
MIDDLE EAST
30.1 GW
(1) Capacity 31/12/18 @ 100%(2) Excluding Glow contribution in 2018 and after allocation of multi-Métiers BUs’ corporate costs
28/02/2019 115ENGIE 2019
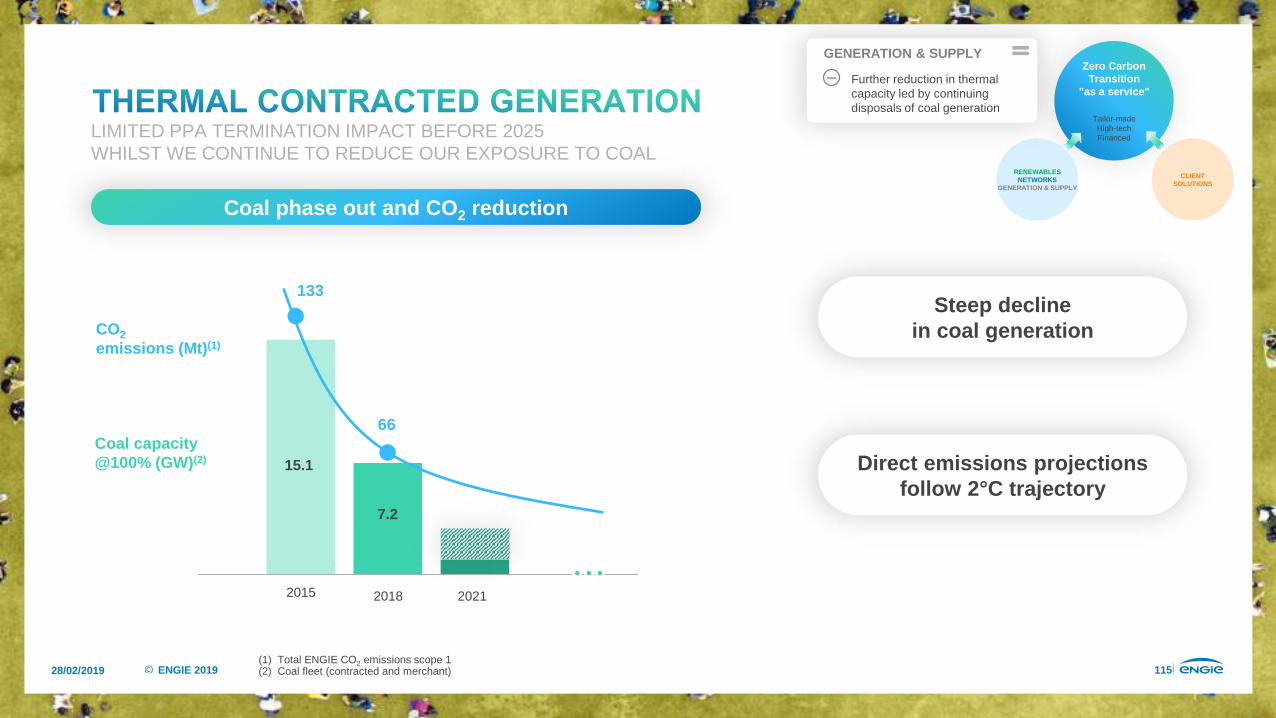
LIMITED PPA TERMINATION IMPACT BEFORE 2025WHILST WE CONTINUE TO REDUCE OUR EXPOSURE TO COAL
7.2
15.1
133
66
2015 2018 2021
Coal capacity @100% (GW)(2)
CO2emissions (Mt)(1)
Coal phase out and CO2 reduction
Steep decline in coal generation
Direct emissions projections follow 2°C trajectory
Zero CarbonTransition
"as a service"
Tailor-madeHigh-techFinanced
RENEWABLESNETWORKS
GENERATION & SUPPLY
CLIENT SOLUTIONS
GENERATION & SUPPLY
Further reduction in thermal capacity led by continuing disposals of coal generation
(1) Total ENGIE CO2 emissions scope 1 (2) Coal fleet (contracted and merchant)
28/02/2019 116ENGIE 2019
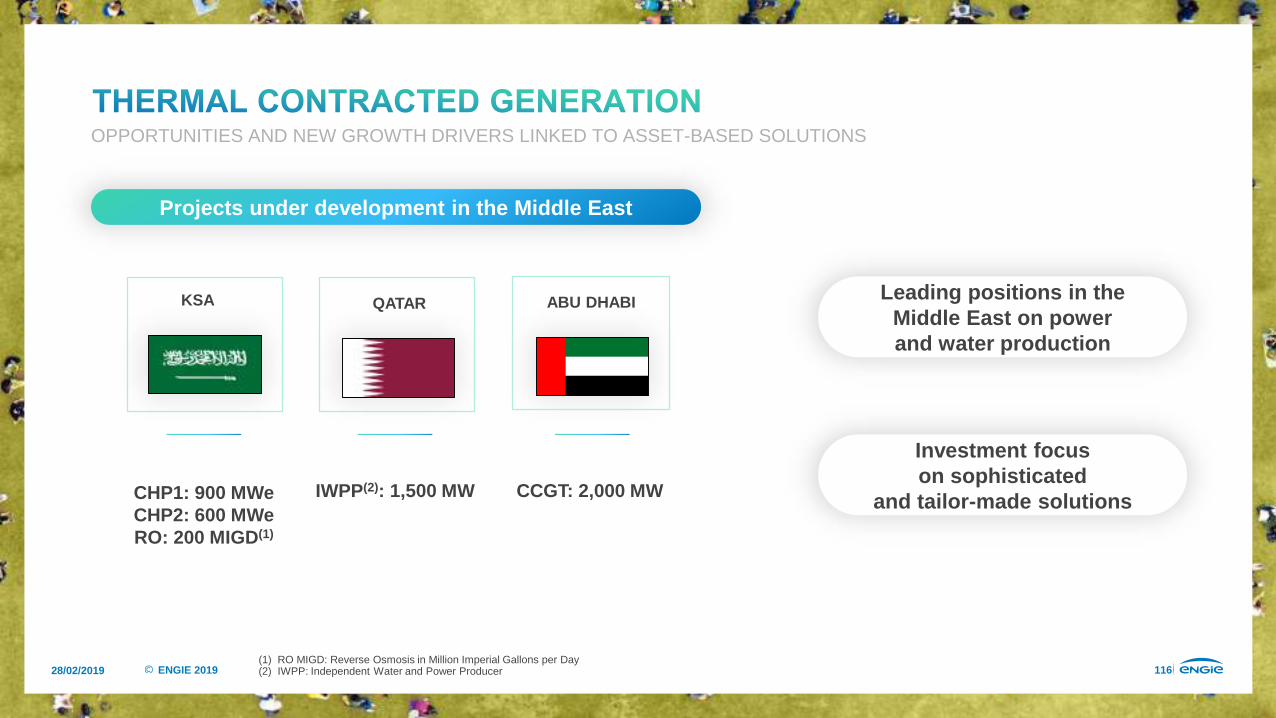
Projects under development in the Middle East
OPPORTUNITIES AND NEW GROWTH DRIVERS LINKED TO ASSET-BASED SOLUTIONS
Leading positions in the Middle East on power and water production
Investment focus on sophisticated
and tailor-made solutionsCCGT: 2,000 MW IWPP(2): 1,500 MWCHP1: 900 MWeCHP2: 600 MWeRO: 200 MIGD(1)
KSA QATAR ABU DHABI
(1) RO MIGD: Reverse Osmosis in Million Imperial Gallons per Day(2) IWPP: Independent Water and Power Producer

28/02/2019 117ENGIE 2019
PRODUCTS KEY FIGURES
Opportunities and new growth drivers linked to asset-based solutions
OPPORTUNITIES AND NEW GROWTH DRIVERS LINKED TO ASSET-BASED SOLUTIONS
Long-term partnerships with energy intensive industrials in Europe
Industrial opportunities linked to Energy Efficiency
Security of supply and price visibility “as a service”
partnerships in 3 countries
14CHP
CCGT
Waste to Power
Conversion of siderurgical gases
electrical power
2 GW
steam delivery
1,600 t/h

28/02/2019 118ENGIE 2019
DELIVERING COMPETITIVE PRODUCTS FROM ENERGY MARKETS TO CUSTOMERS

28/02/2019 119ENGIE 2019
Thermal Merchant Europe
21 GW capacity
€0.3bn COI 2018
Gas Midstream
3rd in Europe
400 TWh gas portfolio
€0.3bn COI 2018
NuclearMerchant
Generation
6.4 GW capacity(1)
€(1.1)bn COI 2018
Supply B2B/B2C
304 TWh Gas
124 TWh Power
22M B2C contracts
€0.5bn(2) COI 2018
Energy Management
9,000 TWh Gas
1,600 TWh Power
(1) Net capacity o/w 5.9 GW operated in Belgium / (2) excl. €0.1bn for rest of the world

28/02/2019 120ENGIE 2019
AFTER SIGNIFICANT DIFFICULTIES IN 2018, WE ARE STABILIZING OUR OPERATIONS
>4031
20212018
Stabilization of operations
Planning adjusted following recent experience
Contingencies included in financial planning
Total nuclear production (TWh)Availability in Belgium (%)LTO(1) works will finish by 2020
€(1.1)bn Positive COI by 2021
COI 2018
79
2016 2017 2018 202120202019
77
52
78
September 2019
April 2020
February2020
August 2019
Doel 1
Doel 2
Tihange 1
LTO outages
October2019
May 2020
Reinforced project management and execution capabilities
Zero CarbonTransition
"as a service"
Tailor-madeHigh-techFinanced
RENEWABLESNETWORKS
GENERATION & SUPPLY
CLIENT SOLUTIONS
GENERATION & SUPPLYBack to normal operations for nuclear
(1) LTO: Long-Term Operations (life extension)

28/02/2019 121ENGIE 2019
Doel 3 and Tihange 2phased out
Start D&D
2022-23 2025 Beyond 2025
Doel 1, Doel 2 and Tihange 1phased out
Doel 4 and Tihange 3possibly extended
Future options for after 2025 will be defined by the Belgian authorities
ANTICIPATING THE NEXT PHASES

28/02/2019 122ENGIE 2019
THE TRANSFORMATION OF A MERCHANT FLEET FROM A NEGATIVE CONTRIBUTION TO PROFITABILITY
A reshaped, flexible and resilient portfolio
2821
2015 2018
Capacity GW @ 100% Reduce carbon exposure Mt CO2
2015 2018
5034
Operational performance Costs savings 2015-2018
€-180m O&M costs
-34% SG&A costs
-32% unplanned outages
-41% trips
COI 2015(1)
COI 2018(1)
€(0.05)bn
€0.3bn
(1) Excluding (i) the liquidating damages of Wilhelmshaven and Rotterdam in 2015 and 2018 and (ii) the contributions of Rosen (Italy),UK and Polish assets which have been sold or closed in 2016-17

28/02/2019 123ENGIE 2019
MULTIPLE EVENTS
HIGHER CO2 PRICES
HIGHER VOLATILITY
Q4-2016: Nuclear issues FR
2016 2017 20182015
Jan-2017: Cold snap
Q4-2017: Nuclear issues FR
Q4-2018: Nuclear issues BE
OPPORTUNITY TO CAPTURE VALUE ON A REGULAR BASIS
(1) Efficiencies used for clean fuel costs: 50% (gas) and 36% (coal)
Spot power prices 2015-2018
TIGHT SUPPLY DEMAND
Clean Coal CostClean Gas CostPower DEPower FR
Year-ahead forward price levels1
2016 2017 20182015
2015-18 evolution of CSS and CDS
0
70
€/M
Wh

28/02/2019 124ENGIE 2019
Gas and Power
Networks
Thermal Contracted
Energy Markets Europe
DELIVERING EARNINGS STABILITY AND VISIBILITY
CAPTURING OPTIONALITY VALUE

CAPITAL MARKETS DAY
February 28, 2019
GwenaelleHUETChief Executive Officer, Business Unit France Renewables
DEVELOPER AND OPERATOROF LARGE-SCALE RENEWABLES

28/02/2019 127ENGIE 2019
WHAT WE HAVE ACHIEVEDSO FAR
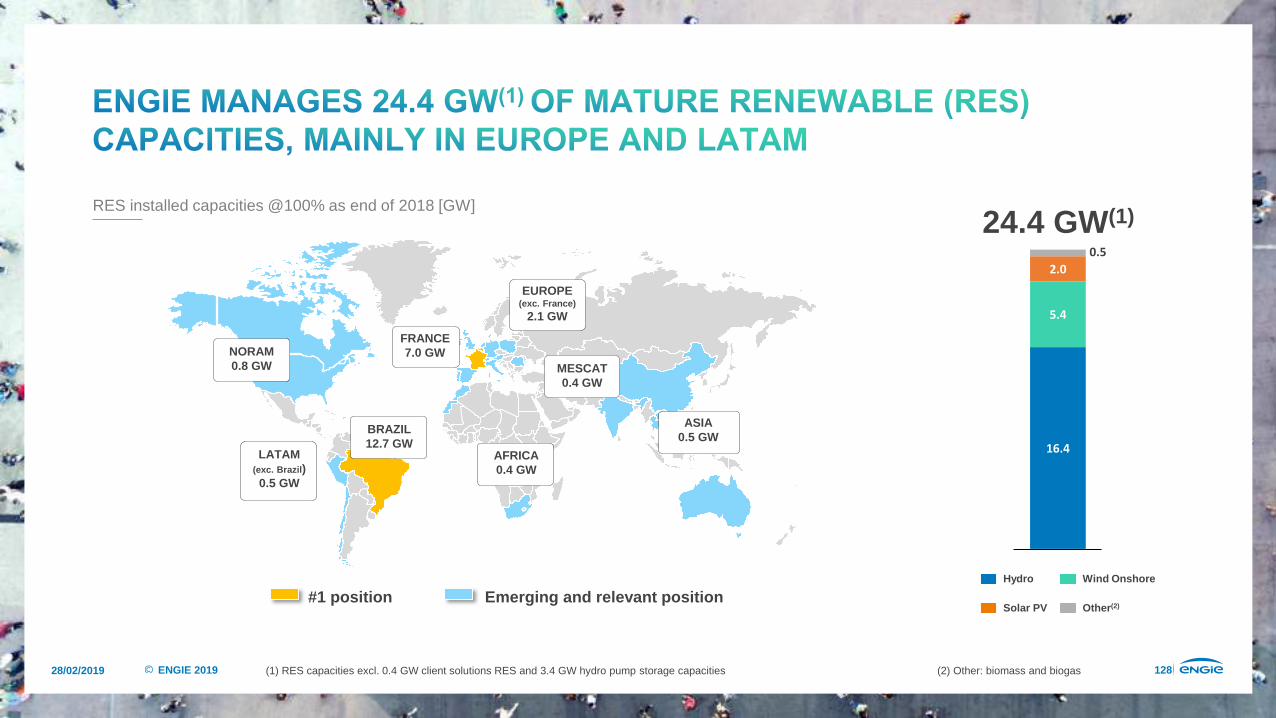
28/02/2019 128ENGIE 2019
24.4 GW(1)
(1) RES capacities excl. 0.4 GW client solutions RES and 3.4 GW hydro pump storage capacities
#1 position Emerging and relevant position
NORAM0.8 GW
LATAM(exc. Brazil) 0.5 GW
ASIA0.5 GW
EUROPE(exc. France)
2.1 GW
MESCAT0.4 GW
AFRICA0.4 GW
BRAZIL 12.7 GW
FRANCE7.0 GW
Hydro Wind Onshore
Solar PV Other(2)
16.4
5.4
2.0
0.5
RES installed capacities @100% as end of 2018 [GW]
(2) Other: biomass and biogas

28/02/2019 129ENGIE 2019
Advanced Development
9-12 GW
>2023
2021-2023
2019-2021
Expected COD (Commercial Operation Date)
Secured(2)
& Under Construction
6 GW
Early-Stage Development
50 GW
Onshore wind
Solar
Offshore wind
Other(2)
Target 2021: ~9 GW
50%
28%
20%2%
49%
39%
9% 3%
(1) Secured = awarded (2) Other: biomass and biogas, geothermal

28/02/2019 130ENGIE 2019
0,0
0,5
1,0
1,5
2,0
2,5
3,0
3,5
2019 - 20212016 - 2018
Average installed RES capacity [GW/yr]ENGIE vs. competitors (European and US RES developers)
3.5
3.0
2.5
2.0
1.5
1.0
0.5
0

28/02/2019 131ENGIE 2019
Development
Engineering& Construction
Partial Sell-Down
Operation & Maintenance (O&M)
Energy Management
Customer Relations
Project origination and development with local teams
Strong engineering and business experience and expertise
Financial platforms to industrialize DBpSO model
Operational excellence in O&M and strategic sourcing
Expertise of internal teams, able to shape complex productsand manage risk of mixed assets to design corporate power purchase agreements
Based on ENGIE’s portfolio of more than 30,000 corporate clients and 1,000 large cities

28/02/2019 132ENGIE 2019
WHAT THE MARKET TELLS US

28/02/2019 133ENGIE 2019
Microgrid Market(2):€15.2bn today,
x2 by 2022, x3 by 2025
€250bn/yrworldwide(1)
Continuous investment across geographies
50% in Europe,LATAM & US
(2) Global Data, Naviguant Research, BIS Research
(1) IEA World Energy Outlook “Current Policies” Scenario, IEA World Energy Investment 2018
Middle Term2023
Long Term>2026
With more sophisticated technologies
GeothermalBiomethane
Fixed wind offshore
Microgrids Floating wind offshoreGreen hydrogen
Short Term2021
Grid scale storage

28/02/2019 134ENGIE 2019
StateSubsidies
RES assets
Corporate& Cities
Corporate& Cities
RES assets
StateSubsidies
New contracts in 2018 Middle-term evolution of new contracts
PPA(1) as produced PPA(1) as consumed (24/7)Integrated RES through
microgrids or grid storage
Long-term evolution: more sophisticated contracts with clients
(1) PPA : Power Purchase Agreement

28/02/2019 135ENGIE 2019
OUR STRATEGIC INTENTIONS

28/02/2019 136ENGIE 2019
RENEWABLES50% new RES projects dedicated to specific clients by 2021
Commoditized renewables
Zero-CarbonTransition
"as a service"
Tailor-madeHigh-techFinanced
RENEWABLESNETWORKS
GENERATION & SUPPLYCLIENT SOLUTIONS

28/02/2019 137ENGIE 2019
FASTER GROWTH
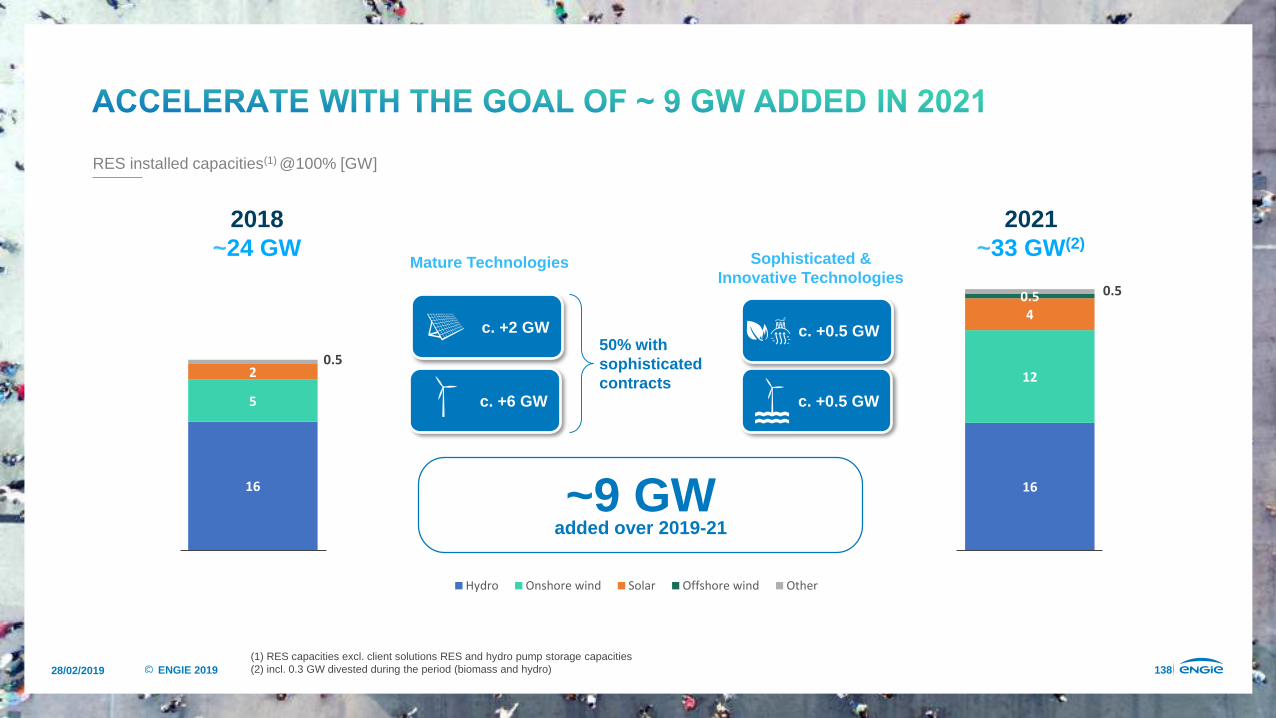
28/02/2019 138ENGIE 2019
RES installed capacities(1) @100% [GW]
(1) RES capacities excl. client solutions RES and hydro pump storage capacities(2) incl. 0.3 GW divested during the period (biomass and hydro)
16 16
5
122
40.5
0.5
0.5
Hydro Onshore wind Solar Offshore wind Other
c. +2 GW
c. +6 GW
2021~33 GW(2)
2018~24 GW
~9 GWadded over 2019-21
c. +0.5 GW
c. +0.5 GW
Mature Technologies
50% withsophisticatedcontracts
Sophisticated & Innovative Technologies

28/02/2019 139ENGIE 2019
63%
6%
Hydro Wind Onshore Solar
€1.15bn
Other
€1.5 - 1.6bn
COI [€bn]
8-11% CAGR 2018 2021
3%
28%

28/02/2019 140ENGIE 2019
HIGHER VALUE

28/02/2019 141ENGIE 2019
• Companies & cities PPA • Only commoditized renewables
• Innovative and sophisticated technologies • Development in countries not part of the Group’s
geographical priorities
Less AttractiveVery Attractive
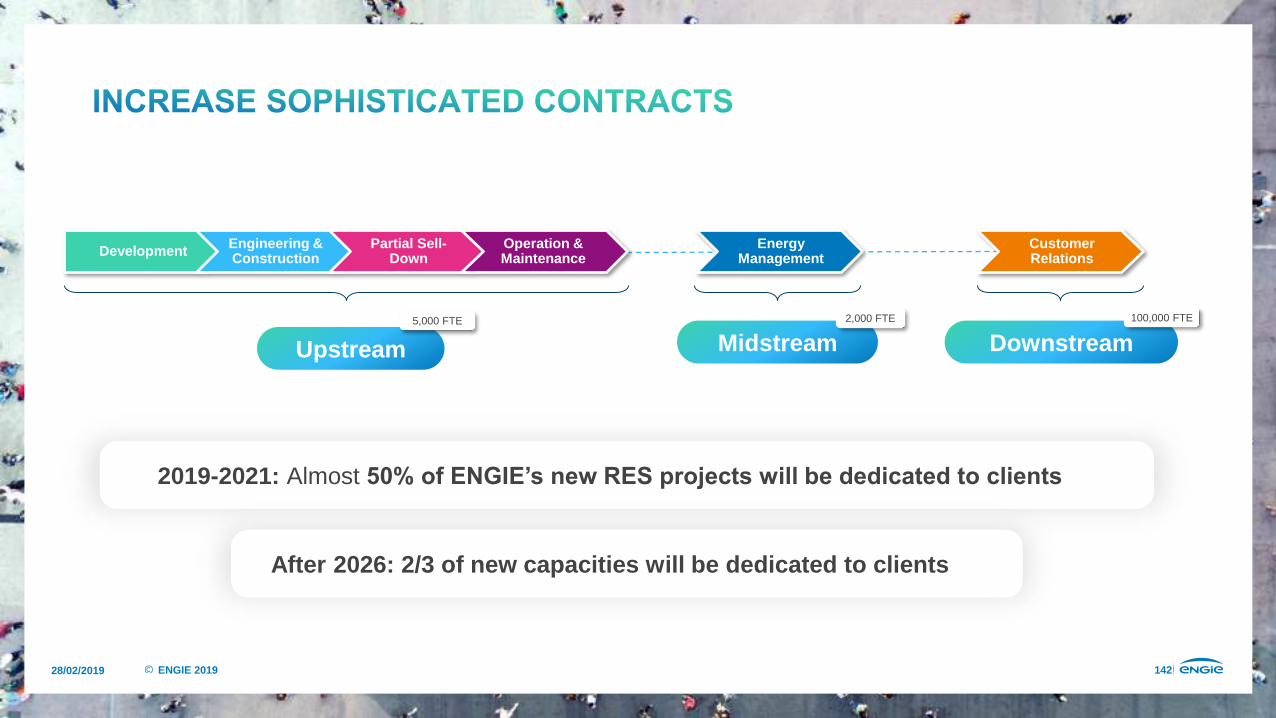
28/02/2019 142ENGIE 2019
Upstream Midstream
Development Engineering & Construction
Partial Sell-Down
Operation & Maintenance
Energy Management
Customer Relations
Downstream5,000 FTE 2,000 FTE 100,000 FTE
2019-2021: Almost 50% of ENGIE’s new RES projects will be dedicated to clients
After 2026: 2/3 of new capacities will be dedicated to clients

28/02/2019 143ENGIE 2019 * Under construction
Large- and small-scale territorialgreen H2 projects
Biomethane(market share target of 15-20%)
GREEN GAS
Moray* (950 MW)
Seamade* (487 MW)
Treport & Noirmoutier (2 X 496 MW)
Wind Float Atlantic* (25 MW)
Eoliennes Flottantes du Golfe du Lion (25 MW)
Fixed Floating
FIXED & FLOATING OFFSHORE WIND
Lifou(wind, solar, biofuel & storage)
MICROGRIDS
Semakau island(microgrid-based hydrogen storage system)
28/02/2019 144ENGIE 2019
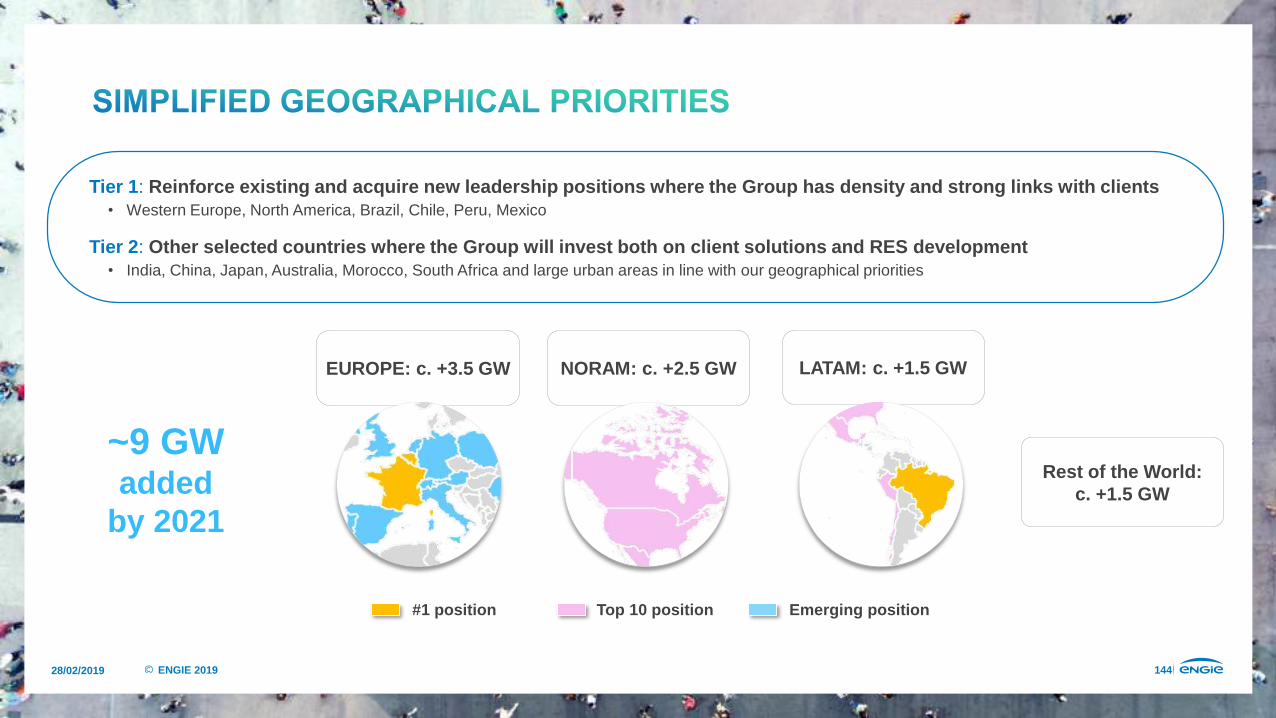
Tier 1: Reinforce existing and acquire new leadership positions where the Group has density and strong links with clients• Western Europe, North America, Brazil, Chile, Peru, Mexico
Tier 2: Other selected countries where the Group will invest both on client solutions and RES development• India, China, Japan, Australia, Morocco, South Africa and large urban areas in line with our geographical priorities
NORAM: c. +2.5 GW
#1 position Top 10 position Emerging position
Rest of the World:c. +1.5 GW
LATAM: c. +1.5 GW
~9 GW added
by 2021
EUROPE: c. +3.5 GW

28/02/2019 145ENGIE 2019
Development & construction risk
Keep a stake & monetize NPV
O&M, Energy management & asset optimization(incl. repowering)
+ + =
• Win more projects
• Increase ENGIE IRR
• Share risk
• Accelerate capital rotation to fuel dynamic growth
• Keep the industrial side of the assets
1.1 GW
3 GW/yr
2018 2019-2021
Development Engineering & Construction Partial Sell Down Operation &
MaintenanceEnergy
ManagementCustomer Solutions
Financial Investor
Large marketwith continuous
development
Competitive capital availability
Large pipeline, recurring projects and acceleration
of development
RES capacity addition
Delta cost of capital
Global W&S installed capacity
ENGIE existingpipeline

28/02/2019 146ENGIE 2019
0
50
100
CAPEX Debtfinancing
Equityinjection
Sell down
Recurrent revenues:
dividend + O&M (margin: 8-15%)
NPV: 50-250 k€/MW
Normative 10 MW wind onshore or solar project (competitive tender)
with 70%-80% gearing and 80% sell-down
IRR Buy & Hold = CoEIRR DBpSO = CoE +4%
COD 10 y. 20 y.
EBITDA[k€/MW]
Close to 80% of value creation secured 1 year after COD (DBpSO margin)50-250

28/02/2019 147ENGIE 2019
Capex W+S 2016-18: €3.7 bn
GW W+S added: 2.8 GWCapex W+S 2019-21: ~€1.7 bn
GW W+S added: ~8.0 GW
2018 2021
2018@100% 2018@equity share
Onshore wind Solar
2021@100% 2021@equity share
Onshore wind Solar
~ 50%
~ 40%
~7.5
Average equityshare
58%
58%
Average equityshare
7.4
4.3
~16
Installed W+S capacity [GW]

28/02/2019 148ENGIE 2019
2018 2021
ROCEp 9.6%
2019-2021gross Capex
2019-2021Capex net DBpSO
€~9bn €2.3 - 2.8bn
Increase Value Creation
Increase Capex Optimization
CAPEX
low single-digit improvement

28/02/2019 149ENGIE 2019
BETTER IMPACT

28/02/2019 150ENGIE 2019
100 MW wind
276 MW wind in Kansas
Other Customers+ Distributed Solar:
~ 50 MW
Upstream Midstream Downstream
176 MW wind
Target (USA)

28/02/2019 151ENGIE 2019
160 MW15 y.
49 MW15 y.
30 MW15 y.
100 MW15 y.
208 MW25 y.
30 MW12 y.
50 MW15 y.
Our goal is to become a global leader in Corporate PPA

28/02/2019 152ENGIE 2019
CONCLUSION

28/02/2019 153ENGIE 2019
Installed RES capacity @ 100% [GW]
2018 2019 2020 2021 2022 2023 2024 2025 2026
24.4 GW
~ 33 GW
2018
2021
2023
42 GW
40 GW
64 GW
52 GW
2026
70
60
50
40
30
20
High scenario
Low scenario
Middle Term Long TermShort Term

28/02/2019 154ENGIE 2019
Faster Growth Higher Value Better Impact
Goal of ~9 GW added over2019-21
Tier 1 position in terms of development
COI CAGR 2018-21: 8-11%
COI 2021: €1.5 - 1.6bn
Corporate PPA Leader
• 2019-21: Almost 50% of new RES projects linked to client solutions
• Become a leader in Corporate PPA with 2/3 of new capacities dedicated to clients after 2026
Become a leader in selected sophisticated technologies
• Offshore wind
• Green gases
Growth Capex 2019-21: €2.3 - 2.8bnROCEp: increase in 2021 vs 2018
Integrated zero-carbon solutions delivered “as a service”
Better access to energythrough microgrids andcost-efficient renewables

CAPITAL MARKETS DAY
February 28, 2019

Franck BRUEL Executive Vice President, France BtoB and Hydrogen
CLIENT SOLUTIONS PROVIDER

28/02/2019 157ENGIE 2019
FRANCEBELGIUM
ITALYNETHERLANDS
#1Top
5
UKGCC
SWITZERLANDSINGAPORE
CHILEMOROCCO
SOUTH AFRICA
26 countries
worldwide in cooling
worldwide in heating
worldwide in technical installation
worldwide in EV charging stations
28/02/2019 158ENGIE 2019
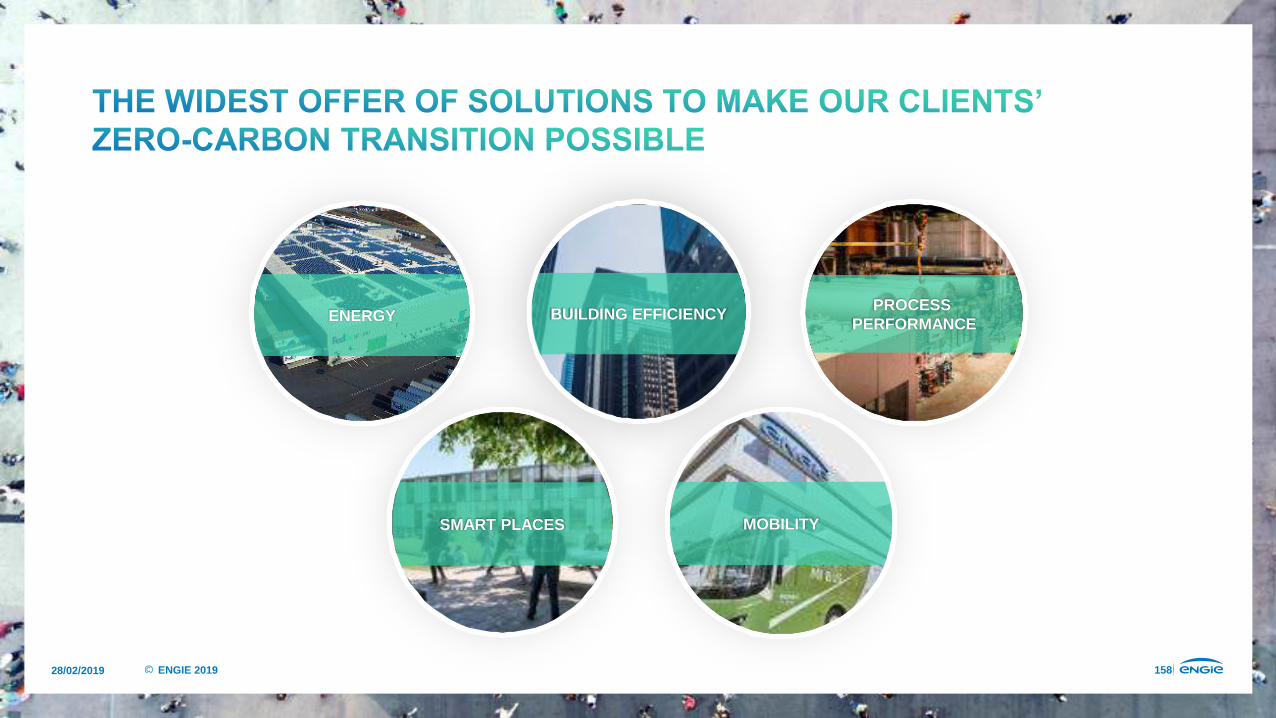
BUILDING EFFICIENCYENERGY PROCESS
PERFORMANCE
SMART PLACES MOBILITY

28/02/2019 159ENGIE 2019
Energy Supply
Operation & Maintenance
InstallationInvestmentsDesign
& Engineering
RESOURCE MANAGEMENT
DATA SCIENCE& SMART CITIES
MECHANICS & ROBOTICS
ENGINEERING
HEATING & COOLING
FACILITY MANAGEMENT
ELECTRICAL ENGINEERING
DISTRIBUTED ENERGY
100,000 experts
on site
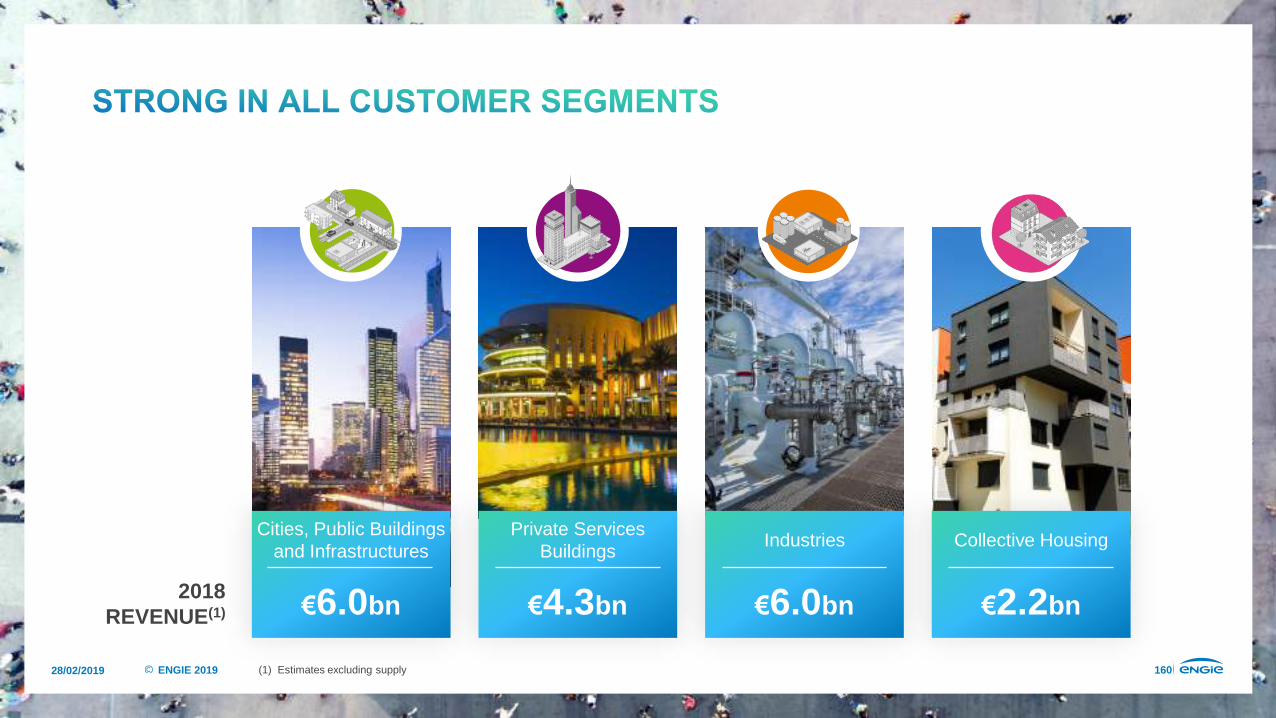
28/02/2019 160ENGIE 2019 (1) Estimates excluding supply
2018 REVENUE(1) €6.0bn
Industries
€6.0bn
Cities, Public Buildings and Infrastructures
€4.3bn
Private Services Buildings
€2.2bn
Collective Housing

28/02/2019 161ENGIE 2019
TECHNOLOGY SHARE IN BUILDING VALUE
CARBON FOOTPRINT & SUSTAINABILITY AWARENESS
COMPLEXITY OUTSOURCING
Market Drivers Reliable & Profitable
(1) France, Benelux, NECST, Noram
>8years
Remaining portfolio duration
>80%Contract renewals
>9months
Revenue coveredby backlog(1)
Order intake > yearly revenue(1) ~110%
CASH GENERATIVE
BUSINESS
HIGH SINGLE-DIGIT
ROCE
28/02/2019 162ENGIE 2019
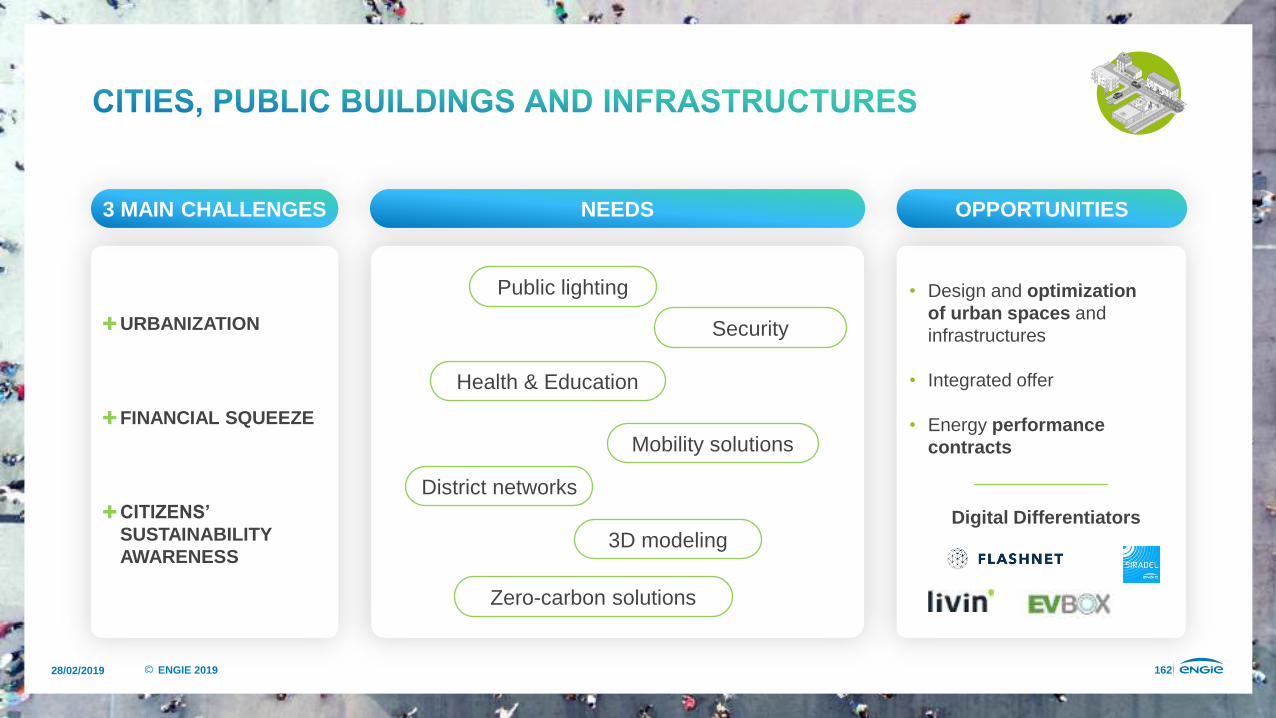
✚URBANIZATION
✚FINANCIAL SQUEEZE
✚CITIZENS’
SUSTAINABILITY AWARENESS
• Design and optimizationof urban spaces and infrastructures
• Integrated offer
• Energy performance contracts
Digital Differentiators
3 MAIN CHALLENGES NEEDS OPPORTUNITIES
Public lighting
Mobility solutions
Security
Health & Education
District networks
Zero-carbon solutions
3D modeling

28/02/2019 163ENGIE 2019
Design & Engineering Investments Installation
Operation & Maintenance Energy Supply
OUR OFFERS
BUILDING EFFICIENCYENERGY
PROCESS PERFORMANCE
SMART PLACES
MOBILITY

28/02/2019 164ENGIE 2019
✚NEW BEHAVIORS
✚CONNECTIVITY & COMFORT
✚COMPLEXITY OUTSOURCING
• Design and optimization of buildings and spaces for new usages
• Design, financing and installation of equipment (energy, connectivity, security, air...)
• Energy audit and energy performance consulting
Digital Differentiators
3 MAIN CHALLENGES NEEDS OPPORTUNITIES
Real-time asset management & Predictive maintenance
3D design
Competitive green energy
Performance commitment
Renovation

28/02/2019 165ENGIE 2019
✚GREENING OF PROCESSES & PRODUCTS
✚ CARBON FOOTPRINT
✚OUTSOURCING OF NON-CORE PROCESSES
• Overall approach of industrial processes performance
• Accompany zero-carbon agenda
• Offer “as a service” solutions instead of physical equipment
Digital Differentiators
3 MAIN CHALLENGES NEEDS OPPORTUNITIES
Sustainable solutions
Reliability & Traceability
Predictive maintenance
Performance contracts
Decentralized energy production

28/02/2019 166ENGIE 2019
OUR OFFERS
Design & Engineering Investments Installation
Operation & Maintenance Energy Supply
Attentes éléments –
Ingrid
BUILDING EFFICIENCYENERGY
PROCESS PERFORMANCE
SMART PLACES
MOBILITY

28/02/2019 167ENGIE 2019
✚ COST REDUCTION
✚ SOCIAL TRENDS
✚ AGING POPULATION
• Energy audit and support on energy performance
• Develop new usage of energy and services to improve quality of life
• Integrated offers with financing
• Building regeneration solutions
Digital Differentiators
3 MAIN CHALLENGES NEEDS OPPORTUNITIES
Energy performance
Financing solutions
On-site renewable energy production
Consumption management

28/02/2019 168ENGIE 2019
DEVELOPING“AS A SERVICE” SOLUTIONS

28/02/2019 169ENGIE 2019
CLIENT SOLUTIONSAsset-based solutions a rising proportion of CS COI
Commoditized service offer
Zero-CarbonTransition
"as a service"
Tailor-madeHigh-techFinanced
RENEWABLESNETWORKS
GENERATION & SUPPLYCLIENT SOLUTIONS

28/02/2019 170ENGIE 2019
CLIENT NEEDS • Requires enhanced supply of steam, power, air
• Subject to challenging sustainability goals
• Requires external financing
• Wants total integrated solution
THE BENEFIT OF FINANCING AND EQUITY SYNDICATION
Total investment cost of €100M
Case example
In €M
Steam/power/air margin 12,4
ENGIE O&M & other operational costs (3.4)
Depreciation (5.0)
Financing cost @ 4% (2.3)
Tax (0.5)
Net result 1.2
In €M
O&M margin invoiced to Project Co. 0.2
Share of Project Co. net income 0.4
EBITDA 0.6
Tax (0.1)
Net result 0.5
Capital employed ENGIE (average) €5.5M
ROCE ~9 to 12%
PROJECT CO.
• Large 20-year asset
• Debt/equity @ 70/30
ENGIE Client Solutions
30% EQUITY STAKE(2)
“AS A SERVICE” SOLUTION
Project Co. Typical P&L(1)
(equity consolidated within ENGIE) ENGIE Typical P&L(1)
(excl. one-off development fee & DBpSO margin)
Overall project economics
(1) Average yearly contribution first 10 years(2) At inception (but sell-down could also be after building the asset)

28/02/2019 171ENGIE 2019
1
23
4
5
6
7
8
12
3
45 6
8
9
10 11
1216
17
14
7
181920
21
23
2224
On-site Generation – Unisun Investment
Integrated Services – Opterra Acquisition
Integrated Services – ECAM Acquisition
Microgrids - Comoros
Microgrids – Palau
Mobility – TER Dakar
Integrated Services – CAM Acquisition
On-site Generation – Power Corner
171
Mobility – Dijon Tramway, PPP
Lighting – Avignon Public Lighting, PPP
DHC – 240 DHC Networks in Europe
Lighting – 1M Lighting points managed, mainly in France
Mobility – 140 NGV Stations in France
Mobility – 5.000 Charging Stations EV
Smart City - North Tyneside, North East Lincolnshire, Chester1234
765
8 DHC – Queen Elizabeth Olympic Park DHC
2016Several references, mainly in Europe
2019Worldwide references thanks to a new focus
1234
765
8
DHC – Settimo Torinese
Microgrids - EPS Acquisition
Lighting – Aubagne Contract
DHC – Northgate Filinvest
DHC – Amiens SEMOP
Smart City – La Baule
Lighting – Flashnet Acquisition
DHC – Tabreed Investment
9101112
151413
16
Campus – Ohio State University
Campus – Longwood Energy
Campus – Springfield
On-site Generation – DSM, Novartis, Syngenta
Campus – Kingston University
Mobility – London Railway Stations Maintenance
Mobility – Intelligent Transportation System
Mobility – Transantiago electric buses system
17181920
232221
24

28/02/2019 172ENGIE 2019
Rest of Europe39%
€18.6bn x2
France49%
Rest of world12%
4 - 7% CAGR 2018 2021
€21 - 23bn

28/02/2019 173ENGIE 2019
11-14% CAGR
26%
41%
25%
7%
€1.0bn €1.3 - 1.4bn
Design & Engineering Investment Installation Operation & Maintenance
2018 2021
HIGH ADDED VALUE SOLUTIONS
LEADING TO HIGHER MARGINS

28/02/2019 174ENGIE 2019
OUR KEY DIFFERENTIATORS

28/02/2019 175ENGIE 2019
Preferred and strategic relationships with C-suite, Fortune 500 and C40 cities
• Customer profiling• C-suite engagement• Solution architect & coordinator
Leverage financing for “as a service” developments
• Leverage cheaper financing • Maximize our impact and assets portfolio
A best-in-class software library
• Ability to upgrade our offers and design new ones• Leverage transversal tools (platforms, etc.)
FINANCING SYNDICATION
STRATEGY DESIGN DIGITAL ACCELERATION
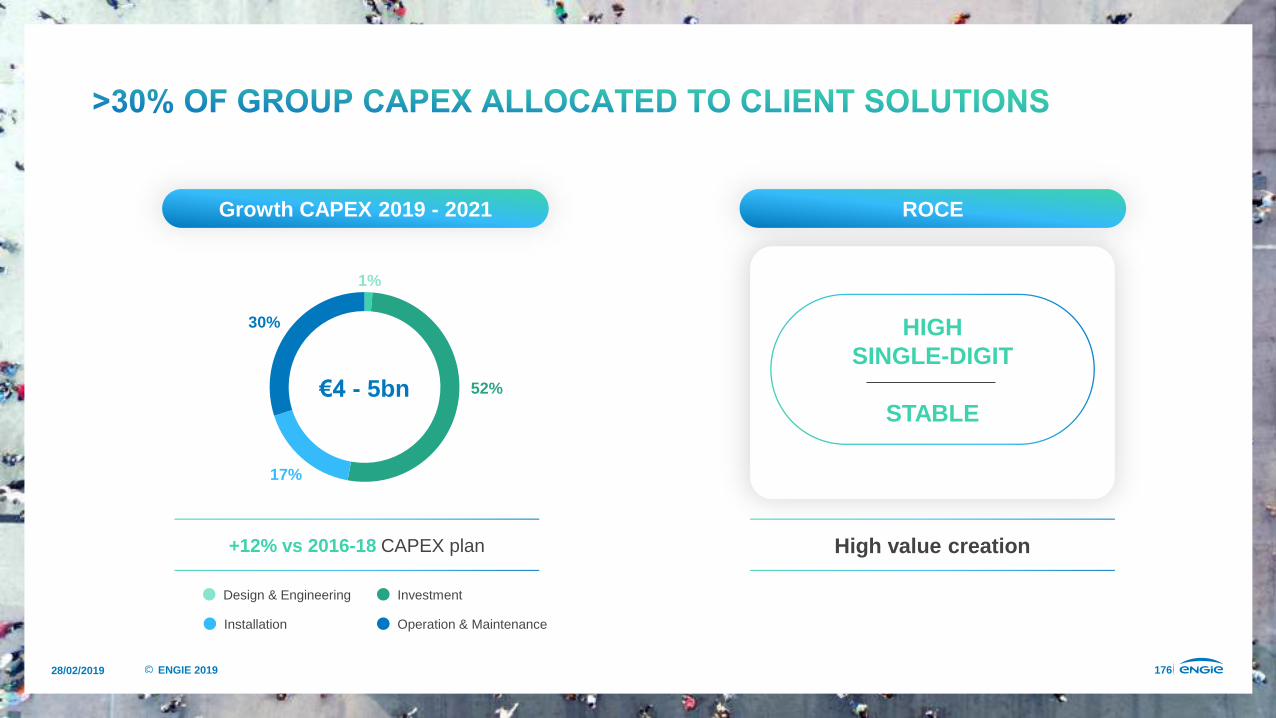
28/02/2019 176ENGIE 2019
Design & Engineering Investment
Installation Operation & Maintenance
Growth CAPEX 2019 - 2021
€4 - 5bn
17%
30%
1%
52%
ROCE
+12% vs 2016-18 CAPEX plan High value creation
HIGH SINGLE-DIGIT
STABLE

28/02/2019 177ENGIE 2019
Customer intimacy enabling us to develop tailor-made solutions (complex & innovative)
Focus on activities leveraging ENGIE financing capabilities and ultimately DBpSO model
Long-term contracts, providing predictability & recurrence
Improve density in geographies and customer segment
Simple offer with low-margin business
Short-term contracts
Non-secure offtake
Entering new geographies greenfield
Less AttractiveVery Attractive

28/02/2019 178ENGIE 2019
TOWARDSA ZERO-CARBON TRANSITION& BETTER ENERGY ACCESS

28/02/2019 179ENGIE 2019

28/02/2019 180ENGIE 2019
CONCLUSION

28/02/2019 181ENGIE 2019
Asset as a
service
Business as Usual
O&M
DHC
Data centers
Public lighting
Mobility
Microgrids
On-site generation
Clean rooms
Microgrids
On-site generation
DHC
Mobility
Public lighting
Data centers
Clean rooms
Time Horizon
Microgrids
On-site generationDHC
Mobility
Clean rooms
Public lighting
Data centers
Middle Term Long TermShort Term
28/02/2019 182ENGIE 2019
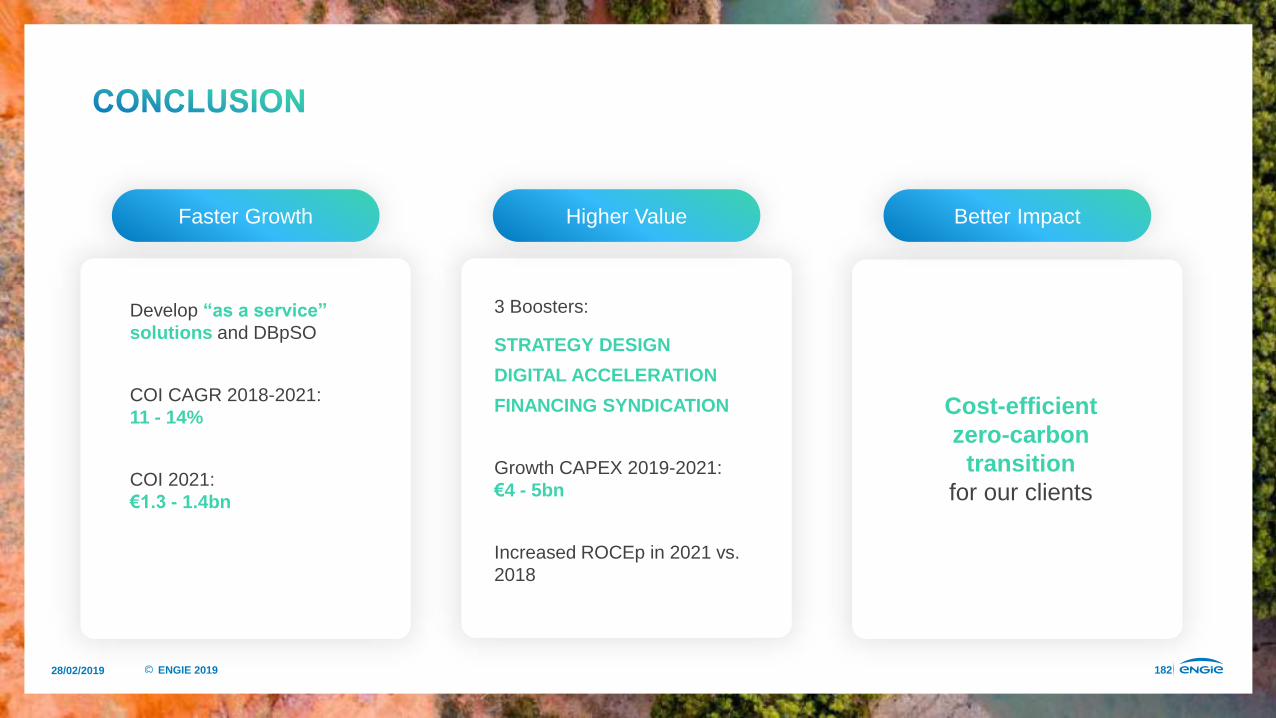
Faster Growth
3 Boosters:
STRATEGY DESIGN
DIGITAL ACCELERATION
FINANCING SYNDICATION
Growth CAPEX 2019-2021: €4 - 5bn
Increased ROCEp in 2021 vs. 2018
Develop “as a service”
solutions and DBpSO
COI CAGR 2018-2021: 11 - 14%
COI 2021: €1.3 - 1.4bn
Cost-efficient zero-carbon
transitionfor our clients
Higher Value Better Impact

28/02/2019 183ENGIE 2019
Forward-Looking statements
This communication contains forward-looking information and statements. These statements include financial projections, synergies, cost-savings and estimates, statements regarding plans, objectives, savings, expectations and benefits from the transactions and expectations with respect to future operations, products and services, and statements regarding future performance. Although the management of ENGIE believes that the expectations reflected in such forward-looking statements are reasonable, investors and holders of ENGIE securities are cautioned that forward-looking information and statements are not guarantees of future performances and are subject to various risks and uncertainties, many of which are difficult to predict andgenerally beyond the control of ENGIE , that could cause actual results, developments, synergies, savings and benefits to differmaterially from those expressed in, or implied or projected by, the forward-looking information and statements. These risks and uncertainties include those discussed or identified in the public filings made by ENGIE with the autorité des marchés financiers (AMF), including those listed under “facteurs de risque” (risk factors) section in the document de référence filed by ENGIE (ex GDF SUEZ) with the AMF on 28 march 2018 (under no: D.18-0207). Investors and holders of ENGIE securities should consider that the occurrence of some or all of these risks may have a material adverse effect on ENGIE.
28/02/2019 184ENGIE 2019
Ticker: ENGI
+33 1 44 22 66 29 [email protected]
Download the new ENGIE Investor relations app!
FOR MORE INFORMATION ABOUT FY 2018 RESULTS:http://www.engie.com/en/investors/results/results-2018/
http://www.engie.com/en/investors-area/


