19
Capital Markets Viewpoint: Your Securitization Questions Answered 2016 Regional Seller Workshops

Capital Markets Viewpoint:
Your Securitization Questions Answered
2016 Regional Seller Workshops

© Freddie Mac
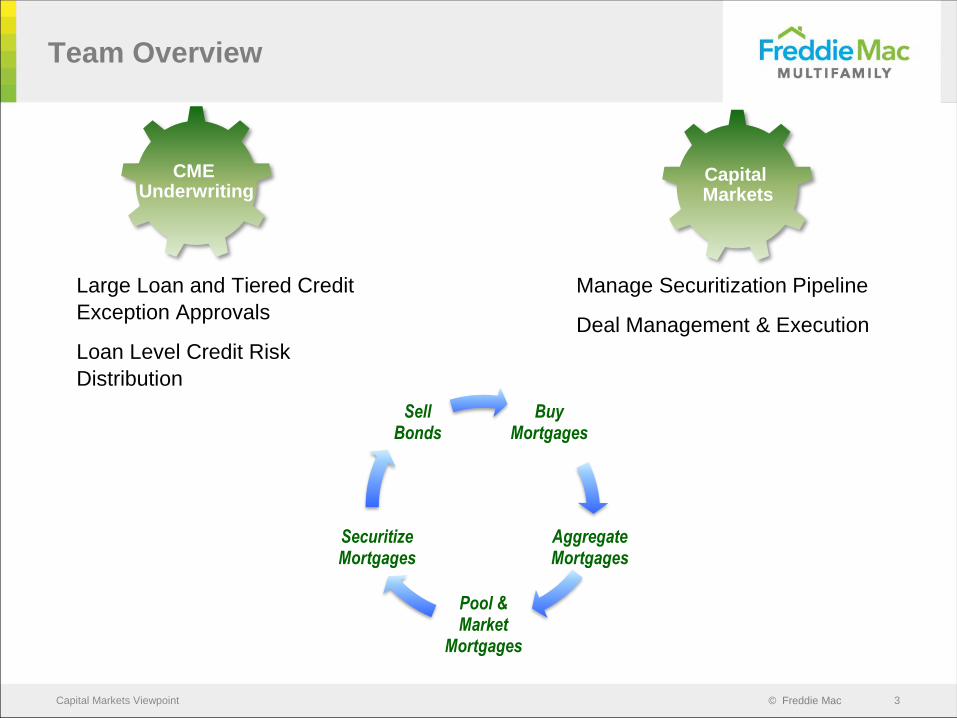
An overview of the CME Underwriting and Capital Market teams
Our securitization pipeline strategy and process
Who are our investors and what are their levels of due diligence
The Q&A process and assets of concern
The roles of rating agencies
Comparisons of K-Deal vs. CMBS performance
Regulatory Environment
Single Asset Single Borrower
What We Will be Covering Today
Capital Markets Viewpoint 2
© Freddie Mac
Capital Markets
Manage Securitization Pipeline
Deal Management & Execution
Large Loan and Tiered Credit
Exception Approvals
Loan Level Credit Risk
Distribution
Team Overview
Capital Markets Viewpoint 3
CME Underwriting
Buy Mortgages
Aggregate Mortgages
Pool & Market
Mortgages
Securitize Mortgages
Sell Bonds
© Freddie Mac
Type10 -Year Fixed-
Rate7-Year Fixed-
RateConventional Floating-Rate
Small Balance
Seniors Housing
Other*
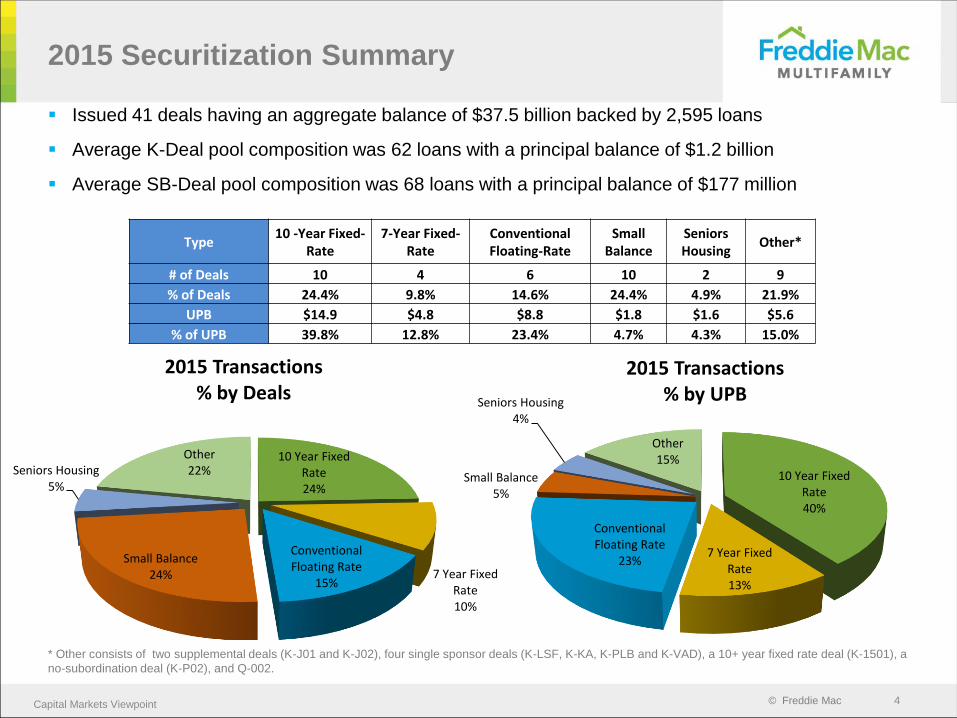
# of Deals 10 4 6 10 2 9
% of Deals 24.4% 9.8% 14.6% 24.4% 4.9% 21.9%
UPB $14.9 $4.8 $8.8 $1.8 $1.6 $5.6
% of UPB 39.8% 12.8% 23.4% 4.7% 4.3% 15.0%
2015 Securitization Summary
Capital Markets Viewpoint 4
Issued 41 deals having an aggregate balance of $37.5 billion backed by 2,595 loans
Average K-Deal pool composition was 62 loans with a principal balance of $1.2 billion
Average SB-Deal pool composition was 68 loans with a principal balance of $177 million
10 Year Fixed Rate24%
7 Year Fixed Rate10%
Conventional Floating Rate
15%
Small Balance 24%
Seniors Housing5%
Other22%
2015 Transactions % by Deals
10 Year Fixed Rate40%
7 Year Fixed Rate13%
Conventional Floating Rate
23%
Small Balance 5%
Seniors Housing4%
Other15%
2015 Transactions% by UPB
* Other consists of two supplemental deals (K-J01 and K-J02), four single sponsor deals (K-LSF, K-KA, K-PLB and K-VAD), a 10+ year fixed rate deal (K-1501), a
no-subordination deal (K-P02), and Q-002.

© Freddie Mac
The Underwriting & Credit Approval Process
Capital Markets Viewpoint 5
Production presents deal to Regional Underwriting for approval
to quote
Borrower completes
loan application and Seller
submits U/W package
Underwriter completes due
diligence process,
reports findings in investment
brief
STARTSeller
submits loan request to Production
Underwriter recommends
loan for approval
Production sizes,
structures, and submits
loan for pricing
Loan is approved,
rate-locked,and funded
>$100MM
approval by SVP MF
Underwriting &
Credit
$50 - $100MM
approved by VP MF
Underwriting
>$250MM
approved
by EVP MF and
SVP MF CCO
As a general rule, transactions that are above
$50MM UPB and have exceptions to Freddie
Mac credit policy that impact leverage
parameters, or those that fail an exit test,
must be approved by the Enterprise Risk
Management group prior to rate lock.
• Approval authorities may vary on non-conventional
multifamily products
• Loan requests from $125MM - $200MM approved
by EVP MF and SVP MF CCO
• Loan requests from $200MM - $500MM approved
by CEO/CERO
• Loan requests > $500MM approved by the Business
and Risk Committee of the Board of Directors
Up to $50MM
approval level
determined by
Region
< $100MM
approval to quote
determined by
Region
$100M - $250MM
approved by SVP
MF Underwriting &
Credit

© Freddie Mac
There are many factors taken into consideration when creating a K-Deal pool:
Pipeline Strategy
Capital Markets Viewpoint 6
First In, First Out (FIFO)
Consistency: Freddie’s K-Deal program is
known for consistency in:
» Size: The average deal size in 2015 was
approximately $1.2 billion
» Term: Generally designate similar terms ―
10 year, 7 year, 5 year, fixed/floating
» Credit Metrics: LTV and DSCR
Pool diversification:
» Geography
» Sponsor
» Property Subtype
» Seller/Servicer
» Amortization
» Call Protection
K-Deal Summary By Year1 Weighted Average
YearNumber of
DealsNumber of
LoansMortgage Pool
Cutoff Balance ($)Guaranteed Balance ($)
Average Cutoff Principal Balance
($)
Interest Rate (%)
Remaining Loan Term (Months)
Seasoning (Months)
Loan to Value %
Debt Service Coverage Ratio
(x)
Loan Balance % Top 10 Loans
Acquisition Loans (%)
Delinquency % (60+ days & REO)
2009 2 108 2,139,995,180 1,979,495,000 19,814,770 5.707 115 4 69.0 1.51 54.4 28.8 0.00%
2010 6 364 6,443,710,496 5,693,793,676 17,702,501 5.547 113 4 69.0 1.38 46.2 24.9 0.21%
2011 12 839 13,658,171,155 11,722,206,000 16,279,107 4.901 102 5 68.5 1.43 38.7 30.0 0.00%
2012 17 1,141 21,203,764,465 17,922,331,076 18,583,492 4.081 92 6 70.3 1.45 37.3 39.3 0.00%
2013 19 1,391 28,036,108,438 23,696,302,400 20,155,362 3.625 104 6 68.5 1.56 36.3 45.6 0.00%
2014 17 1,299 21,324,933,962 18,262,559,000 16,416,423 3.678 92 5 68.5 1.68 34.4 47.2 0.00%
2015 30 1,858 35,621,528,113 30,552,872,011 19,171,974 3.453 100 7 70.4 1.62 45.7 44.7 0.00%
Total/WA 103 7,000 128,428,211,809 109,829,559,163 18,346,887 3.908 99 6 69.3 1.56 39.8 42.7 0.01%
© Freddie Mac
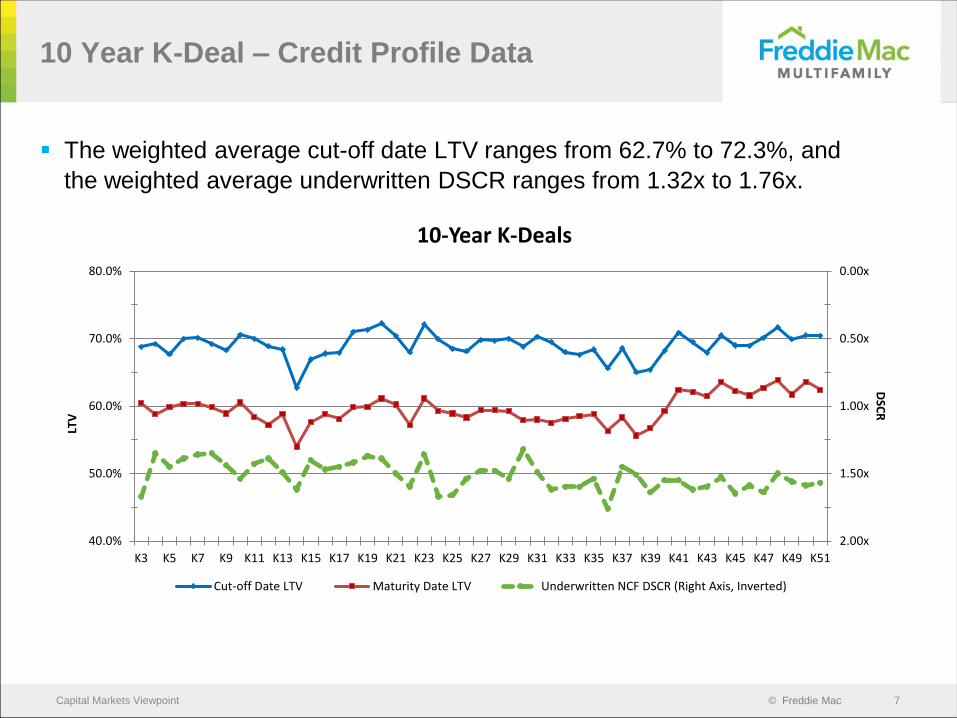
The weighted average cut-off date LTV ranges from 62.7% to 72.3%, and
the weighted average underwritten DSCR ranges from 1.32x to 1.76x.
10 Year K-Deal – Credit Profile Data
Capital Markets Viewpoint 7
K3 K5 K7 K9 K11 K13 K15 K17 K19 K21 K23 K25 K27 K29 K31 K33 K35 K37 K39 K41 K43 K45 K47 K49 K51
0.00x
0.50x
1.00x
1.50x
2.00x40.0%
50.0%
60.0%
70.0%
80.0%
DSC
RLT
V
10-Year K-Deals
Cut-off Date LTV Maturity Date LTV Underwritten NCF DSCR (Right Axis, Inverted)
© Freddie Mac
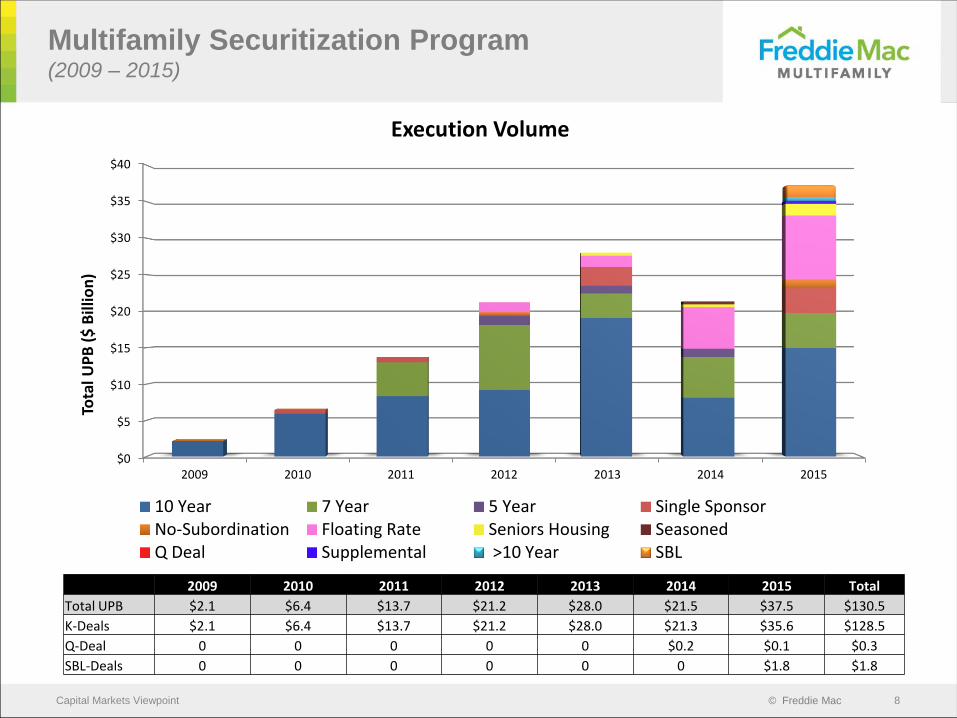
Multifamily Securitization Program (2009 – 2015)
Capital Markets Viewpoint 8
2009 2010 2011 2012 2013 2014 2015 Total
Total UPB $2.1 $6.4 $13.7 $21.2 $28.0 $21.5 $37.5 $130.5
K-Deals $2.1 $6.4 $13.7 $21.2 $28.0 $21.3 $35.6 $128.5
Q-Deal 0 0 0 0 0 $0.2 $0.1 $0.3
SBL-Deals 0 0 0 0 0 0 $1.8 $1.8
$0
$5
$10
$15
$20
$25
$30
$35
$40
2009 2010 2011 2012 2013 2014 2015
Tota
l UP
B (
$ B
illio
n)
Execution Volume
10 Year 7 Year 5 Year Single SponsorNo-Subordination Floating Rate Seniors Housing SeasonedQ Deal Supplemental >10 Year SBL
© Freddie Mac
Investors
Capital Markets Viewpoint 9
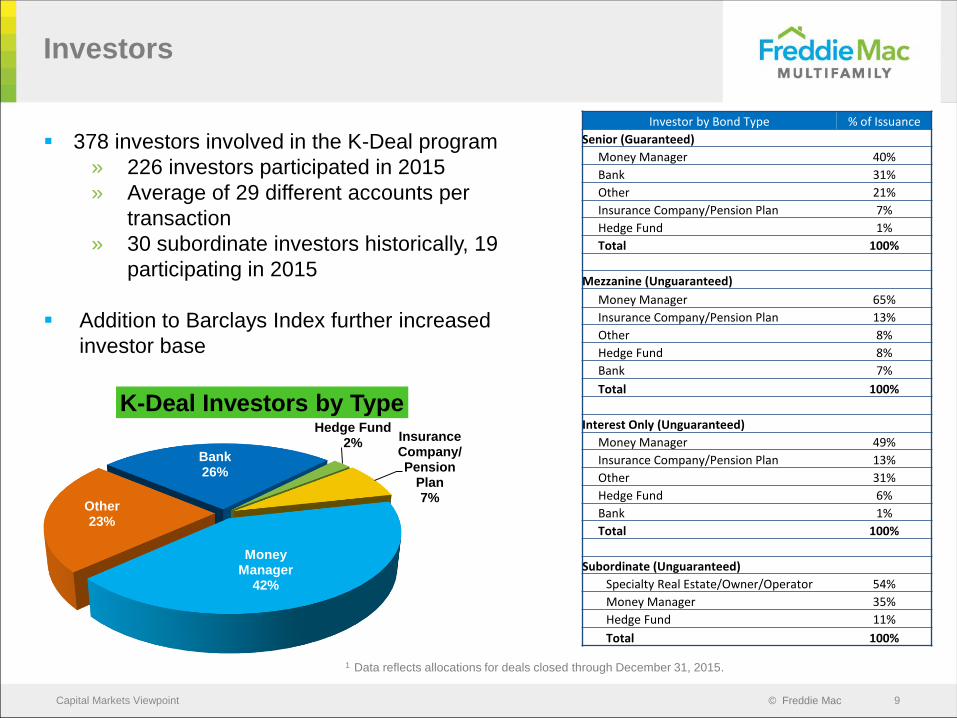
1 Data reflects allocations for deals closed through December 31, 2015.
Bank26%
Hedge Fund2%
Insurance Company/Pension
Plan7%
Money Manager
42%
Other23%
K-Deal Investors by Type
378 investors involved in the K-Deal program
» 226 investors participated in 2015
» Average of 29 different accounts per
transaction
» 30 subordinate investors historically, 19
participating in 2015
Addition to Barclays Index further increased
investor base
Investor by Bond Type % of Issuance
Senior (Guaranteed)
Money Manager 40%
Bank 31%
Other 21%
Insurance Company/Pension Plan 7%
Hedge Fund 1%
Total 100%
Mezzanine (Unguaranteed)
Money Manager 65%
Insurance Company/Pension Plan 13%
Other 8%
Hedge Fund 8%
Bank 7%
Total 100%
Interest Only (Unguaranteed)
Money Manager 49%
Insurance Company/Pension Plan 13%
Other 31%
Hedge Fund 6%
Bank 1%
Total 100%
Subordinate (Unguaranteed)
Specialty Real Estate/Owner/Operator 54%
Money Manager 35%
Hedge Fund 11%
Total 100%
© Freddie Mac
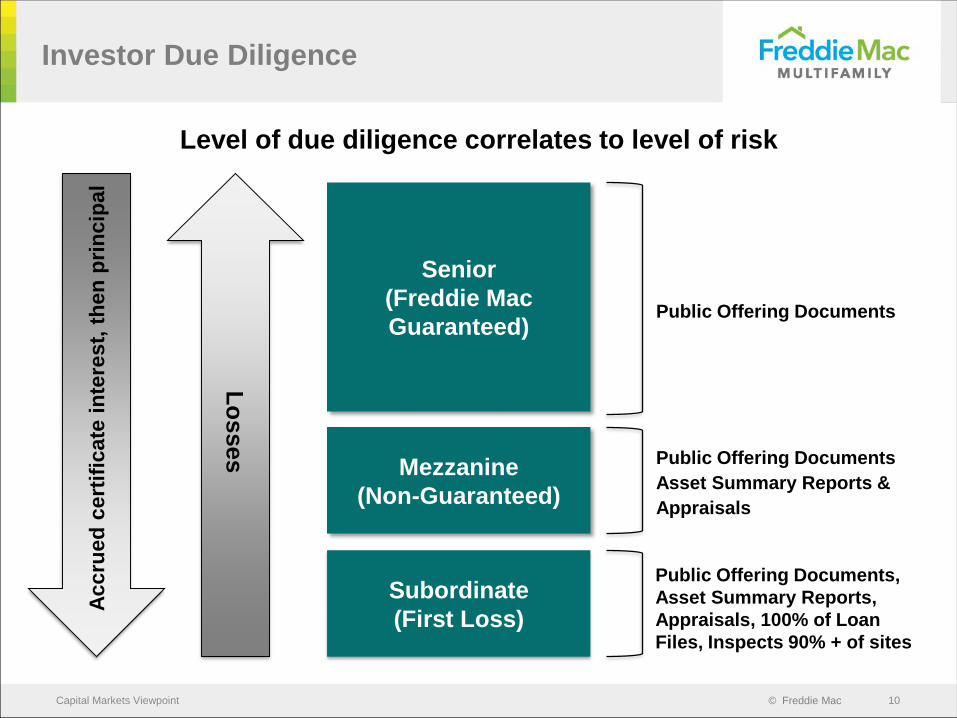
Level of due diligence correlates to level of risk
Investor Due Diligence
Capital Markets Viewpoint 10
Senior
(Freddie Mac
Guaranteed)
Mezzanine
(Non-Guaranteed)
Subordinate
(First Loss)
Accru
ed
cert
ific
ate
in
tere
st,
th
en
pri
ncip
al
Lo
sses Public Offering Documents
Asset Summary Reports &
Appraisals
Public Offering Documents
Public Offering Documents,
Asset Summary Reports,
Appraisals, 100% of Loan
Files, Inspects 90% + of sites
© Freddie Mac
Selected via public auction or private placement
First hand experience with multifamily real estate
Prior to securitization
» Underwrites all loans
» Typically performs site inspections on 90% + of loans
» Appoints an unaffiliated entity as Special Servicer, subject to
Freddie Mac approval
» Approves loans for final pool
Post-securitization
» Monitor transaction
» Approval required for certain modifications, assumptions
and requests
» Investment absorbs losses first
Subordinate Bond Investors (“B-Buyers”)
Capital Markets Viewpoint 11
© Freddie Mac
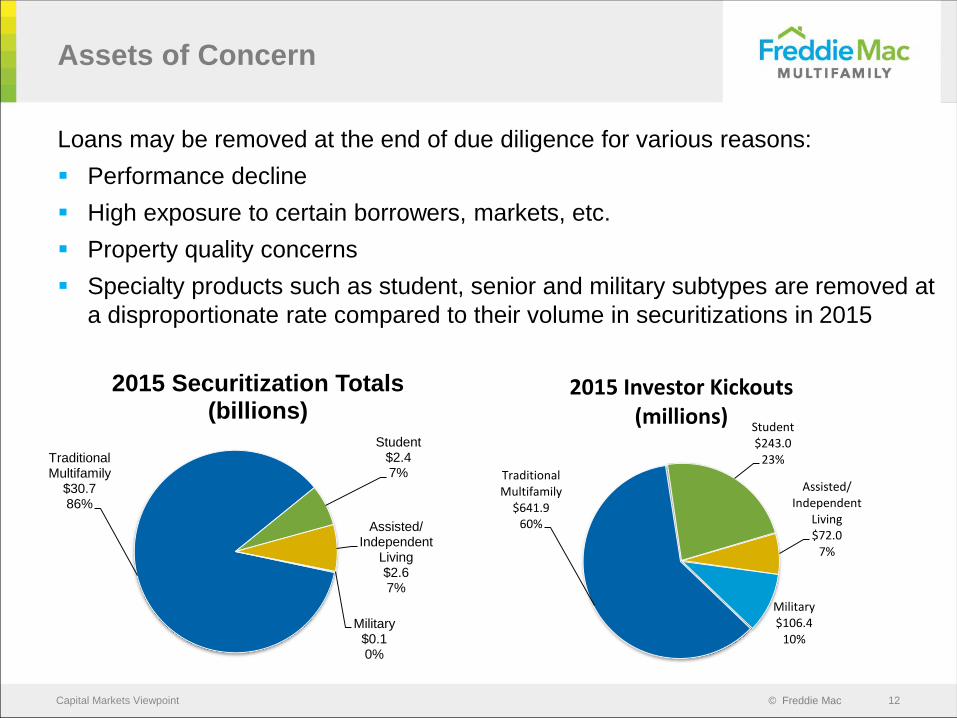
Loans may be removed at the end of due diligence for various reasons:
Performance decline
High exposure to certain borrowers, markets, etc.
Property quality concerns
Specialty products such as student, senior and military subtypes are removed at
a disproportionate rate compared to their volume in securitizations in 2015
Assets of Concern
Capital Markets Viewpoint 12
Traditional Multifamily
$30.786%
Student$2.47%
Assisted/Independent
Living$2.67%
Military$0.10%
2015 Securitization Totals (billions)
Traditional Multifamily
$641.960%
Student$243.0
23%
Assisted/Independent
Living$72.0
7%
Military$106.4
10%
2015 Investor Kickouts (millions)
© Freddie Mac
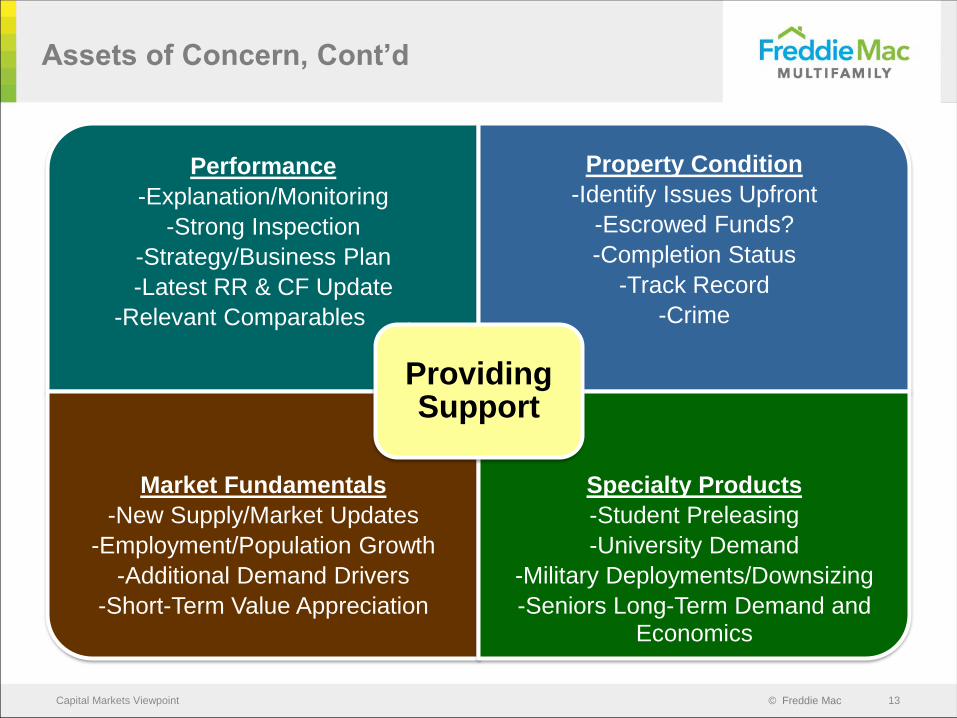
Performance
-Explanation/Monitoring
-Strong Inspection
-Strategy/Business Plan
-Latest RR & CF Update
-Relevant Comparables .
Property Condition
-Identify Issues Upfront
-Escrowed Funds?
-Completion Status
-Track Record
-Crime
Market Fundamentals
-New Supply/Market Updates
-Employment/Population Growth
-Additional Demand Drivers
-Short-Term Value Appreciation
Specialty Products
-Student Preleasing
-University Demand
-Military Deployments/Downsizing
-Seniors Long-Term Demand and Economics
Providing Support
Assets of Concern, Cont’d
Capital Markets Viewpoint 13
© Freddie Mac
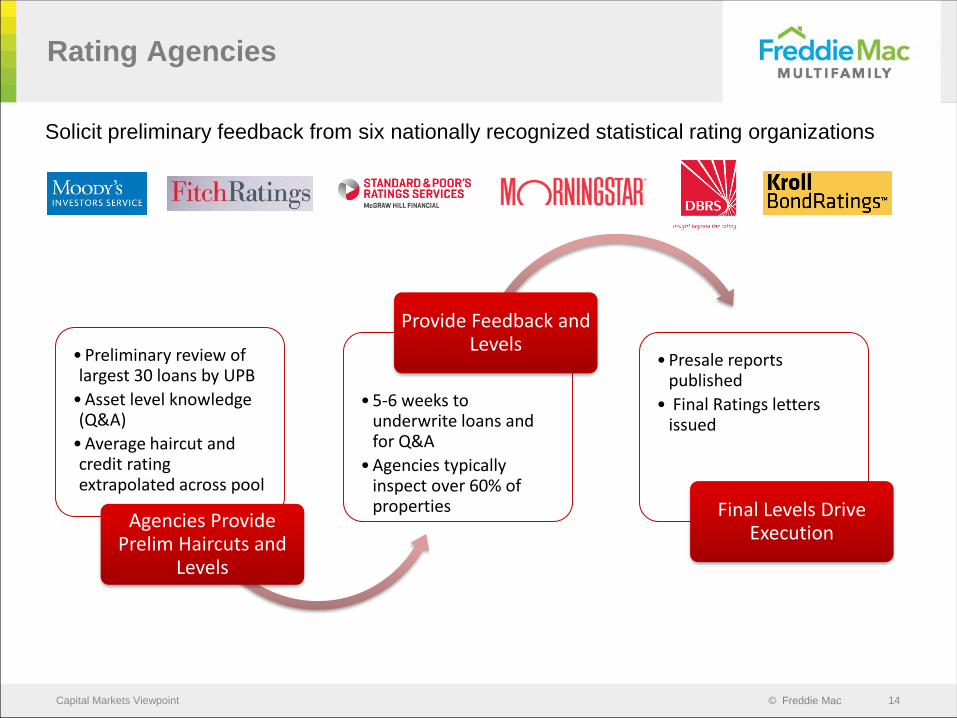
Solicit preliminary feedback from six nationally recognized statistical rating organizations
Rating Agencies
Capital Markets Viewpoint 14
•Preliminary review of largest 30 loans by UPB
•Asset level knowledge (Q&A)
•Average haircut and credit rating extrapolated across pool
Agencies Provide Prelim Haircuts and
Levels
•5-6 weeks to underwrite loans and for Q&A
•Agencies typically inspect over 60% of properties
Provide Feedback and Levels
•Presale reports published
• Final Ratings letters issued
Final Levels Drive Execution
© Freddie Mac
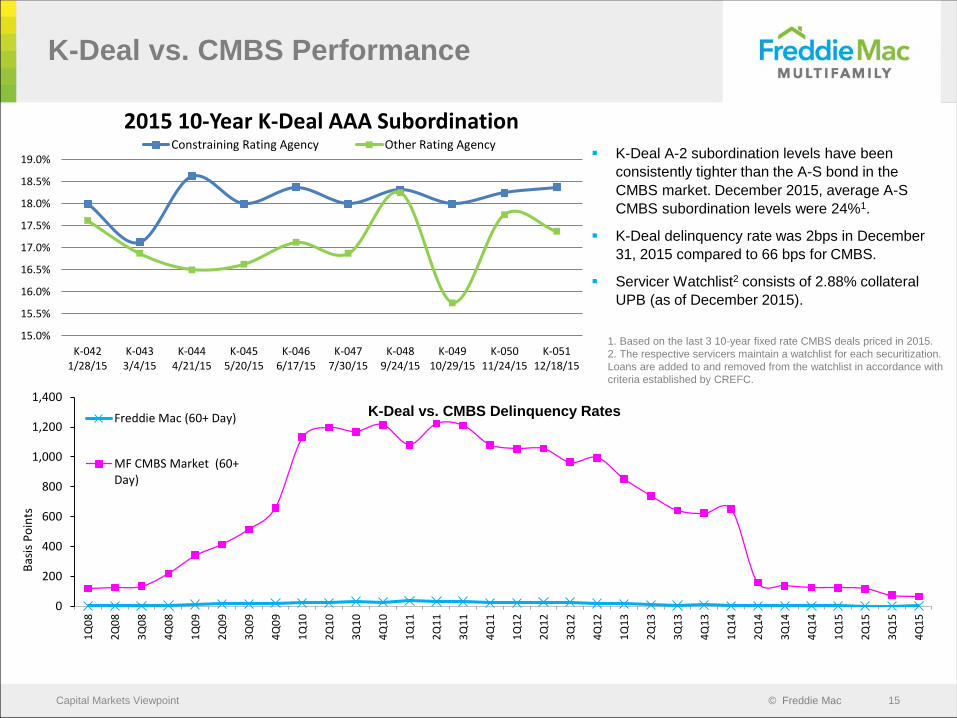
K-Deal A-2 subordination levels have been
consistently tighter than the A-S bond in the
CMBS market. December 2015, average A-S
CMBS subordination levels were 24%1.
K-Deal delinquency rate was 2bps in December
31, 2015 compared to 66 bps for CMBS.
Servicer Watchlist2 consists of 2.88% collateral
UPB (as of December 2015).
K-Deal vs. CMBS Performance
Capital Markets Viewpoint 15
1. Based on the last 3 10-year fixed rate CMBS deals priced in 2015.
2. The respective servicers maintain a watchlist for each securitization.
Loans are added to and removed from the watchlist in accordance with
criteria established by CREFC.
0
200
400
600
800
1,000
1,200
1,400
1Q
08
2Q
08
3Q
08
4Q
08
1Q
09
2Q
09
3Q
09
4Q
09
1Q
10
2Q
10
3Q
10
4Q
10
1Q
11
2Q
11
3Q
11
4Q
11
1Q
12
2Q
12
3Q
12
4Q
12
1Q
13
2Q
13
3Q
13
4Q
13
1Q
14
2Q
14
3Q
14
4Q
14
1Q
15
2Q
15
3Q
15
4Q
15
Bas
is P
oin
ts
Freddie Mac (60+ Day)
MF CMBS Market (60+Day)
K-Deal vs. CMBS Delinquency Rates
15.0%
15.5%
16.0%
16.5%
17.0%
17.5%
18.0%
18.5%
19.0%
K-0421/28/15
K-0433/4/15
K-0444/21/15
K-0455/20/15
K-0466/17/15
K-0477/30/15
K-0489/24/15
K-04910/29/15
K-05011/24/15
K-05112/18/15
2015 10-Year K-Deal AAA SubordinationConstraining Rating Agency Other Rating Agency
© Freddie Mac
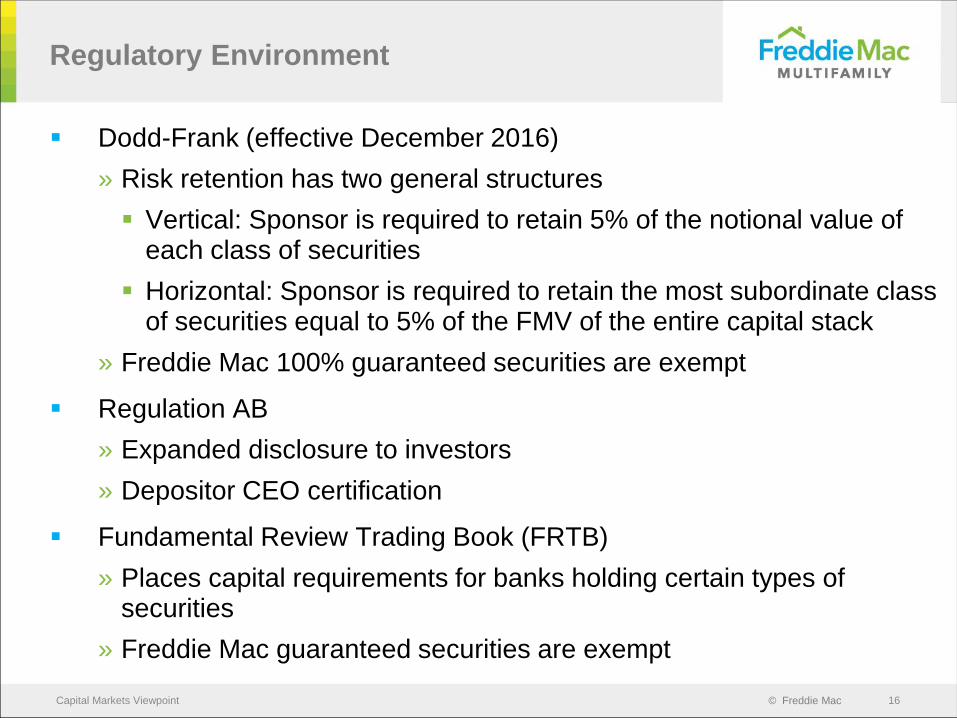
Dodd-Frank (effective December 2016)
» Risk retention has two general structures
Vertical: Sponsor is required to retain 5% of the notional value of each class of securities
Horizontal: Sponsor is required to retain the most subordinate class of securities equal to 5% of the FMV of the entire capital stack
» Freddie Mac 100% guaranteed securities are exempt
Regulation AB
» Expanded disclosure to investors
» Depositor CEO certification
Fundamental Review Trading Book (FRTB)
» Places capital requirements for banks holding certain types of securities
» Freddie Mac guaranteed securities are exempt
Regulatory Environment
Capital Markets Viewpoint 16
© Freddie Mac
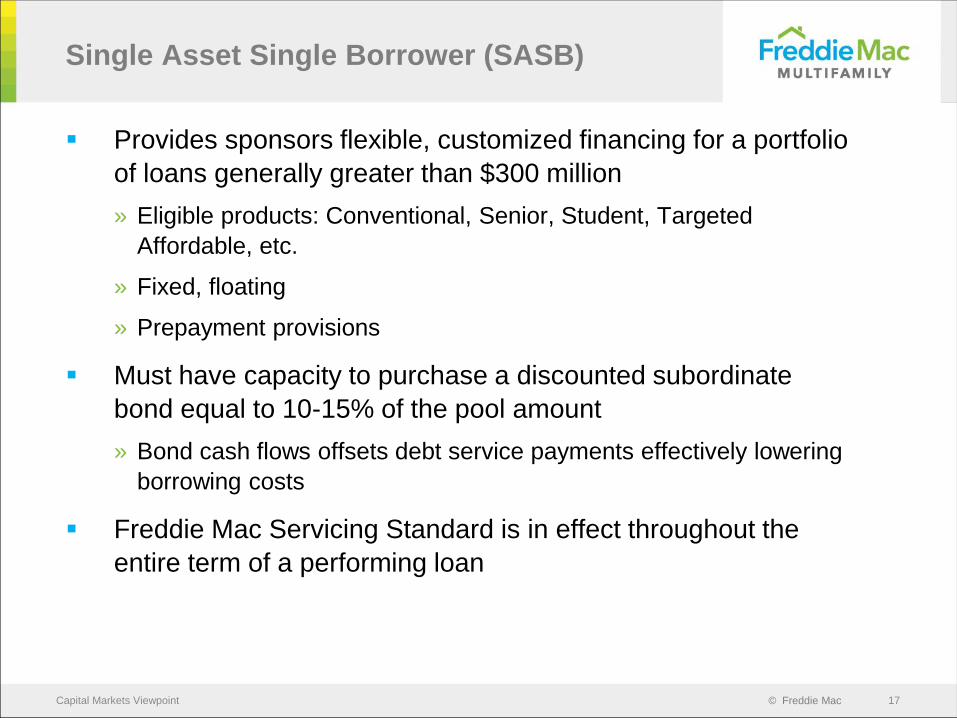
Provides sponsors flexible, customized financing for a portfolio
of loans generally greater than $300 million
» Eligible products: Conventional, Senior, Student, Targeted
Affordable, etc.
» Fixed, floating
» Prepayment provisions
Must have capacity to purchase a discounted subordinate
bond equal to 10-15% of the pool amount
» Bond cash flows offsets debt service payments effectively lowering
borrowing costs
Freddie Mac Servicing Standard is in effect throughout the
entire term of a performing loan
Single Asset Single Borrower (SASB)
Capital Markets Viewpoint 17
© Freddie Mac
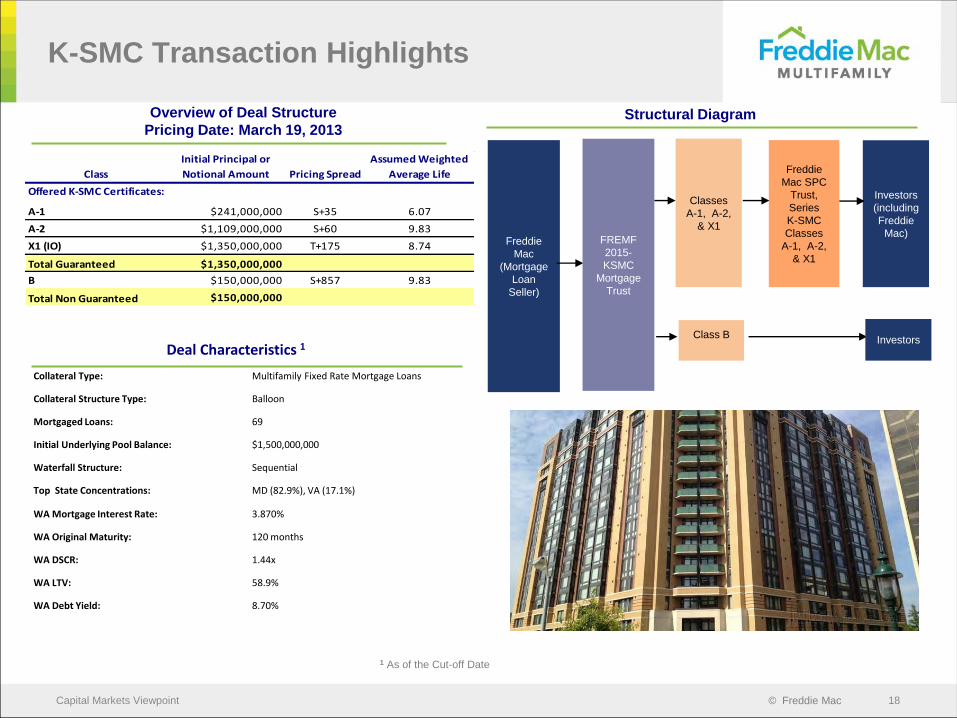
Deal Characteristics 1
Collateral Type: Multifamily Fixed Rate Mortgage Loans
Collateral Structure Type: Balloon
Mortgaged Loans: 69
Initial Underlying Pool Balance: $1,500,000,000
Waterfall Structure: Sequential
Top State Concentrations: MD (82.9%), VA (17.1%)
WA Mortgage Interest Rate: 3.870%
WA Original Maturity: 120 months
WA DSCR: 1.44x
WA LTV: 58.9%
WA Debt Yield: 8.70%
K-SMC Transaction Highlights
Capital Markets Viewpoint 18
Structural DiagramOverview of Deal Structure
Pricing Date: March 19, 2013
Classes
A-1, A-2,
& X1
Freddie
Mac
(Mortgage
Loan
Seller)
Freddie
Mac SPC
Trust,
Series
K-SMC
Classes
A-1, A-2,
& X1
Investors
(including
Freddie
Mac)
InvestorsClass B
FREMF
2015-
KSMC
Mortgage
Trust
1 As of the Cut-off Date
Class
Initial Principal or
Notional Amount Pricing Spread
Assumed Weighted
Average Life
A-1 $241,000,000 S+35 6.07
A-2 $1,109,000,000 S+60 9.83
X1 (IO) $1,350,000,000 T+175 8.74
Total Guaranteed $1,350,000,000
B $150,000,000 S+857 9.83
Total Non Guaranteed $150,000,000
Offered K-SMC Certificates:
© Freddie Mac
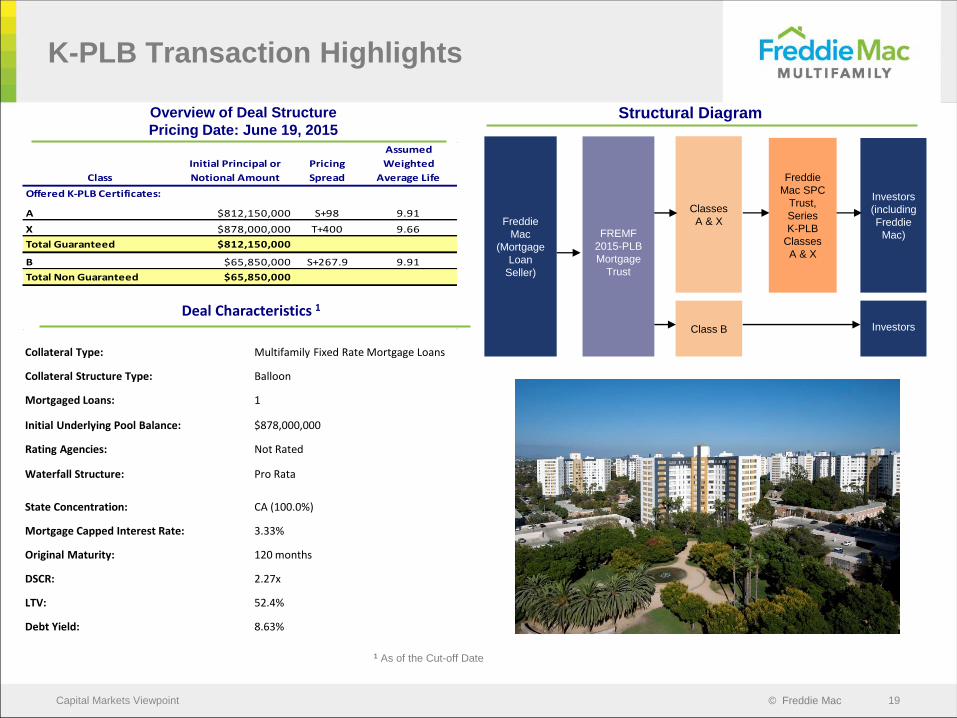
K-PLB Transaction Highlights
Capital Markets Viewpoint 19
Overview of Deal Structure
Pricing Date: June 19, 2015
Class
Initial Principal or
Notional Amount
Pricing
Spread
Assumed
Weighted
Average Life
A $812,150,000 S+98 9.91
X $878,000,000 T+400 9.66
Total Guaranteed $812,150,000
B $65,850,000 S+267.9 9.91
Total Non Guaranteed $65,850,000
Offered K-PLB Certificates:
1 As of the Cut-off Date
Classes
A & XFreddie
Mac
(Mortgage
Loan
Seller)
Freddie
Mac SPC
Trust,
Series
K-PLB
Classes
A & X
Investors
(including
Freddie
Mac)FREMF
2015-PLB
Mortgage
Trust
Class B Investors
Structural Diagram
Deal Characteristics 1
Collateral Type: Multifamily Fixed Rate Mortgage Loans
Collateral Structure Type: Balloon
Mortgaged Loans: 1
Initial Underlying Pool Balance: $878,000,000
Rating Agencies: Not Rated
Waterfall Structure: Pro Rata
State Concentration: CA (100.0%)
Mortgage Capped Interest Rate: 3.33%
Original Maturity: 120 months
DSCR: 2.27x
LTV: 52.4%
Debt Yield: 8.63%


