Page 1
Capital Regional District
Coastal Sea Level Rise Risk Assessment
Prepared by:
AECOM 200 – 415 Gorge Road East Victoria, BC, Canada V8T 2W1 www.aecom.com
January 2015
Attachment 1 to Appendix A
Page 3
AECOM Capital Regional District Coastal Sea Level Rise Risk Assessment
RPT-2015-01-26-CRD Coastal SLR Risk Assessment-60310678 FINAL.Docx
Statement of Qualifications and Limitations
The attached Report (the “Report”) has been prepared by AECOM Canada Ltd. (“Consultant”) for the benefit of the client (“Client”) in
accordance with the agreement between Consultant and Client, including the scope of work detailed therein (the “Agreement”).
The information, data, recommendations and conclusions contained in the Report (collectively, the “Information”):
• is subject to the scope, schedule, and other constraints and limitations in the Agreement and the qualifications
contained in the Report (the “Limitations”);
• represents Consultant’s professional judgement in light of the Limitations and industry standards for the preparation
of similar reports;
• may be based on information provided to Consultant which has not been independently verified;
• has not been updated since the date of issuance of the Report and its accuracy is limited to the time period and
circumstances in which it was collected, processed, made or issued;
• must be read as a whole and sections thereof should not be read out of such context;
• was prepared for the specific purposes described in the Report and the Agreement; and
• in the case of subsurface, environmental or geotechnical conditions, may be based on limited testing and on the
assumption that such conditions are uniform and not variable either geographically or over time.
Consultant shall be entitled to rely upon the accuracy and completeness of information that was provided to it and has no
obligation to update such information. Consultant accepts no responsibility for any events or circumstances that may have
occurred since the date on which the Report was prepared and, in the case of subsurface, environmental or geotechnical
conditions, is not responsible for any variability in such conditions, geographically or over time.
Consultant agrees that the Report represents its professional judgement as described above and that the Information has been
prepared for the specific purpose and use described in the Report and the Agreement, but Consultant makes no other
representations, or any guarantees or warranties whatsoever, whether express or implied, with respect to the Report, the
Information or any part thereof.
Without in any way limiting the generality of the foregoing, any estimates or opinions regarding probable construction costs or
construction schedule provided by Consultant represent Consultant’s professional judgement in light of its experience and the
knowledge and information available to it at the time of preparation. Since Consultant has no control over market or economic
conditions, prices for construction labour, equipment or materials or bidding procedures, Consultant, its directors, officers and
employees are not able to, nor do they, make any representations, warranties or guarantees whatsoever, whether express or
implied, with respect to such estimates or opinions, or their variance from actual construction costs or schedules, and accept no
responsibility for any loss or damage arising therefrom or in any way related thereto. Persons relying on such estimates or
opinions do so at their own risk.
Except (1) as agreed to in writing by Consultant and Client; (2) as required by-law; or (3) to the extent used by governmental
reviewing agencies for the purpose of obtaining permits or approvals, the Report and the Information may be used and relied
upon only by Client.
Consultant accepts no responsibility, and denies any liability whatsoever, to parties other than Client who may obtain access to
the Report or the Information for any injury, loss or damage suffered by such parties arising from their use of, reliance upon, or
decisions or actions based on the Report or any of the Information (“improper use of the Report”), except to the extent those
parties have obtained the prior written consent of Consultant to use and rely upon the Report and the Information. Any injury, loss
or damages arising from improper use of the Report shall be borne by the party making such use.
This Statement of Qualifications and Limitations is attached to and forms part of the Report and any use of the Report is subject to the terms hereof.
Page 4
AECOM Capital Regional District Coastal Sea Level Rise Risk Assessment
RPT-2015-01-26-CRD Coastal SLR Risk Assessment-60310678 FINAL.Docx
Page 5
AECOM Capital Regional District Coastal Sea Level Rise Risk Assessment
RPT-2015-01-26-CRD Coastal SLR Risk Assessment-60310678 FINAL.Docx Page i
Executive Summary
1. Project Context. With global sea levels projected to continue rising, public and private assets and shoreline
land uses across the Capital Regional District (CRD) have the potential to experience an increase in
frequency and magnitude of periodic inundation events as well as permanent inundation. The Coastal Sea
Level Rise Risk Assessment project has been developed as a first phase in CRD’s multi-year project to
gather information to support future analysis and policy response for sea level rise (SLR) within the CRD.
CRD is the first BC regional district to have completed mapping based on the draft provincial guidelines for
floodplain mapping and intends to use the mapping and findings from this project to consult and provide
feedback to the Province on the proposed guidelines, and planning for the impacts that SLR will have in the
CRD region. Mapping based on provincial guidelines shows that any significant impacts from sea level rise
will not be felt until 2050 or beyond, and advanced planning can be applied to help avoid or manage such
impacts before they are realised.
2. Uses and Limitation. This project is the very first step to assess how the region’s shoreline may look 35, 85
and 185 years in the future. The mapping from this study considers static sea level rise, coupled with
relatively extreme 1 in 500 year storm surge conditions, so while areas may be depicted within an inundation
zone, this does not mean these areas will necessarily experience flooding due to sea level rise and storm
surge in the future. Significant further analysis is necessary to fully understand what the effects of future sea
level rise may be in these coastal areas. Establishing flood hazard boundaries is a responsibility of local
government, and each municipality within the region will determine how they will respond to future sea level
rise. Once future flood hazard area boundaries are established by municipalities, there are many tools that
can be used to address sea level rise within these areas. These include planning and regulatory tools, land
use change or restriction, structural tools including flood protection works, and non-structural tools such as
soft armouring by wetland construction. Future work for specific locations should be used to confirm the data
used and produced in this report.
3. Project Objectives. The primary purpose of this project was to identify and map areas that are vulnerable to
SLR within the CRD. The secondary purpose was to understand the potential economic consequences of
SLR, thereby providing information to support development of future policy and land use regulations. The
technical scope of work to deliver these objectives was designed to align with the available project funding,
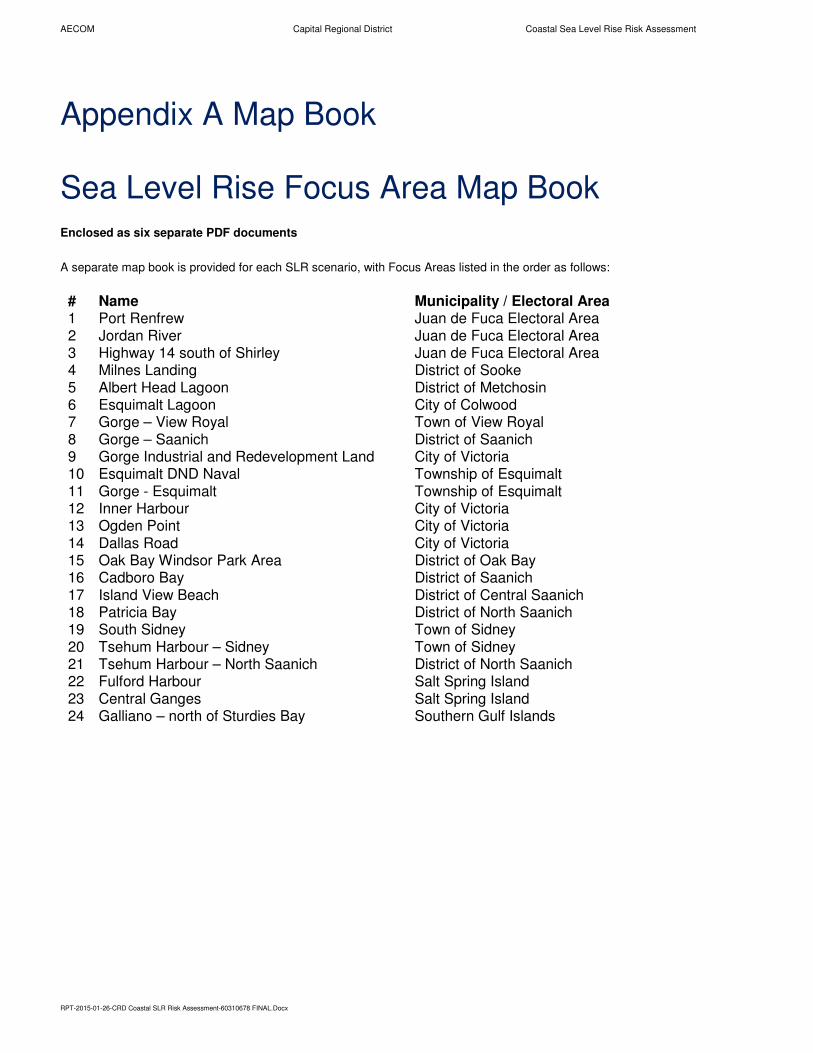
and the mapping (Appendix A) and other data reporting (Appendix B) was focused on 24 key areas (“Sea
Level Rise Focus Areas”) that were selected because of the relatively high levels of expected future
inundation and / or the key community assets that are present in those areas. Three high-level case studies
were developed to help identify the potential service disruption effects that could occur under sea level rise
and storm surge conditions. These case studies were for transportation disruption (based on disruption to
Highway 14 south of Shirley), local community disruption (in the Oak Bay Windsor Park residential area),
and business disruption (in the Victoria Inner Harbour).
4. Approach to Mapping. The maps developed for the project show the anticipated future shoreline at high
tide, and during storm surge conditions in 2050, 2100 and 2200. The mapping is based on the 2011
Province of BC Coastal Floodplain Mapping Guidelines and Specifications Report, and uses the
recommended SLR levels for those time periods and 1 in 500 year storm surge conditions. A digital
elevation model was developed for across the region, and then factors that will influence future sea levels
were layered onto the model to give an estimation of the future shoreline. These factors include projections
for static SLR, highest high water large tide (HHWLT) values collected from hydrological monitoring at over
30 sites across the region, vertical land elevation figures which address seismic activity, and the 1 in 500
year storm surge conditions.
Page 6
AECOM Capital Regional District Coastal Sea Level Rise Risk Assessment
RPT-2015-01-26-CRD Coastal SLR Risk Assessment-60310678 FINAL.Docx Page ii
5. SLR Focus Areas. Once maps were developed for the entire CRD coastline a workshop was run with the
CRD Project Team to identify the key assets (e.g. key municipal infrastructure) that exist within the coastal
areas that could be subject to flooding for the scenarios considered. This was used to help define SLR
Focus Areas for a selection of areas with key assets and relatively high levels of expected future inundation.
A set of 24 SLR Focus Areas were then defined and for each area maps were produced to show inundation
levels for the different sea level rise scenarios (for 2050, 2100 and 2200, and with and without 1 in 500 year
storm surge conditions).
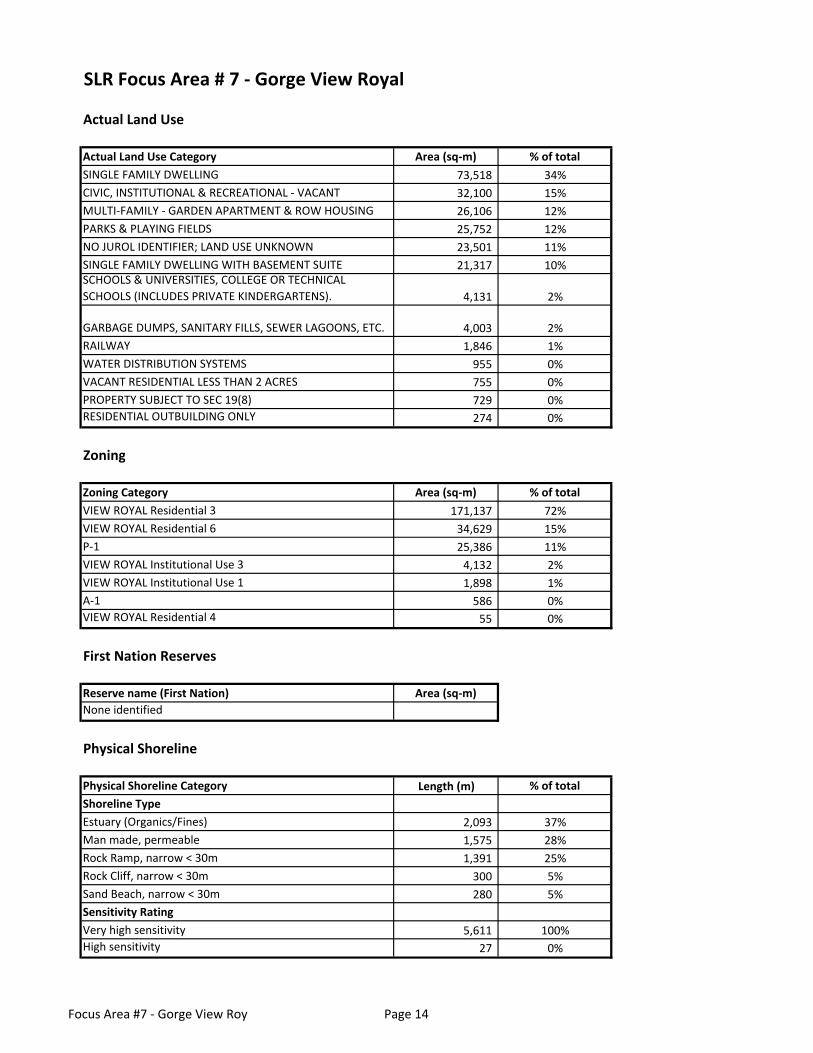
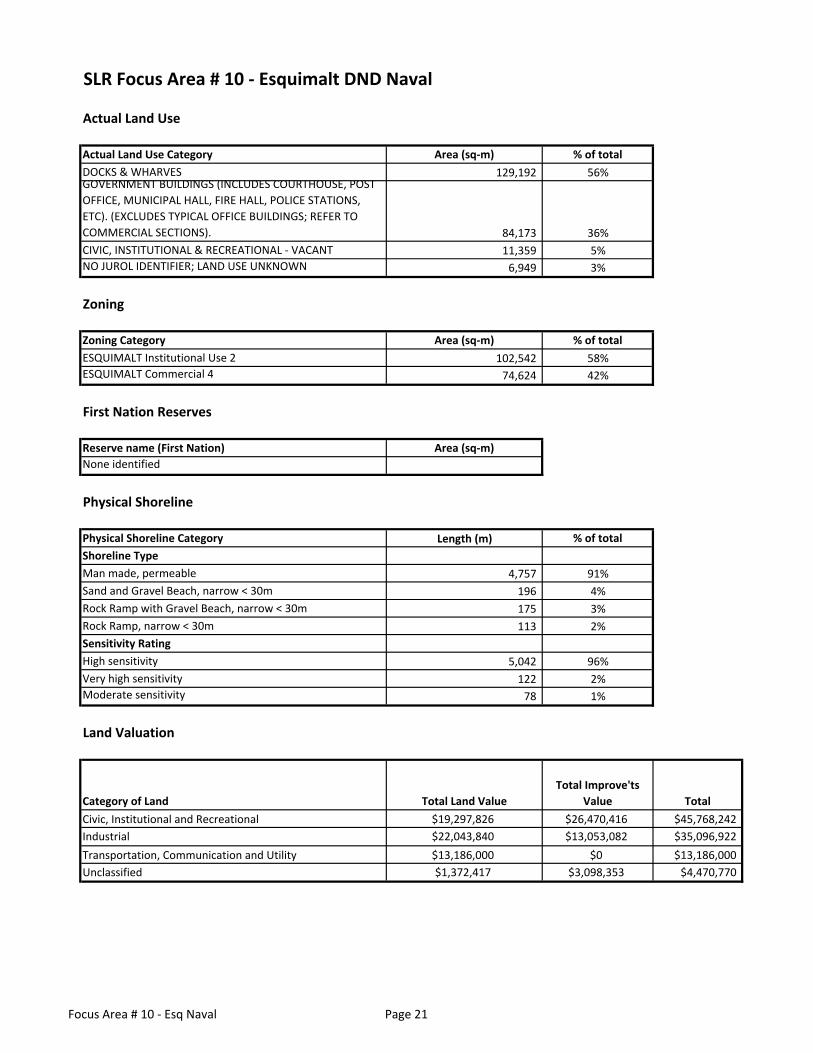
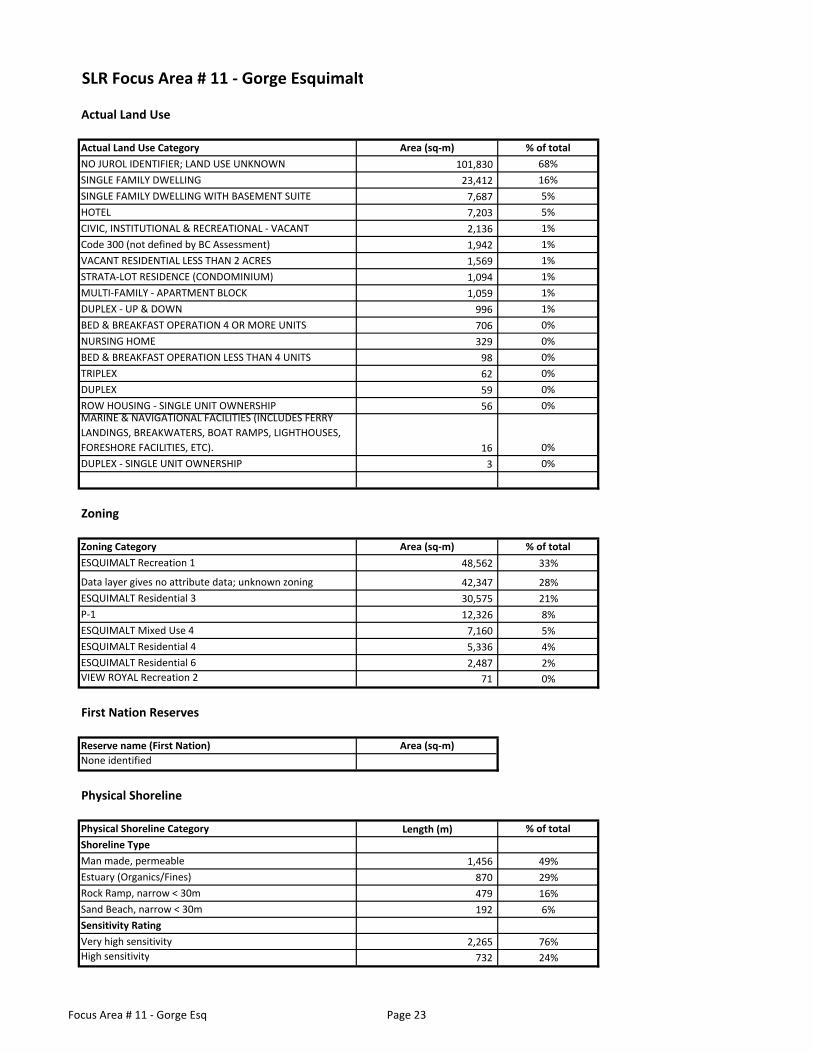
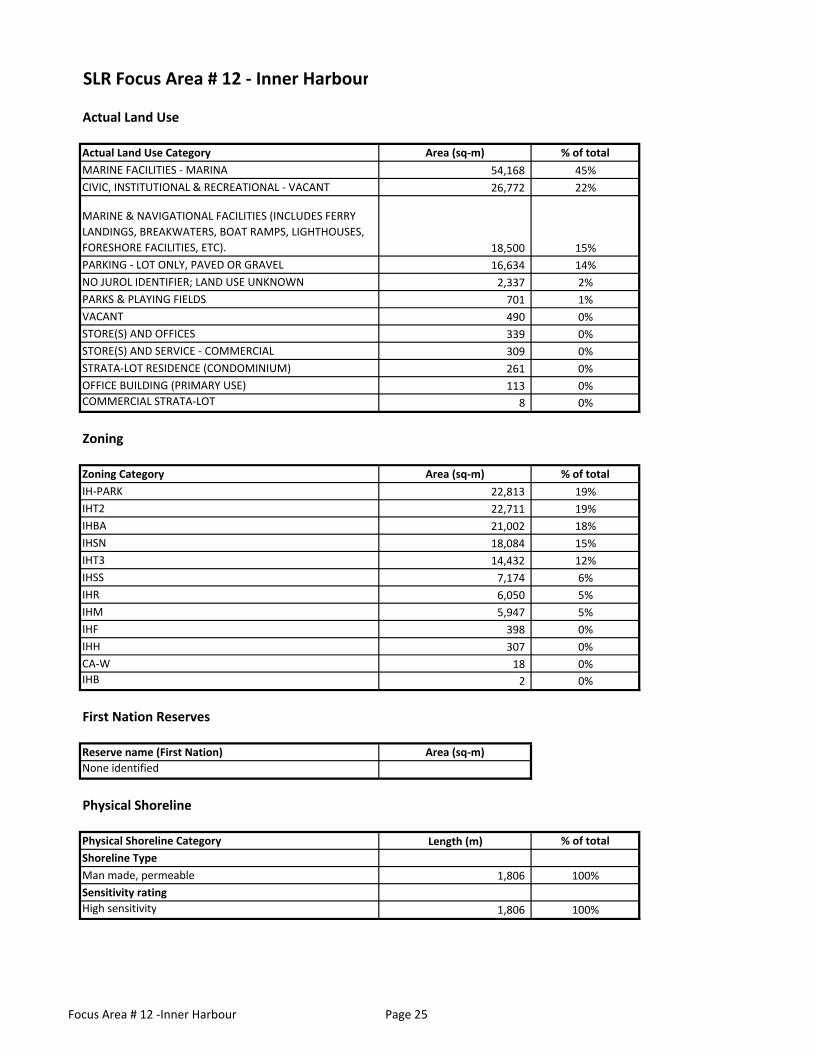
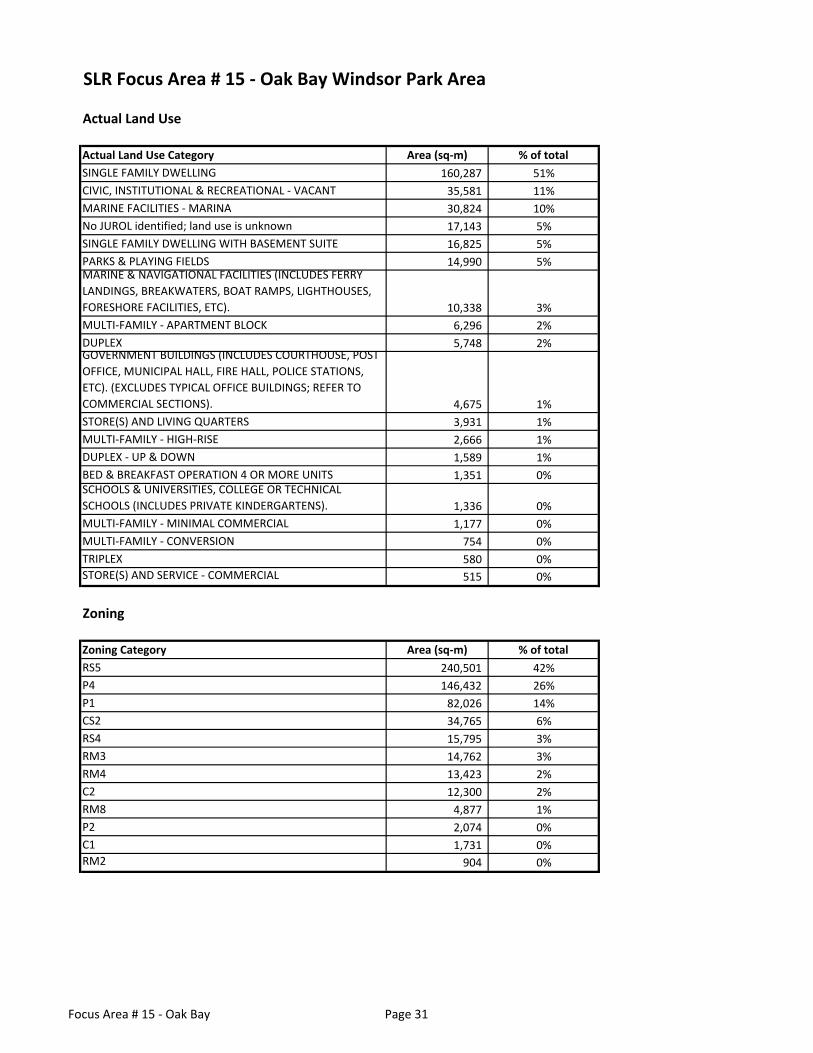
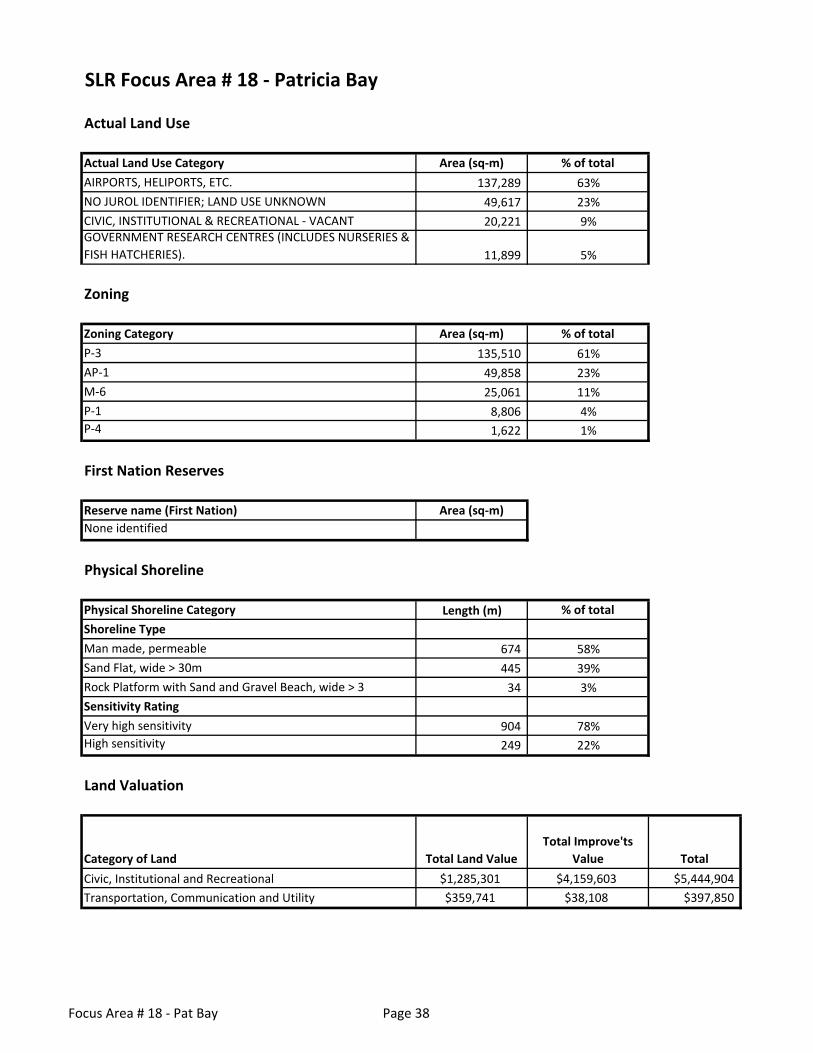
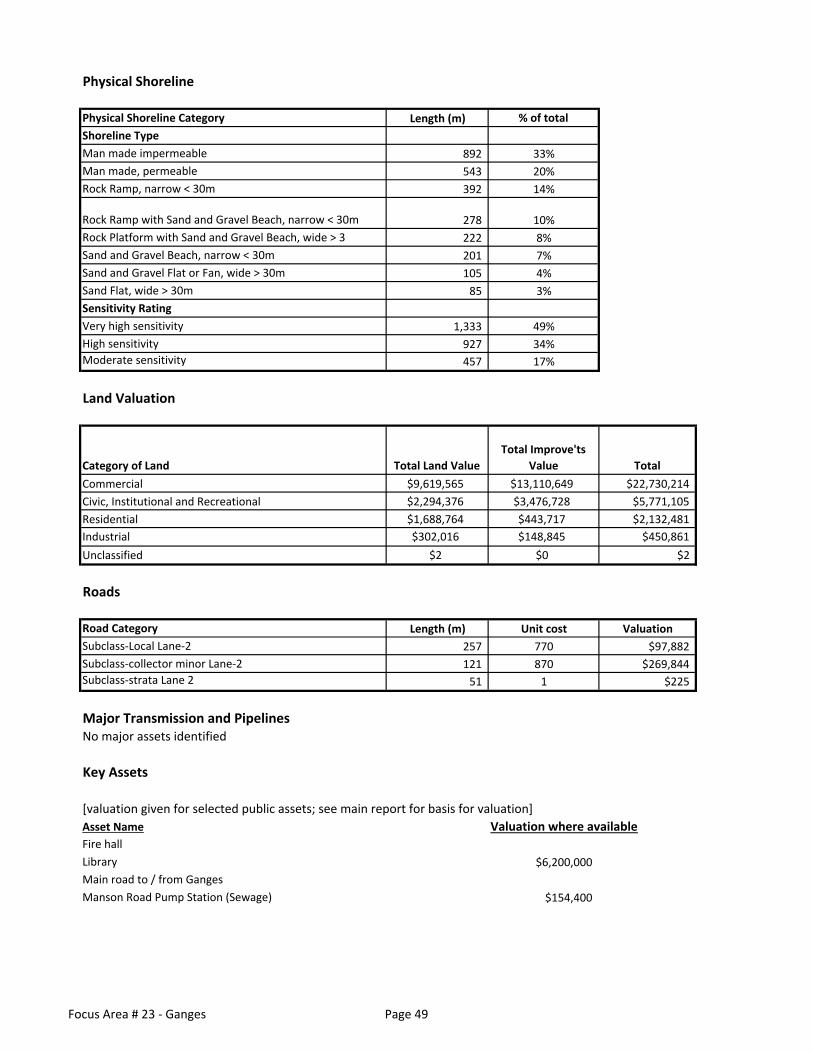
6. Description of land and assets within each SLR Focus Area. Data were compiled to define land use,
shoreline sensitivity to sea level rise, valuation of land and improvements, roads and presence of key public
assets within the areas that would be flooded within the selected scenario of SLR in year 2100 plus the 1 in
500 year storm surge conditions. These data were provided by CRD and included: municipal zoning data,
BC Assessment data for actual use of land and market valuation of land and improvements, location of
roads, and replacement cost estimates for key public assets. These data are reported in Appendix B and
help describe the assets that would theoretically be at risk for the selected scenario if the 1 in 500 storm
surge scenario occurs and assuming no management measures were put in place.
7. Key Findings and Recommendations.
a. As a result of varying topography there are different levels of inundation that may occur across the CRD
coastline for the SLR and storm surge scenarios that were considered as part of this project. Many of
the lower lying areas that may have higher levels of inundation coincide with developed and populated
areas, leading to the potential for infrastructure damage, safety risk and service disruption. As well as
the key areas represented in the 24 SLR Focus Areas, there are other parts of the CRD outside of these
selected areas that could have inundation effects under these scenarios and these areas should also be
considered during future mapping and planning work.
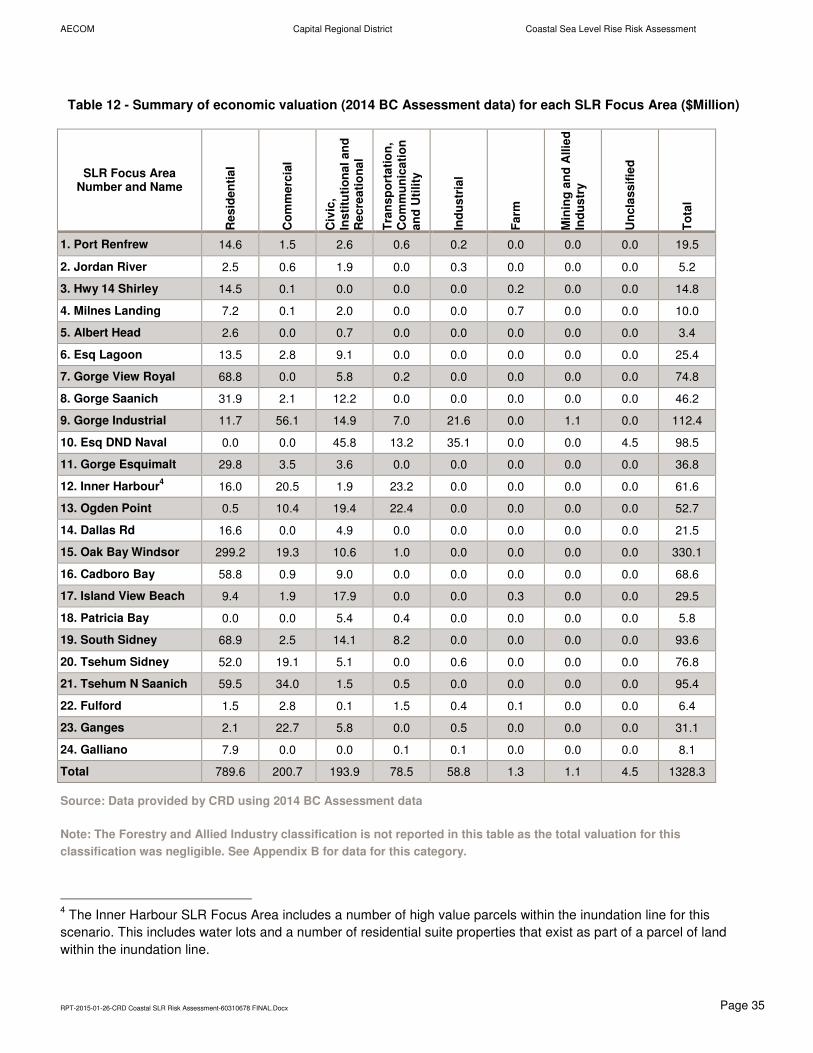
b. For the 24 Focus Areas used for this project the total valuation of land and improvements (as defined by
BC Assessment) within the year 2100 + 500-year storm surge inundation line ranges from $330 million
(for the Oak Bay Windsor Park SLR Focus Area) to $3.4 million (Albert Head SLR Focus Area). These
are total asset values based on market valuation and do not infer expected losses that would occur from
periodic inundation. Across the 24 SLR Focus Areas, BC Assessment data show that residential
property has the highest total assessed value followed by commercial and then civic, institutional and
recreational land uses.
c. The key assets that would be at least partially inundated for this selected scenario (and assuming no
future management measures are put in place) within the 24 SLR Focus Areas are principally network
structures for water and wastewater, and some road bridges could be affected. There is the potential for
some large businesses to be at least partially inundated, with some of their operations (e.g. ferry, float
plane) being regionally important for the tourism sector. There are also a large number of marine docks
that are within the inundation line for this scenario, though it has not been assumed that infrastructure
damage would necessarily occur to the dock structures themselves.
d. One of the main areas of Highway inundation for the year 2100 plus 1 in 500-year storm surge scenario
is at Highway 14 between Sooke and Port Renfrew, and this area was used as a case study for
transport service disruption. In other SLR Focus Areas there are a range of local and connector roads
that would be subject to inundation for this scenario.
e. The key recommendation is that CRD use the analysis and mapping conducted for the 24 SLR Focus
Areas as an evidence base for the identification and appraisal of options for a future model bylaw that
deals with SLR management for the CRD. In particular, the data reported in this project demonstrates
the types of land use, key assets, services and indicative economic values that exist in areas at
inundation risk, and this evidence will help to develop the objectives for and assess the impacts of
different management options.
Page 7
AECOM Capital Regional District Coastal Sea Level Rise Risk Assessment
RPT-2015-01-26-CRD Coastal SLR Risk Assessment-60310678 FINAL.Docx Page iii
Table of Contents
Statement of Qualifications and Limitations
Executive Summary
page
1. Introduction .................................................................................................................................. 1
1.1 Background .......................................................................................................................................... 1
1.2 Project Objectives ................................................................................................................................ 1
1.3 Project deliverables ............................................................................................................................. 2
1.4 Report Outline ...................................................................................................................................... 2
1.5 Uses and Limitations ........................................................................................................................... 2
1.6 Acknowledgements .............................................................................................................................. 3
2. Methods ........................................................................................................................................ 5
2.1 Overview .............................................................................................................................................. 5
2.2 Inundation Mapping ............................................................................................................................. 5
2.2.1 Water Level Analysis .............................................................................................................. 5
2.2.2 Existing Conditions Water Levels ........................................................................................... 6
2.2.3 Future Conditions Water Level Analysis................................................................................. 8
2.2.3.1 Sea Level Rise ..................................................................................................... 8
2.2.3.2 Storm Surge ......................................................................................................... 9
2.2.3.3 Wave effects ......................................................................................................... 9
2.2.3.4 Freeboard ............................................................................................................. 9
2.2.3.5 Inundation Mapping Scenarios ........................................................................... 10
2.2.4 Inundation Map Development ............................................................................................... 10
2.2.4.1 Topographic Data ............................................................................................... 10
2.2.4.2 Water Surface DEM Creation ............................................................................. 11
2.2.4.3 Inundation Depths .............................................................................................. 11
2.2.4.4 Inundation Mapping Caveats .............................................................................. 11
2.3 Identification of key assets................................................................................................................. 12
2.3.1 Use of Key Assets ................................................................................................................ 12
2.3.2 Spatial data ........................................................................................................................... 12
2.3.3 Workshop .............................................................................................................................. 13
2.4 Definition of Sea Level Rise Focus Areas ......................................................................................... 13
2.5 Land Use Analysis ............................................................................................................................. 14
2.6 Identification of Physical Shoreline Characteristics ........................................................................... 15
2.7 Valuation of Land and Improvements ................................................................................................ 15
2.8 Valuation of Roads ............................................................................................................................ 16
2.9 Valuation of Key Public Assets .......................................................................................................... 17
2.10 Service Disruption .............................................................................................................................. 18
2.11 Summary of Source Data .................................................................................................................. 19
3. Results ........................................................................................................................................ 21
3.1 Sea Level Rise Focus Areas ............................................................................................................. 21
3.2 Inundation Mapping ........................................................................................................................... 22
3.3 Land Use, Roads and other Infrastructure ........................................................................................ 31
3.4 Shoreline Type and Sensitivity Rating ............................................................................................... 31
3.5 Identification and Valuation of Key Public Assets ............................................................................. 31
Page 8
AECOM Capital Regional District Coastal Sea Level Rise Risk Assessment
RPT-2015-01-26-CRD Coastal SLR Risk Assessment-60310678 FINAL.Docx Page iv
3.6 Economic Valuation ........................................................................................................................... 34
3.7 Service Disruption .............................................................................................................................. 36
3.7.1 Summary of Case Study Results .......................................................................................... 36
3.7.2 Transportation Disruption Case Study.................................................................................. 36
3.7.2.1 Overview ............................................................................................................. 36
3.7.2.2 Indicators and Data Metrics ................................................................................ 37
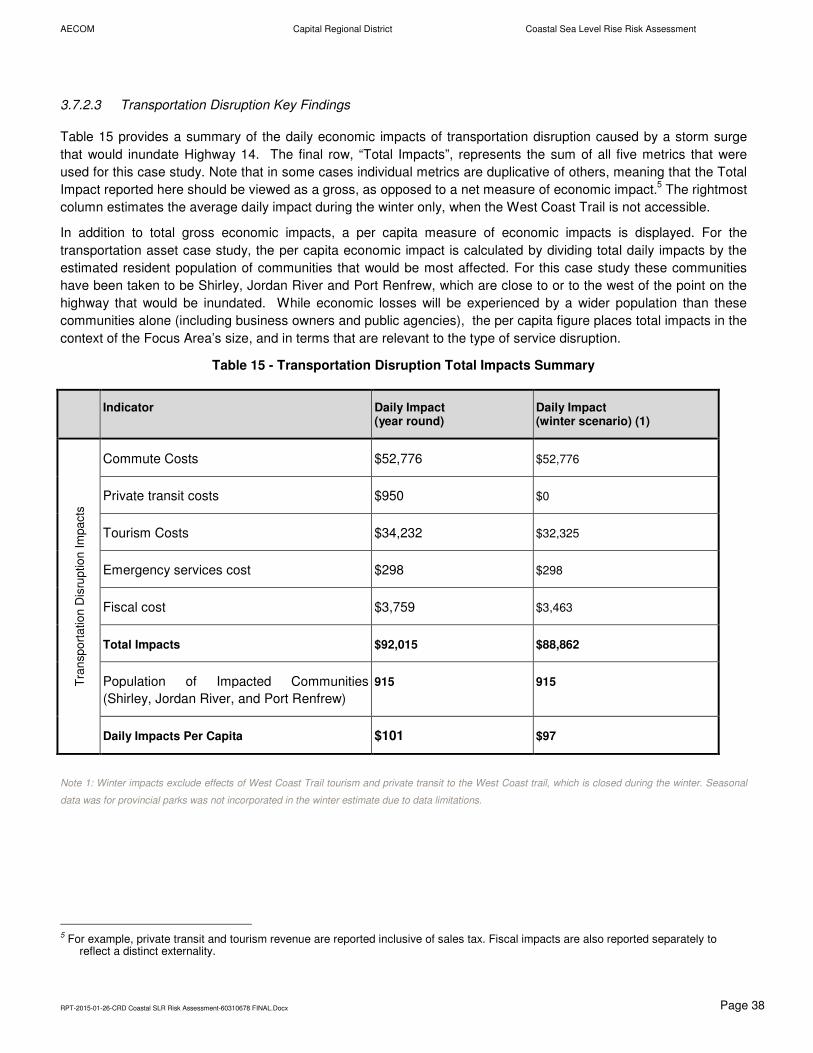
3.7.2.3 Transportation Disruption Key Findings ............................................................. 38
3.7.3 Community Disruption Case Study ....................................................................................... 39
3.7.3.1 Case Study Overview ......................................................................................... 39
3.7.3.2 Indicators and Data Metrics ................................................................................ 39
3.7.3.3 Community Disruption Key Findings .................................................................. 40
3.7.4 Business Disruption Case Study .......................................................................................... 42
3.7.4.1 Overview of Case Study ..................................................................................... 42
3.7.4.2 Service Disruption Indicators and Data Metrics ................................................. 42
3.7.4.3 Summary of Costs .............................................................................................. 43
4. Conclusions ............................................................................................................................... 45
5. Recommendations ..................................................................................................................... 47
List of Figures
Figure 1 - Overview of project tasks .............................................................................................................................. 5
Figure 2 - Spatial Variability of HHWLT and Hydrographic Zones in CRD Study Area................................................. 8
Figure 3 - Map of Sea Level Rise Focus Areas ........................................................................................................... 23
Figure 4 - Inundation maps for the Oak Bay Windsor Park Area SLR Focus Area ..................................................... 24
List of Tables
Table 1 - Comparison of Conversion Techniques from Local CD to CGVD28 ............................................................. 6
Table 2 - Tidal Datums for CRD Study Area Tide Stations ........................................................................................... 6
Table 3 - Vertical Land Movement for Each Hydrographic Zone in CRD Study Area ................................................... 9
Table 4 - Future Projections of HHWLT and Extreme High Tide for the CRD Study Area ......................................... 10
Table 5 - Assumed Road Construction Material Thicknesses ..................................................................................... 17
Table 6 - Cost assumptions used for different road types ........................................................................................... 17
Table 7 - Summary of data sources used for project analysis .................................................................................... 19
Table 8 - List of SLR Focus Areas and their municipality or electoral area ................................................................ 21
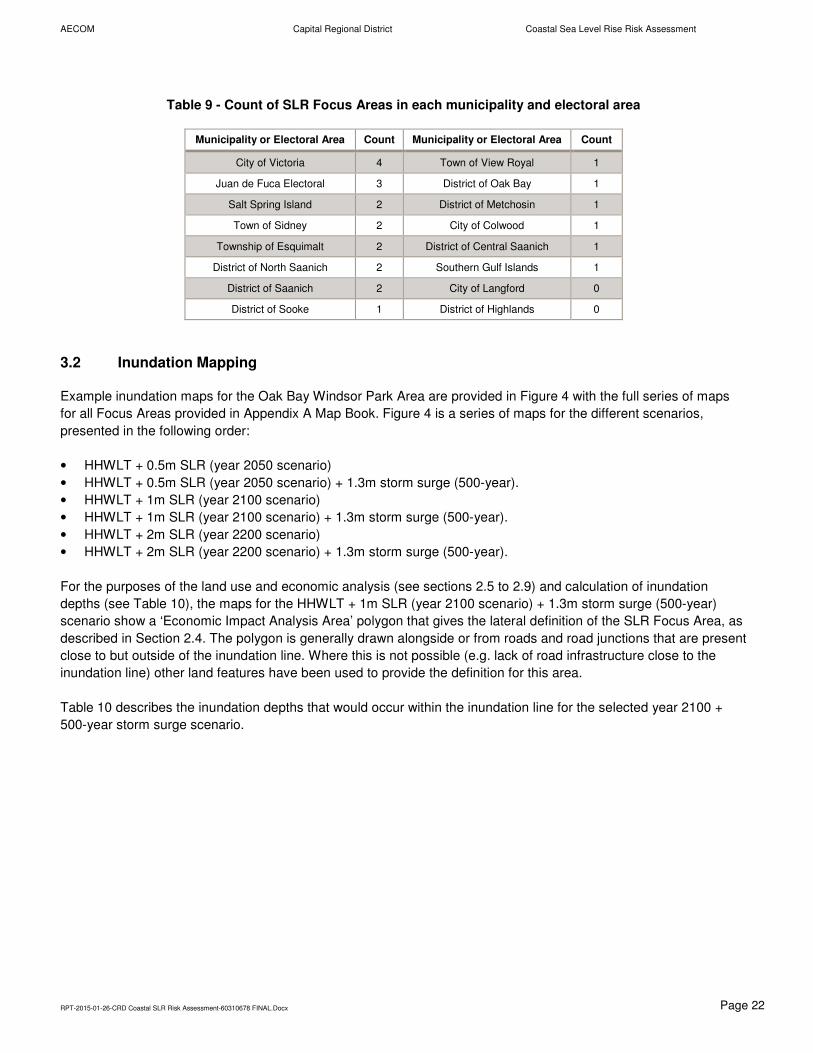
Table 9 - Count of SLR Focus Areas in each municipality and electoral area ............................................................ 22
Table 10 - Level of inundation for each SLR Focus Area (2100 + 500-year storm surge scenario) ........................... 30
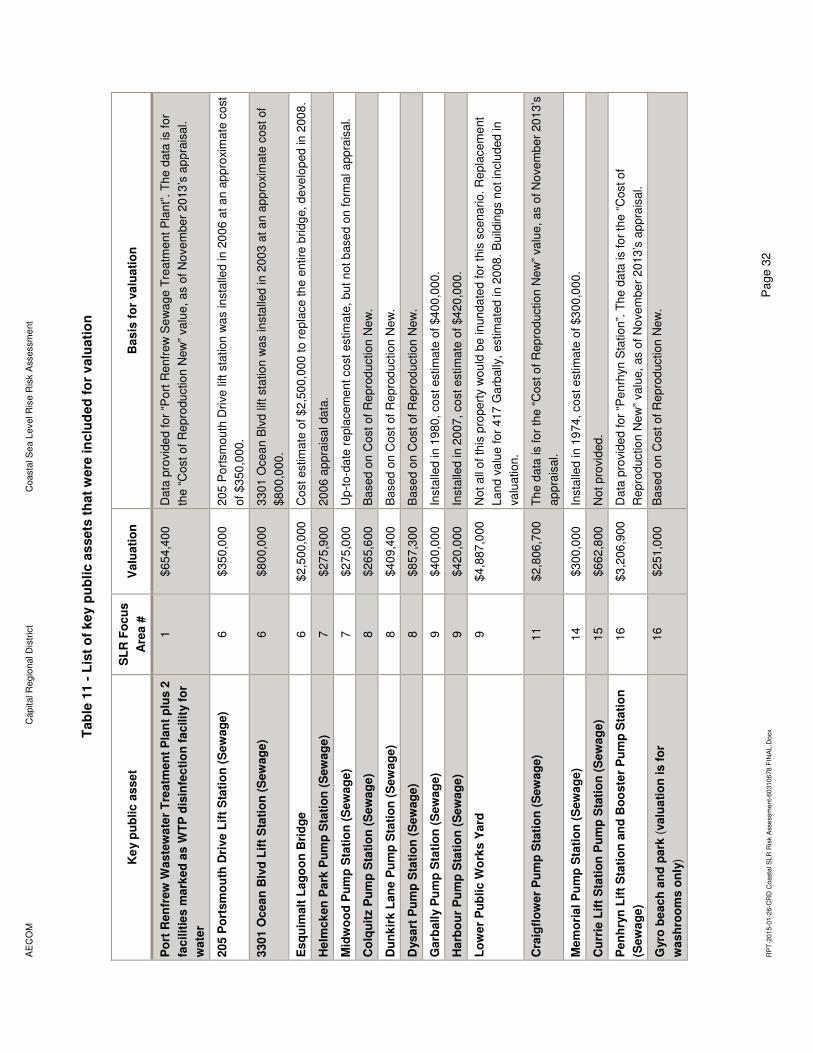
Table 11 - List of key public assets that were included for valuation .......................................................................... 32
Table 12 - Summary of economic valuation (BC Assessment data) for each SLR Focus Area ($Million) .................. 35
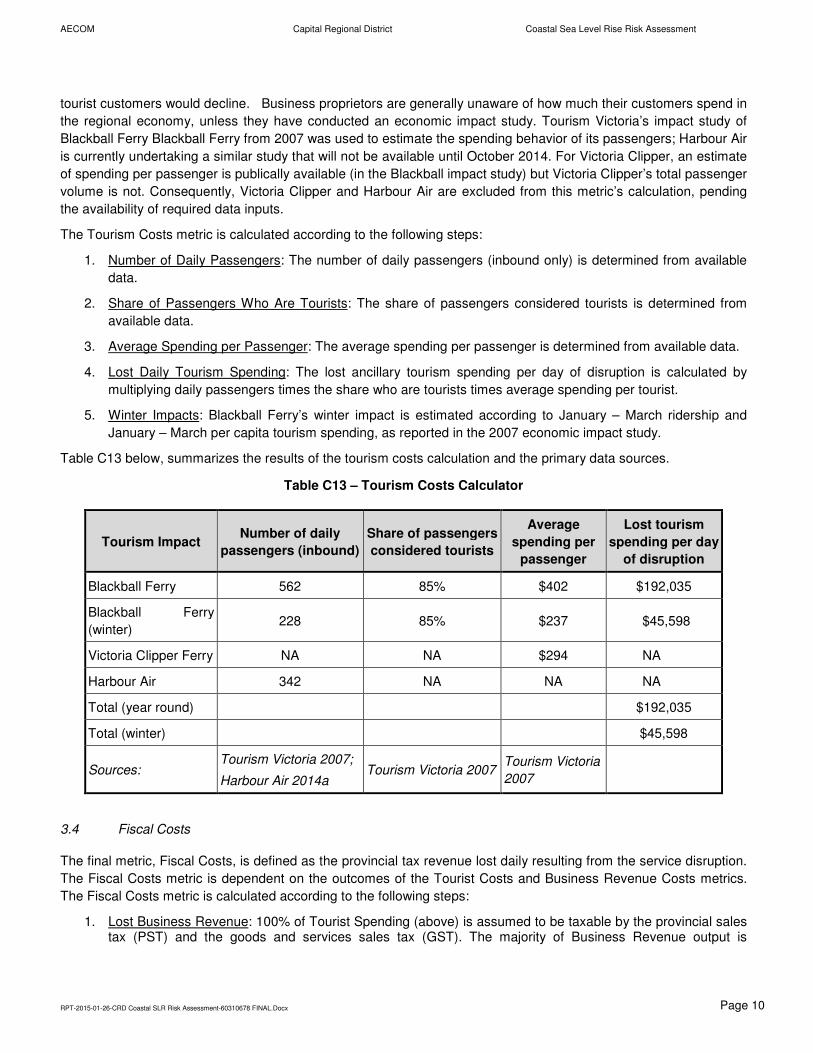
Table 13 - Summary of economic impacts for service disruption case studies ........................................................... 36
Table 14 – Transportation Disruption Cost Indicators ................................................................................................. 37
Table 15 - Transportation Disruption Total Impacts Summary .................................................................................... 38
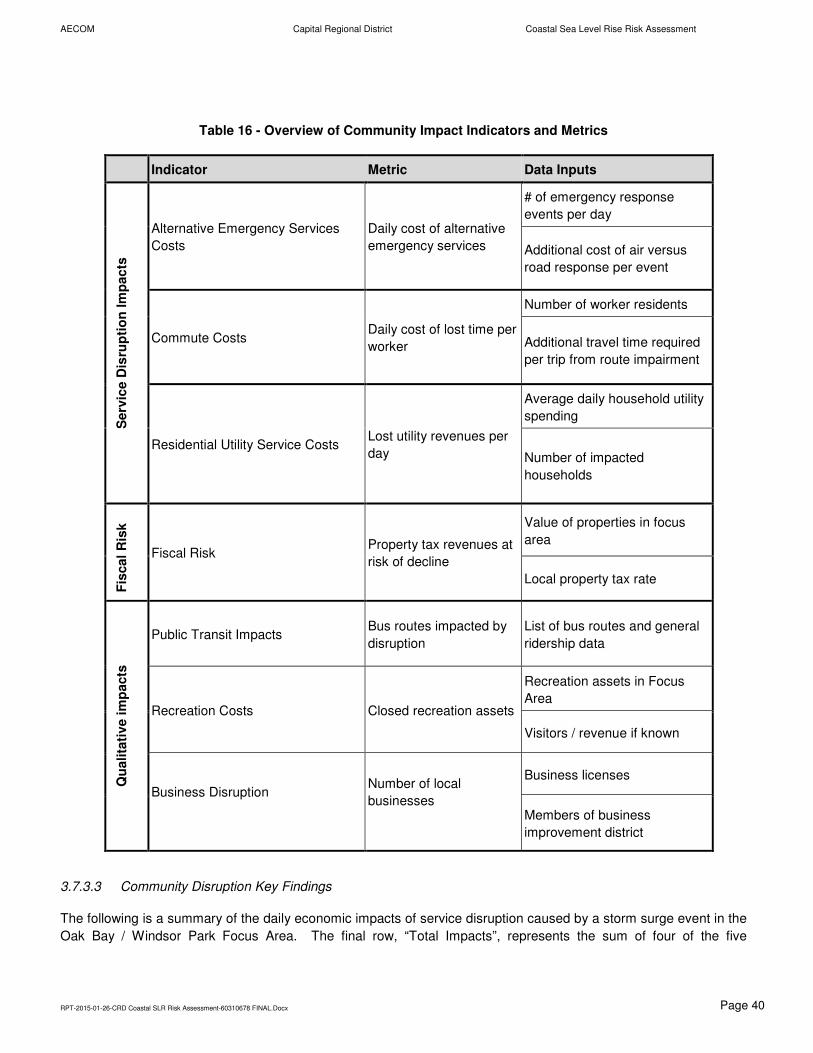
Table 16 - Overview of Community Impact Indicators and Metrics ............................................................................. 40
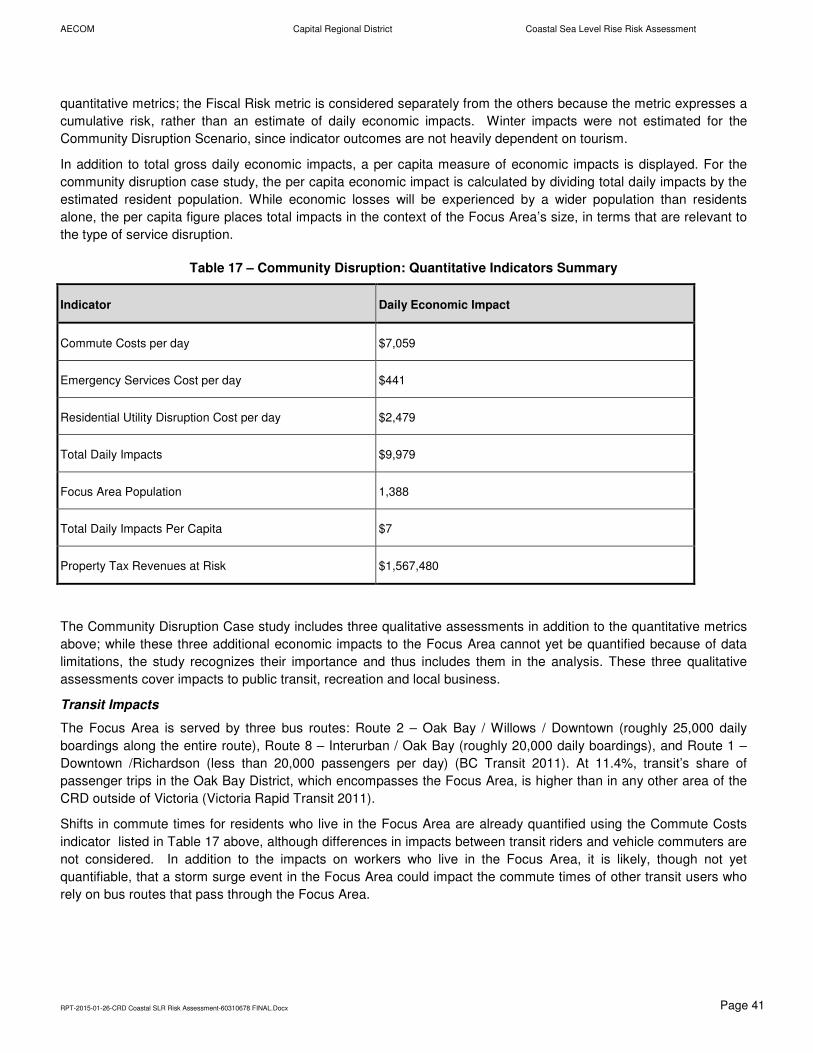
Table 17 – Community Disruption: Quantitative Indicators Summary ......................................................................... 41
Page 9
AECOM Capital Regional District Coastal Sea Level Rise Risk Assessment
RPT-2015-01-26-CRD Coastal SLR Risk Assessment-60310678 FINAL.Docx Page v
Table 18 – Business Disruption Indicators and Metrics .............................................................................................. 43
Table 19 – Business Disruption Total Costs Summary ............................................................................................... 44
Appendices
Appendix A Sea Level Rise Focus Area Map Book
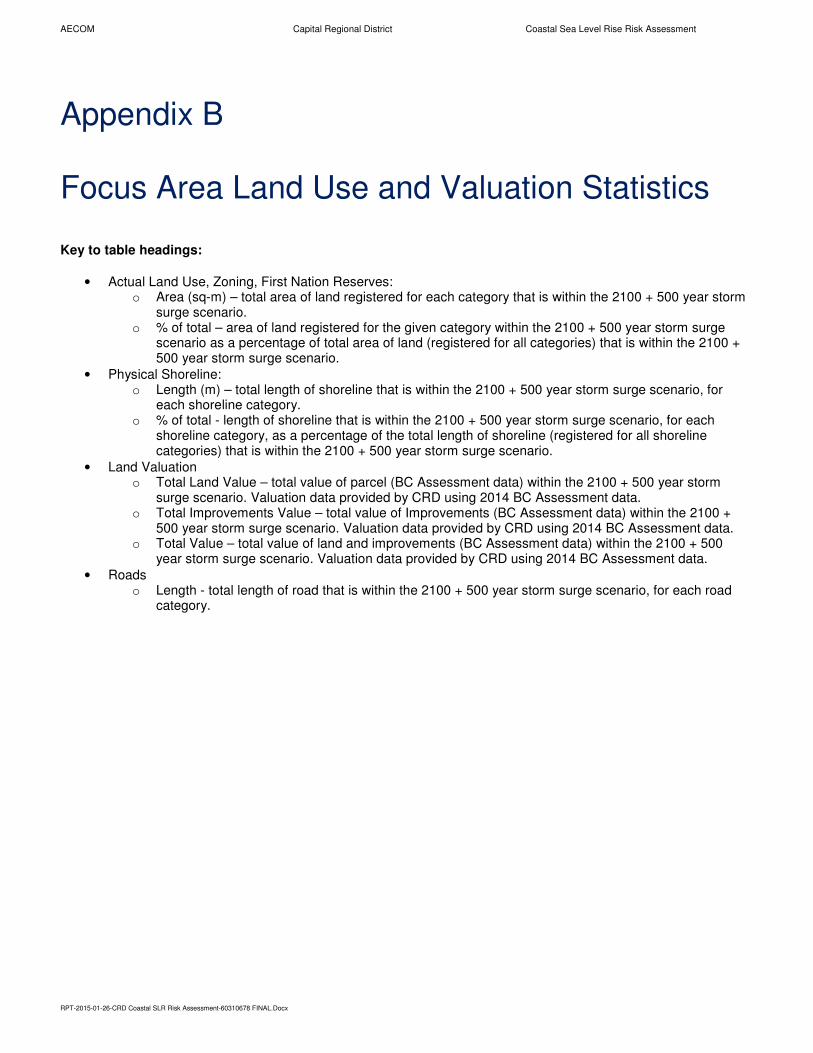
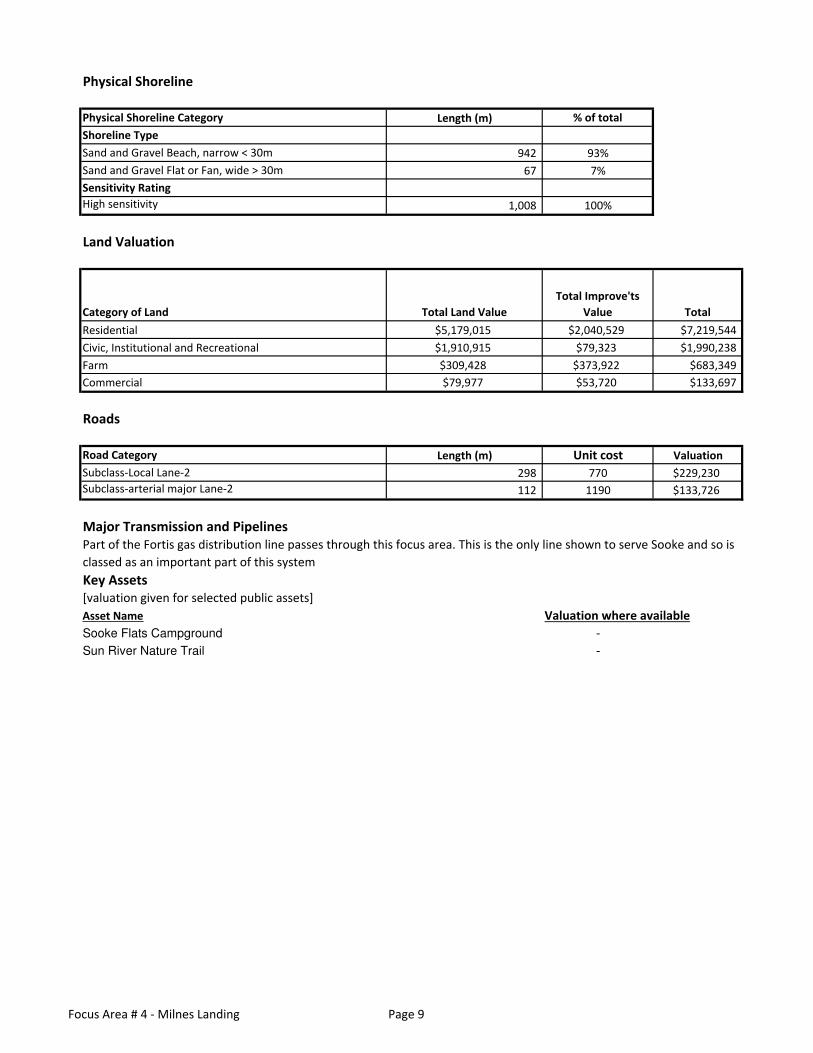
Appendix B Focus Area Land Use and Valuation Statistics
Appendix C Methods for Service Disruption case studies
Appendix D References
Page 10
AECOM Capital Regional District Coastal Sea Level Rise Risk Assessment
RPT-2015-01-26-CRD Coastal SLR Risk Assessment-60310678 FINAL.Docx Page i
Page 11
AECOM Capital Regional District Coastal Sea Level Rise Risk Assessment
RPT-2015-01-26-CRD Coastal SLR Risk Assessment-60310678 FINAL.Docx Page 1
1. Introduction
1.1 Background
Historically, the main causes of coastal flooding are attributed to astronomical tides coupled with the meteorological
influences associated with storms (BC Ministry of Forests, Lands and Natural Resource Operations, 2011). With
global sea levels projected to continue rising, public and private assets along with land uses in shoreline areas
across the Capital Regional District (CRD) have the potential to experience an increase in frequency and magnitude
of periodic inundation events as well as permanent inundation. Therefore, incorporation of future flood hazard
impacts into development of coastal hazard maps can provide science-based support to allow prioritization of
resource allocation to best prepare coastal communities, fragile ecosystems, and jeopardized infrastructure.
Within the Province of British Columbia (BC), local governments have responsibility for making decisions about local
floodplain management practices, including decisions about floodplain bylaws (BC Ministry of Forests, Lands and
Natural Resource Operations, 2011). The CRD is planning a series of work that will contribute to the development of
a model bylaw for managing the impact of sea level rise (SLR). Such a bylaw is one of the regulatory adaptation
strategies that can be put into place at the local level (BC Ministry of Environment, 2013).
In 2011 the Province of BC issued guidelines and specifications for the development of floodplain maps to show
coastal hazard, including from SLR (BC Ministry of Forests, Lands and Natural Resource Operations, 2011). This
project is the first application of these guidelines by the CRD for the purposes of understanding coastal SLR risk at
the regional level.
The Coastal Sea Level Rise Risk Assessment project has been developed as a first phase in CRD’s multi-year
project to gather information to support future analysis and policy response for sea level rise (SLR) within the CRD.
CRD is the first BC regional district to have completed mapping based on the draft provincial guidelines for floodplain
mapping and intends to use the mapping and findings from this project to consult and provide feedback to the
Province on the proposed guidelines, and planning for the impacts that SLR will have in the CRD region. The
mapping based on provincial guidelines show that any significant impacts from sea level rise will not be felt until
2050 or beyond, and advanced planning can be applied to help avoid or manage such impacts before they are
realised.
1.2 Project Objectives
The primary purpose of this project was to identify and map areas that are vulnerable to SLR within the CRD. The
secondary purpose was to conduct a risk assessment to understand the potential economic consequences of SLR,
thereby providing information to support development of future policy and land use regulations.
The specific objectives of this project were:
1. To map future limits and depth of inundation in the CRD study area for multiple climate change planning
scenarios with Higher High Water Large Tide (HHWLT; the average annual high tide) and extreme high tide
(HHWLT plus storm surge).
2. To identify the different land uses that exist within areas that may be subject to future inundation.
3. To identify the total value of land, developments and infrastructure that exist within areas that may be
subject to future inundation.
4. To identify the key public assets that exist within areas that may be subject to future inundation.
Page 12
AECOM Capital Regional District Coastal Sea Level Rise Risk Assessment
RPT-2015-01-26-CRD Coastal SLR Risk Assessment-60310678 FINAL.Docx Page 2
5. To provide an evidence base of the above maps and data that can be used by CRD and regional
municipalities / electoral areas for future development of a model bylaw.
The technical scope of work to deliver these objectives was designed to align with the available project funding and
the geographic context of the CRD region, with extensive shoreline on the mainland portion of Vancouver Island as
well as many islands, with varying shoreline topography and land uses. The analysis and mapping for the project
was focused on a series of key areas that were selected because of the relatively high levels of expected future
inundation and / or the key community assets that are present in those areas (see section 2.4). The digital files
developed by the project and delivered to CRD give expected inundation profiles for the whole of the CRD coastline
and can be used by CRD to replicate this scope of work for those areas that were not included in the areas covered
by this project.
1.3 Project deliverables
The deliverables from this project are:
• This project report as a written record of the project.
• A separate map book showing spatial inundation information for the key areas that were analysed as part of
the project.
• Digital files that provide inundation levels for the different planning scenarios for the entire CRD coastline.
1.4 Report Outline
This report is structured with the following sections:
• Method – a summary of the technical approaches used to achieve the project objectives.
• Results – a summary of the maps and other data generated from the project.
• Conclusions – a summary of the key findings identified from the project.
• Recommendations – a listing of next steps and further work that could be done by CRD to implement these
findings in the context of model bylaw development.
• Appendix A – map book showing inundation levels for different scenarios (provided as separate documents)
• Appendix B – detailed land use and valuation statistics for each focus area.
• Appendix C – detailed methods used for service disruption case studies.
• Appendix D – listing of referenced data sources used in the project.
1.5 Uses and Limitations
This project is the very first step to assess how the region’s shoreline may look 35, 85 and 185 years in the future.
The mapping from this study considers static sea level rise, coupled with relatively extreme 1 in 500 year storm
surge conditions, so while areas may be depicted within an inundation zone, this does not mean these areas will
necessarily experience flooding due to sea level rise in the future. Significant further analysis is necessary to fully
understand what the effects of future sea level rise may be in these coastal areas. Establishing flood hazard
boundaries is a responsibility of local government, and each municipality within the region will determine how they
will respond to future sea level rise. Once future flood hazard area boundaries are established by municipalities,
there are many tools that can be used to address sea level rise within these areas. These include planning and
regulatory tools, land use change or restriction, structural tools including flood protection works, and non-structural
tools such as soft armouring by wetland construction. Future work for specific locations should be used to confirm
the data used and produced in this report.
Page 13
AECOM Capital Regional District Coastal Sea Level Rise Risk Assessment
RPT-2015-01-26-CRD Coastal SLR Risk Assessment-60310678 FINAL.Docx Page 3
1.6 Acknowledgements
This project was made possible with financial support from Natural Resources Canada’s Climate Change Impacts
and Adaptation Program, Tides Canada, City of Victoria, District of Saanich, and the Capital Regional District, with
additional support from the Province of British Columbia Climate Action Secretariat.
Page 15
AECOM Capital Regional District Coastal Sea Level Rise Risk Assessment
RPT-2015-01-26-CRD Coastal SLR Risk Assessment-60310678 FINAL.Docx Page 5
2. Methods
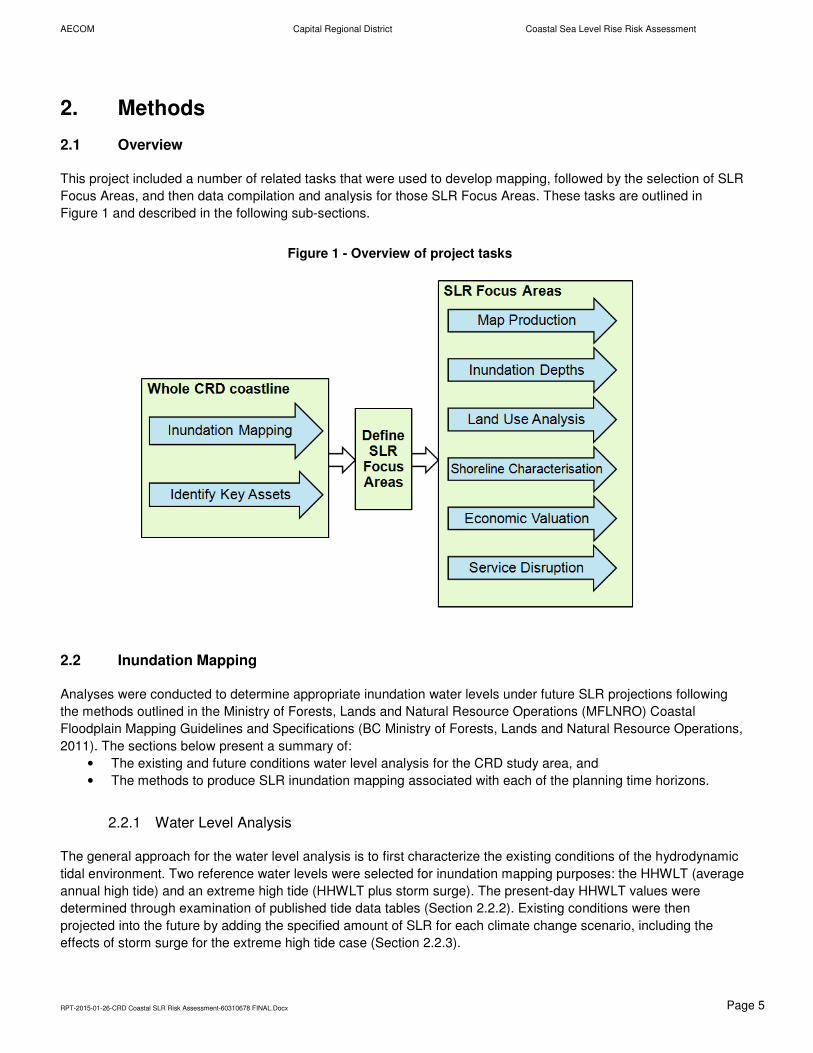
2.1 Overview
This project included a number of related tasks that were used to develop mapping, followed by the selection of SLR
Focus Areas, and then data compilation and analysis for those SLR Focus Areas. These tasks are outlined in
Figure 1 and described in the following sub-sections.
2.2 Inundation Mapping
Analyses were conducted to determine appropriate inundation water levels under future SLR projections following
the methods outlined in the Ministry of Forests, Lands and Natural Resource Operations (MFLNRO) Coastal
Floodplain Mapping Guidelines and Specifications (BC Ministry of Forests, Lands and Natural Resource Operations,
2011). The sections below present a summary of:
• The existing and future conditions water level analysis for the CRD study area, and
• The methods to produce SLR inundation mapping associated with each of the planning time horizons.
2.2.1 Water Level Analysis
The general approach for the water level analysis is to first characterize the existing conditions of the hydrodynamic
tidal environment. Two reference water levels were selected for inundation mapping purposes: the HHWLT (average
annual high tide) and an extreme high tide (HHWLT plus storm surge). The present-day HHWLT values were
determined through examination of published tide data tables (Section 2.2.2). Existing conditions were then
projected into the future by adding the specified amount of SLR for each climate change scenario, including the
effects of storm surge for the extreme high tide case (Section 2.2.3).
Figure 1 - Overview of project tasks
Page 16
AECOM Capital Regional District Coastal Sea Level Rise Risk Assessment
RPT-2015-01-26-CRD Coastal SLR Risk Assessment-60310678 FINAL.Docx Page 6
2.2.2 Existing Conditions Water Levels
The Canadian Hydrographic Service (CHS), tasked with maintaining Canada’s network of tide gauge instruments,
collects and publishes HHWLT elevations for approximately 40 Reference Stations and Secondary Stations for the
CRD study area in a series of Tide Table Volumes. The HHWLT is the average of the annual maximum higher high
water levels from approximately 19 years of predicted tide data and represents the average annual high tide level.
HHWLT and mean water level (MWL) values were obtained from Volume 5 of the Canadian Tide and Current
Tables. Data values are recorded relative to each station’s local Chart Datum (CD), which typically corresponds to
the lowest recorded low tide value. Since each station’s CD is different, it was necessary to convert all water levels
to a common vertical datum to facilitate consistent inundation mapping across the region. Conversion to Canada’s
national datum, the Canadian Geodetic Vertical Datum of 1928 (CGVD28), was achieved by assuming the local
MWL datum is approximately equal to the CGVD28 datum at each tide station (BC Ministry of Forests, Lands and
Natural Resource Operations, 2011). This approximate conversion technique is supported by comparing the CD to
MWL conversion factor derived from the tide tables to the vertical offset of HHWLT and CD elevations obtained from
24-hour benchmark occupations of two tidal stations as shown in Table 1. HHWLT values relative to CD were
converted to CGVD28 using the MWL offsets at each tide station (Table 2).
Table 1 - Comparison of Conversion Techniques from Local CD to CGVD28
Tidal Station CD to CGVD28 conversion based on 24-hr
benchmark occupation
CD to CGVD28 conversion based on
CD-MWL difference
Patricia Bay 2.26 m 2.26 m
Victoria 1.89 m 1.90 m
Source: Personal communication with Canadian Hydrographic Service.
Table 2 - Tidal Datums for CRD Study Area Tide Stations
Station Latitude
(deg)
Longitude
(deg)
HHWLT
(m CD)
MWL
(m CD)
HHWLT
(m CGVD28)
Port Renfrew 48.55 -124.417 3.8 1.9 1.9
Sooke 48.367 -123.733 3.6 1.9 1.7
Victoria 48.417 -123.367 3.4 1.9 1.5
Fulford Harbour 48.767 -123.45 3.8 2.3 1.5
Point No Point 48.4 -123.967 3.63 1.92 1.71
Sooke Basin 48.383 -123.683 3.32 1.83 1.50
Becher Bay 48.333 -123.633 3.41 1.77 1.65
Pedder Bay 48.333 -123.55 3.35 1.83 1.52
William Head 48.333 -123.533 3.26 1.77 1.49
Esquimalt 48.433 -123.433 3.38 1.89 1.49
Clover Point 48.4 -123.35 3.41 1.89 1.52
Oak Bay 48.433 -123.3 3.54 2.01 1.52
Finnerty Cove 48.467 -123.3 3.44 1.98 1.46
Page 17
AECOM Capital Regional District Coastal Sea Level Rise Risk Assessment
RPT-2015-01-26-CRD Coastal SLR Risk Assessment-60310678 FINAL.Docx Page 7
Station Latitude
(deg)
Longitude
(deg)
HHWLT
(m CD)
MWL
(m CD)
HHWLT
(m CGVD28)
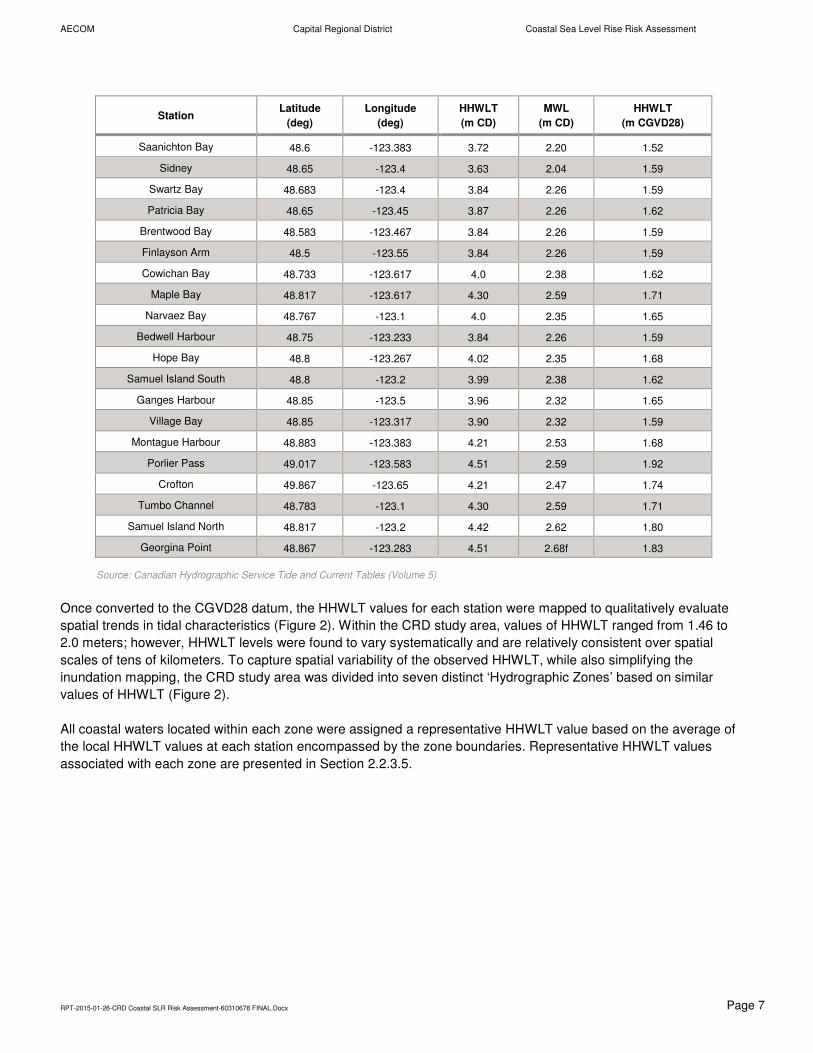
Saanichton Bay 48.6 -123.383 3.72 2.20 1.52
Sidney 48.65 -123.4 3.63 2.04 1.59
Swartz Bay 48.683 -123.4 3.84 2.26 1.59
Patricia Bay 48.65 -123.45 3.87 2.26 1.62
Brentwood Bay 48.583 -123.467 3.84 2.26 1.59
Finlayson Arm 48.5 -123.55 3.84 2.26 1.59
Cowichan Bay 48.733 -123.617 4.0 2.38 1.62
Maple Bay 48.817 -123.617 4.30 2.59 1.71
Narvaez Bay 48.767 -123.1 4.0 2.35 1.65
Bedwell Harbour 48.75 -123.233 3.84 2.26 1.59
Hope Bay 48.8 -123.267 4.02 2.35 1.68
Samuel Island South 48.8 -123.2 3.99 2.38 1.62
Ganges Harbour 48.85 -123.5 3.96 2.32 1.65
Village Bay 48.85 -123.317 3.90 2.32 1.59
Montague Harbour 48.883 -123.383 4.21 2.53 1.68
Porlier Pass 49.017 -123.583 4.51 2.59 1.92
Crofton 49.867 -123.65 4.21 2.47 1.74
Tumbo Channel 48.783 -123.1 4.30 2.59 1.71
Samuel Island North 48.817 -123.2 4.42 2.62 1.80
Georgina Point 48.867 -123.283 4.51 2.68f 1.83
Source: Canadian Hydrographic Service Tide and Current Tables (Volume 5)
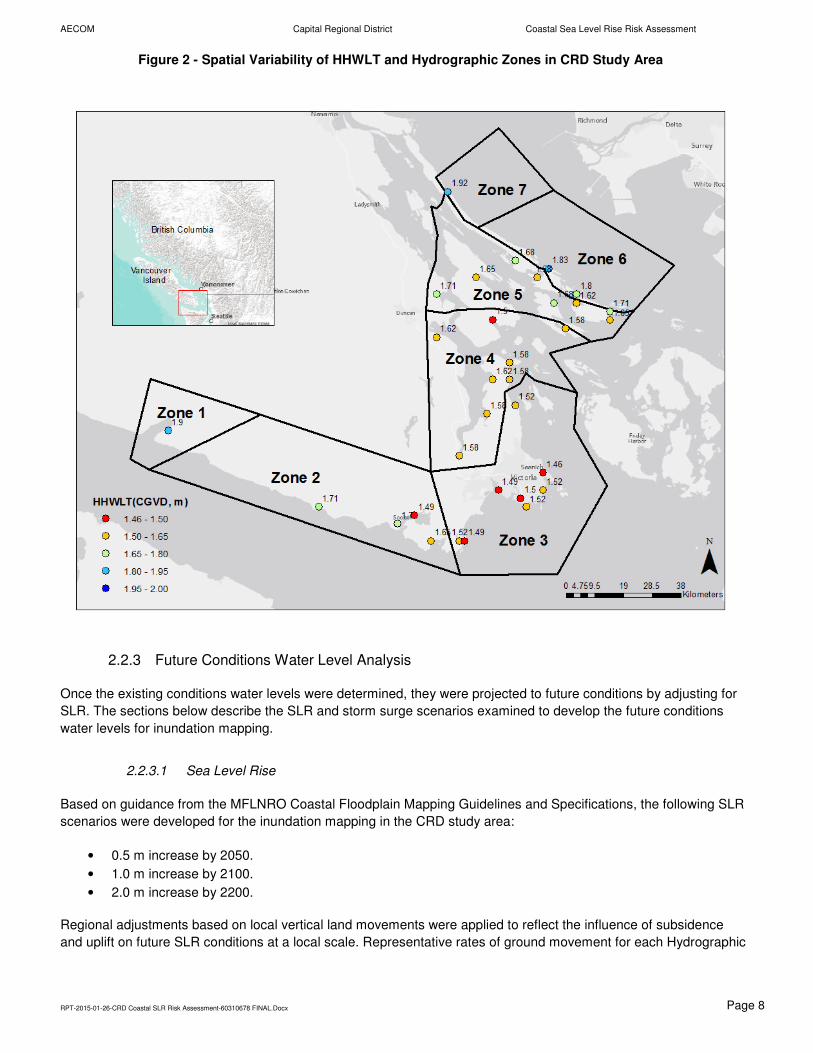
Once converted to the CGVD28 datum, the HHWLT values for each station were mapped to qualitatively evaluate
spatial trends in tidal characteristics (Figure 2). Within the CRD study area, values of HHWLT ranged from 1.46 to
2.0 meters; however, HHWLT levels were found to vary systematically and are relatively consistent over spatial
scales of tens of kilometers. To capture spatial variability of the observed HHWLT, while also simplifying the
inundation mapping, the CRD study area was divided into seven distinct ‘Hydrographic Zones’ based on similar
values of HHWLT (Figure 2).
All coastal waters located within each zone were assigned a representative HHWLT value based on the average of
the local HHWLT values at each station encompassed by the zone boundaries. Representative HHWLT values
associated with each zone are presented in Section 2.2.3.5.
Page 18
AECOM Capital Regional District Coastal Sea Level Rise Risk Assessment
RPT-2015-01-26-CRD Coastal SLR Risk Assessment-60310678 FINAL.Docx Page 8
2.2.3 Future Conditions Water Level Analysis
Once the existing conditions water levels were determined, they were projected to future conditions by adjusting for
SLR. The sections below describe the SLR and storm surge scenarios examined to develop the future conditions
water levels for inundation mapping.
2.2.3.1 Sea Level Rise
Based on guidance from the MFLNRO Coastal Floodplain Mapping Guidelines and Specifications, the following SLR
scenarios were developed for the inundation mapping in the CRD study area:
• 0.5 m increase by 2050.
• 1.0 m increase by 2100.
• 2.0 m increase by 2200.
Regional adjustments based on local vertical land movements were applied to reflect the influence of subsidence
and uplift on future SLR conditions at a local scale. Representative rates of ground movement for each Hydrographic
Figure 2 - Spatial Variability of HHWLT and Hydrographic Zones in CRD Study Area
Page 19
AECOM Capital Regional District Coastal Sea Level Rise Risk Assessment
RPT-2015-01-26-CRD Coastal SLR Risk Assessment-60310678 FINAL.Docx Page 9
Zone were derived from information presented in the Coastal Floodplain Mapping Guidelines and Specifications and
are displayed in Table 3 for the years 2050, 2100, and 2200. For each SLR scenario, the global rates presented
above were adjusted to account for the amount of local vertical land movement shown in the table.
Vertical land movements presented in Table 3 consider long-term geological processes occurring over millennia. It
should be noted that shorter-term processes, such as rapid subsidence or uplift as a result of a major earthquake,
could result in significant changes in ground elevations, thereby warranting the re-evaluation of potential inundation
impacts.
Table 3 - Vertical Land Movement for Each Hydrographic Zone in CRD Study Area
Vertical Land Movement
Zone Rate (mm/year) 2050 (m) 2100 (m) 2200 (m)
1 -0.4 -0.02 -0.04 -0.08
2 3.1 0.155 0.31 0.62
3 1.1 0.055 0.11 0.22
4 1.1 0.055 0.11 0.22
5 1.1 0.055 0.11 0.22
6 1.1 0.055 0.11 0.22
7 1.1 0.055 0.11 0.22
Note: Positive values indicate zones of uplift and negative values indicate zones of subsidence.
2.2.3.2 Storm Surge
Taking into account the influence of storms on coastal water levels, the MFLNRO Coastal Floodplain Mapping
Guidelines and Specifications provides recommendations for incorporating appropriate storm surge scenarios in the
determination of design water levels. For highly developed areas of British Columbia such as Victoria, a 500-year
(0.2-percent annual chance) magnitude storm surge of 1.3 m is recommended based on work by Ausensco
Sandwell (2011a, b). This amount of storm surge was added to the future HHWLT water level to obtain an additional
set of extreme tide scenarios considering the influence of storm events on coastal inundation.
2.2.3.3 Wave effects
The presence of breaking wave conditions may further increase the depth of water near the shoreline and will result
in wave runup, potentially resulting in erosion and flooding. The extent of flooding will depend on terrain located
landward of the shoreline. Wave effects were not included in the analysis, but the MFLNRO Coastal Floodplain
Mapping Guidelines provides recommendations for estimating an allowance for wave effects.
2.2.3.4 Freeboard
A nominal freeboard is typically added to the FCL to provide an additional factor of safety, accounting for
uncertainties associated with the estimation of the design water level (e.g. 500-year storm surge). The inundation
analysis did not take into account freeboard of 0.6 m as noted in the MFLNRO Coastal Floodplain Mapping
Guidelines. For the identification of impacts, neglecting freeboard is appropriate, as the inclusion of freeboard in the
inundation itself would bias the inundation depths. The SLR scenarios selected for mapping are at the high end of
the uncertainty range of the current SLR projections therefore neglecting freeboard for determining inundation depth
Page 20
AECOM Capital Regional District Coastal Sea Level Rise Risk Assessment
RPT-2015-01-26-CRD Coastal SLR Risk Assessment-60310678 FINAL.Docx Page 10
and impacts is appropriate. However, when developing the model bylaws, the inclusion of freeboard would be
appropriate, as noted in the Guidelines.
2.2.3.5 Inundation Mapping Scenarios
Six inundation scenarios were evaluated as a part of the SLR assessment for the CRD (Table 4). Each SLR
scenario – 0.5 m by 2050, 1.0 m by 2100, and 2.0 m by 2200 – was evaluated under two tide conditions: inundation
associated with 1) HHWLT (average annual high tide) and 2) extreme high tide (HHWLT plus storm surge).
Table 4 - Future Projections of HHWLT and Extreme High Tide for the CRD Study Area
Estimated Future HHWLT (including vertical land movement and sea level rise)
(m CGVD28)
Estimated Future Extreme High Tide (including vertical land movement and sea level rise)
(m CGVD28)
Zone Existing 2050 2100 2200 Existing 2050 2100 2200
1 1.9 2.42 2.94 3.98 3.2 3.72 4.24 5.28
2 1.7 2.05 2.39 3.08 3.0 3.35 3.69 4.38
3 1.5 1.95 2.39 3.28 2.8 3.25 3.69 4.58
4 1.6 2.05 2.49 3.38 2.9 3.35 3.79 4.68
5 1.7 2.15 2.59 3.48 3.0 3.45 3.89 4.78
6 1.8 2.25 2.69 3.58 3.1 3.55 3.99 4.88
7 1.9 2.35 2.79 3.68 3.2 3.65 4.09 4.98
Note 1: Future water levels include global SLR projections with local adjustments for vertical land motion at 2050, 2100, and 2200, as described in Section
2.2.3.1 (Table 3). Allowance for regional uplift or subsidence for each time period was calculated using vertical land movement values taken from Table 3.
The formula is as follows: Allowance for Regional Uplift or Subsidence = Vertical Land Movement x (-1). Example calculation: Zone 1 (2050) = Existing
HHWLT (1.9 m) + Subsidence (-0.02 * -1) + Sea Level Rise (0.50 m) = 2.42 m. Subsidence values increase the amount of relative sea level rise; uplift
values decrease the amount of relative sea level rise. The extreme tide scenarios include a 500-year storm surge magnitude of 1.3 m..
Note 2: The Canadian Hydrographic Service is in the process of updating local luni-tidal based HHWLT estimates, which are consistent with provincial sea
level rise mapping guidelines and used in this study, to values established using a new datum calculator program.”
2.2.4 Inundation Map Development
Once the relevant water level statistics were generated for the six inundation mapping scenarios, the inundation
maps were generated utilizing methodologies developed by the NOAA Coastal Services Center (Marcy et al., 2011).
2.2.4.1 Topographic Data
AECOM used topographic and bathymetric data provided by the CRD and public sources to develop a 1-meter
resolution seamless topographic-bathymetric Digital Elevation Model (DEM). This dataset was leveraged from the
DEM created for the CRD Modelling of Potential Tsunami Inundation Limits and Run-up study (AECOM, 2013). The
DEM forms a single, bare earth surface that extends from open water up to a specified interior land surface
elevation. An interior contour elevation of 10 m CGVD28 was used as the upland cutoff. Although more recent 2013
LiDAR data was available from the CRD, a digital elevation model could not be created from this LiDAR data within
the timeframe and budget for this project. The 2013 LiDAR was used to spot check elevation data within the sea
level rise focus areas.
Page 21
AECOM Capital Regional District Coastal Sea Level Rise Risk Assessment
RPT-2015-01-26-CRD Coastal SLR Risk Assessment-60310678 FINAL.Docx Page 11
2.2.4.2 Water Surface DEM Creation
The initial step in creating the inundation maps was to create the inundated water surface, or DEM. Projected SLR
and storm surge were added to the tide scenarios to develop the tidal water surface over the open water portion of
the CRD study area for each of the six inundation scenarios.
The water surface DEM was extended inland to project the water surface over the inundated topography. It should
be noted that the water surface DEM is simply an extension of the tidal water surface at the shoreline over the inland
topography. This represents a generalized estimate of the inland inundated water surface. This step does not take
into account the associated physics of overland flow, wave dissipation, levee overtopping, or potential shoreline
erosion associated with extreme water levels and waves. In order to account for these processes, a more
sophisticated modelling effort would be required.
2.2.4.3 Inundation Depths
Depth and extent of flooding raster files were created by subtracting the land-surface DEM from the water surface
DEM. Both DEMs were generated using a 2-meter horizontal resolution with the same grid spacing in order to allow
for grid cell-to-grid cell subtraction. The resultant DEM provides both the inland extent and depth of inundation (in the
absence of considering hydraulic connectivity).
The final step in creating depth and extent of flood maps relies on an assessment of hydraulic connectivity. The
methodology described by Marcy et al. (2011) employs two rules for assessing whether or not a grid cell is
inundated. A cell must be below the scenario water level, and it must be connected to an adjacent grid cell that was
either flooded or open water. NOAA’s methodology applies an “eight-sided rule” for connectedness, where the grid
cell is considered “connected” if any of its cardinal or diagonal directions are connected to a flooded grid cell. This
approach decreases the inundated area over earlier inundation methods that considered a grid cell to be inundated
solely based on its elevation (i.e., all grid cells with elevation below the reference water level were shown as
inundated, even if they were separated from the flood source by topographic high ground).
The assessment of hydraulic connectivity removes areas from the inundation zone if they are protected by levees or
other topographic features that are not overtopped. It also removes areas that are low-lying, but inland, and not
connected to an adjacent flooded area.
2.2.4.4 Inundation Mapping Caveats
The Provincial Coastal Floodplain Mapping Guidelines and Specification document provides the following notations
for use with floodplain maps:
• Under the provisions of the Flood Hazard Statutes Amendment Act, 2003 (Bill 56), local governments have
the role and responsibility for making decisions about local floodplain development practices, including
decisions about floodplain bylaws within their communities. Information on floodplain management
guidelines can be found in the BC Flood Hazard Area Land Use Management Guidelines.
• Users must note the dates of base mapping, aerial photography, ground or bathymetric surveys and issue
of mapping relevant to dates of development in the map area. Subsequent developments or changes within
the floodplain or channel will affect flood levels and render site-specific map information obsolete.
• The accuracy of the location of a floodplain boundary as shown on this map is limited by the base
topography. It is generally assumed to be plus or minus one-half the increment of the ground contours.
Page 22
AECOM Capital Regional District Coastal Sea Level Rise Risk Assessment
RPT-2015-01-26-CRD Coastal SLR Risk Assessment-60310678 FINAL.Docx Page 12
• The floodplain limits are not established on the ground by legal survey. A site survey is required to reconcile
property location, ground elevations and designated flood level information. Building and floodproofing
elevations should be based on field survey and established benchmarks.
• Flooding may still occur outside the defined floodplain boundary and the local government does not assume
any liability by reason of the failure to delineate flood areas on this map.
• The required or recommended setback of buildings from the natural boundaries of watercourses to allow for
the passage of floodwaters and possible bank erosion is not shown. This information is available from the
local government. In addition, site-specific setbacks from the floodplain limit must be considered.
• Flood construction level is based on a global sea level rise described in Section 2.2.3.1. This may need to
be revised to reflect updated future sea level rise values.
2.3 Identification of key assets
2.3.1 Use of Key Assets
This project used the identification of important shoreline assets in order to:
• Develop SLR Focus Areas that provide coverage across areas containing important assets (see section
2.4).
• Develop a shortlist of public assets for which valuation data would be compiled (see section 2.9).
The definition of Key Assets used for this project was:
Physical infrastructure and buildings that provide important services to the community. Key Assets include:
• Transportation assets such as transportation infrastructure (rail lines, airports, highways),
• Utility Asset such as utility infrastructure (water and wastewater treatment plants, power plants and their
key transmission and distribution lines),
• Community Assets such as public health and safety facilities (hospitals, police and fire stations).
• Business assets such as major employers, such as schools, universities, government, and large
businesses.
This definition was used as the basis for compiling relevant data provided by CRD (see section 2.3.2) and for
eliciting input and review from regional municipalities / electoral areas through a workshop (see section 2.3.3).
The Key Assets identified for each of the SLR Focus Areas are reported in Appendix B and summarised in Table 11.
2.3.2 Spatial data
The following spatial data were used to develop a preliminary list of Key Assets:
• BC Assessment Actual Use Codes with values higher than 610. These codes correspond to non-residential
parcels of land that may have important institutional, commercial or utility assets.
• CRD stormwater and sanitary key assets database – key structures layer.
• CRD water assets database – data layers for network structures, water structures and containment
structures.
• CRD Atlas Civic Sites layer.
Page 23
AECOM Capital Regional District Coastal Sea Level Rise Risk Assessment
RPT-2015-01-26-CRD Coastal SLR Risk Assessment-60310678 FINAL.Docx Page 13
A 6 metre contour line was used as a conservative approximation of potential SLR and storm surge scenarios1, and
the assets shown by these spatial data layers that were within this 6 metre contour were identified. The definition of
Key Asset (section 2.3.1) was used to shortlist those assets that would be classified as Key Assets.
2.3.3 Workshop
A workshop with representatives from regional municipalities and electoral areas was conducted with the objective of
reviewing the preliminary set of Key Assets and gaining participant review of this list and suggested additions to the
list. In advance of the meeting the participants were asked to identify the Key Assets that exist in shoreline areas of
their respective municipalities and electoral areas. The definition of Key Assets and a list of specific asset types was
sent to participants to help them identify assets in advance of the meeting.
The workshop was facilitated by using ArcGIS software to take participants through all coastal areas of the CRD,
showing the locations of the Key Assets included in the preliminary list, and asking participants to identify other Key
Assets that had not been recorded in the preliminary list.
2.4 Definition of Sea Level Rise Focus Areas
This project was concentrated on the mapping and analysis of a series of SLR Focus Areas that had relatively high
levels of future inundation and / or with key community assets present in areas that would be inundated. There was
also a preference to include SLR Focus Areas for a range of the regional municipalities / electoral areas. SLR Focus
Areas were defined based on a set of guiding principles, rather than strict, rule-based criteria that had to be adhered
to in all cases. This approach recognised that there were trade-offs and subjective judgements to make in achieving
the inclusion of a range of representative areas while also having an objective and transparent basis for SLR Focus
Area definition.
The selected principles for guiding the selection of SLR Focus Areas were:
1. Each SLR Focus Area should be defined to:
a) Contain one or a small number of different types of land use. This helps avoid having significant
mixes of urban / rural and developed / undeveloped land within each SLR Focus Area.
b) Contain areas with similar topography. This helps ensure that the summary data for each SLR
Focus Area are representative, rather than masking a high level of variability in the level of
inundation that occurs across the shoreline of the area.
c) Contain at least one key asset that is highly important locally or regionally. This helps ensure that
the selected areas are of importance in relation to potential risks from SLR.
d) Avoid crossing municipal / electoral area boundaries. Where candidate SLR Focus Areas cross a
boundary separate SLR Focus Areas should be developed for each municipality or electoral area.
This division will help support future use of these SLR Focus Areas for consideration in bylaw
development at the individual municipality or electoral area level.
2. The land-ward limit of each SLR Focus Area will be the Floodplain Limit for the selected Scenario of 2100 +
500-year storm surge. This land-ward limit is defined as per Figure 2-4 of the Provincial Coastal Floodplain
Mapping Guidelines and Specifications (BC Ministry of Forests, Lands and Natural Resource Operations,
2011). Lateral limits were also defined for the SLR Focus Areas in order to allow separate areas to be defined
and be subject to the land use and economic analysis conducted for this project. The selected scenario of
2100 + 500-year storm surge was proposed to and accepted by CRD for use in the land use and economic
1 A basic scenario was used for this task as it was undertaken prior to completion of the inundation mapping for different SLR and storm
surge scenarios.
Page 24
AECOM Capital Regional District Coastal Sea Level Rise Risk Assessment
RPT-2015-01-26-CRD Coastal SLR Risk Assessment-60310678 FINAL.Docx Page 14
analysis on the basis that it is a time horizon that would include identifiable SLR effects, and uses the storm
surge period recommended by the provincial guidelines. The maps in Appendix A for this scenario show the
lateral limits (marked as the ‘Economic Impact Analysis Area’) that define each SLR Focus Area for use in the
land use and economic analysis described in sections 2.5 to 2.9.
3. The set of selected SLR Focus Areas should:
a) Include at least one SLR Focus Area for each regional municipality / electoral area that would
experience coastal effects from SLR.
b) Include SLR Focus Areas for a broadly representative variety of different land uses, critical assets
and stages of development.
2.5 Land Use Analysis
The existing land use and key infrastructure present within each SLR Focus Area were identified for those areas
within the 2100 + 500-year storm surge scenario inundation line. This inundation line was developed through the
mapping described in section 2.2.4, and includes all land that would be flooded for the 2100 + 500-year storm surge
scenario. Land use and key infrastructure were identified through the use of six different sets of data analysis:
• Recorded actual use. As part of the property assessment system, BC Assessment provides a record of
actual uses for each parcel of land. There are over 200 categories of actual use, with each parcel of land
being assigned one of these categories. BC Assessment actual use data for 2013 were spatially linked to
each parcel registered in the CRD’s cadastral data layer. The total area of different actual use categories
was calculated and is provided in tabulated form for each SLR Focus Area in Appendix B. These data
provide an indication of the current uses of land at a relatively fine resolution.
• Zoning. Each municipality and electoral area defines different zoning types for land within their areas. The
total area of land for each zoning type was calculated for each SLR Focus Area and is provided in tabulated
form for each SLR Focus Area in Appendix B. These data provide an indication of the permitted uses of land
at a relatively coarse resolution.
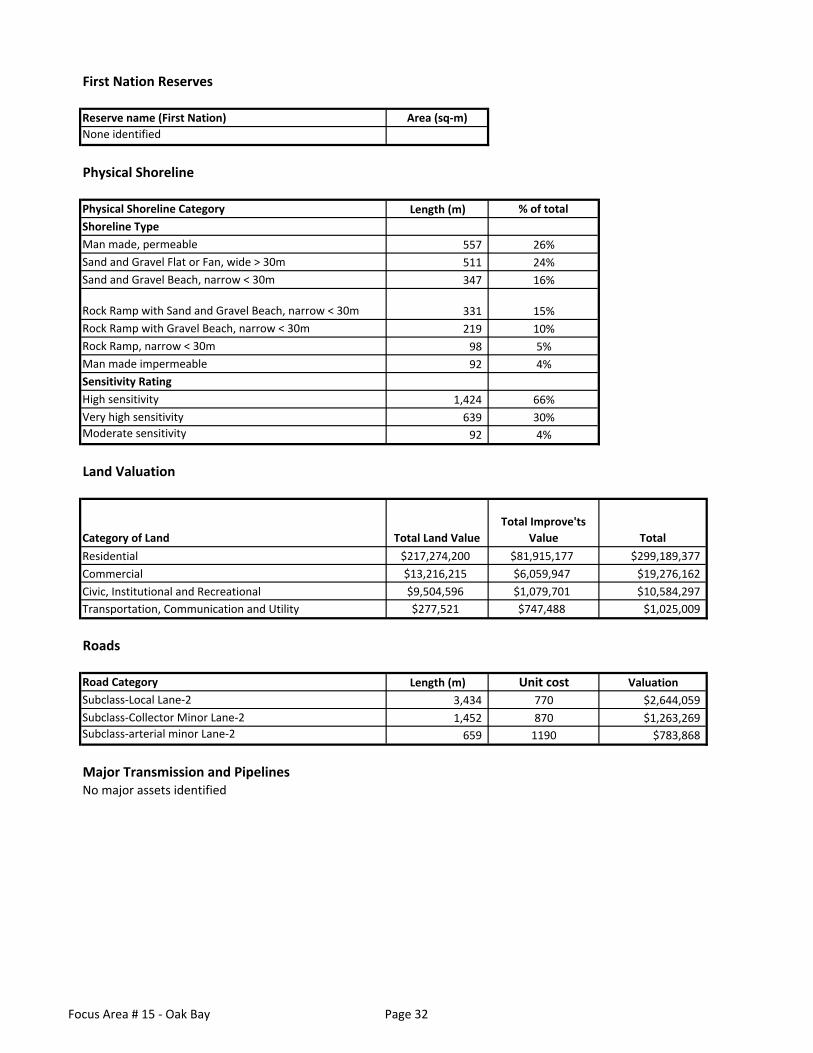
• First Nation Reserves. Spatial data for First Nations reserve land was used to identify the presence of any
reserves within each SLR Focus Area. Where a reserve is present the area of that reserve within the
inundation line is given for each SLR Focus Area in Appendix B.
• Road and rail. CRD spatial data sets were used to identify the presence and length of road and rail within
the inundation line for each SLR Focus Area. Attribute data were used to allow a breakdown of road
distances by different categories of road type and number of lanes. Data are reported for each SLR Focus
Area in Appendix B.
• Major pipeline and transmission line. Spatial datasets were used to identify the length of any key
pipelines or major electric transmission lines present within the inundation line for each SLR Focus Area.
The presence of any key part of the major pipeline and transmission systems are reported for each SLR
Focus Area in Appendix B. Local pipeline and transmission systems (i.e. to localised areas for domestic
distribution) were not reported as key assets.
• Bridges. Bridge elevation data were provided by CRD for selected bridges within regional coastal areas.
From this list of selected bridges, those that would be inundated within each SLR Focus Area for the
selected 2100 + 500-year storm surge scenario are identified in Appendix B. Due to limitations in data
accuracy for elevation of bridge structures, the bridge features shown in Appendix A maps should not be
relied upon to determine if bridges would be inundated for the selected scenarios. If required for planning,
site-specific analysis should be undertaken to determine the precise extent or level of inundation for these
and other bridges across the CRD.
Spatial data were used to compile attribute data for each feature (e.g. parcel of land, length of road) that exists within
the 2100 + 500-year storm surge scenario inundation line. For features that crossed over that inundation line only
Page 25
AECOM Capital Regional District Coastal Sea Level Rise Risk Assessment
RPT-2015-01-26-CRD Coastal SLR Risk Assessment-60310678 FINAL.Docx Page 15
the extent of the attribute (e.g. area, length) that exists inside the line was used. For example, if a parcel of land was
70% in the inundation line and 30% outside, only the 70% within the inundation line was included in the calculations.
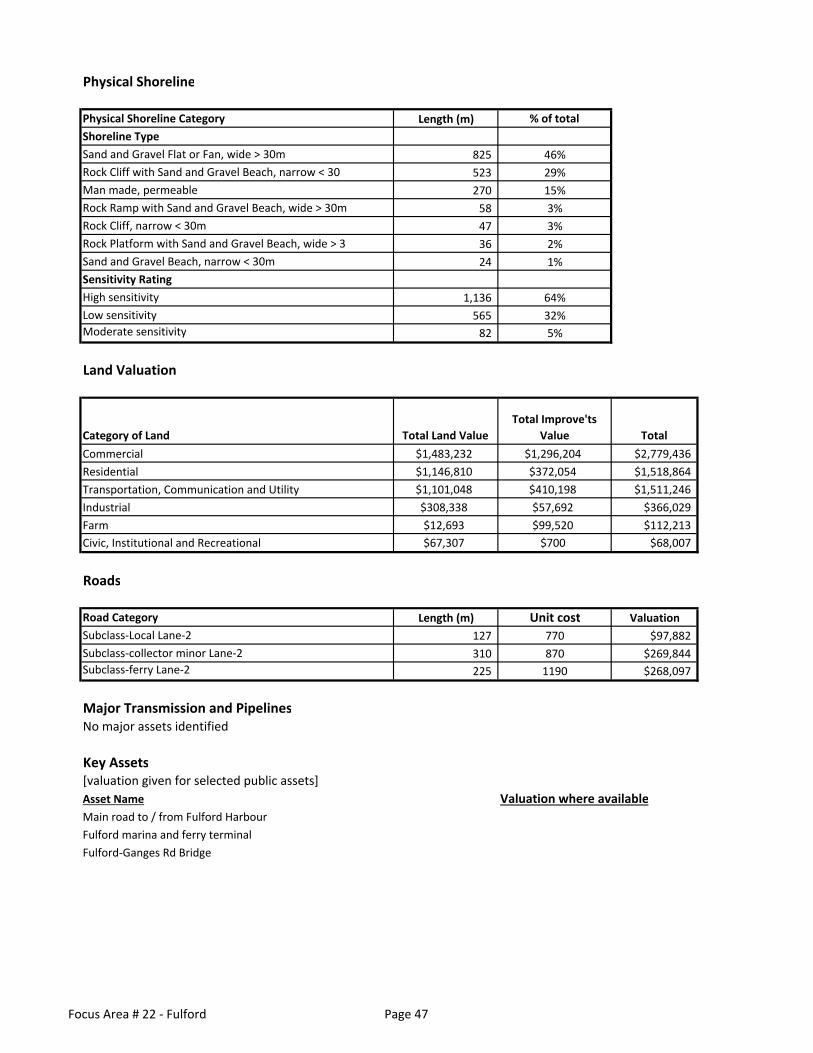
2.6 Identification of Physical Shoreline Characteristics
The provincial BC Parks Shoreline Sensitivity to Sea Level Rise Model (BC Parks, undated) provides data on the
physical shoreline type and sensitivity to SLR for all parts of the CRD coastline, as well as other parts of the
province. This dataset was used to calculate two measures, both of which are reported in Appendix B:
• Shoreline Type. The model provides a determination of which category of foreshore type best applies to
each segment of shoreline. The model uses a series of categories based on substrate, width and slope
characteristics.
• Sensitivity Rating. The model provides an overall sensitivity to SLR rating for each segment of shoreline.
This rating is based on separate sensitivity ratings derived for foreshore (based on substrate, width, slope,
sediment mobility and exposure) and backshore (based on slope and coastal habitat type), with the most
sensitive rating of the two being used for the overall sensitivity rating.
Appendix B provides a summary of the total length for each Shoreline Type and Sensitivity Rating category within
the inundation line for the year 2100 + 500-year storm surge. The BC Parks Shoreline Sensitivity to Sea Level Rise
Model report describes the relationship between shoreline type and sensitivity to SLR rating.
2.7 Valuation of Land and Improvements
The valuation of land and improvements2 is based on BC Assessment data that represent an assessed market value
for each property. BC Assessment’s data were spatially linked to each parcel registered in the CRD’s cadastral data
layer. The market value assessment data were summed for land and for improvements present within the 2100 +
500-year storm surge inundation line for each SLR Focus Area. For parcels that crossed over that inundation line
the valuation data were assigned proportionally to the area of land that is inside of the inundation line. As such, the
analysis cannot account for the position of infrastructure (e.g. building footprints) within the parcel in relation to the
inundation line3. Any area of the parcel within the inundation line that also extends beyond the shoreline to the ocean
was also included in the valuation. This is particularly relevant for the Inner Harbour where there are a number of
marine parcels, such as those that contain marine infrastructure.
Data analysis was conducted by AECOM using BC Assessment 2013 data and the method stated above. This
analysis was then updated by CRD using BC Assessment 2014 data and refined cadastral data, and is reported in
this report.
The total assessed market values are provided in Appendix B for each of the following categories of property:
• Residential
• Commercial
• Civic, Institutional And Recreational
• Transportation, Communication, And Utility
• Industrial
• Mining And Allied Industries
• Farm
2 Improvements are defined by BC Assessment as “any building, fixture, or other similar structure attached to land or another
improvement”. 3 Spatial data on building footprints for the CRD region were reviewed and did not provide sufficient coverage across the region to allow
for an analysis based on precise building location to be developed.
Page 26
AECOM Capital Regional District Coastal Sea Level Rise Risk Assessment
RPT-2015-01-26-CRD Coastal SLR Risk Assessment-60310678 FINAL.Docx Page 16
• Forest & Allied Industry
The valuation data used for this task represent market values and should not be interpreted as the total financial cost
or economic impact of SLR in these SLR Focus Areas. Actual property impact costs will be determined by:
• The level of adaptation that takes place prior to effects arising from SLR.
• The frequency and depth of inundation events that occur following SLR, and the impact that this has to
property.
Within the scope of this project the BC Assessment data has been the sole data source for the aggregated data
provided in Appendix B. For some publically owned properties that have not been subject to sale or have unique or
restricted uses the extent to which BC Assessment valuation fully reflects market valuation would have to be
reviewed and validated before using those valuation data for any further analysis.
The limitations of the BC Assessment data for estimating market value are:
• BC Assessment data for cadastral parcels registered on Indian Reserve land were not available for use in
the valuation of land, and so the valuations provided in this report do not include the Indian Reserve land
recorded in Appendix B. This is relevant to the valuation developed for the Port Renfrew and Island View
SLR Focus Areas as these have relatively high areas of Indian Reserve land within the Focus Area. The
valuation data for these two areas should be interpreted as low-end estimates that do not include the area of
land in Indian Reserve (as stated in Appendix B) within the valuation.
• For the small number of other cadastral parcels that do not have an associated valuation in the BC
Assessment database, a check was undertaken using 2013 BC Assessment data to determine if their
absence from the analysis could significantly alter the total valuation estimates. The only other SLR Focus
Area that includes a significant parcel without an associated valuation is in the Patricia Bay SLR Focus Area,
where 23% of the assessed area did not have associated valuation data. For other SLR Focus Areas there
were either no or minor (e.g. a few percentage points of total land area) levels of cadastral parcels without
associated valuation data, or the cadastral parcels without valuation data would not significantly alter the
valuation, because: they are undeveloped water lots that have been surveyed as cadastral parcels but do
not have any identified development or economic use (present in the Jordan River and Highway 14 south of
Shirley SLR Focus Areas), they are undeveloped water lots and relatively small parts of shoreline park
(Gorge Esquimalt SLR Focus Area), or they are a single water lot (Central Ganges SLR Focus Area).
Within these limitations, the total valuation data presented in Appendix B should be interpreted as the total market
value of property within areas that may be inundated in the 2100 + 500-year storm surge scenario. These valuation
data are relevant as being broadly indicative of the values of land and improvements that may be at risk from effects
from SLR. These are present day valuations and have not been discounted or in any other way altered to reflect that
potential effects relate to a future time period. They do not include other costs associated with disaster recovery.
2.8 Valuation of Roads
This project developed and used replacement costs per unit length of road to calculate the total value of roads that
are within the inundation line for the 2100 + 500-year storm surge scenario. These costs per unit length of road were
applied to the total distances of road identified within the inundation line. The assumed replacement cost per unit
length of road were estimated using AECOM in-house experience. Current unit costs for materials (asphalt course,
crushed base course, sub grade/sub base) were used to develop estimates based on typical roadway design with
shoulders of 1.5 m width, and lane width of 3.6 m, and road materials thicknesses as per Table 5. These stated road
materials thicknesses are assumptions based on AECOM experience of roads in comparable conditions. In reality,
roads will be built with thickness designed for site-specific conditions. The assumptions provide a reasonably
indicative basis for deriving the cost estimates used to value road assets within the CRD.
Page 27
AECOM Capital Regional District Coastal Sea Level Rise Risk Assessment
RPT-2015-01-26-CRD Coastal SLR Risk Assessment-60310678 FINAL.Docx Page 17
The cost estimates are present day costs and have not been discounted or in any other way altered to reflect that
potential effects relate to a future time period. They do not include other costs associated with disaster recovery.
Table 5 - Assumed Road Construction Material Thicknesses
Road Type Arterial Collector Local
AC thickness 0.15 m 0.15 m 0.1 m
CBC thickness 0.3 m 0.2 m 0.2 m
SGSB thickness 0.5 m 0.4 m 0.3 m
(AC = asphalt course; CBC = crushed base course; SGSB – sub grade / sub base)
Construction costs also include estimates for keying in the road. Road appurtenances have been estimated and
assumed to consist of ditches and central barriers for arterials, curbs for collectors, and curb and sidewalk for local
roads. Detailed estimates of the different minor 2-lane road categories (restricted, strata, resource, recreation and
service) was not possible within the scope of this work. They have been conservatively assumed to have the same
cost as the ‘local’ 2-lane road category. The ferry 2-lane category has been assumed to be equal to an arterial lane.
The cost assumptions used for this project are applied to the category of road given in the attribute data provided in
the CRD roads data layer (Table 6).
Table 6 - Cost assumptions used for different road types
Road type Cost ($/m) Road type Cost ($/m)
Arterial minor and major Highway
Arterial Lane-2 $1,190 Highway $1,850
Arterial Lane-3 $1,550 Other 2 lane
Arterial Lane-4 $1,850 Restricted Lane 2 $770
Collector minor and major Strata Lane 2 $770
Collector minor Lane-2 $870 Ferry Lane-2 $1,190
Collector minor Lane-3 $1,180 Resource Lane-2 $770
Collector minor Lane-4 $1,530 Recreation Lane-2 $770
Local Service Lane 2 $770
Local Lane 1 $620
Local Lane-2 $770
Local Lane-3 $980
Local Lane-4 $1,230
2.9 Valuation of Key Public Assets
Valuation estimates were compiled for the key public assets that are present within the 2100 + 500-year storm surge
scenario inundation line for the selected SLR Focus Areas. CRD and regional municipalities / electoral areas
provided valuation data for a shortlist of publically-owned assets identified during the ‘Identification of Key Assets’
task (section 2.3). The valuation data were generally provided on a ‘Cost of Reproduction New’ or replacement cost
basis, and so represent the full cost to reproduce the property in like kind and materials in accordance with current
market prices. As with private property (see section 2.7) this valuation should not be interpreted as the total financial
Page 28
AECOM Capital Regional District Coastal Sea Level Rise Risk Assessment
RPT-2015-01-26-CRD Coastal SLR Risk Assessment-60310678 FINAL.Docx Page 18
cost or economic impact of SLR effects on these public assets. They do not include other costs associated with
disaster recovery. Actual impact costs will be determined by:
• The level of adaptation that takes place prior to effects arising from SLR.
• The frequency and depth of inundation events that occur following SLR, and the impact that this has to
property.
• Costs to acquire any new land for redevelopment of replacement assets and any extra costs incurred for
developing in those new areas.
The valuation data for each of the public Key Assets presented in Appendix B should be interpreted as the total
replacement cost of the public assets that exist within areas that may be inundated in the 2100 + 500-year storm
surge scenario. These valuation data are relevant as being broadly indicative of the value of those selected public
assets that may be at risk from SLR.
2.10 Service Disruption
The project included the development of three high-level case studies to characterize the potential service disruption
and related economic effects that could arise from SLR. These case studies relate to each of the following three
types of assets of importance to the CRD region:
• A transportation asset (case study of Highway 14, south of Shirley);
• A residential community (case study of Oak Bay / Windsor Park);
• A major business center (case study of Victoria’s Inner Harbour).
These case studies were selected in consultation with CRD staff and were selected based on the anticipated
inundation that would occur for the year 2100 + 500-year storm surge scenario.
The key economic costs of temporary service disruption caused by storm surge generated inundation are expected
to include:
• Foregone revenues of businesses that cannot operate and related lost wages to employees;
• Extra costs incurred from both providing alternative service provision, where applicable, and repairing
damaged service delivery infrastructure;
• Benefits lost to users from not being able to use the service and subsequent costs to users for utilizing
alternative service options.
For each of the case studies, AECOM developed high-level estimates of the costs of these impact types to arrive at
a total gross operational cost. Gross operational costs include all the above costs, with the exception of repairing
damaged infrastructure.
The resulting estimates are meant to provide an order-of-magnitude understanding of potential impacts of disruption
arising from SLR, in present economic terms. This analysis does not project changes in transportation mode shifts,
business revenue, or population, which will ultimately determine future economic impacts. Instead, the case studies
adopted a replicable methodology for assessing potential economic impacts according to existing economic
conditions, using publically available data whenever possible. It is the intent of this analysis that each case study’s
methodology could be applied across the other Focus Areas or for other jurisdictions.
The “Total Economic Impact” of a case study is a gross measure of economic impact, which aggregates a series of
metrics estimating externalities posed to different groups. The externalities considered in the following case studies
are often interdependent and overlapping. For example, the business case study includes metrics of lost revenue,
lost worker productivity, and lost sales tax revenue resulting from inundation impacting the Inner Harbour. Wage,
output, and tax impacts are aggregated to determine the gross economic impact.
Page 29
AECOM Capital Regional District Coastal Sea Level Rise Risk Assessment
RPT-2015-01-26-CRD Coastal SLR Risk Assessment-60310678 FINAL.Docx Page 19
The service disruption valuation for all case studies is constrained by available model metrics. The selected metrics
differ for each case study as they are designed to describe impacts to the specific asset types that are the focus for
each case study. As a result, the service disruption valuation given each of the three case studies does not reflect
the total service disruption effects for each Focus Area. For example, the transportation case study only includes
relevant transportation metrics and so the valuation given for the Focus Area studied for that case study does not
include other service disruption effects. For future work the metrics used across the three case studies could be
applied together to each Focus Area in order to provide a more comprehensive valuation of total service disruption
costs.
A detailed description of the methods used for these case studies is provided in Appendix C.
2.11 Summary of Source Data
For ease of reference, Table 7 lists the source data used for inundation mapping, identification of existing land use,
and valuation of land and infrastructure. AECOM has not undertaken any validation of the accuracy of the data
provided from these external data sets.
Table 7 - Summary of data sources used for project analysis
Land use / asset type Data layer and attributes to report
Actual Land Use • CRD data ‘cdCadastre’, attribute JUROL. • BC Assessment database – table ‘tblValuation’, column Actual_Use, linked by JUROL.
Zoning • CRD data ‘Municipal Zoning 2008’, attribute ZoningCode • For Juan de Fuca: CRD data ‘jfZoning’, attribute Zoning Code.
First Nation Reserves • CRD data ‘adFirstNationReserves’
Physical Shoreline • Provincial Shoreline Sensitivity Model layers ‘StraitofGeorgia.kmz’ and ‘Juandefuca.kmz’.
Road • CRD data ‘trRoads’, attributes: Road SubClass, Road Surface Type, Number of Lanes.
Rail • CRD data ‘trRail’.
Major Gas Pipeline • Canvec data layer ‘Pipeline’ • Fortis BC gas distribution layer. This data layer shows the whole distribution system and
was used to identify only the key parts of the system that could affect more regional supply.
Major Transmission Line • Canvec data layer ‘Transmission’
CRD stormwater and sanitary
key assets – Discharge Points
• CRD’s SanitaryStormwaterData.mdb, data layer ssDischargePoint.lyr
CRD stormwater and sanitary
key assets – key structures
• CRD’s SanitaryStormwaterData.mdb, data layer NetworkStructure.lyr
Key bridge assets • Bridge elevation data for selected key bridges, provided by CRD. Data based on 2013 Lidar, NRC 2007 Lidar and Provincial TRIM.
Water Assets • CRD’s CRDWaterSupplyData.mdb, data layer s Network Structure.lyr, WaterStructure.lyr, ContainmentStructure.lyr.
Market value of land and
improvements
• CRD data ‘cdCadastre’, attribute JUROL. BC Assessment database – table ‘tblValuation’, columns Land_1 to Land_10, Improvements_1 to Improvements_10.
• BC Assessment database – table ‘tblActualUse’, columns Actual_Use and Type_Of.
Page 31
AECOM Capital Regional District Coastal Sea Level Rise Risk Assessment
RPT-2015-01-26-CRD Coastal SLR Risk Assessment-60310678 FINAL.Docx Page 21
3. Results
3.1 Sea Level Rise Focus Areas
A total of 24 SLR Focus Areas were defined (Table 8). These include at least one area for all regional municipalities
and electoral areas apart from the City of Langford and the District of Highlands (Table 9). The location of these SLR
Focus Areas is mapped in Figure 3.
Table 8 - List of SLR Focus Areas and their municipality or electoral area
# Name Municipality / Electoral Area
1 Port Renfrew Juan de Fuca Electoral Area
2 Jordan River Juan de Fuca Electoral Area
3 Highway 14 south of Shirley Juan de Fuca Electoral Area
4 Milnes Landing District of Sooke
5 Albert Head Lagoon District of Metchosin
6 Esquimalt Lagoon City of Colwood
7 Gorge – View Royal Town of View Royal
8 Gorge – Saanich District of Saanich
9 Gorge Industrial and Redevelopment Land City of Victoria
10 Esquimalt DND Naval Township of Esquimalt
11 Gorge - Esquimalt Township of Esquimalt
12 Inner Harbour City of Victoria
13 Ogden Point City of Victoria
14 Dallas Road City of Victoria
15 Oak Bay Windsor Park Area District of Oak Bay
16 Cadboro Bay District of Saanich
17 Island View Beach District of Central Saanich
18 Patricia Bay District of North Saanich
19 South Sidney Town of Sidney
20 Tsehum Harbour – Sidney Town of Sidney
21 Tsehum Harbour – North Saanich District of North Saanich
22 Fulford Harbour Salt Spring Island
23 Central Ganges Salt Spring Island
24 Galliano – north of Sturdies Bay Southern Gulf Islands
Page 32
AECOM Capital Regional District Coastal Sea Level Rise Risk Assessment
RPT-2015-01-26-CRD Coastal SLR Risk Assessment-60310678 FINAL.Docx Page 22
Table 9 - Count of SLR Focus Areas in each municipality and electoral area
Municipality or Electoral Area Count Municipality or Electoral Area Count
City of Victoria 4 Town of View Royal 1
Juan de Fuca Electoral 3 District of Oak Bay 1
Salt Spring Island 2 District of Metchosin 1
Town of Sidney 2 City of Colwood 1
Township of Esquimalt 2 District of Central Saanich 1
District of North Saanich 2 Southern Gulf Islands 1
District of Saanich 2 City of Langford 0
District of Sooke 1 District of Highlands 0
3.2 Inundation Mapping
Example inundation maps for the Oak Bay Windsor Park Area are provided in Figure 4 with the full series of maps
for all Focus Areas provided in Appendix A Map Book. Figure 4 is a series of maps for the different scenarios,
presented in the following order:
• HHWLT + 0.5m SLR (year 2050 scenario)
• HHWLT + 0.5m SLR (year 2050 scenario) + 1.3m storm surge (500-year).
• HHWLT + 1m SLR (year 2100 scenario)
• HHWLT + 1m SLR (year 2100 scenario) + 1.3m storm surge (500-year).
• HHWLT + 2m SLR (year 2200 scenario)
• HHWLT + 2m SLR (year 2200 scenario) + 1.3m storm surge (500-year).
For the purposes of the land use and economic analysis (see sections 2.5 to 2.9) and calculation of inundation
depths (see Table 10), the maps for the HHWLT + 1m SLR (year 2100 scenario) + 1.3m storm surge (500-year)
scenario show a ‘Economic Impact Analysis Area’ polygon that gives the lateral definition of the SLR Focus Area, as
described in Section 2.4. The polygon is generally drawn alongside or from roads and road junctions that are present
close to but outside of the inundation line. Where this is not possible (e.g. lack of road infrastructure close to the
inundation line) other land features have been used to provide the definition for this area.
Table 10 describes the inundation depths that would occur within the inundation line for the selected year 2100 +
500-year storm surge scenario.
Page 33
Projec
tion:
UTM
Zone
10N,
Nort
h Ame
rican
Datu
m 19
83Da
te: 5/
5/20
14
Capit
al Regi
onal D
istrict
Inund
ation
Mapp
ingFo
cus A
reas
05,4
0010
,800
2,700
Meter
s$
1
2
3
456
78
9
1011
13
12 141516
17
181920
21
22
2324
1-P
ort Re
nfrew
2-J
ordan
River
3-H
ighwa
y 14
4-M
ilnes
Landin
g5
-Albe
rt Head
Lagoo
n6
-Esqu
imalt
Lagoo
n7
-Gorg
e View
-Royal
8-G
orge V
iew-Sa
anich
9-G
orge V
iew-In
dustr
ial Lan
d10
-Esqu
imalt
DND
11-G
orge V
iew-Es
quim
alt12
-Inn
er Ha
rbour
13-O
gden P
oint
14-D
allas R
oad15
-Oak
Bay W
indsor
Park
16-C
adboro
Bay
17-I
sland
View
Park
18-P
atricia
Bay
19-S
outh
Sidne
y20
-Tseh
um Ha
rbour-
Sidne
y21
-Tseh
um Ha
rbour-
North
Saani
ch22
-Fulf
ord Ha
rbour
23-C
entra
l Gang
es24
-Galli
ano Isl
and
Figu
re 3
- M
ap o
f Sea
Lev
el R
ise
Focu
s A
reas
Page 34
AECOM Capital Regional District Coastal Sea Level Rise Risk Assessment
RPT-2015-01-26-CRD Coastal SLR Risk Assessment-60310678 FINAL.Docx Page 24
Figure 4 - Inundation maps for the Oak Bay Windsor Park Area SLR Focus Area
Provided as a separate document due to large file size.
Page 35
AE
CO
M
Capital R
egio
nal D
istr
ict
Coasta
l S
ea L
evel R
ise
Ris
k A
ssessm
ent
RP
T-2
015-0
1-2
6-C
RD
Coast
al S
LR
Ris
k A
sse
ssm
ent-
60310678 F
INA
L.D
ocx
Pa
ge
30
Tab
le 1
0 -
Lev
el o
f in
un
da
tio
n f
or
each
SL
R F
ocu
s A
rea (
210
0 +
50
0-y
ea
r sto
rm s
urg
e s
cen
ari
o)
Are
a i
nu
nd
ate
d b
y e
ach
de
pth
in
terv
al
(sq
ua
re k
m)
Fo
cus
Are
a
Low
-ly
ing
Dis
con
ne
cte
d
Are
a (
squ
are
km
)
To
tal
Are
a
Inu
nd
ate
d
(sq
ua
re k
m)
0 -
50
cm
5
0 -
10
0
cm
10
0 -
15
0
cm
15
0 -
20
0
cm
20
0 -
25
0
cm
25
0 -
30
0
cm
30
0 -
35
0
cm
35
0 -
40
0
cm
> 4
00
cm
Po
rt R
en
fre
w
0.0
1
7.7
8
1.0
6
0.4
1
1.9
1
0.6
5
2.6
7
0.1
9
0.4
7
0.0
5
0.3
7
Jord
an
Riv
er
0.0
0
0.3
7
0.0
8
0.1
2
0.0
5
0.0
3
0.0
2
0.0
2
0.0
2
0.0
3
0.0
0
Hig
hw
ay
14
0
.00
0
.53
0
.03
0
.05
0
.08
0
.03
0
.02
0
.02
0
.02
0
.00
0
.00
Mil
ne
s La
nd
ing
0
.01
0
.49
0
.05
0
.06
0
.06
0
.06
0
.10
0
.09
0
.07
0
.00
0
.00
Alb
ert
He
ad
La
go
on
0
.00
0
.11
0
.00
0
.00
0
.00
0
.01
0
.01
0
.00
0
.00
0
.00
0
.00
Esq
uim
alt
La
go
on
0
.00
0
.33
0
.03
0
.05
0
.09
0
.05
0
.04
0
.03
0
.04
0
.00
0
.00
Go
rge
Vie
w R
oy
al
0.0
0
0.2
5
0.0
6
0.0
7
0.0
6
0.0
3
0.0
2
0.0
1
0.0
0
0.0
0
0.0
0
Go
rge
Sa
an
ich
0
.00
0
.23
0
.05
0
.05
0
.05
0
.03
0
.03
0
.02
0
.00
0
.00
0
.00
Go
rge
In
du
stri
al La
nd
0
.01
0
.17
0
.07
0
.06
0
.03
0
.01
0
.00
0
.00
0
.00
0
.00
0
.00
Esq
uim
alt
DN
D N
av
al
0.0
0
0.2
7
0.0
6
0.0
9
0.0
2
0.0
0
0.0
0
0.0
0
0.0
0
0.0
0
0.1
0
Go
rge
Esq
uim
alt
0
.00
0
.10
0
.03
0
.02
0
.02
0
.01
0
.01
0
.01
0
.00
0
.00
0
.00
Inn
er
Ha
rbo
ur
0.0
0
0.0
3
0.0
0
0.0
2
0.0
1
0.0
0
0.0
0
0.0
0
0.0
0
0.0
0
0.0
0
Og
de
n P
oin
t 0
.00
0
.14
0
.11
0
.03
0
.00
0
.00
0
.00
0
.00
0
.00
0
.00
0
.00
Da
lla
s R
oa
d
0.0
0
0.0
3
0.0
2
0.0
1
0.0
0
0.0
0
0.0
0
0.0
0
0.0
0
0.0
0
0.0
0
Oa
k B
ay
Win
dso
r P
ark
0
.00
0
.38
0
.11
0
.15
0
.09
0
.03
0
.00
0
.00
0
.00
0
.00
0
.00
Ca
db
oro
Ba
y
0.0
0
0.1
7
0.0
2
0.0
2
0.0
2
0.0
3
0.0
6
0.0
0
0.0
0
0.0
2
0.0
0
Isla
nd
Vie
w P
ark
0
.00
1
.46
0
.03
0
.03
0
.07
0
.18
0
.23
0
.56
0
.30
0
.06
0
.00
Pa
tric
ia B
ay
0.0
0
0.1
7
0.0
4
0.0
2
0.0
0
0.0
0
0.0
0
0.0
0
0.0
1
0.1
0
0.0
0
So
uth
Sid
ne
y
0.0
0
0.2
1
0.0
5
0.0
8
0.0
6
0.0
2
0.0
0
0.0
0
0.0
0
0.0
0
0.0
0
Tse
hu
m H
arb
ou
r-S
yd
ne
y
0.0
0
0.1
3
0.0
3
0.0
3
0.0
3
0.0
1
0.0
0
0.0
0
0.0
3
0.0
0
0.0
0
Tse
hu
m H
arb
ou
r-N
ort
h S
aa
nic
h
0.0
0
0.3
8
0.0
7
0.0
7
0.0
7
0.0
4
0.0
2
0.0
3
0.0
8
0.0
0
0.0
0
Fu
lfo
rd H
arb
ou
r 0
.00
0
.09
0
.01
0
.01
0
.01
0
.01
0
.01
0
.01
0
.00
0
.01
0
.02
Ce
ntr
al
Ga
ng
es
0.0
0
0.0
5
0.0
3
0.0
2
0.0
0
0.0
0
0.0
0
0.0
0
0.0
0
0.0
0
0.0
0
Ga
llia
no
Isl
an
d
0.0
0
0.1
5
0.0
2
0.0
3
0.0
2
0.0
2
0.0
3
0.0
4
0.0
0
0.0
0
0.0
0
Page 36
AECOM Capital Regional District Coastal Sea Level Rise Risk Assessment
RPT-2015-01-26-CRD Coastal SLR Risk Assessment-60310678 FINAL.Docx Page 31
3.3 Land Use, Roads and other Infrastructure
Appendix B provides the results of data analysis for actual land use, zoning, First Nation reserves, roads,
transmission lines and pipelines for each SLR Focus Area. The only rail infrastructure identified was part of the E&N
rail line in Focus Area number 9.
3.4 Shoreline Type and Sensitivity Rating
Appendix B provides the results of data analysis for Shoreline Type and Sensitivity Rating for each SLR Focus Area.
The data show presence of a wide range of shoreline types and sensitivity ratings across the SLR Focus Areas,
including different natural coastal classes as well as man-made classes. Sensitivity ratings to SLR are generally
classed as Very High or High.
3.5 Identification and Valuation of Key Public Assets
The set of key public assets that were included for valuation as part of this project are listed in Table 11. This
includes only those assets for which valuation data were available from CRD and municipalities and received within
project reporting timescales. The basis for valuation is provided in the table and is typically replacement cost. This is
one measure of asset value and does not indicate expected level of financial impact to the asset or any associated
disaster recovery costs that could arise as a result of inundation. If these valuation data are used for planning
purposes they should be verified and updated by CRD and / or municipalities and electoral area staff.
The key public assets that are included in this valuation and are present within the 2100 + 500-year storm surge
inundation line are principally sewage and water pump stations, with a small number of buildings that provide other
public services, including the City of Victoria public works yard and Ganges library. Appendix B provides a list of all
key assets identified, including those for which valuation data were not available from CRD and municipalities.
Within the scope of this project AECOM has not field-verified the asset data used for the study. Verification of asset
locations should be completed prior to any site-specific planning or other work related to these locations.
Page 37
AE
CO
M
Capital R
egio
nal D
istr
ict
Coasta
l S
ea L
evel R
ise
Ris
k A
ssessm
ent
RP
T-2
015-0
1-2
6-C
RD
Coast
al S
LR
Ris
k A
sse
ssm
ent-
60310678 F
INA
L.D
ocx
Pa
ge
32
Tab
le 1
1 -
Lis
t o
f ke
y p
ub
lic a
ssets
th
at
were
in
clu
ded
fo
r v
alu
ati
on
Ke
y p
ub
lic
as
se
t S
LR
Fo
cu
s
Are
a #
V
alu
ati
on
B
as
is f
or
va
lua
tio
n
Po
rt R
en
frew
Wa
ste
wa
ter
Tre
atm
en
t P
lan
t p
lus
2
fac
ilit
ies
ma
rke
d a
s W
TP
dis
infe
cti
on
fa
cilit
y f
or
wa
ter
1
$6
54
,40
0
Da
ta p
rovi
de
d fo
r “P
ort
Re
nfr
ew
Se
wa
ge
Tre
atm
en
t P
lan
t”.
Th
e d
ata
is f
or
the
“C
ost
of
Re
pro
du
ctio
n N
ew
” va
lue
, a
s o
f N
ove
mbe
r 2
013
’s a
pp
rais
al.
20
5 P
ort
sm
ou
th D
rive
Lif
t S
tati
on
(S
ew
ag
e)
6
$3
50
,00
0
20
5 P
ort
sm
ou
th D
rive
lift
sta
tion
wa
s in
sta
lled
in 2
00
6 a
t a
n a
pp
roxi
ma
te c
ost
of
$3
50
,000
.
33
01
Oce
an
Blv
d L
ift
Sta
tio
n (
Sew
ag
e)
6
$8
00
,00
0
33
01
Oce
an
Blv
d lift
sta
tion
wa
s in
sta
lled
in 2
00
3 a
t a
n a
pp
roxi
ma
te c
ost
of
$8
00
,00
0.
Es
qu
imalt
La
go
on
Bri
dg
e
6
$2
,500
,000
C
ost
estim
ate
of $
2,5
00
,00
0 t
o r
ep
lace
th
e e
ntire
brid
ge
, d
eve
lop
ed
in 2
00
8.
He
lmc
ken
Pa
rk P
um
p S
tati
on
(S
ew
ag
e)
7
$
27
5,9
00
2
00
6 a
pp
rais
al da
ta.
Mid
wo
od
Pu
mp
Sta
tio
n (
Sew
ag
e)
7
$
27
5,0
00
U
p-t
o-d
ate
re
pla
cem
en
t co
st e
stim
ate
, b
ut n
ot b
ase
d o
n f
orm
al a
pp
rais
al.
Co
lqu
itz P
um
p S
tati
on
(S
ew
ag
e)
8
$
26
5,6
00
B
ase
d o
n C
ost
of
Re
pro
duction
Ne
w.
Du
nk
irk
Lan
e P
um
p S
tati
on
(S
ew
ag
e)
8
$
40
9,4
00
B
ase
d o
n C
ost
of
Re
pro
duction
Ne
w.
Dys
art
Pu
mp
Sta
tio
n (
Sew
ag
e)
8
$
85
7,3
00
B
ase
d o
n C
ost
of
Re
pro
duction
Ne
w.
Ga
rba
lly P
um
p S
tati
on
(S
ew
ag
e)
9
$4
00
,00
0
Insta
lled
in 1
980
, co
st e
stim
ate
of
$4
00
,00
0.
Ha
rbo
ur
Pu
mp
Sta
tio
n (
Sew
ag
e)
9
$4
20
,00
0
Insta
lled
in 2
007
, co
st e
stim
ate
of
$4
20
,00
0.
Lo
we
r P
ub
lic
Wo
rks
Ya
rd
9
$4
,887
,000
N
ot
all
of
this
pro
pe
rty
wo
uld
be
in
un
da
ted
fo
r th
is s
cen
ario
. R
ep
lace
me
nt
La
nd
va
lue
fo
r 4
17
Ga
rbally
, estim
ate
d in
20
08
. B
uild
ings n
ot in
clu
ded
in
valu
ation
.
Cra
igfl
ow
er
Pu
mp
Sta
tio
n (
Sew
ag
e)
1
1
$2
,806
,700
Th
e d
ata
is fo
r th
e “
Co
st o
f R
ep
rod
uction
Ne
w”
valu
e,
as o
f N
ove
mb
er
20
13’s
ap
pra
isal.
Me
mo
ria
l P
um
p S
tati
on
(S
ew
ag
e)
1
4
$3
00
,00
0
Insta
lled
in 1
974
, co
st e
stim
ate
of
$3
00
,00
0.
Cu
rrie
Lif
t S
tati
on
Pu
mp
Sta
tio
n (
Sew
ag
e)
1
5
$6
62
,80
0
No
t p
rovi
ded
.
Pe
nh
ryn
Lif
t S
tati
on
an
d B
oo
ste
r P
um
p S
tati
on
(Sew
ag
e)
16
$3
,206
,900
D
ata
pro
vide
d fo
r “P
en
rhyn
Sta
tio
n”.
Th
e d
ata
is f
or
the
“C
ost
of
Re
pro
ductio
n N
ew
” va
lue
, as o
f N
ove
mbe
r 2
01
3’s
app
rais
al.
Gyro
be
ac
h a
nd
pa
rk (
va
lua
tio
n i
s f
or
wa
sh
roo
ms
on
ly)
16
$2
51
,00
0
Ba
se
d o
n C
ost
of
Re
pro
duction
Ne
w.
Page 38
AE
CO
M
Capital R
egio
nal D
istr
ict
Coasta
l S
ea L
evel R
ise
Ris
k A
ssessm
ent
RP
T-2
015-0
1-2
6-C
RD
Coast
al S
LR
Ris
k A
sse
ssm
ent-
60310678 F
INA
L.D
ocx
Pa
ge
33
Ke
y p
ub
lic
as
se
t S
LR
Fo
cu
s
Are
a #
V
alu
ati
on
B
as
is f
or
va
lua
tio
n
Isla
nd
Vie
w B
ea
ch
cam
pg
rou
nd
(va
luatio
n is
for
toil
et
bu
ild
ing
an
d in
form
ati
on
kio
sk
only
)
17
$4
3,9
29
“I
sla
nd
Vie
w B
ea
ch
– T
oile
t B
uild
ing
” va
lue
d a
t $
27
,033
and
an
“Is
land
Vie
w
Be
ach
– I
nfo
rma
tion
Kio
sk”
valu
ed
at $
16,8
96.
No
te:
the a
vaila
ble
da
ta c
ou
ld
no
t b
e u
sed
to
co
nfirm
if t
hese s
pecifi
c fa
cili
ties
we
re in
the
pa
rt o
f th
e Isla
nd
Vie
w b
ea
ch
th
at
wo
uld
be
within
the
inu
nd
ation
lin
e.
Sid
ne
y P
um
p S
tati
on
(S
ew
ag
e)
1
9
$3
,952
,800
T
he
da
ta is
fo
r th
e “
Co
st o
f R
ep
rod
uction
Ne
w”
valu
e,
as o
f N
ove
mb
er
20
13’s
ap
pra
isal.
Ma
ns
on
Ro
ad
Pu
mp
Sta
tio
n (
Sew
ag
e)
2
3
$1
54
,40
0
Th
e d
ata
is fo
r th
e “
Co
st o
f R
ep
rod
uction
Ne
w”
valu
e,
as o
f N
ove
mb
er
20
13’s
ap
pra
isal.
Ga
ng
es
Lib
rary
2
3
$6
,200
,000
N
ot
pro
vid
ed
. P
art
of
this
build
ing
ma
y b
e o
uts
ide
of
the
inu
nd
ation
lin
e.
Page 39
AECOM Capital Regional District Coastal Sea Level Rise Risk Assessment
RPT-2015-01-26-CRD Coastal SLR Risk Assessment-60310678 FINAL.Docx Page 34
3.6 Economic Valuation
Table 12 provides a summary of the total assessed value determined by BC Assessment for land and improvements that exist within the inundation line for the 2100 + 500-year storm surge scenario for each SLR Focus Area. Across the 24 SLR Focus Areas, residential property has the highest total assessed value, followed by commercial and then civic, institutional and recreational land uses. The SLR Focus Areas with the highest assessed values within this inundation line are:
• Oak Bay Windsor Park area, with $330million of assessed value, principally for residential property.
• Gorge Industrial and Redevelopment area, with $112million of assessed value, principally for the commercial
and industrial categories.
• Esquimalt Naval, South Sidney and Tsehum North Saanich, each having total assessed values of close to
$100million.
Page 40
AECOM Capital Regional District Coastal Sea Level Rise Risk Assessment
RPT-2015-01-26-CRD Coastal SLR Risk Assessment-60310678 FINAL.Docx Page 35
Table 12 - Summary of economic valuation (2014 BC Assessment data) for each SLR Focus Area ($Million)
SLR Focus Area Number and Name
Re
si d
en
tia
l
Co
mm
erc
ial
Civ
ic,
Ins
titu
tio
na
l an
d
Re
cre
ati
on
al
Tra
ns
po
rta
tio
n,
Co
mm
un
ica
tio
n
an
d U
tili
ty
Ind
us
tria
l
Fa
rm
Min
ing
an
d A
llie
d
Ind
us
try
Un
cla
ss
ifie
d
To
tal
1. Port Renfrew 14.6 1.5 2.6 0.6 0.2 0.0 0.0 0.0 19.5
2. Jordan River 2.5 0.6 1.9 0.0 0.3 0.0 0.0 0.0 5.2
3. Hwy 14 Shirley 14.5 0.1 0.0 0.0 0.0 0.2 0.0 0.0 14.8
4. Milnes Landing 7.2 0.1 2.0 0.0 0.0 0.7 0.0 0.0 10.0
5. Albert Head 2.6 0.0 0.7 0.0 0.0 0.0 0.0 0.0 3.4
6. Esq Lagoon 13.5 2.8 9.1 0.0 0.0 0.0 0.0 0.0 25.4
7. Gorge View Royal 68.8 0.0 5.8 0.2 0.0 0.0 0.0 0.0 74.8
8. Gorge Saanich 31.9 2.1 12.2 0.0 0.0 0.0 0.0 0.0 46.2
9. Gorge Industrial 11.7 56.1 14.9 7.0 21.6 0.0 1.1 0.0 112.4
10. Esq DND Naval 0.0 0.0 45.8 13.2 35.1 0.0 0.0 4.5 98.5
11. Gorge Esquimalt 29.8 3.5 3.6 0.0 0.0 0.0 0.0 0.0 36.8
12. Inner Harbour4 16.0 20.5 1.9 23.2 0.0 0.0 0.0 0.0 61.6
13. Ogden Point 0.5 10.4 19.4 22.4 0.0 0.0 0.0 0.0 52.7
14. Dallas Rd 16.6 0.0 4.9 0.0 0.0 0.0 0.0 0.0 21.5
15. Oak Bay Windsor 299.2 19.3 10.6 1.0 0.0 0.0 0.0 0.0 330.1
16. Cadboro Bay 58.8 0.9 9.0 0.0 0.0 0.0 0.0 0.0 68.6
17. Island View Beach 9.4 1.9 17.9 0.0 0.0 0.3 0.0 0.0 29.5
18. Patricia Bay 0.0 0.0 5.4 0.4 0.0 0.0 0.0 0.0 5.8
19. South Sidney 68.9 2.5 14.1 8.2 0.0 0.0 0.0 0.0 93.6
20. Tsehum Sidney 52.0 19.1 5.1 0.0 0.6 0.0 0.0 0.0 76.8
21. Tsehum N Saanich 59.5 34.0 1.5 0.5 0.0 0.0 0.0 0.0 95.4
22. Fulford 1.5 2.8 0.1 1.5 0.4 0.1 0.0 0.0 6.4
23. Ganges 2.1 22.7 5.8 0.0 0.5 0.0 0.0 0.0 31.1
24. Galliano 7.9 0.0 0.0 0.1 0.1 0.0 0.0 0.0 8.1
Total 789.6 200.7 193.9 78.5 58.8 1.3 1.1 4.5 1328.3
Source: Data provided by CRD using 2014 BC Assessment data
Note: The Forestry and Allied Industry classification is not reported in this table as the total valuation for this
classification was negligible. See Appendix B for data for this category.
4 The Inner Harbour SLR Focus Area includes a number of high value parcels within the inundation line for this
scenario. This includes water lots and a number of residential suite properties that exist as part of a parcel of land
within the inundation line.
Page 41
AECOM Capital Regional District Coastal Sea Level Rise Risk Assessment
RPT-2015-01-26-CRD Coastal SLR Risk Assessment-60310678 FINAL.Docx Page 36
3.7 Service Disruption
3.7.1 Summary of Case Study Results
Table 13 summarizes the quantitative findings of the three case studies. For each case study, the Total Economic
Impact ranges from $90,000 per day to more than $400,000 per day due to disruption from temporary inundation
from storm surge events on transportation, residential community or business assets within one Focus Area. The
figures can be extrapolated to give an indication of the economic impact of a permanent inundation scenario. The
total daily economic impact is based on average year-round economic conditions. Considering that economic certain
impacts, such as those related to tourism, will vary by season, AECOM also estimated daily impacts of service
disruption during the winter months when service disruption is most likely to occur. As the table below illustrates, the
daily impact of service disruption for the Victoria Inner Harbour drops by half when only winter tourism activity is
considered.
A detailed explanation of the methodology used to arrive at total economic impacts can be found in Appendix C.
Table 13 - Summary of economic impacts for service disruption case studies
Case Study Type Focus Area
Total Economic
Impact per day of
disruption (year-round
average)
Total Daily
Impact (winter
months only) (1)
Focus Area
Population (2)
Service Disruption
Impacts on a
Transportation Asset
Highway 14, south of
Shirley $92,015 $88,862
915 nearby
residents
Service Disruption
Impacts on a Residential
Community
Oak Bay / Windsor
Park $9,979 NA 1,388 residents
Service Disruption
Impacts on a Business
District
Victoria Inner Harbour $415,557 $214,322
161 workers
(year-round)
125 workers
(winter)
Note 1: Winter impacts were estimated only for indicators for which seasonal data was readily available. See Appendix for details on how daily impacts
during the winter were calculated.
Note 2: The Focus Area population is the population of communities dependent on the transportation asset, the resident population of the residential
community, and the estimated workforce of key business district employers. This population figure is meant to compare total impacts of each case study to
Focus Area’s size, in terms that are relevant to the type of service disruption. This does not imply that losses are only experienced by the population
defined here. See Appendix C for sources of population data.
3.7.2 Transportation Disruption Case Study
3.7.2.1 Overview
The transportation disruption scenario assesses the economic impact of the temporary disruption of Highway 14,
south of Shirley (Focus Area number 3). Figures for Focus Area 3 (see Appendix A Map Book) show the extent of
inundation of Highway 14 for different scenarios. This case study assesses potential impacts for the scenario where
storm surge events may temporarily disrupt Highway 14.
Page 42
AECOM Capital Regional District Coastal Sea Level Rise Risk Assessment
RPT-2015-01-26-CRD Coastal SLR Risk Assessment-60310678 FINAL.Docx Page 37
A storm surge event that inundates Highway 14 will disrupt the most direct route from Victoria to Port Renfrew (see
Appendix A Map Book for relative position of these communities). Inundation of the route will result in fewer visits to
the West Coast Trail and British Columbia’s provincial parks, fewer riders on a popular private transportation service,
longer in-bound and out-bound commute times for residents to the northwest of the Focus Area and higher costs for
British Columbia’s Emergency Services Unit to respond to emergencies.
3.7.2.2 Indicators and Data Metrics
Five indicators of economic impact are assessed for this case study:
• Commute costs
• Private transit costs
• Tourism costs
• Emergency services costs
• Fiscal costs
To quantify the economic impact of temporary service disruption along Highway 14, five corresponding metrics are
used to determine the monetary value of the indicators. Metric calculations are intended to be replicable, meaning a
similar process can be applied in determining the impacts of service disruptions to the same asset type in other
areas. With this in mind, metrics rely on publically available data inputs whenever possible. These metrics, along
with their data inputs, are summarized in the table below.
Table 14 – Transportation Disruption Cost Indicators
Indicator Metric Data Inputs
Commute Costs Daily cost of lost time per
worker
Number of vehicle trips per day
Additional travel time required per trip
from route impairment
Average dollar value per hour of a
commuter’s time
Private Transit Costs
Daily cost of lost business
revenue from service
disruption
Average daily passengers
Average revenue per passenger
Tourism Costs Daily cost of lost tourism
spending
Average daily visitors (provincial and
national parks)
Daily spending per visitor (provincial and
national parks)
Emergency Services
Costs
Daily cost of alternative
emergency services
# of emergency response events per day
Additional cost of air versus road
response per event
Fiscal Costs Daily cost of lost sales tax
revenue
Output from “Tourist Costs” metric
Provincial and general sales tax rates
Page 43
AECOM Capital Regional District Coastal Sea Level Rise Risk Assessment
RPT-2015-01-26-CRD Coastal SLR Risk Assessment-60310678 FINAL.Docx Page 38
3.7.2.3 Transportation Disruption Key Findings
Table 15 provides a summary of the daily economic impacts of transportation disruption caused by a storm surge
that would inundate Highway 14. The final row, “Total Impacts”, represents the sum of all five metrics that were
used for this case study. Note that in some cases individual metrics are duplicative of others, meaning that the Total
Impact reported here should be viewed as a gross, as opposed to a net measure of economic impact.5 The rightmost
column estimates the average daily impact during the winter only, when the West Coast Trail is not accessible.
In addition to total gross economic impacts, a per capita measure of economic impacts is displayed. For the
transportation asset case study, the per capita economic impact is calculated by dividing total daily impacts by the
estimated resident population of communities that would be most affected. For this case study these communities
have been taken to be Shirley, Jordan River and Port Renfrew, which are close to or to the west of the point on the
highway that would be inundated. While economic losses will be experienced by a wider population than these
communities alone (including business owners and public agencies), the per capita figure places total impacts in the
context of the Focus Area’s size, and in terms that are relevant to the type of service disruption.
Table 15 - Transportation Disruption Total Impacts Summary
Indicator Daily Impact (year round)
Daily Impact (winter scenario) (1)
Tra
nsp
ort
atio
n D
isru
ptio
n Im
pa
cts
Commute Costs $52,776 $52,776
Private transit costs $950 $0
Tourism Costs $34,232 $32,325
Emergency services cost $298 $298
Fiscal cost $3,759 $3,463
Total Impacts $92,015 $88,862
Population of Impacted Communities
(Shirley, Jordan River, and Port Renfrew)
915 915
Daily Impacts Per Capita $101 $97
Note 1: Winter impacts exclude effects of West Coast Trail tourism and private transit to the West Coast trail, which is closed during the winter. Seasonal
data was for provincial parks was not incorporated in the winter estimate due to data limitations.
5 For example, private transit and tourism revenue are reported inclusive of sales tax. Fiscal impacts are also reported separately to
reflect a distinct externality.
Page 44
AECOM Capital Regional District Coastal Sea Level Rise Risk Assessment
RPT-2015-01-26-CRD Coastal SLR Risk Assessment-60310678 FINAL.Docx Page 39
3.7.3 Community Disruption Case Study
3.7.3.1 Case Study Overview
The Community Disruption Case Study assesses the economic impacts of storm surge in the Oak Bay / Windsor
Park Focus Area (see Figures for Focus Area 15 in Appendix A Map Book). A storm surge event that inundates the
Oak Bay Focus Area has the potential to disrupt the life of local residents. Inundation of the neighborhood may result
in disruption of utility service, longer commute times due to flooded roads, higher costs to deliver emergency
services, the closure of recreation areas, and in the long run, lower property values and tax receipts because of flood
risks. For some SLR and storm surge scenarios the inundation could occur in a way that makes the south-eastern
portion of this area into a temporary “island”. Without any management measures in place (e.g. to maintain a
corridor of unflooded roads), this could prevent access to and from this part of the area, and this would drive some of
the types of community disruption that are described below.
This case study assesses the potential economic impacts resulting from storm surge events that will cause
temporary disruption of the delivery of public and utility services and the operation of recreational amenities in the
Focus Area.
3.7.3.2 Indicators and Data Metrics
Five indicators of economic impacts are assessed in a quantitative manner for this case study:
• Emergency services costs
• Commute costs
• Residential utility disruption costs
• Fiscal risk
Three additional indicators (business disruption, recreation disruption, and transit disruption) are assessed in
qualitative terms.
Replicable metrics are assigned to each indicator to determine the economic impact of service disruption in the
Focus Area. Metrics rely primarily on publically available data inputs, with the intention of establishing a replicable
process. These metrics, along with their data inputs, are summarized on the following page.
Page 45
AECOM Capital Regional District Coastal Sea Level Rise Risk Assessment
RPT-2015-01-26-CRD Coastal SLR Risk Assessment-60310678 FINAL.Docx Page 40
Table 16 - Overview of Community Impact Indicators and Metrics
Indicator Metric Data Inputs
Serv
ice D
isru
pti
on
Im
pac
ts
Alternative Emergency Services
Costs
Daily cost of alternative
emergency services
# of emergency response
events per day
Additional cost of air versus
road response per event
Commute Costs Daily cost of lost time per
worker
Number of worker residents
Additional travel time required
per trip from route impairment
Residential Utility Service Costs Lost utility revenues per
day
Average daily household utility
spending
Number of impacted
households
Fis
cal
Ris
k
Fiscal Risk Property tax revenues at
risk of decline
Value of properties in focus
area
Local property tax rate
Qu
ali
tati
ve i
mp
acts
Public Transit Impacts Bus routes impacted by
disruption
List of bus routes and general
ridership data
Recreation Costs Closed recreation assets
Recreation assets in Focus
Area
Visitors / revenue if known
Business Disruption
Number of local
businesses
Business licenses
Members of business
improvement district
3.7.3.3 Community Disruption Key Findings
The following is a summary of the daily economic impacts of service disruption caused by a storm surge event in the
Oak Bay / Windsor Park Focus Area. The final row, “Total Impacts”, represents the sum of four of the five
Page 46
AECOM Capital Regional District Coastal Sea Level Rise Risk Assessment
RPT-2015-01-26-CRD Coastal SLR Risk Assessment-60310678 FINAL.Docx Page 41
quantitative metrics; the Fiscal Risk metric is considered separately from the others because the metric expresses a
cumulative risk, rather than an estimate of daily economic impacts. Winter impacts were not estimated for the
Community Disruption Scenario, since indicator outcomes are not heavily dependent on tourism.
In addition to total gross daily economic impacts, a per capita measure of economic impacts is displayed. For the
community disruption case study, the per capita economic impact is calculated by dividing total daily impacts by the
estimated resident population. While economic losses will be experienced by a wider population than residents
alone, the per capita figure places total impacts in the context of the Focus Area’s size, in terms that are relevant to
the type of service disruption.
Table 17 – Community Disruption: Quantitative Indicators Summary
Indicator Daily Economic Impact
Commute Costs per day $7,059
Emergency Services Cost per day $441
Residential Utility Disruption Cost per day $2,479
Total Daily Impacts $9,979
Focus Area Population 1,388
Total Daily Impacts Per Capita $7
Property Tax Revenues at Risk $1,567,480
The Community Disruption Case study includes three qualitative assessments in addition to the quantitative metrics
above; while these three additional economic impacts to the Focus Area cannot yet be quantified because of data
limitations, the study recognizes their importance and thus includes them in the analysis. These three qualitative
assessments cover impacts to public transit, recreation and local business.
Transit Impacts
The Focus Area is served by three bus routes: Route 2 – Oak Bay / Willows / Downtown (roughly 25,000 daily
boardings along the entire route), Route 8 – Interurban / Oak Bay (roughly 20,000 daily boardings), and Route 1 –
Downtown /Richardson (less than 20,000 passengers per day) (BC Transit 2011). At 11.4%, transit’s share of
passenger trips in the Oak Bay District, which encompasses the Focus Area, is higher than in any other area of the
CRD outside of Victoria (Victoria Rapid Transit 2011).
Shifts in commute times for residents who live in the Focus Area are already quantified using the Commute Costs
indicator listed in Table 17 above, although differences in impacts between transit riders and vehicle commuters are
not considered. In addition to the impacts on workers who live in the Focus Area, it is likely, though not yet
quantifiable, that a storm surge event in the Focus Area could impact the commute times of other transit users who
rely on bus routes that pass through the Focus Area.
Page 47
AECOM Capital Regional District Coastal Sea Level Rise Risk Assessment
RPT-2015-01-26-CRD Coastal SLR Risk Assessment-60310678 FINAL.Docx Page 42
AECOM understands that transportation boarding data may be available at the Focus Area level. In future analyses,
transit impacts could be developed as a quantitative indicator, measured either as lost revenue to the local transit
agency, or the value of longer commute times for transit riders along the system.
Recreation Impacts
The Focus Area includes several recreation assets including the Monterey Elementary School fields and Windsor
Park Field. Just outside the Focus Area is the private Victoria Golf Club, whose 1,200 members pay $37 million in
membership fees, according to AECOM’s estimate (Victoria News 2013 and AECOM analysis). It should be
acknowledged that valuing recreation assets in terms of fees charged biases the analysis toward recreation assets
located in high-income areas, as well as private recreation assets. In the future, the CRD may wish to explore more
sophisticated valuation methods of recreation valuation (for example, valuing the intrinsic value of recreation assets,
or quantifying the positive impacts of a park on public health).
Business Disruption
During storm events businesses may be forced to close down either because of flooding of a business
establishment, or because of disruption in utility services that would impair safe business operations. In either case,
these impacts would lead to a reduction in business revenue. The District of Oak Bay reports 600 active business
licenses in the municipality, while the local business improvement district has 92 active members (Oak Bay 2014;
Oak Bay BIA 2014). Public data were not available to determine the number of these businesses located in the
Focus Area, or their aggregate revenues and number of employees. . It is AECOM’s understanding that the CRD’s
employer database could provide local business data to support future analyses. The final case study of Business
Disruption, below, presents a methodology for using primary research to determine the daily economic impacts of
storm surge on local businesses in terms of wages and revenue, based on publically available employer data.
3.7.4 Business Disruption Case Study
3.7.4.1 Overview of Case Study
The Business Disruption Case Study assesses the economic impact of storm surge related flooding on major
businesses located in Victoria’s Inner Harbour (see Figures for Focus Area 12 in Appendix A Map Book ). Disruption
of harbour businesses will impact the revenue of firms, wages paid to workers (or worker productivity), as well as the
behavior of tourists who rely on the Inner Harbour as an entry point to Victoria.
A storm surge event that inundates the Inner Harbour will impact the activities of businesses primarily in the
transportation industry. These include the sea plane service company, Harbour Air, and the ferry companies Clipper
Vacations and Blackball Ferry, which both operate international ferries between Victoria and Seattle and Port
Angeles. The analysis only includes impacts on these businesses.
Smaller businesses in the area include restaurants, a gift shop, and licensed street vendors, many of which operate
as tenants of properties owned by the Greater Victoria Harbour Authority. Impacts to these smaller businesses are
not considered here due to data limitations.
3.7.4.2 Service Disruption Indicators and Data Metrics
Four indicators of economic impacts are assessed for this case study:
• Worker Productivity Costs
• Business Revenue Costs
• Tourism Costs
• Fiscal costs
Page 48
AECOM Capital Regional District Coastal Sea Level Rise Risk Assessment
RPT-2015-01-26-CRD Coastal SLR Risk Assessment-60310678 FINAL.Docx Page 43
Replicable metrics are used to determine the economic impact of business disruption for each of the above
indicators. Whenever possible, metrics rely on publically available data to ensure the analysis can be replicated in
other Focus Areas; however, in the case of business-level data, primary interviews were often necessary to
supplement public information. Each indicator’s metrics and data inputs are summarized in the table below.
Table 18 – Business Disruption Indicators and Metrics
Indicator Metric Data Inputs
Bu
sin
ess
Dis
rup
tion
Im
pa
cts
Worker Productivity Cost
Daily cost of lost wages of
disrupted business
establishments (experienced
either as lost income or
reduced productivity)
Number of workers – large
firms only (gathered from
interviews / review of public
documents)
Average industry wage
Business Revenue Cost
Daily cost of lost aggregate
revenue of disrupted
business establishments
Number of passengers –
large firms (* will change by
industry)
Revenue per passenger
Tourism Cost Daily cost of lost ancillary
tourist spending
Number of daily passengers
Ancillary spending per
passenger
Fiscal Cost Daily cost of lost sales tax
revenue
Outputs from the Business
Revenue and Tourism Cost
Metrics above.
General sales tax rate
3.7.4.3 Summary of Costs
The following is a summary of the daily economic impacts of service disruption caused by a storm surge event in the
Inner Harbour Focus Area. The final row, “Total Impacts”, represents the sum of all four metrics. Note that wage and
revenue impacts are duplicative of one another, as wages are paid out of revenue. The Total Impacts row should
therefore be viewed as a gross as opposed to a net economic impact. The rightmost column estimates the daily
impact of service disruption during the winter months only, based on seasonal passenger data reported by Blackball
Ferry only.
In addition to total gross economic impacts, a per capita measure of economic impacts is displayed. For the
business disruption case study, the per capita economic impact is calculated by dividing total daily impacts by the
estimated workforce population (including only those firms that publically report workforce data). While economic
losses will be experienced by a wider population than workers alone, the per capita figure places total impacts in the
context of the Focus Area’s size, and in terms that are relevant to the type of service disruption.
Page 49
AECOM Capital Regional District Coastal Sea Level Rise Risk Assessment
RPT-2015-01-26-CRD Coastal SLR Risk Assessment-60310678 FINAL.Docx Page 44
Table 19 – Business Disruption Total Costs Summary
Indicator Daily Impact (year-round) Daily Impact (winter months) (1)
Wages / Productivity cost $34,937 $27,023
Revenue cost $160,373 $130,596
Tourism cost $192,035 $45,598
Fiscal cost $28,212 $11,105
Total Impacts $415,557 $214,322
Worker Population of Focus Area
(Blackball Ferry and Harbour Air)
161 125
Total Daily Impacts Per Capita
(workforce)
$2,581 $1,714
Note 1: Winter impact uses winter ridership and winter tourist spending figures for Blackball Ferry. Winter employment for Blackball Ferry was also implied from these figures. For all other businesses, winter impacts were assumed to be constant (as seasonal data was not publically available).
Page 50
AECOM Capital Regional District Coastal Sea Level Rise Risk Assessment
RPT-2015-01-26-CRD Coastal SLR Risk Assessment-60310678 FINAL.Docx Page 45
4. Conclusions
The mapping and analysis developed as part of this project were used to draw the following conclusions:
a. As a result of varying topography there are different levels of inundation that may occur across the CRD
coastline for the SLR and storm surge scenarios that were considered as part of this project. Many of the
lower lying areas that may have higher levels of inundation coincide with developed and populated areas,
leading to the potential for infrastructure damage, safety risk and service disruption.
b. The study of distinct coastal areas for SLR planning purposes requires that the provincial guidelines for
floodplain mapping be applied along with a means for laterally defining these areas, i.e. applying the land-
ward limit and a limit on the intersecting axis. By applying a set of principles for this lateral definition the
project identified 24 SLR Focus Areas that have relatively high levels of expected future inundation and / or
key community assets that are present in those areas. These are not the only areas of the CRD that may
experience inundation for these scenarios, but were selected as key areas for which analysis could be
conducted within the scope of this project, and which would help support CRD’s longer term work in SLR risk
management.
c. Almost all electoral areas and municipalities within the CRD have areas that contain at least one key
community, transportation or business asset that would be inundated for the selected scenario of year 2100
+ 500-year storm surge. These areas of inundation also include lands that are currently used for residential,
commercial, civic / institutional and industrial purposes. The confirmed presence of these assets and land
uses reinforces the need for CRD’s work in identifying the potential risks that may arise from SLR and the
appropriate management measures for the region.
d. The analysis provided in this report focuses on the assets that would be temporarily inundated under storm
surge conditions for the selected scenario of SLR for year 2100 + 500-year storm surge. This does not imply
long-term effect or destruction of this land or infrastructure. It does however identify the type and scale of
assets that may be at risk from SLR. The key assets that would be at least partially inundated for this
selected scenario are principally network structures for water and wastewater (pump stations, treatment
plants), a library, a public works yard and some road bridges. There is the potential for some large
businesses to be at least partially inundated for this scenario, with some of their operations (e.g. ferry, float
plane) being regionally important for the tourism sector. There are also a large number of marine docks that
are within the inundation line for this scenario, though it has not been assumed that infrastructure damage
would necessarily occur to the dock structures themselves. Shoreline classification data show presence of a
wide range of shoreline types and sensitivity ratings across the SLR Focus Areas, including different natural
coastal classes as well as man-made classes. Sensitivity ratings to SLR are generally classed as Very High
or High.
e. One of the main areas of Highway within the inundation line for the year 2100 + 500-year storm surge
scenario is at Highway 14 between Sooke and Port Renfrew. This area was used as a case study for
transportation service disruption. There are a small number of locations along this section that would be at
least temporarily inundated during storm surge conditions for this scenario. As alternative routing in this area
is limited, this inundation would disrupt movement of traffic between the Greater Victoria area and
communities out to Port Renfrew, and could require re-routing via Lake Cowichan. As well as disruption to
local residents this inundation could have effects for emergency response and for visitors accessing
recreational sites and trails in this area.
Page 51
AECOM Capital Regional District Coastal Sea Level Rise Risk Assessment
RPT-2015-01-26-CRD Coastal SLR Risk Assessment-60310678 FINAL.Docx Page 46
f. Temporary inundation from storm surge also has the potential to disrupt other aspects of life for local
residents. The case study of inundation in the Oak Bay / Windsor Park area shows extra costs incurred for
emergency services, commuting, residential utility disruption, and recreation as well as fiscal risk from
declining property tax.
g. For the 24 Focus Areas used for this project the total valuation of land and improvements within the year
2100 + 500-year storm surge inundation line ranges from $330 million (Oak Bay Windsor Park SLR Focus
Area) to $3.4million (Albert Head SLR Focus Area). Across the 24 SLR Focus Areas, residential property
has the highest total assessed value, followed by commercial and then civic, institutional and recreational
land uses. The key public assets that were identified within the inundation lines and were subject to
valuation in this project included pump stations (with varying valuations up to approximately $4million), and
parts of the Lower Public Works yard and Ganges Library that may be subject to inundation and as a whole
have multi-million dollar valuations.
h. This project has developed and applied a method for defining SLR Focus Areas, for characterising existing
land uses, for identifying and valuing key public assets and for valuing land and infrastructure. While specific
data sets may vary for other jurisdictions these methods will have relevance for assessing SLR risks for
other areas.
Page 52
AECOM Capital Regional District Coastal Sea Level Rise Risk Assessment
RPT-2015-01-26-CRD Coastal SLR Risk Assessment-60310678 FINAL.Docx Page 47
5. Recommendations
The following recommendations are made:
a. That CRD use the analysis and mapping conducted for the 24 Focus Areas as an evidence base for the
identification and appraisal of options for a future model bylaw that deals with SLR management for the
CRD. In particular, the analysis provided in this project demonstrates the types of land use, key assets,
services and indicative economic values that exist in areas at inundation risk and this evidence will help to
develop the objectives for and assess the impacts of different management options.
b. That the digital files produced by this project for the entire CRD region are used for future work by the CRD
and regional municipalities / electoral areas to assess areas not covered by the 24 Focus Areas. This
application of data and the assessment methods applied by this project will be useful if a more localised and
detailed review of SLR risks is undertaken by CRD or regional municipalities / electoral areas.
c. That CRD consider opportunities to communicate the approaches used in this project to other municipalities
or Regional Districts that would benefit from identifying SLR risk in their coastal areas. The methods and
data sets used for this project are not yet fully standardised or represented in guidelines and so this project
may have value as a concept demonstrator for other local governments.
d. That CRD consider the value in assessing inundation risk that could occur from flooding of drainage and
other water systems. This recommendation is based on feedback received by regional municipalities /
electoral areas during the project that water could enter coastal outfalls and create a flow of water to low-
lying inland areas that would not otherwise have direct connectivity to inundated areas. The assessment of
such risks was not within the scope of this project and AECOM has not reviewed the potential for this to
occur. Data generated from this project could be used to create maps to show where such non-connected
low-lying areas are located.
Page 53
AECOM Capital Regional District Coastal Sea Level Rise Risk Assessment
RPT-2015-01-26-CRD Coastal SLR Risk Assessment-60310678 FINAL.Docx
Appendix A Map Book Sea Level Rise Focus Area Map Book
Enclosed as six separate PDF documents
A separate map book is provided for each SLR scenario, with Focus Areas listed in the order as follows:
# Name Municipality / Electoral Area
1 Port Renfrew Juan de Fuca Electoral Area 2 Jordan River Juan de Fuca Electoral Area 3 Highway 14 south of Shirley Juan de Fuca Electoral Area 4 Milnes Landing District of Sooke 5 Albert Head Lagoon District of Metchosin 6 Esquimalt Lagoon City of Colwood 7 Gorge – View Royal Town of View Royal 8 Gorge – Saanich District of Saanich 9 Gorge Industrial and Redevelopment Land City of Victoria 10 Esquimalt DND Naval Township of Esquimalt 11 Gorge - Esquimalt Township of Esquimalt 12 Inner Harbour City of Victoria 13 Ogden Point City of Victoria 14 Dallas Road City of Victoria 15 Oak Bay Windsor Park Area District of Oak Bay 16 Cadboro Bay District of Saanich 17 Island View Beach District of Central Saanich 18 Patricia Bay District of North Saanich 19 South Sidney Town of Sidney 20 Tsehum Harbour – Sidney Town of Sidney 21 Tsehum Harbour – North Saanich District of North Saanich 22 Fulford Harbour Salt Spring Island 23 Central Ganges Salt Spring Island 24 Galliano – north of Sturdies Bay Southern Gulf Islands
Page 54
AECOM Capital Regional District Coastal Sea Level Rise Risk Assessment
RPT-2015-01-26-CRD Coastal SLR Risk Assessment-60310678 FINAL.Docx
Appendix B Focus Area Land Use and Valuation Statistics Key to table headings:
• Actual Land Use, Zoning, First Nation Reserves:
o Area (sq-m) – total area of land registered for each category that is within the 2100 + 500 year storm surge scenario.
o % of total – area of land registered for the given category within the 2100 + 500 year storm surge scenario as a percentage of total area of land (registered for all categories) that is within the 2100 + 500 year storm surge scenario.
• Physical Shoreline: o Length (m) – total length of shoreline that is within the 2100 + 500 year storm surge scenario, for
each shoreline category. o % of total - length of shoreline that is within the 2100 + 500 year storm surge scenario, for each
shoreline category, as a percentage of the total length of shoreline (registered for all shoreline categories) that is within the 2100 + 500 year storm surge scenario.
• Land Valuation o Total Land Value – total value of parcel (BC Assessment data) within the 2100 + 500 year storm
surge scenario. Valuation data provided by CRD using 2014 BC Assessment data. o Total Improvements Value – total value of Improvements (BC Assessment data) within the 2100 +
500 year storm surge scenario. Valuation data provided by CRD using 2014 BC Assessment data. o Total Value – total value of land and improvements (BC Assessment data) within the 2100 + 500
year storm surge scenario. Valuation data provided by CRD using 2014 BC Assessment data. • Roads
o Length - total length of road that is within the 2100 + 500 year storm surge scenario, for each road category.
Page 55
SLR Focus Area # 1 - Port Renfrew
Actual Land Use
Actual Land Use Category Area (sq-m) % of total
CIVIC, INSTITUTIONAL & RECREATIONAL - VACANT 2,454,956 36%
2 ACRES OR MORE - VACANT 1,425,511 21%
INDUSTRIAL - VACANT 1,107,333 16%
NO JUROL IDENTIFIER; LAND USE UNKNOWN 1,002,412 15%
VACANT 342,835 5%
CAMPGROUND (COMMERCIAL) 233,835 3%
2 ACRES OR MORE - SINGLE FAMILY DWELLING, DUPLEX 106,680 2%
MARINE & NAVIGATIONAL FACILITIES (INCLUDES FERRY
LANDINGS, BREAKWATERS, BOAT RAMPS, LIGHTHOUSES,
FORESHORE FACILITIES, ETC).
59,658 1%
SINGLE FAMILY DWELLING 53,985 1%
2 ACRES OR MORE - OUTBUILDING 39,631 1%
2 ACRES OR MORE - SEASONAL DWELLING 39,194 1%
PARKS & PLAYING FIELDS 15,926 0.2%
VACANT RESIDENTIAL LESS THAN 2 ACRES 8,449 0.1%
RESIDENTIAL OUTBUILDING ONLY 5,924 0.1%
SEASONAL RESORT 3,377 0.0%
MANUFACTURED HOME - (NOT IN MANUFACTURED HOME
PARK)1,574 0.0%
BED & BREAKFAST OPERATION LESS THAN 4 UNITS 1,083 0.0%
WATER DISTRIBUTION SYSTEMS 850 0.0%
SEASONAL DWELLING 845 0.0%
CHURCHES & BIBLE SCHOOLS 743 0.0%
STORE(S) AND LIVING QUARTERS 698 0.0%
MARINE FACILITIES - MARINA 275 0.0%
RANGER STATION 205 0.0%
Zoning
Zoning Category Area (sq-m) % of total
Municipal Zoning
MP 183,039 55%
ALR 73,697 22%
CR-1 53,817 16%
CU 19,445 6%
IND 2,836 1%
JF_Zoning
AG 3,291,454 52%
P 2,005,302 31%
RL 503,532 8%
GR 235,705 4%
MP 183,038 3%
ALR 73,697 1%
CR-1 53,817 1%
CU 18,747 0.3%
CD-2A 7,166 0.1%
IND 2,836 0.0%
Focus Area # 1 - Port Renfrew Page 1
Page 56
First Nation Reserves
Reserve name (First Nation) Area (sq-m)
Gordon River First Nation Reserve No. 2 475,653
Pacheena First Nation Reserve No. 1 387,828
Physical Shoreline
Physical Shoreline Category Length (m) % of total
Shoreline Type
Estuary (Organics/Fines) 21,361 59%
Sand and Gravel Beach, narrow < 30m 4,425 12%
Sand Beach, wide > 30m 4,104 11%
Sand Flat, wide > 30m 2,718 8%
Sand and Gravel Flat or Fan, wide > 30m 1,841 5%
Man made, permeable 1,331 4%
Rock Ramp, narrow < 30m 131 0%
Rock Ramp with Sand and Gravel Beach, narrow < 30m 25 0%
Sensitivity Rating
Very high sensitivity 32,587 91%
High sensitivity 3,257 9%
Low sensitivity 92 0%
Land Valuation
Category of Land Total Land Value
Total Improv'ts
Value Total Value
Residential $8,838,731 $5,717,155 $14,555,887
Civic, Institutional and Recreational $2,543,496 $31,764 $2,575,259
Commercial $856,842 $633,101 $1,489,943
Transportation, Communication and Utility $143,799 $477,198 $620,997
Industrial $220,880 $0 $220,880
Focus Area # 1 - Port Renfrew Page 2
Page 57
Roads
Road Category Length (m) Unit cost Valuation
Subclass-Local Lane-2 7,832 770 $6,030,431
Subclass-resource Lane-2 2,014 770 $1,550,855
Subclass-collector minor Lane-2 1,375 870 $1,195,963
Subclass-recreation Lane-2 448 770 $344,796
Subclass-arterial minor Lane-2 62 1190 $73,847
Major Transmission and Pipelines
No major assets identified
Key Assets
[valuation given for selected public assets; see main report for basis for valuation]
Asset Name Valuation where available
Port Renfrew Wastewater Treatment Plant and 2 facilities
marked as WTP disinfection 654,400$
Community of Port Renfrew
Port Renfrew Pump Station
Deering Rd Bridge (North)
Deering Rd Bridge (South)
Island Rd Bridge
Focus Area # 1 - Port Renfrew Page 3
Page 58
SLR Focus Area # 2 - Jordan River
Actual Land Use
Actual Land Use Category Area (sq-m) % of total
INDUSTRIAL - VACANT 109,296 28%
PARKS & PLAYING FIELDS 90,950 23%
CIVIC, INSTITUTIONAL & RECREATIONAL - VACANT 78,907 20%
NO JUROL IDENTIFIER; LAND USE UNKNOWN 52,856 13%
LOGGING OPERATIONS 19,698 5%
IMPROVED 13,541 3%
MISCELLANEOUS (FOREST AND ALLIED INDUSTRY) 12,664 3%
SINGLE FAMILY DWELLING 7,370 2%
BED & BREAKFAST OPERATION LESS THAN 4 UNITS 4,932 1%
RESTAURANT ONLY 2,310 1%
VACANT RESIDENTIAL LESS THAN 2 ACRES 290 0%
2 ACRES OR MORE - VACANT 132 0%
OFFICE BUILDING (PRIMARY USE) 8 0%
Zoning
Zoning Category Area (sq-m) % of total
Municipal Zoning
A 193,755 53%
B 169,857 47%
Juan de Fuca Zoning
A 193,755 42%
No Zone 133,653 29%
RL 118,601 26%
JR-1 5,175 1%
CR-1A 4,932 1%
C-1B 4,794 1%
RR-2A 132 0%
First Nation Reserves
Reserve name (First Nation) Area (sq-m) % of total
None identified
Physical Shoreline
Physical Shoreline Category Length (m) % of total
Shoreline type
Gravel Flat, wide > 30m 2,673 69%
Man made, permeable 555 14%
Gravel Beach, narrow < 30m 546 14%
Sand and Gravel Flat or Fan, wide > 30m 123 3%
Sensitivity Rating
High sensitivity 3,351 86%
Moderate sensitivity 546 14%
Focus Area # 2 - Jordan River Page 4
Page 59
Land Valuation
Category of Land Total Land Value
Total Improve'ts
Value Total
Residential $1,271,034 $1,217,198 $2,488,232
Civic, Institutional and Recreational $1,795,918 $81,059 $1,876,977
Commercial $146,900 $416,000 $562,900
Industrial $38,885 $238,079 $276,964
Forest and Allied Industry $2,000 $0 $2,000
Roads
Road Category Length (m) Unit cost Valuation
Subclass-highway_minor Lane-2 960 1850 $1,775,701
Subclass-recreation Lane-2 243 770 $187,347
Subclass-service Lane 2 315 770 $242,427
Major Transmission and Pipelines
No major assets identified
Key Assets
[valuation given for selected public assets]
Asset Name Valuation where available
Jordan River Bridge -
Jordan River campground -
Log sort business -
Focus Area # 2 - Jordan River Page 5
Page 60
Actual Land Use
Actual Land Use Category Area (sq-m) % of total
NO JUROL IDENTIFIER; LAND USE UNKNOWN 100,656 38%
2 ACRES OR MORE - VACANT 49,838 19%
VACANT RESIDENTIAL LESS THAN 2 ACRES 31,489 12%
SINGLE FAMILY DWELLING 26,555 10%
2 ACRES OR MORE - SINGLE FAMILY DWELLING, DUPLEX 19,873 7%
OTHER 17,870 7%
MIXED 8,646 3%
2 ACRES OR MORE - SEASONAL DWELLING 7,928 3%
BED & BREAKFAST OPERATION LESS THAN 4 UNITS 3,721 1%
SAND & GRAVEL (VACANT AND IMPROVED) 191 0%
INDUSTRIAL - VACANT 134 0%
Zoning
Zoning Category Area (sq-m) % of total
Municipal Zoning
A 107,624 38%
RR-A 63,343 23%
AF 45,359 16%
AG 44,336 16%
R-4 17,252 6%
B 1,980 1%
JF_Zoning
RR-OB 64,230 33%
A 43,038 22%
AF 39,308 20%
AG 36,902 19%
R-4 8,696 5%
First Nation Reserves
Reserve name (First Nation) Area (sq-m) % of total
None identified
Physical Shoreline
Physical Shoreline Category Length (m) % of total
Shoreline type
Sand and Gravel Flat or Fan, wide > 30m 4,242 64%
Gravel Flat, wide > 30m 1,847 28%
Sand and Gravel Beach, narrow < 30m 520 8%
Sensitivity Rating
High sensitivity 6,089 92%
Moderate sensitivity 520 8%
SLR Focus Area # 3 - Highway 14 South of Shirley
Focus Area # 3 Highway 14 Shirl Page 6
Page 61
Land Valuation
Category of Land Total Land Value
Total Improve'ts
Value Total
Residential $10,386,364 $4,135,640 $14,522,003
Farm $9,730 $208,885 $218,615
Commercial $29,752 $27,204 $56,956
Industrial $9,695 $0 $9,695
Roads
Road Category Length (m) Unit cost Valuation
Subclass-highway_minor Lane-2 789 1850 $1,459,370
Major Transmission and Pipelines
No major assets identified
Key Assets
[valuation given for selected public assets]
Asset Name Valuation where available
Section of Highway 14 -
Muir Creek Bridge -
Focus Area # 3 Highway 14 Shirl Page 7
Page 62
Actual Land Use
Actual Land Use Category Area (sq-m) % of total
2 ACRES OR MORE - SINGLE FAMILY DWELLING, DUPLEX 99,365 25%
CIVIC, INSTITUTIONAL & RECREATIONAL - VACANT 93,641 23%
2 ACRES OR MORE - VACANT 62,671 15%
PARKS & PLAYING FIELDS 34,664 9%CAMPGROUNDS (INCLUDES GOVERNMENT
CAMPGROUNDS, YMCA & CHURCH, ETC). (EXCLUDES
COMMERCIAL CAMPGROUND). 25,593 6%
GRAIN & FORAGE 20,062 5%
SINGLE FAMILY DWELLING 17,340 4%
MIXED 14,912 4%
MIXED - VACANT 11,433 3%
2 ACRES OR MORE - OUTBUILDING 6,532 2%
NO JUROL IDENTIFIER; LAND USE UNKNOWN 6,007 1%
VACANT RESIDENTIAL LESS THAN 2 ACRES 5,624 1%
OTHER - VACANT 4,143 1%
OTHER 2,019 0%
RESIDENTIAL OUTBUILDING ONLY 594 0%
BED & BREAKFAST OPERATION LESS THAN 4 UNITS 181 0%
SINGLE FAMILY DWELLING WITH BASEMENT SUITE 102 0%
GOLF COURSES (INCLUDES PUBLIC & PRIVATE) 86 0%
MANUFACTURED HOME - (NOT IN MANUFACTURED HOME
PARK) 25 0%
NEIGHBOURHOOD PUB 18 0%
DUPLEX - SINGLE UNIT OWNERSHIP 0 0%
Zoning
Zoning Category Area (sq-m) % of total
RU3 162,490 42%
P1 116,269 30%
RU2 90,326 23%
CD2-C 7,363 2%
R1 3,983 1%
W7 3,939 1%
RR1A 2,260 1%
M4 2,019 1%
CD2-E 224 0%
CD2-B 113 0%
First Nation Reserves
Reserve name (First Nation) Area (sq-m)
T'Sou-ke First Nation Reserve No. 1 2,655
SLR Focus Area # 4 -Milnes Landing
Focus Area # 4 - Milnes Landing Page 8
Page 63
Physical Shoreline
Physical Shoreline Category Length (m) % of total
Shoreline Type
Sand and Gravel Beach, narrow < 30m 942 93%
Sand and Gravel Flat or Fan, wide > 30m 67 7%
Sensitivity Rating
High sensitivity 1,008 100%
Land Valuation
Category of Land Total Land Value
Total Improve'ts
Value Total
Residential $5,179,015 $2,040,529 $7,219,544
Civic, Institutional and Recreational $1,910,915 $79,323 $1,990,238
Farm $309,428 $373,922 $683,349
Commercial $79,977 $53,720 $133,697
Roads
Road Category Length (m) Unit cost Valuation
Subclass-Local Lane-2 298 770 $229,230
Subclass-arterial major Lane-2 112 1190 $133,726
Major Transmission and Pipelines
Key Assets
[valuation given for selected public assets]
Asset Name Valuation where available
Sooke Flats Campground -
Sun River Nature Trail -
Part of the Fortis gas distribution line passes through this focus area. This is the only line shown to serve Sooke and so is
classed as an important part of this system
Focus Area # 4 - Milnes Landing Page 9
Page 64
Actual Land Use
Actual Land Use Category Area (sq-m) % of total
CIVIC, INSTITUTIONAL & RECREATIONAL - VACANT 70,889 77%
SINGLE FAMILY DWELLING 11,057 12%
GOVERNMENT BUILDINGS (INCLUDES COURTHOUSE, POST
OFFICE, MUNICIPAL HALL, FIRE HALL, POLICE STATIONS,
ETC). (EXCLUDES TYPICAL OFFICE BUILDINGS; REFER TO
COMMERCIAL SECTIONS). 4,549 5%
2 ACRES OR MORE - SINGLE FAMILY DWELLING, DUPLEX 2,472 3%
SINGLE FAMILY DWELLING WITH BASEMENT SUITE 2,318 3%
VACANT RESIDENTIAL LESS THAN 2 ACRES 1,137 1%
BED & BREAKFAST OPERATION LESS THAN 4 UNITS 96 0%
Zoning
Zoning Category Area (sq-m) % of total
P3 75,444 79%
RR1 20,630 21%
First Nation Reserves
Reserve name (First Nation) Area (sq-m)
None identified
Physical Shoreline
Physical Shoreline Category Length (m) % of total
Shoreline Type
Estuary (Organics/Fines) 854 58%
Sand and Gravel Beach, narrow < 30m 474 32%
Sand and Gravel Flat or Fan, wide > 30m 141 10%
Sensitivity Rating
Very high sensitivity 854 58%
Moderate sensitivity 460 31%
High sensitivity 154 10%
Land Valuation
Category of Land Total Land Value
Total Improve'ts
Value Total
Residential $1,663,244 $972,633 $2,635,877
Civic, Institutional and Recreational $663,830 $42,865 $706,695
Commercial $15,289 $17,285 $32,574
SLR Focus Area # 5 - Albert Head Lagoon
Focus Area # 5 - Albert Head Page 10
Page 65
Roads
Road Category Length (m) Unit cost Valuation
Subclass-Local Lane-2 154 770 $118,681
Major Transmission and Pipelines
No major assets identified
Key Assets
[valuation given for selected public assets]
Asset Name Valuation where available
Regional Park -
Focus Area # 5 - Albert Head Page 11
Page 66
Actual Land Use
Actual Land Use Category Area (sq-m) % of total
2 ACRES OR MORE - SINGLE FAMILY DWELLING, DUPLEX 110,682 35%
CIVIC, INSTITUTIONAL & RECREATIONAL - VACANT 62,562 20%SCHOOLS & UNIVERSITIES, COLLEGE OR TECHNICAL
SCHOOLS (INCLUDES PRIVATE KINDERGARTENS). 42,177 13%
2 ACRES OR MORE - VACANT 41,485 13%
STORE(S) AND SERVICE - COMMERCIAL 14,689 5%
NO JUROL IDENTIFIER; LAND USE UNKNOWN 8,293 3%
VACANT RESIDENTIAL LESS THAN 2 ACRES 7,876 3%
SINGLE FAMILY DWELLING 6,366 2%
RECREATIONAL & CULTURAL BUILDINGS (INCLUDES
CURLING RINK ARENA, SWIMMING POOLS, MUSEUMS,
HISTORICAL BUILDINGS, ART GALLERY, LIBRARIES)
(EXCLUDE PARKS, GOLF COURSES & GOVERNMENT
CAMPGROUNDS). 5,934 2%
SINGLE FAMILY DWELLING WITH BASEMENT SUITE 4,134 1%
GOVERNMENT BUILDINGS (INCLUDES COURTHOUSE, POST
OFFICE, MUNICIPAL HALL, FIRE HALL, POLICE STATIONS,
ETC). (EXCLUDES TYPICAL OFFICE BUILDINGS; REFER TO
COMMERCIAL SECTIONS). 3,244 1%
BED & BREAKFAST OPERATION LESS THAN 4 UNITS 2,822 1%
GOVERNMENT RESERVES (INCLUDES GREENBELTS (NOT IN
FARM USE), BIRD SANCTUARIES, ECOLOGY RESERVES, ETC). 1,793 1%
DUPLEX - SINGLE UNIT OWNERSHIP 1,448 0%
Zoning
Zoning Category Area (sq-m) % of total
P4 1,417,542 86%
R1 132,040 8%
AG1 75,988 5%
CD6 15,764 1%
AG2 3,103 0%
First Nation Reserves
Reserve name (First Nation) Area (sq-m)
None identified
SLR Focus Area # 6 - Esquimalt Lagoon
Focus Area # 6 - Esq Lagoon Page 12
Page 67
Physical Shoreline
Physical Shoreline Category Length (m) % of total
Shoreline Type
Sand Flat, wide > 30m 8,255 54%
Estuary (Organics/Fines) 6,756 44%
Sand and Gravel Beach, narrow < 30m 330 2%
Sensitivity rating
Very high sensitivity 15,011 98%
Moderate sensitivity 330 2%
Land Valuation
Category of Land Total Land Value
Total Improve'ts
Value Total
Residential $10,139,377 $3,402,061 $13,541,438
Civic, Institutional and Recreational $3,096,454 $5,969,448 $9,065,902
Commercial $1,776,735 $975,014 $2,751,749
Roads
Road Category Length (m) Unit cost Valuation
Subclass-Local Lane-2 2,364 770 $1,820,374
Subclass-local Lane 1 501 620 $310,517
Subclass-collector minor Lane-2 102 870 $88,313
Major Transmission and Pipelines
No major assets identified
Key Assets
[valuation given for selected public assets; see main report for basis for valuation]
Asset Name Valuation where available
Royal Roads University grounds -
Ocean Blvd (road) -
3301 Ocean Blvd Lift Station (Sewage) 800,000$
205 Portsmouth Drive Lift Station (Sewage) 350,000$
Bldg 32 Pump Station (Sewage) -
Esquimalt Lagoon Bridge 2,500,000$
Focus Area # 6 - Esq Lagoon Page 13
Page 68
Actual Land Use
Actual Land Use Category Area (sq-m) % of total
SINGLE FAMILY DWELLING 73,518 34%
CIVIC, INSTITUTIONAL & RECREATIONAL - VACANT 32,100 15%
MULTI-FAMILY - GARDEN APARTMENT & ROW HOUSING 26,106 12%
PARKS & PLAYING FIELDS 25,752 12%
NO JUROL IDENTIFIER; LAND USE UNKNOWN 23,501 11%
SINGLE FAMILY DWELLING WITH BASEMENT SUITE 21,317 10%
SCHOOLS & UNIVERSITIES, COLLEGE OR TECHNICAL
SCHOOLS (INCLUDES PRIVATE KINDERGARTENS). 4,131 2%
GARBAGE DUMPS, SANITARY FILLS, SEWER LAGOONS, ETC. 4,003 2%
RAILWAY 1,846 1%
WATER DISTRIBUTION SYSTEMS 955 0%
VACANT RESIDENTIAL LESS THAN 2 ACRES 755 0%
PROPERTY SUBJECT TO SEC 19(8) 729 0%
RESIDENTIAL OUTBUILDING ONLY 274 0%
Zoning
Zoning Category Area (sq-m) % of total
VIEW ROYAL Residential 3 171,137 72%
VIEW ROYAL Residential 6 34,629 15%
P-1 25,386 11%
VIEW ROYAL Institutional Use 3 4,132 2%
VIEW ROYAL Institutional Use 1 1,898 1%
A-1 586 0%
VIEW ROYAL Residential 4 55 0%
First Nation Reserves
Reserve name (First Nation) Area (sq-m)
None identified
Physical Shoreline
Physical Shoreline Category Length (m) % of total
Shoreline Type
Estuary (Organics/Fines) 2,093 37%
Man made, permeable 1,575 28%
Rock Ramp, narrow < 30m 1,391 25%
Rock Cliff, narrow < 30m 300 5%
Sand Beach, narrow < 30m 280 5%
Sensitivity Rating
Very high sensitivity 5,611 100%
High sensitivity 27 0%
SLR Focus Area # 7 - Gorge View Royal
Focus Area #7 - Gorge View Roy Page 14
Page 69
Land Valuation
Category of Land Total Land Value
Total Improve'ts
Value Total
Residential $44,429,035 $24,323,435 $68,752,470
Civic, Institutional and Recreational $4,361,202 $1,435,784 $5,796,986
Transportation, Communication and Utility $179,073 $41,154 $220,226
Roads
Road Category Length (m) Unit cost Valuation
Subclass-Local Lane-2 1,252 770 $964,201
Subclass-arterial minor Lane-2 259 1190 $307,668
Subclass-recreation Lane-2 78 770 $59,908
Subclass-restricted Lane 2 64 770 $49,292
Subclass-arterial_minor Lane 1 51 1530 $77,982
Major Transmission and Pipelines
No major assets identified
Key Assets
[valuation given for selected public assets; see main report for basis for valuation]
Asset Name Valuation where available
Midwood Pump Station (Sewage) 275,000$
Helmcken Park Pump Station (Sewage) 275,900$
Focus Area #7 - Gorge View Roy Page 15
Page 70
Actual Land Use
Actual Land Use Category Area (sq-m) % of total
CIVIC, INSTITUTIONAL & RECREATIONAL - VACANT 119,505 57%
SINGLE FAMILY DWELLING 41,916 20%
SINGLE FAMILY DWELLING WITH BASEMENT SUITE 13,807 7%
RECREATIONAL & CULTURAL BUILDINGS (INCLUDES
CURLING RINK ARENA, SWIMMING POOLS, MUSEUMS,
HISTORICAL BUILDINGS, ART GALLERY, LIBRARIES)
(EXCLUDE PARKS, GOLF COURSES & GOVERNMENT
CAMPGROUNDS). 9,628 5%
GOVERNMENT BUILDINGS (INCLUDES COURTHOUSE, POST
OFFICE, MUNICIPAL HALL, FIRE HALL, POLICE STATIONS,
ETC). (EXCLUDES TYPICAL OFFICE BUILDINGS; REFER TO
COMMERCIAL SECTIONS). 8,486 4%
VACANT RESIDENTIAL LESS THAN 2 ACRES 4,936 2%
DUPLEX 2,415 1%
NO JUROL IDENTIFIER; LAND USE UNKNOWN 2,006 1%
SHOPPING CENTRE - REGIONAL 1,410 1%
PARKS & PLAYING FIELDS 1,081 1%
MOTEL & AUTO COURT 857 0%
TRIPLEX 829 0%
RECREATIONAL CLUBS, SKI HILLS 660 0%
MULTI-FAMILY - APARTMENT BLOCK 303 0%
STORES AND/OR OFFICES WITH APARTMENTS 269 0%
SCHOOLS & UNIVERSITIES, COLLEGE OR TECHNICAL
SCHOOLS (INCLUDES PRIVATE KINDERGARTENS). 188 0%MARINE & NAVIGATIONAL FACILITIES (INCLUDES FERRY
LANDINGS, BREAKWATERS, BOAT RAMPS, LIGHTHOUSES,
FORESHORE FACILITIES, ETC). 138 0%
BED & BREAKFAST OPERATION LESS THAN 4 UNITS 133 0%
MULTI-FAMILY - GARDEN APARTMENT & ROW HOUSING 98 0%
Zoning
Zoning Category Area (sq-m) % of total
P-1 598,581 72%
P-4N 111,615 13%
P-4 46,303 6%
RS-6 36,062 4%
RS-12 23,220 3%
A-1 11,105 1%
RS-13 4,673 1%
C-3 1,935 0%
RD-1 1,265 0%
C-10 1,003 0%
RA-1 852 0%
RA-3 345 0%
SLR Focus Area # 8 - Gorge Saanich
Focus Area # 8 - Gorge Saanich Page 16
Page 71
First Nation Reserves
Reserve name (First Nation) Area (sq-m)
None identified
Physical Shoreline
Physical Shoreline Category Length (m) % of total
Shoreline Type
Man made, permeable 3,221 46%
Rock Ramp, narrow < 30m 2,260 32%
Estuary (Organics/Fines) 1,126 16%
Sand and Gravel Beach, narrow < 30m 271 4%
Sand Beach, narrow < 30m 197 3%
Sensitivity Rating
Very high sensitivity 6,514 92%
High sensitivity 560 8%
Land Valuation
Category of Land Total Land Value
Total Improve'ts
Value Total
Residential $24,239,226 $7,624,736 $31,863,962
Civic, Institutional and Recreational $10,957,980 $1,228,534 $12,186,515
Commercial $1,090,338 $1,054,790 $2,145,128
Transportation, Communication and Utility $2,000 $0 $2,000
Roads
Road Category Length (m) Unit cost Valuation
Subclass-arterial major Lane-2 918 1190 $1,092,577
Subclass-Local Lane-2 341 770 $262,224
Subclass-arterial minor Lane-2 105 1190 $124,971
Subclass-collector minor Lane-4 20 1530 $29,923
Major Transmission and Pipelines
No major assets identified
Key Assets
[valuation given for selected public assets; see main report for basis for valuation]
Asset Name Valuation where available
Colquitz Pump Station (Sewage) 265,600$
Dunkirk Lane Pump Station (Sewage) 409,400$
Dysart Pump Station (Sewage) 857,300$
Focus Area # 8 - Gorge Saanich Page 17
Page 72
Actual Land Use
Actual Land Use Category Area (sq-m) % of total
ELECTRICAL POWER SYSTEMS (INCLUDING NON-UTILITY
COMPANIES) 24,374 12%
STORAGE & WAREHOUSING - CLOSED 21,235 10%
SHIPYARDS 20,456 10%
CIVIC, INSTITUTIONAL & RECREATIONAL - VACANT 19,387 9%
METAL FABRICATING INDUSTRIES 15,455 7%GOVERNMENT BUILDINGS (INCLUDES COURTHOUSE, POST
OFFICE, MUNICIPAL HALL, FIRE HALL, POLICE STATIONS,
ETC). (EXCLUDES TYPICAL OFFICE BUILDINGS; REFER TO
COMMERCIAL SECTIONS). 15,325 7%
INDUSTRIAL - VACANT 12,348 6%
CONCRETE MIXING PLANTS 12,314 6%
MISCELLANEOUS (TRANSPORTATION & COMMUNICATION) 9,026 4%
MARINE FACILITIES - MARINA 8,189 4%
STORE(S) AND OFFICES 7,904 4%
VACANT 5,485 3%
WORKS YARDS 5,037 2%
MISCELLANEOUS (MINING AND ALLIED INDUSTRIES) 4,775 2%
STORAGE & WAREHOUSING - OPEN 4,383 2%
AUTOMOBILE PAINT SHOP, GARAGES, ETC. 4,279 2%
MULTI-FAMILY - VACANT 4,243 2%
ASPHALT PLANTS 2,928 1%
OFFICE BUILDING (PRIMARY USE) 2,821 1%
PARKING - LOT ONLY, PAVED OR GRAVEL 2,220 1%
DOCKS & WHARVES 1,624 1%
COMMERCIAL STRATA-LOT 1,325 1%
STORE(S) AND SERVICE - COMMERCIAL 1,108 1%
MISCELLANEOUS & (INDUSTRIAL OTHER) 1,092 1%
AUTOMOBILE SALES (LOT) 951 0%
RECREATIONAL & CULTURAL BUILDINGS (INCLUDES
CURLING RINK ARENA, SWIMMING POOLS, MUSEUMS,
HISTORICAL BUILDINGS, ART GALLERY, LIBRARIES) (EXCLUDE
PARKS, GOLF COURSES & GOVERNMENT CAMPGROUNDS). 808 0%
SAND & GRAVEL (VACANT AND IMPROVED) 796 0%
PARKS & PLAYING FIELDS 555 0%
RAILWAY 258 0%
NEIGHBOURHOOD PUB 243 0%
STRATA-LOT RESIDENCE (CONDOMINIUM) 121 0%
MULTI-FAMILY - APARTMENT BLOCK 41 0%
CEMENT PLANTS 12 0%
TRANSPORTATION EQUIPMENT INDUSTRY (INCLUDING
AIRCRAFT, MOTOR VEHICLE, TRUCK BODY, RAILROAD,
SHIPBUILDING, BOATBUILDING, AND REPAIR OF SAME). 0 0%
SLR Focus Area # 9 - Gorge Industrial and Redevelopment Land
Focus Area # 9 - Gorge Ind Page 18
Page 73
Zoning
Zoning Category Area (sq-m) % of total
M-3 132,412 49%
CD-9 21,018 8%
S-PH 17,758 7%
SD-1 17,594 6%
VHP 16,182 6%
CD-1 13,099 5%
M-2 12,139 4%
M-3S 8,931 3%
CA-W 6,281 2%
MS-4 4,676 2%
CA-19 4,257 2%
M2-G 3,909 1%
SD-2 3,832 1%
CD-5 3,827 1%
M-G 1,850 1%
CA-3C 1,326 0%
M2-I 1,265 0%
CA-34 633 0%
M3-C 289 0%
R-2 209 0%
S-3 191 0%
M-4 91 0%
T-1 48 0%
First Nation Reserves
Reserve name (First Nation) Area (sq-m)
New Songhees First Nation Reserve No. 1A 453
Physical Shoreline
Physical Shoreline Category Length (m) % of total
Shoreline Type
Man made, permeable 5,091 89%
Sand and Gravel Beach, narrow < 30m 348 6%
Rock Ramp, narrow < 30m 262 5%
Sensitivity Rating
High sensitivity 3,783 66%
Very high sensitivity 1,919 34%
Focus Area # 9 - Gorge Ind Page 19
Page 74
Land Valuation
Category of Land Total Land Value
Total Improve'ts
Value Total
Commercial $26,640,747 $29,473,019 $56,113,766
Industrial $17,486,908 $4,137,422 $21,624,332
Civic, Institutional and Recreational $12,916,527 $1,934,424 $14,850,951
Residential $9,318,163 $2,396,053 $11,714,216
Transportation, Communication and Utility $6,224,427 $797,847 $7,022,273
Mining and Allied Industry $1,081,636 $4,829 $1,086,465
Roads
Road Category Length (m) Unit cost Valuation
Subclass-Local Lane-2 1,108 770 $853,345
Subclass-arterial major Lane-2 176 1190 $209,496
Subclass-collector major Lane-3 139 1180 $163,820
Subclass-collector major Lane-4 25 1530 $37,575
Major Transmission and Pipelines
No major assets identified
Key Assets
[valuation given for selected public assets; see main report for basis for valuation]
Asset Name Valuation where available
Point Hope dockyard
Dockland Green private power facility
Point Ellice Bay St road bridge (note: elevation above water level for this scenario)
Concrete plant
Steel facility
Lower Public Works Yard 4,887,000$
Jutland Business District
Harbour Pump Station (Sewage) 420,000$
Garbally Pump Station (Sewage) 400,000$
Selkirk Trestle: Galloping Goose regional trail (note: bridge elevation above water level for this scenario)
Johnson St Bridge (road bridge, 133m of E&N rail though this was not identified as operational, Galloping Goose regional trail) (note:
elevation of bridge above water level for this scenario)
Focus Area # 9 - Gorge Ind Page 20
Page 75
Actual Land Use
Actual Land Use Category Area (sq-m) % of total
DOCKS & WHARVES 129,192 56%GOVERNMENT BUILDINGS (INCLUDES COURTHOUSE, POST
OFFICE, MUNICIPAL HALL, FIRE HALL, POLICE STATIONS,
ETC). (EXCLUDES TYPICAL OFFICE BUILDINGS; REFER TO
COMMERCIAL SECTIONS). 84,173 36%
CIVIC, INSTITUTIONAL & RECREATIONAL - VACANT 11,359 5%
NO JUROL IDENTIFIER; LAND USE UNKNOWN 6,949 3%
Zoning
Zoning Category Area (sq-m) % of total
ESQUIMALT Institutional Use 2 102,542 58%
ESQUIMALT Commercial 4 74,624 42%
First Nation Reserves
Reserve name (First Nation) Area (sq-m)
None identified
Physical Shoreline
Physical Shoreline Category Length (m) % of total
Shoreline Type
Man made, permeable 4,757 91%
Sand and Gravel Beach, narrow < 30m 196 4%
Rock Ramp with Gravel Beach, narrow < 30m 175 3%
Rock Ramp, narrow < 30m 113 2%
Sensitivity Rating
High sensitivity 5,042 96%
Very high sensitivity 122 2%
Moderate sensitivity 78 1%
Land Valuation
Category of Land Total Land Value
Total Improve'ts
Value Total
Civic, Institutional and Recreational $19,297,826 $26,470,416 $45,768,242
Industrial $22,043,840 $13,053,082 $35,096,922
Transportation, Communication and Utility $13,186,000 $0 $13,186,000
Unclassified $1,372,417 $3,098,353 $4,470,770
SLR Focus Area # 10 - Esquimalt DND Naval
Focus Area # 10 - Esq Naval Page 21
Page 76
Roads
Road Category Length (m) Valuation
No registered roads in this Focus Area - -
Major Transmission and Pipelines
No major assets identified
Key Assets
[valuation given for selected public assets]
Asset Name Valuation where available
DND Naval Base
Federal land leased to Seaspan (shipyard)
Pump Station No 2 (Sewage)
Rainbow Pump Station (Sewage)
Signal Hill Pump Station No 2 (Sewage)
Lift Station from Bldg 126 Pump Station No 2 (Sewage)
Pump Station No 11 (Sewage)
Graving Dock Lift Station No 14 (Sewage)
North Wharf Lift Station No 15 (Sewage)
Focus Area # 10 - Esq Naval Page 22
Page 77
Actual Land Use
Actual Land Use Category Area (sq-m) % of total
NO JUROL IDENTIFIER; LAND USE UNKNOWN 101,830 68%
SINGLE FAMILY DWELLING 23,412 16%
SINGLE FAMILY DWELLING WITH BASEMENT SUITE 7,687 5%
HOTEL 7,203 5%
CIVIC, INSTITUTIONAL & RECREATIONAL - VACANT 2,136 1%
Code 300 (not defined by BC Assessment) 1,942 1%
VACANT RESIDENTIAL LESS THAN 2 ACRES 1,569 1%
STRATA-LOT RESIDENCE (CONDOMINIUM) 1,094 1%
MULTI-FAMILY - APARTMENT BLOCK 1,059 1%
DUPLEX - UP & DOWN 996 1%
BED & BREAKFAST OPERATION 4 OR MORE UNITS 706 0%
NURSING HOME 329 0%
BED & BREAKFAST OPERATION LESS THAN 4 UNITS 98 0%
TRIPLEX 62 0%
DUPLEX 59 0%
ROW HOUSING - SINGLE UNIT OWNERSHIP 56 0%MARINE & NAVIGATIONAL FACILITIES (INCLUDES FERRY
LANDINGS, BREAKWATERS, BOAT RAMPS, LIGHTHOUSES,
FORESHORE FACILITIES, ETC). 16 0%
DUPLEX - SINGLE UNIT OWNERSHIP 3 0%
Zoning
Zoning Category Area (sq-m) % of total
ESQUIMALT Recreation 1 48,562 33%
Data layer gives no attribute data; unknown zoning 42,347 28%
ESQUIMALT Residential 3 30,575 21%
P-1 12,326 8%
ESQUIMALT Mixed Use 4 7,160 5%
ESQUIMALT Residential 4 5,336 4%
ESQUIMALT Residential 6 2,487 2%
VIEW ROYAL Recreation 2 71 0%
First Nation Reserves
Reserve name (First Nation) Area (sq-m)
None identified
Physical Shoreline
Physical Shoreline Category Length (m) % of total
Shoreline Type
Man made, permeable 1,456 49%
Estuary (Organics/Fines) 870 29%
Rock Ramp, narrow < 30m 479 16%
Sand Beach, narrow < 30m 192 6%
Sensitivity Rating
Very high sensitivity 2,265 76%
High sensitivity 732 24%
SLR Focus Area # 11 - Gorge Esquimalt
Focus Area # 11 - Gorge Esq Page 23
Page 78
Land Valuation
Category of Land Total Land Value
Total Improve'ts
Value Total
Residential $20,196,783 $9,566,472 $29,763,254
Civic, Institutional and Recreational $3,551,542 $26,897 $3,578,439
Commercial $2,947,500 $511,227 $3,458,727
Transportation, Communication and Utility $2,000 $0 $2,000
Unclassified $1 $0 $1
Roads
Road Category Length (m) Unit cost Valuation
Subclass-Local Lane-2 179 770 $137,900
Subclass-collector minor Lane-4 21 1530 $32,175
Subclass-recreation Lane-2 36 770 $27,352
Subclass-arterial major Lane-2 102 1190 $121,155
Major Transmission and Pipelines
No major assets identified
Key Assets
[valuation given for selected public assets; see main report for basis for valuation]
Asset Name Valuation where available
Forshaw Pump Station (Sewage) -
Craigflower Pump Station (Sewage) 2,806,700$
Sewage Storage Chamber (Sewage) -
Focus Area # 11 - Gorge Esq Page 24
Page 79
Actual Land Use
Actual Land Use Category Area (sq-m) % of total
MARINE FACILITIES - MARINA 54,168 45%
CIVIC, INSTITUTIONAL & RECREATIONAL - VACANT 26,772 22%
MARINE & NAVIGATIONAL FACILITIES (INCLUDES FERRY
LANDINGS, BREAKWATERS, BOAT RAMPS, LIGHTHOUSES,
FORESHORE FACILITIES, ETC). 18,500 15%
PARKING - LOT ONLY, PAVED OR GRAVEL 16,634 14%
NO JUROL IDENTIFIER; LAND USE UNKNOWN 2,337 2%
PARKS & PLAYING FIELDS 701 1%
VACANT 490 0%
STORE(S) AND OFFICES 339 0%
STORE(S) AND SERVICE - COMMERCIAL 309 0%
STRATA-LOT RESIDENCE (CONDOMINIUM) 261 0%
OFFICE BUILDING (PRIMARY USE) 113 0%
COMMERCIAL STRATA-LOT 8 0%
Zoning
Zoning Category Area (sq-m) % of total
IH-PARK 22,813 19%
IHT2 22,711 19%
IHBA 21,002 18%
IHSN 18,084 15%
IHT3 14,432 12%
IHSS 7,174 6%
IHR 6,050 5%
IHM 5,947 5%
IHF 398 0%
IHH 307 0%
CA-W 18 0%
IHB 2 0%
First Nation Reserves
Reserve name (First Nation) Area (sq-m)
None identified
Physical Shoreline
Physical Shoreline Category Length (m) % of total
Shoreline Type
Man made, permeable 1,806 100%
Sensitivity rating
High sensitivity 1,806 100%
SLR Focus Area # 12 - Inner Harbour
Focus Area # 12 -Inner Harbour Page 25
Page 80
Land Valuation
Category of Land Total Land Value
Total Improve'ts
Value Total
Transportation, Communication and Utility $14,856,683 $8,389,913 $23,246,596
Commercial $16,688,285 $3,795,523 $20,483,807
Residential $10,581,483 $5,412,753 $15,994,236
Civic, Institutional and Recreational $1,904,378 $7,290 $1,911,668
Roads
Road Category Length (m) Unit cost Valuation
Subclass-ferry Lane-2 229 1190 $272,460
Subclass-Local Lane-2 17 770 $13,157
Major Transmission and Pipelines
No major assets identified
Key Assets
[valuation given for selected public assets]
Asset Name Valuation where available
Coho ferry terminal
Clipper terminal
Customs facilities
Marina and floating docks
Harbour Air terminal
Focus Area # 12 -Inner Harbour Page 26
Page 81
Actual Land Use
Actual Land Use Category Area (sq-m) % of total
MARINE FACILITIES - MARINA 191,238 75%GOVERNMENT BUILDINGS (INCLUDES COURTHOUSE, POST
OFFICE, MUNICIPAL HALL, FIRE HALL, POLICE STATIONS,
ETC). (EXCLUDES TYPICAL OFFICE BUILDINGS; REFER TO
COMMERCIAL SECTIONS). 57,668 23%
OFFICE BUILDING (PRIMARY USE) 5,375 2%
VACANT 905 0%
TRIPLEX 297 0%
SINGLE FAMILY DWELLING 267 0%
HOTEL 51 0%
STRATA LOT - PARKING RESIDENTIAL 32 0%
COMMERCIAL STRATA-LOT 3 0%
Zoning
Zoning Category Area (sq-m) % of total
M-2 109,123 61%
M-S-1 64,602 36%
VHP 3,909 2%
MS-3 73 0%
R3-L 41 0%
MS-2 32 0%
R2-36 30 0%
First Nation Reserves
Reserve name (First Nation) Area (sq-m)
None identified
Physical Shoreline
Physical Shoreline Category Length (m) % of total
Shoreline Type
Man made, permeable 3,327 97%
Rock Cliff, narrow < 30m 86 3%
Sensitivity Rating
High sensitivity 2,754 81%
Very high sensitivity 659 19%
Land Valuation
Category of Land Total Land Value
Total Improve'ts
Value Total
Transportation, Communication and Utility $12,880,410 $9,565,011 $22,445,420
Civic, Institutional and Recreational $16,557,211 $2,844,532 $19,401,739
Commercial $6,291,010 $4,067,099 $10,358,108
Residential $327,988 $206,572 $534,560
SLR Focus Area # 13 - Ogden Point
Focus Area # 13 - Ogden Point Page 27
Page 82
Roads
Road Category Length (m) Unit cost Valuation
Subclass-collector major Lane-2 29 870 $24,976
Subclass-Local Lane-2 11 770 $8,455
Major Transmission and Pipelines
No major assets identified
Key Assets
[valuation given for selected public assets]
Asset Name Valuation where available
Fishermens Wharf (tourism attraction and houseboats) -
Greater Victoria Harbour Authority, Helijet and Coastguard facilities -
Cruise ship terminal -
Focus Area # 13 - Ogden Point Page 28
Page 83
Actual Land Use
Actual Land Use Category Area (sq-m) % of total
CIVIC, INSTITUTIONAL & RECREATIONAL - VACANT 70,478 83%
CEMETARIES (INCLUDES PUBLIC OR PRIVATE). 6,502 8%
SINGLE FAMILY DWELLING 2,653 3%
NO JUROL IDENTIFIER; LAND USE UNKNOWN 2,499 3%
TRIPLEX 922 1%
DUPLEX 778 1%
DUPLEX - UP & DOWN 532 1%
SINGLE FAMILY DWELLING WITH BASEMENT SUITE 272 0%
MULTI-FAMILY - APARTMENT BLOCK 188 0%
STRATA-LOT RESIDENCE (CONDOMINIUM) 88 0%
STRATA LOT - PARKING RESIDENTIAL 88 0%
DUPLEX - SINGLE UNIT OWNERSHIP 7 0%
Zoning
Zoning Category Area (sq-m) % of total
R1-B 23,525 68%
R3-2 1,717 5%
R-J 8,936 26%
R1-G 408 1%
R1-18 84 0%
First Nation Reserves
Reserve name (First Nation) Area (sq-m)
None identified
Physical Shoreline
Physical Shoreline Category Length (m) % of total
Shoreline Type
Sand and Gravel Beach, narrow < 30m 1,503 73%
Gravel Beach, narrow < 30m 431 21%
Rock Ramp, narrow < 30m 69 3%
Rock Platform with Sand and Gravel Beach, wide > 3 62 3%
Sensitvity Rating
High sensitivity 1,634 79%
Very high sensitivity 431 21%
SLR Focus Area # 14 - Dallas Road
Focus Area # 14 - Dallas Rd Page 29
Page 84
Land Valuation
Category of Land Total Land Value
Total Improve'ts
Value Total
Residential $12,127,760 $4,513,012 $16,640,773
Civic, Institutional and Recreational $4,861,478 $274 $4,861,752
Roads
Road Category Length (m) Unit cost Valuation
Subclass-arterial minor Lane-2 596 1190 $709,310
Subclass-local Lane 1 191 620 $118,521
Subclass-Local Lane-2 161 770 $124,084
Major Transmission and Pipelines
No major assets identified
Key Assets
[valuation given for selected public assets; see main report for basis for valuation]
Asset Name Valuation where available
Dallas Road (key road route) and seawall -
Ross Bay cemetery -
Memorial Pump Station (Sewage) 300,000$
Focus Area # 14 - Dallas Rd Page 30
Page 85
Actual Land Use
Actual Land Use Category Area (sq-m) % of total
SINGLE FAMILY DWELLING 160,287 51%
CIVIC, INSTITUTIONAL & RECREATIONAL - VACANT 35,581 11%
MARINE FACILITIES - MARINA 30,824 10%
No JUROL identified; land use is unknown 17,143 5%
SINGLE FAMILY DWELLING WITH BASEMENT SUITE 16,825 5%
PARKS & PLAYING FIELDS 14,990 5%MARINE & NAVIGATIONAL FACILITIES (INCLUDES FERRY
LANDINGS, BREAKWATERS, BOAT RAMPS, LIGHTHOUSES,
FORESHORE FACILITIES, ETC). 10,338 3%
MULTI-FAMILY - APARTMENT BLOCK 6,296 2%
DUPLEX 5,748 2%GOVERNMENT BUILDINGS (INCLUDES COURTHOUSE, POST
OFFICE, MUNICIPAL HALL, FIRE HALL, POLICE STATIONS,
ETC). (EXCLUDES TYPICAL OFFICE BUILDINGS; REFER TO
COMMERCIAL SECTIONS). 4,675 1%
STORE(S) AND LIVING QUARTERS 3,931 1%
MULTI-FAMILY - HIGH-RISE 2,666 1%
DUPLEX - UP & DOWN 1,589 1%
BED & BREAKFAST OPERATION 4 OR MORE UNITS 1,351 0%SCHOOLS & UNIVERSITIES, COLLEGE OR TECHNICAL
SCHOOLS (INCLUDES PRIVATE KINDERGARTENS). 1,336 0%
MULTI-FAMILY - MINIMAL COMMERCIAL 1,177 0%
MULTI-FAMILY - CONVERSION 754 0%
TRIPLEX 580 0%
STORE(S) AND SERVICE - COMMERCIAL 515 0%
Zoning
Zoning Category Area (sq-m) % of total
RS5 240,501 42%
P4 146,432 26%
P1 82,026 14%
CS2 34,765 6%
RS4 15,795 3%
RM3 14,762 3%
RM4 13,423 2%
C2 12,300 2%
RM8 4,877 1%
P2 2,074 0%
C1 1,731 0%
RM2 904 0%
SLR Focus Area # 15 - Oak Bay Windsor Park Area
Focus Area # 15 - Oak Bay Page 31
Page 86
First Nation Reserves
Reserve name (First Nation) Area (sq-m)
None identified
Physical Shoreline
Physical Shoreline Category Length (m) % of total
Shoreline Type
Man made, permeable 557 26%
Sand and Gravel Flat or Fan, wide > 30m 511 24%
Sand and Gravel Beach, narrow < 30m 347 16%
Rock Ramp with Sand and Gravel Beach, narrow < 30m 331 15%
Rock Ramp with Gravel Beach, narrow < 30m 219 10%
Rock Ramp, narrow < 30m 98 5%
Man made impermeable 92 4%
Sensitivity Rating
High sensitivity 1,424 66%
Very high sensitivity 639 30%
Moderate sensitivity 92 4%
Land Valuation
Category of Land Total Land Value
Total Improve'ts
Value Total
Residential $217,274,200 $81,915,177 $299,189,377
Commercial $13,216,215 $6,059,947 $19,276,162
Civic, Institutional and Recreational $9,504,596 $1,079,701 $10,584,297
Transportation, Communication and Utility $277,521 $747,488 $1,025,009
Roads
Road Category Length (m) Unit cost Valuation
Subclass-Local Lane-2 3,434 770 $2,644,059
Subclass-Collector Minor Lane-2 1,452 870 $1,263,269
Subclass-arterial minor Lane-2 659 1190 $783,868
Major Transmission and Pipelines
No major assets identified
Focus Area # 15 - Oak Bay Page 32
Page 87
Key Assets
[valuation given for selected public assets; see main report for basis for valuation]
Asset Name Valuation where available
East-west road routes that connect to residential areas and golf course
Windsor Park
St Christopher’s school
Currie Lift Station Pump Station (Sewage) 662,800$
Focus Area # 15 - Oak Bay Page 33
Page 88
Actual Land Use
Actual Land Use Category Area (sq-m) % of total
SINGLE FAMILY DWELLING 60,671 46%
PARKS & PLAYING FIELDS 24,457 19%GOVERNMENT BUILDINGS (INCLUDES COURTHOUSE, POST
OFFICE, MUNICIPAL HALL, FIRE HALL, POLICE STATIONS,
ETC). (EXCLUDES TYPICAL OFFICE BUILDINGS; REFER TO
COMMERCIAL SECTIONS). 16,352 12%
CIVIC, INSTITUTIONAL & RECREATIONAL - VACANT 11,509 9%
SINGLE FAMILY DWELLING WITH BASEMENT SUITE 7,392 6%
NO JUROL IDENTIFIER; LAND USE UNKNOWN 4,822 4%
VACANT RESIDENTIAL LESS THAN 2 ACRES 4,390 3%
DUPLEX 1,276 1%
BED & BREAKFAST OPERATION LESS THAN 4 UNITS 248 0%
STRATA-LOT RESIDENCE (CONDOMINIUM) 13 0%
VACANT 8 0%
MULTI-FAMILY - CONVERSION 7 0%
ROW HOUSING - SINGLE UNIT OWNERSHIP 6 0%
Zoning
Zoning Category Area (sq-m) % of total
RS-10 62,379 36%
P-4 58,519 34%
P-1 27,323 16%
RS-12A 18,592 11%
RD-1 1,892 1%
P-2 1,442 1%
C-2 650 0%
RS-8 456 0%
RS-16 159 0%
RS-6 85 0%
RT-3 0 0%
First Nation Reserves
Reserve name (First Nation) Area (sq-m)
None identified
SLR Focus Area # 16 - Cadboro Bay
Focus Area # 16 - Cadboro Bay Page 34
Page 89
Physical Shoreline
Physical Shoreline Category Length (m) % of total
Shoreline Type
Sand Flat, wide > 30m 1,402 90%
Rock Ramp with Sand Beach, wide > 30m 159 10%
Sensitivity Rating
Very high sensitivity 1,402 90%
High sensitivity 159 10%
Land Valuation
Category of Land Total Land Value
Total Improve'ts
Value Total
Residential $44,884,263 $13,876,980 $58,761,243
Civic, Institutional and Recreational $6,050,999 $2,942,000 $8,992,999
Commercial $756,625 $130,653 $887,278
Roads
Road Category Total Length Unit cost Valuation
Subclass-Local Lane-2 655 770 $504,104
Subclass-Collector Major Lane-2 93 870 $80,987
Major Transmission and Pipelines
No major assets identified
Key Assets
[valuation given for selected public assets; see main report for basis for valuation]
Asset Name Valuation where available
Gyro beach and park (valuation for washrooms only) 251,000$
Penhryn Lift Station and Booster Pump Station (Sewage) 3,206,900$
Focus Area # 16 - Cadboro Bay Page 35
Page 90
Actual Land Use
Actual Land Use Category Area (sq-m) % of total
CIVIC, INSTITUTIONAL & RECREATIONAL - VACANT 514,491 40%
NO JUROL IDENTIFIER; LAND USE UNKNOWN 465,656 36%
VACANT 79,773 6%
OTHER 58,518 4%
VEGETABLE & TRUCK 48,684 4%
VEGETABLE & TRUCK - VACANT 46,934 4%
2 ACRES OR MORE - SINGLE FAMILY DWELLING, DUPLEX 22,494 2%
SINGLE FAMILY DWELLING 17,438 1%
INDUSTRIAL - VACANT 14,523 1%
MISCELLANEOUS (FOREST AND ALLIED INDUSTRY) 14,523 1%
PARKS & PLAYING FIELDS 12,876 1%
TELEPHONE 3,096 0%
VACANT RESIDENTIAL LESS THAN 2 ACRES 1,666 0%
SINGLE FAMILY DWELLING WITH BASEMENT SUITE 1,114 0%
Zoning
Zoning Category Area (sq-m) % of total
W1 689,175 45%
P2 552,620 36%
A1 259,108 17%
RE2 18,284 1%
RE5 16,763 1%
First Nation Reserves
Reserve name (First Nation) Area (sq-m)
East Saanich First Nation Reserve No. 2 458,553
Physical Shoreline
Physical Shoreline Category Length (m) % of total
Shoreline Type
Sand and Gravel Flat or Fan, wide > 30m 2,960 33%
Estuary (Organics/Fines) 2,753 31%
Sand Flat, wide > 30m 2,177 24%
Sand and Gravel Beach, narrow < 30m 961 11%
Rock Platform with Sand and Gravel Beach, wide > 3
102 1%
Rock Ramp with Sand and Gravel Beach, narrow < 30m 58 1%
Sensitivity Rating
Very high sensitivity 8,459 94%
High sensitivity 553 6%
SLR Focus Area # 17 - Island View Park
Focus Area # 17 - Island View Page 36
Page 91
Land Valuation
Category of Land Total Land Value
Total Improve'ts
Value Total
Civic, Institutional and Recreational $17,847,127 $37,500 $17,884,627
Residential $6,160,559 $3,284,218 $9,444,777
Commercial $1,899,960 $0 $1,899,960
Farm $24,780 $246,525 $271,305
Industrial $4,757 $0 $4,757
Transportation, Communication and Utility $1,253 $0 $1,253
Forest and Allied Industry $386 $0 $386
Roads
Road Category Length (m) Unit cost Valuation
Subclass-Local Lane-2 1,798 770 $1,384,647
Major Transmission and Pipelines
Major electric transmission line of 371m length
Key Assets
[valuation given for selected public assets; see main report for basis for valuation]
Asset Name Valuation where available
Regional park
Island view campground (value for toilet and kiosk only) 43,929$
Tsawout Pollution Control Centre (Sewage)
Focus Area # 17 - Island View Page 37
Page 92
Actual Land Use
Actual Land Use Category Area (sq-m) % of total
AIRPORTS, HELIPORTS, ETC. 137,289 63%
NO JUROL IDENTIFIER; LAND USE UNKNOWN 49,617 23%
CIVIC, INSTITUTIONAL & RECREATIONAL - VACANT 20,221 9%
GOVERNMENT RESEARCH CENTRES (INCLUDES NURSERIES &
FISH HATCHERIES). 11,899 5%
Zoning
Zoning Category Area (sq-m) % of total
P-3 135,510 61%
AP-1 49,858 23%
M-6 25,061 11%
P-1 8,806 4%
P-4 1,622 1%
First Nation Reserves
Reserve name (First Nation) Area (sq-m)
None identified
Physical Shoreline
Physical Shoreline Category Length (m) % of total
Shoreline Type
Man made, permeable 674 58%
Sand Flat, wide > 30m 445 39%
Rock Platform with Sand and Gravel Beach, wide > 3 34 3%
Sensitivity Rating
Very high sensitivity 904 78%
High sensitivity 249 22%
Land Valuation
Category of Land Total Land Value
Total Improve'ts
Value Total
Civic, Institutional and Recreational $1,285,301 $4,159,603 $5,444,904
Transportation, Communication and Utility $359,741 $38,108 $397,850
SLR Focus Area # 18 - Patricia Bay
Focus Area # 18 - Pat Bay Page 38
Page 93
Roads
Road Category Length (m) Unit cost Valuation
Subclass-Local Lane-2 144 770 $110,562
Major Transmission and Pipelines
No major assets identified
Key Assets
[valuation given for selected public assets]
Asset Name Valuation where available
Float plane terminal
Institute of Ocean Sciences Pump Station (Sewage)
Focus Area # 18 - Pat Bay Page 39
Page 94
Actual Land Use
Actual Land Use Category Area (sq-m) % of total
SINGLE FAMILY DWELLING 46,723 29%
CIVIC, INSTITUTIONAL & RECREATIONAL - VACANT 37,566 23%MARINE & NAVIGATIONAL FACILITIES (INCLUDES FERRY
LANDINGS, BREAKWATERS, BOAT RAMPS, LIGHTHOUSES,
FORESHORE FACILITIES, ETC). 26,965 17%
STORE(S) AND OFFICES 18,961 12%
GARBAGE DUMPS, SANITARY FILLS, SEWER LAGOONS, ETC. 7,804 5%
DUPLEX - SINGLE UNIT OWNERSHIP 5,223 3%
STRATA-LOT RESIDENCE (CONDOMINIUM) 5,125 3%
SINGLE FAMILY DWELLING WITH BASEMENT SUITE 3,351 2%
MOTEL & AUTO COURT 2,861 2%
ROW HOUSING - SINGLE UNIT OWNERSHIP 2,163 1%
NO JUROL IDENTIFIER; LAND USE UNKNOWN 1,233 1%
DUPLEX 1,100 1%
BED & BREAKFAST OPERATION LESS THAN 4 UNITS 962 1%
MULTI-FAMILY - CONVERSION 384 0%
VACANT RESIDENTIAL LESS THAN 2 ACRES 338 0%
VACANT 258 0%
CHURCHES & BIBLE SCHOOLS 191 0%
PARKS & PLAYING FIELDS 37 0%
Zoning
Zoning Category Area (sq-m) % of total
R1.2 71,874 30%
P1 60,455 25%
U2 32,068 13%
W3 15,509 6%
R1.1 14,693 6%
R2 8,670 4%
RM5.2 8,254 3%
C5.2 5,994 2%
U1 5,821 2%
U3 5,077 2%
RM4 4,590 2%
CD 3,642 2%
RM1.2 3,338 1%
I2 425 0%
SLR Focus Area # 19 - South Sidney
Focus Area # 19 - South Sidney Page 40
Page 95
First Nation Reserves
Reserve name (First Nation) Area (sq-m)
None identified
Physical Shoreline
Physical Shoreline Category Length (m) % of total
Shoreline Type
Man made, permeable 1,058 61%
Man made impermeable 460 26%
Sand and Gravel Flat or Fan, wide > 30m 220 13%
Sensitivity Rating
High sensitivity 1,518 87%
Very high sensitivity 220 13%
Land Valuation
Category of Land Total Land Value
Total Improve'ts
Value Total
Residential $48,498,382 $20,406,380 $68,904,762
Civic, Institutional and Recreational $9,747,230 $4,306,116 $14,053,346
Transportation, Communication and Utility $7,147,251 $1,064,971 $8,212,222
Commercial $1,981,057 $494,665 $2,475,722
Roads
Road Category Length (m) Unit cost Valuation
Subclass-Local Lane-2 2,739 770 $2,108,806
Subclass-recreation Lane-2 75 770 $57,632
Subclass-collector major Lane-2 665 870 $578,893
Subclass-strata Lane 2 88 770 $67,378
Major Transmission and Pipelines
No major assets identified
Key Assets
[valuation given for selected public assets; see main report for basis for valuation]
Asset Name Valuation where available
Sidney to Anacortes Ferry Terminal
Sidney Pump Station (Sewage) $3,952,800
Focus Area # 19 - South Sidney Page 41
Page 96
Actual Land Use
Actual Land Use Category Area (sq-m) % of total
CIVIC, INSTITUTIONAL & RECREATIONAL - VACANT 21,248 23%
MARINE FACILITIES - MARINA 19,701 21%
ROW HOUSING - SINGLE UNIT OWNERSHIP 17,140 18%
STRATA-LOT RESIDENCE (CONDOMINIUM) 10,344 11%
SINGLE FAMILY DWELLING 7,689 8%
SINGLE FAMILY DWELLING WITH BASEMENT SUITE 6,102 6%
NO JUROL IDENTIFIER; LAND USE UNKNOWN 5,419 6%
DUPLEX - SINGLE UNIT OWNERSHIP 2,176 2%
PARKS & PLAYING FIELDS 1,676 2%
STORE(S) AND LIVING QUARTERS 1,526 2%
SHIPYARDS 599 1%
OFFICE BUILDING (PRIMARY USE) 442 0%
Zoning
Zoning Category Area (sq-m) % of total
W3 193,907 42%
W1 168,691 37%
P1 23,588 5%
R2 18,710 4%
RM3 17,116 4%
RM5.2 16,278 4%
W2 12,767 3%
M-6 4,127 1%
R1.1 1,157 0%
C5 389 0%
First Nation Reserves
Reserve name (First Nation) Area (sq-m)
None identified
SLR Focus Area # 20 - Tsehum Harbour Sidney
Focus Area # 20 - Tsehum Sidney Page 42
Page 97
Physical Shoreline
Physical Shoreline Category Length (m) % of total
Shoreline Type
Sand Flat, wide > 30m 795 27%
Man made impermeable 633 21%
Man made, permeable 536 18%
Rock Ramp, narrow < 30m 241 8%
Rock Ramp with Sand and Gravel Beach, narrow < 30m 217 7%
Sand and Gravel Beach, narrow < 30m 155 5%
Rock Ramp with Sand and Gravel Beach, wide > 30m 146 5%
Rock Cliff with Sand and Gravel Beach, narrow < 30 126 4%
Rock Platform with Sand and Gravel Beach, wide > 3 98 3%
Sensitivity Rating
High sensitivity 1,707 58%
Very high sensitivity 1,240 42%
Land Valuation
Category of Land Total Land Value
Total Improve'ts
Value Total
Residential $34,262,731 $17,781,588 $52,044,319
Commercial $13,793,916 $5,331,022 $19,124,937
Civic, Institutional and Recreational $5,040,067 $10,315 $5,050,382
Industrial $389,903 $220,342 $610,245
Unclassified $1 $0 $1
Roads
Road Category Length (m) Unit cost Valuation
Subclass-strata Lane 2 574 770 $442,360
Subclass-Local Lane-2 533 770 $410,754
Subclass-collector minor Lane-2 355 870 $308,719
Major Transmission and Pipelines
No major assets identified
Key Assets
[valuation given for selected public assets]
Asset Name Valuation where available
Large marina facilities
Harbour Pump Station (Sewage)
Focus Area # 20 - Tsehum Sidney Page 43
Page 98
Actual Land Use
Actual Land Use Category Area (sq-m) % of total
SINGLE FAMILY DWELLING 99,006 40%
MARINE FACILITIES - MARINA 85,160 34%
CIVIC, INSTITUTIONAL & RECREATIONAL - VACANT 21,439 9%
MULTI-FAMILY - GARDEN APARTMENT & ROW HOUSING 14,128 6%
VACANT RESIDENTIAL LESS THAN 2 ACRES 8,283 3%MARINE & NAVIGATIONAL FACILITIES (INCLUDES FERRY
LANDINGS, BREAKWATERS, BOAT RAMPS, LIGHTHOUSES,
FORESHORE FACILITIES, ETC). 5,259 2%
RESIDENTIAL OUTBUILDING ONLY 4,697 2%
SINGLE FAMILY DWELLING WITH BASEMENT SUITE 4,145 2%
No JUROL identified; land use is unknown 2,675 1%
ROW HOUSING - SINGLE UNIT OWNERSHIP 2,482 1%
STRATA-LOT RESIDENCE (CONDOMINIUM) 1,213 0%
SCHOOLS & UNIVERSITIES, COLLEGE OR TECHNICAL
SCHOOLS (INCLUDES PRIVATE KINDERGARTENS). 337 0%
2 ACRES OR MORE - SINGLE FAMILY DWELLING, DUPLEX 125 0%
Zoning
Zoning Category Area (sq-m) % of total
M-6 545,843 60%
M-3 119,128 13%
R-2 117,559 13%
M-4 50,275 6%
M-2 40,143 4%
P-4 16,726 2%
RM-2 14,128 2%
P-1 1,274 0%
M-5 688 0%
First Nation Reserves
Reserve name (First Nation) Area (sq-m)
None identified
SLR Focus Area # 21 - Tsehum Harbour N Saanich
Focus Area # 21 - Tsehum N Saan Page 44
Page 99
Physical Shoreline
Physical Shoreline Category Length (m) % of total
Shoreline Type
Mud Flat, wide > 30m 3,211 40%
Sand Flat, wide > 30m 1,652 20%
Man made impermeable 893 11%
Man made, permeable 601 7%
Rock Ramp, narrow < 30m 463 6%
Rock Platform with Sand Beach, wide > 30m 433 5%
Rock Ramp with Sand and Gravel Beach, narrow < 30m 405 5%
Rock Ramp with Sand and Gravel Beach, wide > 30m 233 3%
Rock Platform with Sand and Gravel Beach, wide > 3 80 1%
Rock Cliff, narrow < 30m 80 1%
Sand Beach, narrow < 30m 77 1%
Sensitivity Rating
Very high sensitivity 5,768 71%
High sensitivity 2,361 29%
Land Valuation
Category of Land Total Land Value
Total Improve'ts
Value Total
Residential $36,386,822 $23,118,092 $59,504,913
Commercial $24,805,685 $9,161,787 $33,967,472
Civic, Institutional and Recreational $1,284,227 $167,459 $1,451,686
Transportation, Communication and Utility $504,000 $0 $504,000
Roads
Road Category Length (m) Unit cost Valuation
Subclass-Local Lane-2 1,153 770 $888,023
Subclass-collector minor Lane-2 264 870 $229,925
Subclass-strata Lane 2 140 770 $107,571
Major Transmission and Pipelines
No major assets identified
Key Assets
[valuation given for selected public assets]
Asset Name Valuation where available
Large marina facilities
Focus Area # 21 - Tsehum N Saan Page 45
Page 100
Actual Land Use
Actual Land Use Category Area (sq-m) % of total
2 ACRES OR MORE - SINGLE FAMILY DWELLING, DUPLEX 19,769 23%
DOCKS & WHARVES 15,566 18%MARINE & NAVIGATIONAL FACILITIES (INCLUDES FERRY
LANDINGS, BREAKWATERS, BOAT RAMPS, LIGHTHOUSES,
FORESHORE FACILITIES, ETC). 13,224 16%
MIXED 9,684 11%
2 ACRES OR MORE - SEASONAL DWELLING 8,048 9%
MOTEL & AUTO COURT 7,162 8%
CIVIC, INSTITUTIONAL & RECREATIONAL - VACANT 2,819 3%
SINGLE FAMILY DWELLING 2,147 3%
MARINE FACILITIES - MARINA 1,637 2%
MIXED - VACANT 1,379 2%
NO JUROL IDENTIFIER; LAND USE UNKNOWN 1,072 1%
RESTAURANT ONLY 590 1%
CHURCHES & BIBLE SCHOOLS 467 1%
INDUSTRIAL - VACANT 452 1%
SEASONAL DWELLING 316 0%
VACANT RESIDENTIAL LESS THAN 2 ACRES 291 0%
STORE(S) AND LIVING QUARTERS 287 0%
RESIDENTIAL OUTBUILDING ONLY 184 0%
TELEPHONE 126 0%
STORE(S) AND SERVICE - COMMERCIAL 27 0%
Zoning
Zoning Category Area (sq-m) % of total
No Municipal Zoning data for this Focus Area
First Nation Reserves
Reserve name (First Nation) Area (sq-m)
None identified
SLR Focus Area # 22 Fulford Harbour
Focus Area # 22 - Fulford Page 46
Page 101
Physical Shoreline
Physical Shoreline Category Length (m) % of total
Shoreline Type
Sand and Gravel Flat or Fan, wide > 30m 825 46%
Rock Cliff with Sand and Gravel Beach, narrow < 30 523 29%
Man made, permeable 270 15%
Rock Ramp with Sand and Gravel Beach, wide > 30m 58 3%
Rock Cliff, narrow < 30m 47 3%
Rock Platform with Sand and Gravel Beach, wide > 3 36 2%
Sand and Gravel Beach, narrow < 30m 24 1%
Sensitivity Rating
High sensitivity 1,136 64%
Low sensitivity 565 32%
Moderate sensitivity 82 5%
Land Valuation
Category of Land Total Land Value
Total Improve'ts
Value Total
Commercial $1,483,232 $1,296,204 $2,779,436
Residential $1,146,810 $372,054 $1,518,864
Transportation, Communication and Utility $1,101,048 $410,198 $1,511,246
Industrial $308,338 $57,692 $366,029
Farm $12,693 $99,520 $112,213
Civic, Institutional and Recreational $67,307 $700 $68,007
Roads
Road Category Length (m) Unit cost Valuation
Subclass-Local Lane-2 127 770 $97,882
Subclass-collector minor Lane-2 310 870 $269,844
Subclass-ferry Lane-2 225 1190 $268,097
Major Transmission and Pipelines
No major assets identified
Key Assets
[valuation given for selected public assets]
Asset Name Valuation where available
Main road to / from Fulford Harbour
Fulford marina and ferry terminal
Fulford-Ganges Rd Bridge
Focus Area # 22 - Fulford Page 47
Page 102
Actual Land Use
Actual Land Use Category Area (sq-m) % of total
NO JUROL IDENTIFIER; LAND USE UNKNOWN 69,957 41%
DOCKS & WHARVES 42,761 25%
CIVIC, INSTITUTIONAL & RECREATIONAL - VACANT 19,066 11%
STORE(S) AND SERVICE - COMMERCIAL 14,400 8%
STORE(S) AND OFFICES 6,347 4%
MARINE FACILITIES - MARINA 4,095 2%
VACANT RESIDENTIAL LESS THAN 2 ACRES 3,205 2%
Code 300 (not defined by BC Assessment) 1,985 1%
RESIDENTIAL OUTBUILDING ONLY 1,823 1%
VACANT 1,573 1%
BED & BREAKFAST OPERATION 4 OR MORE UNITS 1,439 1%GOVERNMENT BUILDINGS (INCLUDES COURTHOUSE, POST
OFFICE, MUNICIPAL HALL, FIRE HALL, POLICE STATIONS,
ETC). (EXCLUDES TYPICAL OFFICE BUILDINGS; REFER TO
COMMERCIAL SECTIONS). 1,287 1%
SINGLE FAMILY DWELLING 1,167 1%
STORE(S) AND LIVING QUARTERS 804 0%
BANK 792 0%
SEASONAL DWELLING 620 0%
2 ACRES OR MORE - SINGLE FAMILY DWELLING, DUPLEX 283 0%
SERVICE STATION 265 0%
ROW HOUSING - SINGLE UNIT OWNERSHIP 108 0%
SINGLE FAMILY DWELLING WITH BASEMENT SUITE 96 0%
STORAGE & WAREHOUSING - CLOSED 8 0%
Zoning
Zoning Category Area (sq-m) % of total
No Municipal Zoning data for this Focus Area
First Nation Reserves
Reserve name (First Nation) Area (sq-m)
None identified
SLR Focus Area # 23 - Central Ganges
Focus Area # 23 - Ganges Page 48
Page 103
Physical Shoreline
Physical Shoreline Category Length (m) % of total
Shoreline Type
Man made impermeable 892 33%
Man made, permeable 543 20%
Rock Ramp, narrow < 30m 392 14%
Rock Ramp with Sand and Gravel Beach, narrow < 30m 278 10%
Rock Platform with Sand and Gravel Beach, wide > 3 222 8%
Sand and Gravel Beach, narrow < 30m 201 7%
Sand and Gravel Flat or Fan, wide > 30m 105 4%
Sand Flat, wide > 30m 85 3%
Sensitivity Rating
Very high sensitivity 1,333 49%
High sensitivity 927 34%
Moderate sensitivity 457 17%
Land Valuation
Category of Land Total Land Value
Total Improve'ts
Value Total
Commercial $9,619,565 $13,110,649 $22,730,214
Civic, Institutional and Recreational $2,294,376 $3,476,728 $5,771,105
Residential $1,688,764 $443,717 $2,132,481
Industrial $302,016 $148,845 $450,861
Unclassified $2 $0 $2
Roads
Road Category Length (m) Unit cost Valuation
Subclass-Local Lane-2 257 770 $97,882
Subclass-collector minor Lane-2 121 870 $269,844
Subclass-strata Lane 2 51 1 $225
Major Transmission and Pipelines
No major assets identified
Key Assets
[valuation given for selected public assets; see main report for basis for valuation]
Asset Name Valuation where available
Fire hall
Library $6,200,000
Main road to / from Ganges
Manson Road Pump Station (Sewage) $154,400
Focus Area # 23 - Ganges Page 49
Page 104
Actual Land Use
Actual Land Use Category Area (sq-m) % of total
ELECTRICAL POWER SYSTEMS (INCLUDING NON-UTILITY
COMPANIES) 41,836 27%
SEASONAL DWELLING 25,311 17%
TELEPHONE 18,374 12%
2 ACRES OR MORE - SINGLE FAMILY DWELLING, DUPLEX 17,143 11%
VACANT RESIDENTIAL LESS THAN 2 ACRES 14,340 9%
RESIDENTIAL OUTBUILDING ONLY 9,507 6%
SINGLE FAMILY DWELLING 7,278 5%
2 ACRES OR MORE - VACANT 6,182 4%
DOCKS & WHARVES 5,216 3%
CIVIC, INSTITUTIONAL & RECREATIONAL - VACANT 3,911 3%
NO JUROL IDENTIFIER; LAND USE UNKNOWN 1,675 1%
LOGGING OPERATIONS 1,256 1%
2 ACRES OR MORE - SEASONAL DWELLING 354 0%
2 ACRES OR MORE - MANUFACTURED HOME 53 0%
Zoning
Zoning Category Area (sq-m) % of total
No Municipal Zoning data for this Focus Area
First Nation Reserves
Reserve name (First Nation) Area (sq-m)
None identified
Physical Shoreline
Physical Shoreline Category Length (m) % of total
Shoreline Type
Rock Ramp, wide > 30m 1,167 19%
Rock Platform, wide > 30m 1,164 19%
Rock Ramp with Sand Beach, narrow < 30m 886 15%
Rock Cliff, narrow < 30m 752 12%
Sand Flat, wide > 30m 511 8%
Gravel Beach, narrow < 30m 383 6%
Sand and Gravel Beach, narrow < 30m 309 5%
Rock Ramp, narrow < 30m 302 5%
Sand and Gravel Flat or Fan, wide > 30m 298 5%
Rock Ramp with Sand Beach, wide > 30m 187 3%
Man made, permeable 136 2%
Sensitivity Rating
High sensitivity 3,593 59%
Moderate sensitivity 1,410 23%
Low sensitivity 579 10%
Very high sensitivity 511 8%
SLR Focus Area # 24 - Galliano Island
Focus Area # 24 - Galliano Page 50
Page 105
Land Valuation
Category of Land Total Land Value
Total Improve'ts
Value Total
Residential $5,784,325 $2,112,262 $7,896,587
Industrial $59,955 $40,693 $100,648
Transportation, Communication and Utility $56,788 $0 $56,788
Civic, Institutional and Recreational $22,088 $0 $22,088
Roads
Road Category Length (m) Unit cost Valuation
Subclass-Local Lane-2 184 770 $97,882
Major Transmission and Pipelines
No major assets identified
Key Assets
[valuation given for selected public assets]
Asset Name Valuation where available
No Key Assets identified. This area was included as a
Focus Area as representative of shoreline residential
for Southern Gulf Islands Electoral Area
Focus Area # 24 - Galliano Page 51
Page 106
AECOM Capital Regional District Coastal Sea Level Rise Risk Assessment
RPT-2015-01-26-CRD Coastal SLR Risk Assessment-60310678 FINAL.Docx Page 1
Appendix C Methods for service disruption case studies
1. Transportation Disruption Case Study - Method
1.1 Commute Costs
The Commute Costs metric is defined as the daily cost of lost time per worker resulting from longer commutes.
These costs may be borne by workers in the form of lost personal time or by firms in the form of lower productivity.
The Commute Costs metric is calculated according to the following steps:
1. Vehicle Trips Per Day: The number of vehicles traveling the Focus Area per day is derived from BC Ministry
of Transportation traffic data.
2. Travel Time Increase: A typical increase in travel time per trip that would result from temporary disruption is
estimated. AECOM used travel time data from Google Maps to estimate the net increase in travel time
required to reach Victoria by an alternate route from various points along Highway 14, north of the focus
area (Shirley, Jordan River, and Port Renfrew). The assumed additional travel time required per trip is an
average of these time estimates, weighted by the share of the population that lives in each of these
communities, according to Census and CRD population estimates.
3. Increase in Commute Hours: The number of vehicle trips per day is multiplied by the additional travel time
per trip to determine the total increase in commute hours per day resulting from the transportation disruption.
4. Daily Cost of Transportation Disruption: The Increase in Commute Hours output is multiplied by the average
value of a person’s time (assumed to be the average hourly wage in British Columbia) to yield the daily cost
of the disruption.
5. Winter Impact: AECOM did not have access to data regarding the seasonality of traffic in the Focus Area.
Therefore, winter impacts were not calculated for this indicator.
Table C1 summarizes the results of the commute costs calculation and the primary data sources.
Table C1 - Commute Costs Calculator
Commute impact
area
# of passenger
vehicles per day
Additional travel
time per trip
(hours)
Average value of a
worker’s time per
hour
Cost of disruption
/ day
Highway 14, south
of Shirley 1,348 1.6 $24.47 $52,776
Source:
BC Ministry of
Infrastructure and
Transportation 2012
AECOM Estimate,
Google Maps
Statistics Canada
2014
Page 107
AECOM Capital Regional District Coastal Sea Level Rise Risk Assessment
RPT-2015-01-26-CRD Coastal SLR Risk Assessment-60310678 FINAL.Docx Page 2
1.2 Private Transit Costs
The Private Transit Costs metric is defined as the daily cost of lost business revenue from service disruption borne
by private transportation companies – in this case, the West Coast Trail Express, a shuttle bus service that runs from
Victoria to the trailheads of the West Coast Trail6. The Private Transit Costs metric is calculated according to the
following steps:
1. Number of Daily Passengers: The number of daily passengers was determined from a direct interview with
the transit company. In this case, the West Coast Trail Express representative provided an estimate of
annual passenger volume, which was converted to a daily figure. Note that the daily estimate is an average
of the entire year, not only the months when the shuttle is in operation.
2. Transit Revenues: Passenger ticket costs are presumed to be the sole source of revenue, and are drawn
from the West Coast Trail Express website. Full price, no-discount ticket prices are assumed.
3. Average Daily Cost of Service Disruptions: The business’ estimate of average daily passengers is multiplied
by the price per ticket to yield the average daily cost of service disruption on private transit revenue.
4. Winter Impact: The West Coast Trail Express only runs during the summer months. The winter daily impact
is therefore zero.
Table C2 below, summarizes the results of the private transit costs calculation and the primary data sources.
Table C2 - Private Transit Costs Calculator
Private Transit impact Average daily
passengers
Price per passenger
ticket Cost of disruption / day
West Coast Trail Express
(year round average) 10 $95 $950
West Coast Trail Express
(winter) 0 $95 $0
Source: West Coast Trail Express
2014a
West Coast Trail Express
2014b
1.3 Emergency Services Costs
The Emergency Services Costs metric is defined as the daily cost of providing alternative emergency services to
areas that are temporarily inaccessible by road. This metric relies on the assumption that emergency responders will
reach residents of the focus area by airplane or helicopter during a storm event instead of by less expensive road
transport. The Emergency Services Cost metric is calculated according to the following steps:
1. Number of Daily Emergency Response Events: The number of emergency response events per day in
communities northwest of the Focus Area is determined by multiplying the daily number of emergency
events per capita (as reported by BC Ambulance Services) by the population of communities impacted by
the highway disruption. For purposes of this case study, impacted communities are defined as those
communities immediately north of the Focus Area situated along Highway 14 whose route to Victoria would
significantly change due to inundation of the Focus Area.
6 For analysis of public transit costs in Focus Areas where public transportation is more prevalent, a similar calculation can determine the
cost of service disruption to public transportation agencies.
Page 108
AECOM Capital Regional District Coastal Sea Level Rise Risk Assessment
RPT-2015-01-26-CRD Coastal SLR Risk Assessment-60310678 FINAL.Docx Page 3
2. Increase in Cost for Emergency Response: The increase in costs per emergency event for ground versus air
services is determined by taking the difference between the unsubsidized fee for BC Ambulance emergency
response by road and the average of helicopter and airplane response fees.7
3. Daily Cost to Provide Alternative Emergency Services: The number of emergency events per day in the
focus area multiplied by the increase in costs per emergency for air response represents the daily cost to
provide alternative emergency services.
4. Winter Impacts: Winter-only impacts were not calculated for this indicator.
Table C3 below, summarizes the results of alternative emergency services costs calculation and the primary data
sources.
Table C3 - Emergency Services Costs Calculator
Alternative Emergency
Services impact
Number of emergency
response events per day
Additional cost per
emergency event (air
vs. ground service)
Cost of disruption
/ day
Service to Highway 14
communities, Shirley –
Port Renfrew
0.25 $1,193 $298
Source:
AECOM analysis of BCAS
Annual Report 2009 and CRD
Population Estimates 2013
AECOM analysis of
BCAS Fee Schedule
2014
1.4 Tourism Costs
The Tourism Costs metric is defined as the daily costs of lost tourism spending caused by service disruption.
Highway 14 is the primary thoroughfare from Victoria to reach popular tourist destinations such as the West Coast
Trail and the Juan de Fuca Trail. This metric assumes that disruption of Highway 14 would deter tourists from
traveling to destinations north of the Focus Area. The Tourism Costs metric is calculated according to the following
steps:
1. Average Daily Visitors: Total average daily visitors to provincial and national parks north of the study area
(i.e., from Shirley to the West Coast Trail) is determined using BC Provincial Parks and Pacific Rim Park
data.
2. Average Tourist Spending per Visit: Average tourist spending per visit is drawn from prior economic studies
of the parks and weighted according to the share of daily visitors who go to the provincial and national parks,
respectively. The Bank of Canada’s inflation calculator is used to adjust tourism spending figures to current
prices.
3. Lost Tourism Spending: The number of daily visitors is multiplied by average daily tourist spending to
determine the daily cost of lost tourism spending.
4. Winter Impacts: Winter Impacts exclude visits to the West Coast Trail, which is closed in the winter. Visits to
the provincial parks were assumed to be constant (as seasonal data was not available at the time of the
study).
7 Fees are based on those charged to non-beneficiaries of the BC Medical Services Plan. These fees, according to BC Ambulance
Services, represent the “unsubsidized cost of providing these services.”
Page 109
AECOM Capital Regional District Coastal Sea Level Rise Risk Assessment
RPT-2015-01-26-CRD Coastal SLR Risk Assessment-60310678 FINAL.Docx Page 4
Table C4 below, summarizes the results of the tourism costs calculation and the primary data sources.
Table C4 - Tourism Costs Calculator
Tourism impact Average Daily Visitors Tourist spending per visit Cost of
disruption / day
BC provincial parks 1,188 $27.21 $32,325
West Coast trail 12 $158.88 $1,907
Total impact (year-
round) - - $34,232
Winter scenario
(excludes West Coast
Trail visitors)
$32,325
Source:
BC Provincial Parks 2013;
Pacific Rim Park 2009
BC Ministry of Water, Land and Air
Protection 2001;
Canadian Parks Council 2009
1.5 Fiscal Costs
The Fiscal Costs metric is defined as the daily cost of lost provincial tax revenue resulting from transportation
disruption. The Fiscal Costs metric is dependent on the outcomes of the Tourist Costs and Transit Revenue Costs
metrics. The Fiscal Costs metric is calculated according to the following steps:
1. Reduction in Business Revenue: The Tourist Costs and Transit Costs metrics are summed to arrive at a
total reduction in local business revenue.
2. Reduction in Tax Revenue: The outcome of Reduction in Business Revenue is divided by 1 + goods and
services (GST) and provincial sales (PST) tax rates to derive the pretax value of business sales.8 The
difference between pretax and final sales represents the daily loss in provincial sales tax revenue.9
3. Winter Impacts: The winter impacts calculation excludes sales related to the West Coast Trail, which is
closed during the winter.
Table C5 - Fiscal Impacts Calculator
Fiscal impact Lost tourist and transit
revenue / day Sales tax rate Cost of disruption / day
Sales taxes (year round) $35,087 12% $3,759
Sales taxes (winter) $32,325 12% $3,463
Source: Private Transit and
Tourism indicators BC Government 2014
8 Both prior metrics include sales tax in their outputs.
9 Other data inputs might not require this conversion, in which case business revenue would be multiplied by the sales tax rate to
determine lost sales tax revenue.
Page 110
AECOM Capital Regional District Coastal Sea Level Rise Risk Assessment
RPT-2015-01-26-CRD Coastal SLR Risk Assessment-60310678 FINAL.Docx Page 5
2. Community Disruption Case Study - Method10
2.1 Emergency Services
The Emergency Services Costs metric is defined as the daily cost of providing alternative emergency services to
areas that are temporarily inaccessible by road ambulances. It is calculated in the same way as the Transportation
Case Study’s Emergency Services Metric. The metric is repeated here to illustrate how transportation impacts can
be included among a broader set of community impacts. As described in the Transportation Case Study, the metric
relies on the assumption that emergency responders will reach residents of the Focus Area by airplane or helicopter
in the aftermath of a storm event instead of by less expensive road transport. The Emergency Services Cost metric
is calculated according to the following steps:
1. Emergency Responses Per Day: The number of emergency response events per day in the focus area is
determined by multiplying the daily number of emergency events per capita times the population of the
Focus Area.
2. Emergency Response Cost Increase: The increase in costs per emergency event for ground versus air
services is determined by taking the difference between the unsubsidized fee for emergency response by
ambulance and the average of helicopter and airplane response fees.
3. Increase in Daily Costs to Provide Emergency Response: The number of emergency events per day in the
focus area multiplied by the increase in costs per emergency for air response services represents the daily
cost to provide alternative emergency services.
Table C6 below, summarizes the results of the Emergency Services metric and the primary data sources.
Table C6 - Emergency Services Costs Calculator
Alternative Emergency
Services impact
Number of emergency
response events per day
Additional cost per emergency
event. air vs. ground service
Cost of
disruption / day
Service to Oak Bay /
Windsor Park 0.37 $1,193 $441
Source:
AECOM analysis of BCAS
Annual Report 2009, BC
Census 2011 and GIS
parcel data
AECOM analysis of BCAS Fee
Schedule 2014
2.2 Commute Impacts
The Commute Impacts metric is defined as the daily cost of lost time per worker. As with Emergency Services, the
Commute Impacts metric also appears as a metric in the Transportation Asset case study. As traffic count data were
not available for the Oak Bay Windsor Park Focus Area, the Commute Impacts metric methodology was adjusted.
The metric is thus an example of how methodologies may need to shift when conducting impact assessments in
other Focus Areas. For this Community Impact Case Study, the Commute Costs metric is calculated according to
the following steps:
1. Number of Daily Commuters: The number of daily commuters traveling from the Focus Area per day is
determined by estimating the total number of workers who live in the Focus Area. This calculation is done by
10 Winter-only daily impacts were not calculated for the Community Disruption case study, since indicator outputs are not significantly
dependent on tourism.
Page 111
AECOM Capital Regional District Coastal Sea Level Rise Risk Assessment
RPT-2015-01-26-CRD Coastal SLR Risk Assessment-60310678 FINAL.Docx Page 6
multiplying the region’s ratio of employment to working age population (79%, per Stats Canada 2014a) by an
estimate of the Focus Area’s working age population. The Focus Area population was estimated by
multiplying the number of dwelling units times the number of people per dwelling unit reported by the
Census. The working age population was determined by multiplying this output times the share of working
age adults reported by the Oak Bay District for the neighborhood contained by the Focus Area.
2. Increase in Travel Time per Trip: A typical increase in travel time per trip that would result from road
disruption during a storm event is assumed based on the Focus Area’s characteristics. As the Focus Area is
a relatively dense community close to downtown Victoria, AECOM conservatively assumed a 15 minute
increase in commute times each way as a result of flooded roads. This is an illustrative figure assuming
reduced capacity of existing travel routes, pending a more detailed traffic study.
3. Increase in Commute Hours: The number of daily commuters is multiplied by the additional, round-trip travel
time per day to determine the total increase in commute hours per day of service disruption.
4. Cost of Commute Disruption: The Increase in Commute Hours output is multiplied by the average value of a
person’s time (assumed to be the average hourly wage in British Columbia) to yield the cost of the
disruption.
Table C7 below, summarizes the results of the commute costs calculation and the primary data sources.
Table C7 – Commute Impact Calculator
Commute impact Total workforce living in area
Additional round-
trip travel time
per day (hours)
Average value
of a person’s
time per hour
Cost of
disruption /
day
Oak Bay / Windsor
Park 577 0.5 $24.47 $7,059
Source:
AECOM analysis of GIS parcel
data; Stats Canada 2014a; Oak
Bay District 2010
AECOM Estimate,
Google Maps
Statistics
Canada 2014b
2.3 Electric Utility Impacts
The Electric Utility Impacts metric is unique to the Community Disruption Case Study, and is defined as lost electric
utility revenues per day from the disruption of electricity services, which may result from storm events. The economic
cost is expressed in daily terms, though as more is learned about the likely length of utility disruption, the daily cost
may be adjusted downward by the hours per day that a disruption is expected. Note that this quantitative metric only
considers impacts from lost revenue due to disrupted service residential customers. Costs associated with restoring
lost service are not considered. Disruptions to business customers are described qualitatively due to a lack of
available data.
Table C8 summarizes the results of the utility impacts calculation and the primary data sources.
Page 112
AECOM Capital Regional District Coastal Sea Level Rise Risk Assessment
RPT-2015-01-26-CRD Coastal SLR Risk Assessment-60310678 FINAL.Docx Page 7
Table C8 – Electric Utility Costs Calculator
Residential Utility
Impact
Daily utility spending
per household
Number of homes in
area Cost of disruption / day
Oak Bay / Windsor Park –
loss of residential electric
service
$3.91 634 $2,479
Source: AECOM analysis of BC
Hydro 2013 GIS analysis
2.4 Fiscal Risk
The final quantitative metric of Fiscal Risk is defined as residential property tax revenues at risk of decline in the
event of severe storm events. This metric does not arrive at a daily operational cost and is therefore considered
separately from prior quantitative methods and excluded from the calculation of gross economic impact. The Fiscal
Risk metric assumes that with an increase in storm events, residential property values may decrease in response to
the risk of property damage and/or increases in insurance premiums and reductions in coverage, thus impacting tax
revenues. Tax revenue from other properties (commercial, industrial) and other tax revenues (e.g. school taxes)
have not been included within the scope of this Fiscal Risk metric. Fiscal Risk is calculated according to the following
steps:
1. Residential Property Values: The aggregate value of land and improvements in the Focus Area was
determined through GIS parcel data.
2. Property Tax Value Decline Risk: The aggregate value of residential property is multiplied by the applicable
local property tax rate to derive total property tax revenues at risk of decline.
Table C10 summarizes the results of the fiscal impacts calculation and the primary data sources.
Table C10 – Property Tax Impact Calculator
Fiscal impact
Aggregate value of
residential land and
improvements in focus area
Local residential property
tax rate per dollar of
property values
Annual property tax
revenues at risk
Property taxes – Oak
Bay / Windsor Park $263,000,000
11 0.00596 $1,567,480
Source: GIS BC Ministry of Community
Development 2014
3. Business Disruption Case Study - Method
3.1 Productivity Costs
The Worker Productivity Cost metric is defined as the daily cost of wages paid by disrupted business
establishments. In many cases these costs will be borne by firms, as wages may still be paid to employees when
11 Based on AECOM analysis using 2013 data. This differs slightly to the subsequent analysis by CRD reported in section 3.6, which was
based on an updated cadastral data layer and 2014 BC Assessment data.
Page 113
AECOM Capital Regional District Coastal Sea Level Rise Risk Assessment
RPT-2015-01-26-CRD Coastal SLR Risk Assessment-60310678 FINAL.Docx Page 8
business is disrupted by an inundation event. Because wages paid during a disruption represent a loss in
productivity, these costs could eventually lead firms to reduce staffing or wages, ultimately impacting employees as
well as their firms. Estimating worker productivity costs requires an understanding of firms’ existing staffing, which
was not possible to identify through publically available data in the cases of Harbour Air and Victoria Clipper. In a
phone interview with AECOM, Harbour Air provided an estimate of their total workforce based at the Inner Harbour;
Victoria Clipper was contacted by AECOM but chose not to participate in this analysis. AECOM understands that the
CRD may have access to an employer database that can provide more accurate estimates of total employees by
firm. In future rounds of analyses, the CRD may wish to draw on this database to estimate economic impacts.
The Worker Productivity Costs metric is calculated according to the following steps:
1. Number of Workers: The number of workers is determined for each major firm in the Focus Area. This is
done, where possible, through the review of an existing economic impact study, or through primary research.
Note that employee totals are annual averages and do not take into account seasonality in the workforce.
Employers were asked to report employment data only for Inner Harbour establishments; the CRD may wish
to verify whether these estimates are accurate based on its employer database.
2. Daily Wages: The number of workers is multiplied by the average daily industry-specific wage reported by
BC Statistics to arrive at the total daily wages of potentially impacted firms. In this case, the average wage
for the transportation industry is used.
3. Winter Impacts: Winter employment at Blackball Ferry is reduced proportional to the estimated reduction in
ticket sales during the winter (see Revenue Indicator). Employment for Harbour Air is held constant as
seasonal passenger data was not available at the time of this study. Daily wages at both firms are assumed
to be constant.
Table C11 below, summarizes the results of the productivity costs calculation and the primary data sources.
Table C11 - Productivity Costs Calculator
Lost Productivity Average daily industry
wage Number of workers
Lost wages per day of
disruption
Blackball Ferry $217 61 $13,237
Victoria Clipper Ferry $217 NA NA
Harbour Air $217 100 $21,700
Total (year round
impacts) 161 $34,937
Blackball Ferry (winter) $217 25 $5,323
Total (winter impacts) 125 $27,023
Sources: BC Stats 2014 Tourism Victoria 2007;
Harbour Air 2014a
3.2 Revenue Costs
The Business Revenue Costs metric is defined as the daily cost of lost revenue of disrupted business
establishments during a storm event. As firms were generally not willing to share revenue data, this metric relies on
reported passenger and fare data to approximate business revenue. Alternative methodologies (such as an estimate
Page 114
AECOM Capital Regional District Coastal Sea Level Rise Risk Assessment
RPT-2015-01-26-CRD Coastal SLR Risk Assessment-60310678 FINAL.Docx Page 9
of revenue per employee) would have to be developed to apply this metric to other Focus Areas where
transportation is not the dominant industry. Of the two firms without a publically available impact study, Harbour Air
provided a passenger estimate; Victoria Clipper Ferry did not. As with the productivity matrix, Victoria Clipper is
excluded from the calculation because of lack of data. The Business Revenue metric is calculated according to the
following steps:
1. Number of Daily Passengers: The number of daily passengers is determined for each transportation
business based on interviews or a publically available economic impact study. Daily passengers represent
annual averages.
2. Lost Daily Revenues: The daily passenger volume is multiplied by current passenger fees to estimate, by an
order of magnitude, the lost business revenue per day of disruption. Where prices vary by destination (in the
case of Harbour Air), rate information for the most common route is used. Where prices vary by fare type
(auto or passenger) posted fares were weighted according to the share of passengers boarding by foot or
auto. Note that other forms of passenger revenue, such as food and beverage sales, are excluded from this
preliminary economic analysis.
3. Winter Impacts: Blackball Ferry’s winter impact is estimated according to January – March ridership data.
Harbour Air’s impact is assumed to be constant (as seasonal data was not available for this preliminary
study).
Table C12 below, summarizes the results of the productivity impacts calculation and the primary data sources.
Table C12 – Revenue Impact Calculator
Lost Revenues
Number of daily
passengers (inbound and
outbound)
Revenue per
passenger
Lost revenue per day of
disruption
(estimated)
Blackball Ferry 1,124 $51
$57,324
Victoria Clipper Ferry NA $83 NA
Harbour Air 685 $157 $107,545
Total (year round
impacts) $160,373
Blackball Ferry (winter) 456 $51 $23,051
Total (winter impacts) $130,596
Sources: Tourism Victoria 2007;
Harbour Air 2014a
Blackball 2014;
Clipper 2014;
Harbour Air 2014b
3.3 Tourism Costs
The Tourism Costs metric is defined as the daily cost of lost ancillary tourist spending. All three of the major
businesses in the Focus Area are patronized by tourists, who rely on plane or ferry service to reach destinations in
the Capital Regional District. The Tourism Costs metric assumes that in the event of a disruptive storm, spending by
Page 115
AECOM Capital Regional District Coastal Sea Level Rise Risk Assessment
RPT-2015-01-26-CRD Coastal SLR Risk Assessment-60310678 FINAL.Docx Page 10
tourist customers would decline. Business proprietors are generally unaware of how much their customers spend in
the regional economy, unless they have conducted an economic impact study. Tourism Victoria’s impact study of
Blackball Ferry Blackball Ferry from 2007 was used to estimate the spending behavior of its passengers; Harbour Air
is currently undertaking a similar study that will not be available until October 2014. For Victoria Clipper, an estimate
of spending per passenger is publically available (in the Blackball impact study) but Victoria Clipper’s total passenger
volume is not. Consequently, Victoria Clipper and Harbour Air are excluded from this metric’s calculation, pending
the availability of required data inputs.
The Tourism Costs metric is calculated according to the following steps:
1. Number of Daily Passengers: The number of daily passengers (inbound only) is determined from available
data.
2. Share of Passengers Who Are Tourists: The share of passengers considered tourists is determined from
available data.
3. Average Spending per Passenger: The average spending per passenger is determined from available data.
4. Lost Daily Tourism Spending: The lost ancillary tourism spending per day of disruption is calculated by
multiplying daily passengers times the share who are tourists times average spending per tourist.
5. Winter Impacts: Blackball Ferry’s winter impact is estimated according to January – March ridership and
January – March per capita tourism spending, as reported in the 2007 economic impact study.
Table C13 below, summarizes the results of the tourism costs calculation and the primary data sources.
Table C13 – Tourism Costs Calculator
Tourism Impact Number of daily
passengers (inbound)
Share of passengers
considered tourists
Average
spending per
passenger
Lost tourism
spending per day
of disruption
Blackball Ferry 562 85% $402 $192,035
Blackball Ferry
(winter) 228 85% $237 $45,598
Victoria Clipper Ferry NA NA $294 NA
Harbour Air 342 NA NA NA
Total (year round) $192,035
Total (winter) $45,598
Sources: Tourism Victoria 2007;
Harbour Air 2014a Tourism Victoria 2007
Tourism Victoria
2007
3.4 Fiscal Costs
The final metric, Fiscal Costs, is defined as the provincial tax revenue lost daily resulting from the service disruption.
The Fiscal Costs metric is dependent on the outcomes of the Tourist Costs and Business Revenue Costs metrics.
The Fiscal Costs metric is calculated according to the following steps:
1. Lost Business Revenue: 100% of Tourist Spending (above) is assumed to be taxable by the provincial sales tax (PST) and the goods and services sales tax (GST). The majority of Business Revenue output is
Page 116
AECOM Capital Regional District Coastal Sea Level Rise Risk Assessment
RPT-2015-01-26-CRD Coastal SLR Risk Assessment-60310678 FINAL.Docx Page 11
assumed to be taxable only by the goods and services (GST) tax. A 50% factor is applied to business revenue of Blackball Ferry on the basic assumption that only half of its passenger ticket sales are taxed locally. (In other words, Port Angeles in the United States is the point of sale for the remaining ticket sales).
2. Lost tax Revenues: The Lost Business Revenue output is divided by 1 + the applicable tax rate to derive the pretax value of business sales.
12 The difference between pretax and final sales represents the daily loss in
applicable sales taxes.
3. Winter Impacts: Daily Winter Impacts follow the same methodology but based on winter-only Tourism Spending and Business Revenue estimates, calculated above.
Table C14 - Fiscal Costs Calculator
Fiscal impact Local share of lost tourist
and transit revenue / day Sales tax rate Cost of disruption / day
Tourism sales taxes –
goods and services (year
round)
$192,035 (A) 12% (B) 20,575
Transportation sales
taxes (year round) $160,373 5% $7,637
Total sales taxes (year
round) $28,212
Sales taxes – goods and
services (winter) $45,598 12% $4,886
Sales taxes – transit only
(winter) $130,596 5% $6,219
Total sales taxes (winter) $11,105
Source: Business Revenue and
Tourism indicators BC Government 2014 A – [A / (1 + B)]
12
Tourism and Business Revenue metrics include sales tax in their outputs.
Page 117
AECOM Capital Regional District Coastal Sea Level Rise Risk Assessment
RPT-2015-01-26-CRD Coastal SLR Risk Assessment-60310678 FINAL.Docx Page 12
Page 118
AECOM Capital Regional District Coastal Sea Level Rise Risk Assessment
RPT-2015-01-26-CRD Coastal SLR Risk Assessment-60310678 FINAL.Docx Page 1
Appendix D - References
AECOM, (2013). Modelling of Potential Tsunami Inundation Limits and Run-up. Prepared for the Capital Regional
District. 43pp.
Ausenco Sandwell, 2011a. Draft Policy Discussion Paper. Report prepared for BC Ministry of Environment. 45pp.
Ausensco Sandwell, 2011b. Sea Dike Guidelines. Report preared for BC Ministry of Environment. 15pp.
BC Ambulance Service (2009). 2009 Annual Report.
BC Ambulance Service (2014). “Fees” (web page). Accessed April 13 2014. <http://www.bcas.ca/about-us/fees/>
BC Census (2011). British Columbia 2011 Census. Oak Park Population Statistics (data table). Accessed April 13
2014.
BC Government (2014) British Columbia Government. “Provincial Sales Tax” (web page). Accessed 4/13/2014.
BC Hydro (2013). BC Hydro. “Quick Facts for the Year Ended March 31, 2013” (web document). Accessed April 14
2014.<bchydro.com/quickfacts>
BC Ministry of Community Development (2014). BC Ministry of Community Development. “2013 Tax Rates” (data
table). Accessed April 13 2014.
BC Ministry of Environment. (2013). Sea Level Rise Adaptation Primer.
BC Ministry of Forests, Lands and Natural Resource Operations. (2011). Coastal Floodplain Mapping - Guidelines
and Specifications.
BC Ministry of Transportation and Infrastructure (2012). “Daily Volume from 08/16/2012 through 08/17/2012 - Shirley
11-057EW – NY” (data table). Accessed March 31 2014.
BC Ministry of Water, Land and Air Protection (2001). Economic Benefits of British Columbia's Provincial Parks.
BC Parks (2013). 2012/2013 Statistics Report.
BC Parks. (undated). BC Parks Shoreline Sensitivity to Sea Level Rise Model.
BC Stats (2014). British Columbia Stats. “BC Industrial Comparison – Average Weekly Wage Rate” (data table).
Accessed April 13 014.
BC Transit (2011). Transit Future Plan 2011
Blackball Ferry (2014). “Fares” (web page). Accessed April 13 2014. < https://cohoferry.com/Fares>
Canadian Parks Council / The Outspan Group (2011). The Economic Impact of Canada’s National, Provincial &
Territorial Parks in 2009
Page 119
AECOM Capital Regional District Coastal Sea Level Rise Risk Assessment
RPT-2015-01-26-CRD Coastal SLR Risk Assessment-60310678 FINAL.Docx Page 2
CRD (2013). Estimates of Population Growth, Capital Region.
Clipper Ferry (2014). “Schedule and Fares” (web page). Accessed April 13 2014.
http://www.clippervacations.com/seattle-victoria-ferry/
District of Oak Bay (2010). “Community Plan Bylaw 1997.” Revised 2010. <
http://www.oakbay.ca/sites/default/files/municipal-services/bylaws/3943.pdf>
District of Oak Bay (2014). “Business Environment” (web page). Accessed 4/16/14. < https://www.oakbay.ca/our-
community/business/business-environment>
Harbour Air (2014a). Phone interview with Randy Wright, Harbour Air. March 31 2014.
Harbour Air (2014b). Harbour Air. “Seat Sales” (web page). Accessed April 13 2014.
<http://www.harbourair.com/book-a-flight/seat-sales/spring-sale/>
Marcy, D., B. William, K. Dragonoz, B. Hadley, C. Haynes, N. Herold, J. McCombs, M. Pendleton, S. Ryan, K.
Schmid, M. Sutherland, and K. Waters (2011). New Mapping Tool and Techniques or Visualizing Sea Level Rise
and Coastal Flooding Impacts. Proceedings of the 2011 Solutions to Coastal Disasters Conference. June 2011.
Anchorage, AK.
Oak Bay BIA (2014). Oak Bay Business Improvement Association. “Business Directory” (web page). Accessed
4/16/14. < http://www.visitoakbayvillage.ca/index.php?area_id=1006>
Pacific Rim National Park Reserve of Canada (2009). State of the Park Report.
Stats Canada (2014a). Stats Canada. “Labor force survey estimates by census metropolitan area” (data table).
Accessed April 13 2014.
Stats Canada (2014b). Statistics Canada. “Average hourly wages of employees by selected characteristics and
occupation” (data table). Accessed March 31 2014. West Coast Trail Express (2014a). Personal correspondence
with Michael Anderson, West Coast Trail Express. March 31 2014.
Tourism Victoria (2007) Smith, Brock. MV Coho Economic Impact Study. 2007.
West Coast Trail Express (2014b). “Fares” (web page). Accessed April 13 2014.
<http://www.trailbus.com/Fares_wct.html>
Victoria News (2013). Descoteau, D. “Victoria Golf Club at 120: wooing younger players.” Victoria News, Nov. 19,
2013.
Victoria Rapid Transit (2011). Regional Data and Traffic Information. Prepared by SNC Lavalin.
NASA ARC