Capnometry With HRV Application User Guide, copyright Glyn Blackett page 1
1 IntroductionThis guide introduces the Capnometry and Heart Rate Variability (HRV) biofeedback application, part of the Mind-Body Training Tools suite. This set of applications is designed to develop skills in mind-body awareness and self-regulation, particularly in a context of mindfulness and meditation practice.
The guide has two purposes: firstly to give an overview of capnometry and of heart rate coherence, and secondly to teach you how to use the software – though it is more of a reference than a tutorial. Other training material is available on the StressResilientMind.co.uk website.
The application is designed to train optimal breathing. A capnometer measures end-tidal carbon dioxide in exhaled air, which is known to correlate with the level of carbon dioxide in blood. The latter is an important physiological parameter, as it controls vasodilation, most prominently in the brain. Over-breathing or hyperventilation causes depletion of blood carbon dioxide and thus restriction of oxygen delivery to brain cells, while conversely capnometry biofeedback is a means of training optimal oxygen delivery to brain cells.
A further aspect of optimal breathing is Heart Rate Coherence (HRC). HRC is a mind-body state where heart rate variation becomes synchronised with breathing, a pattern known to correlate with emotional and physical well-being and optimal performance. (A fuller definition is presented later.) With biofeedback, we can train the ability to access HRC, and thus positive, adaptive and creative mental states.
The application monitors partial pressure of carbon dioxide in inhaled air (PP CO2) via a capnometer, and also heart rate, via either ECG or PPG sensors. Think of PP CO2 as the concentration of CO2. The software calculates the end-tidal CO2, or the peak in the PP CO2 signal over the course of a breath.
In keeping with others in the suite, the Capnometry & HRV application was designed to support your aims, not to supplant them. Achieving good ET CO2 scores is not necessarily the only consideration – the biofeedback application is designed to enhance or expand your subjective awareness.
The guide assumes that you have read the Software Installation and Set-up Guide, and therefore know how to start the application.
The application works with several devices. For an up to date list of supported hardware, please see the StressResilientMind.co.uk website.
Capnometry With HRV Application User Guide, copyright Glyn Blackett page 2
2 Launching the Application
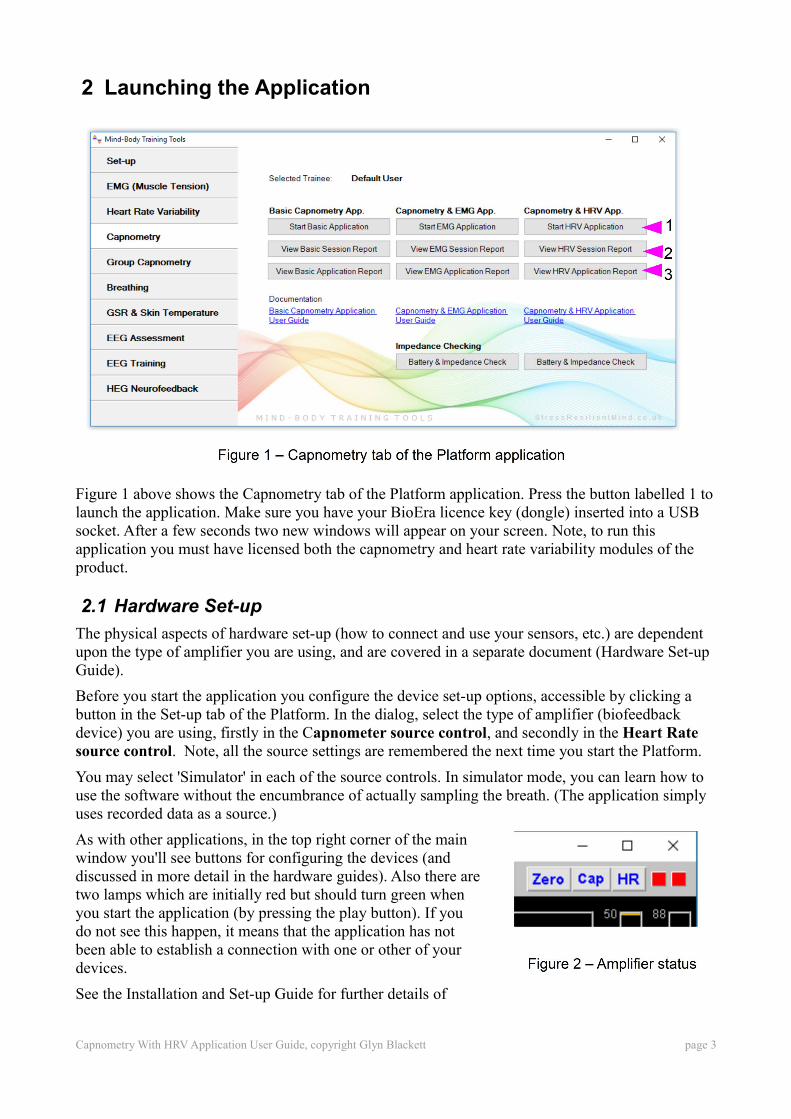
Figure 1 above shows the Capnometry tab of the Platform application. Press the button labelled 1 to launch the application. Make sure you have your BioEra licence key (dongle) inserted into a USB socket. After a few seconds two new windows will appear on your screen. Note, to run this application you must have licensed both the capnometry and heart rate variability modules of the product.
2.1 Hardware Set-up
The physical aspects of hardware set-up (how to connect and use your sensors, etc.) are dependent upon the type of amplifier you are using, and are covered in a separate document (Hardware Set-up Guide).
Before you start the application you configure the device set-up options, accessible by clicking a button in the Set-up tab of the Platform. In the dialog, select the type of amplifier (biofeedback device) you are using, firstly in the Capnometer source control, and secondly in the Heart Rate source control. Note, all the source settings are remembered the next time you start the Platform.
You may select 'Simulator' in each of the source controls. In simulator mode, you can learn how to use the software without the encumbrance of actually sampling the breath. (The application simply uses recorded data as a source.)
As with other applications, in the top right corner of the main window you'll see buttons for configuring the devices (and discussed in more detail in the hardware guides). Also there aretwo lamps which are initially red but should turn green when you start the application (by pressing the play button). If you do not see this happen, it means that the application has not been able to establish a connection with one or other of your devices.
See the Installation and Set-up Guide for further details of
Capnometry With HRV Application User Guide, copyright Glyn Blackett page 3
device set-up.
Capnometers can take up to several minutes after being started, to warm up fully and give a meaningful signal. For some devices the signal takes a while to appear, for this reason.
2.1.1 Zeroing The Capnometer
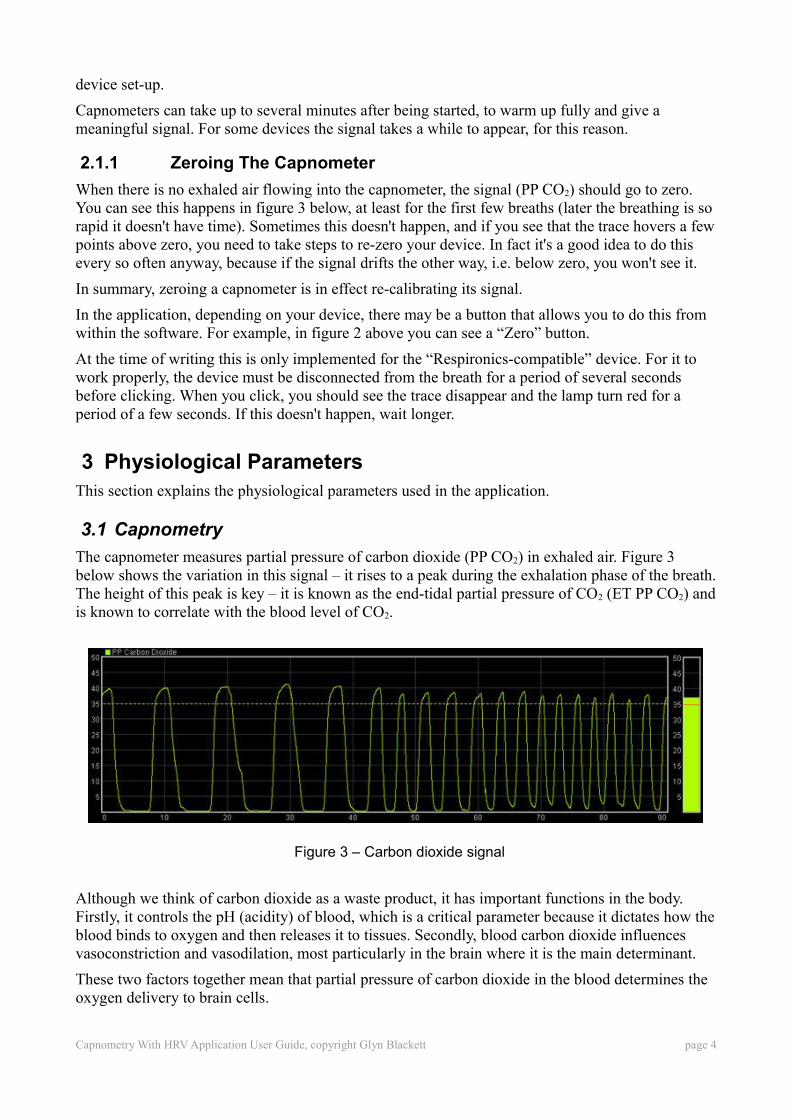
When there is no exhaled air flowing into the capnometer, the signal (PP CO2) should go to zero. You can see this happens in figure 3 below, at least for the first few breaths (later the breathing is so rapid it doesn't have time). Sometimes this doesn't happen, and if you see that the trace hovers a few points above zero, you need to take steps to re-zero your device. In fact it's a good idea to do this every so often anyway, because if the signal drifts the other way, i.e. below zero, you won't see it.
In summary, zeroing a capnometer is in effect re-calibrating its signal.
In the application, depending on your device, there may be a button that allows you to do this from within the software. For example, in figure 2 above you can see a “Zero” button.
At the time of writing this is only implemented for the “Respironics-compatible” device. For it to work properly, the device must be disconnected from the breath for a period of several seconds before clicking. When you click, you should see the trace disappear and the lamp turn red for a period of a few seconds. If this doesn't happen, wait longer.
3 Physiological ParametersThis section explains the physiological parameters used in the application.
3.1 Capnometry
The capnometer measures partial pressure of carbon dioxide (PP CO2) in exhaled air. Figure 3 below shows the variation in this signal – it rises to a peak during the exhalation phase of the breath. The height of this peak is key – it is known as the end-tidal partial pressure of CO2 (ET PP CO2) and is known to correlate with the blood level of CO2.
Although we think of carbon dioxide as a waste product, it has important functions in the body. Firstly, it controls the pH (acidity) of blood, which is a critical parameter because it dictates how the blood binds to oxygen and then releases it to tissues. Secondly, blood carbon dioxide influences vasoconstriction and vasodilation, most particularly in the brain where it is the main determinant.
These two factors together mean that partial pressure of carbon dioxide in the blood determines the oxygen delivery to brain cells.
Capnometry With HRV Application User Guide, copyright Glyn Blackett page 4
Figure 3 – Carbon dioxide signal
3.1.1 Hyperventilation
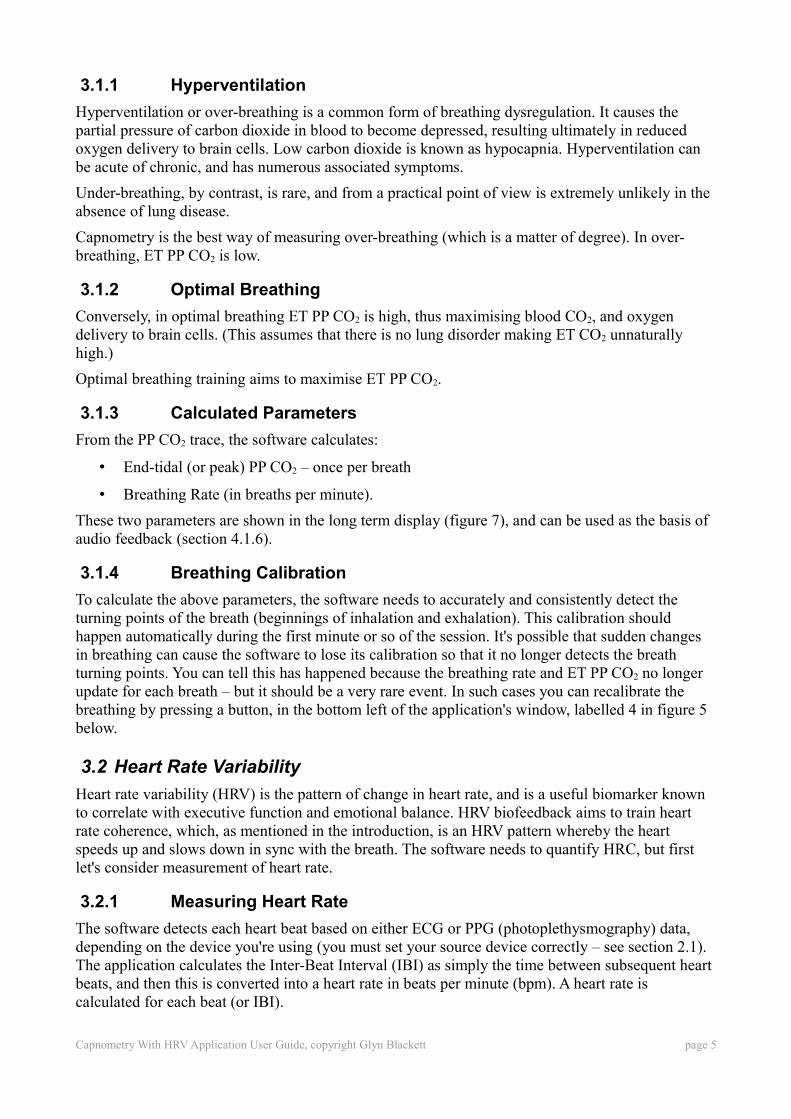
Hyperventilation or over-breathing is a common form of breathing dysregulation. It causes the partial pressure of carbon dioxide in blood to become depressed, resulting ultimately in reduced oxygen delivery to brain cells. Low carbon dioxide is known as hypocapnia. Hyperventilation can be acute of chronic, and has numerous associated symptoms.
Under-breathing, by contrast, is rare, and from a practical point of view is extremely unlikely in the absence of lung disease.
Capnometry is the best way of measuring over-breathing (which is a matter of degree). In over-breathing, ET PP CO2 is low.
3.1.2 Optimal Breathing
Conversely, in optimal breathing ET PP CO2 is high, thus maximising blood CO2, and oxygen delivery to brain cells. (This assumes that there is no lung disorder making ET CO2 unnaturally high.)
Optimal breathing training aims to maximise ET PP CO2.
3.1.3 Calculated Parameters
From the PP CO2 trace, the software calculates:
• End-tidal (or peak) PP CO2 – once per breath
• Breathing Rate (in breaths per minute).
These two parameters are shown in the long term display (figure 7), and can be used as the basis of audio feedback (section 4.1.6).
3.1.4 Breathing Calibration
To calculate the above parameters, the software needs to accurately and consistently detect the turning points of the breath (beginnings of inhalation and exhalation). This calibration should happen automatically during the first minute or so of the session. It's possible that sudden changes in breathing can cause the software to lose its calibration so that it no longer detects the breath turning points. You can tell this has happened because the breathing rate and ET PP CO2 no longer update for each breath – but it should be a very rare event. In such cases you can recalibrate the breathing by pressing a button, in the bottom left of the application's window, labelled 4 in figure 5 below.
3.2 Heart Rate Variability
Heart rate variability (HRV) is the pattern of change in heart rate, and is a useful biomarker known to correlate with executive function and emotional balance. HRV biofeedback aims to train heart rate coherence, which, as mentioned in the introduction, is an HRV pattern whereby the heart speeds up and slows down in sync with the breath. The software needs to quantify HRC, but first let's consider measurement of heart rate.
3.2.1 Measuring Heart Rate
The software detects each heart beat based on either ECG or PPG (photoplethysmography) data, depending on the device you're using (you must set your source device correctly – see section 2.1). The application calculates the Inter-Beat Interval (IBI) as simply the time between subsequent heart beats, and then this is converted into a heart rate in beats per minute (bpm). A heart rate is calculated for each beat (or IBI).
Capnometry With HRV Application User Guide, copyright Glyn Blackett page 5
Movements can create artefact in the signal causing the software to miss beats. In the case of ECG, muscle tension in the arms or hands can also cause interference. Whilst there is a degree of tolerance, sometimes the software takes several seconds to recover. If the heart beat appears to be lost, simply sit still and wait. In the worst case you may need to stop and restart the application.
You can observe the “raw” signal (ECG or PPG), and beat detection, in the support window (see figure 10 in section 4.2).
3.2.2 Heart Rate Coherence
The application calculates a measure of HRC called “coherence score” – the same computation as is used in the main HRV application. This section explains the method of calculation.
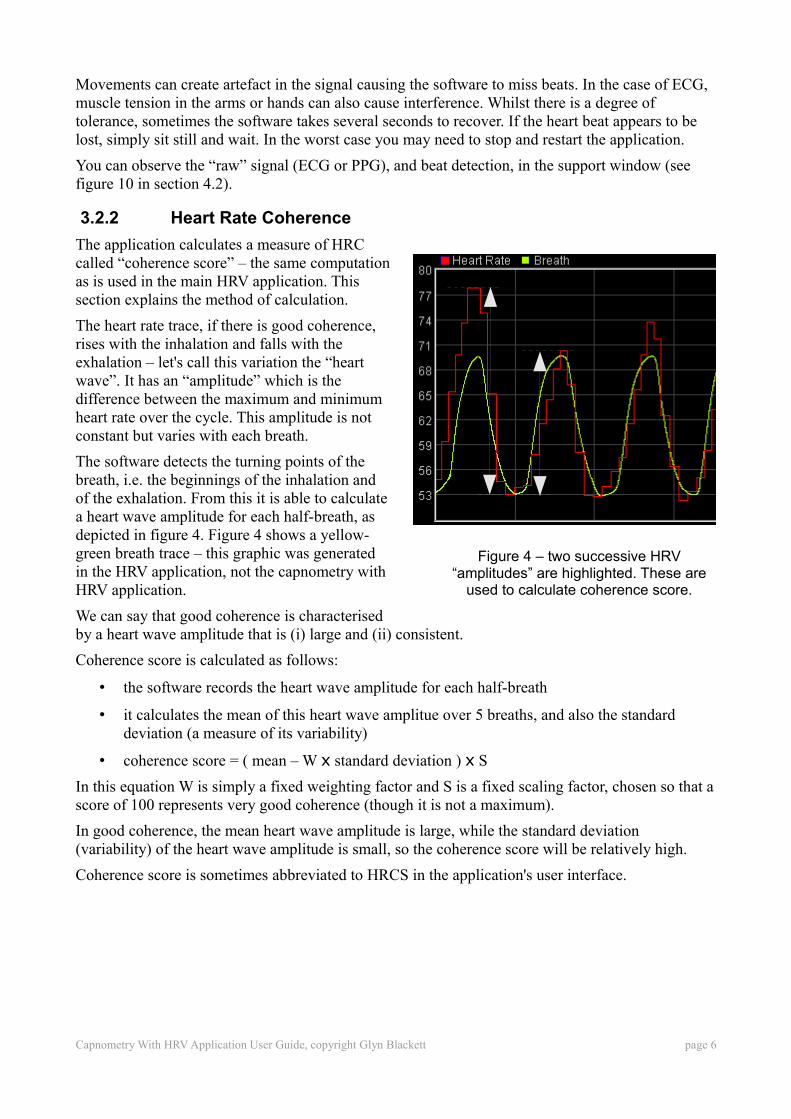
The heart rate trace, if there is good coherence, rises with the inhalation and falls with the exhalation – let's call this variation the “heart wave”. It has an “amplitude” which is the difference between the maximum and minimum heart rate over the cycle. This amplitude is not constant but varies with each breath.
The software detects the turning points of the breath, i.e. the beginnings of the inhalation and of the exhalation. From this it is able to calculate a heart wave amplitude for each half-breath, as depicted in figure 4. Figure 4 shows a yellow-green breath trace – this graphic was generated in the HRV application, not the capnometry with HRV application.
We can say that good coherence is characterised by a heart wave amplitude that is (i) large and (ii) consistent.
Coherence score is calculated as follows:
• the software records the heart wave amplitude for each half-breath
• it calculates the mean of this heart wave amplitue over 5 breaths, and also the standard deviation (a measure of its variability)
• coherence score = ( mean – W x standard deviation ) x S
In this equation W is simply a fixed weighting factor and S is a fixed scaling factor, chosen so that a score of 100 represents very good coherence (though it is not a maximum).
In good coherence, the mean heart wave amplitude is large, while the standard deviation (variability) of the heart wave amplitude is small, so the coherence score will be relatively high.
Coherence score is sometimes abbreviated to HRCS in the application's user interface.
Capnometry With HRV Application User Guide, copyright Glyn Blackett page 6
Figure 4 – two successive HRV “amplitudes” are highlighted. These are
used to calculate coherence score.
4 User InterfaceWhen you first start the application from the Platform, you will see two windows. The main window is shown in figure 5 below, while the support window is shown later (figure 10). The support window shows the raw heart rate signal and allows you to check that that the application is successfully detecting heart beats. I expect that most users will have little use for the support window.
4.1 Main Window
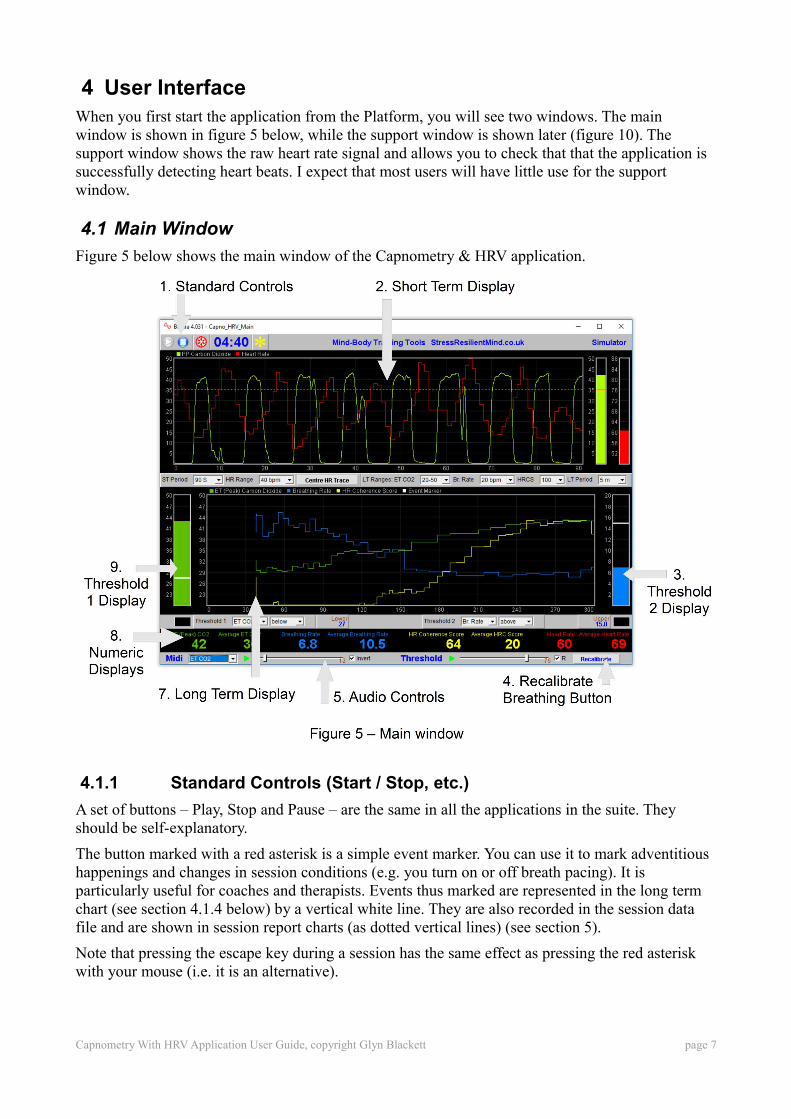
Figure 5 below shows the main window of the Capnometry & HRV application.
4.1.1 Standard Controls (Start / Stop, etc.)
A set of buttons – Play, Stop and Pause – are the same in all the applications in the suite. They should be self-explanatory.
The button marked with a red asterisk is a simple event marker. You can use it to mark adventitious happenings and changes in session conditions (e.g. you turn on or off breath pacing). It is particularly useful for coaches and therapists. Events thus marked are represented in the long term chart (see section 4.1.4 below) by a vertical white line. They are also recorded in the session data file and are shown in session report charts (as dotted vertical lines) (see section 5).
Note that pressing the escape key during a session has the same effect as pressing the red asterisk with your mouse (i.e. it is an alternative).
Capnometry With HRV Application User Guide, copyright Glyn Blackett page 7
4.1.2 Short Term Display and Controls
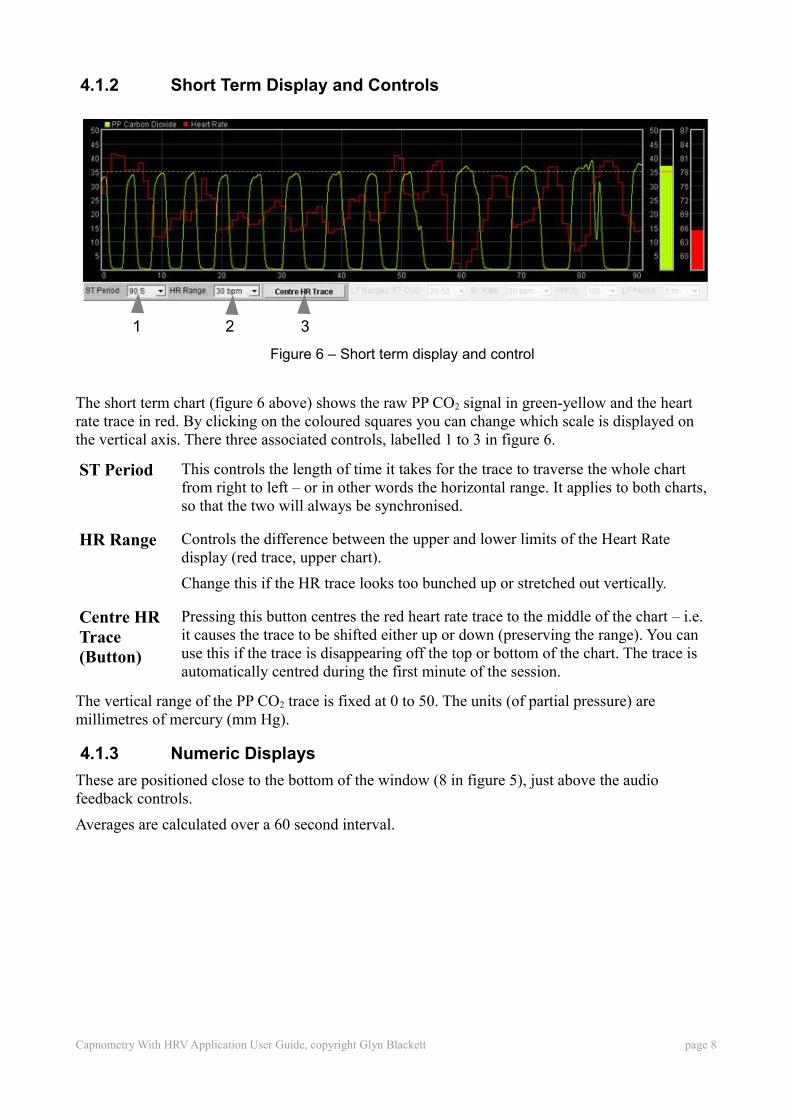
The short term chart (figure 6 above) shows the raw PP CO2 signal in green-yellow and the heart rate trace in red. By clicking on the coloured squares you can change which scale is displayed on the vertical axis. There three associated controls, labelled 1 to 3 in figure 6.
ST Period This controls the length of time it takes for the trace to traverse the whole chart from right to left – or in other words the horizontal range. It applies to both charts, so that the two will always be synchronised.
HR Range Controls the difference between the upper and lower limits of the Heart Rate display (red trace, upper chart).
Change this if the HR trace looks too bunched up or stretched out vertically.
Centre HR Trace (Button)
Pressing this button centres the red heart rate trace to the middle of the chart – i.e. it causes the trace to be shifted either up or down (preserving the range). You can use this if the trace is disappearing off the top or bottom of the chart. The trace is automatically centred during the first minute of the session.
The vertical range of the PP CO2 trace is fixed at 0 to 50. The units (of partial pressure) are millimetres of mercury (mm Hg).
4.1.3 Numeric Displays
These are positioned close to the bottom of the window (8 in figure 5), just above the audio feedback controls.
Averages are calculated over a 60 second interval.
Capnometry With HRV Application User Guide, copyright Glyn Blackett page 8
Figure 6 – Short term display and control
1 2 3
4.1.4 Long Term Display and Controls
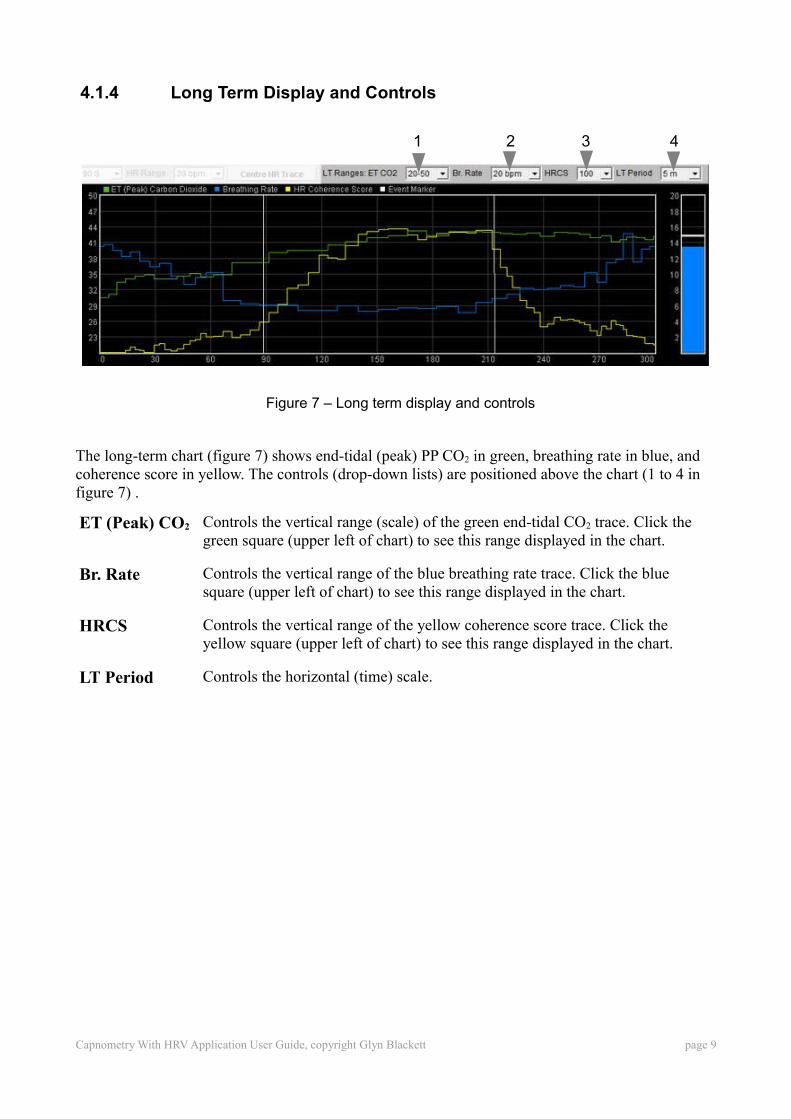
The long-term chart (figure 7) shows end-tidal (peak) PP CO2 in green, breathing rate in blue, and coherence score in yellow. The controls (drop-down lists) are positioned above the chart (1 to 4 in figure 7) .
ET (Peak) CO2 Controls the vertical range (scale) of the green end-tidal CO2 trace. Click the green square (upper left of chart) to see this range displayed in the chart.
Br. Rate Controls the vertical range of the blue breathing rate trace. Click the blue square (upper left of chart) to see this range displayed in the chart.
HRCS Controls the vertical range of the yellow coherence score trace. Click the yellow square (upper left of chart) to see this range displayed in the chart.
LT Period Controls the horizontal (time) scale.
Capnometry With HRV Application User Guide, copyright Glyn Blackett page 9
Figure 7 – Long term display and controls
1 2 3 4
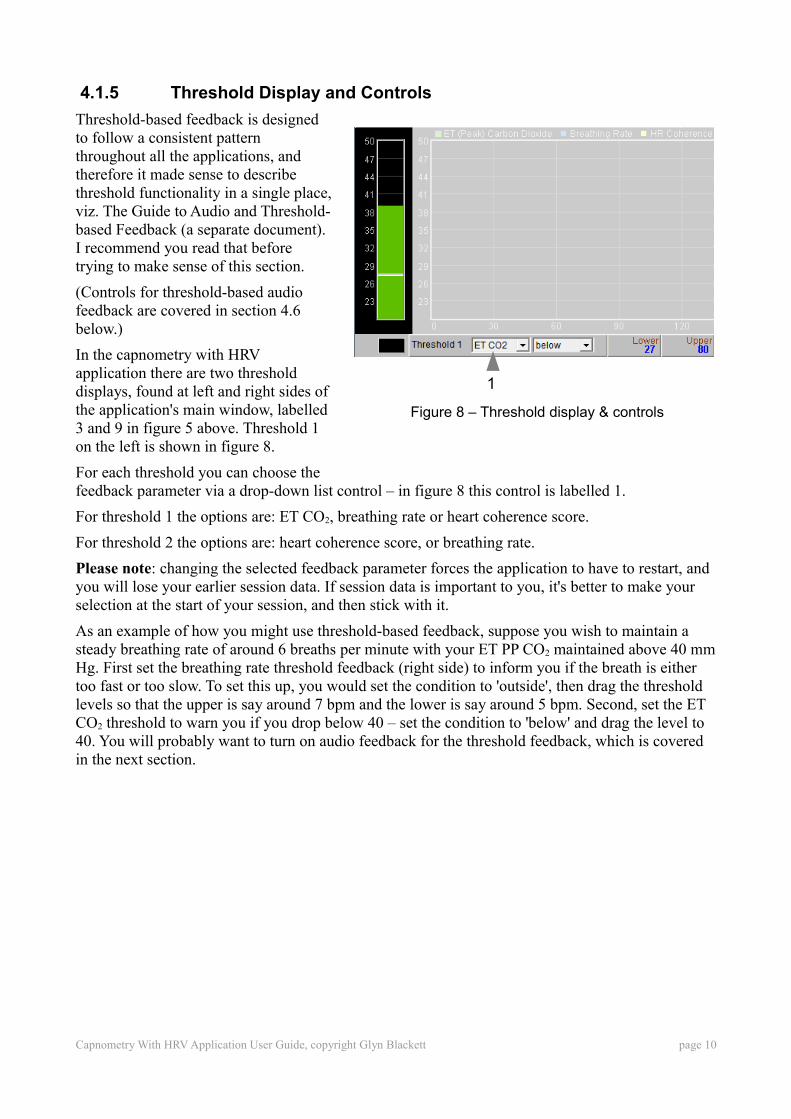
4.1.5 Threshold Display and Controls
Threshold-based feedback is designed to follow a consistent pattern throughout all the applications, and therefore it made sense to describe threshold functionality in a single place, viz. The Guide to Audio and Threshold-based Feedback (a separate document). I recommend you read that before trying to make sense of this section.
(Controls for threshold-based audio feedback are covered in section 4.6 below.)
In the capnometry with HRV application there are two threshold displays, found at left and right sides of the application's main window, labelled 3 and 9 in figure 5 above. Threshold 1 on the left is shown in figure 8.
For each threshold you can choose the feedback parameter via a drop-down list control – in figure 8 this control is labelled 1.
For threshold 1 the options are: ET CO2, breathing rate or heart coherence score.
For threshold 2 the options are: heart coherence score, or breathing rate.
Please note: changing the selected feedback parameter forces the application to have to restart, and you will lose your earlier session data. If session data is important to you, it's better to make your selection at the start of your session, and then stick with it.
As an example of how you might use threshold-based feedback, suppose you wish to maintain a steady breathing rate of around 6 breaths per minute with your ET PP CO2 maintained above 40 mm Hg. First set the breathing rate threshold feedback (right side) to inform you if the breath is either too fast or too slow. To set this up, you would set the condition to 'outside', then drag the threshold levels so that the upper is say around 7 bpm and the lower is say around 5 bpm. Second, set the ET CO2 threshold to warn you if you drop below 40 – set the condition to 'below' and drag the level to 40. You will probably want to turn on audio feedback for the threshold feedback, which is covered in the next section.
Capnometry With HRV Application User Guide, copyright Glyn Blackett page 10
1
Figure 8 – Threshold display & controls
4.1.6 Audio Feedback Controls
Again, audio feedback functionality is consistent between applications and so is described in one place, i.e. The Guide to Audio and Threshold-based Feedback, which you should read before trying to make sense of this section.
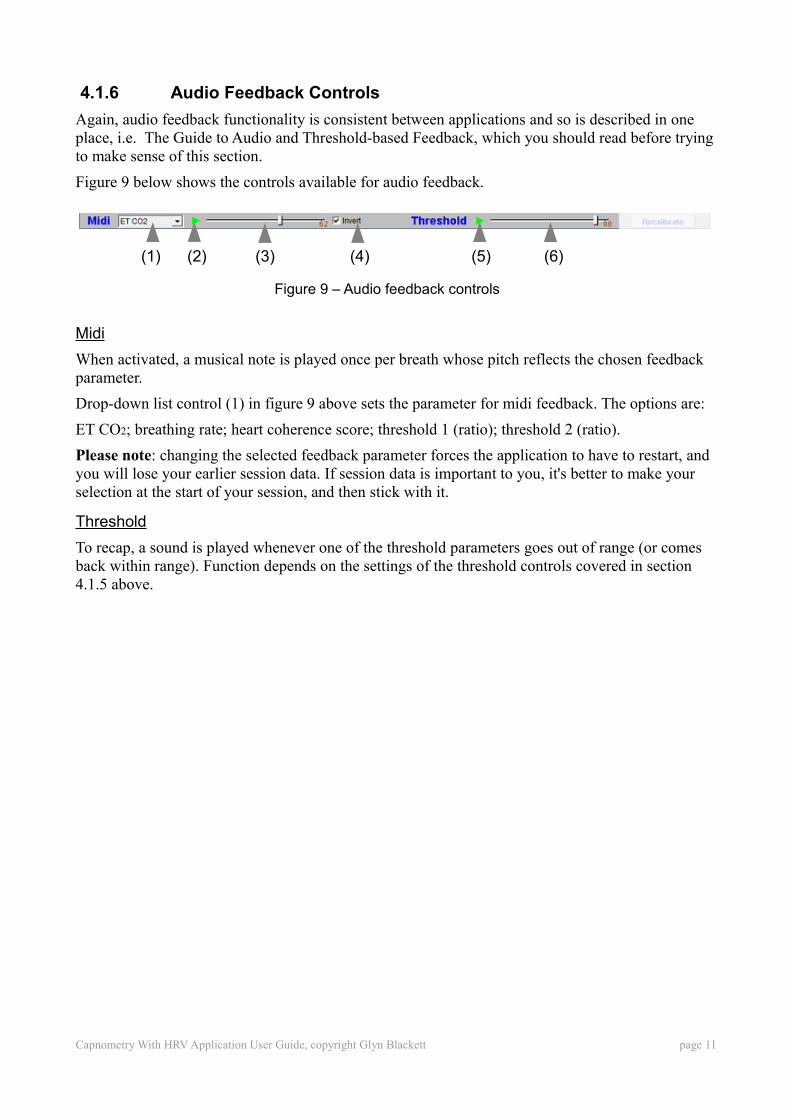
Figure 9 below shows the controls available for audio feedback.
Midi
When activated, a musical note is played once per breath whose pitch reflects the chosen feedback parameter.
Drop-down list control (1) in figure 9 above sets the parameter for midi feedback. The options are:
Please note: changing the selected feedback parameter forces the application to have to restart, and you will lose your earlier session data. If session data is important to you, it's better to make your selection at the start of your session, and then stick with it.
Threshold
To recap, a sound is played whenever one of the threshold parameters goes out of range (or comes back within range). Function depends on the settings of the threshold controls covered in section 4.1.5 above.
Capnometry With HRV Application User Guide, copyright Glyn Blackett page 11
(1) (2) (3) (4) (5) (6)
Figure 9 – Audio feedback controls
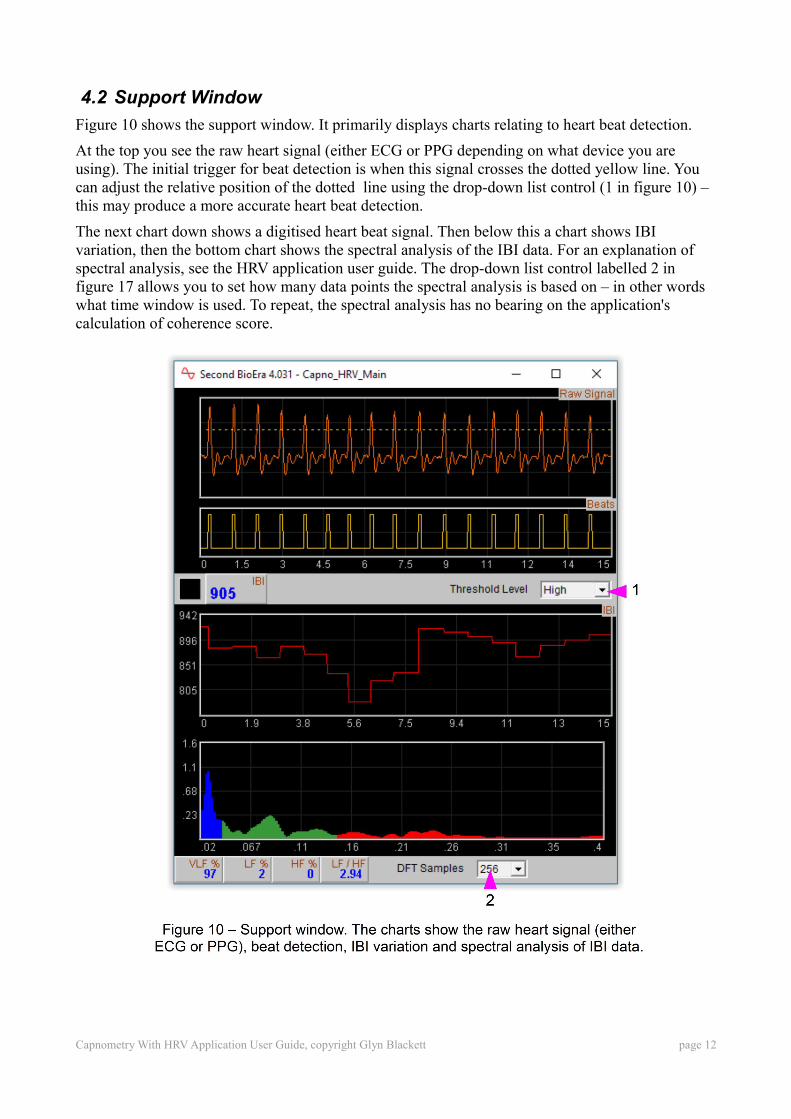
4.2 Support Window
Figure 10 shows the support window. It primarily displays charts relating to heart beat detection.
At the top you see the raw heart signal (either ECG or PPG depending on what device you are using). The initial trigger for beat detection is when this signal crosses the dotted yellow line. You can adjust the relative position of the dotted line using the drop-down list control (1 in figure 10) – this may produce a more accurate heart beat detection.
The next chart down shows a digitised heart beat signal. Then below this a chart shows IBI variation, then the bottom chart shows the spectral analysis of the IBI data. For an explanation of spectral analysis, see the HRV application user guide. The drop-down list control labelled 2 in figure 17 allows you to set how many data points the spectral analysis is based on – in other words what time window is used. To repeat, the spectral analysis has no bearing on the application's calculation of coherence score.
Capnometry With HRV Application User Guide, copyright Glyn Blackett page 12
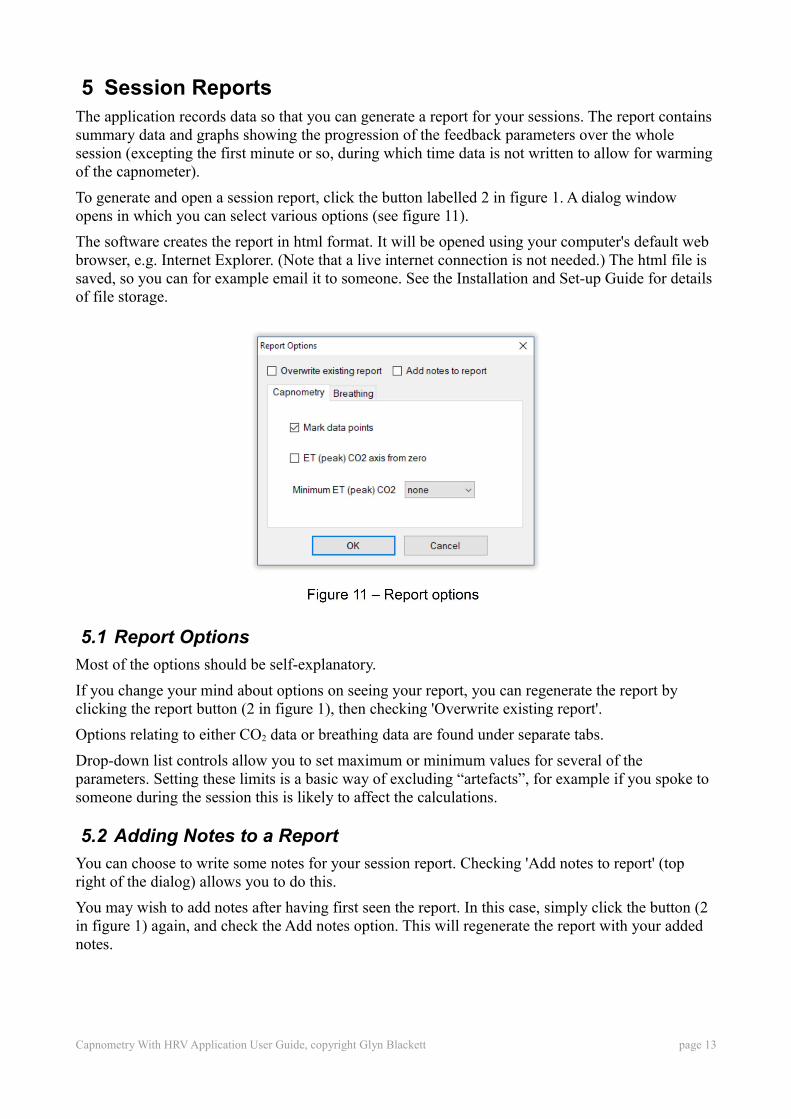
5 Session ReportsThe application records data so that you can generate a report for your sessions. The report contains summary data and graphs showing the progression of the feedback parameters over the whole session (excepting the first minute or so, during which time data is not written to allow for warming of the capnometer).
To generate and open a session report, click the button labelled 2 in figure 1. A dialog window opens in which you can select various options (see figure 11).
The software creates the report in html format. It will be opened using your computer's default web browser, e.g. Internet Explorer. (Note that a live internet connection is not needed.) The html file is saved, so you can for example email it to someone. See the Installation and Set-up Guide for details of file storage.
5.1 Report Options
Most of the options should be self-explanatory.
If you change your mind about options on seeing your report, you can regenerate the report by clicking the report button (2 in figure 1), then checking 'Overwrite existing report'.
Options relating to either CO2 data or breathing data are found under separate tabs.
Drop-down list controls allow you to set maximum or minimum values for several of the parameters. Setting these limits is a basic way of excluding “artefacts”, for example if you spoke to someone during the session this is likely to affect the calculations.
5.2 Adding Notes to a Report
You can choose to write some notes for your session report. Checking 'Add notes to report' (top right of the dialog) allows you to do this.
You may wish to add notes after having first seen the report. In this case, simply click the button (2 in figure 1) again, and check the Add notes option. This will regenerate the report with your added notes.
Capnometry With HRV Application User Guide, copyright Glyn Blackett page 13
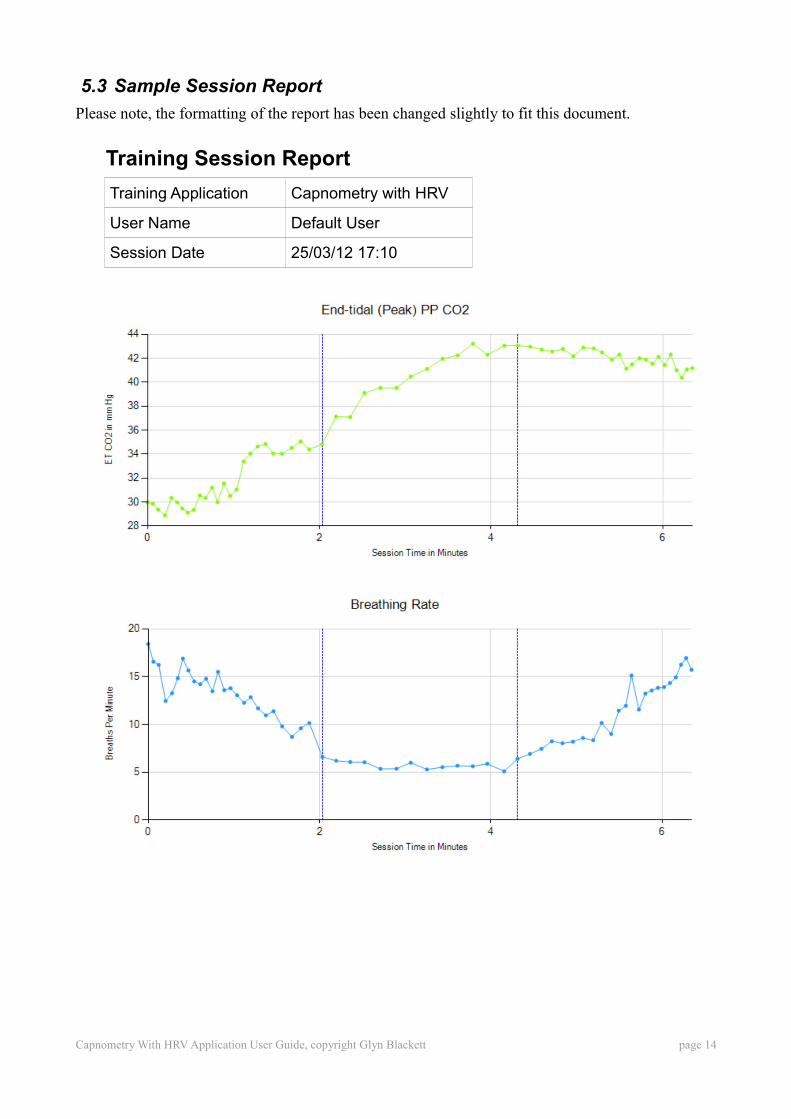
5.3 Sample Session Report
Please note, the formatting of the report has been changed slightly to fit this document.
Training Session Report
Training Application Capnometry with HRV
User Name Default User
Session Date 25/03/12 17:10
Capnometry With HRV Application User Guide, copyright Glyn Blackett page 14
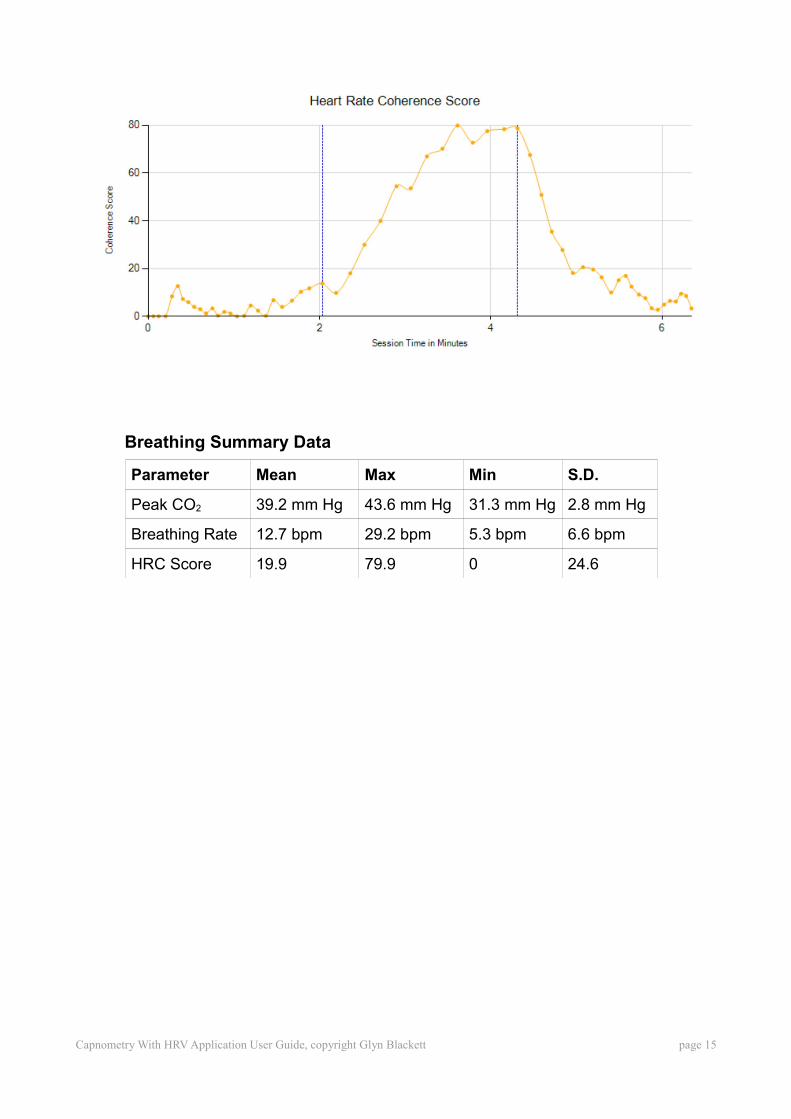
Breathing Summary Data
Parameter Mean Max Min S.D.
Peak CO2 39.2 mm Hg 43.6 mm Hg 31.3 mm Hg 2.8 mm Hg
Breathing Rate 12.7 bpm 29.2 bpm 5.3 bpm 6.6 bpm
HRC Score 19.9 79.9 0 24.6
Capnometry With HRV Application User Guide, copyright Glyn Blackett page 15
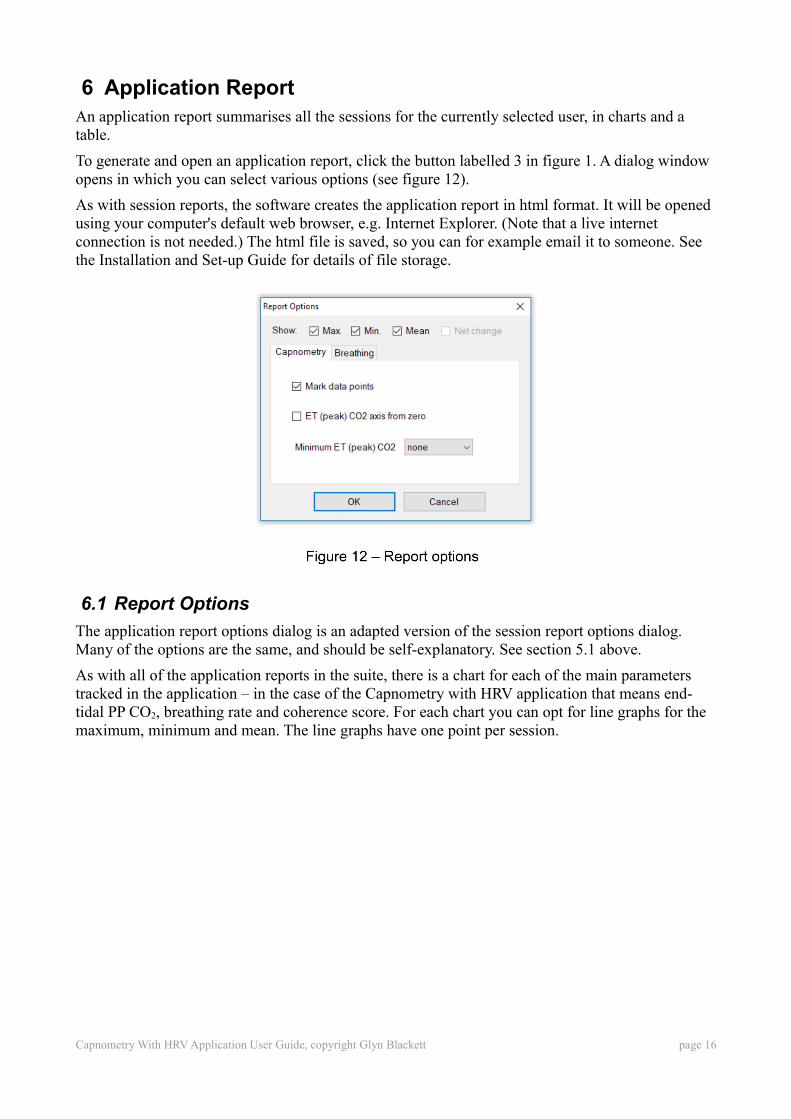
6 Application ReportAn application report summarises all the sessions for the currently selected user, in charts and a table.
To generate and open an application report, click the button labelled 3 in figure 1. A dialog window opens in which you can select various options (see figure 12).
As with session reports, the software creates the application report in html format. It will be opened using your computer's default web browser, e.g. Internet Explorer. (Note that a live internet connection is not needed.) The html file is saved, so you can for example email it to someone. See the Installation and Set-up Guide for details of file storage.
6.1 Report Options
The application report options dialog is an adapted version of the session report options dialog. Many of the options are the same, and should be self-explanatory. See section 5.1 above.
As with all of the application reports in the suite, there is a chart for each of the main parameters tracked in the application – in the case of the Capnometry with HRV application that means end-tidal PP CO2, breathing rate and coherence score. For each chart you can opt for line graphs for the maximum, minimum and mean. The line graphs have one point per session.
Capnometry With HRV Application User Guide, copyright Glyn Blackett page 16