27
Page | 1 Analytical Finance II MMA702 5 th December 2010 Caps and Floors Using Black-76 Participants: 1. Li Weitian 2. Hong Xi 3. Zhang Zhuozhuo 4.Thanyapat Tipweerachat Tutor: Jan Röman
Page | 1
Analytical Finance II
MMA702 5th December 2010
Caps and Floors Using
Black-76
Participants:
1. Li Weitian 2. Hong Xi 3. Zhang Zhuozhuo 4.Thanyapat Tipweerachat
Tutor: Jan Röman

Page | 2
Problem: Create an application in Excel/VBA(java) that calculates the values of Caps and Floors using Black-76. Use the Swap Rate and value Caps and Floors at different levels. The market data of the Spot Rate is given by the Teacher. If you create a BTD tree and make the application as general as possible, then you can get up to 10 points. This is a job for 3 or 4 members.

Page | 3
Abstract The floating interest rate is always a crucial factor people would like to predict
in the financial market. When investors lend or borrow money from bank, the
floating interest rate will be a risk that they have to manage with their asset.
The interest rate caps and floors are essential tools when hedge the risks.
Page | 4
Contents
Abstract ........................................................................................................................................................... 3
Introduction ..................................................................................................................................................... 5
Caps and Floors ............................................................................................................................................... 6
CAPS AND CAPLETS ..................................................................................................................................... 6
Definition ................................................................................................................................................. 6
Advantage and disadvantage of caps ........................................................................................................ 10
Advantages/benefits ............................................................................................................................. 10
Disadvantages/risks ............................................................................................................................... 10
FLOORS AND FLOORLETS ........................................................................................................................... 11
Definition ............................................................................................................................................... 11
Advantage and disadvantage of floors ...................................................................................................... 13
Advantages/benefits ............................................................................................................................. 13
Disadvantages/risks ............................................................................................................................... 14
Binomial Tree Model ..................................................................................................................................... 15
Relationship to the Black-Scholes model .................................................................................................. 17
Black-76 Model .............................................................................................................................................. 18
Numerical work and its application ............................................................................................................... 19
Conclusion ..................................................................................................................................................... 25
Reference ...................................................................................................................................................... 26

Page | 5
Introduction Our aim of this report is to solve the problem above, to create an application
that calculates the values of Caps and Floors using Binomial trees. And then
compare the result with the standard calculation method Black-76. Meanwhile,
we will use the Swap Rate and value Caps and Floors at different levels.
The first part of our report, we have some theoretical explanation about caps
and floors, the advantages and disadvantages of; binomial trees and the Black-
76 model. Follow by that we have our application showing. In the end, we will
analyze the result based out the application outcomes and compare the two
models.

Page | 6
Caps and Floors
Interest rate Caps and Floors are basic products in hedging floating rate risk.
They set the minimum return levels on one side of interest rate movement and
allow the profit on the other side. Caps and Floors are counterparts to Call and
Put options in equity market. In more detail, they are composition of individual
options, called Caplets and Floorlets. By the help of these interest rate
derivatives, corporations enjoy much freedom in managing financial assets and
liabilities. In conjunction with other financial instruments, Caps and Floors may
help remapping the corporation risk structure. Parameters of caps and floors
are:
• Notional
• Cash flow dates
• Floating rate
• Strike rate
CAPS AND CAPLETS
Definition
An (interest rate) cap is designed to protect an investor who has borrowed
funds on a floating interest rate basis against the risk of paying very high
interest rates. More specifically, it is a collection of caplets, each of which is a
call option on e.g., the LIBOR rate at a specified date in the future. A series of
caplets or cap can extend for up to 10 years in most markets. Banks and
institutions will use caps to limit their risk exposure to upward movements in
short term floating rate debt. Caps are equally attractive to speculators as
Page | 7
considerable profits can be achieved on volatility plays in uncertain interest rate
environments.
Suppose we have a loan with face value of N and payment dates t1 < t2 < · · · <
tn, where ti+1 - ti = δ for all i. In practice, there will not be exactly the same
number of days between successive reset dates, and the calculations below
must be slightly adjusted by using the relevant day count convention. The
interest rate to be paid at time ti is determined by the δ-period money market
interest rate prevailing at time ti - δ, i.e. the payment at time ti is equal to Nδl(ti,
ti-δ). Note that the interest rate is set at the beginning of the period, but paid at
the end. Define t0 = t1 - δ. The date’s t0, t1, . . . , tn-1 where the rate for the
coming period is determined are called the reset dates of the loan.
A cap with a face value of N, payment dates ti (i = 1, . . . , n) as above and a so-
called cap rate K yields a time ti payoff of Nδmax{l(ti, ti - δ) - K, 0}, for i = 1,
2, . . . , n. If a borrower buys such a cap, the total payment at time ti cannot
exceed NδK. The period length δ is often referred to as the frequency or the
tenor of the cap. In practice, the frequency is typically either 3, 6, or 12 months.
Note that the time distance between payment dates coincides with the
“maturity” of the floating interest rate. Also, note that while a cap is tailored for
interest rate hedging, it can also be used for interest rate speculation.
A cap can be seen as a portfolio of n caplets, namely one for each payment date
of the cap. The i’th caplet yields a payoff at time ti of
Ctii = Nδmax{l(ti , ti − δ) − K, 0}

Page | 8
and no other payments. A caplet is a call option on the zero-coupon yield
prevailing at time ti – δ for a period of length δ, but where the payment takes
place at time ti although it is already fixed at time ti - δ.
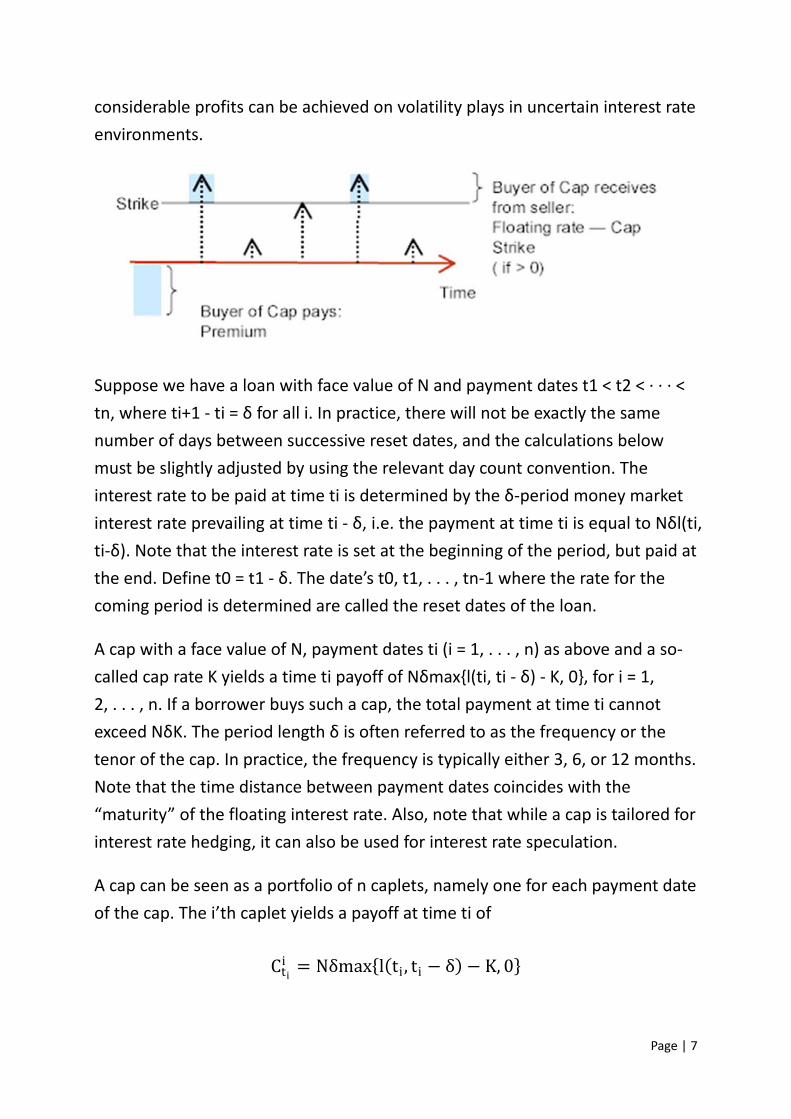
The cap portfolio of n such options. LIBOR rates are observed at times t1, t2...
tn and the corresponding payoffs are occurred at times t2, t3… tn+1. The n call
options underlying are known as caplets. The payoff diagram is shown as in the
figure below.
An interest rate cap can also be characterized as a portfolio of put options on
zero-coupon bonds with payoffs on the puts occurring at the time they are
calculated. The payoff at time ti is equivalent to:

Page | 9
The expression N(1 + δK)/(1 + δl(ti , ti − δ)) is the value of a zero-coupon
bond that pays off N(1+ δ K) at time ti. The expression above is therefore the
payoff from a put option, with maturity ti, on a zero-coupon bond with maturity
ti when the face value of the bond is N(1+ δ K) and the strike price is N. It
follows that an interest rate cap can be regarded as a portfolio of European put
options on zero-coupon bonds.
The relation between the price of a zero-coupon bond at time t with maturity at
T and the forward rate l(t, T) is
The value at time ti - δ is identical to the payoff of a European put option
expiring at time ti - δ that has an exercise price of 1/(1 + δK) and is written on
a zero-coupon bond maturing at time ti. Accordingly, the value of the i’th caplet
at an earlier point in time t ≤ ti - δ must equal the value of that put option. If
we denote the price of a call option on a zero-coupon bond at time t, with the
strike price K, expiry T and where the bond expires at time S with 𝜋𝜋(t,K, S,T).
At all dates after the first reset date, the next payment of the cap will already
be known. If we again use the notation ti(t) for the nearest following payment
date after time t, the value of the cap at any time t in [t0, tn] (exclusive of any
payment received exactly at time t) can be written as:

Page | 10
Advantage and disadvantage of caps
Advantages/benefits 1. The major advantages of caps are that the buyer limits his potential loss
to the premium paid, but retains the right to benefit from favorable rate
movements. A cap limits exposure to rising interest rates, while retaining
the potential to benefit from falling rates.
2. Interest rate option products are highly geared instruments and, for a
relatively small outlay of capital, purchasers can make considerable
profits.
3. At the same time, a seller with a decay strategy in mind can make a profit
amounting to the option premium, without having to make a capital
outlay.
Disadvantages/risks
1. The disadvantages of caps are that the premium is a non-refundable cost,
which is paid upfront by the buyer, and the negative impact of an
immediate cash outflow. Caps can theoretically lose all their value if they
expire as out-the-money or start to approach their expiry dates.

Page | 11
2. There are high potential losses for writers (sellers) of option-type interest
rate derivatives if market movements are contrary to market
expectations.
3. It needs to keep in mind that the bid/offer spreads on most option-type
interest rate derivative products are quite wide.
FLOORS AND FLOORLETS
Definition
The interest rate management method for an investor that the portfolio returns
linked to a Floating rate note is an Interest Rate Floor (Floor) . A Floor helps an
investor to protect their position when falling in interest rates. Moreover it also
maintains the ability in participation for rising in the interest rates. The
investment returns is impacted from a market bank bill that is known such as
LIBOR plus a fixed spread. The underlying investment continues to be governed
by the terms and conditions applying to that investment.
A Floor works with a variable rate investment. It helps to protect investors from
decreasing interest rates by setting a minimum interest rate payable on the
investment. That called a minimum interest rate that the strike rate. Buyers in
this protection will pay a premium for getting that right.
In the beginning, the reference rate of the transaction will be set. That rate is a
benchmark interest rate or applies to the base rate for underlying investment.
Moreover, calculation periods are set also. The investor will get the difference
amount between the reference rate and the strike rate for a calculation period.
It means when the strike rate change will impact to the amount the investor
receives. Moreover, the effective based for the calculation period become the
strike price when the amount is offset. If the strike rate is less than the
reference rate for a calculation period, the investor will get or pay nothing for

Page | 12
that calculation period and the base interest rate applicable to the underlying
investment will be the rate applying under the agreed terms of the investment.
The payoff diagram of full underlying investment in Floor contract is shown
below.
For the premium of the floor rate, the issuer computes based on the
transaction basis at the time a investor need to protect the interest rate risk.
There are various factors relevant the premium calculation such including with
strike rate, notional amount, reference rate, term and the reset dates selected,
current market interest rates, and market volatility. The changing in these
parameters will influence the value of the Floor price, rate and premium as well.
For example, the Floor price will go up when the strike rate increases as same
as the market volatility.
For calculation the premium or the value of floor, we consider Floorlet as a
European put on
the preferred reference rate with deferred payment of the payoff, the payoff at
time ti (i=1,2,…,n ) is given by:
Since call, considering the floorlet as a European call on a zero-coupon bond,
we will get that the value of the ith floorlet at time ti-δ is:
Page | 13
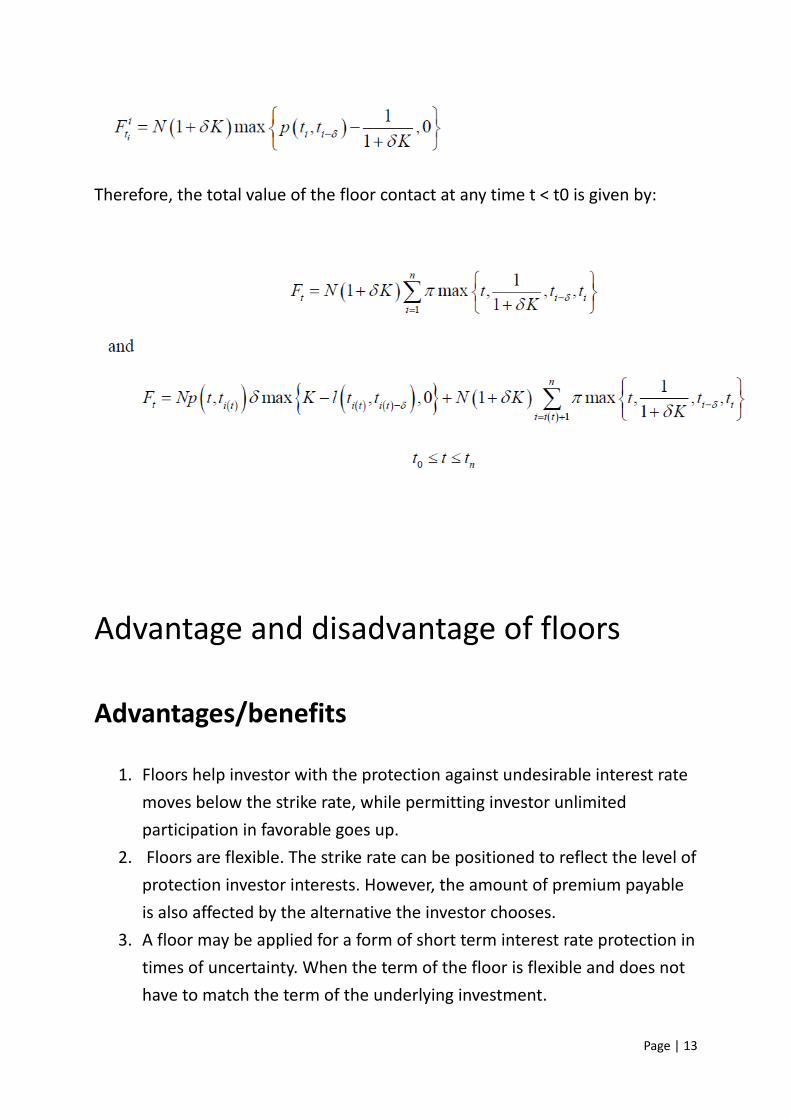
Therefore, the total value of the floor contact at any time t < t0 is given by:
Advantage and disadvantage of floors
Advantages/benefits 1. Floors help investor with the protection against undesirable interest rate
moves below the strike rate, while permitting investor unlimited
participation in favorable goes up.
2. Floors are flexible. The strike rate can be positioned to reflect the level of
protection investor interests. However, the amount of premium payable
is also affected by the alternative the investor chooses.
3. A floor may be applied for a form of short term interest rate protection in
times of uncertainty. When the term of the floor is flexible and does not
have to match the term of the underlying investment.
Page | 14
4. Floors allow for cancelation out without returnable premiums
5. The protection afforded can apply to any investment with similar
commercial terms, since a floor does not form in part of the underlying
investment,
6. The cost for floors is limited to the premium paid.
Disadvantages/risks
1. The premium is not allowed to refund in any cases including in the
situations where the reference rate always exceeds the strike rate and no
payments are happened.
2. When the term of the floor is shorter than that of the underlying
investment, the investor will be uncovered to interest rate movements

Page | 15
Binomial Tree Model
The binomial model breaks down the time to expiration into potentially a very
large number of time intervals, or steps. A tree of stock prices is originally
produced working forward from the present to expiration. At each step it is
assumed that the stock price will move up or down by an amount calculated
applying volatility and time to expiration. This produces a binomial distribution
tree of underlying stock prices or interest rate –short rate or forward rate (relies
on the point you are interested). The tree represents all the possible paths that
the stock price or interest rate could occur during the life of the option.
At the end of the tree – i.e. at expiration of the option -- all the terminal option
prices for each of the final possible stock prices are known as they simply equal
their intrinsic values.
For our case, a binomial tree is constructed for the forward or short rate in such
a way that the tree automatically returns the observed yield function and the
volatility of different yields. The model is explained by a stochastic differential
equation where the rates are log-normally distributed. Thus, the interest rates
cannot be negative.
The Black-Derman-Toy model is a single-factor short-rate model matching the
observed term structure of forward rate volatilities, as well as the term
structure of the interest rate. One of the main advantages of the Black-Derman-
Toy model is that it is a lognormal model that is able to capture a realistic term
structure of the interest rate volatilities.
Due to the property of Brownian motions, we have:
where the values

Page | 16
is used to build the tree. From the above discussion, a fixed spacing, Zi between
the nodes in the binomial tree is defined as (εmax – εmin = 2):
where σ is the volatility at time t. The risk-neutral probabilities of the binomial
branches of this model are assumed equal to ½. The tree uses the short-rate
annual volatility σ, of the benchmark rates which should be given in the Black-
Scholes framework.
When the tree is built, the volatility spread factors, Zi are kept constant and the
tree is built with the following relation between the nodes:
where f 1,1 = f1 This results in the following tree:
where the rates is given by:

Page | 17
Generally the rates are expressed as:
In this example the volatility is constant for simplicity. Generally, the volatility
will change by time.
Relationship to the Black-Scholes model The same fundamental assumptions concerning stock prices support both the
binomial and Black-Scholes models: that stock prices follow a stochastic process
described by geometric brownian motion. As a result, the binomial model
provides discrete approximations to the continuous process underlying the
Black-Scholes model.
Whilst the Cox, Ross & Rubinstein binomial model and the Black-Scholes model
ultimately converge as the number of time steps gets infinitely large and the
length of each step gets infinitesimally small this convergence, except for at-
the-money options, is anything but smooth or uniform.
Page | 18
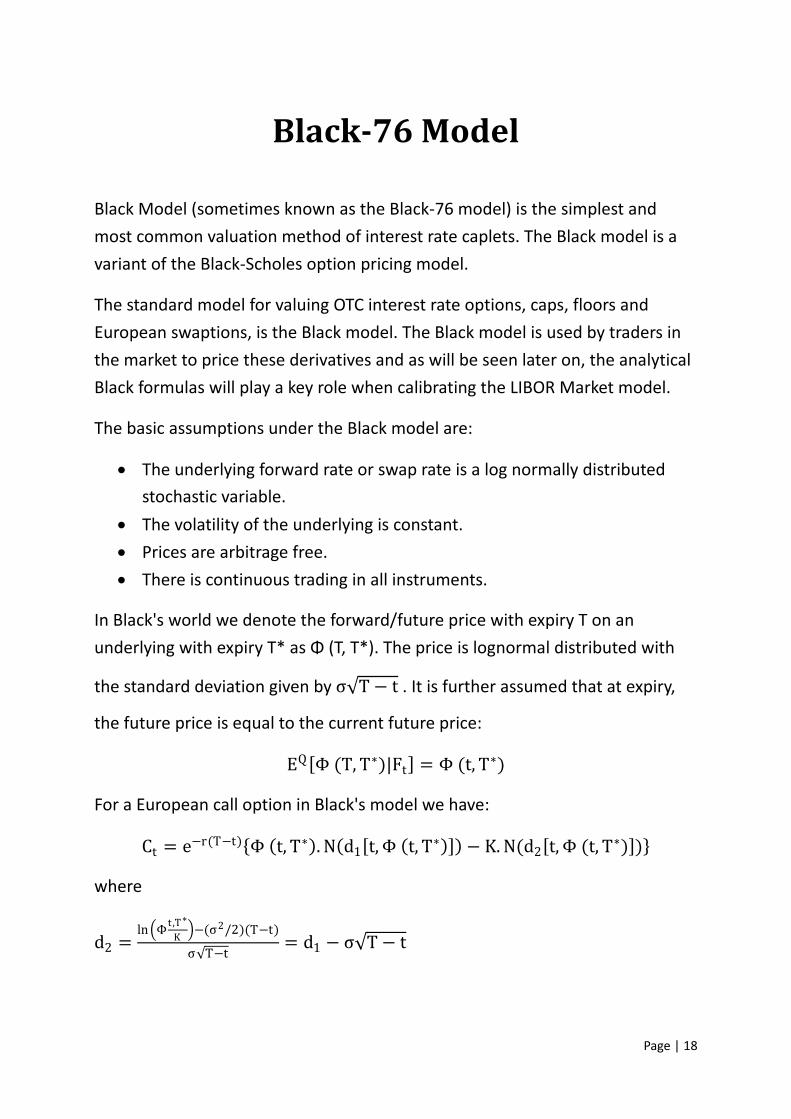
Black-76 Model
Black Model (sometimes known as the Black-76 model) is the simplest and
most common valuation method of interest rate caplets. The Black model is a
variant of the Black-Scholes option pricing model.
The standard model for valuing OTC interest rate options, caps, floors and
European swaptions, is the Black model. The Black model is used by traders in
the market to price these derivatives and as will be seen later on, the analytical
Black formulas will play a key role when calibrating the LIBOR Market model.
The basic assumptions under the Black model are:
• The underlying forward rate or swap rate is a log normally distributed
stochastic variable.
• The volatility of the underlying is constant.
• Prices are arbitrage free.
• There is continuous trading in all instruments.
In Black's world we denote the forward/future price with expiry T on an
underlying with expiry T* as Φ (T, T*). The price is lognormal distributed with
the standard deviation given by σ√T − t . It is further assumed that at expiry,
the future price is equal to the current future price:
EQ [Φ (T, T∗)|Ft] = Φ (t, T∗)
For a European call option in Black's model we have:
Ct = e−r(T−t){Φ (t, T∗). N(d1[t,Φ (t, T∗)]) − K. N(d2[t,Φ (t, T∗)])}
where
d2 =ln�Φt ,T∗
K �−(σ2/2)(T−t)
σ√T−t= d1 − σ√T − t

Page | 19
Numerical work and its Application
We have created a java application based on the Black model. As you can see, there’s several windows where you can input the data you want. You can set up the spot rate, risk-free rate, the face value of your caps&floors, the volatility and the Start date of your contract ( note it has to set up with the form “yyyy-mm-dd”).
In order to find the forward rate, we must read the data from a given Excel file. Therefore, we first import the jxl package so that java can read the Excel file:

Page | 20
Note: We use Green letters to explain the important link of our java application:
import jxl.Workbook;
import java.io.*;
import java.util.*;
import java.text.SimpleDateFormat;
After that we read the Excel file :
Workbook workbook = Workbook.getWorkbook(new File(
"C:\\Users\\lwt\\Documents\\NetBeansProjects"
+ "\\ReadExcel\\src\\readexcel\\YieldCurves8nov.xls"));
jxl.Sheet m = workbook.getSheet(0);
String Sday[] = new String[45];
String Eday[] = new String[45];
double days[] = new double[44];
double rate[] = new double[45];
Date d1[] =new Date[44];
Date d2[] =new Date[44];
Date dateIm;
for(i=0;i<45;i++){
jxl.Cell n = m.getCell(9,i+3);
Sday[i]=n.getContents();
jxl.Cell l = m.getCell(10,i+3);
Eday[i]=l.getContents();
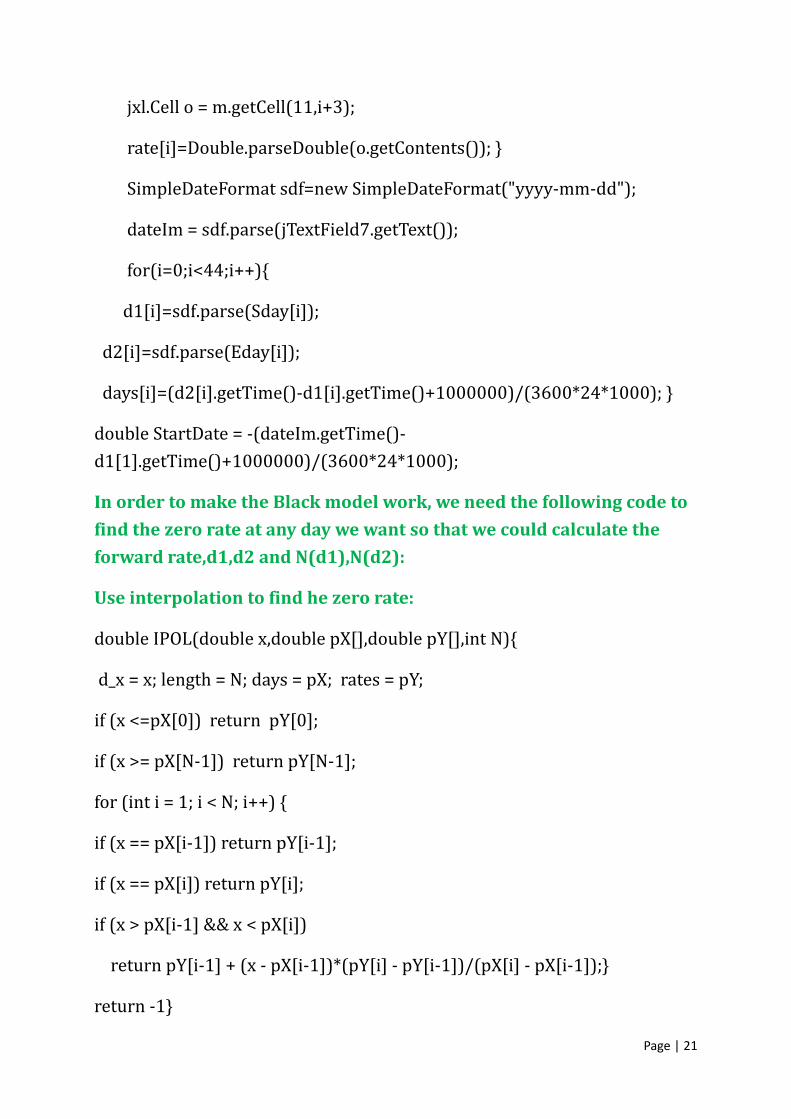
Page | 21
jxl.Cell o = m.getCell(11,i+3);
rate[i]=Double.parseDouble(o.getContents()); }
SimpleDateFormat sdf=new SimpleDateFormat("yyyy-mm-dd");
dateIm = sdf.parse(jTextField7.getText());
for(i=0;i<44;i++){
d1[i]=sdf.parse(Sday[i]);
d2[i]=sdf.parse(Eday[i]);
days[i]=(d2[i].getTime()-d1[i].getTime()+1000000)/(3600*24*1000); }
double StartDate = -(dateIm.getTime()-d1[1].getTime()+1000000)/(3600*24*1000);
In order to make the Black model work, we need the following code to
find the zero rate at any day we want so that we could calculate the
forward rate,d1,d2 and N(d1),N(d2):
Use interpolation to find he zero rate:
double IPOL(double x,double pX[],double pY[],int N){
d_x = x; length = N; days = pX; rates = pY;
if (x <=pX[0]) return pY[0];
if (x >= pX[N-1]) return pY[N-1];
for (int i = 1; i < N; i++) {
if (x == pX[i-1]) return pY[i-1];
if (x == pX[i]) return pY[i];
if (x > pX[i-1] && x < pX[i])
return pY[i-1] + (x - pX[i-1])*(pY[i] - pY[i-1])/(pX[i] - pX[i-1]);}
return -1}

Page | 22
Calculate the forward rate:
double forwardRate(int Days1, double r_t1, int Days2, double r_t2)
{return Math.pow((Math.pow(1.0 + r_t2, Days2/365.0))/
(Math.pow(1.0 + r_t1, Days1/365.0)), 365.0/(Days2 - Days1)) - 1.0;}
Calculate N(d1) and N(d2):
double Nd1(double forward,double strike,double volatility,double T) throws MathException{
double d1 = ((Math.log(forward / strike)) + (volatility * volatility / 2) * T) / (volatility * Math.sqrt(T));
NormalDistributionImpl a = new NormalDistributionImpl();
return a.cumulativeProbability(d1);}
double Nd2(double forward,double strike,double volatility,double T) throws MathException{
double d2 = ((Math.log(forward / strike)) - (volatility * volatility / 2) * T) / (volatility * Math.sqrt(T));
NormalDistributionImpl a = new NormalDistributionImpl();
return a.cumulativeProbability(d2);}

Page | 23
Finally, we have the code to implement the Black mode and calculate
the value of each Caplets&Floorlets:
double BlackCaplet(double forward,double faceVal,double strike,double volatility,double rf,double T,double PeriodLength) throws MathException{
double d1 = ((Math.log(forward / strike)) + (volatility * volatility / 2) * T) / (volatility * Math.sqrt(T));
double d2 = ((Math.log(forward / strike)) - (volatility * volatility / 2) * T) / (volatility * Math.sqrt(T));
NormalDistributionImpl a = new NormalDistributionImpl();
double Nd1 = a.cumulativeProbability(d1);
double Nd2 = a.cumulativeProbability(d2);
double td = PeriodLength/365;
return ((faceVal * td) / (1 + (forward * td))) * Math.exp(-rf * T) * ((forward * Nd1) - (strike *Nd2));}
double BlackFloorlet(double forward,double faceVal,double strike,double volatility,double rf,double T,double PeriodLength) throws MathException{
double d1 = ((Math.log(forward / strike)) + (volatility * volatility / 2) * T) / (volatility * Math.sqrt(T));
double d2 = ((Math.log(forward / strike)) - (volatility * volatility / 2) * T) / (volatility * Math.sqrt(T));
NormalDistributionImpl a = new NormalDistributionImpl();
double Nd1 = a.cumulativeProbability(d1);
double Nd2 = a.cumulativeProbability(d2);
double td = PeriodLength/365;
return ((faceVal * td) / (1 + (forward * td))) * Math.exp(-rf * T) * ((strike * (1 -Nd2) - (forward * (1 - Nd1))));}

Page | 24
The above code is the main part our written codes, these codes are enough to show how we combine the theoretical knowledge in the previous sections of this report with our java knowledge. All the outcomes will be shown in the way of java swing.
Through the java swing, you will see we could successfully valuing caps and floors based on the Black-Model, and please notice this Calculation tool that we had create could help everyone to use the Swap Rate to get Caps and
Floors at different levels.

Page | 25
Conclusion Since the interest rate risk exists in the changing of the asset value from the variability of interest rate. The important of interest rate become very significant since several financial instruments have been developed to deal with the interest rate. Caps and Floor are one of the essential tools for managing the interest rate risk. For sellers of Caps and Floor, no risk is encounter in this position while the buyers face the risk coming from the non performance of that contract as the strike rate. Moreover the buyers face the risk from the default risk of the seller also from the interest rates fluctuation. Understanding the pros and cons for each financial instrument will help the investors to protect the risk may be occurred suitable.

Page | 26
Reference
1. Internet
[1]http://en.wikipedia.org/wiki/Interest_rate_cap_and_floor last
visited 11:00am, 15th December, 2010
[2] http://www.stgeorge.com.au/corporate-business/institutional-
financial-markets/treasury-investments/floorsfaq last visited
11:20am, 15th December, 2010
2. Literature
Jan R. M. Röman, Lecture notes in Analytical Finance I Jan R. M. Röman, Lecture notes in Analytical Finance II

Page | 27


