3 Capture of CO 2 Coordinating Lead Authors Kelly (Kailai) Thambimuthu (Australia and Canada), Mohammad Soltanieh (Iran), Juan Carlos Abanades (Spain) Lead Authors Rodney Allam (United Kingdom), Olav Bolland (Norway), John Davison (United Kingdom), Paul Feron (The Netherlands), Fred Goede (South Africa), Alyce Herrera (Philippines), Masaki Iijima (Japan), Daniël Jansen (The Netherlands), Iosif Leites (Russian Federation), Philippe Mathieu (Belgium), Edward Rubin (United States), Dale Simbeck (United States), Krzysztof Warmuzinski (Poland), Michael Wilkinson (United Kingdom), Robert Williams (United States) Contributing Authors Manfred Jaschik (Poland), Anders Lyngfelt (Sweden), Roland Span (Germany), Marek Tanczyk (Poland) Review Editors Ziad Abu-Ghararah (Saudi Arabia), Tatsuaki Yashima (Japan)
Transcript
Chapter 3: Capture of CO2 105
3Capture of CO2
Coordinating Lead AuthorsKelly (Kailai) Thambimuthu (Australia and Canada), Mohammad Soltanieh (Iran), Juan Carlos Abanades (Spain)
Lead AuthorsRodney Allam (United Kingdom), Olav Bolland (Norway), John Davison (United Kingdom), Paul Feron (The Netherlands), Fred Goede (South Africa), Alyce Herrera (Philippines), Masaki Iijima (Japan), Daniël Jansen (The Netherlands), Iosif Leites (Russian Federation), Philippe Mathieu (Belgium), Edward Rubin (United States), Dale Simbeck (United States), Krzysztof Warmuzinski (Poland), Michael Wilkinson (United Kingdom), Robert Williams (United States)
Contributing AuthorsManfred Jaschik (Poland), Anders Lyngfelt (Sweden), Roland Span (Germany), Marek Tanczyk (Poland)
106 IPCC Special Report on Carbon dioxide Capture and Storage
Contents
ExECutivE SummARy 107
3.1 introduction 1083.1.1 The basis for CO2 capture 1083.1.2 CO2 capture systems 1083.1.3 Types of CO2 capture technologies 1093.1.4 Application of CO2 capture 110
3.2 industrial process capture systems 1113.2.1 Introduction 1113.2.2 Natural gas sweetening 1113.2.3 Steel production 1123.2.4 Cement production 1133.2.5 Ammonia production 1133.2.6 Status and outlook 113
3.3 Post-combustion capture systems 1133.3.1 Introduction 1133.3.2 Existing technologies 1143.3.3 Emerging technologies 1183.3.4 Status and outlook 121
3.4 Oxy-fuel combustion capture systems 1223.4.1 Introduction 1223.4.2 Oxy-fuel indirect heating - steam cycle 1223.4.3 Oxy-fuel direct heating - gas turbine cycle 1253.4.4 Oxy-fuel direct heating - steam turbine cycle 1263.4.5 Techniques and improvements in oxygen
production 1273.4.6 Chemical looping combustion 1293.4.7 Status and outlook 130
3.5 Pre-combustion capture systems 1303.5.1 Introduction 1303.5.2 Existing technologies 1303.5.3 Emerging technologies 1363.5.4 Enabling technologies 1383.5.5 Status and outlook 140
3.6 Environmental, monitoring, risk and legal aspects of capture systems 141
3.6.1 Emissions and resource use impacts of CO2 capture systems 141
3.6.2 Issuesrelatedtotheclassificationofcarbon dioxide as a product 145
3.6.3 Health and safety risks associated with carbon dioxide processing 145
3.6.4 Plant design principles and guidelines used by governments,industriesandfinanciers 145
3.6.5 Commissioning, good practice during operations and sound management of chemicals 146
3.6.6 Site closure and remediation 146
3.7 Cost of CO2 capture 1463.7.1 Factors affecting CO2 capture cost 1463.7.2 Measures of CO2 capture cost 1473.7.3 The context for current cost estimates 1493.7.4 Overview of technologies and systems evaluated 1503.7.5 Post-combustion CO2 capture cost for electric
power plants (current technology) 1503.7.6 Pre-combustion CO2 capture cost for electric
power plants (current technology) 1553.7.7 CO2 capture cost for hydrogen production and
multi-product plants (current technology) 1583.7.8 Capture costs for other industrial processes
(current technology) 1613.7.9 Outlook for future CO2 capture costs 1633.7.10 CO2 capture costs for electric power plants
(advanced technology) 1633.7.11 CO2 capture costs for hydrogen production and
multi-product plants (advanced technology) 1663.7.12 CO2 capture costs for other industrial processes
(advanced technology) 1683.7.13 Summary of CO2 capture cost estimates 168
3.8 Gaps in knowledge 170
References 171
Chapter 3: Capture of CO2 107
ExECutivE SummARy
The purpose of CO2 capture is to produce a concentrated stream that can be readily transported to a CO2 storage site. CO2 capture and storage is most applicable to large, centralized sources like power plants and large industries. Capture technologies also open the way for large-scale production of low-carbon or carbon-free electricity and fuels for transportation, as well as for small-scale or distributed applications. The energy required to operate CO2capturesystemsreducestheoverallefficiencyofpower generation or other processes, leading to increased fuel requirements, solid wastes and environmental impacts relative to the same type of base plant without capture. However, as moreefficientplantswithcapturebecomeavailableandreplacemany of the older less efficient plants now in service, thenet impacts will be compatible with clean air emission goals for fossil fuel use. Minimization of energy requirements for capture,togetherwithimprovementsintheefficiencyofenergyconversion processes will continue to be high priorities for future technology development in order to minimize overall environmental impacts and cost. At present, CO2 is routinely separated at some large industrial plants such as natural gas processing and ammonia production facilities, although these plants remove CO2 to meet process demands and not for storage. CO2 capture also has been applied to several small power plants. However, there have been no applications at large-scale power plants of several hundred megawatts, the major source of current and projected CO2 emissions. There are three main approaches to CO2 capture, for industrial and power plant applications. Post-combustion systems separate CO2fromthefluegasesproducedby combustion of a primary fuel (coal, natural gas, oil or biomass) in air. Oxy-fuel combustion uses oxygen instead of airforcombustion,producingafluegasthatismainlyH2O and CO2 and which is readily captured. This is an option still under development. Pre-combustion systems process the primary fuel in a reactor to produce separate streams of CO2 for storage and H2 which is used as a fuel. Other industrial processes, including processes for the production of low-carbon or carbon-free fuels, employ one or more of these same basic capture methods. The monitoring, risk and legal aspects associated with CO2 capture systems appear to present no new challenges, as they are all elements of long-standing health, safety and environmental control practice in industry. For all of the aforementioned applications, we reviewed recent studies of the performance and cost of commercial or near-commercial technologies, as well as that of newer CO2 capture concepts that are the subject of intense R&D efforts worldwide. For power plants, current commercial CO2 capture systems can reduce CO2 emissions by 80-90% kWh-1 (85-95% capture efficiency). Across all plant types the cost ofelectricity production (COE) increases by 12-36 US$ MWh-1 (US$ 0.012-0.036 kWh-1) over a similar type of plant without capture, corresponding to a 40-85% increase for a supercritical pulverized coal (PC) plant, 35-70% for a natural gas combined cycle(NGCC)plantand20-55%foranintegratedgasification
combined cycle (IGCC) plant using bituminous coal. Overall the COE for fossil fuel plants with capture, ranges from 43-86 US$ MWh-1, with the cost per tonne of CO2 ranging from 11-57 US$/tCO2 captured or 13-74 US$/tCO2 avoided (depending on plant type, size, fuel type and a host of other factors). These costs include CO2 compression but not additional transport and storage costs. NGCC systems typically have a lower COE than new PC and IGCC plants (with or without capture) for gas prices below about 4 US$ GJ-1. Most studies indicate that IGCC plants are slightly more costly without capture and slightly less costly with capture than similarly sized PC plants, but the differences in cost for plants with CO2 capture can vary with coal type and other local factors. The lowest CO2 capture costs (averaging about 12 US$/t CO2 captured or 15 US$/tCO2 avoided) were found for industrial processes such as hydrogen production plants that produce concentrated CO2 streams as part of the current production process; such industrial processes may represent some of the earliest opportunities for CO2 Capture and Storage (CCS). In all cases, CO2 capture costs are highly dependent upon technical, economic and financial factorsrelated to the design and operation of the production process or power system of interest, as well as the design and operation of the CO2 capture technology employed. Thus, comparisons of alternative technologies, or the use of CCS cost estimates, requireaspecificcontexttobemeaningful. New or improved methods of CO2 capture, combined with advanced power systems and industrial process designs, can significantly reduceCO2 capture costs and associated energy requirements. While there is considerable uncertainty about the magnitude and timing of future cost reductions, this assessment suggests that improvements to commercial technologies can reduce CO2 capture costs by at least 20-30% over approximately the next decade, while new technologies under development promise more substantial cost reductions. Realization of future cost reductions, however, will require deployment and adoption of commercial technologies in the marketplace as well as sustained R&D.
108 IPCC Special Report on Carbon dioxide Capture and Storage
3.1 introduction
3.1.1 ThebasisforCO2capture
The main application of CO2 capture is likely to be at large point sources: fossil fuel power plants, fuel processing plants and other industrial plants, particularly for the manufacture of iron, steel, cement and bulk chemicals, as discussed in Chapter 2. Capturing CO2 directly from small and mobile sources in the transportation and residential & commercial building sectors is expectedtobemoredifficultandexpensivethanfromlargepointsources. Small-scale capture is therefore not further discussed in this chapter. An alternative way of avoiding emissions of CO2 from these sources would be by use of energy carriers such as hydrogen or electricity produced in large fossil fuel-based plants with CO2 capture or by using renewable energy sources. Production of hydrogen with CO2 capture is included in this chapter. The possibility of CO2 capture from ambient air (Lackner, 2003) is not discussed in this chapter because the CO2 concentration in ambient air is around 380 ppm, a factor of 100 ormore lower than in flue gas. Capturing CO2 from air by the growth of biomass and its use in industrial plants with CO2 capture is more cost-effective based on foreseeable technologies, and is included in this chapter. In an analysis of possible future scenarios for anthropogenic greenhouse-gas emissions it is implicit that technological innovations will be one of the key factors which determines our future path (Section 2.5.3). Therefore this chapter deals not
only with application of existing technology for CO2 capture, but describes many new processes under development which may result in lower CO2 capture costs in future.
3.1.2 CO2capturesystems
There are four basic systems for capturing CO2 from use of fossil fuels and/or biomass:• Capture from industrial process streams (described in
Section 3.2);• Post-combustion capture (described in Section 3.3);• Oxy-fuel combustion capture (described in Section 3.4); • Pre-combustion capture (described in Section 3.5).
ThesesystemsareshowninsimplifiedforminFigure3.1.
3.1.2.1 Capture from industrial process streamsCO2 has been captured from industrial process streams for 80 years (Kohl and Nielsen, 1997), although most of the CO2 that is captured is vented to the atmosphere because there is no incentive or requirement to store it. Current examples of CO2 capture from process streams are purification of naturalgas and production of hydrogen-containing synthesis gas for the manufacture of ammonia, alcohols and synthetic liquid fuels. Most of the techniques employed for CO2 capture in the examples mentioned are also similar to those used in pre-combustion capture. Other industrial process streams which are a source of CO2 that is not captured include cement and steel production, and fermentation processes for food and drink production. CO2 could be captured from these streams using
Figure 3.1 CO2 capture systems (adapted from BP).
Chapter 3: Capture of CO2 109
techniques that are common to post-combustion capture, oxy-fuel combustion capture and pre-combustion capture (see below and Section 3.2).
3.1.2.2 Post-combustion captureCapture of CO2 from flue gases produced by combustion offossil fuels and biomass in air is referred to as post-combustion capture. Instead of being discharged directly to the atmosphere, fluegasispassedthroughequipmentwhichseparatesmostofthe CO2. The CO2 is fed to a storage reservoir and the remaining fluegas is discharged to the atmosphere.A chemical sorbentprocess as described in Section 3.1.3.1 would normally be used for CO2 separation. Other techniques are also being considered but these are not at such an advanced stage of development. Besides industrial applications, the main systems of reference for post-combustion capture are the current installed capacity of 2261 GWe of oil, coal and natural gas power plants (IEA WEO, 2004) and in particular, 155 GWe of supercritical pulverizedcoalfiredplants(IEACCC,2005)and339GWe of natural gas combined cycle (NGCC) plants, both representing thetypesofhighefficiencypowerplanttechnologywhereCO2 capture can be best applied (see Sections 3.3 and 3.7).
3.1.2.3 Oxy-fuel combustion captureIn oxy-fuel combustion, nearly pure oxygen is used for combustioninsteadofair,resultinginafluegasthatismainlyCO2 and H2O. If fuel is burnt in pure oxygen, the flametemperature is excessively high, but CO2 and/or H2O-rich flue gas can be recycled to the combustor to moderate this.Oxygen is usually produced by low temperature (cryogenic) air separation and novel techniques to supply oxygen to the fuel, such as membranes and chemical looping cycles are being developed. The power plant systems of reference for oxy-fuel combustion capture systems are the same as those noted above for post-combustion capture systems.
3.1.2.4 Pre-combustion capturePre-combustion capture involves reacting a fuel with oxygen or air and/or steam to give mainly a ‘synthesis gas (syngas)’ or ‘fuel gas’ composed of carbon monoxide and hydrogen. The carbon monoxide is reacted with steam in a catalytic reactor, called a shift converter, to give CO2 and more hydrogen. CO2 is then separated, usually by a physical or chemical absorption process, resulting in a hydrogen-rich fuel which can be used in many applications, such as boilers, furnaces, gas turbines, engines and fuel cells. These systems are considered to be strategically important (see Section 3.5) but the power plant systems of reference today are 4 GWe of both oil and coal-based, integrated gasification combined cycles (IGCC) which arearound 0.1% of total installed capacity worldwide (3719 GWe; IEA WEO, 2004). Other reference systems for the application of pre-combustion capture include substantially more capacity thanthatidentifiedaboveforIGCCinexistingnaturalgas,oiland coal-based syngas/hydrogen production facilities and other types of industrial systems described in more detail in Sections 3.2 and 3.5.
3.1.3 TypesofCO2capturetechnologies
CO2 capture systems use many of the known technologies for gas separation which are integrated into the basic systems for CO2captureidentifiedinthelastsection.Asummaryoftheseseparation methods is given below while further details are available in standard textbooks.
3.1.3.1 Separation with sorbents/solventsThe separation is achieved by passing the CO2-containing gas in intimate contact with a liquid absorbent or solid sorbent that is capable of capturing the CO2. In the general scheme of Figure 3.2a, the sorbent loaded with the captured CO2 is transported to a different vessel, where it releases the CO2 (regeneration) after being heated, after a pressure decrease or after any other change in the conditions around the sorbent. The sorbent resulting after the regeneration step is sent back to capture more CO2 in a cyclic process. In some variants of this scheme the sorbent is a solid and does not circulate between vessels because the sorption and regeneration are achieved by cyclic changes (in pressure or temperature) in the vessel where the sorbent is contained. A make-upflowoffreshsorbentisalwaysrequiredtocompensatefor the natural decay of activity and/or sorbent losses. In some situations, the sorbent may be a solid oxide which reacts in a vessel with fossil fuel or biomass producing heat and mainly CO2 (see Section 3.4.6). The spent sorbent is then circulated to a second vessel where it is re-oxidized in air for reuse with some loss and make up of fresh sorbent. The general scheme of Figure 3.2 governs many important CO2 capture systems, including leading commercial options like chemical absorption and physical absorption and adsorption. Other emerging processes based on new liquid sorbents, or new solid regenerable sorbents are being developed with the aim of overcoming the limitations of the existing systems. One common problem of these CO2 capture systems is that theflowofsorbentbetweenthevesselsofFigure3.2aislargebecauseithastomatchthehugeflowofCO2 being processed in the power plant. Therefore, equipment sizes and the energy required for sorbent regeneration are large and tend to translate into an important efficiencypenalty and added cost.Also, insystems using expensive sorbent materials there is always a danger of escalating cost related to the purchase of the sorbent and the disposal of sorbent residues. Good sorbent performance under high CO2 loading in many repetitive cycles is obviously a necessary condition in these CO2 capture systems.
3.1.3.2 Separation with membranesMembranes (Figure 3.2b) are specially manufactured materials that allow the selective permeation of a gas through them. The selectivity of the membrane to different gases is intimately relatedtothenatureofthematerial,buttheflowofgasthroughthe membrane is usually driven by the pressure difference across the membrane. Therefore, high-pressure streams are usually preferred for membrane separation. There are many different types of membrane materials (polymeric, metallic, ceramic) thatmayfindapplication inCO2 capture systems to
110 IPCC Special Report on Carbon dioxide Capture and Storage
preferentially separate H2 from a fuel gas stream, CO2 from a range of process streams or O2 from air with the separated O2 subsequently aiding the production of a highly concentrated CO2stream.Althoughmembraneseparationfindsmanycurrentcommercial applications in industry (some of a large scale, like CO2 separation from natural gas) they have not yet been applied for the large scale and demanding conditions in terms of reliability and low-cost required for CO2 capture systems. A large worldwide R&D effort is in progress aimed at the manufacture of more suitable membrane materials for CO2 capture in large-scale applications.
A gas can be made liquid by a series of compression, cooling and expansion steps. Once in liquid form, the components of the gas can be separated in a distillation column. In the case of air, this operation is currently carried out commercially on a large scale. Oxygen can be separated from air following the scheme of Figure 3.2c and be used in a range of CO2 capture systems (oxy-fuel combustion and pre-combustion capture). As in the previous paragraphs, the key issue for these systems is
thelargeflowofoxygenrequired.Refrigeratedseparationcanalso be used to separate CO2 from other gases. It can be used to separate impurities from relatively high purity CO2 streams, for example, from oxy-fuel combustion and for CO2 removal from natural gas or synthesis gas that has undergone a shift conversion of CO to CO2.
3.1.4 ApplicationofCO2capture
The CO2 capture systems shown in Figure 3.1 can be cross-referenced with the different separation technologies of Figure 3.2, resulting in a capture toolbox. Table 3.1 gives an overview of both current and emerging technologies in this toolbox. In the next sections of this chapter a more detailed description of all these technological options will be given, with more emphasis on the most developed technologies for which the CO2 capture cost can be estimated most reliably. These leading commercial options are shown in bold in Table 3.1. An overview of the diverse range of emerging options being investigated worldwide for CO2 capture applications will also be provided. All of these optionsareaimedatmoreefficientandlowercostCO2-capture systems (compared with the leading options). It is important
Figure 3.2 General schemes of the main separation processes relevant for CO2 capture. The gas removed in the separation may be CO2, H2 or O2. In Figures 3.2b and 3.2c one of the separated gas streams (A and B) is a concentrated stream of CO2, H2 or O2 and the other is a gas stream with all the remaining gases in the original gas (A+B).
Chapter 3: Capture of CO2 111
to understand that this wide variety of approaches for CO2 capturewill tend to settlewith time as the expected benefits(and potential weaknesses) in the technological portfolio of Table 3.1 becomes obvious with new results from current and future research and demonstration projects. Only a few of these options will prove truly cost-effective in the medium to long term. CO2 capture may be installed in new energy utilization plantsor itmaybe retrofitted toexistingplants. Inprinciple,if CO2 capture is to be introduced rapidly, it may have to be retrofittedtosomeexistingplantsortheseplantswouldhavetobe retired prematurely and replaced by new plants with capture. Disadvantagesofretrofitsare:• There may be site constraints such as availability of land for
the capture equipment; • A long remaining plant life may be needed to justify the
large expense of installing capture equipment;• Oldplantstendtohavelowenergyefficiencies.Including
CO2 capture will have a proportionally greater impact on the netoutputthaninhighefficiencyplants.
To minimize the site constraints, new energy utilization plants could be built ‘capture-ready’, that is with the process design initially factoring in the changes necessary to add capture and with sufficient space and facilitiesmade available for simpleinstallation of CO2 capture at a later date. For some types of captureretrofit,forexamplepre-combustioncaptureandoxy-fuelcombustion,muchoftheretrofitequipmentcouldbebuilton a separate site if necessary. The other barriers could be largely overcome by upgrading or substantially rebuilding the existing plant when capture is retrofitted.Forexample,oldinefficientboilersandsteamturbinescould be replaced by modern, high-efficiency supercriticalboilers and turbines or IGCC plants. As the efficiencies ofpowergenerationtechnologiesareincreasing,theefficiencyoftheretrofittedplantwithCO2 capture could be as high as that of the original plant without capture.
3.2 industrial process capture systems
3.2.1 Introduction
There are several industrial applications involving process streams where the opportunity exists to capture CO2 in large quantities and at costs lower than from the systems described in the rest of this chapter. Capture from these sources will not be the complete answer to the needs of climate change, since the volumes of combustion-generated CO2 are much higher, butitmaywellbetheplacewherethefirstcaptureandstorageoccurs.
3.2.2 Naturalgassweetening
Natural gas contains different concentration levels of CO2, depending on its source, which must be removed. Often pipeline specificationsrequirethattheCO2 concentration be lowered to ta
ble
3.1
Cap
ture
tool
box.
Sepa
ratio
n ta
skPr
oces
s str
eam
saPo
st-c
ombu
stio
n ca
ptur
eO
xy-fu
el c
ombu
stio
n ca
ptur
ePr
e-co
mbu
stio
n ca
ptur
e
CO
2/CH
4C
O2/N
2O
2/N2
CO
2/H2
Cap
ture
te
chno
logi
esC
urre
ntEm
ergi
ngC
urre
ntEm
ergi
ngC
urre
ntEm
ergi
ngC
urre
ntEm
ergi
ng
Solv
ents
(A
bsor
ptio
n)Ph
ysic
al so
lven
ts
Che
mic
al
solv
ents
Impr
oved
sol
vent
sN
ovel
con
tact
ing
equi
pmen
tIm
prov
ed d
esig
n of
pr
oces
ses
Che
mic
al
solv
ents
Impr
oved
sol
vent
sN
ovel
con
tact
ing
equi
pmen
tIm
prov
ed d
esig
n of
pr
oces
ses
n. a
.B
iom
imet
ic s
olve
nts,
e.g.
hem
oglo
bine
-de
rivat
ives
Phys
ical
solv
ent
Che
mic
al so
lven
tsIm
prov
ed c
hem
ical
sol
vent
sN
ovel
con
tact
ing
equi
pmen
tIm
prov
ed d
esig
n of
pro
cess
es
mem
bran
esPo
lym
eric
Cer
amic
Faci
litat
ed tr
ansp
ort
Car
bon
Con
tact
ors
Poly
mer
icC
eram
icFa
cilit
ated
tran
spor
tC
arbo
nC
onta
ctor
s
Poly
mer
icIo
n tra
nspo
rt m
embr
anes
Faci
litat
ed tr
ansp
ort
Poly
mer
icC
eram
icPa
lladi
umR
eact
ors
Con
tact
ors
Solid
sorb
ents
Zeol
ites
Act
ivat
ed c
arbo
nZe
olite
sA
ctiv
ated
ca
rbon
Car
bona
tes
Car
bon
base
d so
rben
ts
Zeol
ites
Act
ivat
ed
carb
on
Ads
orbe
nts
for O
2/N2
sepa
ratio
n,
Pero
vski
tes
Oxy
gen
chem
ical
lo
opin
g
Zeol
ites
Act
ivat
ed c
arbo
nA
lum
ina
Car
bona
tes
Hyd
rota
lcite
sSi
licat
es
Cry
ogen
icRy
an-H
olm
es
proc
ess
Liqu
efac
tion
Hyb
rid p
roce
sses
Dist
illat
ion
Impr
oved
dis
tilla
tion
Liqu
efac
tion
Hyb
rid p
roce
sses
a N
otes
: Pr
oces
ses
show
n in
bol
d ar
e co
mm
erci
al p
roce
sses
that
are
cur
rent
ly p
refe
rred
in m
ost c
ircum
stan
ces.
Som
e pr
oces
s st
ream
s in
volv
e C
O2/H
2 or C
O2/N
2 sep
arat
ions
but
this
is c
over
ed u
nder
pr
e-co
mbu
stio
n ca
ptur
e an
d po
st-c
ombu
stio
n ca
ptur
e. T
he k
ey s
epar
atio
n pr
oces
ses
are
outli
ned
in S
ectio
n 3.
1.3
and
desc
ribed
in S
ectio
ns 3
.2-3
.5.
112 IPCC Special Report on Carbon dioxide Capture and Storage
around 2% by volume (although this amount varies in different places) to prevent pipeline corrosion, to avoid excess energy for transport and to increase the heating value of the gas. Whilst accurate figures are published for annual worldwidenatural gas production (BP, 2004), none seem to be published on how much of that gas may contain CO2. Nevertheless, a reasonable assumption is that about half of raw natural gas production contains CO2 at concentrations averaging at least 4% by volume. These figures can be used to illustrate thescale of this CO2 capture and storage opportunity. If half of the worldwide production of 2618.5 billion m3 of natural gas in 2003 is reduced in CO2 content from 4 to 2% mol, the resultant amount of CO2 removed would be at least 50 Mt CO2 yr-1. It is interesting to note that there are two operating natural gas plants capturing and storing CO2, BP’s In Salah plant in Algeria and a Statoil plant at Sleipner in the North Sea. Both capture about 1 MtCO2 yr-1 (see Chapter 5). About 6.5 million tCO2 yr-1 from natural gas sweetening is also currently being used in enhanced oil recovery (EOR) in the United States (Beecy and Kuuskraa, 2005) where in these commercial EOR projects, a large fraction of the injected CO2 is also retained underground (see Chapter 5). Depending on the level of CO2 in natural gas, different processes for natural gas sweetening (i.e., H2S and CO2 removal) are available (Kohl and Nielsen, 1997 and Maddox and Morgan, 1998):• Chemical solvents• Physical solvents• Membranes
Natural gas sweetening using various alkanolamines (MEA, DEA, MDEA, etc.; See Table 3.2), or a mixture of them, is the mostcommonlyusedmethod.TheprocessflowdiagramforCO2 recoveryfromnaturalgasissimilartowhatispresentedforfluegas treatment (see Figure 3.4, Section 3.3.2.1), except that in natural gas processing, absorption occurs at high pressure, with subsequent expansion before the stripper column, where CO2 willbeflashedandseparated.WhentheCO2 concentration in natural gas is high, membrane systems may be more economical. Industrial application of membranes for recovery of CO2 from
natural gas started in the early 1980s for small units, with many design parameters unknown (Noble and Stern, 1995). It is now a well-established and competitive technology with advantages compared to other technologies, including amine treatment in certain cases (Tabe-Mohammadi, 1999). These advantages include lower capital cost, ease of skid-mounted installation, lower energy consumption, ability to be applied in remote areas, especiallyoffshoreandflexibility.
3.2.3 Steelproduction
The iron and steel industry is the largest energy-consuming manufacturing sector in the world, accounting for 10-15% of total industrial energy consumption (IEA GHG, 2000a). Associated CO2 emissions were estimated at 1442 MtCO2 in 1995. Two types of iron- and steel-making technologies are in operation today. The integrated steel plant has a typical capacity of 3-5 Mtonnes yr-1 of steel and uses coal as its basic fuel with, in many cases, additional natural gas and oil. The mini-mill uses electric arc furnaces to melt scrap with a typical output of 1 Mtonnes yr-1 of steel and an electrical consumption of 300-350 kWh tonne-1 steel. Increasingly mini-mills blend direct-reduced iron (DRI) with scrap to increase steel quality. The production of direct-reduced iron involves reaction of high oxygen content iron ore with H2 and CO to form reduced iron plus H2O and CO2. As a result, many of the direct reduction iron processes could capture a pure CO2 stream. An important and growing trend is the use of new iron-making processes, which can use lower grade coal than the coking coals required for blast furnace operation. A good example is the COREX process (von Bogdandy et. al, 1989), which produces a large additional quantity of N2-free fuel gas which can be used in a secondary operation to convert iron ore to iron. Complete CO2 capture from this process should be possible with this arrangement since the CO2 and H2O present in the COREX top gas must be removed to allow the CO plus H2 to be heated and used to reduce iron oxide to iron in the secondary shaft kiln. This process will produce a combination of molten iron and iron with high recovery of CO2 derived from the coal feed to the COREX process.
table 3.2 Common solvents used for the removal of CO2 from natural gas or shifted syngas in pre-combustion capture processes.
Solvent name type Chemical name vendorsRectisol Physical Methanol Lurgi and Linde, Germany
Lotepro Corporation, USAPurisol Physical N-methyl-2-pyrolidone (NMP) Lurgi, GermanySelexol Physical Dimethyl ethers of polyethylene glycol (DMPEG) Union Carbide, USABenfield Chemical Potassium carbonate UOPMEA Chemical Monoethanolamine VariousMDEA Chemical Methyldiethylamine BASF and othersSulfinol Chemical Tetrahydrothiophene 1,1-dioxide (Sulfolane),
an alkaloamine and waterShell
Chapter 3: Capture of CO2 113
Early opportunities exist for the capture of CO2 emissions from the iron and steel industry, such as:• CO2 recovery from blast furnace gas and recycle of CO-rich
top gas to the furnace. A minimum quantity of coke is still required and the blast furnace is fed with a mixture of pure O2 and recycled top gas. The furnace is, in effect, converted from air firing to oxy-fuel firing with CO2 capture (see Section 3.4). This would recover 70% of the CO2 currently emitted from an integrated steel plant (Dongke et al., 1988). Itwouldbefeasibletoretrofitexistingblastfurnaceswiththis process.
• Direct reduction of iron ore, using hydrogen derived from a fossil fuel in a pre-combustion capture step (see Section 3.5) (Duarte and Reich, 1998). Instead of the fuel being burnt in the furnace and releasing its CO2 to atmosphere, the fuel would be converted to hydrogen and the CO2 would be captured during that process. The hydrogen would then be used as a reduction agent for the iron ore. Capture rates should be 90-95% according to the design of the pre-combustion capture technique (see Section 3.5).
Other novel process routes for steel making to which CO2 capture can be applied are currently in the research and development phase (Gielen, 2003; IEA, 2004)
3.2.4 Cementproduction
Emissions of CO2 from the cement industry account for 6% of the total emissions of CO2 from stationary sources (see Chapter 2). Cement production requires large quantities of fuel to drive the high temperature, energy-intensive reactions associated with the calcination of the limestone – that is calcium carbonate being converted to calcium oxide with the evolution of CO2. At present, CO2 is not captured from cement plants, but possibilities do exist. The concentration of CO2inthefluegasesis between 15-30% by volume, which is higher than in fluegases from power and heat production (3-15% by volume). So, in principle, the post-combustion technologies for CO2 capture described in Section 3.3 could be applied to cement production plants, but would require the additional generation of steam in a cement plant to regenerate the solvent used to capture CO2. Oxy-fuel combustion capture systems may also become a promising technique to recover CO2 (IEA GHG, 1999). Another emerging option would be the use of calcium sorbents for CO2 capture (see Sections 3.3.3.4 and 3.5.3.5) as calcium carbonate (limestone) is a raw material already used in cement plants. All ofthesecapturetechniquescouldbeappliedtoretrofit,ornewplant applications.
3.2.5 Ammoniaproduction
CO2 is a byproduct of ammonia (NH3) production (Leites et al., 2003); Two main groups of processes are used:• Steamreformingoflighthydrocarbons(naturalgas,liquefied
petroleum gas, naphtha)• Partial oxidation or gasification of heavy hydrocarbons
(coal, heavy fuel oil, vacuum residue).
Around 85% of ammonia is made by processes in the steam methane reforming group and so a description of the process is useful. Although the processes vary in detail, they all comprise the following steps:
1. Purificationofthefeed;2. Primary steam methane reforming (see Section 3.5.2.1);3. Secondary reforming, with the addition of air, commonly
called auto thermal reforming (see Section 3.5.2.3);4. Shift conversion of CO and H2O to CO2 and H2;5. Removal of CO2;6. Methanation (a process that reacts and removes trace CO
and CO2);7. Ammonia synthesis.
The removal of CO2 as a pure stream is of interest to this report. A typical modern plant will use the amine solvent process to treat 200,000 Nm3 h-1 of gas from the reformer, to produce 72 tonnes h-1 of concentrated CO2 (Apple, 1997). The amount of CO2 produced in modern plants from natural gas is about 1.27 tCO2/tNH3. Hence, with a world ammonia production of about 100 Mtonnes yr-1, about 127 MtCO2 yr-1 is produced. However, it should be noted that this is not all available for storage, as ammonia plants are frequently combined with urea plants, which are capable of utilizing 70-90% of the CO2. About 0.7 MtCO2 yr-1captured from ammonia plants is currently used for enhanced oil recovery in the United States (Beecy and Kuuskraa, 2005) with a large fraction of the injected CO2 being retained underground (see Chapter 5) in these commercial EOR projects.
3.2.6 Statusandoutlook
We have reviewed processes – current and potential - that may be used to separate CO2 in the course of producing another product. One of these processes, natural gas sweetening, is already being used in two industrial plants to capture and store about 2 MtCO2 yr-1 for the purpose of climate change mitigation. In the case of ammonia production, pure CO2 is already being separated. Over 7 MtCO2 yr-1 captured from both natural gas sweetening and ammonia plants is currently being used in enhanced oil recovery with some storage (see also Chapter 5) of the injected CO2 in these commercial EOR projects. Several potential processes for CO2 capture in steel and cement production exist, but none have yet been applied. Although the total amount of CO2 that may be captured from these industrial processes is insignificant intermsofthescaleoftheclimatechangechallenge,significancemay arise in that their use could serve as early examples of solutions that can be applied on larger scale elsewhere.
3.3 Post-combustion capture systems
3.3.1 Introduction
Current anthropogenic CO2 emissions from stationary sources come mostly from combustion systems such as power plants,
114 IPCC Special Report on Carbon dioxide Capture and Storage
cement kilns, furnaces in industries and iron and steel production plants (see Chapter 2). In these large-scale processes, the direct firingoffuelwithair inacombustionchamberhasbeen(forcenturies, as it is today) the most economic technology to extract and use the energy contained in the fuel. Therefore, the strategic importance of post-combustion capture systems becomes evident when confronted with the reality of today’s sources of CO2 emissions. Chapter 2 shows that any attempt to mitigate CO2 emissions from stationary sources on a relevant scale using CO2 capture and storage, will have to address CO2 capture from combustion systems. All the CO2 capture systems described in this section are aimed at the separation of CO2 from thefluegasesgeneratedinalarge-scalecombustionprocessfiredwithfossil fuels. Similar capture systems can also be applied to biomassfiredcombustionprocessesthat tendtobeusedonamuch smaller scale compared to those for fossil fuels. Flue gases or stack gases found in combustion systems are usually at atmospheric pressure. Because of the low pressure, the large presence of nitrogen from air and the large scale of the units,hugeflowsofgases aregenerated, the largest exampleof which may be the stack emissions coming from a natural gas combined cycle power plant having a maximum capacity of around 5 million normal m3 h-1. CO2contentsoffluegasesvarydepending on the type of fuel used (between 3% for a natural gascombinedcycletolessthan15%byvolumeforacoal-firedcombustion plant See Table 2.1). In principle post-combustion capture systems can be applied to flue gases produced fromthe combustion of any type of fuel. However, the impurities in the fuel are very important for the design and costing of the complete plant (Rao and Rubin, 2002). Flue gases coming from coal combustion will contain not only CO2, N2, O2 and H2O, but also air pollutants such as SOx, NOx, particulates, HCl, HF, mercury, other metals and other trace organic and inorganic contaminants. Figure 3.3 shows a general schematic ofacoal-firedpowerplantinwhichadditionalunitoperationsare deployed to remove the air pollutants prior to CO2 capture
in an absorption-based process. Although capture of CO2 in these flue gases is in principlemore problematic and energyintensive than from other gas streams, commercial experience isavailableata sufficiently largescale (seeSection3.3.2) toprovide the basis for cost estimates for post-combustion CO2 capture systems (see Section 3.7). Also, a large R&D effort is beingundertakenworldwidetodevelopmoreefficientandlowercost post-combustion systems (see Section 3.3.3), following all possible approaches for the CO2 separation step (using sorbents, membranes or cryogenics; see Section 3.1.3).
3.3.2 Existingtechnologies
There are several commercially available process technologies which can in principle be used for CO2capturefromfluegases.However, comparative assessment studies (Hendriks, 1994; Riemer and Ormerod, 1995; IEA GHG, 2000b) have shown that absorption processes based on chemical solvents are currently the preferred option for post-combustion CO2 capture. At this pointintime,theyofferhighcaptureefficiencyandselectivity,and the lowest energy use and costs when compared with other existing post-combustion capture processes. Absorption processes have reached the commercial stage of operation for post-combustion CO2 capture systems, albeit not on the scale required for power plantfluegases.Therefore, the followingparagraphs are devoted to a review of existing knowledge of the technology and the key technical and environmental issues relevant to the application of this currently leading commercial option for CO2 capture. The fundamentals of the CO2 separation step using commercial chemical absorption processes are discussed first. The requirements of flue gaspretreatment (removal of pollutants other than CO2) and the energy requirements for regeneration of the chemical solvent follow. 3.3.2.1 Absorption processes
Figure 3.3 Schematicofapulverizedcoal-firedpowerplantwithanamine-basedCO2 capture system and other emission controls.
Chapter 3: Capture of CO2 115
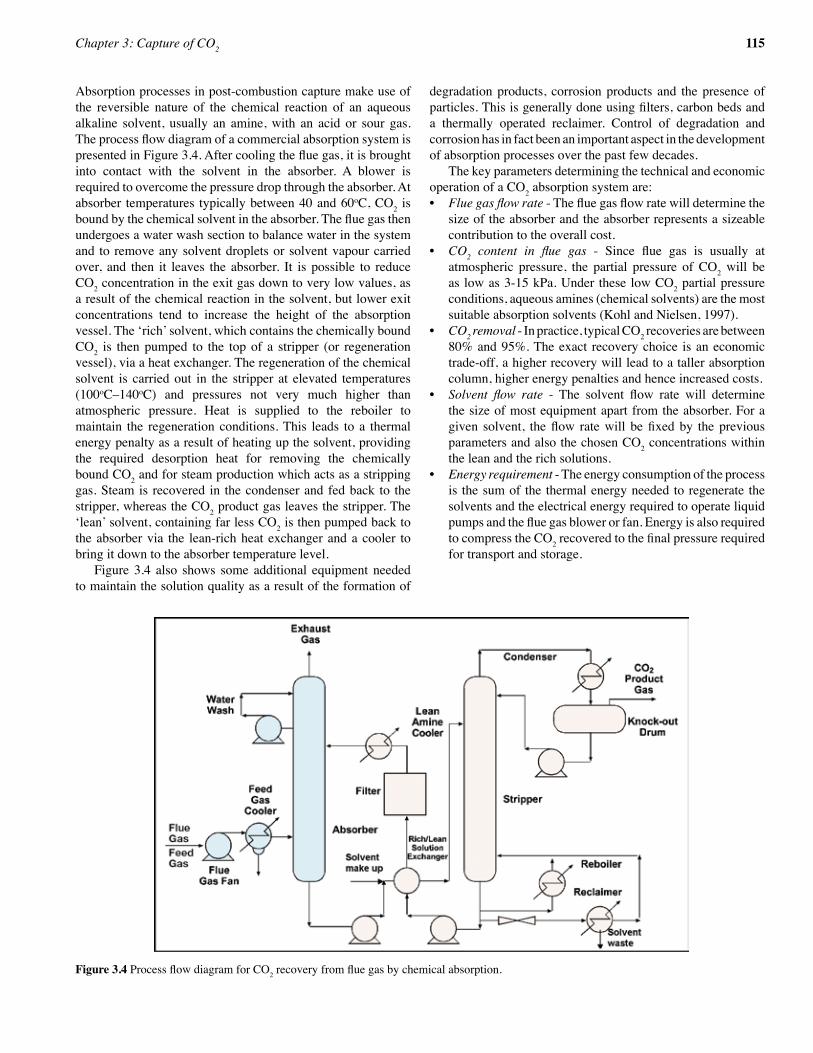
Absorption processes in post-combustion capture make use of the reversible nature of the chemical reaction of an aqueous alkaline solvent, usually an amine, with an acid or sour gas. TheprocessflowdiagramofacommercialabsorptionsystemispresentedinFigure3.4.Aftercoolingthefluegas,itisbroughtinto contact with the solvent in the absorber. A blower is required to overcome the pressure drop through the absorber. At absorber temperatures typically between 40 and 60oC, CO2 is boundbythechemicalsolventintheabsorber.Thefluegasthenundergoes a water wash section to balance water in the system and to remove any solvent droplets or solvent vapour carried over, and then it leaves the absorber. It is possible to reduce CO2 concentration in the exit gas down to very low values, as a result of the chemical reaction in the solvent, but lower exit concentrations tend to increase the height of the absorption vessel. The ‘rich’ solvent, which contains the chemically bound CO2 is then pumped to the top of a stripper (or regeneration vessel), via a heat exchanger. The regeneration of the chemical solvent is carried out in the stripper at elevated temperatures (100oC–140oC) and pressures not very much higher than atmospheric pressure. Heat is supplied to the reboiler to maintain the regeneration conditions. This leads to a thermal energy penalty as a result of heating up the solvent, providing the required desorption heat for removing the chemically bound CO2 and for steam production which acts as a stripping gas. Steam is recovered in the condenser and fed back to the stripper, whereas the CO2 product gas leaves the stripper. The ‘lean’ solvent, containing far less CO2 is then pumped back to the absorber via the lean-rich heat exchanger and a cooler to bring it down to the absorber temperature level. Figure 3.4 also shows some additional equipment needed to maintain the solution quality as a result of the formation of
degradation products, corrosion products and the presence of particles.Thisisgenerallydoneusingfilters,carbonbedsanda thermally operated reclaimer. Control of degradation and corrosion has in fact been an important aspect in the development of absorption processes over the past few decades. The key parameters determining the technical and economic operation of a CO2 absorption system are:• Fluegasflowrate-Thefluegasflowratewilldeterminethe
size of the absorber and the absorber represents a sizeable contribution to the overall cost.
• CO2 content in flue gas - Since flue gas is usually atatmospheric pressure, the partial pressure of CO2 will be as low as 3-15 kPa. Under these low CO2 partial pressure conditions, aqueous amines (chemical solvents) are the most suitable absorption solvents (Kohl and Nielsen, 1997).
• CO2 removal - In practice, typical CO2 recoveries are between 80% and 95%. The exact recovery choice is an economic trade-off, a higher recovery will lead to a taller absorption column, higher energy penalties and hence increased costs.
• Solvent flow rate - The solvent flow rate will determinethe size of most equipment apart from the absorber. For a given solvent, theflow ratewill befixedby the previousparameters and also the chosen CO2 concentrations within the lean and the rich solutions.
• Energy requirement - The energy consumption of the process is the sum of the thermal energy needed to regenerate the solvents and the electrical energy required to operate liquid pumpsandthefluegasblowerorfan.Energyisalsorequiredto compress the CO2recoveredtothefinalpressurerequiredfor transport and storage.
116 IPCC Special Report on Carbon dioxide Capture and Storage
• Coolingrequirement-Coolingisneededtobringthefluegas and solvent temperatures down to temperature levels requiredforefficientabsorptionofCO2. Also, the product from the stripper will require cooling to recover steam from the stripping process.
The purity and pressure of CO2 typically recovered from an amine-based chemical absorption process are as follows (Sander and Mariz, 1992):• CO2 purity: 99.9% by volume or more (water saturated
conditions)• CO2 pressure: 50 kPa (gauge)
A further CO2purificationstepmakesitpossible tobringtheCO2-quality up to food-grade standard. This is required for use in beverages and packaging. Since combustionflue gases are generally at atmosphericpressure and the CO2 is diluted, the CO2 partial pressure is verylow.Also,fluegascontainsoxygenandotherimpurities;therefore an important characteristic of an absorption process is in the proper choice of solvent for the given process duty. High CO2 loading and low heat of desorption energy are essential foratmosphericfluegasCO2 recovery. The solvents must also have low byproduct formation and low decomposition rates, to maintain solvent performance and to limit the amount of waste materials produced. The important effect of other contaminants on the solvent is discussed in Section 3.3.2.2. The following three absorption processes are commercially available for CO2 capture in post-combustion systems:• The Kerr-McGee/ABB Lummus Crest Process (Barchas and
Davis, 1992) - This process recovers CO2 from coke and
coal-fired boilers, deliveringCO2 for soda ash and liquid CO2 preparations. It uses a 15-20% by weight aqueous MEA (Mono-Ethanolamine) solution. The largest capacity experienced for this process is 800 tCO2 d-1utilizing two parallel trains (Arnold et al., 1982).
• The Fluor Daniel ® ECONAMINE™ Process (Sander and Mariz, 1992, Chapel et al., 1999) - This process was acquired by Fluor Daniel Inc. from Dow Chemical Company in 1989. It is a MEA-based process (30% by weight aqueous solution) with an inhibitor to resist carbon steel corrosion and is specifically tailored for oxygen-containinggas streams. Ithas been used in many plants worldwide recovering up to 320 tCO2 d-1 in a single train for use in beverage and urea production.
• The Kansai Electric Power Co., Mitsubishi Heavy Industries, Ltd., KEPCO/MHI Process (Mimura et al., 1999 and 2003) - The process is based upon sterically-hindered amines and already three solvents (KS-1, KS-2 and KS-3) have been developed. KS-1 was commercialized in a urea production application. In this process, low amine losses and low solvent degradation have been noted without the use of inhibitors or additives. As shown in Figure 3.5, the firstcommercialplantat200tCO2 d-1 recoveryfromafluegas stream has been operating in Malaysia since 1999 for urea production (equivalent to the emissions from a 10 MWt coal-firedpowerplant)
The performance of the chemical solvent in the operation is maintained by replacement, filtering and reclaiming, whichleads to a consumables requirement. Typical values for the solvent consumption are between 0.2 and 1.6 kg/tCO2. In addition, chemicals are needed to reclaim the amine from the heat stable salt (typically 0.03–0.13 kg NaOH/tCO2) and to remove decomposition products (typically 0.03-0.06 kg activated carbon/tCO2). The ranges are primarily dependent on the absorption process, with KS-1 being at the low end of the range and ECONAMINE ™ at the high end.
3.3.2.2. Flue gas pretreatmentFlue gases from a combustion power plant are usually above 100°C, which means that they need to be cooled down to the temperature levels required for the absorption process. This can be done in a cooler with direct water contact, which also acts as afluegaswashwithadditionalremovaloffineparticulates. Inadditiontotheabove,fluegasfromcoalcombustionwillcontain other acid gas components such as NOx and SOx. Flue gases from natural gas combustion will normally only contain NOx. These acidic gas components will, similar to CO2, have a chemical interaction with the alkaline solvent. This is not desirable as the irreversible nature of this interaction leads to the formation of heat stable salts and hence a loss in absorption capacity of the solvent and the risk of formation of solids in the solution. It also results in an extra consumption of chemicals to regenerate the solvent and the production of a waste stream such as sodium sulphate or sodium nitrate. Therefore, the pre-removal of NOx and SOx to very low values before CO2
Figure 3.5 CO2 capture plant in Malaysia using a 200 tonne d−1 KEPCO/MHI chemical solvent process (Courtesy of Mitsubishi).
Chapter 3: Capture of CO2 117
recovery becomes essential. For NOx it is the NO2 which leads to the formation of heat stable salts. Fortunately, the level of NO2 is mostly less than 10% of the overall NOxcontentinafluegas (Chapel et al., 1999). The allowable SOx content in the flue gas is primarilydetermined by the cost of the solvent - as this is consumed by reaction with SOx. SO2 concentrations in the flue gas aretypically around 300-5000 ppm. Commercially available SO2-removal plants will remove up to 98-99%. Amines are relatively cheap chemicals, but even cheap solvents like MEA (with a price around 1.25 US$ kg-1 (Rao and Rubin, 2002) may require SOx concentrations of around 10 ppm, to keep solvent consumption (around 1.6 kg of MEA/tCO2 separated) and make up costs at reasonable values, which often means that additional fluegasdesulphurizationisneeded.TheoptimalSO2 content, before the CO2 absorption process is a cost trade-off between CO2-solvent consumption and SO2-removal costs. For the Kerr-Mcgee/ABB Lummus Crest Technology, SO2-removal is typicallynot justified forSO2 levels below 50 ppm (Barchas and Davis, 1992). For the Fluor Daniel Econamine FG process a maximum of 10 ppm SO2 content is generally set as the feed gas specification (Sander andMariz, 1992).This can bemetby using alkaline salt solutions in a spray scrubber (Chapel et al., 1999). A SO2 scrubber might also double as a direct contact coolertocooldownthefluegas. Carefulattentionmustalsobepaidtoflyashandsootpresentinthefluegas,astheymightplugtheabsorberifcontaminantslevels are too high.Often the requirements of other flue gastreatment are such that precautions have already been taken. In the case of CO2 recoveryfromacoal-firedboilerfluegas,the plant typically has to be equipped with a DeNOx unit, an electrostaticprecipitatororabaghousefilterandaDeSOx or flue gas desulphurization unit as part of the environmentalprotection of the power plant facilities. In some cases, these environmental protection facilities are not enough to carry out deep SOx removal up to the 1-2 ppm level sometimes needed to minimize solvent consumption and its reclamation from sticking of solvent wastes on reclaimer tube surfaces.
3.3.2.3 PowergenerationefficiencypenaltyinCO2 capture A key feature of post-combustion CO2 capture processes based on absorption is the high energy requirement and the resulting efficiencypenaltyonpowercycles.Thisisprimarilyduetotheheat necessary to regenerate the solvent, steam use for stripping and to a lesser extent the electricity required for liquid pumping, theflue gas fan andfinally compression of theCO2 product. Later in this chapter, Sections 3.6 and 3.7 present summaries of CO2 capture energy requirements for a variety of power systems and discuss the environmental and economic implications of these energy demands. In principle, the thermal energy for the regeneration process can be supplied by an auxiliary boiler in a retrofit situation.Most studies, however, focus on an overall process in which the absorption process is integrated into the power plant. The heat requirement is at such levels that low-pressure steam, for example condensing at 0.3 MPa(g), can be used in the
reboiler. The steam required for the regeneration process is then extracted from the steam cycle in the power plant. For a coal-firedpowerstation,low-pressuresteamwillbeextractedpriorto the last expansion stage of the steam turbine. For a natural gasfiredcombinedcycle,low-pressuresteamwillbeextractedfrom the last stage in the heat recovery steam generator. Some of this heat can be recovered by preheating the boiler feed water (Hendriks, 1994). Values for the heat requirement for the leading absorption technologies are between 2.7 and 3.3 GJ/tCO2, depending on the solvent process. Typical values for the electricity requirement are between 0.06 and 0.11 GJ/tCO2 for post-combustioncapture incoal-firedpowerplants and0.21and 0.33 GJ/tCO2 for post-combustion capture in natural gas firedcombinedcycles.CompressionoftheCO2 to 110 bar will require around 0.4 GJ/tCO2 (IEA GHG, 2004). Integration of the absorption process with an existing power plantwillrequiremodificationsofthelow-pressurepartofthesteam cycle, as a sizeable fraction of the steam will be extracted and hence will not be available to produce power (Nsakala et al., 2001, Mimura et al.,1995, Mimura et al., 1997). To limit therequiredmodifications,smallback-pressuresteamturbinesusingmediumpressuresteamtodrivethefluegasfanandboilerfeed water pumps can be used. The steam is then condensed in the reboiler (Mimura et al., 1999). Furthermore, in power plants based on steam cycles more than 50% thermal energy in the steam cycle is disposed off in the steam condenser. If the steam cycle system and CO2 recovery can be integrated, part of the waste heat disposed by the steam condenser can be utilized for regeneration of the chemical solvent. The reduction of the energy penalty is, nevertheless, closely linked to the chosen solvent system. The IEA Greenhouse Programme (IEA GHG) has carried out performance assessments of power plants with post-combustion capture of CO2, taking into consideration the most recent improvements in post-combustion CO2 capture processes identified by technologylicensors (IEA GHG, 2004). In this study, Mitsui Babcock Energy Ltd. and Alstom provided information on the use of a highefficiency,ultra-supercriticalsteamcycle(29MPa,600°C, 620°Creheat)boilerandsteamturbineforacoal-firedpowerplant, while for the NGCC case, a combined cycle using a GE 9FA gas turbine was adopted. Fluor provided information on the Fluor Econamine + process based on MEA, and MHI provided information on KEPCO/MHI process based on the KS-1 solvent for CO2 capture. CO2 leaving these systems were compressed to a pressure of 11 MPa. The overall net power plantefficiencieswithandwithoutCO2 capture are shown in Figure3.6,whileFigure3.7 shows theefficiencypenalty forCO2 capture. Overall, results from this study show that the efficiencypenaltyforpost-combustioncaptureincoalandgasfiredplantislowerforKEPCO/MHI’sCO2 absorption process. For the purpose of comparison, the performance of power plants with pre-combustion and oxy-fuel capture, based on the same standard set of plant design criteria are also shown in Figures 3.6 and 3.7.
118 IPCC Special Report on Carbon dioxide Capture and Storage
3.3.2.4 EffluentsAs a result of decomposition of amines, effluents will becreated, particularly ammonia and heat-stable salts. Rao and Rubin (2002) have estimated these emissions for an MEA-based process based on limited data. In such processes, heat stable salts (solvent decomposition products, corrosion products etc.) are removed from the solution in a reclaimer and a waste stream is created and is disposed of using normal HSE (Health, Safety and Environmental) practices. In some cases, these reclaimer bottoms may be classified as a hazardous waste, requiringspecialhandling(RaoandRubin,2002).Alsoaparticlefilterandcarbonfilterisnormallyinstalledinthesolventcircuittoremovebyproducts. Finally, some solvent material will be lost to the environment through evaporation and carry over in the absorber, which is accounted for in the solvent consumption. It is expected that acid gases other than CO2,whicharestillpresentinthefluegas (SOx and NO2) will also be absorbed in the solution. This will lower the concentration of these components further and even the net emissions in some cases depending on the amount of additional energy use for CO2 capture (see Tables 3.4 and 3.5). As SO2-removal prior to CO2-removalisverylikelyincoal-firedplants, this will lead to the production of a waste or byproduct stream containing gypsum and water from the FGD unit.
3.3.3 Emergingtechnologies
3.3.3.1 Other absorption processVarious novel solvents are being investigated, with the object of achieving a reduced energy consumption for solvent regeneration (Chakma, 1995; Chakma and Tontiwachwuthikul, 1999; Mimura et al., 1999; Zheng et al., 2003; Cullinane and Rochelle, 2003; Leites, 1998; Erga et al., 1995; Aresta and Dibenedetto, 2003; Bai and Yeh, 1997). Besides novel solvents, novel process designs are also currently becoming available (Leites et al. 2003). Research is also being carried out to improve upon the existing practices and packing types (Aroonwilas et al., 2003). Another area of research is to increase the concentration levels of aqueous MEA solution used in absorption systems as this tends to reduce the size of equipment used in capture plants (Aboudheir et al., 2003). Methods to prevent oxidative degradation of MEA by de-oxygenation of the solvent solutions are also being investigated (Chakravarti et al., 2001). In addition to this, the catalyticremovalofoxygeninfluegasesfromcoalfiringhasbeen suggested (Nsakala et al., 2001) to enable operation with promising solvents sensitive to oxygen.
Figure 3.6 ThermalefficienciesofpowerplantswithandwithoutCO2 capture, % LHV-basis (Source data: Davison 2005, IEA GHG 2004, IEA GHG 2003; IEA GHG, 2000b; Dillon et al., 2005).a. Theefficienciesarebasedonastandardsetofplantdesigncriteria(IEAGHG,2004).b. The coal steam cycle plants, including the post-combustion capture and oxy-fuel plants, are based on ultra-supercritical steam (29MPa, 600C
superheat, 620C reheat). The IGCC and natural gas pre- and post-combustion capture plants are based on GE 9FA gas turbine combined cycles. The natural gas oxy-fuel plant is based on a CO2 recycle gas turbine, as shown in Figure 3.10, with different operating pressures and temperatures but similar mechanical design criteria to that of the 9FA.
c. Data are presented for two types of post-combustion capture solvent: MEA (Fluor plant designs) and KS-1 (MHI plant designs). The solvent desorption heat consumptions are 3.2 and 2.7 MJ/kgCO2 captured respectively for the coal plants and 3.7 and 2.7 MJ kg−1 for the natural gas plants.
d. DataarepresentedforIGCCplantsbasedontwotypesofgasifier:theShelldryfeed/heatrecoveryboilertypeandtheGE(formerlyTexaco)slurry feed water quench type.
e. The natural gas pre-combustion capture plant is based on partial oxidation using oxygen. f. The oxy-fuel plants include cryogenic removal of some of the impurities from the CO2 during compression. Electricity consumption for
oxygen production by cryogenic distillation of air is 200 kWh/ tO2 at atmospheric pressure for the coal plant and 320 kWh/ tO2 at 40 bar for the natural gas plant. Oxygen production in the IGCC and natural gas pre-combustion capture plants is partially integrated with the gas turbine compressor, so comparable data cannot be provided for these plants.
g. The percentage CO2captureis85−90%forallplantsexceptthenaturalgasoxy-fuelplantwhichhasaninherentlyhigherpercentagecaptureof 97%.
Chapter 3: Capture of CO2 119
Figure 3.7 Percentage increase in fuel use per kWh of electricity due to CO2 capture, compared to the same plant without capture (Source data: Davison, 2005; IEA GHG, 2004; IEA GHG, 2003; IEA GHG, 2000b; Dillon et al., 2005).a. The increase in fuel required to produce a kWh of electricity is calculated by comparing the same type of plant with and without capture. The
increase in fuel consumption depends on the type of baseline plant without capture. For example, the increase in energy consumption for a GE IGCC plant with capture compared to a coal steam cycle baseline plant without capture would be 40% as opposed to the lower value shown inthefigurethatwascalculatedrelativetothesametypeofbaselineplantwithoutcapture.
b. The direct energy consumptions for CO2 separation are lower for pre-combustion capture than for post-combustion capture, because CO2 is removed from a more concentrated, higher pressure gas, so a physical rather than a chemical solvent can be used.
c. The ‘Fuel gas processing and related impacts’ category for IGCC includes shift conversion of the fuel gas and the effects on the gas turbine combined cycle of removal of CO2 from the fuel gas and use of hydrogen as a fuel instead of syngas. For natural gas pre-combustion capture this category also includes partial oxidation/steam reforming of the natural gas.
d. The energy consumption for CO2 compression is lower in pre-combustion capture than in post-combustion capture because some of the CO2 leaves the separation unit at elevated pressure.
e. The energy consumption for CO2 compression in the oxy-fuel processes depends on the composition of the extracted product, namely 75% byvolume in thecoal-firedplantand93%byvolume in thegasfiredplant. Impuritiesarecryogenically removedfromtheCO2 during compression,togiveafinalCO2 purity of 96% by volume. The energy consumption of the cryogenic CO2 separation unit is included in the CO2 compression power consumption.
f. The ‘Oxygen production and power plant impacts’ category for oxy-fuel processes includes the power consumption for oxygen production and the impacts of CO2 capture on the rest of the power plant, that is excluding CO2compressionandpurification.Inthecoal-firedoxy-fuelplant,theefficiencyoftherestofthepowerplantincreasesslightly,forexampleduetotheabsenceofafluegasdesulphurization(FGD)unit.Theefficiencyoftherestofthegasfiredoxy-fuelplantdecreasesbecauseofthechangeofworkingfluidinthepowercyclefromairtorecycledfluegas.
3.3.3.2 Adsorption processIntheadsorptionprocessforfluegasCO2 recovery, molecular sieves or activated carbons are used in adsorbing CO2. Desorbing CO2 is then done by the pressure swing operation (PSA) or temperature swing operation (TSA). Most applications are associated with pressure swing adsorption (Ishibashi et al., 1999 and Yokoyama, 2003). Much less attention has been focused on CO2 removal via temperature swing adsorption, as this technique is less attractive compared to PSA due to the longer cycle times needed to heat up the bed of solid particles during sorbent regeneration. For bulk separations at large scales, it is also essential to limit the length of the unused bed and therefore opt for faster cycle times. Adsorption processes have been employed for CO2 removal from synthesis gas for hydrogen production (see Section 3.5.2.9). It has not yet reached a commercial stage for CO2 recoveryfromfluegases.ThefollowingmainR&Dactivitieshave been conducted:• Study of CO2 removal from flue gas of a thermal power
plant by physical adsorption (Ishibashi et al., 1999);
• Study of CO2 removal from flue gas of a thermal powerplant by a combined system with pressure swing adsorption and a super cold separator (Takamura et al., 1999);
• Pilot tests on the recovery of CO2fromacoalandoilfiredpower plant, using pressure temperature swing adsorption (PTSA) and an X-type zeolite as an adsorbent (Yokoyama, 2003).
Pilottestresultsofcoal-firedfluegasCO2 recovery by adsorption processes show that the energy consumption for capture (blowers and vacuum pumps) has improved from the original 708 kWh/tCO2 to 560 kWh/tCO2. An energy consumption of 560 kWh/tCO2 is equivalent to a loss corresponding to 21% of the energy output of the power plant. Recovered CO2 purity is about 99.0% by volume using two stages of a PSA and PTSA system (Ishibashi et al., 1999). It can be concluded that based on mathematical models and data from pilot-scale experimental installations, the design of a full-scale industrial adsorption process might be feasible. A serious drawback of all adsorptive methods is the necessity to
120 IPCC Special Report on Carbon dioxide Capture and Storage
treat the gaseous feed before CO2 separation in an adsorber. Operation at high temperature with other sorbents (see Section 3.3.3.4) can circumvent this requirement (Sircar and Golden, 2001). In many cases gases have to be also cooled and dried, which limits the attractiveness of PSA, TSA or ESA (electric swing adsorption) vis-à-vis capture by chemical absorption described in previous sections. The development of a new generation of materials that would efficiently adsorb CO2 will undoubtedly enhance the competitiveness of adsorptive separationinafluegasapplication.
3.3.3.3 MembranesMembrane processes are used commercially for CO2 removal from natural gas at high pressure and at high CO2 concentration (seeSection3.2.2).Influegases,thelowCO2 partial pressure difference provides a low driving force for gas separation. The removal of carbon dioxide using commercially available polymeric gas separation membranes results in higher energy penalties on the power generation efficiency compared to astandard chemical absorption process (Herzog et al., 1991, Van der Sluijs et al., 1992 and Feron, 1994). Also, the maximum percentage of CO2 removed is lower than for a standard chemical absorption processes. Improvements can be made if more selective membranes become available, such as facilitated membranes, described below. The membrane option currently receiving the most attention is a hybrid membrane – absorbent (or solvent) system. These systems are being developed for flue gas CO2 recovery. Membrane/solvent systems employ membranes to provide a very high surface area to volume ratio for mass exchange between a gas stream and a solvent resulting in a very compact system. This results in a membrane contactor system in which the membrane forms a gas permeable barrier between a liquid and a gaseous phase. In general, the membrane is not involved in the separation process. In the case of porous membranes, gaseous components diffuse through the pores and are absorbed by the liquid; in cases of non-porous membranes they dissolve in the membrane and diffuse through the membrane. The contact surface area between gas and liquid phase is maintained by the membraneand is independentof thegas and liquidflow rate.The selectivity of the partition is primarily determined by the absorbent (solvent). Absorption in the liquid phase is determined either by physical partition or by a chemical reaction. The advantages of membrane/solvent systems are avoidance of operational problems occurring in conventional solvent absorption systems (see Section 3.3.2.1) where gas and liquid flows are in direct contact. Operational problems avoidedinclude foaming, flooding entrainment and channelling, andresult in the free choice of the gas and liquidflow rates anda fixed interface for mass transfer in the membrane/solventsystem. Furthermore, the use of compact membranes result in smaller equipment sizes with capital cost reductions. The choice of a suitable combination of solvent and membrane material is very important. The material characteristics should be such that the transfer of solvent through the membrane is avoided at operating pressure gradients of typically 50–100 kPa,
while the transfer of gas is not hindered. The overall process configurationintermsofunitoperationswouldbeverysimilarto a conventional chemical absorption/desorption process (see Figure 3.4). Membrane/solvent systems can be both used in the absorption as well as in the desorption step. Feron and Jansen (2002) and Falk-Pedersen et al. (1999) give examples of suitable membrane/solvent systems. Research and development efforts have also been reported in the area of facilitated transport membranes. Facilitated transport membranes rely on the formation of complexes or reversible chemical reactions of components present in a gas stream with compounds present in the membrane. These complexes or reaction products are then transported through the membrane. Although solution and diffusion still play a role in the transportmechanism, theessentialelement is thespecificchemical interaction of a gas component with a compound in the membrane, the so-called carrier. Like other pressure driven membrane processes, the driving force for the separation comes from a difference in partial pressure of the component to be transported. An important class of facilitated transport membranes is the so-called supported liquid membrane in which the carrier is dissolved into a liquid contained in a membrane. For CO2 separations, carbonates, amines and molten salt hydrates have been suggested as carriers (Feron, 1992). Porous membranes and ion-exchange membranes have been employed as the support. Until now, supported liquid membranes have only been studied on a laboratory scale. Practical problems associated with supported liquid membranes are membrane stability and liquid volatility. Furthermore, the selectivity for a gas decreases with increasing partial pressure on the feed side. This is a result of saturation of the carrier in the liquid. Also, as the total feed pressure is increased, the permeation of unwanted components is increased. This also results in a decrease in selectivity. Finally, selectivity is also reduced by a reduction in membrane thickness. Recent development work has focused on the following technological options that are applicable to both CO2/N2 and CO2/H2 separations:• Amine-containing membranes (Teramoto et al., 1996);• Membranes containing potassium carbonate polymer gel
membranes (Okabe et al., 2003);• Membranes containing potassium carbonate-glycerol
(Chen et al., 1999);• Dendrimer-containing membranes
(Kovvali and Sirkar, 2001).• Poly-electrolyte membranes (Quinn and Laciak, 1997);
Facilitated transport membranes and other membranes can also be used in a preconcentration step prior to the liquefaction of CO2 (Mano et al., 2003).
3.3.3.4 Solid sorbentsThere are post-combustion systems being proposed that make use of regenerable solid sorbents to remove CO2 at relatively high temperatures. The use of high temperatures in the CO2 separationstephasthepotentialtoreduceefficiencypenaltieswith respect to wet-absorption methods. In principle, they all
Chapter 3: Capture of CO2 121
follow the scheme shown in Figure 3.2a, where the combustion fluegasisputincontactwiththesorbentinasuitablereactortoallow the gas-solid reaction of CO2 with the sorbent (usually the carbonation of a metal oxide). The solid can be easily separated from the gas stream and sent for regeneration in a different reactor. Instead of moving the solids, the reactor can also be switched between sorption and regeneration modes of operation in a batch wise, cyclic operation. One key component for the development of these systems is obviously the sorbent itself, that has to have good CO2 absorption capacity and chemical and mechanical stability for long periods of operation in repeated cycles. In general, sorbent performance and cost are critical issues in all post-combustion systems, and more elaborate sorbent materials are usually more expensive and will have to demonstrate outstanding performance compared with existing commercial alternatives such as those described in 3.3.2. Solid sorbents being investigated for large-scale CO2 capture purposes are sodium and potassium oxides and carbonates (to produce bicarbonate), usually supported on a solid substrate (Hoffman et al., 2002; Green et al., 2002). Also, high temperature Li-based and CaO-based sorbents are suitable candidates. The use of lithium-containing compounds (lithium, lithium-zirconia and lithium-silica oxides) in a carbonation-calcination cycle, wasfirstinvestigatedinJapan(NakagawaandOhashi,1998).The reported performance of these sorbents is very good, with very high reactivity in a wide range of temperatures below 700ºC, rapid regeneration at higher temperatures and durability in repeated capture-regeneration cycles. This is essential because lithium is an intrinsically expensive material. The use of CaO as a regenerable CO2 sorbent has been proposed in several processes dating back to the 19th century. The carbonation reaction of CaO to separate CO2 from hot gases (T > 600ºC) is very fast and the regeneration of the sorbent by calcining the CaCO3 into CaO and pure CO2 is favoured at T > 900ºC (at a partial pressure of CO2 of 0.1 MPa). The basic separation principle using this carbonation-calcination cycle was successfully tested in a pilot plant (40 tonne d-1) for the development of the Acceptor Coal Gasification Process(Curran et al.,1967)usingtwointerconnectedfluidizedbeds.The use of the above cycle for a post-combustion system wasfirstproposedbyShimizuet al. (1999) and involved the regeneration of the sorbent in a fluidized bed, firing part ofthe fuel with O2/CO2 mixtures (see also Section 3.4.2). The effective capture of CO2 by CaO has been demonstrated in a small pilot fluidized bed (Abanades et al., 2004a). Other combustion cycles incorporating capture of CO2 with CaO that might not need O2 are being developed, including one that works at high pressures with simultaneous capture of CO2 and SO2 (Wang et al., 2004). One weak point in all these processes is that natural sorbents (limestones and dolomites) deactivate rapidly,anda largemake-upflowof sorbent (of theorderofthemassflowoffuelenteringtheplant)isrequiredtomaintainthe activity in the capture-regeneration loop (Abanades et al., 2004b).Althoughthedeactivatedsorbentmayfindapplicationin the cement industry and the sorbent cost is low, a range of methods to enhance the activity of Ca-based CO2 sorbents are
being pursued by several groups around the world.
3.3.4 Statusandoutlook
Virtually all the energy we use today from carbon-containing fuels is obtained by directly burning fuels in air. This is despite many decades of exploring promising and more efficientalternative energy conversion cycles that rely on other fuel processing steps prior to fuel combustion or avoiding direct fuel combustion (see pre-combustion capture – Section 3.5). In particular, combustion-based systems are still the competitive choice for operators aiming at large-scale production of electricity and heat from fossil fuels, even under more demanding environmental regulations, because these processes are reliable and well proven in delivering electricity and heat at prices that often set a benchmark for these services. In addition, there is a continued effort to raise the energy conversion efficienciesof these systems through advanced materials and component development. This will allow these systems to operate at higher temperatureandhigherefficiency. As was noted in Section 3.1, the main systems of reference for post-combustion capture are the present installed capacity of coal and natural gas power plants, with a total of 970 GWe subcritical steam and 155 GWe of supercritical/ultra-supercritical steam-basedpulverizedcoalfiredplants, 339GWe of natural gas combined cycle, 333 GWe natural gas steam-electric power plants and 17 GWe of coal-fired, circulating, fluidized-bedcombustion (CFBC) power plants. An additional capacity of 454 GWeofoil-basedpowerplant,withasignificantproportionof these operating in an air-firing mode is also noted (IEAWEO, 2004 and IEA CCC, 2005). Current projections indicate that the generation efficiencyof commercial, pulverized coalfired power plants based on ultra-supercritical steam cycleswould exceed 50% lower heating value (LHV) over the next decade (IEA, 2004), which will be higher than efficienciesof between 36 and 45% reported for current subcritical and supercritical steam-based plants without capture (see Section 3.7). Similarly,naturalgasfiredcombinedcyclesareexpectedtohaveefficienciesof65%by2020(IEAGHG,2002b)and up fromcurrentefficienciesbetween55and58%(seeSection3.7).In a future carbon-constrained world, these independent and ongoing developments in power cycle efficiencies will result in lower CO2-emissions per kWh produced and hence a lower loss in overall cycle efficiencywhenpost-combustioncaptureis applied. There are proven post-combustion CO2 capture technologies based on absorption processes that are commercially available at present . They produce CO2fromfluegasesincoalandgas-firedinstallationsforfood/beverageapplicationsandchemicalsproduction in capacity ranges between 6 and 800 tCO2 d-1. They require scale up to 20-50 times that of current unit capacities for deployment in large-scale power plants in the 500 MWe capacity range (see Section 3.3.2). The inherent limitations of currently available absorption technologies when applied to post-combustion capture systems are well known and their impact on system cost can be estimated relatively accurately for
122 IPCC Special Report on Carbon dioxide Capture and Storage
a given application (see Section 3.7). Hence, with the dominant role played by air- blown energy conversion processes in the global energy infrastructure, the availability of post-combustion capture systems is important if CO2 capture and storage becomes a viable climate change mitigation strategy. The intense development efforts on novel solvents for improved performance and reduced energy consumption during regeneration, as well as process designs incorporating new contacting devices such as hybrid membrane-absorbent systems, solid adsorbents and high temperature regenerable sorbents,may lead to the use ofmore energy efficient post-combustion capture systems. However, all these novel concepts still need to prove their lower costs and reliability of operation on a commercial scale. The same considerations also apply to other advanced CO2 capture concepts with oxy-fuel combustion or pre-combustion capture reviewed in the following sections of this chapter. It is generally not yet clear which of these emerging technologies, if any, will succeed as the dominant commercial technology for energy systems incorporating CO2 capture.
3.4 Oxy-fuel combustion capture systems
3.4.1 Introduction
The oxy-fuel combustion process eliminates nitrogen from the fluegasbycombustingahydrocarbonorcarbonaceousfuelineither pure oxygen or a mixture of pure oxygen and a CO2-rich recycled flue gas (carbonaceous fuels include biomass).Combustion of a fuel with pure oxygen has a combustion temperature of about 3500°C which is far too high for typical power plant materials. The combustion temperature is limited to about 1300-1400°C in a typical gas turbine cycle and to about 1900°C in an oxy-fuel coal-fired boiler using currenttechnology. The combustion temperature is controlled by the proportion of flue gas and gaseous or liquid-water recycledback to the combustion chamber. The combustion products (or flue gas) consist mainly ofcarbon dioxide and water vapour together with excess oxygen required to ensure complete combustion of the fuel. It will also contain any other components in the fuel, any diluents in the oxygen stream supplied, any inerts in the fuel and from air leakageintothesystemfromtheatmosphere.Thenetfluegas,after cooling to condense water vapour, contains from about 80-98% CO2 depending on the fuel used and the particular oxy-fuel combustion process. This concentrated CO2 stream canbecompressed,driedandfurtherpurifiedbeforedeliveryinto a pipeline for storage (see Chapter 4). The CO2 capture efficiencyisverycloseto100%inoxy-fuelcombustioncapturesystems. Impurities in the CO2 are gas components such as SOx, NOx, HCl and Hg derived from the fuel used, and the inert gas components, such as nitrogen, argon and oxygen, derived from the oxygen feed or air leakage into the system. The CO2 is transported by pipeline as a dense supercritical phase. Inert gases must be reduced to a low concentration to avoid two-phase flow conditions developing in the pipeline systems.The acid gas components may need to be removed to comply
with legislation covering co-disposal of toxic or hazardous waste or to avoid operations or environmental problems with disposal in deep saline reservoirs, hydrocarbon formations or in the ocean. The carbon dioxide must also be dried to prevent water condensation and corrosion in pipelines and allow use of conventional carbon-steel materials. Although elements of oxy-fuel combustion technologies are in use in the aluminium, iron and steel and glass melting industries today, oxy-fuel technologies for CO2 capture have yettobedeployedonacommercialscale.Therefore,thefirstclassification between existing technologies and emerging technologies adopted in post-combustion (Section 3.3) and pre-combustion (Section 3.5) is not followed in this section. However, it is important to emphasize that the key separation step in most oxy-fuel capture systems (O2 from air) is an ‘existing technology’ (see Section 3.4.5). Current methods of oxygen production by air separation comprise cryogenic distillation, adsorption using multi-bed pressure swing units and polymeric membranes. For oxy-fuel conversions requiring less than 200 tO2 d-1, the adsorption system will be economic. For all the larger applications, which include power station boilers, cryogenic air separation is the economic solution (Wilkinson et al., 2003a). In the following sections we present the main oxy-fuel combustion systems classified according to how the heat ofcombustion is suppliedandwhether thefluegas isusedasaworkingfluid (Sections 3.4.2, 3.4.3, 3.4.4).Abrief overviewof O2 production methods relevant for these systems is given (Section 3.4.5). In Section 3.4.6, the emerging technology of chemical looping combustion is presented, in which pure oxygen is supplied by a metal oxide rather than an oxygen production process. The section on oxy-fuel systems closes with an overview of the status of the technology (Section 3.4.7).
3.4.2 Oxy-fuelindirectheating-steamcycle
In these systems, the oxy-fuel combustion chamber provides heattoaseparatefluidbyheattransferthroughasurface.Itcanbe used for either process heating, or in a boiler with a steam cycle for power generation. The indirect system can be used with any hydrocarbon or carbon-containing fuel. The application of oxy-fuel indirect heating for CO2 capture in process heating and power generation has been examined in both pilot-scale trials evaluating the combustion of carbonaceous fuels in oxygen and CO2-richrecycledfluegasmixtures and engineering assessments of plant conversions as described below.
3.4.2.1 Oxy-fuel combustion trialsWork to demonstrate the application of oxy-fuel recycle combustion in process heating and for steam generation for use in steam power cycles have been mostly undertaken in pilot scale tests that have looked at the combustion, heat transfer and pollutant-forming behaviour of natural gas and coal. One study carried out (Babcock Energy Ltd. et al., 1995) includedanoxy-fueltestwithfluegasrecycleusinga160kW,
Chapter 3: Capture of CO2 123
pulverized coal, low NOx burner. The system included a heat-transfer test section to simulate fouling conditions. Test conditions included variation in recycle flow and excess O2 levels. Measurements included all gas compositions, ash analysis and tube fouling after a 5-week test run. The work also included a case study on oxy-fuel operation of a 660 MW power boiler with CO2capture,compressionandpurification.Themaintestresults were that NOx levels reduced with increase in recycle rate, while SO2 and carbon in ash levels were insensitive to the recycle rate. Fouling in the convective test section was greater withoxy-fuelfiringthanwithair.High-slaggingUKcoalhadworseslaggingwhenusingoxy-fuelfiring,thehigherexcessO2 level lowered carbon in ash and CO concentration. For the combustion of pulverized coal, other pilot-scale tests byCroisetandThambimuthu(2000)havereportedthattheflametemperature and heat capacity of gases to match fuel burning in air occurs when the feed gas used in oxy-fuel combustion has a composition of approximately 35% by volume O2 and 65% by volume of dry recycled CO2 (c.f. 21% by volume O2 and the rest nitrogen in air). In practice, the presence of inerts such asashandinorganiccomponentsinthecoal,thespecificfuelcomposition and moisture in the recycled gas stream and the coal feed will result in minor adjustments to this feed mixture compositiontokeeptheflametemperatureatavaluesimilartofuel combustion in air. At conditions that match O2/CO2 recycle combustion to fuel burning in air, coal burning is reported to be complete (Croiset and Thambimuthu, 2000), with operation of the process at excess O2levelsinthefluegasaslowas1-3%byvolumeO2, producingafluegasstreamof95-98%byvolumedryCO2 (the rest being excess O2, NOx, SOx and argon) when a very high purity O2 stream is used in the combustion process with zero leakage of ambient air into the system. No differences were detectedintheflyashformationbehaviourinthecombustororSO2emissionscomparedtoconventionalairfiringconditions.For NOx on the other hand, emissions were lower due to zero thermal NOx formation from the absence of nitrogen in the feed gas - with the partial recycling of NOx also reducing the formation and net emissions originating from the fuel bound nitrogen. Other studies have demonstrated that the level of NOx reduction is as high as 75% compared to coal burning in air (Chatel-Pelage et al., 2003). Similar data for natural gas burning in O2/CO2 recycle mixtures report zero thermal NOx emissions in the absence of air leakage into the boiler, with trace amounts produced as thermal NOx when residual nitrogen is present in the natural gas feed (Tan et al., 2002). Theaboveandotherfindingsshowthatwiththeapplicationofoxy-fuelcombustioninmodifiedutilityboilers,thenitrogen-freecombustionprocesswouldbenefitfromhigherheattransferrates (McDonald and Palkes, 1999), and if also constructed with higher temperature tolerant materials, are able to operate athigheroxygenconcentrationandlowerfluegasrecycleflows–bothofwhichwillconsiderablyreduceoverallvolumeflowsand size of the boiler. Itshouldbenotedthatevenwhendeployinga2/3fluegasrecycle gas ratio to maintain a 35% by volume O2 feed to a
pulverizedcoalfiredboiler,hotrecyclingofthefluegaspriorto CO2 purification and compression also reduces the size ofall unit operations in the stream leaving the boiler to 1/5 that of similar equipment deployed in conventional air blown combustion systems (Chatel-Pelage et al., 2003). Use of a low temperature gas purification step prior to CO2 compression (see Section 3.4.2.2) will also eliminate the need to deploy conventional selective catalytic reduction for NOx removal and fluegasdesulphurizationtopurifythegas,apracticetypicallyadopted in conventional air-blown combustion processes (see Figure3.3).Theoverallreductioninflowvolumes,equipmentscaleandsimplificationofgaspurificationstepswillthushavethe benefit of reducing both capital and operating costs ofequipmentdeployedforcombustion,heattransferandfinalgaspurificationinprocessandpowerplantapplications(Marinet al., 2003). As noted above for pulverized coal, oil, natural gas and biomass combustion, fluidized beds could also be fired withO2 instead of air to supply heat for the steam cycle. The intense solid mixing in a fluidized bed combustion systemcan provide very good temperature control even in highly exothermic conditions, therebyminimizing the need for fluegas recycling. In principle, a variety of commercial designs for fluidizedcombustionboilersexistthatcouldberetrofittedforoxygenfiring.A circulatingfluidizedbed combustorwithO2 firingwasproposedbyShimizuet al. (1999) to generate the heat required for the calcination of CaCO3 (see also Section 3.3.3.4).Morerecently,plansforpilot testingofanoxy-firedcirculatingfluidizedbedboilerhavebeenpublishedbyNsakalaet al. (2003).
3.4.2.2 Assessments of plants converted to oxy-fuel combustion
We now discuss performance data from a recent comprehensive design study for an application of oxy-fuel combustion in a new build pulverized coal fired power boiler using a supercriticalsteam cycle (see Figure 3.8; Dillon et al., 2005). The overall thermal efficiency on a lower heating value basis is reducedfrom 44.2% to 35.4%. The net power output is reduced from 677 MWe to 532 MWe.
Important features of the system include:• Burnerdesignandgasrecycleflowratehavebeenselected
to achieve the same temperatures as in air combustion (compatible temperatures with existing materials in the boiler).
• The CO2-richfluegasfromtheboilerisdividedintothreegas streams: one to be recycled back to the combustor, one to be used as transport and drying gas of the coal feed, and the thirdasproductgas.Thefirstrecycleandtheproductstreamare cooled by direct water scrubbing to remove residual particulates, water vapour and soluble acid gases such as SO3 and HCl. Oxygen and entrained coal dust together with thesecondrecyclestreamflowtotheburners.
• Theair leakage into theboiler is sufficient togiveahighenough inerts level to require a low temperature inert gas
124 IPCC Special Report on Carbon dioxide Capture and Storage
removal unit to be installed, even if pure O2 were used as the oxidant in the boiler. The cryogenic oxygen plant will, in this case, produce 95% O2 purity to minimize power consumption and capital cost.
• The low temperature (-55°C) CO2 purification plant(Wilkinson et al., 2003b) integrated with the CO2 compressor will not only remove excess O2, N2, argon but can also remove all NOx and SO2 from the CO2 stream, if high purity CO2isrequiredforstorage.Significantly,removalofthesecomponentsbeforefinalCO2 compression eliminates the need to otherwise incorporate upstream NOx and SOx removal equipment in the net flue gas stream leaving theboiler. Elimination of N2fromthefluegasresultsinhigherSOx concentrations in the boiler and reduced NOx levels. Suitable corrosion resistant materials of construction must be chosen.
• The overall heat transfer is improved in oxy-fuel firingbecause of the higher emissivity of the CO2/H2O gas mixture in the boiler compared to nitrogen and the improved heat transfer in the convection section. These improvements, togetherwiththerecycleofhotfluegas,increasetheboilerefficiencyandsteamgenerationbyabout5%.
• TheoverallthermalefficiencyisimprovedbyrunningtheO2 plant air compressor and the first and final stages ofthe CO2 compressor without cooling, and recovering the compression heat for boiler feed water heating prior to de-aeration.
Engineering studies have also been reported by Simbeck and McDonald (2001b) and by McDonald and Palkes (1999). Thisworkhasconfirmed that theconceptof retrofittingoxy-fuel combustion with CO2capturetoexistingcoal-firedpower
stations does not have any technical barriers and can make use of existing technology systems. It has been reported (Wilkinson et al., 2003b) that the application of oxy-fuel technology for the retrofit of powerplant boilers and a range of refinery heaters in a refinerycomplex (Grangemouth refinery in Scotland) is technicallyfeasible at a competitive cost compared to other types of CO2 capture technologies. In this case, the existing boiler is adaptedtoallowcombustionofrefinerygasandfueloilwithhighlyenrichedoxygenandwithpartialfluegasrecyclingfortemperature control. Oxy-fuel boiler conversions only needed minor burner modifications, a new O2 injection system and controls,andanewfluegasrecyclelinewithaseparateblower.Thesearecheapandrelativelysimplemodificationsandresultin an increase in boiler/heater thermal efficiency due to therecycleofhotgas.Modificationstoacoal-firedboileraremorecomplex. In this study, it was found to be more economic to design the air separation units for only 95% O2 purity instead of 99.5% to comply with practical levels of air leakage into boilers and to separate the associated argon and nitrogen in the CO2 inert gas removal system to produce a purity of CO2 suitable for geological storage. After conversion of the boiler, the CO2concentrationinthefluegasincreasesfrom17to60%while the water content increases from 10 to 30%. Impurities (SOx, NOx) and gases (excess O2, N2, argon) representing about 10% of the stream are separated from CO2 at low temperature (-55°C). After cooling, compression and drying of the separated or non-recycled flue gas, the product for storage comprises96% CO2 contaminated with 2% N2, 1% argon and less than 1% O2 and SO2. Production of ultra-pure CO2 for storage would also be possible if distillation steps are added to the separation process.
3.4.2.3 Advanced zero emission power plantThe advanced zero emission power plant (or AZEP as outlined in Figure3.9;Griffinet al., 2003) is an indirect heating gas turbine cycle that incorporates a high-temperature oxygen transport membrane, operating at about 800°C -1000°C (see Section 3.4.5.2). This process uses a standard air-based gas turbine in a combined cycle arrangement. Three process steps take place in a reactor system that replaces the combustion chamber of a standard gas turbine: 1) separation of oxygen from hot air using the membrane and transport to the combustion section; 2) combustion and 3) heat exchange from the combustion products to the compressed air. Anetefficiencyforadvancedzeroemissionpowercycleofaround 49–50% LHV is claimed including CO2 compression for transport. In order to get full advantage of the potential of the most advanced gas turbines, which have inlet temperatures of 1300°C-1400°C,anafterburnerfiredwithnaturalgasinairmaybeaddedbehindthereactorsystem.Theefficiencythenclimbsup to 52% but now 15% of the CO2 generated by combustion is released at the stack and is not captured.
3.4.3 Oxy-fueldirectheating-gasturbinecycle
Oxy-fuel combustion takes place in a pressurized CO2-rich recirculatingstreaminamodifiedgas turbine.Thehotgas isexpanded in the turbine producing power. The turbine exhaust is cooled to provide heat for a steam cycle and water vapour is condensed by further cooling. The CO2-rich gas is compressed in the compressor section. The net CO2-rich combustion product is removed from the system. Only natural gas, light hydrocarbons and syngas (CO + H2) can be used as fuel.
3.4.3.1 Cycle description and performanceFigure 3.10 shows how a gas turbine can be adapted to run withoxy-fuelfiringusingCO2asaworkingfluid.Exhaustgasleaving the heat recovery steam generator is cooled to condense water. The net CO2 product is removed and the remaining gas is
recycled to the compressor. Suitable fuels are natural gas, light to medium hydrocarbons or (H2 + CO) syngas, which could be derived from coal. The use of CO2astheworkingfluidintheturbine will necessitate a complete redesign of the gas turbine (see Section 3.4.3.2). A recent study (Dillon et al., 2005) gives anoverallefficiencyincludingCO2 compression of 45%. Twotypicalvariantsofthisconfigurationaretheso-calledMatiant and Graz cycles (Mathieu, 2003; Jericha et al., 2003). The Matiant cycle uses CO2astheworkingfluid,andconsistsof features like intercooled compressor and turbine reheat. The exhaust gas is preheating the recycled CO2 in a heat exchanger. The CO2 generated in combustion is extracted from the cycle behind the compressor. The net overall LHV efficiency isexpected to be 45-47% and can increase above 50% in a combinedcycleconfigurationsimilar to thatshowninFigure3.10. The Graz cycle consists of an integrated gas turbine and steamturbinecycle.AnetLHVefficiencyofabove50%hasbeen calculated for this cycle (Jericha et al., 2003). A recent comprehensive review of gas turbine cycles with CO2 capture provides efficiencies of different cycles on acommon basis (Kvamsdal et al., 2004).
3.4.3.2 The CO2/oxy-fuel gas turbineIn existing gas turbines the molecular weight of the gases in the compressor and turbine are close to that of air (28.8). In the case of oxy-fuel combustion with CO2-recycle the compressor fluidmolecularweightisabout43andabout40intheturbine.ThechangeinworkingfluidfromairtoaCO2-rich gas results in a number of changes in properties that are of importance for the design of the compressor, combustor and the hot gas path including the turbine:• The speed of sound is 80% of air;• The gas density is 50% higher than air;• Thespecificheatratioislowerthanairresultinginalower
temperature change on adiabatic compression or expansion. An oxy-fuel gas turbine in a combined cycle has a higher optimal pressure ratio, typically 30 to 35 compared to 15
126 IPCC Special Report on Carbon dioxide Capture and Storage
to 18 used with air in a combined cycle system. With the highest turbine inlet temperature consistent with material limitations, the rather high-pressure ratio results in an exhaust gas temperature of about 600°C, which is optimal for the steam cycle.
These changes in the fundamental properties of the working fluidwillhaveasignificantimpactongasturbinecomponents,requiring completely new designs of compressors, combustors (to account for aerodynamic changes and acoustic feedbacks) and hot gas path (O2 partial pressure must be low in oxy-fuel systems but it is also important to avoid reducing conditions for the materials of the turbine or the change to materials allowing much lower O2 partial pressures).
3.4.4 Oxy-fueldirectheating-steamturbinecycle
In an oxy-fuel steam turbine cycle, water is pressurized as a liquid and is then evaporated, heated by the direct injection and combustion of a fuel with pure oxygen and expanded in a turbine. Most of the water in the low pressure turbine exhaust gas is cooled and condensed, prior to pumping back to a high pressure while the CO2 produced from combustion is removed and compressed for pipeline transport. A variant of this cycle in which the heat is provided by burning natural gas fuel in-situ with pure oxygen was proposed by Yantovskii et al. (1992). The direct combustion of fuel and oxygen has been practised for many years in the metallurgical and glass industries where burners operate at near stoichiometric conditions with flametemperatures of up to 3500°C. A water quenched H2/O2 burner capable of producing 60 tonne h-1, 6 MPa super heated steam was demonstrated in the mid-1980s (Ramsaier et al., 1985). A
recent development by Clean Energy Systems incorporating these concepts where a mixture of 90 % by volume superheated steam and 10% CO2 is produced at high temperature and pressure to power conventional or advanced steam turbines is shown in Figure 3.11. The steam is condensed in a low- pressure condenser and recycled, while CO2 is extracted from thecondenser,purifiedandcompressed.(Andersonet al., 2003 and Marin et al., 2003). Plants of this type require a clean gaseous or liquid fuel and will operate at 20 to 50 MPa pressure. The steam plus CO2 generator is very compact. Control systems must be very preciseasstart-upandincreasetofullflowinapreheatedplantcan take place in less than 2 seconds. Precise control of this very rapid start was demonstrated (Ramsaier et al., 1985) in a 60 tonne steam h-1 unit. The Clean Energy Systems studies claim efficienciesashighas55%withCO2 capture depending on the process conditions used. The Clean Energy Systems technology can be initially applied with current steam turbines (565°C inlet temperature). The main technical issue is clearly the design of the steam turbines which could be used at inlet temperatures up to 1300°C by applying technology similar to that used in the hot path of gas turbines. The combustor itself (the ‘gas generator’) is adapted from existing rocket engine technology. In 2000, Clean Energy Systems proved the concept with a 110 kW pilot project conducted at the University of California Davis. A 20 MW thermal gas generator was successfully operated in a test run of the order of a few minutes in early 2003. A zero emissions demonstration plant (up to 6 MW electrical) is now on-line. US Department of Energy’s National Energy Technology Laboratory designed the reheater (Richards, 2003) and NASA tested it in 2002. Much more technology development and demonstration
Figure 3.10 Principle of the oxy-fuel gas turbine combined cycle. Exhaust gas is recycled, compressed and used in the combustion chamber to control the temperature entering the turbine.
Oxygen is the key requirement for any oxy-fuel combustion system. It is also a key technology for pre-combustion CO2 capture (see Section 3.5). In the next paragraphs, existing large-scale O2 productionmethods are describedfirst, followed byemerging concepts aimed at reducing the energy consumption and cost.
3.4.5.1 Cryogenic oxygen productionThe very large quantities of oxygen required for CO2 capture using the techniques of oxy-fuel combustion and pre-combustion de-carbonization can only be economically produced, at present, by using the established process of oxygen separation from air by distillation at cryogenic temperatures (Latimer, 1967). This is a technology that has been practiced for over 100 years. In a typical cryogenic air separation plant (Castle, 1991; Figure 3.12), air is compressed to a pressure of 0.5 to 0.6 MPa andpurifiedtoremovewater,CO2, N2O and trace hydrocarbons which could accumulate to dangerous levels in oxygen-rich parts of the plant, such as the reboiler condenser. Two or more switching fixed bed adsorbers are used, which can be
regenerated by either temperature or pressure swing, using in each case, a low pressure waste nitrogen stream. The air is cooled against returning products (oxygen and nitrogen) in a batteryof aluminiumplate-finheat exchangers and separatedinto pure oxygen and nitrogen fractions in a double distillation column, which uses aluminium packing. Oxygen can be pumped as liquid and delivered as a high-pressure gas at up to 10 MPa. Pumped oxygen plants have largely replaced the oxygen gas compression systems. They have virtually identical power consumptions but in a pumped cycle, a high-pressure air booster compressor provides a means ofefficientlyvaporizingandheatingtheliquidoxygenstreamto ambient temperature. Current plant sizes range up to 3500 tO2 d-1 and larger single train plants are being designed. Typical power consumption for the delivery of 95% O2 at low pressure (0.17 MPa, a typical pressure for an oxy-fuel application) is 200 to 240 kWh/tO2. There are numerous process cycle variations particularly for the production of oxygen at less than 97.5% purity which have been developed to reduce power and capital cost. Note that adsorption and polymeric membrane methods of air separation are only economic for small oxygen production rates.
3.4.5.2 High temperature oxygen ion transport membranesCeramic mixed metal oxides have been developed which exhibit simultaneous oxygen ion and electron conduction at
Figure 3.11 Principle of the Clean Energy Systems cycle. The combustion of the fuel and oxygen is cooled by injection of liquid-water, which is recycled in the process.
128 IPCC Special Report on Carbon dioxide Capture and Storage
temperatures above 500°C and preferably above 700°C (Skinner and Kilner 2003; Bouwmeester and Van Laar, 2002; Dyer et al., 2000; Bredesen et al., 2004). Typical crystal structures which exhibit these properties include the perovskites and the brownmillerites. The selectivity of these materials for oxygen is infinite.Theoxygenpermeabilityisprimarilycontrolledbytheoxygen ion vacancies in the metal oxide lattice. A difference in oxygen partial pressure across the membrane will cause oxygen
molecules to ionize on the ceramic surface and pass into the crystal structure while simultaneously on the permeate side of the membrane, the oxygen ions give up their electrons and leave the ceramic in the region of lower activity. The electron conduction path is through the metal ions in the lattice. Unlike conventional membranes, the flux through the ceramic is afunction of the partial pressure ratio. In the technical literature, the engineered structures of these ceramic mixed metal oxides are referred to as ion transport membranes, ITM or oxygen transport membranes, OTM. The oxygen transport membrane can be fabricated in the formofplaintubesorashollowfinsonacentralcollectortube(Armstrong et al.,2002).Thefinnedelementsarethenmountedin tube sheets within a pressure vessel with high-pressure air flowingoverthefins.Thereareseveralnewconceptsthathavebeen proposed for using oxygen transport membranes in power cycles with CO2 capture. A prime example of an oxy-fuel gas turbine cycle that incorporates an oxygen transport membrane for oxygen production is the advanced zero emission power plant described in Section 3.4.2.3. Another example is found in Sundnes (1998).
Development statusOxygen transport membrane systems for oxygen production are currently in the early stages of development by at least two consortia receiving research funding from the US Department of Energy and the European Commission. The concept has now
Figure 3.12a Oxygen production by distillation of liquid air.
Figure 3.12b A 3000 t day-1 oxygen plant (Courtesy of Air Products).
Chapter 3: Capture of CO2 129
reached the pilot plant stage and projected cost, manufacturing procedures and performance targets for full size systems have been evaluated. Systems capable of large-scale production are projected to be available after industrial demonstration in about 7 years time (Armstrong et al., 2002).
3.4.6 Chemicalloopingcombustion
Originally proposed by Richter and Knoche (1983) and with subsequentsignificantcontributionsbyIshidaandJin(1994),themain idea of chemical looping combustion is to split combustion of a hydrocarbon or carbonaceous fuel into separate oxidation and reduction reactions by introducing a suitable metal oxide as an oxygen carrier to circulate between two reactors (Figure 3.13).Separationofoxygenfromairisaccomplishedbyfixingthe oxygen as a metal oxide. No air separation plant is required. The reaction between fuel and oxygen is accomplished in a second reactor by the release of oxygen from the metal oxide in a reducing atmosphere caused by the presence of a hydrocarbon or carbonaceous fuel. The recycle rate of the solid material between the two reactors and the average solids residence time in each reactor, control the heat balance and the temperature levels in each reactor. The effect of having combustion in two reactors compared to conventional combustion in a single stage is that the CO2 is not diluted with nitrogen gas, but is almost pure after separation from water, without requiring any extra energy demand and costly external equipment for CO2 separation. Possible metal oxides are some oxides of common transition-state metals, such as iron, nickel, copper and manganese (Zafar et al., 2005). The metal/metal oxide may be present in various forms, but most studies so far have assumed the use of particles with diameter 100-500 µm. In order to move particles between the tworeactors, theparticlesarefluidized.Thismethodalsoensuresefficientheatandmasstransferbetweenthegasesandthe particles. A critical issue is the long-term mechanical and chemical stability of the particles that have to undergo repeated cycles of oxidation and reduction, to minimize the make-up requirement. When a chemical looping cycle is used in a gas turbine cycle, the mechanical strength for crushing and the filtrationsystemisimportanttoavoiddamagingcarry-overtothe turbine. The temperature in the reactors, according to available information in the literature, may be in the range 800°C-
1200°C. NOx formation at these typical operating temperatures will always be low. The fuel conversion in the reduction reactor may not be complete, but it is likely (Cho et al., 2002) that the concentrations of methane and CO when burning natural gas are very small. In order to avoid deposit of carbon in the reduction reactor, it is necessary to use some steam together with the fuel. The chemical looping principle may be applied either in a gas turbine cycle with pressurized oxidation and reduction reactors, or in a steam turbine cycle with atmospheric pressure in the reactors. In the case of a gas turbine cycle, the oxidation reactor replaces the combustion chamber of a conventional gas turbine. The exothermic oxidation reaction provides heat for increasing the air temperature entering the downstream expansion turbine. In addition, the reduction reactor exit stream may also be expanded in a turbine together with steam production for power generation. The cooled low pressure CO2 stream will then be compressed to pipeline pressure. Another option is to generate steam using heat transfer surfaces in the oxidationreactor.Currentcirculatingfluidizedbedcombustiontechnology operating at atmospheric pressure in both the oxidation and reduction stages necessitates the use of a steam turbine cycle for power generation. Using natural gas as fuel in a chemical looping combustion cycle which supplies a gas turbine combined cycle power plant and delivering CO2 at atmospheric pressure, the potential for natural gas fuel-to-electricityconversionefficiencyisestimatedtobeintherange45-50% (Brandvoll and Bolland, 2004). Work on chemical looping combustion is currently in the pilot plant and materials research stage.
3.4.7 Statusandoutlook
Oxy-fuel combustion applied to furnaces, process heaters, boilers and power generation systems is feasible since no technicalbarriersforits implementationhavebeenidentified.Early use of this capture technology is likely to address applications involving indirect heating in power generation and process heating (Section 3.4.2), since these options involve the minimal modification of technologies and infrastructure thathave hitherto been already developed for the combustion of hydrocarbon or carbonaceous fuels in air. However, several novel applications proposed for direct heating in steam turbine cycles or gas turbine cycles for power generation (Sections 3.4.3 and 3.4.4) still require the development of new components such as oxy-fuel combustors, higher temperature tolerant components such as CO2- and H2O-based turbines with blade cooling, CO2 compressors and high temperature ion transport membranes for oxygen separation. As for Chemical Looping Combustion, it is currently still at an early stage of development. The potential for thermal efficiencies for oxy-fuel cycleswith CO2 capture, assuming the current state of development in power plant technology, is depicted in Figures 3.6 and 3.7. Power generation from pulverized coal fired systems, usingsupercriticalsteamconditionspresentlyoperateatefficienciesaround 45% (LHV), while projections to the 2010-2020 time
Figure 3.13 The chemical looping combustion principle in a gas turbine cycle.
130 IPCC Special Report on Carbon dioxide Capture and Storage
frame are predicting efficiencies above 50% (IEA, 2004) forplants using ultra-supercritical steam conditions. An increase in efficiency ofmore than 5% can therefore be expected forfutureoxy-fuelcapturesystemsbasedoncoalfiringthatcouldpotentially match the best efficiencies realisable today forpulverized coal-fired plants without CO2 capture. Similarly, naturalgasfiredcombinedcycleswillhaveefficienciesof65%in 2020 (IEA GHG, 2000b and up from current efficienciesbetween55and58%),whichwillenableplantefficienciesfornaturalgasfiredoxy-fuelcycleswithCO2 capture above 50%. The energy penalty for producing oxygen is by far the most important cause for reduced efficiency in an oxy-fuel cyclecompared to a conventional power plant. Current technology development envisages very high efficiencyseparationofNOx, SOx, and Hg, as part of the CO2 compression and purification system. Improved separationefficienciesofthesecontaminantsarepossiblebasedonfurtherprocess and heat integration in the power cycle. Current cryogenic oxygen technology is showing continuing cost reduction based on improved compressor efficiencies,moreefficientprocessequipmentandlargerscaleplants.Thenew high temperature oxygen membrane could significantlyimprovepowergenerationefficiencyandreducecapitalcost. Future oxy-fuel demonstration plants could be based on retrofits to existing equipment such as process heaters andboilers, in order to minimize development costs and achieve early market entry. In this respect, power systems of reference for oxy-fuel combustion capture are mainly the steam-based pulverized coal and natural gas fired plants that currentlyrepresent up to 1468 GWe, or 40% (IEA WEO, 2004) of the existing global infrastructure (see also Section 3.1.2.3). Several demonstration units may be expected within the next few years particularly in Europe, USA, Canada and Australia where active research initiatives are currently underway. As these developments proceed and the technologies achieve market penetration they may become competitive relative to alternate options based on pre- and post-combustion CO2 capture. A significantincentivetothedevelopmentofoxy-fuelcombustiontechnology, as well as for pre- and post-combustion capture technologies, is the introduction of environmental requirements and/orfiscalincentivestopromoteCO2 capture and storage.
3.5 Pre-combustion capture systems
3.5.1 Introduction
Apre-combustion capture process typically comprises a firststage of reaction producing a mixture of hydrogen and carbon monoxide (syngas) from a primary fuel. The two main routes are to add steam (reaction 1), in which case the process is called ‘steam reforming’, or oxygen (reaction 2) to the primary fuel. In the latter case, the process is often called ‘partial oxidation’ when applied to gaseous and liquid fuels and ‘gasification’when applied to a solid fuel, but the principles are the same.
This is followed by the ‘shift’ reaction to convert CO to CO2 by the addition of steam (reaction 3):
Water Gas Shift ReactionCO + H2O ↔ CO2 + H2 ∆H -41 kJ mol-1 (3)
Finally, the CO2 is removed from the CO2/H2 mixture. The concentration of CO2 in the input to the CO2/H2 separation stage can be in the range 15-60% (dry basis) and the total pressure is typically 2-7 MPa. The separated CO2 is then available for storage. It is possible to envisage two applications of pre-combustion capture. The first is in producing a fuel (hydrogen) that isessentially carbon-free. Although the product H2 does not need to be absolutely pure and may contain low levels of methane, CO or CO2, the lower the level of carbon-containing compounds, the greater the reduction in CO2 emissions. The H2 fuel may also contain inert diluents, such as nitrogen (when air is typically used for partial oxidation), depending on the production process andcanbefiredinarangeofheaters,boilers,gasturbinesorfuel cells. Secondly, pre-combustion capture can be used to reduce the carbon content of fuels, with the excess carbon (usually removed as CO2) being made available for storage. For example, when using a low H:C ratio fuel such as coal it is possible to gasify the coal and to convert the syngas to liquid Fischer-Tropsch fuels and chemicals which have a higher H:C ratio than coal. In this section, we consider both of these applications. This section reports on technologies for the production of H2 with CO2 capture that already exist and those that are currently emerging. It also describes enabling technologies that need to be developed to enhance the pre-combustion capture systems for power, hydrogen or synfuels and chemicals production or combination of all three.
3.5.2 Existingtechnologies
3.5.2.1 Steam reforming of gas and light hydrocarbonsSteam reforming is the dominant technology for hydrogen production today and the largest single train plants produce up to 480 tH2 d-1. The primary energy source is often natural gas, Then the process is referred to as steam methane reforming (SMR), but can also be other light hydrocarbons, such as naphtha. The process begins with the removal of sulphur compounds from the feed, since these are poisons to the current nickel-based catalyst and then steam is added. The reforming reaction (1), which is endothermic, takes place over a catalyst at high temperature (800°C-900°C). Heat is supplied to the reactor tubes by burning part of the fuel (secondary fuel). The reformed gas is cooled in a waste heat boiler which generates the steam needed for the reactions and passed into the CO shift system. Shift reactors in one or two stages are used to convert most of the CO in the syngas to CO2 (Reaction 3, which is exothermic).
Chapter 3: Capture of CO2 131
The conventional two-stage CO conversion reduces the CO concentration in syngas (or in hydrogen) down to 0.2-0.3%. High temperature shift reactors operating between 400°C and 550°C and using an iron-chromium catalyst leave between 2% and 3% CO in the exit gas (dry basis). Copper-based catalyst can be used at temperatures from 180°C-350°C and leave from 0.2-1% CO in the exhaust. Lower CO content favours higher CO2 recovery. The gas is then cooled and hydrogen is produced by a CO2/H2 separation step. Until about 30 years ago, the CO2 was removed using a chemical (solvent) absorption process such as an amine or hot potassium carbonate and was rejected to atmosphere as a pure stream from the top of the regenerator. There are many of these plants still in use and the CO2 could be captured readily. Modern plants, however, use a pressure swing adsorber (PSA), where gases other than H2 are adsorbed in a set of switching beds containing layers of solid adsorbent such as activated carbon, alumina and zeolites (see the fuller description of PSA in Section 3.5.2.9). The H2 exiting the PSA (typically about 2.2 MPa) can have a purity of up to 99.999%, depending on the market need. The CO2 is contained in a stream, from the regeneration cycle, which contains some methane and H2. The stream is used as fuel in the reformer where it is combusted in air and the CO2 ends up being vented to atmosphere in the reformerfluegas.Hence, to captureCO2 from modern SMR plants would require one of the post-combustion processes described above in Section 3.3. Alternatively, the PSA system could be designed not only for high recovery of pure H2 but also to recover pure CO2 and have a fuel gas as the third product stream. In a design study for a large modern plant (total capacity 720 tH2 d-1),theoverallefficiencyofmaking6.0MPaH2 from natural gas with CO2 vented that is without CO2 capture, is estimated to be 76%, LHV basis, with emissions of 9.1 kg CO2/kg H2 (IEAGHG, 1996).The process can bemodified (at acost) to provide a nearly pure CO2 co-product. One possibility is to remove most of the CO2 from the shifted, cooled syngas in a ‘wet’ CO2 removal plant with an appropriate amine solvent. In this case the CO2-deficientsyngasexitingtheaminescrubberispassed to a PSA unit from which relatively pure H2 is recovered and the PSA purge gases are burned along with additional natural gas to provide the needed reformer heat. The CO2 is recovered from the amine solvent by heating and pressurized for transport. Taking into account the power to compress the CO2(to11.2MPa)reducestheefficiencytoabout73%andtheemission rate to 1.4 kgCO2/kgH2, while the CO2 removal rate is 8.0 kgCO2/kgH2.
3.5.2.2 Partial oxidation of gas and light hydrocarbonsIn the partial oxidation (POX) process (reaction 2), a fuel reacts with pure oxygen at high pressure. The process is exothermic and occurs at high temperatures (typically 1250°C-1400°C). All the heat required for the syngas reaction is supplied by the partial combustion of the fuel and no external heat is required. As with SMR, the syngas will be cooled, shifted and the CO2 removed from the mixture. The comments made on the
separation of CO2 from SMR syngas above apply equally to the POX process. POX is a technology in common use today, the efficiencyislowerthanSMR,buttherangeoffuelsthatcanbeprocessed is much wider. For large-scale hydrogen production, the oxygen is supplied from a cryogenic air separation unit (ASU). The high investment and energy consumption of the ASU is compensated by the higherefficiencyandlowercostofthegasificationprocessandthe absence of N2 (from the air) in the syngas, which reduces the separation costs considerably. However for pre-combustion de-carbonization applications, in which the hydrogen would be used as fuel in a gas turbine, it will be necessary to dilute the H2 with either N2orsteamtoreduceflametemperatureinthegasturbine combustor and to limit NOx emission levels. In this case themostefficientsystemwilluseairastheoxidantandproducea H2/N2 fuel mixture (Hufton et al. 2005)
3.5.2.3 Auto-thermal reforming of gas and light hydrocarbons
The autothermal reforming (ATR) process can be considered as a combination of the two processes described above. The heat required in the SMR reactor is generated by the partial oxidation reaction (2) using air or oxygen, but because steam is supplied to the reactor as well as excess natural gas, the endothermic reforming reaction (1) occurs in a catalytic section of the reactor downstream of the POX burner. The addition of steam enables a high conversion of fuel to hydrogen at a lower temperature. Operating temperatures of the autothermal process are typically 950-1050°C, although this depends on the design of the process. An advantage of the process, compared to SMR, is the lower investment cost for the reactor and the absence of any emissions of CO2 since all heat release is internal, although this is largely offset by investment and operating cost for the oxygen plant. The range of fuels that can be processed is similar to the SMR process, but the feed gas must be sulphur free. CO2 capture is accomplished as described above for the steam methane reforming.
3.5.2.4 Gas heated reformerEach of the three syngas generation technologies, SMR, ATR and POX produce high temperature gas which must be cooled, producingineachcaseasteamflowinexcessofthatrequiredby the reforming and shift reactions. It is possible to reduce this excess production by, for example, using preheated air and a pre-reformer in an SMR plant. Another technique is to use the hot syngas, leaving the primary reactor, as the shell-side heatingfluidinatubularsteam/hydrocarbonreformingreactorwhich can operate in series, or in parallel, with the primary reactor (Abbott et al., 2002). The addition of a secondary gas heated reformer will increase the hydrogen production by up to 33% and eliminate the excess steam production. The overall efficiency is improved and specific capital cost is typicallyreduced by 15%. Again, CO2 capture is accomplished as described previously for steam methane reforming.
132 IPCC Special Report on Carbon dioxide Capture and Storage
Gasification (see Figure 3.14) is a chemical process aimedat making high-value products (chemicals, electricity, clean synthetic fuels) out of low-value solid feedstocks such as coal,oilrefiningresidues,orbiomass.Gasificationisbasicallypartial oxidation (reaction 2), although steam is also supplied to the reactor inmost processes. Fixed bed, fluidized bed orentrained flow gasifiers can be used. These can have verydifferent characteristics with respect to oxidant (air or O2), operating temperature (up to 1350oC), operating pressure (0.1-7 MPa), feed system (dry or water slurry), syngas cooling method (water quench or via radiative and convective heat exchangers) and gas clean-up system deployed. These alternative design options determine the fraction of feedstock converted to syngas, syngas composition and cost. As economics depend strongly on scale, gasification is generally considered to be suitable onlyforlargeplants.ThegasifieroutputcontainsCO,H2, CO2, H2O and impurities (e.g., N2, COS, H2S, HCN, NH3, volatile trace minerals and Hg) that must be managed appropriately. A worldwide survey of commercial gasification projectsidentified128operatinggasificationplantswith366gasifiersproducing 42,700 MWt of syngas (NETL-DOE, 2002 and Simbeck, 2001a). There are also about 24,500 MWt of syngas projects under development or construction, with 4000-5000 MWt of syngas added annually. The feedstocks are mainly higherrankcoalsandoilresidues.Mostcommercialgasificationgrowthforthelast20yearshasinvolvedentrained-flowgasifiers,for which there are three competing systems on the market. Recentcommercialgasificationdevelopmenthasbeenmainlywith industrial ammonia production, industrial polygeneration (in which clean syngas is used to make electricity and steam
along with premium syngas chemicals) and IGCC power plants. Commercialexperiencewithbiomassgasificationandfluidizedbedgasificationhasbeenlimited. CO2capturetechnologyiswellestablishedforgasificationsystems that make chemicals and synthetic fuels (NETL-DOE, 2002).Gasification-basedNH3 plants (many in China) include making pure H2 and CO2 separation at rates up to 3500 tCO2 d-1 per plant. South African plants making Fischer-Tropsch fuels and chemicals and a North Dakota plant making synthetic natural gas (SNG) from coal also produce large streams of nearly pure CO2. Figure 3.15 shows a picture of the North Dakotagasificationplantinwhich3.3MtCO2 yr-1 is captured using a refrigerated methanol-based, physical solvent scrubbing process (Rectisol process, see Section 3.5.2.11 and Table 3.2). Most of this captured CO2 is vented and about 1.5 Mtonnes yr-1 of this stream is currently pipelined to the Weyburn, Canada enhanced oil recovery and CO2 storage project (see Chapter 5). When CO2 capture is an objective, O2-blown and high-pressure systems are preferred because of the higher CO2 partial pressures. De-carbonization via gasification entails lowerenergy penalties for CO2 capture than does post-combustion capture when considering only the separation stage, because the CO2 can be recovered at partial pressures up to 3 orders of magnitude higher. This greatly reduces CO2 absorber size, solvent circulation rates and CO2 stripping energy requirements. However, additional energy penalties are incurred in shifting the CO in the syngas to CO2 and in other parts of the system (see examples for IGCC plant with CO2 capture in Figures 3.6 and 3.7). Recent analyses for bituminous coals (see, for example, IEA GHG, 2003) suggest using simple high-pressure
Figure 3.14 SimplifiedschematicofagasificationprocessshowingoptionswithCO2 capture and electricity, hydrogen or chemical production.
Chapter 3: Capture of CO2 133
entrained-flowgasifierswithwaterslurryfeedanddirectwaterquench followed by ‘sour’ (sulphur-tolerant) shift reactors and finallyco-removalofCO2 and H2S by physical absorption. With sourshifting,hotrawsyngasleavingthegasifierrequiresonlyone cooling cycle and less processing. Oxygen requirements increase for slurry fed gasifiers and conversion efficienciesdeclinewithhighercycleefficiencylosseswithquenchcooling.Similar trends are also noted with a shift from bituminous to lower rank sub-bituminous coal and lignite (Breton and Amick, 2002). Some analyses (e.g., Stobbs and Clark, 2005) suggest that the advantages of pre-combustion over post-combustion de-carbonization may be small or disappear for low-rank coals converted with entrained-flow gasifiers. High-pressure,fluidized-bedgasifiersmaybebettersuitedforusewith low-rank coals, biomass and various carbonaceous wastes. Although thereareexamplesofsuccessfuldemonstrationofsuchgasifiers(e.g., the high temperature Winkler, Renzenbrink et al., 1998), there has been little commercial-scale operating experience. The H2S in syngas must be removed to levels of tens of ppm for IGCC plants for compliance with SO2 emissions regulations and to levels much less than 1 ppm for plants that make chemicals or synthetic fuels, so as to protect synthesis catalysts. If the CO2 must be provided for storage in relatively pureform,thecommonpracticewouldbetorecoverfirstH2S (which is absorbed more readily than CO2) from syngas (along with a small amount of CO2) in one recovery unit, followed by reduction of H2S to elemental sulphur in a Claus plant and tail gas clean-up, and subsequent recovery of most of the remaining CO2 in a separate downstream unit. An alternative option is to recover sulphur in the form of sulphuric acid (McDaniel and Hormick, 2002). If H2S/CO2 co-storage is allowed, however, it would often be desirable to recover H2S and CO2 in the same physical absorption unit, which would lead to moderate system cost savings (IEA GHG, 2003; Larson and Ren, 2003; Kreutz et al., 2005) especially in light of the typically poor prospects
for selling byproduct sulphur or sulphuric acid. Although co-storage of H2S and CO2 is routinely pursued in Western Canada as an acid gas management strategy for sour natural gas projects (Bachu and Gunter, 2005), it is not yet clear that co-storage wouldberoutinelyviableatlargescales-atypicalgasification-based energy project would involve an annual CO2 storage rate of 1-4 Mtonnes yr-1, whereas the total CO2 storage rate for all 48 Canadian projects is presently only 0.48 Mtonnes yr-1 (Bachu and Gunter, 2005).
In a coal IGCC, syngas exiting the gasifier is cleaned ofparticles, H2S and other contaminants and then burned to make electricity via a gas turbine/steam turbine combined cycle. The syngas is generated and converted to electricity at the same site, both to avoid the high cost of pipeline transport of syngas (with a heating value only about 1/3 of that for natural gas) and to cost-effectively exploit opportunities for making extra power in the combined cycle’s steam turbine using steam from syngas cooling. The main drivers for IGCC development were originally the prospects of exploiting continuing advances in gas turbine technology, the ease of realizing low levels of air-pollutant emissions when contaminants are removed from syngas, and greatly reduced process stream volumes compared tofluegasstreamsfromcombustionwhichareatlowpressureand diluted with nitrogen from air. Since the technology was initially demonstrated in the 1980s, about 4 GWe of IGCC power plants have been built. Most of this capacity is fuelled with oil or petcoke; less than 1 GWe of the total is designed for coal (IEA CCC, 2005) and 3 out of 4 plants currently operating on coal and/or petcoke. This experience has demonstrated IGCC load-following capability, although the technology will probably be used mainly in base load applications. All coal-based IGCC projects have been subsidized, whereas only the Italian oil-based IGCC projects have been subsidized. Other polygeneration projects in Canada, the Netherlands and the United States, as well as an oil-based IGCC in Japan, have not been subsidized (Simbeck, 2001a). IGCC has not yet been deployed more widely because of strong competition from the natural gas combined cycle (NGCC) wherever natural gas is readily available at low prices, because coal-based IGCC plants are not less costly than pulverized coal fired steam-electric plants and because of availability(reliability) concerns. IGCC availability has improved in recent years in commercial-scale demonstration units (Wabash River Energy, 2000; McDaniel and Hornick, 2002). Also, availability has been better for industrial polygeneration and IGCC projects at oil refineries and chemical plants where personnel areexperienced with the chemical processes involved. The recent rise in natural gas prices in the USA has also increased interest in IGCC. BecauseoftheadvantagesforgasificationofCO2 capture at high partial pressures discussed above, IGCC may be attractive for coal power plants in a carbon-constrained world (Karg and Hannemann, 2004). CO2 capture for pre-combustion systems
Figure 3.15 NorthDakotacoalgasificationplantwith3.3MtCO2 yr−1capture using a cold methanol, physical solvent process (cluster of 4 tall columns in the middle of the picture represent the H2S and CO2 capture processes; part of the captured stream is used for EOR with CO2 storage in Weyburn, Saskatchewan, Canada).
134 IPCC Special Report on Carbon dioxide Capture and Storage
is commercially ready, however, no IGCC plant incorporating CO2 capture has yet been built. With current technology, average estimates of the energy penalties and the impact of increased fuel use for CO2 removal are compared with other capture systems in Figures 3.6 and 3.7 and show the prospective potential of IGCC options. The data in Figures 3.6 and 3.7 also show that some IGCC options may be different from others (i.e., slurry fed and quench cooled versus dry feed and syngas cooling) and their relative merits in terms of the capital cost of plant and the delivered cost of power are discussed in Section 3.7.
3.5.2.7 Hydrogen from coal with CO2 captureRelative to intensively studied coal IGCC technology with CO2 capture, there are few studies in the public domain on making H2 fromcoalviagasificationwithCO2 capture (NRC, 2004; Parsons 2002a, b; Gray and Tomlinson, 2003; Chiesa et al., 2005; Kreutz et al., 2005), even though this H2 technology is well established commercially, as noted above. With commercial technology, H2 with CO2capturecanbeproducedviacoalgasificationinasystem similar to a coal IGCC plant with CO2 capture. In line with the design recommendations for coal IGCC plants described above (IEA GHG, 2003), what follows is the description from a design study of a coal H2 system that produces, using best available technology, 1070 MWt of H2 from high-sulphur (3.4%) bituminous coal (Chiesa et al., 2005; Kreutz et al., 2005). In the basecasedesign,syngasisproducedinanentrainedflowquenchgasifier operated at 7MPa.The syngas is cooled, cleaned ofparticulate matter, and shifted (to primarily H2 and CO2) in sour water gas shift reactors. After further cooling, H2S is removed from the syngas using a physical solvent (Selexol). CO2 is then removed from the syngas, again using Selexol. After being stripped from the solvents, the H2S is converted to elemental S in a Claus unit and a plant provides tail gas clean-up to remove residual sulphur emissions; and the CO2 is either vented or dried and compressed to 150 atm for pipeline transport and underground storage. High purity H2 is extracted at 6 MPa from the H2-rich syngas via a pressure swing adsorption (PSA) unit. The PSA purge gas is compressed and burned in a conventional gas turbine combined cycle, generating 78 MWe and 39 MWe of electricity in excess of onsite electricity needs in the without and with CO2 capture cases, respectively. For this base case analysis, theeffectiveefficiencyofH2 manufacture was estimated to be 64% with CO2 vented and 61% with CO2 captured, while the corresponding emission rates are 16.9 kgCO2 and 1.4 kgCO2/kgH2, respectively. For the capture case, the CO2 removal rate was 14.8 kgCO2/kgH2.Variousalternativesystemconfigurationswere explored. It was found that there are no thermodynamic or cost advantages from increasing the electricity/H2 output ratio, so this ratio would tend to be determined by relative market demands for electricity and H2. One potentially significantoption for reducing the cost of H2 with CO2 capture to about the same level as with CO2 vented involves H2S/CO2 co-capture in a single Selexol unit, as discussed above.
3.5.2.8 Carbon-basedfluidfuelsandmulti-productsAs discussed in Chapter 2, clean synthetic high H/C ratio fuels
canbemadefromsyngasviagasificationofcoalorotherlowH/C ratio feedstocks. Potential products include synthetic natural gas, Fischer-Tropsch diesel/gasoline, dimethyl ether, methanol and gasoline from methanol via the Mobil process. A byproduct is typically a stream of relatively pure CO2 that can be captured and stored. Coal derived Fischer-Tropsch synfuels and chemicals have been produced on a commercial scale in South Africa; coal methanol is produced in China and at one US plant; and coal SNG is produced at a North Dakota (US) plant (NETL-DOE, 2002). Since 2000, 1.5 MtCO2 yr-1 from the North Dakota synthetic natural gas plant (see Figure 3.15) have been transported by pipeline, 300 km to theWeyburn oil field in Saskatchewan,Canada for enhanced oil recovery with CO2 storage. Synfuel manufacture involves O2-blowngasificationtomakesyngas, gas cooling, gas clean-up, water gas shift and acid gas (H2S/CO2) removal. Subsequently cleaned syngas is converted catalytically to fuel in a synthesis reactor and unconverted syngas is separated from the liquid fuel product. At this point either most unconverted gas is recycled to the synthesis reactor to generate additional liquid fuel and the remaining unconverted gas is used to make electricity for onsite needs, or syngas is passed only once through the synthesis reactor, and all unconverted syngas is used for other purposes, for example, to make electricity for sale to the electric grid as well as for onsite use. The latter once through option is often more competitive as a technology option (Williams, 2000; Gray and Tomlinson, 2001; Larson and Ren, 2003; Celik et al., 2005). New slurry-phase synthesis reactors make the once through configuration especially attractive for CO-rich (e.g., coal-derived) syngas by making high once through conversion possible. For once through systems, a water gas shift reactor is often placed upstream of the synthesis reactor to generate the H2/CO ratio that maximizes synfuel conversion in the synthesis reactor. It is desirable to remove most CO2 from shifted syngas to maximize synthetic fuel conversion. Also, because synthesis catalysts are extremely sensitive to H2S and various trace contaminants, these must be removed to very low levels ahead of the synthesis reactor. Most trace metals can be removed at low-cost using an activated carbonfilter.CO2 removal from syngas upstream of the synthesis reactor is a low-cost, partial de-carbonization option, especially when H2S and CO2 are co-captured and co-stored as an acid gas management strategy (Larson and Ren, 2003). Further de-carbonization can be realized in once through systems, at higher incremental cost, by adding additional shift reactors downstream of the synthesis reactor, recovering the CO2, and using the CO2-depleted, H2-rich syngas to make electricity or some mix of electricity plus H2 in a‘polygeneration’configuration(seeFigure3.16).Therelativeamounts of H2 and electricity produced would depend mainly on relative demands, as there do not seem to be thermodynamic or cost advantages for particular H2/electricity production ratios (Chiesa et al., 2005; Kreutz et al., 2005). When syngas is de-carbonized both upstream and downstream of the synthesis reactor (see Figure 3.16) it is feasible to capture and store as CO2 up to 90% of the carbon in the original feedstock except
Chapter 3: Capture of CO2 135
that contained in the synthetic fuel produced. An example of such a system (Celik et al., 2005) is one making 600 MW of dimethyl ether (containing 27% of coal input energy and 20% of coal input carbon) plus 365 MW of electricity (no H2) from coal. For this system the CO2 storage rate (equivalent to 74% of C in coal) is 3.8 Mtonnes yr-1 (39% from upstream of the synthesis reactor). The estimated fuel cycle-wide GHG emissions for dimethyl ether are 0.9 times those for crude oil-derived diesel and those for electricity are 0.09timesthosefora43%efficientcoal-firedpowerplantwithCO2 vented.
3.5.2.9 Pressure swing adsorptionPressure Swing Adsorption (PSA) is the system of choice for the purification of syngas, where high purity H2 is required. However, it does not selectively separate CO2 from the other waste gases and so for an SMR application the CO2 concentration in the waste gas would be 40-50% and require further upgrading to produce pure CO2 for storage. Simultaneous H2 and CO2 separation is possible by using an additional PSA section to remove the CO2 prior to the H2 separation step, such as the Air Products Gemini Process (Sircar, 1979). The PSA process is built around adsorptive separations of cyclic character. The cycles consist of two basic steps: adsorption, in which the more adsorbable species are selectively removed from the feed gas and regeneration (desorption), when these species are removed from the adsorbent so that it can be ready for the next cycle. It is possible to obtain useful products during both adsorption and regeneration. The principal characteristic of PSA processes is the use of a decrease in pressure and/or the purge by a less adsorbable gas to clean the adsorbent bed. Apart from adsorption and regeneration, a single commercial PSA cycle consists of a number of additional steps, including co- and counter-current pressurization, pressure equalization and co- and counter-current depressurization. A detailed description of the PSA technique, along with its practical applications can be found elsewhere (Ruthven et al., 1994).
3.5.2.10 Chemical solvent processesChemical solvents are used to remove CO2 from syngas at partial pressures below about 1.5 MPa (Astarita et al., 1983) and are similar to those used in post-combustion capture (see Section 3.3.2.1). The solvent removes CO2 from the shifted syngas by
means of a chemical reaction, which can be reversed by pressure reduction and heating. The tertiary amine methyldiethanolamine (MDEA, see Table 3.2) is widely used in modern industrial processes, due to the high CO2 loading possible and the low regenerator heating load, relative to other solvents. Hot potassium carbonate (the most common commercial version of whichisknownasBenfield)wasusedforCO2 removal in most hydrogen plants until about 15 years ago.
3.5.2.11 Physical solvent processesPhysical solvent (or absorption) processes are mostly applicable to gas streams which have a high CO2 partial pressure and/or a high total pressure. They are often used to remove the CO2 from the mixed stream of CO2 and H2 that comes from the shift reaction in pre-combustion CO2 capture processes, such as product from partial oxidation of coal and heavy hydrocarbons. The leading physical solvent processes are shown in Table 3.2. The regeneration of solvent is carried out by release of pressure at which CO2 evolves from the solvent, in one or more stages. If a deeper regeneration is required the solvent would be stripped by heating. The process has low energy consumption, as only the energy for pressurizing the solvent (liquid pumping) is required. The use of high sulphur fossil fuels in a pre-combustion capture process results in syngas with H2S. Acid gas components must be removed. If transport and storage of mixed CO2 and H2S is possible then both components can be removed together. Sulphinol was developed to achieve significantly highersolubilities of acidic components compared to amine solvents, without added problems of excessive corrosion, foaming, or solution degradation. It consists of a mixture of sulpholane (tetrahydrothiophene 1,1-dioxide), an alkanolamine and water in various proportions depending on the duty. If pure CO2 is required, then a selective process is required using physical solvents - often Rectisol or Selexol. The H2S must be separated atsufficientlyhighconcentration(generally>50%)tobetreatedin a sulphur recovery plant.
3.5.2.12 Effect on other pollutantsPre-combustion capture includes reforming, partial oxidation or gasification. In order to maintain the operability of thecatalyst of reformers, sulphur (H2S) has to be removed prior toreforming.Ingasification,sulphurcanbecapturedfromthe
Figure 3.16 Makingliquidfuel,electricityandhydrogenfromcoalviagasification,withCO2 capture and storage.
136 IPCC Special Report on Carbon dioxide Capture and Storage
syngas,andinthecasewhenliquidorsolidfuelsaregasified,particulates, NH3, COS and HCN are also present in the system that need to be removed. In general, all of these pollutants can be removed from a high-pressure fuel gas prior to combustion, where combustion products are diluted with nitrogen and excess oxygen. In the combustion of hydrogen or a hydrogen-containing fuel gas, NOx may be formed. Depending upon combustion technology and hydrogen fraction, the rate at which NOx is formed may vary. If the volumetric fraction of hydrogen is below approximately 50-60%, NOx formation is at the same level as for natural gas dry low-NOx systems (Todd and Battista, 2001). In general, with the exception of H2S that could be co-removed with CO2,otherpollutantsidentifiedaboveareseparatedin additional pretreatment operations, particularly in systems that gasify liquid or solid fuels. High temperature pretreatment operations for these multi-pollutants that avoid cooling of the syngashavetheadvantageofimprovingthecycleefficiencyoftheoverallgasificationprocess,buttheseseparationprocesseshave not been commercially demonstrated. Although it is not yet regulated as a ‘criteria pollutant’, mercury (Hg), is currently the focus of considerable concern as apollutantfromcoalpowersystems.ForgasificationsystemsHg can be recovered from syngas at ambient temperatures at verylow-cost,comparedtoHgrecoveryfromfluegases(Klettet al., 2002).
3.5.3 Emergingtechnologies
Emerging options in both natural gas reforming and coal gasification incorporate novel combined reaction/separationsystems such as sorption-enhanced reforming and sorption-enhanced water gas shift, membrane reforming and membrane water gas shift. Finally there is a range of technologies that make use of the carbonation of CaO for CO2 capture.
3.5.3.1 Sorption enhanced reactionA concept called Sorption Enhanced Reaction (SER) uses a packed bed containing a mixture of a catalyst and a selective adsorbent to remove CO2 from a high temperature reaction zone, thus driving the reaction to completion. (Hufton et al., 1999). The adsorbent is periodically regenerated by using a pressure swing, or temperature swing adsorption system with steam regeneration (Hufton et al., 2005). High temperature CO2 adsorbents such as hydrotalcites (Hufton et al., 1999) or lithium silicate (Nakagawa and Ohashi, 1998) can be mixed with a catalyst to promote either the steam methane reforming reaction (Reaction 1) or water gas shift reaction (Reaction 3) producing pure hydrogen and pure CO2 in a single process unit. The continuous removal of the CO2 from the reaction products by adsorption shifts each reaction towards completion. The SER can be used to produce hydrogen at 400-600oC to fuel a gas turbine combined cycle power generation system. A design study based on a General Electric 9FA gas turbine with hot hydrogen, produced from an air blown ATR with a
sorption enhanced water gas shift reactor, gave a theoretical net efficiencyof48.3%with90%CO2 capture at 99% purity and 150 bar pressure (Hufton et al., 2005). The process is currently at the pilot plant stage.
3.5.3.2 Membrane reactors for hydrogen production with CO2 capture
Inorganic membranes with operating temperatures up to 1000°C offer the possibility of combining reaction and separation of the hydrogen in a single stage at high temperature and pressure to overcome the equilibrium limitations experienced in conventional reactor configurations for the production ofhydrogen. The combination of separation and reaction in membrane steam reforming and/or membrane water gas shift offers higher conversion of the reforming and/or shift reactions due to the removal of hydrogen from these equilibrium reactions as shown in Reactions (1) and (3) respectively. The reforming reaction is endothermic and can, with this technique, be forced to completion at lower temperature than normal (typically 500-600°C). The shift reaction being exothermic can be forced to completion at higher temperature (500-600°C). Another reason to incorporate H2 separation membranes in the hydrogen production system is that CO2 is also produced without the need for additional separation equipment. Membrane reactors allow one-step reforming, or a single intermediate water gas shift reaction, with hydrogen separation (the permeate) leaving behind a retentate gas which is predominantly CO2 and a small amount of non-recovered hydrogen and steam. This CO2 remains at the relatively high pressure of the reacting system (see Figure 3.17). Condensation of the steam leaves a concentrated CO2 stream at high pressure, reducing the compression energy fortransportandstorage.Membranereformingwillbenefitfromhigh-pressure operation due to the increased H2 partial pressure differential across the membrane which is the driving force for hydrogen permeation. Therefore membrane reactors are also seen as a good option for pre-combustion de-carbonization where a low-pressure hydrogen stream for fuel gas and a high-pressure CO2-rich stream for transport and storage are required. The use of the membrane reformer reactor in a gas turbine combined cycle means that the hydrogen needs to be produced at such pressure that the significant power consumption forthe hydrogen compression is avoided. This could be done by increasing the operating pressure of the membrane reactor or by using a sweep gas, for instance steam, at the permeate side of the membrane (Jordal et al., 2003). For these membrane reactor concepts, a hydrogen selective membrane capable of operating in a high-temperature, high-pressure environment is needed. In the literature a number of membrane types have been reported that have these capabilities and these are listed in Table 3.3. Microporous inorganic membranes based upon surface diffusion separation exhibit rather low separation factors (e.g., H2/CO2 separation factor of 15). However, the separation ability of the current commercially available gamma-alumina and silica microporous membranes (which have better separation factors, up to 40) depends upon the stability of the membrane pore size, which is adversely
Chapter 3: Capture of CO2 137
affected by the presence of steam in the feed streams. The dense ceramic membranes based on inorganic perovskite oxides (also called proton conducting) need high temperatures, higher than 800oC, to achieve practical hydrogen flux rates. Palladium-based dense membranes are also known for their high hydrogen selectivity and permeability over other gases in the temperature range 300°C-600oC that is appropriate for these two reactions. Palladium alloy tubes have been available for several decades, but for CCS applications they are too expensive due to the membrane thickness needed for structural stability and consequentlylowhydrogenfluxrates.Inordertobesuitableforthe target application, a hydrogen separation membrane must have adequate selectivity andflux rate andmust be stable inthe reducing coal gas or fuel-reforming environment containing steam and hydrogen sulphide. A number of membrane reactor developments have been reported for hydrogen production with CO2 capture. Several groups have evaluated methane steam reforming membrane
reactors based on palladium alloy membranes (Middleton et al., 2002, Damle and Dorchak, 2001). These evaluations showed that membrane reactors could achieve 90% CO2 recovery and that at this moment the projected cost is nearly identical to that for a conventional system. However, a cost-reduction can be achieved by either reducing the material cost of the membrane or by increasing the permeability. Similar evaluations of membrane reactors for the shift conversion and separation of CO2 from syngas produced fromheavy feeds by gasificationhave been reported (Bracht et al., 1997; Middleton 2002; Lowe et al.,2003).Forthesegasifiersystemsthemembranereactorscould reduce the costs for capturing CO2 and the cost reduction would be more significant if they could be made sulphurtolerant.
3.5.3.3 Microchannel reformerMicroreactor technology can be used to produce a SMR, or low temperature air-based POX system using a multichannel plate-
Figure 3.17 Operating principle of a membrane reactor.
table 3.3 Membrane materials, operating conditions and characteristics for H2 separation.
microporous Ceramic
microporous Ceramic
microporous Carbon
Zeolites metal
Membrane material Alumina Silica Carbon Silica (Alumina) Pd/AgTemperature range (°C) <500 <400 <400 <500 - 700 <600Pressure range (bar) >100 >100 10 >100 >100Pore size distribution (nm) 0.7-2 0.7-2 0.7-2 0.3-0.7 no poresSeparation factors (H2/CO2) 15 15 15-25 50 100Permeability (mol m-2s-1Pa-1) 10-6 10-6 10-7 10-6 10-7-10-6
Experim. temp. (°C) 200 200 300-400 300-400 300-400Pre-clean-up requirements S S, HCl, HF (?)Chemical resistance problem H2O O2 S S, HCl, HFGeometry Top layer tube Top layer tube Top layer tube/fibre Top layer tube Top layer tube/plateConfiguration Cascade/recycle/
138 IPCC Special Report on Carbon dioxide Capture and Storage
finheatexchanger, fabricated instainlesssteelorhighnickelalloy by vacuum brazing or diffusion bonding. AnSMRreactorconsistsofalternatepassageshavingfins,which are coated with catalyst or porous catalyst insets. Heat is produced by catalytic combustion of fuel gas premixed with air and transferred by conduction to the adjacent passage fed with the steam/hydrocarbon mixture, where the reforming reaction takes place (Babovic et al., 2001). Very compact high efficiencysystemscanbeproduced.Although theseunitsarebeing currently developed by a number of groups for small-scale H2 production for fuel cell applications, they also show promise in larger H2 plants.
3.5.3.4 Conversion to hydrogen and carbonThermal cracking or pyrolysis of methane is the reaction where methane reacts to carbon and hydrogen through:
Methane pyrolysis:CH4 → C + 2 H2 (4)
The main advantage of the process is that it can potentially yield a clean gas (free of carbon oxides) that could be used directly for power production, but a disadvantage is that the chemical energy from the oxidation of carbon to CO2 is not released. The cracking reaction is endothermic and so heat has to be supplied to the reaction. If the natural gas is converted fully, the theoretical yield of hydrogen corresponds to 60% of the heating value of the natural gas. The amount of carbon, which can be obtained, corresponds to 49% of the heating value, with the extra 9% of the energy in this calculation being provided as endothermic heat shown by reaction (4) above. Therefore full conversion can be achieved only if heat is supplied from an external source. If full conversion of methane is not achieved, the remaining methane will be combusted to produce heat. There are many different methods under development for reactors based on this principle, including thermal catalytic, thermal non-catalytic and plasma cracking. In the plasma cracking process natural gas or other hydrocarbons are supplied to a plasma reactor where the hydrocarbons are cracked under pyrolysis conditions (i.e., in absence of oxides, e.g., steam, which can supply oxygen to form CO or CO2). The plasma arc, for which electricity is used, supplies the heat for the cracking reaction. Advantages of the processareitsflexibilitywithrespecttothefuelandthehighquality carbon black which can be produced. Two small-scale plasma cracking processes for hydrogen/syngas production have been in development. The Glid Arc process has been developed by the Canadian Synergy Technologies Corporation. The second process is the Kvaerner CB&H process. Kvaerner has reported results for a pilot plant producing 1000 Nm³ hydrogen per hour and 270 kg or 500 kg carbon black using natural gas and aromatic oil respectively (IEA GHG, 2001).
3.5.3.5 Technologies based on calcium oxideThere is a range of pre-combustion systems that make use of the carbonation reaction of CaO at high pressures and temperatures,
to further integrate the gasification of the fuel (if solid), theshift reaction, and in-situ CO2 removal with CaO. The overall reaction aimed in the system is:
Carbonation of calcium oxide:CaO + C + 2 H2O → CaCO3 + 2H2 (5)
The regeneration of the sorbent produces pure CO2 when carried out in a separate reactor by calcining CaCO3. A range of systems can be developed under this general reaction schemedependingonthetechnologyadoptedforgasification,carbonation-calcination, hydrogen utilization route and storage option for CO2.ThefirstoftheseconceptswasproposedattheLos Alamos National Laboratory (USA) and is currently under development as the Zero Emission Coal Alliance (ZECA) process. The full system includes (Lackner et al., 2001) a hydro-gasificationreactor,solidoxidefuelcellandatechnologyformineral carbonation. However, the fuel cell will require more development and mineral carbonation is only at the laboratory investigation stage (see Section 7.2 for a discussion of mineral carbonation). The HyPrRing process (Lin et al., 2002) is being developed by the Center for Coal Utilization of Japan. It integrates gasification,reformingandin situ CO2 capture in a single reactor at pressures above 12 MPa and temperature above 650ºC. Projects in Norway using natural gas and in Germany using brown coal (Bandi et al., 2002) are also underway developing pre-combustion systems using capture of CO2 with CaO. Finally, General Electric (Rizeq et al., 2002) is developing an innovative system involving the capture of CO2inthegasificationreactorby a high temperature sorbent and with calcination in a separate reactor by burning part of the fuel with an oxygen carrier. All these systems are at an early stage of development. Detailed process simulations show that the efficiencies arepotentially high because most of the energy employed for sorbent regeneration is effectively transferred to the H2 generated in reaction (5). The systems are aimed at very large-scale generation of electricity and/or H2 and cement production (from the deactivated sorbent, CaO). However, many uncertainties remain concerning the performance of the individual units and their practical integration. The main challenge may be the regeneration of the sorbent at very high temperatures (>9000C), to produce a pure stream of CO2. Another is the operating conditionstoachievesufficientconversiontowardshydrogen,without the use of a catalyst for the shift reaction.
3.5.4 Enablingtechnologies
The performance and cost of a pre-combustion capture system is linked to the availability of the enabling technologies that complete the system. In this section we consider the availability of industrial systems, to produce heat from the de-carbonized fuel and gas turbines and fuel cells to produce power.
Chapter 3: Capture of CO2 139
3.5.4.1 Use of de-carbonized fuel in industrial systemsThe use of hydrogen as a fuel for conventional fired heatersand boilers is considered to be proven and indeed it is practiced at certain industrial sites. There is a very large stock of capital equipment of this type and so the use of hydrogen as a fuel might be considered a valuable technology option in a carbon-constrained world. A study (IEA GHG, 2000c) has looked at the costofconvertinganexistingrefinerytousehydrogenfuel.
3.5.4.2 Use of de-carbonized fuel in gas turbine systemsThere is extensive commercial experience with hydrogen-rich fuelgasfiring ingas turbines.Forexample,GeneralElectricreports over 450,000 hours of operating experience with high hydrogen (52-95% by volume) content fuel gas in gas turbines (Shilling and Jones, 2003). Unfortunately, most of that experienceisfor‘refinerygas’wheremethaneistheothermaincomponentofthefuelgasandisutilizedinolderlowerfiringtemperature gas turbines, not the state-of-the-art over 1300°C gas turbines normally considered for large de-carbonization power plants. Norsk Hydro and General Electric collaborated to perform full-scale combustion system testing for modern gas turbines firinghydrogen-richgaswithcombustionexittemperaturesofabove 1400°C (Todd and Battista, 2001). The results showed good combustion conditions with low NOx emission and acceptable hot metal temperatures for mixtures with 54-77% by volume hydrogen with most of the additional gas being nitrogen. Dilution of the hydrogen with nitrogen or steam reduces the NOx emission. For pre-combustion capture of CO2 from natural gas, air-blown gasification or autothermal reforming is usuallypreferred (IEA GHG, 2000b; Wilkinson and Clarke, 2002). Nitrogendilutionofthehydrogenrequiredforfiringinmoderngasturbinescomesfromthegasificationair.High-pressureairis usually extracted from the gas turbine to feed the air-blown gasifier, or autothermal reformer to reduce costs and avoid aseparate air compressor. The balance between the amount of air withdrawn from the gas turbine and the amount provided from a separate air compressor is determined by the particular characteristics of the gas turbine used. Some gas turbines can acceptahigherratioofexpandertocompressorflow,allowinggreatervolumesofdilutiongasor smallerair-sidedrawflowand giving higher power output. For pre-combustion capture of CO2 from coal, oxygen-blown gasification is usually preferred (IEA GHG, 2003).Nitrogendilutionofthehydrogenrequiredforfiringinmoderngas turbines comes from the cryogenic air separation unit (used to make the oxygen; see Section 3.4.5.1). The nitrogen is added to the hydrogen after the gasification, CO shifting and CO2 capture to reduce the equipment sizes and cost. High-pressure air is usually extracted from the gas turbine to supply a higher than normal pressure cryogenic air separation unit to reduce costs plus air, oxygen and nitrogen compression power. An alternative IGCC scheme that incorporates newly emerging ion transport membranes for oxygen production is also described below in Section 3.5.4.3.
3.5.4.3 Syngas production using oxygen membranesOxygen required for a coal-fired IGCC process (Section3.5.2.6) can be generated in an oxygen transport membrane system by using a heated, high-pressure air stream produced by heating the discharge air from the compressor section of a gas turbine (Allam et al., 2002), typically at 1.6 MPa or 420°C, to the precise inlet temperature of the oxygen transport membrane module which is above 700°C. The oxygen, which permeates to the low-pressure side passes through a heat recovery section andiscompressedtothefinalpressureofuse.TheO2 depleted air leaving the oxygen transport membrane module then enters the gas turbine combustor where it is used to burn fuel before entering the gas turbine expander at the required temperature. Note that due to the necessity to have excess air in a gas turbine to limit turbine inlet temperature, removing one mole of oxygen can be compensated by injection of the equivalent thermal capacity of steam to maintain gas turbine power output. Studies have been carried out (Armstrong et al., 2002) to compare oxygen transport membrane and cryogenic oxygen production in an IGCC power plant using coal as fuel. The oxygen plant projected cost was reduced by 35% and the power consumption by37%.AnLHVefficiencyof41.8%withoutCO2 capture and compression is reported for this cycle compared to 40.9% when a conventional cryogenic oxygen plant is used. For autothermal reforming or the partial oxidation of natural gas, if the permeate side of the oxygen transport membrane is exposed to a natural gas plus water vapour stream in the presence of a reforming catalyst, the oxygen will react as it leaves the membrane in an exothermic reaction (Dyer et al., 2001; Carolan et al., 2001), which will provide heat for the endothermic steam/natural gas reforming reaction. The oxygen partial pressure at these highly-reducing, high temperature conditions is extremely low, allowing heated air at close to atmospheric pressure to be used on the feed side of the membrane while producing a H2 + CO mixture at high pressure from the permeate side. This system can be used to produce H2 following CO shift reaction and CO2 removal.
3.5.4.4 Chemicalloopinggasification/reformingThe chemical looping concept described in 3.4.6 is being considered for reforming of a fuel to produce H2 and CO (Zafar et al., 2005). When the amount of oxygen brought by the metal oxide into the reduction reactor is below stoichiometric requirements, the chemical reaction with the fuel produces H2 and CO. The reaction products may subsequently be shifted with steam to yield CO2 and more H2.
3.5.4.5 Use of de-carbonized fuel in fuel cellsFuel cells offer the possibility for highly efficient powerproduction since the conversion process is not controlled by heat to work Carnot cycle restrictions (Blomen and Mugerwa, 1993). In general fuel cells feature the electrochemical oxidation of gaseous fuels directly into electricity, avoiding the mixture of theairandthefuelflowsandthusthedilutionwithnitrogenandexcess oxygen of the oxidized products (Campanari, 2002). As a result, the anode outlet stream of a fuel cell already has a very
140 IPCC Special Report on Carbon dioxide Capture and Storage
high CO2 content that simplifies theCO2 capture subsystem. The fuel is normally natural gas, though some concepts can alsobeincorporatedintocoalgasificationsystems.Thesystemsconceptscanbeclassified into twomaingroups (Goettlicher,1999):• Systems with pre-fuel cell CO2 capture;• Systems with post-fuel cell CO2 capture.
In pre-fuel cell CO2 capture systems (see Figure 3.18a) the fuelisfirstconvertedintohydrogenusingsteamreformingorcoalgasification, followedby thewatergas shift conversion.This system approach has been first proposed both for lowtemperature and for high temperature fuel cells. The post-fuel cell capture system (see Figure 3.18b) is proposed for high temperature fuel cell systems (Dijkstra and Jansen, 2003). These systems make use of the internal reforming capabilities of the high temperature fuel cells resulting in an anode off-gas that has a high CO2-content, but also contains H2O and unconverted CO and H2. The water can easily be removed by conventional techniques (cooling, knock-out, additional drying). Oxidizing the H2 and CO from the (SOFC) anode with air will result in a too high dilution of the stream with nitrogen. Haines (1999) chooses to use an oxygen-transport membrane reactor placed after the SOFC. The anode off-gas is fed to one side of the membrane, the cathode off-gas is fed to the other side of the membrane. The membrane is selective to oxygen, which permeates from the cathode off-gas stream to the anode-off gas. In the membrane unit the H2 and CO are oxidized. The retenate of the membrane unit consist of CO2 and water. Finally a concept using a water gas shift membrane reactor has been proposed (Jansen and Dijkstra, 2003).
3.5.5 Statusandoutlook
This section reviewed a wide variety of processes and fuel conversion routes that share a common objective: to produce a cleaner fuel stream from the conversion of a raw carbonaceous fuel into one that contains little, or none, of the carbon contained in the original fuel. This approach necessarily involves the separation of CO2 at some point in the conversion process. The resulting H2-rich fuel can be fed to a hydrogen consuming process, oxidized in a fuel cell, or burned in the combustion chamber of a gas turbine to produce electricity. In systems that operateathighpressure,theenergyconversionefficienciestendto be higher when compared to equivalent systems operating at low pressures following the combustion route, but these efficiencyimprovementsareoftenobtainedattheexpenseofahigher complexity and capital investment in process plants (see Section 3.7). In principle, all pre-combustion systems are substantially similar in their conversion routes, allowing for differences that arise from the initial method employed for syngas production from gaseous, liquid or solid fuels and from the subsequent need to remove impurities that originate from the fuel feed to the plant. Onceproduced,thesyngasisfirstcleanedandthenreactedwith
steam to produce more H2 and CO2. The separation of these two gases can be achieved with well-known, commercial absorption-desorption methods, producing a CO2 stream suitable for storage. Also, intense R&D efforts worldwide are being directed towards the development of new systems that combine CO2 separation with some of the reaction steps, such as the steam reforming of natural gas or water gas shift reaction stages, but it is not yet clear if these emerging concepts (see Section 3.5.3) will deliver a lower CO2 capture cost. In power systems, pre-combustion CO2 capture in natural gas combined cycles has not been demonstrated. However, studies show that based on current state of the art gas turbine combined cycles, pre-combustion CO2 capture will reduce the efficiencyfrom56%LHVto48%LHV(IEA,2000b).Innaturalgas combined cycles, themost significant area for efficiencyimprovement is the gas turbine and it is expected that by 2020, the efficiency of a natural gas combined cycle could be ashigh as 65% LHV (IEA GHG, 2000d). For such systems the efficiencywithCO2 capture would equal the current state-of-the-artefficiencyforplantswithoutCO2 capture, that is, 56% LHV. IntegratedGasificationCombinedCycles(IGCC)arelargescale, near commercial examples of power systems that can be implemented with heavy oil residues and solid fuels like coal and petroleumcoke.Fortheembryoniccoal-firedIGCCtechnologywith the largest unit rated at 331 MWe, future improvements are expected. A recent study describes improvements potentially realisable for bituminous coals by 2020 that could reduce both energy and cost-of-electricity penalties for CO2 capture to 13% compared to a same base plant without capture. For such
Figure 3.18a Fuel cell system with pre-fuel cell CO2 capture. The carbon-containingfuelisfirstcompletelyconvertedintoamixtureofhydrogen and CO2. Hydrogen and CO2 are then separated and the H2-rich fuel is oxidized in the fuel cell to produce electricity. The CO2 stream is dried and compressed for transport and storage.
Figure 3.18b Fuel cell system with post-fuel cell CO2 capture. The carbon-containing fuel is first converted into a syngas. The syngasis oxidized in the fuel cell to produce electricity. At the outlet of the fuel cell CO2isseparatedfromthefluegas,driedandcompressedfortransport and storage.
Chapter 3: Capture of CO2 141
systemsthegenerationefficiencywithcapturewouldequalthebestefficiencyrealisabletodaywithoutCO2 capture (i.e., 43% LHV; IEA GHG, 2003). Notably, all the innovations considered, with the exception of ion transport membrane technology for air separation (which is motivated by many market drivers other than IGCC needs) involve ‘non- breakthrough’ technologies, with modest continuing improvements in components that are already established commercially - improvements that might emerge as a natural result of growing commercial experience with IGCC technologies. All fuel cell types are currently in the development phase. The first demonstration systems are now being tested, withthe largest units being at the 1 MW scale. However, it will take at least another 5 to 10 years before these units become commercially available. In the longer term, these highly efficientfuelcellsystemsareexpectedtobecomecompetitivefor power generation. Integrating CO2 capture in these systems is relatively simple and therefore fuel cell power generation systems offer the prospect of reducing the CO2 capture penalty intermsofefficiencyandcapturecosts.Forinstance,forhightemperature fuel cell systems without CO2capture,efficienciesthatexceed67%arecalculatedwithananticipated7%efficiencyreduction when CO2 capture is integrated into the system (Jansen and Dijkstra, 2003). However, fuel cell systems are too small to reach a reasonable level of CO2 transport cost (IEA GHG, 2002a), but in groups of a total of capacity 100MWe, the cost of CO2 transport is reduced to a more acceptable level. Most studies agree that pre-combustion systems may be better suited to implement CO2 capture at a lower incremental cost compared to the same type of base technology without capture (Section 3.7), but with a key driver affecting implementation being the absolute cost of the carbon emission-free product, or service provided. Pre-combustion systems also have a high strategic importance, because their capability to deliver, in a large scale and at high thermal efficiencies, a suitablemixof electricity, hydrogen and lower carbon-containing fuels or
chemical feedstocks in an increasingly carbon-constrained world.
3.6 Environmental, monitoring, risk and legal aspects of capture systems
The previous sections of this chapter focused on each of the major technologies and systems for CO2 capture. Here we summarize the major environmental, regulatory and risk issues associated with the use of CO2 capture technology and the handling of carbon dioxide common to all of these systems. Issues related to the subsequent transport and storage of carbon dioxide are discussed in Chapters 4 to 7.
3.6.1.1 Overview of emissions from capture systems Plants with CO2 capture would produce a stream of concentrated CO2forstorage,plusinmostcasesafluegasorventgasemittedto the atmosphere and liquid wastes. In some cases solid wastes will also be produced. The captured CO2 stream may contain impurities which would have practical impacts on CO2 transport and storage systems and also potential health, safety and environmental impacts. The types and concentrations of impurities depend on the type of capture process, as shown in Table 3.4, and detailed plant design. The major impurities in CO2 are well known but there is little published information on the fate of any trace impurities in the feed gas such as heavy metals. If substances are captured along with the CO2 then their net emissions to the atmosphere will be reduced, but impurities in the CO2 may result in environmental impacts at the storage site. CO2 from most capture processes contains moisture, which has to be removed to avoid corrosion and hydrate formation during transportation. This can be done using conventional
table 3.4 Concentrations of impurities in dried CO2, % by volume (Source data: IEA GHG, 2003; IEA GHG, 2004; IEA GHG, 2005).
SO2 NO H2S H2 CO CH4 N2/Ar/O2 totalCOAL FIRED PLANTS
a. The SO2 concentration for oxy-fuel and the maximum H2S concentration for pre-combustion capture are for cases where these impurities are deliberately left in the CO2, to reduce the costs of capture (see Section 3.6.1.1). The concentrations shown in the table are based on use of coal with a sulphur content of 0.86%. The concentrations would be directly proportional to the fuel sulphur content.
b. Theoxy-fuelcaseincludescryogenicpurificationoftheCO2 to separate some of the N2, Ar, O2 and NOx. Removal of this unit would increase impurity concentrations but reduce costs.
c. For all technologies, the impurity concentrations shown in the table could be reduced at higher capture costs.
142 IPCC Special Report on Carbon dioxide Capture and Storage
processes and the costs of doing so are included in published costs of CO2 capture plants. CO2 from post-combustion solvent scrubbing processes normally contains low concentrations of impurities. Many of the existing post-combustion capture plants produce high purity CO2 for use in the food industry (IEA GHG, 2004). CO2 from pre-combustion physical solvent scrubbing processes typically contains about 1-2% H2 and CO and traces of H2S and other sulphur compounds (IEA GHG, 2003). IGCC plants with pre-combustion capture can be designed to produce a combined stream of CO2 and sulphur compounds, to reduce costs and avoid the production of solid sulphur (IEA GHG, 2003). Combined streams of CO2 and sulphur compounds (primarily hydrogen sulphide, H2S) are already stored, for example in Canada, as discussed in Chapter 5. However, this option would only be considered in circumstances where the combined stream could be transported and stored in a safe and environmentally acceptable manner. The CO2-rich gas from oxy-fuel processes contains oxygen, nitrogen, argon, sulphur and nitrogen oxides and various other trace impurities. This gas will normally be compressed and fedtoacryogenicpurificationprocesstoreducetheimpuritiesconcentrations to the levels required toavoid two-phaseflowconditions in the transportation pipelines. A 99.99% purity could be produced by including distillation in the cryogenic separation unit. Alternatively, the sulphur and nitrogen oxides could be left in the CO2 fed to storage in circumstances where that is environmentally acceptable as described above for pre-combustion capture and when the total amount of all impurities left in the CO2islowenoughtoavoidtwo-phaseflowconditionsin transportation pipelines. Power plants with CO2 capture would emit a CO2-depleted fluegastotheatmosphere.Theconcentrationsofmostharmfulsubstances in the flue gaswould be similar to or lower thaninthefluegasfromplantswithoutCO2 capture, because CO2 capture processes inherently remove some impurities and some other impurities have to be removed upstream to enable the CO2 capture process to operate effectively. For example, post-combustion solvent absorption processes require low concentrations of sulphur compounds in the feed gas to avoid excessive solvent loss, but the reduction in the concentration of an impurity may still result in a higher rate of emissions per kWh of product, depending upon the actual amount removed upstream and the capture system energy requirements. As discussed below (Section 3.6.1.2), the latter measure is more relevant for environmental assessments. In the case of post-combustion solvent capture, the flue gas may also containtraces of solvent and ammonia produced by decomposition of solvent. Some CO2 capture systems produce solid and liquid wastes. Solvent scrubbing processes produce degraded solvent wastes, which would be incinerated or disposed of by other means. Post-combustion capture processes produce substantially more degraded solvent than pre-combustion capture processes. However, use of novel post-combustion capture solvents can significantly reduce the quantity ofwaste compared toMEA
solvent, as discussed in Section 3.3.2.1. The waste from MEA scrubbing would normally be processed to remove metals and then incinerated. The waste can also be disposed of in cement kilns, where the waste metals become agglomerated in the clinker (IEA GHG, 2004). Pre-combustion capture systems periodically produce spent shift and reforming catalysts and these would be sent to specialist reprocessing and disposal facilities.
3.6.1.2 Framework for evaluating capture system impactsAs discussed in Chapter 1, the framework used throughout this report to assess the impacts of CO2 capture and storage is based onthematerialandenergyflowsneededtoproduceaunitofproduct from a particular process. As seen earlier in this chapter, CO2 capture systems require an increase in energy use for their operation.Asdefinedinthisreport(seeSection1.5andFigure1.5), the energy requirement associated with CO2 capture is expressed as the additional energy required to produce a unit of useful product, such as a kilowatt-hour of electricity (for the case of a power plant). As the energy and resource requirement for CO2 capture (which includes the energy needed to compress CO2 for subsequent transport and storage) is typically much larger than for other emission control systems, it has important implications for plant resource requirements and environmental emissions when viewed from the ‘systems’ perspective of Figure 1.5. In general, the CCS energy requirement per unit of product can beexpressedintermsofthechangeinnetplantefficiency(η) when the reference plant without capture is equipped with a CCS system:1
∆E = (ηref / ηccs) - 1 (6)
where ∆E is the fractional increase in plant energy input per unit of product and ηccs and ηrefarethenetefficienciesofthecapture plant and reference plant, respectively. The CCS energy requirement directly determines the increases in plant-level resource consumption and environmental burdens associated with producing a unit of useful product (like electricity) while capturing CO2. In the case of a power plant, the larger the CCS energy requirement, the greater the increases per kilowatt-hour of in-plant fuel consumption and other resource requirements (such as water, chemicals and reagents), as well as environmental releases in the form of solid wastes, liquid wastes and air pollutants not captured by the CCS system. The magnitude of ∆E also determines the magnitude of additional upstream environmental impacts associated with the extraction, storage and transport of additional fuel and other resources consumed at the plant. However, the additional energy for these upstream activities is not normally included in the reported
1 A different measure of the ‘energy penalty’ commonly reported in the literature is the fractional decrease in plant output (plant derating) for a fixed energyinput. This value can be expressed as: ∆E* = 1 – (ηccs/ηref). Numerically, ∆E* is smaller than the value of ∆E given by Equation (6). For example, a plant derating of ∆E* = 25% corresponds to an increase in energy input per kWh of ∆E = 33%.
Chapter 3: Capture of CO2 143
energy requirements for CO2 capture systems.2
Recent literature on CO2 capture systems applied to electricpowerplantsquantifiesthemagnitudeofCCSenergyrequirements for a range of proposed new plant designs with and without CO2 capture. As elaborated later in Section 3.7 (Tables 3.7 to 3.15), those data reveal a wide range of ∆E values. For new supercritical pulverized coal (PC) plants using current technology, these ∆E values range from 24-40%, while for natural gas combined cycle (NGCC) systems the range is 11%–22% and for coal-based gasification combined cycle (IGCC)systems it is 14%–25%. These ranges reflect the combinedeffectsofthebaseplantefficiencyandcapturesystemenergyrequirements for the same plant type with and without capture.
3.6.1.3 Resource and emission impacts for current systems Only recently have the environmental and resource implications of CCS energy requirements been discussed and quantifiedfor a variety of current CCS systems. Table 3.5 displays the assumptions and results from a recent comparison of three common fossil fuel power plants employing current technology to capture 90% of the CO2 produced (Rubin et al., 2005). Increasesinspecificfuelconsumptionrelativetothereferenceplant without CO2 capture correspond directly to the ∆E valuesdefined above.For these three cases, theplant energyrequirement per kWh increases by 31% for the PC plant, 16% for the coal-based IGCC plant and 17% for the NGCC plant. For thespecificexamplesusedinTable3.5,theincreaseinenergyconsumption for the PC and NGCC plants are in the mid-range of the values for these systems reported later in Tables 3.7 to 3.15 (see also Section 3.6.1.2), whereas the IGCC case is nearer the low end of the reported range for such systems. As a result of the increased energy input per kWh of output, additional resource requirements for the PC plant include proportionally greater amounts of coal, as well as limestone (consumed by the FGD system for SO2 control) and ammonia (consumed by the SCR system for NOx control). All three plants additionally require more sorbent make-up for the CO2 capture units. Table 3.5 also shows the resulting increases in solid residues for these three cases. In contrast, atmospheric emissions of CO2 decrease sharply as a result of the CCS systems, which also remove residual amounts of other acid gases, especially SO2 influegasstreams.Thus,thecoalcombustionsystemshowsanet reduction in SO2 emission rate as a result of CO2 capture. However,becauseofthereductioninplantefficiency,otherairemission rates per kWh increase relative to the reference plants without capture. For the PC and NGCC systems, the increased emissions of ammonia are a result of chemical reactions in the amine-based capture process. Not included in this analysis are the incremental impacts of upstream operations such as mining, processing and transport of fuels and other resources.
2Thoseadditionalenergyrequirements,ifquantified,couldbeincludedbyre-definingthesystemboundaryandsystemefficiencytermsinEquation(6) toapply to the full life cycle, rather than only the power plant. Such an analysis would require additional assumptions about the methods of fuel extraction, processing, transport to the power plant, and the associated energy requirements of those activities; as well as the CO2 losses incurred during storage.
Other studies, however, indicate that these impacts, while not insignificant, tend to be small relative to plant-level impacts(Bock et al., 2003). For the most part, the magnitude of impacts noted above - especially impacts on fuel use and solid waste production - is directly proportional to the increased energy per kWh resulting from the reduction in plant efficiency, as indicatedby Equation (6). Because CCS energy requirements are one to two orders of magnitude greater than for other power plant emission control technologies (such as particulate collectors andfluegasdesulphurizationsystems), the illustrativeresultsabove emphasize the importance of maximizing overall plant efficiencywhilecontrollingenvironmentalemissions.
3.6.1.4 Resource and emission impacts of future systems The analysis above compared the impacts of CO2 capture for a given plant type based on current technology. The magnitude of actual future impacts, however, will depend on four important factors: (1) the performance of technologies available at the time capture systems are deployed; (2) the type of power plants and capture systems actually put into service; (3) the total capacity of each plant type that is deployed; and, (4) the characteristics and capacity of plants they may be replacing. Analyses of both current and near-future post-combustion, pre-combustion and oxy-fuel combustion capture technology options reveal that some of the advanced systems currently underdevelopmentpromisetosignificantlyreducethecaptureenergy requirements - and associated impacts - while still reducing CO2 emissions by 90% or more, as shown in Figure 3.19.Datainthisfigurewasderivedfromthestudiespreviouslyreported in Figures 3.6 and 3.7. ThetimetablefordeployingmoreefficientplantswithCO2 capture will be the key determinant of actual environmental changes. If a new plant with capture replaces an older, less efficient and higher-emitting plant currently in service, thenet change in plant-level emission impacts and resource requirements would be much smaller than the values given earlier (which compared identical new plants with and without
Figure 3.19 Fuel use for a reduction of CO2 emissions from capture plants (data presented from design studies for power plants with and without capture shown in Figures 3.6 and 3.7).
144 IPCC Special Report on Carbon dioxide Capture and Storage
tabl
e 3.
5 Ill
ustra
tive
impa
cts o
f CC
S en
ergy
requ
irem
ents
on
plan
t-lev
el re
sour
ce c
onsu
mpt
ion
and
non-
CO
2 em
issi
on ra
tes f
or th
ree
curr
ent p
ower
pla
nt sy
stem
s. Va
lues
show
n ar
e m
ass
flow
rat
es in
kg
per
MW
h fo
r th
e ca
ptur
e pl
ant,
plus
incr
ease
s ov
er th
e re
fere
nce
plan
t rat
es f
or th
e sa
me
plan
t typ
e. S
ee f
ootn
otes
for
add
ition
al d
etai
ls. (
Sour
ce: R
ubin
et a
l., 2
005)
Cap
ture
Pla
nt P
aram
eter
a P
C b
iG
CC
cN
GC
C d
Rat
ein
crea
seR
ate
incr
ease
Rat
ein
crea
seR
esou
rce
cons
umpt
ion
(All
valu
es in
kg
mW
h-1)
Fuel
390
9336
149
156
23Li
mes
tone
27.5
6.8
--
--
Am
mon
ia0.
800.
19-
--
-C
CS
Rea
gent
s2.
762.
760.
005
0.00
50.
800.
80So
lid W
aste
s/by
prod
uct
Ash
/sla
g28
.16.
734
.24.
7-
-FG
D re
sidu
es49
.612
.2-
--
-Su
lfur
--
7.53
1.04
--
Spen
t CC
S so
rben
t4.
054.
050.
005
0.00
50.
940.
94A
tmos
pher
ic e
mis
sion
sC
O2
107
–704
97-7
2043
–342
SOx
0.00
1–0
.29
0.33
0.05
--
NO
x 0.
770.
180.
100.
010.
110.
02N
H3
0.23
0.22
--
0.00
20.
002
a N
et p
ower
out
put o
f all
plan
ts is
app
roxi
mat
ely
500
MW
. Coa
l pla
nts
use
Pitts
burg
h #8
coa
l with
2.1
%S,
7.2
% a
sh, 5
.1%
moi
stur
e an
d 30
3.2
MJ
kg-1 lo
wer
hea
ting
valu
e ba
sis
(L
HV
). N
atur
al g
as L
HV
= 5
9.9
MJ
kg-1.
All
plan
ts c
aptu
re 9
0% o
f pot
entia
l CO
2 em
issi
ons
and
com
pres
s to
13.
7 M
Pa.
b PC
= Pu
lver
ized
coa
l-fire
d pl
ant;
base
d on
a s
uper
criti
cal u
nit w
ith S
CR
, ESP
and
FG
D s
yste
ms,
follo
wed
by
an a
min
e sy
stem
for C
O2 c
aptu
re. S
CR
sys
tem
ass
umes
2 p
pmv
am
mon
ia s
lip. S
O2 r
emov
al e
ffici
ency
is 9
8% fo
r ref
eren
ce p
lant
and
99%
for c
aptu
re p
lant
. Net
pla
nt e
ffici
ency
(LH
V b
asis
) is
40.9
% w
ithou
t CC
S an
d 31
.2%
with
CC
S.
c IG
CC
=int
egra
ted
gasi
ficat
ion
com
bine
d cy
cle
syst
em b
ased
on
Texa
co q
uenc
h ga
sifie
rs (2
+ 1
spa
re),
two
GE
7FA
gas
turb
ines
, 3-p
ress
ure
rehe
at H
RSG
. Su
lfur r
emov
al
ef
ficie
ncy
is 9
8% v
ia h
ydro
lyze
r plu
s Se
lexo
l sys
tem
; Su
lfur r
ecov
ery
via
Cla
us p
lant
and
Bea
von-
Stre
tford
tailg
as u
nit.
Net
pla
nt e
ffici
ency
(LH
V b
asis
) is
39.1
% w
ithou
t
CC
S an
d 33
.8%
with
CC
S.
d
NG
CC
=nat
ural
gas
com
bine
d cy
cle
plan
t usi
ng tw
o G
E 7F
A g
as tu
rbin
es a
nd 3
-pre
ssur
e re
heat
HR
SG, w
ith a
n am
ine
syst
em fo
r CO
2 cap
ture
. Net
pla
nt e
ffici
ency
(LH
V
ba
sis)
is 5
5.8%
with
out C
CS
and
47.6
% w
ith C
CS.
Chapter 3: Capture of CO2 145
capture).Forexample, theefficiencyofamoderncoal-basedplant with capture is close to many older coal-burning plants currently in service. Replacing the latter with the former would thus reduce CO2 emissions significantly with little orno net change in plant coal consumption or related solid waste impacts. In some cases, there could in fact be net reductions in other plant emissions, in support of clean air goals. If, however, the deployment of new CCS plants is delayed significantly,older existing plants could well be replaced by modern high-efficiency plants without capture. Such plants also wouldbe built to provide additional capacity in regions with high electricity growth rates, such as in China and other parts of Asia today.Adecadeor twofromnow, thefleetof ‘existing’plants in those regions would thus look very different from the present. Accordingly, the environmental and resource impacts of additional new plants with CO2 capture would have to be assessed in the context of the future situation. Because comparisons of different plant types require a specific context (or scenario) to be meaningful, this chapterhas only focused on characterizing the effects of CO2 capture systems relative to the same type of power plant and not the type of infrastructure it would replace (either currently, or in a future carbon-constrained world). If other systems such as the use of renewable energy, or electricity and synfuels cogenerated fromcoal,findsignificantapplications,thosesystemstoowouldrequire more comprehensive comparative life-cycle assessments of resource use and impacts that are not currently available. Chapter 8, however, assesses overall energy use impacts for illustrative scenarios of CCS deployment in competition with other carbon mitigation options.
As a current commercial product, carbon dioxide is subject to classification and regulations.The classification of carbondioxide is dependent on its physical state (gas, liquid or solid), its concentration, impurities present and other criteria established by national legislative classification in differentregions of the world. During the capture and concentration process,thequalitypropertiescanchangetheclassificationofthe substance. A detailed assessment of carbon dioxide physical and chemical properties is provided in Annex I. The environmental, monitoring, risk and legal aspects associated with carbon dioxide handling and storage are well established in the processing industry. However, much larger volumes are targeted for carbon dioxide processing for purposes of CCS than the volumes handled at present. On a local and regional level, additional emergency response and other regulatory measures can be expected in the future, depending on the rate of development of CCS. It is anticipated that human capacity will be developed to assess the monitoring, risk and legal aspects as required by the market. At present, carbon dioxide typically occurs and is mainly tradedasanon-flammablegas(USDepartmentofTransportationclassificationclass2.2).TheclassificationsystemofTransport
Dangerous Goods, International Maritime Organization/ International Maritime Dangerous Goods and International Civil Aviation Organization / International Air Transport Association, all classify carbon dioxide in class 2.2, non-flammable, non-corrosive and non-poisonous gases. In US federal regulations, carbon dioxide is not listed as a product in the Clean Water Act (CWA 307 and 311), Clean Air Act (CAA 112) or the Toxics Release Inventory. In other international regulations carbon dioxideisnotclassifiedintheEuropeanInventoryofExistingCommercial Chemical Substance or other international lists, butinCanadaisclassifiedasacompressedgas(classA)ontheCanadian Energy Pipeline Association Dangerous Substances List (Hazardous Substances Data Bank, 2002).
The effects of exposure to carbon dioxide are described in Annex I. However, a risk assessment that includes an understanding of both exposure and effects is required to characterize the risk for various situations associated with carbon dioxide processing (European Chemicals Bureau, 2003); see the following two sections for established risk management practices. The most probable routes of human exposure to carbon dioxide are inhalation or skin contact. The need for a risk-based approach is clear from the following two descriptions. Carbon dioxide and itsproductsofdegradationarenot legallyclassifiedasatoxic substance; is non-hazardous on inhalation, is a non-irritant and does not sensitize or permeate the skin. However, chronic effects on humans follow from long-term exposure to airborne carbon dioxide concentrations of between 0.5 and 1% resulting in metabolic acidosis and increased calcium deposits in soft tissues. The substance is toxic to the cardiovascular system and upper respiratory tract at concentrations above 3%. Sensitive populations to elevated carbon dioxide levels are described in Annex I. The product risk assessment process is therefore necessary as with any other chemical use to determine the risk and establish the necessary risk management processes. As an asphyxiate carbon dioxide presents the greatest danger. If atmospheric oxygen is displaced such that oxygen concentration is 15-16%, signs of asphyxia will be noted. Skin contact with dry ice has caused serious frostbites and blisters (Hazardous Substances Data Bank, 2002). Protective equipment and clothing required in the processing industries include full face-piece respirators to prevent eye contact and appropriate personal protective clothing to protect the skin from becoming frozen by the liquid.
New plant facilities like those envisioned for carbon dioxide are subject to design guidelines for the petrochemical industry as determined by relevant authorities. One example is the European Unions’ Integrated Pollution Prevention and Control (IPPC) directive requiring the application of the principles
146 IPCC Special Report on Carbon dioxide Capture and Storage
of Best Available Technology Not Entailing Excessive Cost (BATNEEC). Carbon dioxide capture and compression processes are listed in several guidelines as gas-processing facilities. Typically the World Bank guidelines and other financialinstitutionshavespecificrequirementstoreduceriskand these require monitoring (World Bank, 1999) which is part of routine plant monitoring to detect accidental releases. Investor guidelines like the World Bank guidelines are particularly important for developing countries where there is less emphasis on monitoring and legislation. National and regional legislation forplantdesignandspecificationsfromorganizationsliketheUS Environmental Protection Agency are available to guide the development of technology.
The routine engineering design, commissioning and start-up activities associated with petrochemical facilities are applicable to the capture and compression of carbon dioxide; for example Hazard Operability studies are conducted on a routine basis for new facilities (Sikdar and Diwekar, 1999). The management of carbon dioxide and reagents inside factory battery limits will be in accordance with the relevant practices in use for carbon dioxide. For carbon dioxide, US Occupational Health and Safety Act standards and National Institute for Occupational Safety and Health recommendations exist, which are applied widely in industry to guide safe handling of carbon dioxide and the same applies to reagents and catalysts used. Well established and externally audited management systems such as International Standards Organization’s ISO 14001 (environment) and ISO 9001 (quality) and Occupational Health and Safety (OHSAS 18000) exist to provide assurance that environment, safety, health and quality management systems are in place (American Institute of Chemical Engineers, 1995). Tools like life-cycle assessment (ISO 14040 series) with the necessary boundary expansion methodology are useful to determine the overall issues associated with a facility and assist with selection of parameters such as energy carriers, operational conditions and materials used in the process. The life-cycle assessment will also indicate if a trouble-free capture system does generate environmental concerns elsewhere in the product life cycle.
3.6.6 Siteclosureandremediation
It is not anticipated that carbon dioxide capture will result in a legacy of polluted sites requiring remediation after plant closure, assuming that standard operating procedures and management practices in the previous section are followed. However, depending on the technology used and the materials procured for operations, waste disposal at the facilities and operation according to a formal management system from construction, operation to the development of site closure plans will largely assist to reduce the risk of a polluted site after closure of operations.
3.7 Cost of CO2 capture
This section of the report deals with the critical issue of CO2 capture costs. We begin with an overview of the many factors that affect costs and the ability to compare published estimates on a consistent basis. Different measures of CO2 capture cost also are presented and discussed. The literature on CO2 capture costs for currently available technologies is then reviewed, along with the outlook for future costs over the next several decades.
3.7.1 FactorsaffectingCO2capturecost
Published estimates for CO2 capture costs vary widely, mainly as a result of different assumptions regarding technical factors related to plant design and operation (e.g., plant size, netefficiency,fuelpropertiesandloadfactor),aswellaskeyeconomicandfinancialfactorssuchasfuelcost,interestratesand plant lifetime. A number of recent papers have addressed thisissueandidentifiedtheprincipalsourcesofcostdifferencesand variability (Herzog, 1999; Simbeck, 1999; Rubin and Rao, 2003). This section draws heavily on Rubin and Rao (2003) to highlight the major factors affecting the cost of CO2 capture.
3.7.1.1 DefiningthetechnologyofinterestCosts will vary with the choice of CO2 capture technology and the choice of power system or industrial process that generates the CO2 emissions. In engineering-economic studies of a single plant or CO2 capture technology, suchdefinitions areusuallyclear. However, where larger systems are being analyzed, such as in regional, national or global studies of CO2 mitigation options,thespecifictechnologiesassumedforCO2 production andcapturemaybeunclearorunspecified.Insuchcases,thecontext for reported cost results also may be unclear.
3.7.1.2 DefiningthesystemboundaryAny economic assessment should clearly define the ‘system’whose CO2 emissions and cost is being characterized. The most common assumption in studies of CO2 capture is a single facility (most often a power plant) that captures CO2 and transports it to an off-site storage area such as a geologic formation. The CO2 emissions considered are those released at the facility before and after capture. Reported costs may or may not include CO2 transport and storage costs. The system boundary of interest in this section of the report includes only the power plant or other process of interest and does not include CO2 transport and storage systems, whose costs are presented in later chapters. CO2 compression, however, is assumed to occur within the facility boundary and therefore the cost of compression is included in the cost of capture.3
In some studies the system boundary includes emissions of
3 Alternatively, compression costs could be attributed wholly or in part to CO2 transport and storage. Most studies, however, include compression with capture cost. This also facilitates comparisons of capture technologies that operate at differentpressures,and thus incurdifferentcosts toachievea specifiedfinalpressure.
Chapter 3: Capture of CO2 147
CO2 and other greenhouse gases such as methane (expressed as equivalent CO2) over the complete fuel cycle encompassing not only the power plant or facility in question, but also the ‘upstream’processesofextraction,refiningandtransportoffuelused at the facility, plus any ‘downstream’ emissions from the use or storage of captured CO2. Still larger system boundaries might include all power plants in a utility company’s system; all plants in a regional or national grid; or a national economy where power plant and industrial emissions are but one element of the overall energy system being modelled. In each of these cases it is possible to derive a mitigation cost for CO2, but the resultsarenotdirectlycomparablebecausetheyreflectdifferentsystem boundaries and considerations. Chapter 8 discusses such differences in more detail and presents results for alternative systems of interest.
3.7.1.3 DefiningthetechnologytimeframeandmaturityAnother factor that is often unclear in economic evaluations of CO2 capture is the assumed time frame and/or level of maturity for the technology under study. Does the cost estimate apply to a facility that would be built today, or at some future time? This is especially problematic in studies of ‘advanced’ technologies that are still under development and not currently commercial. In most cases, studies of advanced technologies assume that costs apply to an ‘nth plant’ to be built sometime in the future when the technology is mature. Such estimates reflect theexpected benefits of technological learning, butmay ormaynot adequately account for the increased costs that typically occur in the early stages of commercialization. The choice of technology time frame and assumed rate of cost improvements and can therefore make a big difference in CO2 capture cost estimates.
3.7.1.4 Different cost measures and assumptionsThe literature reveals a number of different measures used to characterize CO2 capture and storage costs, including capital cost, cost of electricity, cost of CO2 avoided and others. Because some of these measures are reported in the same units (e.g., US dollars per tonne of CO2) there is great potential for misunderstanding. Furthermore, for any given cost measure, different assumptions about the technical, economic and financial parameters used in cost calculations can also giverise to large differences in reported capture costs. Section 3.7.2 elaborates on some of the common metrics of cost and the parameters they employ.
3.7.2 MeasuresofCO2capturecost
Wedefine four commonmeasures ofCO2 capture cost here: capital cost, incremental product cost (such as the cost of electricity), cost of CO2 avoided and cost of CO2 captured or removed. Each of these measures provides a different perspective on CO2 capture cost for a particular technology or system of interest. All of them, however, represent an ‘engineering economic’ perspective showing the added cost of capturing CO2 in a particular application. Such measures are
required to address larger questions such as which options or strategies to pursue - a topic addressed later in Chapter 8.
3.7.2.1 Capital costCapital cost (also known as investment cost or first cost)is a widely used, albeit incomplete, metric of the cost of a technology. It is often reported on a normalized basis (e.g., cost per kW). For CO2 capture systems, the capital cost is generally assumed to represent the total expenditure required to design, purchase and install the system of interest. It may also include the additional costs of other plant components not needed in the absence of a CO2 capture device, such as the costs of an upstreamgaspurificationsystemtoprotectthecapturedevice.Such costs often arise in complex facilities like a power plant. Thus, the total incremental cost of CO2 capture for a given plant design is best determined as the difference in total cost between plants with and without CO2 capture, producing the same amounts of useful (primary) product, such as electricity. Different organizations employ different systems of accounts to specify the elements of a capital cost estimate. For electric power plants, one widely used procedure is that defined bythe Electric Power Research Institute (EPRI, 1993). However, because there is no universally employed nomenclature or system of accounts, capital costs reported by different organizations or authors may not always include the same items. The terms used to report capital costs may further disguise such differences and lead to misunderstandings about what is and is not included. For example, power plant cost studies often report a value of capital cost that does not include the cost of interest during construction or other so-called ‘owners costs’ that typically add at least 10-20% (sometimes substantially more) to the ‘total capital requirement’ of a system. Only if a capital cost breakdown is reported can such omissions be discovered. Studies that fail to report the year of a cost estimate introduce further uncertainty that may affect cost comparisons.
3.7.2.2 Incremental product costThe effect of CO2 capture on the cost of electricity (or other product) is one of the most important measures of economic impact. Electric power plants, a major source of CO2 emissions, are of particular interest in this regard. The cost electricity (COE) for a power plant can be calculated as:4
COE = [(TCR)(FCF) + (FOM)]/[(CF)(8760)(kW)] + VOM + (HR)(FC) (7)
where, COE = levelized cost of electricity (US$ kWh-1), TCR = total capital requirement (US$),FCF=fixed charge factor(fraction yr-1),FOM=fixedoperatingcosts(US$yr-1), VOM = variable operating costs (US$ kWh-1), HR = net plant heat rate (kJ kWh-1), FC = unit fuel cost (US$ kJ-1), CF = capacity
4 For simplicity, the value of FCF in Equation (7) is applied to the total capital requirement. More detailed calculations of COE based on a year-by-year analysis apply the FCF to the total capital cost excluding owner’s costs (such as interest during construction), which are separately accounted for in the years prior to plant start-up.
148 IPCC Special Report on Carbon dioxide Capture and Storage
factor (fraction), 8760 = total hours in a typical year and kW = net plant power (kW). In this chapter, the costs in Equation (7) include only the power plant and capture technologies and not the additional costs of CO2 transport and storage that are required for a complete system with CCS. The incremental COE is the difference in electricity cost with and without CO2 capture.5 Again, the values reported here exclude transport and storage costs. Full CCS costs are reported in Chapter 8. Equation (7) shows that many factors affect this incremental cost. For example, just as the total capital cost includes many differentitems,sotoodothefixedandvariablecostsassociatedwith plant operation and maintenance (O&M). Similarly, the fixed charge factor (FCF, also known as the capital recoveryfactor) reflects assumptions about the plant lifetime and theeffective interest rate (or discount rate) used to amortize capital costs.6 Assumptions about any of the factors in Equation (7) can have a pronounced effect on overall cost results. Nor are these factors all independent of one another. For example, the design heat rate of a new power plant may affect the total capital requirementsincehigh-efficiencyplantsusuallyaremorecostlythanlower-efficiencydesigns. Finally, because several of the parameter values in Equation (7) may change over the operating life of a facility (such as the capacity factor, unit fuel cost, or variable operating costs), the value of COE also may vary from year to year. To include such effects, an economic evaluation would calculate the net present value (NPV) of discounted costs based on a schedule of year-to-year cost variations, in lieu of the simpler formulation of Equation (7). However, most engineering-economic studies use Equation (7) to calculate a single value of ‘levelized’ COE over the assumed life of the plant. The levelized COE is the cost of electricity, which, if sustained over the operating life of the plant, would produce the same NPV as an assumed stream of variable year-to-year costs. In most economic studies of CO2 capture, however, all parameter values in Equation (7) are held constant,reflecting(eitherimplicitlyorexplicitly)alevelizedCOE over the life of the plant.7
3.7.2.3 Cost of CO2 avoidedOne of the most widely used measures for the cost of CO2 capture and storage is the ‘cost of CO2avoided.’Thisvaluereflectstheaverage cost of reducing atmospheric CO2 mass emissions by one unit while providing the same amount of useful product as a ‘reference plant’ without CCS. For an electric power plant the avoidancecostcanbedefinedas:
5 For CO2 capture systems with large auxiliary energy requirements, the magnitude of incremental cost also depends on whether the plant with capture is assumed to be a larger facility producing the same net output as the reference plant without capture, or whether the reference plant is simply derated to supply the auxiliary energy. While the latter assumption is most common, the former yields a smaller incremental cost due to economy-of-scale effects.6 In its simplest form, FCF can be calculated from the project lifetime, n (years), and annual interest rate, i (fraction), by the equation: FCF = i / [1 – (1 + i)–n ].7 Readers not familiar with these economic concepts and calculations may wish to consult a basic economics text, or references such as (EPRI, 1993) or (Rubin, 2001) for more details.
where, COE = levelized cost of electricity (US$ kWh-1) as given by Equation (7) and CO2 kWh-1 = CO2 mass emission rate (in tonnes) per kWh generated, based on the net plant capacity for each case. The subscripts ‘capture’ and ‘ref’ refer to the plant with and without CO2 capture, respectively. Note that while this equation is commonly used to report a cost of CO2 avoided for the capture portion of a full CCS system, strictly speaking it should be applied only to a complete CCS system including transport and storage costs (since all elements are required to avoid emissions to the atmosphere). The choice of the reference plant without CO2 capture plays a key role in determining the CO2 avoidance cost. Here the reference plant is assumed to be a plant of the same type and design as the plant with CO2 capture. This provides a consistent basis for reporting the incremental cost of CO2 capture for a particular type of facility. Using Equation (8), a cost of CO2 avoided can be calculated for any two plant types, or any two aggregates of plants. Thus, special care should be taken to ensure that the basis for a reported cost of CO2 avoided is clearly understood or conveyed. For example, the avoidance cost is sometimes taken as a measure of the cost to society of reducing GHG emissions.8 In that case, the cost per tonne of CO2 avoided reflectstheaveragecostofmovingfromonesituation(e.g.,thecurrent mix of power generation fuels and technologies) to a different mix of technologies having lower overall emissions. Alternatively, some studies compare individual plants with and without capture (as we do), but assume different types of plants for the two cases. Such studies, for example, might compare a coal-fired plant with capture to an NGCC reference plantwithoutcapture.Suchcasesreflectadifferentchoiceofsystemboundaries and address very different questions, than those addressed here. However, the data presented in this section (comparing the same type of plant with and without capture) can be used to estimate a cost of CO2 avoided for any two of the systems of interest in a particular situation (see Chapter 8).
3.7.2.4 Cost of CO2 captured or removedAnother cost measure frequently reported in the literature is based on the mass of CO2 captured (or removed) rather than emissionsavoided.Foranelectricpowerplantitcanbedefinedas:
Cost of CO2 Captured (US$/tCO2) = [(COE)capture – (COE)ref] / (CO2, captured kWh-1) (9)
8 As used here, ‘cost’ refers only to money spent for technology, fuels and related materials, and not to broader societal measures such as macroeconomic costs or societal damage costs associated with atmospheric emissions. Further discussions and use of the term ‘cost of CO2 avoided’ appear in Chapter 8 and in the references cited earlier.
Chapter 3: Capture of CO2 149
where, CO2, captured kWh-1 = total mass of CO2 captured (in tonnes) per net kWh for the plant with capture. This measure reflectstheeconomicviabilityofaCO2 capture system given a market price for CO2 (as an industrial commodity). If the CO2 captured at a power plant can be sold at this price (e.g., to the food industry, or for enhanced oil recovery), the COE for the plant with capture would be the same as for the reference plant having higher CO2 emissions. Numerically, the cost of CO2 captured is lower than the cost of CO2 avoided because the energy required to operate the CO2 capture systems increases the amount of CO2 emitted per unit of product.
3.7.2.5 Importance of CCS energy requirementsAs the energy requirement for CCS is substantially larger than for other emission control systems, it has important implications for plant economics as well as for resource requirements and environmental impacts. The energy ‘penalty’ (as it is often called) enters cost calculations in one of two ways. Most commonly, all energy needed to operate CCS absorbers, compressors, pumps and other equipment is assumed to be provided within the plant boundary, thus lowering the net plant capacity (kW) and output (kWh, in the case of a power plant). The result, as shown by Equation (7), is a higher unit capital cost (US$ kW-1) and a higher cost of electricity production (US$ kWh-1).Effectively,thesehigherunitcostsreflecttheexpenseof building and operating the incremental capacity needed to operate the CCS system. Alternatively, some studies - particularly for industrial processes such as hydrogen production - assume that some or all of the energy needed to operate the CCS system is purchased from outside the plant boundary at some assumed price. Still other studies assume that new equipment is installed to generate auxiliary energy on-site. In these cases, the net plant capacity and output may or may not change and may even increase. However, the COE in Equation (7) again will rise due to the increases in VOM costs (for purchased energy) and (if applicable) capital costs for additional equipment. The assumption of purchased power, however, does not guarantee a full accounting of the replacement costs or CO2 emissions associated with CCS. In all cases, however, the larger the CCS energy requirement, the greater the difference between the costs of CO2 captured and avoided.
3.7.2.6 Other measures of costThe cost measures above characterize the expense of adding CO2 capture to a single plant of a given type and operating profile.Abroadermodelling framework is needed to addressquestions involving multiple plants (e.g., a utility system, regional grid, or national network), or decisions about what type of plant to build (and when). Macroeconomic models that include emission control costs as elements of a more complex framework typically yield cost measures such as the change in gross domestic product (GDP) from the imposition of a carbon constraint, along with changes in the average cost of electricity and cost per tonne of CO2 abated. Such measures areoftenusefulforpolicyanalysis,butreflectmanyadditional
assumptions about the structure of an economy as well as the cost of technology. Chapter 8 provides a discussion of macroeconomic modelling as it relates to CO2 capture costs.
3.7.3 Thecontextforcurrentcostestimates
Recall that CO2 capture, while practiced today in some industrial applications, is not currently a commercial technology used at large electric power plants, which are the focus of most CCS studies. Thus, cost estimates for CO2 capture systems rely mainly on studies of hypothetical plants. Published studies also differsignificantlyintheassumptionsusedforcostestimation.Equation (7), for example, shows that the plant capacity factor has a major impact on the cost of electric power generation, as do the plant lifetime and discount rate used to compute the fixedchargefactor.TheCOE,inturn,isakeyelementofCO2 avoidance cost, Equation (8). Thus, a high plant capacity factor ora lowfixedchargeratewill lower thecostofCO2 capture per kWh. The choice of other important parameters, such as theplantsize,efficiency,fueltypeandCO2 removal rate will similarly affect the CO2 capture cost. Less apparent, but often equally important, are assumptions about parameters such as the ‘contingency cost factors’ embedded in capital cost estimates toaccountforunspecifiedcostsanticipatedfortechnologiesatan early stage of development, or for commercial systems that have not yet been demonstrated for the application, location, or plant scale under study. Because of the variability of assumptions employed in different studies of CO2 capture, a systematic comparison of cost results is not straightforward (or even possible in most cases). Moreover, there is no universally ‘correct’ set of assumptions that apply to all the parameters affecting CO2 capture cost. For example, the quality and cost of natural gas or coal delivered to power plants in Europe and the United States may differ markedly. Similarly, the cost of capital for a municipal or government-ownedutilitymaybesignificantlylowerthanforaprivately-owned utility operating in a competitive market. These and other factors lead to real differences in CO2 capture costs for a given technology or power generation system. Thus, we seek in this report to elucidate the key assumptions employed in different studies of similar systems and technologies and their resulting impact on the cost of CO2 capture. Analyses comparing the costs of alternative systems on an internally consistent basis (within a particular study) also are highlighted. Nor are all studies equally credible, considering their vintage, data sources, level of detail and extent of peer review. Thus, the approach adopted here is to rely as much as possible on recent peer-reviewed literature, together with other publicly-available studies by governmental and private organizations heavilyinvolvedinthefieldofCO2 capture. Later, in Chapter 8, the range of capture costs reported here are combined with cost estimates for CO2 transport and storage to arrive at estimates of the overall cost of CCS for selected power systems and industrial processes.
150 IPCC Special Report on Carbon dioxide Capture and Storage
3.7.4 Overviewoftechnologiesandsystemsevaluated
Economic studies of CO2 capture have focused mainly on electric power generation, a major source of CO2 emissions. To a lesser extent, CO2 capture from industrial processes also has been subject to economic evaluations, especially processes producing hydrogen, often in combination with other products. The sections below review and summarize recent estimates of CO2 capture costs for major systems of interest. Sections 3.7.5 to 3.7.8 focus first on the cost of current CO2 capture technologies, while Sections 3.7.10 to 3.7.12 go on to discuss improved or ‘advanced’ technologies promising lower costs in thefuture.Inallcasesthesystemboundaryisdefinedasasinglefacility at which CO2 is captured and compressed for delivery toatransportandstoragesystem.Toreflectdifferentlevelsofconfidence (oruncertainty) incost estimates for technologiesat different stages of development, the qualitative descriptors shown in Table 3.6 are applied in summarizing published cost estimates.9 The studies reviewed typically report costs in US dollars for reference years ranging from 2000 to early 2004. Becauseinflationeffectsgenerallyhavebeensmallduringthisperiod no adjustments have been made in summarizing ranges of reported costs.
Most of the world’s electricity is currently generated from the combustion of fossil fuels, especially coal and (to an increasing extent) natural gas. Hence, the ability to capture and store the CO2 emitted by such plants has been a major focus of investigation. This section of the report focuses on the cost of currently available technology for CO2 capture. Because of the relatively low CO2 concentration in power plant fluegases, chemical absorption systems have been the dominant technology of interest for post-combustion capture (see Section 3.3.2). However, the cost of CO2 capture depends not only on
9 These descriptions are used in subsequent tables to characterize systems with CO2 capture. In most cases the cost estimates for reference plants (without capture) would rank as high (e.g., IGCC power plants) or very high (e.g., PC and NGCC power plants).
the choice of capture technology, but also - and often more importantly - on the characteristics and design of the overall power plant. For purposes of cost reporting, we distinguish betweencoal-firedandgas-firedplantdesignsandbetweennewand existing facilities.
3.7.5.1 Newcoal-firedpowerplantsTable 3.7 summarizes the key assumptions and results of recent studies of post-combustion CO2 capture at new coal-firedpower plants. Assumed plant sizes with CO2 capture range from approximately 300-700 MW net power output. In all cases, CO2 capture is accomplished using an amine-based absorption system,typicallyMEA.Captureefficienciesrangefrom85-95%with the most common value being 90%. The studies employ different assumptions about other key parameters such as the base power plant efficiency, coal properties, coal cost, plantcapacity factor, CO2productpressureandfinancialparameterssuchasthefixedchargefactor.AllofthesefactorshaveadirectinfluenceontotalplantcostandthecostofCO2 capture. Table 3.7 summarizes several measures of CO2 capture cost, both in absolute and relative terms. Across the full set of studies, CO2 capture adds 44-87% to the capital cost of the reference plant (US$ kW-1) and 42-81% to the cost of electricity (US$ MWh-1), while achieving CO2 reductions of approximately 80-90% per net kWh produced. The cost of CO2 avoided for these cases varies from 29-51 US$/tCO2. The absolute values of capital cost, COE and incremental cost of electricity in Table 3.7 reflect the different assumptions employed in eachstudy. The result is an incremental COE of 18-38 US$ MWh-1 (or US$ 0.018-0.038 kWh-1) for CO2 capture. The total COE for plants with capture ranges from 62-87 US$ MWh-1. In all cases,asignificantportionofthetotalCO2 capture cost is due to the energy requirement for CO2 capture and compression. For the studies in Table 3.7, the plants with CO2 capture require 24-42% more fuel input per MWh of plant output relative to a similar reference plant without capture. Roughly half the energy is required for solvent regeneration and a third for CO2 compression. While many factors contribute to the cost differences observed inTable 3.7, systematic studies of the influence ofdifferent factors indicate that the most important sources of variability in reported cost results are assumptions about the
table 3.6 Confidence levels for technology and system cost estimates.
Confidence Level DescriptionVery High Mature technology with multiple commercial replications for this application and scale of operation; considerable
operating experience and data under a variety of conditions.
High Commercially deployed in applications similar to the system under study, but at a smaller scale and/or with limited operating experience; no major problems or issues anticipated in this application; commercial guarantees available.
Moderate No commercial application for the system and/or scale of interest, but technology is commercially deployed in other applications; issues of scale-up, operability and reliability remain to be demonstrated for this application.
Low Experience and data based on pilot plant or proof-of-concept scale; no commercial applications or full-scale demonstrations; significant technical issues or cost-related questions still to be resolved for this application.
Very Low A new concept or process not yet tested, or with operational data limited to the laboratory or bench-scale level; issues of large-scale operability, effectiveness, reliability and manufacturability remain to be demonstrated.
Chapter 3: Capture of CO2 151
tabl
e 3.
7 C
O2 c
aptu
re c
osts
: new
pul
veriz
ed-c
oal p
ower
pla
nts
usin
g cu
rren
t tec
hnol
ogy.
Stud
y A
ssum
ptio
ns a
nd R
esul
ts
Pars
ons
Pars
ons
Sim
beck
iEA
GH
GiE
A G
HG
Rub
in
eta
l.R
ange
NEt
LR
ao &
R
ubin
Stob
bs &
Cla
rk
2002
b20
02b
2002
2004
2004
2005
min
max
2002
2002
2005
SuPE
RC
Rit
iCA
L u
Nit
S / B
itu
miN
Ou
S C
OA
LSSu
BCR
it u
Nit
S / L
OW
RA
NK
CO
ALS
Ref
eren
ceP
lant
(with
outc
aptu
re)
**
**
Boi
ler t
ype
(sub
criti
cal,
supe
r, ul
tra)
supe
rul
traul
traul
traul
trasu
per
subc
ritic
al
subc
ritic
al
supe
rC
oal t
ype
(bit,
sub
-bit,
lig)
and
%S
bit,
2.5%
Sbi
t, 2.
5% S
bi
t, 1%
Sbi
t, 1%
S
bit,
1% S
bi
t, 2.
1% S
bi
t, 2.
5%S
sub-
bit,
0.5%
Slig
nite
Emis
sion
con
trol t
echn
olog
ies
(SO
2/NO
x)FG
D, S
CR
FGD
, SC
RFG
D, S
CR
FGD
, SC
RFG
D, S
CR
FGD
, SC
RFG
DFG
D, S
CR
FGD
, SC
R, L
oTO
x
Ref
eren
ce p
lant
net
out
put (
MW
)46
250
652
075
875
452
446
275
839
746
242
4Pl
ant c
apac
ity fa
ctor
(%)
6565
8085
8575
6585
8575
90N
et p
lant
effi
cien
cy, L
HV
(%)
42.2
44.8
44.5
44.0
43.7
40.9
4145
38.9
36.1
43.4
Coa
l cos
t, LH
V (U
S$ G
J-1)
1.29
0.98
1.50
1.50
1.25
0.98
1.50
1.03
1.25
0.88
Ref
eren
ce p
lant
em
issi
on ra
te (t
C
O2 M
Wh-1
)0.
774
0.73
60.
760.
743
0.74
70.
811
0.74
0.81
0.83
50.
941
0.88
3
Ca
ptur
ePl
antD
esig
nC
O2 c
aptu
re te
chno
logy
MEA
MEA
MEA
MEA
KS-
1M
EAM
EAM
EAM
EAN
et p
lant
out
put w
ith c
aptu
re (M
W)
329
367
408
666
676
492
329
676
283
326
311.
0N
et p
lant
effi
cien
cy, L
HV
(%)
30.1
32.5
34.9
34.8
35.4
31.1
3035
27.7
25.4
31.8
CO
2 cap
ture
sys
tem
effi
cien
cy (%
)90
9085
87.5
9090
8590
9590
95C
O2 e
mis
sion
rate
afte
r cap
ture
(t
MW
h-1)
0.10
80.
101
0.14
50.
117
0.09
20.
107
0.09
0.15
0.05
90.
133
0.06
0
CO
2 cap
ture
d (M
t yr-1
)1.
830
2.35
02.
360
4.06
14.
168
3.10
21.
834.
172.
346
2.58
02.
795
CO
2 pro
duct
pre
ssur
e (M
Pa)
8.4
8.4
13.7
11.0
11.0
13.9
814
10.3
13.9
13.9
CC
S en
ergy
requ
irem
ent (
% m
ore
inpu
t MW
h-1)
4038
2826
2431
2440
4042
36
CO
2 red
uctio
n pe
r kW
h (%
)86
8681
8488
8781
8893
8693
Co
stRe
sults
***
****
***
Cos
t yea
r bas
is (c
onst
ant d
olla
rs)
2000
2000
2000
2004
2004
2002
2002
2000
2003
Fixe
d ch
arge
fact
or (%
)15
.515
.512
.711
.011
.014
.811
.015
.514
.815
.0R
efer
ence
pla
nt T
CR
(US$
kW
-1)
1281
1161
1486
1319
1265
1205
1161
1486
1268
1236
1891
Cap
ture
pla
nt T
CR
(US$
kW
-1)
2219
1943
2578
1894
2007
1936
1894
2578
2373
2163
3252
Incr
emen
tal T
CR
for c
aptu
re
(US$
kW
-1)
938
782
1092
575
742
731
575
1092
1105
927
1361
Ref
eren
ce p
lant
CO
E (u
S$
mW
h1 )51
.551
.042
.943
.942
.846
.143
5242
.349
.244
.5
Cap
ture
pla
nt C
OE
(uS$
mW
h1 ) 85
.682
.470
.962
.463
.074
.162
8676
.687
.074
.3in
crem
enta
l CO
E fo
r ca
ptur
e (u
S$ m
Wh1 )
34.1
31.4
2818
.520
.228
1834
37.8
37.8
29.8
% in
crea
se in
cap
ital c
ost (
over
ref.
plan
t)73
6774
4459
6144
7487
7572
% in
crea
se in
CO
E (o
ver
ref.
plan
t)66
6265
4247
6142
6681
7767
Cos
t of C
O2 c
aptu
red
(US$
/tCO
2)35
2834
2324
2923
3531
3126
Cos
t of C
O2 a
void
ed (U
S$/tC
O2)
5149
4329
3140
2951
4347
36C
aptu
re c
ost c
onfid
ence
leve
l (se
e Ta
ble
3.6)
mod
erat
em
oder
ate
Not
es: A
ll co
sts
in th
is ta
ble
are
for c
aptu
re o
nly
and
do n
ot in
clud
e th
e co
sts
of C
O2 t
rans
port
and
stor
age;
see
Cha
pter
8 fo
r tot
al C
CS
cost
s. *
Rep
orte
d H
HV
val
ues
conv
erte
d to
LH
V a
ssum
ing
LHV
/HH
V =
0.
96 fo
r coa
l. **
Rep
orte
d ca
pita
l cos
ts in
crea
sed
by 8
% to
incl
ude
inte
rest
dur
ing
cons
truct
ion.
***
Rep
orte
d ca
pita
l cos
ts in
crea
sed
by 1
5% to
est
imat
e in
tere
st d
urin
g co
nstru
ctio
n an
d ot
her o
wne
rs’ c
osts
.
152 IPCC Special Report on Carbon dioxide Capture and Storage
CO2 capturesystemenergyrequirement,powerplantefficiency,fueltype,plantcapacityfactorandfixedchargerate(RaoandRubin, 2002). In this regard, it is useful to note that the lowest-cost capture systems in Table 3.7 (in terms of COE and cost of CO2 avoided) come from a recent study (IEA GHG, 2004) that combines an efficient supercritical power plant design usingbituminouscoal,withhighplantutilization,lowestfixedchargerateandmoreenergy-efficientaminesystemdesigns,asrecentlyannounced by two major vendors (but not yet demonstrated on coal-firedpowerplants).Incontrast,thehighestreportedCOEvaluesareforlessefficientsubcriticalplantdesignsusinglowrankcoal,combinedwithlowercapacityfactors,higherfixedcharge rates and employing amine system designs typical of units currently in operation at small power plants. Recent increases in world coal prices, if sustained, also would affect the levelized COE values reported here. Based on one recent study (IEA GHG, 2004), each 1.00 US$ GJ-1 increase in coal price would increase the COE by 8.2 US$ MWh-1 for a new PC plant without capture and by 10.1 US$ MWh-1 for a plant with capture. These results indicate that new power plants equipped with CO2capturearelikelytobehigh-efficiencysupercriticalunits, which yield lowest overall costs. The worldwide use of supercritical units (without capture) with current usage at 155 GWe (Section 3.1.2.2), is rapidly increasing in several regions of the world and, as seen in Table 3.7, the preponderance of recent studies of CO2 capture are based on supercritical units using bituminous coals. For these plants, Table 3.7 shows that capture systems increase the capital cost by 44-74% and the COE by 42-66% (18-34 US$ MWh-1). The major factors contributing to these ranges were differences in plant size, capacity factor andfixedchargefactor.Neworimprovedcapturesystemsandpower plant designs that promise to further reduce the costs of CO2 capture are discussed later in Section 3.7.7. First, however, we examine CO2 capture costs at existing plants.
3.7.5.2 Existingcoal-firedplantsCompared to the study of new plants, CO2 capture options for existing power plants have received relatively little study to date. Table 3.8 summarizes the assumptions and results of several studiesestimatingthecostofretrofittinganamine-basedCO2 capture system to an existing coal-firedpower plant. Severalfactorssignificantlyaffecttheeconomicsofretrofits,especiallytheage,smallersizesandlowerefficienciestypicalofexistingplants relative to new builds. The energy requirement for CO2 capture also is usually higher because of less efficient heatintegration for sorbent regeneration. All of these factors lead to higheroverallcosts.Existingplantsnotyetequippedwithafluegas desulphurization (FGD) system for SO2 control also must beretrofittedorupgradedforhigh-efficiencysulphurcaptureinaddition to the CO2 capture device. For plants with high NOx levels, a NO2 removal system also may be required to minimize solventlossfromreactionswithacidgases.Finally,site-specificdifficulties,suchaslandavailability,accesstoplantareasandthe need for special ductwork, tend to further increase the capitalcostofanyretrofitprojectrelativetoanequivalentnew
plant installation. Nonetheless, in cases where the capital cost of the existing plant has been fully or substantially amortized, Table3.8showsthattheCOEofaretrofittedplantwithcapture(including all new capital requirements) can be comparable to or lower than that of a new plant, although the incremental COE is typically higher because of the factors noted above. Table 3.8 further shows that for comparable levels of about 85% CO2 reduction per kWh, the average cost of CO2 avoidedforretrofitsisabout35%higherthanforthenewplantsanalyzed in Table 3.7. The incremental capital cost and COE depend strongly on site-specific assumptions, including thedegree of amortization and options for providing process energy needs. As with new plants, heat and power for CO2 capture are usually assumed to be provided by the base (reference) plant, resulting in a sizeable (30 to 40%) plant output reduction. Other studiesassumethatanauxiliarygas-firedboilerisconstructedto provide the CO2 capture steam requirements and (in some cases) additional power. Low natural gas prices can make this option more attractive than plant output reduction (based on COE), but such systems yield lower CO2 reductions (around 60%) since the emissions from natural gas combustion are typically not captured. For this reason, the avoided cost values for this option are not directly comparable to those with higher CO2 reductions. Also reflected in Table 3.8 is the option of rebuildingan existing boiler and steam turbine as a supercritical unit to gain efficiency improvements in conjunction with CO2 capture. One recent study (Gibbins et al., 2005) suggests this option could be economically attractive in conjunction with CO2 capture since themore efficient unitminimizes the costof capture and yields a greater net power output and a lower COEcomparedtoasimpleretrofit.Theuseofanewandlessenergy-intensive capture unit yields further cost reductions in this study. Another recent study similarly concluded that the most economical approach to CO2 capture for an existing coal-firedplantwastocombineCO2 capture with repowering the unit with an ultra-supercritical steam system (Simbeck, 2004). One additional option, repowering an existing unit with a coal gasifier, is discussed later in Section 3.7.6.2.
3.7.5.3 Naturalgas-firedpowerplantsPower plants fuelled by natural gas may include gas-firedboilers, simple-cycle gas turbines, or natural gas combined cycle (NGCC) units. The current operating capacity in use globally is 333 GWe for gas-fired boilers, 214 GWe for simple cycle gas turbines and 339 GWe for NGCC (IEA WEO, 2004). The absence of sulphur and other impurities in natural gas reduces the capital costs associated with auxiliary flue gas clean-upsystems required for amine-based CO2 capture technology. On the other hand, the lower concentration of CO2ingas-firedunitstends to increase the cost per tonne of CO2 captured or avoided relativetocoal-firedunits. Table 3.9 summarizes the assumptions and cost results of several recent studies of CO2 capture at gas-fired combinedcycle power plants ranging in size from approximately 300-700 MW. Relative to reference plants without capture, to achieve net
Chapter 3: Capture of CO2 153
tabl
e 3.
8 C
O2 c
aptu
re c
osts
: exi
stin
g pu
lver
ized
-coa
l pow
er p
lant
s us
ing
curr
ent t
echn
olog
y.
Stud
y A
ssum
ptio
ns a
nd R
esul
ts
Sim
beck
&
mcD
onal
dA
lstom
et
al.
Rao
&
Rub
inR
ao &
R
ubin
Che
n
eta
l.C
hen
et
al.
Che
n
eta
l.Si
ngh
et
al.
Gib
bins
et
al.
Ran
geG
ibbi
ns
eta
l.G
ibbi
ns
eta
l.C
hen
et
al.
2000
2001
2002
2002
2003
2003
2003
2003
2005
min
max
2006
2006
2003
Am
iNE
SySt
Em R
EtR
OFi
tS t
O E
xiS
tiN
G B
OiL
ERS
REP
OW
ERiN
G +
CO
2 CA
Ptu
RE
Ref
eren
ceP
lant
(with
outc
aptu
re)
**
**
**
Boi
ler t
ype
(sub
criti
cal,
supe
r, ul
tra)
sub
sub
sub
sub
sub
sub
sub
sub
supe
rsu
per
sub
Coa
l typ
e (b
it, s
ub-b
it, li
g) a
nd %
Ssu
b-bi
t, 0.
5%
bit,
2.7%
S su
b-bi
t, 0.
5%
sub-
bit,
0.5%
su
b-bi
t, 1.
1%S
sub-
bit,
1.1%
S su
b-bi
t, 1.
1%S
sub-
bit
Emis
sion
con
trol t
echn
olog
ies
(S
O2/N
Ox)
none
FGD
none
FGD
FGD
FG
D
FGD
no
t re
porte
dno
t re
porte
dno
t rep
orte
dno
t rep
orte
dFG
D
Ref
eren
ce p
lant
siz
e (M
W)
292
434
470
470
248
248
248
400
248
470
248
Plan
t cap
acity
fact
or (%
)80
6775
7580
76
(Cap
ture
= 80
)76
(C
aptu
re=8
0)91
.380
6791
8080
80
Net
pla
nt e
ffici
ency
, LH
V (%
)36
.236
.236
.633
.133
.133
.136
.033
3743
.543
.5C
oal c
ost,
LHV
(US$
GJ-1
)0.
981.
301.
251.
251.
201.
201.
203.
070.
983.
073.
073.
071.
20R
efer
ence
pla
nt e
mis
sion
rate
(t
CO
2 MW
h-1)
0.90
10.
908
0.94
10.
951.
004
1.00
41.
004
0.92
50.
901.
001.
004
C
aptu
reP
lant
Des
ign
CO
2 cap
ture
tech
nolo
gyM
EAM
EAM
EAM
EAM
EAM
EAM
EAM
EAM
EAM
EAK
S S
elex
olO
ther
equ
ipm
ent i
nclu
ded
new
FG
DFG
D
upgr
ade
New
FG
DFG
D
upgr
ade
FGD
up
grad
eFG
D u
pgra
deFG
D u
pgra
deFG
DA
dvan
ced
supe
rcrit
bo
iler r
etro
fit
Adv
ance
d su
perc
rit b
oile
r re
trofit
IGC
C (T
exac
o Q
) rep
ower
+c
urre
nt s
team
turb
ine
Net
pla
nt s
ize
with
cap
ture
(MW
)29
425
527
527
514
028
228
240
014
040
059
0A
uxila
ry b
oile
r/fue
l use
d? (t
ype,
LH
V
cost
)N
G. $
4.51
G
J-1
none
none
none
none
NG
. $2.
59
GJ-1
NG
. $5.
06
GJ-1
NG
. $3
.79
GJ-1
none
none
none
none
Net
pla
nt e
ffici
ency
, LH
V (%
)25
.321
.321
.421
.418
.724
.019
2531
.534
.532
.6C
O2 c
aptu
re s
yste
m e
ffici
ency
(%)
9096
9090
9090
9090
9096
90C
O2 e
mis
sion
rate
afte
r cap
ture
(t M
Wh-1
)0.
113
0.05
90.
155
0.16
0.17
70.
369
0.36
90.
324
0.06
0.37
0.09
9C
O2 c
aptu
red
(Mt y
r-1)
2.09
02.
228
1.48
01.
480
1.48
02.
664
1.48
2.66
3.68
4C
O2 p
rodu
ct p
ress
ure
(MPa
)13
.713
.913
.913
.913
.913
.913
.910
.010
1410
.010
.014
.5C
CS
ener
gy re
quire
men
t (%
mor
e in
put M
Wh-1
)43
7071
7750
4377
3826
CO
2 red
uctio
n pe
r kW
h (%
)87
9484
8382
6363
6563
94
Cos
tRes
ults
****
Cos
t yea
r bas
is (c
onst
ant d
olla
rs)
1999
n/a
2000
2000
2000
2000
2000
2001
Fixe
d ch
arge
fact
or (%
)12
.813
.015
.015
.014
.814
.814
.89.
411
.89.
415
.011
.811
.815
Ref
eren
ce p
lant
TC
R (U
S$ k
W-1)
112
00
00
160
016
048
048
00
Cap
ture
pla
nt T
CR
(US$
kW
-1)
1059
1941
837
647
654
846
1028
647
1941
1282
1170
1493
Incr
emen
tal T
CR
for c
aptu
re (U
S$ k
W-1)
947
1602
837
647
654
846
868
647
1602
802
690
1493
Ref
eren
ce p
lant
CO
E (u
S$ m
Wh-1
) 18
.818
.018
.020
.620
.620
.626
.018
2627
.027
.021
Cap
ture
pla
nt C
OE
(uS$
mW
h-1)
54.3
70.4
66.7
66.8
51
.1
62.2
65
.0
5170
58.0
53
.0
62.2
incr
emen
tal C
OE
for
capt
ure
(u
S$ m
Wh-1
)35
.561
.752
.448
.746
.230
.641
.733
.239
.031
6231
.026
.041
.2
% in
crea
se in
cap
ital c
ost (
over
ref.
plan
t)%
incr
ease
in C
OE
(ove
r re
f. pl
ant)
189
291
271
225
149
203
150
149
291
115
9619
6C
ost o
f CO
2 cap
ture
d (U
S$/tC
O2)
3542
3141
5640
3156
Cos
t of C
O2 a
void
ed (U
S$/tC
O2)
4573
6759
5648
6655
4573
46C
aptu
re c
ost c
onfid
ence
leve
l (s
ee T
able
3.6
) m
oder
ate
mod
erat
e
Not
es: A
ll co
sts
in th
is ta
ble
are
for c
aptu
re o
nly
and
do n
ot in
clud
e th
e co
sts
of C
O2 t
rans
port
and
stor
age;
see
Cha
pter
8 fo
r tot
al C
CS
cost
s. *
Rep
orte
d H
HV
val
ues
conv
erte
d to
LH
V a
ssum
ing
LHV
/HH
V =
0.9
6 fo
r coa
l and
0.9
0 fo
r nat
ural
gas
. **
Rep
orte
d ca
pita
l cos
ts in
crea
sed
by 1
5% to
est
imat
e in
tere
st d
urin
g co
nstru
ctio
n an
d ot
her o
wne
rs’ c
osts
.
154 IPCC Special Report on Carbon dioxide Capture and Storageta
ble
3.9
CO
2 cap
ture
cos
ts: n
atur
al g
as-f
ired
pow
er p
lant
s us
ing
curr
ent t
echn
olog
y.St
udy
Ass
umpt
ions
and
Res
ults
Pa
rson
sN
EtL
iEA
GH
GiE
A G
HG
CC
PR
ubin
eta
l.R
ubin
eta
l.R
ange
20
02(b
)20
0220
0420
0420
0520
0520
05m
inm
ax
Ref
eren
ceP
lant
(with
outc
aptu
re)
**
*Pl
ant t
ype
(boi
ler,
gas
turb
ine,
com
b.cy
cle)
com
b.cy
cle
com
b.cy
cle
com
b.cy
cle
com
b.cy
cle
com
b.cy
cle
com
b.cy
cle
com
b.cy
cle
Ref
eren
ce p
lant
siz
e (M
W)
509
379
776
776
392
507
507
379
776
Plan
t cap
acity
fact
or (%
)65
8585
8595
7550
5095
Net
pla
nt e
ffici
ency
, LH
V (%
)55
.157
.955
.655
.657
.655
.855
.855
58Fu
el c
ost,
LHV
(US$
GJ-1
)2.
823.
553.
003.
002.
964.
444.
442.
824.
44R
efer
ence
pla
nt e
mis
sion
rate
(tC
O2 M
Wh-1
)0.
364
0.34
40.
379
0.37
90.
370.
367
0.36
70.
344
0.37
9
Cap
ture
Pla
ntD
esig
nC
O2 c
aptu
re te
chno
logy
MEA
MEA
MEA
KS-
1M
EAM
EAM
EAN
et p
lant
siz
e w
ith c
aptu
re (M
W)
399
327
662
692
323
432
432
323
692
Net
pla
nt e
ffici
ency
, LH
V (%
)47
.449
.947
.449
.647
.447
.647
.647
50C
O2 c
aptu
re s
yste
m e
ffici
ency
(%)
9090
8585
8690
9085
90C
O2 e
mis
sion
rate
afte
r cap
ture
(t M
Wh-1
)0.
045
0.04
00.
066
0.06
30.
063
0.04
30.
043
0.04
00.
066
CO
2 cap
ture
d (M
t yr-1
)0.
949
0.87
51.
844
1.84
41.
091.
099
0.73
30.
733
1.84
4C
O2 p
rodu
ct p
ress
ure
(MPa
)8.
410
.311
.011
.013
.713
.78
14C
CS
ener
gy re
quire
men
t (%
mor
e in
put M
Wh-1
)16
1615
1122
1717
1122
CO
2 red
uctio
n pe
r kW
h (%
)88
8883
8383
8888
8388
C
ostR
esul
tsC
ost y
ear b
asis
(con
stan
t dol
lars
)20
0020
0220
0420
0420
0120
01Fi
xed
char
ge fa
ctor
(%)
11.0
11.0
11.0
14.8
14.8
11.0
14.8
Ref
eren
ce p
lant
TC
R (U
S$ k
W-1)
549
515
539
539
724
554
554
515
724
Cap
ture
pla
nt T
CR
(US$
kW
-1)
1099
911
938
958
1261
909
909
909
1261
Incr
emen
tal T
CR
for c
aptu
re (U
S$ k
W-1)
550
396
399
419
537
355
355
355
550
Ref
eren
ce p
lant
CO
E (u
S$ m
Wh-1
) 34
.234
.731
.331
.334
.243
.150
3150
Cap
ture
pla
nt C
OE
(uS$
mW
h-1)
57.9
48.3
4443
.151
.858
.972
4372
incr
emen
tal C
OE
for
capt
ure
(uS$
mW
h-1)
23.7
13.6
12.7
11.8
17.6
15.8
2212
24%
incr
ease
in c
apita
l cos
t (ov
er re
f. pl
ant)
100
7774
7874
6464
6410
0%
incr
ease
in C
OE
(ove
r re
f. pl
ant)
6939
4138
5137
4437
69C
ost o
f CO
2 cap
ture
d (U
S$/tC
O2)
5738
3433
4641
5733
57C
ost o
f CO
2 avo
ided
(US$
/tCO
2)74
4541
3757
4968
3774
Cap
ture
cos
t con
fiden
ce le
vel (
see
Tabl
e 3.
6) m
oder
ate
Not
es: A
ll co
sts
in th
is ta
ble
are
for c
aptu
re o
nly
and
do n
ot in
clud
e th
e co
sts
of C
O2 t
rans
port
and
stor
age;
see
Cha
pter
8 fo
r tot
al C
CS
cost
s. *
Rep
orte
d H
HV
val
ues
conv
erte
d to
LH
V a
ssum
ing
LHV
/HH
V =
0.9
0 fo
r nat
ural
gas
.
Chapter 3: Capture of CO2 155
CO2 reductions (per kWh) of the order of 83-88%, the capital cost per kW increases by 64-100%, while the COE increases by 37-69%, or by 12-24 US$ MWh-1 on an absolute basis. The corresponding cost of CO2 avoided ranges from 37-74 US$/tCO2, while the CCS energy requirement increases plant fuel consumption per kWh by 11-22%. As seen earlier in Equations (7) to (9), assumptions about theplantfuelcosthaveanespeciallyimportantinfluenceontheCOEforgas-firedplantsbecausethecontributionofcapitalcostsis relatively low compared to coal plants. The studies in Table 3.9 assume stable gas prices of 2.82-4.44 US$ GJ-1 (LHV basis) over the life of the plant, together with high capacity factors (65-95%) representing base load operation. These assumptions result in relatively low values of COE for both the reference plant and capture plant. Since about 2002, however, natural gas priceshaveincreasedsignificantlyinmanypartsoftheworld,which has also affected the outlook for future prices. Based on the assumptions of one recent study (IEA GHG, 2004), the COE for an NGCC plant without capture would increase by 6.8 US$ MWh-1 for each 1.00 US$ GJ-1 increase in natural gas price (assuming no change in plant utilization or other factors of production). An NGCC plant with CCS would see a slightly higher increase of 7.3 US$ MWh-1. The price of natural gas, and its relation to the price of competing fuels like coal, is an important determinant of which type of power plant will provide the lowest cost electricity in the context of a particular situation. However, across a twofold increase in gas price (from 3-6 US$ GJ-1), the incremental cost of CO2 capture changed by only 2 US$ MWh-1 (US$ 0.002 kWh-1) with all other factors held constant. In countries like the US, higher gas prices have also resulted in lower utilization rates (averaging 30-50%) for plants originally designed for base-load operation, but where lower-cost coal plants are available for dispatch. This further raises the average cost of electricity and CO2 capture for those NGCC plants, as reflectedinonecaseinTable3.9withacapacityfactorof50%.In other parts of the world, however, lower-cost coal plants may not be available, or gas supply contracts might limit the ability to curtail gas use. Such situations again illustrate that options for power generation with or without CO2 capture should be evaluated in the context of a particular situation or scenario. Studies of commercial post-combustion CO2 capture applied to simple-cycle gas turbines have been conducted for thespecialcaseofretrofittinganauxiliarypowergeneratorina remote location (CCP, 2005). This study reported a relatively high cost of 88 US$/tCO2 avoided. Studies of post-combustion capture for gas-fired boilers have been limited to industrialapplications, as discussed later in Section 3.7.8.
3.7.5.4 Biomass-firingandco-firingsystemsPower plants can be designed to be fuelled solely by biomass, orbiomasscanbeco-firedinconventionalcoal-burningplants.The requirement to reduce net CO2 emissions could lead to an increased use of biomass fuel, because plants that utilize biomass as a primary or supplemental fuel may be able to take credit for the carbon removed from the atmosphere during the
biomass growth cycle. If the biomass carbon released during combustion (as CO2) is then captured and stored, the net quantity of CO2 emitted to the atmosphere could in principle be negative. The most important factor affecting the economics of biomass use is the cost of the biomass. This can range from a negative value, as in the case of some biomass wastes, to costs substantially higher than coal, as in the case of some purposely-grown biomass fuels, or wastes that have to be collected from diffuse sources. Power plants that use only biomass are typically smaller than coal-firedplantsbecause localavailabilityofbiomass isoftenlimited and biomass is more bulky and hence more expensive totransportthancoal.Thesmallersizesofbiomass-firedplantswouldnormally result in lowerenergyefficienciesandhighercosts of CO2 capture. Biomass can be co-fired with coal inlarger plants (Robinson et al., 2003). In such circumstances the incremental costs of capturing biomass-derived CO2 should be similar to costs of capturing coal-derived CO2. Another option is toconvertbiomassintopelletsorrefinedliquidfuelstoreducethe cost of transporting it over long distances. However, there are costsandemissionsassociatedwithproductionoftheserefinedfuels. Information on costs of CO2 capture at biomass-firedplants is sparse but some information is given in Section 3.7.8.4. The overall economics of CCS with biomass combustion will depend very much on local circumstances, especially biomass availability and cost and (as with fossil fuels) proximity to potential CO2 storage sites.
Studies of pre-combustion capture for electric power plants have focused mainly on IGCC systems using coal or other solid fuels such as petroleum coke. This section of the report focuses on currently available technology for CO2 capture at such plants. As before, the cost of CO2 capture depends not only on the choice of capture technology, but more importantly on the characteristics and design of the overall power plant, including the fuel typeandchoiceofgasifier.Because IGCCis not widely used for electric power generation at the present time, economic studies of IGCC power plants typically employ design assumptions based on the limited utility experience with IGCC systems and the more extensive experience with gasificationinindustrialsectorssuchaspetroleumrefiningandpetrochemicals.Foroxygen-blowngasifiers,thehighoperatingpressure and relatively high CO2 concentrations achievable in IGCC systems makes physical solvent absorption systems the predominant technology of interest for pre-combustion CO2 capture (see Section 3.5.2.11). For purposes of cost reporting, we again distinguish between new plant designs and the retrofittingofexistingfacilities.
3.7.6.1 NewcoalgasificationcombinedcyclepowerplantsTable 3.10 summarizes the key assumptions and results of several recent studies of CO2 capture costs for new IGCC power plants ranging in size from approximately 400-800 MW
156 IPCC Special Report on Carbon dioxide Capture and Storageta
ble
3.10
CO
2 cap
ture
cos
ts:
new
IGC
C p
ower
pla
nts
usin
g cu
rren
t tec
hnol
ogy.
Stud
y A
ssum
ptio
ns a
nd R
esul
ts
NEt
LN
EtL
NEt
LPa
rson
sSi
mbe
ckN
saka
la,
eta
l.iE
A G
HG
iEA
GH
GiE
A G
HG
Rub
in
eta
l.R
ubin
et
al.
Ran
ge
2002
2002
2002
2002
b20
0220
0320
0320
0320
0320
0520
05m
inm
axPL
AN
tS W
itH
Bit
um
iNO
uS
CO
AL
FEED
StO
CK
R
efer
ence
Pla
ntw
ithou
tcap
ture
)*
**
**
Gas
ifier
nam
e or
type
Shel
l,
O2 b
low
n,
CG
CU
E-ga
s,
O2 b
low
n,
CG
UC
Texa
co
quen
ch,
O2 b
low
n
E-ga
s,
O2 b
low
nTe
xaco
qu
ench
, O
2 blo
wn
Texa
co
syng
as c
oole
r, O
2 blo
wn
Texa
co
quen
ch,
O2 b
low
n
Texa
co
quen
ch,
O2 b
low
n
Shel
l,
O2 b
low
nTe
xaco
qu
ench
, O2
blow
n
Texa
co
quen
ch,
O2 b
low
nFu
el ty
pe (b
it, s
ubbi
t, lig
; oth
er) a
nd %
SIll
inoi
s #6
Illin
ois
#6Ill
inoi
s #6
bit,
2.5%
Sbi
t, 1%
Sbi
t b
it, 1
%S
bit,
1%
S b
it, 1
%S
bit,
2.1
%S
bit,
2.1
%S
Ref
eren
ce p
lant
siz
e (M
W)
413
401
571
425
521
827
827
776
527
527
401
827
Plan
t cap
acity
fact
or (%
)85
8565
6580
8085
8585
7565
6585
Net
pla
nt e
ffici
ency
, LH
V (%
)47
.446
.739
.144
.844
.638
.038
.043
.139
.139
.138
47Fu
el c
ost,
LHV
(US$
GJ-1
)1.
031.
031.
281.
290.
981.
231.
501.
501.
501.
251.
250.
981.
50R
efer
ence
pla
nt e
mis
sion
rate
(tC
O2 M
Wh-1
)0.
682
0.69
20.
846
0.71
80.
725
0.83
30.
833
0.76
30.
817
0.81
70.
680.
85
C
aptu
reP
lant
Des
ign
CO
2 cap
ture
tech
nolo
gySe
lexo
lSe
lexo
lSe
lexo
lSe
lexo
lSe
lexo
lSe
lexo
lSe
lexo
lSe
lexo
l. N
SSe
lexo
lSe
lexo
lSe
lexo
lN
et p
lant
siz
e, w
ith c
aptu
re (M
W)
351
359
457
404
455
730
742
676
492
492
351
742
Net
pla
nt e
ffici
ency
, LH
V (%
)40
.140
.131
.338
.539
.031
.531
.532
.034
.533
.833
.831
40C
O2 c
aptu
re s
yste
m e
ffici
ency
(%)
89.2
87.0
89.0
91.0
91.2
8585
8590
9085
91C
O2 e
mis
sion
rate
afte
r cap
ture
(t
MW
h-1)
0.08
70.
105
0.11
60.
073
0.06
50.
104
0.15
20.
151
0.14
20.
097
0.09
70.
070.
15
CO
2 cap
ture
d (M
t/yr)
1.80
31.
870
2.36
81.
379
2.15
14.
682
4.72
84.
050
2.74
92.
383
1.38
4.73
CO
2 pro
duct
pre
ssur
e (M
Pa)
14.5
14.5
8.3
8.3
11.0
11.0
11.0
13.7
13.7
814
CC
S en
ergy
requ
irem
ent (
% m
ore
inpu
t M
Wh-1
)18
1625
1614
2119
2516
1614
25
CO
2 red
uctio
n pe
r kW
h (%
)87
8586
9091
8282
8188
8881
91
Cos
tRes
ults
****
**
Cos
t yea
r bas
is (c
onst
ant d
olla
rs)
2002
2002
2002
2000
2000
2002
2002
2002
2001
2001
Fixe
d ch
arge
fact
or (%
)14
.814
.815
.013
.813
.011
.011
.011
.014
.817
.311
17R
efer
ence
pla
nt T
CR
(US$
kW
-1)
1370
1374
1169
1251
1486
1565
1187
1187
1371
1311
1311
1169
1565
Cap
ture
pla
nt T
CR
(US$
kW
-1)
2270
1897
1549
1844
2067
2179
1495
1414
1860
1748
1748
1414
2270
Incr
emen
tal T
CR
for c
aptu
re (U
S$ k
W-1)
900
523
380
593
581
614
308
227
489
437
437
227
900
Ref
eren
ce p
lant
CO
E (u
S$ m
Wh-1
) 40
.640
.943
.447
.743
.053
.045
.045
.048
.048
.361
4161
Cap
ture
pla
nt C
OE
(uS$
mW
h-1)
62.9
54.4
59.9
65.8
57.7
71.5
56.0
54.0
63.0
62.6
7954
79in
crem
enta
l CO
E fo
r ca
ptur
e
(uS$
mW
h-1)
22.3
13.5
16.5
18.1
14.7
18.5
119
1514
.318
.29
22
% in
crea
se in
cap
ital c
ost (
over
ref.
plan
t)66
3833
4739
3926
1936
3333
1966
% in
crea
se in
CO
E (o
ver
ref.
plan
t)55
3338
3834
3524
2031
3030
2055
Cos
t of C
O2 c
aptu
red
(US$
/tCO
2)32
1918
3021
1311
1917
2111
32C
ost o
f CO
2 av
oide
d (U
S$/tC
O2)
3723
2328
2223
1613
2420
2513
37C
aptu
re c
ost c
onfid
ence
leve
l (s
ee T
able
3.6
)m
oder
ate
Not
es: A
ll co
sts
in th
is ta
ble
are
for c
aptu
re o
nly
and
do n
ot in
clud
e th
e co
sts
of C
O2 t
rans
port
and
stor
age;
see
Cha
pter
8 fo
r tot
al C
CS
cost
s. *
Rep
orte
d H
HV
val
ues
conv
erte
d to
LH
V a
ssum
ing
LHV
/HH
V =
0.9
6 fo
r coa
l. **
Rep
orte
d ca
pita
l cos
ts in
crea
sed
by 8
% to
incl
ude
inte
rest
dur
ing
cons
truct
ion.
**R
epor
ted
capi
tal c
osts
incr
ease
d by
15%
to e
stim
ate
inte
rest
dur
ing
cons
truct
ion
and
othe
r ow
ners
’ cos
ts.
Chapter 3: Capture of CO2 157
table 3.10. Continued.
Study Assumptions and Results Stobbs & Clark Stobbs & Clark Stobbs & Clark iEA GHG
2005 2005 2005 2000bPLANtS WitH OtHER FEEDStOCKS
ReferencePlantwithoutcapture)Gasifier name or type Texaco quench,
O2 blownShell,
O2 blown O2 blown,
partial oxidationFuel type (bit, subbit, lig; other) and %S bit Sub-bit Lignite Natural gasReference plant size (MW) [No IGCC Reference Plants] 790Plant capacity factor (%) 90 90 90 90Net plant efficiency, LHV (%) 56.2Fuel cost, LHV (US$ GJ-1) 1.90 0.48 0.88 2.00Reference plant emission rate (tCO2 MWh-1) 0.370CapturePlantDesignCO2 capture technology Selexol Selexol Selexol SelexolNet plant size, with capture (MW) 445 437 361 820Net plant efficiency, LHV (%) 32.8 27.0 28.3 48.3CO2 capture system efficiency (%) 87 92 86 85CO2 emission rate after capture (t MWh-1) 0.130 0.102 0.182 0.065CO2 captured (Mt/yr) 3.049 4.040 3.183 2.356CO2 product pressure (MPa) 13.9 13.9 13.9 11.0CCS energy requirement (% more input MWh-1) 14CO2 reduction per kWh (%) 82CostResults *** *** *** **Cost year basis (constant dollars) 2003 2003 2003 2000Fixed charge factor (%) 11.0Reference plant TCR (US$ kW-1) 447Capture plant TCR (US$ kW-1) 2205 2518 3247 978Incremental TCR for capture (US$ kW-1) 531Reference plant COE (uS$ mWh-1) 21.6Capture plant COE (uS$ mWh-1) 68.4 62.1 83.9 34.4incremental COE for capture (uS$ mWh-1) 12.8% increase in capital cost (over ref. plant) 119% increase in COE (over ref. plant) 59Cost of CO2 captured (US$/tCO2) 35Cost of CO2 avoided (US$/tCO2) 31 33 56 42Capture cost confidence level (see Table 3.6) moderate moderateNotes: All costs in this table are for capture only and do not include the costs of CO2 transport and storage; see Chapter 8 for total CCS costs. * Reported HHV values converted to LHV assuming LHV/HHV = 0.96 for coal. ** Reported capital costs increased by 8% to include interest during construction. ***Reported capital costs increased by 15% to estimate interest during construction and other owners’ costs.
net power output.While several gasifiers and coal types arerepresented, most studies focus on the oxygen-blown Texaco quench system,10 and all but one assume bituminous coals. CO2 capture efficiencies across these studies range from 85-92%using commercially available physical absorption systems. The energy requirements for capture increase the overall plant heat rate (energy input per kWh) by 16-25%, yielding net CO2 reductions per kWh of 81-88%. Other study variables that influence totalplantcostand thecostofCO2 capture include the fuel cost, CO2 product pressure, plant capacity factor and fixedchargefactor.Manyoftherecentstudiesalsoincludethecostofasparegasifiertoensurehighsystemreliability. Table 3.10 indicates that for studies based on the Texaco or E-Gas gasifiers, CO2 capture adds approximately 20-40% to both the capital cost (US$ kW-1) and the cost of electricity (US$ MWh-1) of the reference IGCC plants, while studies
10 In 2004, the Texaco gasifier was re-named as the GE gasifier followingacquisition by GE Energy (General Electric). However, this report uses the name Texaco, as it is referred to in the original references cited.
using the Shell gasifier report increases of roughly 30-65%.The total COE reported for IGCC systems ranges from 41-61 US$ MWh-1 without capture and 54-79 US$ MWh-1 with capture.With capture, the lowest COE is found for gasifiersystems with quench cooling designs that have lower thermal efficiencies than themore capital-intensivedesignswithheatrecovery systems. Without capture, however, the latter system type has the lowest COE in Table 3.10. Across all studies, the cost of CO2 avoided ranges from 13-37 US$/tCO2 relative to an IGCC without capture, excluding transport and storage costs. Part of the reason for this lower incremental cost of CO2 capture relative to coal combustion plants is the lower average energy requirement for IGCC systems. Another key factor is the smallergasvolumetreatedinoxygen-blowngasifiersystems,which substantially reduces equipment size and cost. As with PC plants, Table 3.10 again emphasizes the importance of plant financing and utilization assumptions onthe calculated cost of electricity, which in turn affects CO2-capture costs. The lowest COE values in this table are for plants with a low fixed charge rate and high capacity factor, while
158 IPCC Special Report on Carbon dioxide Capture and Storage
substantiallyhigherCOEvaluesresultfromhighfinancingcostsand lower plant utilization. Similarly, the type and properties of coal assumed has a major impact on the COE, as seen in a recent Canadian Clean Power Coalition study, which found substantially higher costs for low-rank coals using a Texaco-based IGCC system (Stobbs and Clark, 2005, Table 3.10). EPRI also reports higher IGCC costs for low-rank coals (Holt et al., 2003). On the other hand, where plant-level assumptions and designs are similar across studies, there is relatively little difference in the estimated costs of CO2 capture based on current commercial technology. Similarly, the several studies in Tables 3.7 and 3.10 that estimate costs for both IGCC and PC plants onaninternallyconsistentbasis,allfindthatIGCCplantswithcapture have a lower COE than PC plants with capture. There isnotyetahighdegreeofconfidenceinthesecostestimates,however (see Table 3.6). ThecostsinTable3.10alsoreflecteffortsinsomestudiesto identify least-cost CO2 capture options. For example, one recent study (IEA GHG, 2003) found that capture and disposal of hydrogen sulphide (H2S) along with CO2 can reduce overall capture costs by about 20% (although this may increase transport and storage costs, as discussed in Chapters 4 and 5). The feasibility of this approach depends in a large part on applicable regulatory and permitting requirements. Advanced IGCC designs that may further reduce future CO2 capture costs are discussed in Section 3.7.7.
3.7.6.2 Repoweringofexistingcoal-firedplantswithIGCCForsomeexistingcoal-firedpowerplants,analternativetothepost-combustion capture systems discussed earlier is repowering withanIGCCsystem.Inthiscase-dependingonsite-specificcircumstances - some existing plant components, such as the steam turbine, might be refurbished and utilized as part of an IGCC plant. Alternatively, the entire combustion plant might be replaced with a new IGCC system while preserving other site facilities and infrastructure. Although repowering has been widely studied as an option to improve plant performance and increase plant output, there are relatively few studies of repowering motivated by CO2 capture. Table 3.8 shows results from one recent study (Chen et al., 2003) which reports CO2 capture costs for IGCC repowering of a250MWcoal-firedunitthatisassumedtobeafullyamortized(hence, a low COE of 21 US$ MWh-1). IGCC repowering yielded a net plant capacity of 600 MW with CO2 capture and a COE of 62-67 US$ MWh -1 depending on whether or not the existing steam turbine can be reused. The cost of CO2 avoided was 46-51 US$/tCO2. Compared to the option of retrofittingthe existing PC unit with an amine-based capture system and retaining the existing boiler (Table 3.8), the COE for IGCC repoweringwasestimatedtobe10-30%lower.Thesefindingsare in general agreement with earlier studies by Simbeck (1999). Because the addition of gas turbines roughly triples the gross plant capacity of a steam-electric plant, candidates for IGCC repowering are generally limited to smaller existing units (e.g., 100-300MW).Takentogetherwiththepost-combustionretrofitstudies in Table 3.8, the most cost-effective options for existing
plants involve combining CO2 capture with plant upgrades that increase overall efficiency and net output.Additional studieswould be needed to systematically compare the feasibility and cost of IGCC repowering to supercritical boiler upgrades at existingcoal-firedplants.
While electric power systems have been the dominant technologies of interest for CO2 capture studies, other industrial processes, including hydrogen production and multi-product plants producing a mix of fuels, chemicals and electricity also are of interest. Because CO2 capture cost depends strongly on the production process in question, several categories of industrial processes are discussed below.
3.7.7.1 Hydrogen production plantsSection 3.5 discussed the potential role of hydrogen as an energy carrier and the technological options for its production. Here we examine the cost of capturing CO2 normally released during the production of hydrogen from fossil fuels. Table 3.11 shows the key assumptions and cost results of recent studies of CO2 capture costs for plants with hydrogen production rates of 155,000-510,000 Nm3 h-1 (466-1531 MWt), employing either natural gas or coal as a feedstock. The CO2captureefficiencyfor the hydrogen plant ranges from 87-95% using commercially available chemical and physical absorption systems. The CO2 reduction per unit of product is lower, however, because of the process energy requirements and because of additional CO2 emitted by an offsite power plant assumed in some of these studies. As hydrogen production requires the separation of H2 from CO2, the incremental cost of capture is mainly the cost of CO2 compression. At present, hydrogen is produced mainly from natural gas. Two recent studies (see Table 3.11) indicate that CO2 capture would add approximately 18-33% to the unit cost of hydrogen while reducing net CO2 emissions per unit of H2 product by 72-83% (after accounting for the CO2 emissions from imported electricity). The total cost of hydrogen is sensitive to the cost of feedstock, so different gas prices would alter both the absolute and relative costs of CO2 capture. For coal-based hydrogen production, a recent study (NRC,2004) projects an 8% increase in the unit cost of hydrogen for an 83% reduction in CO2 emissions per unit of product. Again, thisfigure includes theCO2 emissions from imported electricity.
3.7.7.2 Multi-product plants Multi-product plants (also known as polygeneration plants) employ fossil fuel feedstocks to produce a variety of products such as electricity, hydrogen, chemicals and liquid fuels. To calculate the cost of any particular product (for a given rate of return), economic analyses of multi-product plants require thatthesellingpriceofallotherproductsbespecifiedovertheoperating life of the plant. Such assumptions, in addition to
Chapter 3: Capture of CO2 159
table 3.11. CO2 capture costs: Hydrogen and multi-product plants using current or near-commercial technology. (Continued on next page)
Study Assumptions and Results
HyDROGEN AND ELECtRiCity PRODuCtSSimbeck NRC NRC Parsons mitretek Kreutz
% increase in fuel product cost 32.5 18.2 7.7 21.1 13.4 9.3 4.5 4.5 32.5Cost of CO2 captured (US$/tCO2) 38.9 20.7 4.1 8.7 6.0 4.8 2.2 2.2 38.9Cost of CO2 avoided (US$/tCO2) 56.3 24.1 4.4 9.2 6.5 5.0 2.3 2.3 56.3Confidencelevel(seeTable3.6) high high moderate
Notes: All costs in this table are for capture only and do not include the costs of CO2 transport and storage; see Chapter 8 for total CCS costs. * Reported HHV values converted to LHV assuming LHV/HHV = 0.96 for coal, 0.846 for hydrogen, and 0.93 for F-T liquids. ** CO2captureefficiency=(CinCO2 captured)/(C in fossil fuel input to plant - C in carbonaceous fuel products of plant) x100; C associated with imported electricity is not included. ***Includes CO2 emitted in the production of electricity imported by the plant. ****Reported total plant investment values increased by 3.5% to estimate total capital requirement.
thosediscussedearlier,cansignificantlyaffecttheoutcomeofcost calculations when there is not one dominant product at the facility. Several of the coal-based hydrogen production plants in Table 3.11 also produce electricity, albeit in small amounts (in fact, smaller than the electricity quantities purchased by the stand-alone plants). Most of these studies assume that the value of the electricity product is higher under a carbon capture regime than without CO2 capture. The result is a 5-33%
increase in hydrogen production cost for CO2 reductions of 72-96% per unit of product. The case with the lowest incremental product cost and highest CO2 reduction assumes co-disposal of H2S with CO2, thus eliminating the costs of sulphur capture and recovery. As noted earlier (Section 3.7.6.1), the feasibility of this option depends strongly on local regulatory requirements; norarehighercosts for transport andstorage reflected in theTable 3.11 cost estimate for this case. Table 3.11 also presents examples of multi-product plants
160 IPCC Special Report on Carbon dioxide Capture and Storage
table 3.11. Continued.
Study Assumptions and Results
LiQuiD FuEL AND ELECtRiCity PRODuCtSmitretek Larson/Ren Larson/Ren Larson/Ren Larson/Ren Celik etal. Celik etal. Celik etal. Celik etal. Range
Confidencelevel(seeTable3.6) moderate moderate moderate low to moderateNotes: All costs in this table are for capture only and do not include the costs of CO2 transport and storage; see Chapter 8 for total CCS costs. * Reported HHV values converted to LHV assuming LHV/HHV = 0.96 for coal, 0.846 for hydrogen, and 0.93 for F-T liquids. ** CO2captureefficiency=(CinCO2 captured)/(C in fossil fuel input to plant - C in carbonaceous fuel products of plant) x100; C associated with imported electricity is not included. ***Includes CO2 emitted in the production of electricity imported by the plant. ****Reported total plant investment values increased by 3.5% to estimate total capital requirement.
Chapter 3: Capture of CO2 161
producing liquid fuels plus electricity. In these cases the amounts of electricity produced are sizeable compared to the liquid products, so the assumed selling price of electricity has amajorinfluenceontheproductcostresults.Sotoodoestheassumption in two of the cases of co-disposal of H2S with CO2 (as described above). For these reasons, the incremental cost of CO2 capture ranges from a 13% decrease to a 13% increase in fuel product cost relative to the no-capture case. Note too that the overall level of CO2 reductions per unit of product is only27-56%.This is because a significant portionof carbonin the coal feedstock is exported with the liquid fuel products. Nonetheless, an important benefit of these fuel-processingschemes is a reduction (of 30-38%) in the carbon content per unit of fuel energy relative to the feedstock fuel. To the extent these liquid fuels displace other fuels with higher carbon per unit ofenergy,thereisanetbenefitinend-useCO2 emissions when the fuels are burned. However, no credit for such reductions is taken in Table 3.11 because the system boundary considered is confinedtothefuelproductionplant.
CO2 can be captured in other industrial processes using the techniques described earlier for power generation. While the costs of capture may vary considerably with the size, type and location of industrial processes, such costs will be lowest for processes or plants having: streams with relatively high CO2 concentrations; process plants that normally operate at high load factors; plants with large CO2 emission rates; and, processes that can utilize waste heat to satisfy the energy requirements of CO2 capture systems. Despite these potential advantages, little detailed work has been carried out to estimate costs of CO2 capture at industrial plants, with most work focused on oilrefineriesandpetrochemicalplants.Asummaryofcurrentlyavailable cost studies appears in Table 3.12.
3.7.8.1 OilrefiningandpetrochemicalplantsGas-fired process heaters and steam boilers are responsiblefor the bulk of the CO2emittedfromtypicaloilrefineriesandpetrochemical plants. Although refineries and petrochemicalplants emit large quantities of CO2, they include multiple emission sources often dispersed over a large area. Economies of scale can be achieved by using centralized CO2 absorbers or amineregeneratorsbutsomeofthebenefitsareoffsetbythecostof pipes and ducts. Based on Table 3.14, the cost of capturing and compressing CO2 from refinery and petrochemical plantheaters using current technology is estimated to be 50-60 US$/tCO2 captured. Because of the complexity of these industrial facilities, along with proprietary concerns, the incremental cost of plant products is not normally reported. High purity CO2 is currently vented to the atmosphere by some gas processing and petrochemical plants, as described in Chapter 2. The cost of CO2 capture in such cases would be simply the cost of drying and compressing the CO2 to the pressure required for transport. The cost would depend on various
factors, particularly the scale of operation and the electricity price. Based on 2 MtCO2 yr-1 and an electricity price of US$ 0.05 kWh-1, the cost is estimated to be around 10 US$/tCO2 emissions avoided. Electricity accounts for over half of the total cost.
3.7.8.2 Cement plantsAs noted in Chapter 2, cement plants are the largest industrial source of CO2 apart from power plants. Cement plants normally burn lower cost high-carbon fuels such as coal, petroleum coke andvariouswastes.ThefluegastypicallyhasaCO2 concentration of14-33%byvolume,significantlyhigherthanatpowerplants,because CO2 is produced in cement kilns by decomposition of carbonate minerals as well as by fuel combustion. The high CO2 concentration would tend to reduce the specific cost of CO2 capturefromfluegas.Pre-combustioncapture,ifused,wouldonly capture the fuel-related CO2, so would be only a partial solution to CO2 emissions. Oxy-fuel combustion and capture using calcium sorbents are other options, which are described in Sections 3.2.4 and 3.7.11.
3.7.8.3 Integrated steel millsIntegrated steel mills are some of the world’s largest emitters of CO2, as described in Chapter 2. About 70% of the carbon introduced into an integrated steel mill is contained in the blast furnace gas in the form of CO2 and CO, each of which comprise about 20% by volume of the gas. The cost of capturing CO2 from blast furnace gas was estimated to be 35 US$/tCO2 avoided (Farla et al., 1995) or 18 US$/tCO2 captured (Gielen, 2003). Iron ore can be reacted with synthesis gas or hydrogen to produce iron by direct reduction (Cheeley, 2000). Direct reduction processes are already used commercially but further development work would be needed to reduce their costs so as to make them more widely competitive with conventional iron production processes. The cost of capturing CO2 from a direct reduction iron (DRI) production processes was estimated to be 10 US$/tCO2 (Gielen, 2003). CO2 also could be captured from other gases in iron and steel mills but costs would probably be higher as they are more dilute or smaller in scale.
3.7.8.4 Biomass plantsThe main large point sources of biomass-derived CO2 are currently wood pulp mills, which emit CO2 from black liquor recoveryboilersandbark-firedboilers,andsugar/ethanolmills,which emit CO2 frombagasse-firedboilers.Black liquor is abyproduct of pulping that contains lignin and chemicals used in the pulping process. The cost of post-combustion capture was estimated to be 34 US$/tCO2 avoided in a plant that captures about 1 MtCO2 yr-1 (Möllersten et al., 2003). Biomass gasificationisunderdevelopmentasanalternativetoboilers. CO2 could be captured from sucrose fermentation and from combustion of sugar cane bagasse at a cost of about 53 US$/tCO2 avoided for a plant capturing 0.6 MtCO2 yr-1 avoided (Möllersten et al., 2003). CO2 from sugar cane fermentation has a high purity, so only drying and compression is required. The overall cost is relatively high due to an annual load factor that is lower than that of most power stations and large industrial
162 IPCC Special Report on Carbon dioxide Capture and Storageta
ble
3.12
. Cap
ture
cos
ts: O
ther
indu
stria
l pro
cess
es u
sing
cur
rent
or a
dvan
ced
tech
nolo
gy.
Stud
y A
ssum
ptio
ns a
nd C
ost R
esul
ts
Cu
RR
ENt
tEC
HN
OLO
Gy
AD
vAN
CED
tEC
HN
OLO
Gy
Farl
a et
al.
iEA
GH
GiE
A G
HG
iEA
GH
Gm
ölle
rste
n et
al.
möl
lers
ten
eta
l.m
ölle
rste
n et
al.
CC
PC
CP
CC
PC
CP
CC
PC
CP
1995
2000
c20
00c
2002
b20
0320
0320
0320
0520
0520
0520
0520
0520
05
Ref
eren
ceP
lant
(with
outc
aptu
re)
Indu
stria
l pro
cess
Iron
pro
duct
ion
Oilrefiningpetrochem
ical
Oilrefining
petro
chem
ical
Hig
h pu
rity
CO
2 sou
rces
Pulp
mill
Pulp
mill
Etha
nol
ferm
enta
tion
Refinery
heat
ers &
bo
ilers
Smal
l gas
tu
rbin
esRefinery
heat
ers &
bo
ilers
Smal
l gas
tu
rbin
esSm
all g
as
turb
ines
Feed
stoc
k ty
peC
oke
Refinerygas/
natu
ral g
asRefinerygas/
natu
ral g
asB
lack
liqu
or
and
bark
Bla
ck li
quor
Suga
r can
eM
ixed
NG
Mix
edM
ixed
Nat
ural
gas
Nat
ural
gas
Plan
t siz
e (s
peci
fy u
nits
)16
8 kg
s−1 i
ron
315
kg s−
1
crud
e oi
l31
5 kg
s−1
cr
ude
oil
17.9
kg
s−1
pulp
17.9
kg
s−1
pulp
9.1
kg s−
1 et
hano
l13
51 M
Wt
358
MW
t13
51 M
Wt
1351
MW
t35
8 M
Wt
358
MW
t
Plan
t cap
acity
fact
or (%
)95
.390
9090
90.4
90.4
49.3
90.4
98.5
90.4
90.4
98.5
98.5
Feedstockcost(U
S$perunitspecified)
US$
3 G
J−1
LHV
US$
3 G
J−1
LHV
Ref
. pla
nt e
mis
sion
rate
(kgC
O2 M
Wh−
1 )0.
220.
820.
220.
220.
820.
82
Cap
ture
Pla
ntD
esig
nC
O2 ca
ptur
e/se
para
tion
tech
nolo
gyM
DEA
MEA
Pre-
co
mbu
stio
nC
ompr
essi
on
only
Am
ine
Phys
ical
so
lven
tLo
catio
n of
CO
2 ca
ptur
eB
last
furn
ace
gas
Fire
d he
ater
s an
d H
2 pla
ntFi
red
heat
ers
and
H2 p
lant
Boi
ler
IGC
CFe
rmen
tatio
n an
d ba
gass
e bo
iler
MEA
B
asel
ine
(pos
t-co
mb.
)
MEA
B
asel
ine
(pos
t-co
mb.
)
Mem
bran
e W
ater
Gas
Sh
ift (p
re-
com
b.)
Flue
Gas
R
ecyc
le &
IT
M (o
xy-
fuel
)
Very
Lar
ge-
scal
e ATR
(p
re-c
omb.
)
Sorp
tion
Enha
nced
W
ater
Gas
Shi
ft (p
re-
com
b.)
Cap
ture
uni
t siz
e (s
peci
fy u
nits
)39
2 M
W fu
el33
8 M
W fu
el13
51 M
Wt
358
MW
t13
51 M
Wt
1351
MW
t35
8 M
Wt
358
MW
tC
O2capturesy
stem
efficiency(%
)90
9591
9090
100/
90En
ergy
sour
ce(s
) for
cap
ture
(typ
e +o
nsite
or o
ffsite
) A
re a
ll en
ergy
-rel
ated
CO
2 em
issi
ons
incl
uded
?ye
sye
sye
sye
sye
sye
s
CO
2em
issi
on ra
te a
fter c
aptu
re
(kgC
O2 M
Wh−
1 )0.
090.
190.
090.
050.
100.
14
CO
2 cap
ture
d (M
t yr−1
)2.
795
1.01
31.
175
1.97
00.
969
0.39
90.
560
CO
2pro
duct
pre
ssur
e (M
Pa)
11.0
11.0
11.0
8.0
10.0
10.0
10.0
CO
2 red
uctio
n pe
r uni
t of p
rodu
ct
(%)
60.3
76.5
58.4
75.8
87.4
82.2
C
ostR
esul
tsC
ost y
ear b
asis
(con
stan
t dol
lars
)Fi
xed
char
ge fa
ctor
(%)
1515
1511
.011
.011
.011
.011
.011
.0R
ef. p
lant
cap
ital c
ost (
US$
per
uni
t ca
paci
ty)
Cap
ture
pla
nt c
apita
l cos
t (U
S$ p
er u
nit c
apac
ity)
Incr
emen
tal c
apita
l cos
t (m
illio
n U
S$ p
er k
g s−
1 CO
2)*3.
84.
14.
90.
33.
21.
92.
6
Ref
. pla
nt c
ost o
f pro
duct
(uS$
/uni
t) C
aptu
re p
lant
cos
t of p
rodu
ct
(uS$
/uni
t) 10
.255
.16.
16.
854
.248
.2
incr
emen
tal c
ost o
f pro
duct
(uS$
/un
it)10
.255
.16.
16.
854
.248
.2
% in
crea
se in
cap
ital c
ost (
over
ref.
plan
t)%
incr
ease
in u
nit c
ost o
f pro
duct
(ove
r re
f. pl
ant)
Cos
t of C
O2 c
aptu
red
(US$
/tCO
2)50
6055
.390
.936
.438
.259
.060
.5C
ost o
f CO
2 avo
ided
(US$
/tCO
2)35
7411
610
3423
5378
.188
.248
.141
.076
.071
.8Capturecostconfidencelevel
(see
Tab
le 3
.6)
mod
erat
elo
w
Not
es: A
ll co
sts i
n th
is ta
ble
are
for c
aptu
re o
nly
and
do n
ot in
clud
e th
e co
sts o
f CO
2 tra
nspo
rt an
d st
orag
e; se
e C
hapt
er 8
for t
otal
CC
S co
sts.
*Cap
ital c
osts
are
incr
emen
tal c
osts
of c
aptu
re, e
xclu
ding
cos
t of m
ake-
up st
eam
and
pow
er
gene
ratio
n an
d al
so e
xclu
ding
inte
rest
dur
ing
cons
truct
ion
and
othe
r ow
ner’s
cos
ts.
Chapter 3: Capture of CO2 163
plants. CO2 could be captured at steam-generating plants or power plants that use other biomass byproducts and/or purpose-grown biomass. At present most biomass plants are relatively small. The cost of capturing 0.19 MtCO2 yr-1 in a 24 MW biomass-powered IGCC plant, compared to a biomass IGCC plant without capture, is estimated to be about 70 US$/tCO2 (Audus and Freund, 2005). Larger plants using purpose-grown biomass may be built in the future and biomass can be co-firedwithfossil fuels to give economies of scale, as discussed in Chapter 2. Biomass fuels produce similar or slightly greater quantities of CO2 per unit of fuel energy as bituminous coals; thus, the CO2concentrationoffluegasesfromthesefuelswillbebroadlysimilar. This implies that the cost of capturing CO2 at large power plants using biomass may be broadly similar to the cost of capturing CO2 in large fossil fuel power plants in cases where plantsize,efficiency,loadfactorandotherkeyparametersaresimilar. The costs of avoiding CO2 emissions in power plants that use biomass are discussed in more detail in Chapter 8.
3.7.9 OutlookforfutureCO2capturecosts
The following sections focus on ‘advanced’ technologies that are not yet commercial available, but which promise to lower CO2 capture costs based on preliminary data and design studies. Earlier sections of Chapter 3 discussed some of the efforts underway worldwide to develop lower-cost options for CO2 capture. Some of these developments are based on new process concepts, while others represent improvements to current commercial processes. Indeed, the history of technology innovation indicates that incremental technological change, sustained over many years (often decades), is often the most successful path to substantial long-term improvements in performance and reductions in cost of a technology (Alic et al., 2003).Such trends are commonly represented andquantifiedin the form of a ‘learning curve’ or ‘experience curve’ showing cost reductions as a function of the cumulative adoption of a particular technology (McDonald and Schrattenholzer, 2001). One recent study relevant to CO2 capture systems found that over the past 25 years, capital costs for sulphur dioxide (SO2) and nitrogen oxides (NOx) capture systems at US coal-firedpower plants have decreased by an average of 12% for each doubling of installed worldwide capacity (a surrogate for cumulative experience, including investments in R&D) (Rubin et al., 2004a). These capture technologies bear a number of similarities to current systems for CO2 capture. Another recent study (IEA, 2004) suggests a 20% cost reduction for a doubling of the unit capacity of engineered processes due to technological learning. For CCS systems the importance of costs related to energy requirements is emphasized, since reductions in such costsarerequiredtosignificantlyreducetheoverallcostofCO2 capture. At the same time, a large body of literature on technology innovation also teaches us that learning rates are highly
uncertain,11 and that cost estimates for technologies at the early stages of development are often unreliable and overly optimistic (Merrow et al., 1981). Qualitative descriptions of cost trends for advanced technologies and energy systems typically show costs increasing from the research stage through full-scale demonstration; only after one or more full-scale commercial plants are deployed do costs begin to decline for subsequent units (EPRI, 1993; NRC, 2003). Case studies of the SO2 and NOx capture systems noted above showed similar behaviour, with large (factor of two or more) increases in the cost of early full-scale FGD and SCR installations before costs subsequently declined (Rubin et al., 2004b). Thus, cost estimates for CO2 capture systems should be viewed in the context of their current stage of development. Here we try to provide a perspective on potential future costs that combines qualitative judgments with the quantitative cost estimates offered by technology developers and analysts. The sections below revisit the areas of power generation and other industrial processes to highlight some of the major prospects for CO2 capture cost reductions.
Thissectionfirstexaminesoxy-fuelcombustion,whichavoidsthe need for CO2 capture by producing a concentrated CO2 stream for delivery to a transport and storage system. Following this we examine potential advances in post-combustion and pre-combustion capture.
3.7.10.1 Oxy-fuel combustion systems Itisfirstimportanttodistinguishbetweentwotypesofoxy-fuelsystems:anoxy-fuelboiler(eitheraretrofitornewdesign)andoxy-fuel combustion-based gas turbine cycles. The former are close to demonstration at a commercial scale, while the latter (such as chemical looping combustion systems and novel power cycles using CO2/waterasworkingfluid)arestillatthedesignstage. Table 3.13 summarizes the key assumptions and cost results of several recent studies of CO2 capture costs for oxy-fuelcombustionsystemsappliedtoneworexistingcoal-firedunits. As discussed earlier in Section 3.4, oxygen combustion produces a flue gas stream consisting primarily of CO2 and water vapour, along with smaller amounts of SO2, nitrogen and other trace impurities. These designs eliminate the capital and operating costs of a post-combustion CO2 capture system, but new costs are incurred for the oxygen plant and other system designmodifications.Becauseoxy-fuelcombustionisstillunderdevelopment and has not yet been utilized or demonstrated for large-scale power generation, the design basis and cost estimates for such systems remain highly variable and uncertain. This is reflectedinthewiderangeofoxy-fuelcostestimatesinTable3.13. Note, however, that cost estimates for advanced design
11 In their study of 42 energy-related technologies, McDonald and Schrattenholzer (2001) found learning rates varying from -14% to 34%, with a median value of 16%. These rates represent the average reduction in cost for each doubling of installed capacity. A negative learning rate indicates that costs increased rather than decreased over the period studied.
164 IPCC Special Report on Carbon dioxide Capture and Storageta
ble
3.13
Cap
ture
cos
ts: A
dvan
ced
tech
nolo
gies
for e
lect
ric p
ower
pla
nts.
(con
tinue
d on
nex
t pag
e)
Stud
y A
ssum
ptio
ns a
nd R
esul
ts
Ox
y-Fu
EL C
Om
BuSt
iON
AD
vAN
CED
PC
Alst
om
eta
l.Si
ngh
et
al.
Stob
bs
&C
lark
Dill
on
eta
l.N
saka
la
eta
l.N
saka
la
eta
l.N
saka
la
eta
l.G
ibbi
ns
eta
l.G
ibbi
ns
eta
l.20
0120
0320
0520
0520
0320
0320
0320
0520
05
Ref
eren
ceP
lant
(with
outc
aptu
re)
**
**
Pow
er p
lant
type
R
ETR
OFI
T
subc
rit P
CR
ETR
OFI
T
PC +
aux
N
GC
C
RET
RO
FIT
PC
New
PC
Air-firedCFB
Air-firedCFB
Air-firedCFB
Dou
ble
rehe
at
supe
rcrit
PC
Dou
ble
rehe
at su
perc
rit
PC
Fuel
type
(bit,
sub-
bit,
lig; N
G, o
ther
) and
%S
bit,
2.7%
S su
b-bi
tlig
nite
bit
bit,
2.3%
Sbi
t, 2.
3%S
bit,
2.3%
SR
efer
ence
pla
nt n
et si
ze (M
W)
434
400
300
677
193
193
193
Plan
t cap
acity
fact
or (%
)67
9185
8080
8085
85Netplantefficiency,LHV(%
)44
.237
.037
.037
.045
.645
.6Fu
el c
ost,
LHV
(US$
GJ−
1 )1.
301.
501.
231.
231.
231.
501.
50R
efer
ence
pla
nt e
mis
sion
rate
(tC
O2 M
Wh−
1 )0.
908
0.92
50.
883
0.72
20.
909
0.90
90.
909
C
aptu
reP
lant
Des
ign
CO
2 ca
ptur
e te
chno
logy
oxy-
fuel
oxy-
fuel
oxy-
fuel
oxy-
fuel
oxy-
fuel
oxy-
fuel
with
C
MB
chem
ical
loop
ing
with
CM
BM
EAK
S-1
Net
pla
nt si
ze w
ith c
aptu
re (M
W)
273
400
532
135
197
165
Netplantefficiency,LHV(%
)23
.435
.425
.831
.332
.234
.336
.5C
O2capturesy
stem
efficiency(%
)ab
out 9
1C
O2 e
mis
sion
rate
afte
r cap
ture
(t M
Wh−
1 )0.
238
0.14
50.
085
0.08
60.
073
0.00
5C
O2 c
aptu
red
(Mt y
r−1)
2.66
4
CO
2 pro
duct
pre
ssur
e (M
Pa)
13.9
1513
.711
11.0
11.0
CC
S en
ergy
requ
irem
ent (
% m
ore
inpu
t MW
h−1 )
2543
1815
3325
CO
2 red
uctio
n pe
r kW
h (%
)74
88.2
90.5
92.0
99.5
C
ostR
esul
ts**
**C
ost y
ear b
asis
(con
stan
t dol
lars
)20
0120
0020
0320
0320
03Fi
xed
char
ge fa
ctor
(%)
13.0
9.4
1111
.011
.0R
efer
ence
pla
nt T
CR
(US$
kW
−1)
012
6015
0015
0015
0010
2210
22C
aptu
re p
lant
TC
R (U
S$ k
W−1
) 15
2790
945
7018
5728
5327
3119
1217
8416
78In
crem
enta
l TC
R fo
r cap
ture
(US$
kW
−1)
1198
909
597
1354
1232
413
762
656
Ref
eren
ce p
lant
CO
E (u
S$ m
Wh−
1 ) 44
.544
45.3
45.3
45.3
3737
Cap
ture
pla
nt C
OE
(uS$
mW
h−1 )
97.5
61.2
82.5
70.5
58.4
6157
Incr
emen
tal C
OE
for c
aptu
re (U
S$ M
Wh−
1 )44
.523
.953
17.2
37.2
25.2
13.1
2420
% in
crea
se in
cap
ital c
ost (
over
ref.
plan
t)47
9082
2875
64%
incr
ease
in C
OE
(ove
r ref
. pla
nt)
119
3982
5629
6554
Cos
t of C
O2 c
aptu
red
(US$
/tCO
2 )29
Cos
t of C
O2 a
void
ed (U
S$/tC
O2 )
5435
7227
4530
14Capturecostconfidencelevel(seeTable3.6)
low
very
low
very
low
low
to m
oder
ate
Not
es: A
ll co
sts i
n th
is ta
ble
are
for c
aptu
re o
nly
and
do n
ot in
clud
e th
e co
sts o
f CO
2 tra
nspo
rt an
d st
orag
e; se
e C
hapt
er 8
for t
otal
CC
S co
sts.
* R
epor
ted
HH
V v
alue
s con
verte
d to
LH
V a
ssum
ing
LHV
/HH
V =
0.
96 fo
r coa
l. **
Rep
orte
d va
lue
incr
ease
d by
15%
to e
stim
ate
inte
rest
dur
ing
cons
truct
ion
and
othe
r ow
ners
’ cos
ts.
Chapter 3: Capture of CO2 165
tabl
e 3.
13 C
ontin
ued.
Stud
y A
ssum
ptio
ns a
nd R
esul
ts
AD
vAN
CED
NG
CC
AD
vAN
CED
iGC
CA
DvA
NC
ED H
yBR
iDS
Sim
beck
Pars
ons
Pars
ons
CC
PC
CP
CC
PC
CP
Dill
on
eta
l.Pa
rson
sN
EtL
NEt
LC
CP
CC
PN
EtL
Pars
ons
2002
2002
b20
02b
2005
2005
2005
2005
2005
2002
b20
0220
0220
0520
0520
0220
02b
Refe
renc
ePl
ant(
with
outc
aptu
re)
**
**
Pow
er p
lant
type
co
mb.
cycl
e
H-c
lass
tu
rbin
e
com
b.cy
cle
H
-cla
ss
turb
ine
com
b.cy
cle
H
-cla
ss
turb
ine
NG
CC
E-ga
s, O
2, w
ater
sc
rubb
er;
H-c
lass
tu
rbin
e
E-ga
s, O
2, C
GC
U,
Hyd
raul
ic a
ir co
mpr
essi
on
E-ga
s, O
2, C
GC
U,
Hyd
raul
ic a
ir co
mpr
essi
on w
ith
open
loop
wat
er
syst
em
Can
ada
coke
gasification
Can
ada
coke
gasification
E-ga
s, O
2, H
GC
U, “
G”
GT,
SO
FC
CH
AT
SOFC
Fuel
type
(bit,
sub-
bit,
lig; N
G, o
ther
) an
d %
SN
at. g
asN
at. g
asN
at. g
asN
GN
GN
GN
GN
GIll
inoi
s #6
Illin
ois #
6Ill
inoi
s #6
Cok
eC
oke
Illin
ois #
6N
at. g
as
Ref
eren
ce p
lant
net
size
(MW
)48
038
438
439
239
239
250
738
842
532
640
858
858
864
455
7Pl
ant c
apac
ity fa
ctor
(%)
8065
8095
9595
9585
8085
8591
.391
.385
80Netplantefficiency,LHV(%
)60
.059
.559
.557
.6%
57.6
%57
.6%
57.6
%56
.041
.143
.854
.956
.466
.2Fu
el c
ost,
LHV
(US$
GJ−
1 )4.
862.
822.
822.
962.
962.
962.
963.
001.
231.
031.
032.
962.
961.
032.
82R
efer
ence
pla
nt e
mis
sion
rate
(tC
O2 M
Wh−
1 )0.
342
0.33
80.
338
0.37
0.37
0.37
0.37
0.37
10.
720
0.71
20.
568
0.95
0.95
0.57
20.
302
C
aptu
reP
lant
Des
ign
CO
2 cap
ture
tech
nolo
gyM
EAM
EAM
EAM
EA lo
w-
cost
/ CC
GT-
inte
grat
ed
(pos
t-com
b.)
Mem
bran
e C
onta
ctor
; K
S-1
(pos
t-co
mb.
)
Hyd
roge
n M
embr
ane
Ref
orm
er
(pre
-com
b.)
Sorp
tion
Enha
nced
Wat
er
Gas
Shi
ft- A
ir AT
R (p
re-c
omb.
)
Oxy
-fu
elSe
lexo
lSe
lexo
lIG
CC
with
ca
ptur
e (p
re-
com
b.)
IGC
C w
ith
adva
nced
ca
ptur
e (p
re-
com
b.)
Sele
xol
Net
pla
nt si
ze w
ith c
aptu
re (M
W)
413
311
311
345
335
361
424
440
387
312
404
699
734
755
517
Netplantefficiency,LHV(%
)51
.748
.148
.150
.649
.253
.048
.244
.733
.835
.245
.449
.746
.1C
O2capturesy
stem
efficiency(%
)85
9090
8686
100
9091
.592
.792
.790
86.8
CO
2 em
issi
on ra
te a
fter c
aptu
re
(t/M
Wh)
0.06
0.04
20.
042
0.06
0.06
0.00
0.04
0.01
10.
074
0.06
50.
050
0.27
0.28
0.04
60.
043
CO
2captured(M
tyr−1)
0.98
00.
669
0.82
31.
091.
091.
271.
472.
074
1.98
41.
984
6.80
6.44
3.39
0C
O2 p
rodu
ct p
ress
ure
(MPa
)13
.78.
38.
311
8.3
14.5
14.5
14.5
8.3
CC
S en
ergy
requ
irem
ent(%
mor
e inputM
Wh−1)
1624
2425
2224
2113
44
CO
2 red
uctio
n pe
r kW
h (%
)82
8888
84.1
83.6
100
87.9
97.0
9091
9171
.271
.192
86
Cos
tRes
ults
Cos
t yea
r bas
is (c
onst
ant d
olla
rs)
2001
2000
2000
2000
2002
2002
2002
2000
Fixe
d ch
arge
fact
or (%
)15
.011
.011
.011
.011
.011
15.0
14.8
14.8
11.0
11.0
14.8
Ref
eren
ce p
lant
TC
R (U
S$ k
W−1
) 58
253
949
672
472
472
472
455
912
4914
3688
1.4
1398
1398
1508
623
Cap
ture
pla
nt T
CR
(US$
kW
−1)
1216
1026
943
1002
1225
1058
1089
1034
1698
2189
1450
1919
1823
1822
Incr
emen
tal T
CR
for c
aptu
re
(US$
kW
−1)
634
487
447
278
501
334
365
475
449
753
568
521
425
314
Ref
eren
ce p
lant
CO
E (u
S$ m
Wh−
1 ) 42
.933
.530
.734
.234
.234
.234
.233
.541
.047
.028
.532
.332
.341
.1C
aptu
re p
lant
CO
E (u
S$ m
Wh−
1 ) 65
.954
.148
.845
.148
.943
.245
.450
.353
.665
.541
.842
.140
.548
.8In
crem
enta
l CO
E fo
r cap
ture
(U
S$ M
Wh−
1 )23
20.6
18.1
10.9
14.7
9.0
11.2
16.8
12.6
18.5
13.3
9.8
8.2
7.7
% in
crea
se in
cap
ital c
ost (
over
ref.
plan
t)10
990
9038
6946
5085
3652
6437
3021
% in
crea
se in
CO
E
(ove
r ref
. pla
nt)
5461
5932
4326
3350
3139
4730
2519
Cos
t of C
O2 ca
ptur
ed (U
S$/tC
O2)
4830
.239
.522
.528
.216
2220
1110
13C
ost o
f CO
2 avo
ided
(US$
/tCO
2)82
7061
35.1
47.5
24.4
34.4
4719
2926
1412
15Capturecostconfidencelevel(see
Tabl
e 3.
6)lo
w to
mod
erat
elo
w to
ver
y lo
wlo
wve
ry lo
w
Not
es: A
ll co
sts i
n th
is ta
ble
are
for c
aptu
re o
nly
and
do n
ot in
clud
e th
e co
sts o
f CO
2 tra
nspo
rt an
d st
orag
e; se
e C
hapt
er 8
for t
otal
CC
S co
sts.
* R
epor
ted
HH
V v
alue
s con
verte
d to
LH
V a
ssum
ing
LHV
/HH
V =
0.9
6 fo
r coa
l and
LH
V/H
HV
=
0.90
for n
atur
al g
as. *
*Rep
orte
d va
lue
incr
ease
d by
15%
to e
stim
ate
inte
rest
dur
ing
cons
truct
ion
and
othe
r ow
ners
’ cos
ts.
166 IPCC Special Report on Carbon dioxide Capture and Storage
concepts based on oxy-fuel combustion gas turbine cycles are more uncertain at this time than cost estimates for new or retrofittedboilersemployingoxy-fuelcombustion. For new plant applications, the data in Table 3.13 indicate that oxy-fuel combustion adds about 30-90% to the capital cost and 30-150% to the COE of a conventional plant, while reducing CO2 emissions per kWh by 75-100%. Retrofit applicationsexhibit higher relative costs in cases where the existing plant is wholly or partially amortized. The lowest-cost oxy-fuel system in Table 3.13 is one that employs chemical looping to achieve nearly a 100% reduction in CO2 emissions. While this concept thus appears promising (see Section 3.4.6), it has yet to be tested andverifiedatameaningfulscale.Thuscostestimatesbasedonconceptual designs remain highly uncertain at this time. To judge the potential cost savings of oxy-fuels relative to current CO2 capture systems, it is useful to compare the costs of alternative technologies evaluated within a particular study based on a particular set of premises. In this regard, the COE fortheoxy-fuelretrofitsystemreportedbyAlstomet al. (2001) in Table 3.13 is 20% lower than the cost of an amine system retrofit(Table3.13)forthesame255MWplant,whilethecostof CO2 avoided is 26% lower. In contrast, a recent study by the Canadian Clean Power Coalition (Stobbs and Clark, 2005) reports that the COE for an oxy-fuel system at a large lignite-firedplant(Table3.13) is36%higher thanforanamineCO2 capture system, while the cost of CO2 avoided is more than twice as great. The major source of that cost difference was a specificationintheCCPCstudythattheoxy-fuelledunitalsobe capable of full air firing. This resulted in a much higher capital cost than for a new unit designed solely for oxy-fuel operation. A more recent study sponsored by IEA GHG (Dillon et al., 2005) found that a large new supercritical coal-firedboiler with oxy-fuel combustion had a COE slightly (2-3%) lower than a state-of-the-art coal plant with post-combustion analyzed in a separate study employing similar assumptions (IEA GHG, 2004). Further cost reductions could be achieved with the successful development of new lower-cost oxygen production technology (see Section 3.4.5). At the current time, the optimum designs of oxy-fuel combustion systems are not yet well established and costs of proposed commercial designs remain uncertain. This is especially true for advanced design concepts that employ components which are not yet available or still in the development stage, such as CO2 gas turbines or high temperature ceramic membranes for oxygen production.
3.7.10.2 Advanced systems with post-combustion captureImprovements to current amine-based systems for post-combustion CO2 capture are being pursued by a number of process developers (Mimura et al., 2003; Muramatsu and Iijima, 2003; Reddy et al., 2003) and may offer the nearest-term potential for cost reductions over the systems currently in use. The newest systems summarized earlier in Table 3.7 reportedly reduce the cost of CO2 avoided by approximately 20-30% (IEA GHG, 2004). Table 3.13 indicates that additional advances in plant heat integration could further reduce the COE of capture plants by about 5%. These results are consistent with
a recent study by Rao et al. (2003), who used expert elicitations and a plant simulation model to quantify the improvements likely achievable by 2015 for four key process parameters: sorbent concentration, regeneration energy requirements, sorbent loss and sorbent cost. The ‘most likely’ improvement was an 18% reduction in COE, while the ‘optimistic’ estimates yielded a 36% cost reduction from improvements in just these four parameters. The cost of CO2 avoided was reduced by similar amounts.Advances inmore efficient heat integration(for sorbent regeneration) and higher power plant efficiencycould lead to even greater reductions in CO2 capture cost. Advancesingasturbinetechnologyproducesimilarbenefitsfor NGCC systems. Table 3.13 shows several cases based on the H-turbine design. Relative to the cases in Table 3.9, these systems offer higher efficiency and greater CO2 reductions per kWh. The higher COEs for the advanced NGCC systems reflects thehighernatural gasprices assumed inmore recentstudies. Table 3.13 indicates that other advanced technologies for post-combustion applications, such as membrane separation systems, may also lower the future cost of CO2 capture (see Section 3.3.3). Reliable cost estimates for such technologies should await their further development and demonstration.
3.7.10.3 Advanced systems with pre-combustion captureThecostofgasification-basedsystemswithCO2 capture also can be expected to fall as a result of continued improvements ingasturbinetechnology,gasifierdesigns,oxygenproductionsystems, carbon capture technology, energy management and optimization of the overall facility. One recent study (IEA GHG, 2003) estimates a 20% reduction in the cost of electricity generation from a coal-based IGCC plant with CO2 capture by 2020. This takes into account improvements in gasification,oxygen production, physical solvent scrubbing and combined cycle processes, but does not take into account any possible radical innovations in CO2 separation technology. The additional IGCC cases shown in Table 3.13, including recent results of the CO2 Capture Project (CCP, 2005), foresee similar reductions in the COE of advanced IGCC systems compared to the systems in Table 3.10.
Table 3.14 shows results of several recent studies that have projected the performance and cost of new or improved ways of producing hydrogen and electricity from fossil fuels. Compared to the current commercial plants in Table 3.11, the advanced single-product systems with CO2 capture have hydrogen cost reductions of 16% (for natural gas feedstock) to 26% (for coal feedstock). Additional cases in Table 3.14 show multi-product systems producing hydrogen and electricity. These cases indicate the potential for substantial reductions in the future cost of hydrogen production with CO2 capture. As before, the results are sensitive to the assumed selling price of co-product electricity. More importantly, these cases assume
Chapter 3: Capture of CO2 167
tabl
e 3.
14 C
O2 c
aptu
re c
osts
: Mul
ti-pr
oduc
t pla
nts u
sing
adv
ance
d te
chno
logy
.
Stud
y A
ssum
ptio
ns a
nd R
esul
tsSi
mbe
ckN
RC
NR
CPa
rson
sm
itret
ekm
itret
ekm
itret
ekR
ange
2005
2004
2004
2002
a20
0320
0320
03m
inm
ax
Capt
ure
Plan
tDes
ign
**
**
*
Plan
t pro
duct
s (pr
imar
y/se
cond
ary)
H2
H2
H2
H2+
elec
trici
tyH
2+el
ectri
city
H2+
elec
trici
tyH
2+el
ectri
city
Prod
uctio
n pr
oces
s or t
ype
Aut
othe
rmal
re
form
ing
with
O
2 pr
ovid
ed b
y IT
M
78%efficient
ATR
/SM
R,
adv
CO
2 co
mpr
esso
r
GasifierLHV=
75--
>80%
, Adv
A
SU, m
embr
ane
sep,
adv
CO
2 co
mpr
esso
r
Hig
h-pr
essu
re
E-ga
s, H
GC
U,
HTM
R, H
2SO
4 co
-pro
duct
Adv
ance
d
E-ga
s, H
GC
U,
HTM
R
Adv
ance
d E-
gas,
HG
CU
, HTM
R,
larg
e el
ec. c
o-pr
oduc
t
Adv
ance
d E-
gas,
HG
CU
, HTM
R,
SOFC
, lar
ge e
lec.
co
-pro
duct
Feed
stoc
kN
atur
al g
asN
atur
al g
asC
oal
Pgh
#8
Coa
l C
oal
Coa
l C
oal
Feed
stoc
k co
st, L
HV
(US$
GJ−
1)5.
264.
731.
200.
891.
031.
031.
031
5
Plan
t cap
acity
fact
or (%
)90
9090
8085
8585
8090
CO
2 cap
ture
/sep
arat
ion
tech
nolo
gyO
xy-f
uel
Oxy
-fue
lO
xy-f
uel
Oxy
-fue
lO
xy-f
uel
Cap
ture
pla
nt in
put c
apac
ity, L
HV
(GJ h
−1)
9527
7697
8121
2794
3020
6051
6051
2794
9527
Cap
ture
pla
nt o
utpu
t cap
acity
, LH
V: F
uels
(GJ h
−1)
7504
6004
6004
1956
1904
1844
1808
1808
7504
Elec
trici
ty (M
W)
−13
−66
−88
725
416
519
-88
519
Netplantefficiency,LHV(%
)78
.374
.970
.070
.966
.055
.260
.755
78
CO
2 captureefficiency(%
)**
9590
9094
100
100
9590
100
CO
2 em
itted
(MtC
O2 y
r−1)*
**0.
086
0.50
50.
873
0.11
70.
000
0.00
00.
191
0.00
00.
873
Car
bon
expo
rted
in fu
els (
MtC
yr−1
)0
00
00
00
00
Tota
l car
bon
rele
ased
(kgC
O2 G
J−1 p
rodu
cts)
1.46
11.1
019
.45
8.45
0.00
0.00
6.96
0.0
19.5
CO
2 ca
ptur
ed (M
tCO
2 yr−1
)4.
074
3.11
95.
853
1.85
51.
918
3.84
63.
652
1.9
5.9
CO
2 pro
duct
pre
ssur
e (M
Pa)
13.7
13.7
13.7
13.4
2020
2013
.420
.0
Cost
Resu
lts
Cos
t yea
r bas
is (c
onst
ant d
olla
rs)
2003
2000
2000
2000
2000
2000
2000
Fixe
d ch
arge
rate
(%)
2016
1614
.312
.712
.712
.712
.720
.0
Cap
ture
pla
nt T
CR
(mill
ion
US$
)***
*72
544
192
139
844
195
010
2339
810
23
Cap
ture
pla
nt e
lect
ricity
pric
e (U
S$ M
Wh−
1 )50
.045
.045
.030
.853
.653
.653
.631
54
Cap
ture
pla
nt fu
el p
rodu
ct c
ost,
LHv
(uS$
GJ−
1 )9.
848.
536.
395.
796.
243.
271.
131.
139.
84
Capturecostconfidencelevel(seeTable3.6)
low
low
low
low
to v
ery
low
very
low
Not
es: A
ll co
sts i
n th
is ta
ble
are
for c
aptu
re o
nly
and
do n
ot in
clud
e th
e co
sts o
f CO
2 tra
nspo
rt an
d st
orag
e; se
e C
hapt
er 8
for t
otal
CC
S co
sts.
* R
epor
ted
HH
V v
alue
s con
verte
d to
LH
V a
ssum
ing
LHV
/H
HV
= 0
.96
for c
oal a
nd 0
.846
for h
ydro
gen.
**C
O2 captureefficiency=(CinCO
2 ca
ptur
ed)/(
C in
foss
il fu
el in
put t
o pl
ant -
C in
car
bona
ceou
s fue
l pro
duct
s of p
lant
) x10
0; C
ass
ocia
ted
with
impo
rted
elec
trici
ty is
not
incl
uded
. ***
Incl
udes
CO
2 em
itted
in th
e pr
oduc
tion
of e
lect
ricity
impo
rted
by th
e pl
ant.
****
Rep
orte
d to
tal p
lant
inve
stm
ent v
alue
s inc
reas
ed b
y 3.
5% to
est
imat
e to
tal c
apita
l req
uire
men
t.
168 IPCC Special Report on Carbon dioxide Capture and Storage
the successful scale-up and commercialization of technologies that have not yet been demonstrated, or which are still under development at relatively small scales, such as solid oxide fuel cells (SOFC). Published cost estimates for these systems thus have a very high degree of uncertainty.
As noted earlier, CO2 capture for industrial processes has not been widely studied. The most extensive analyses have focused on petroleum refineries, especially CO2 capture options for heaters and other combustion-based processes (see Table 3.12). The use of oxy-fuel combustion offers potential cost savings in several industrial applications. The CO2 Capture Project reports the cost of capturing CO2inrefineryheatersandboilers,withan ion transport membrane oxygen plant, to be 31 US$/tCO2 avoided. The cost of pre-combustion capture based on shift and membrane gas separation was predicted to be 41 US$/tCO2 avoided (CCP, 2005). It also may be possible to apply oxy-fuel combustion to cement plants, but the CO2 partial pressure in the cement kiln would be higher than normal and the effects of this on the calcination reactions and the quality of the cement product would need to be investigated. The quantity of oxygen required per tonne of CO2 captured in a cement plant would be only about half as much as in a power plant, because only about half of the CO2 is produced by fuel combustion. This implies that the cost of CO2 capture by oxy-fuel combustion at large cement plants would be lower than at power plants, but a detailed engineering cost study is lacking. Emerging technologies that capture CO2 using calcium-based sorbents, described in Section 3.3.3.4, may be cost competitive in cement plants in the future.
3.7.13 SummaryofCO2capturecostestimates
Table 3.15 summarizes the range of current CO2 capture costs for the major electric power systems analyzed in this report. These costs apply to case studies of large new plants employing current commercial technologies. For the PC and IGCC systems, the data in Table 3.15 apply only to plants using bituminous coals and the PC plants are for supercritical units only. The cost rangesforeachof the threesystemsreflectdifferences in thetechnical, economic and operating assumptions employed in different studies. While some differences in reported costs can be attributed to differences in the CO2 capture system design, the major sources of variability are differences in the assumed design,operationandfinancingofthereferenceplanttowhichthe capture technology is applied (i.e., factors such as plant size, location,efficiency,fueltype,fuelcost,capacityfactorandcostof capital). Because no single set of assumptions applies to all situations or all parts of the world, we display the ranges of cost represented by the studies in Tables 3.8, 3.10, 3.11 and 3.12. ForthepowerplantstudiesreflectedinTable3.15,currentCO2 capture systems reduce CO2 emissions per kilowatt-hour by approximately 85-90% relative to a similar plant without
capture. The cost of electricity production attributed to CO2 capture increases by 35-70% for a natural gas combined cycle plant, 40-85% for a new pulverized coal plant and 20-55% for an integratedgasificationcombinedcycleplant.Overall,theCOEfor fossil fuel plants with capture ranges from 43-86 US$ MWh-
1, as compared to 31-61 US$ MWh-1 for similar plants without capture. These costs include CO2 compression but not transport and storage costs. In most studies to date, NGCC systems typically have a lower COE than new PC and IGCC plants (with or without capture) for large base load plants with high capacity factors (75% or more) and gas prices below about 4 US$ GJ-1 over the life of the plant. However, for higher gas prices and/or lower capacity factors, NGCC plants typically have higher COEs than coal-based plants, with or without capture. Recent studies also found that IGCC plants were on average slightly more costly without capture and slightly less costly with capture than similarly sized PC plants. However, the difference in cost between PC and IGCC plants with or without CO2 capture can varysignificantlywithcoal typeandother localfactors,suchas the cost of capital. Since neither PC nor IGCC systems have yet been demonstrated with CO2 capture and storage for a large modern power plant (e.g., 500 MW), neither the absolute or relative costs of these systems (nor comparably sized NGCC systems with capture and storage) can be stated with a high degree ofconfidenceat this time,basedon thecriteriaofTable3.6. Table 3.15 also shows that the lowest CO2 capture costs with current technology (as low as 2 US$/tCO2 captured or avoided) were found for industrial processes such as coal-based hydrogen production plants that produce concentrated CO2 streams as part of the production process. Such industrial processes may represent some of the earliest opportunities for CCS. Figure 3.20 displays the normalized power plant cost and emissions data from Table 3.15 in graphical form. On this graph, the cost of CO2 avoided corresponds to the slope of a line connecting any two plants (or points) of interest. While Table 3.15 compares a given capture plant to a similar plant without capture, in some cases comparisons may be sought between a given capture plant and a different type of reference plant. Several cases are illustrated in Figure 3.20 based on either a PC or NGCC reference plant. In each case, the COE and CO2 emission rate are highly dependent upon technical, economic andfinancialfactorsrelatedtothedesignandoperationofthepower systems of interest at a particular location. The cost of CO2avoidedisespeciallysensitivetothesesite-specificfactorsand can vary by an order of magnitude or more when different types of plants are compared. Comparisons of different plant types, therefore, require a specific context and geographicallocation to be meaningful and should be based on the full COE including CO2 transport and storage costs. Later, Chapter 8 presents examples of full CCS costs for different plant types and storage options. In contrast to new plants, CO2 capture options and costs for existing power plants have not been extensively studied. Current studiesindicatethatthesecostsareextremelysite-specificandfallintotwocategories(seeTable3.8).Oneistheretrofittingofa post-combustion capture system to the existing unit.
Chapter 3: Capture of CO2 169
tabl
e 3.
15 S
umm
ary
of n
ew p
lant
per
form
ance
and
CO
2 cap
ture
cos
t bas
ed o
n cu
rren
t tec
hnol
ogy.
Perf
orm
ance
and
Cos
t mea
sure
sN
ew N
GC
C P
lant
New
PC
Pla
ntN
ew iG
CC
Pla
ntN
ew H
ydro
gen
Plan
t(u
nits
for
H2 P
lant
)R
ange
Rep.
Valu
eR
ange
Rep.
Valu
eR
ange
Rep.
Valu
eR
ange
Rep.
Valu
elo
whi
ghlo
whi
ghlo
whi
ghlo
whi
ghEm
issi
on ra
te w
ithou
t cap
ture
(k
gCO
2 MW
h−1 )
344
-37
936
773
6-
811
762
682
-84
677
378
-17
413
7kg
CO
2 GJ−
1 (w
ithou
t cap
ture
)
Emis
sion
rate
with
ca
ptur
e (k
gCO
2 MW
h−1 )
40-
6652
92-
145
112
65-
152
108
7-
2817
kgC
O2 G
J−1 (
with
cap
ture
)
Perc
ent C
O2 r
educ
tion
pe
r kW
h (%
)83
-88
8681
-88
8581
-91
8672
-96
86%
redu
ctio
n/un
it of
pro
duct
Plantefficiencywith
capt
ure,
LH
V b
asis
(% )
47-
5048
30-
3533
31-
4035
52-
6860
Captureplantefficiency(%
LHV)
Cap
ture
ene
rgy
requ
irem
ent
(% m
ore
inpu
t MW
h−1 )
11-
2216
24-
4031
14-
2519
4-
228
% m
ore
ener
gy in
put G
J−1 p
rodu
ct
Tota
l cap
ital r
equi
rem
ent w
ithou
t cap
ture
(U
S$ k
W−1
)51
5-
724
568
1161
-14
8612
8611
69-
1565
1326
(Nouniquenormalization
form
ulti-productplants)
Cap
ital r
equi
rem
ent w
ithou
t cap
ture
Tota
l cap
ital r
equi
rem
ent w
ith c
aptu
re
(US$
kW
−1)
909
-12
6199
818
94-
2578
2096
1414
-22
7018
25C
apita
l req
uire
men
t with
cap
ture
Perc
ent i
ncre
ase
in c
apita
l cos
t with
ca
ptur
e (%
)64
-10
076
44-
7463
19-
6637
-2-
5418
% in
crea
se in
cap
ital c
ost
CO
E w
ithou
t cap
ture
(US$
MW
h−1 )
31-
5037
43-
5246
41-
6147
6.5
-10
.07.
8H
2 cos
t with
out c
aptu
re (U
S$ G
J−1 )
CO
E w
ith c
aptu
re o
nly
(US$
MW
h−1)
43-
7254
62-
8673
54-
7962
7.5
-13
.39.
1H
2 co
st w
ith c
aptu
re (U
S$ G
J−1 )
Incr
ease
in C
OE
with
cap
ture
(US$
M
Wh−
1 )12
-24
1718
-34
279
-22
160.
3-
3.3
1.3
Incr
ease
in H
2 cos
t (U
S$ G
J−1 )
Perc
ent i
ncre
ase
in C
OE
with
cap
ture
(%)
37-
6946
42-
6657
20-
5533
5-
3315
% in
crea
se in
H2 c
ost
Cos
t of C
O2 ca
ptur
ed (U
S$/tC
O2)
33-
5744
23-
3529
11-
3220
2-
3912
US$
/tCO
2 ca
ptur
edC
ost o
f CO
2 av
oide
d (U
S$/tC
O2)
37-
7453
29-
5141
13-
3723
2-
5615
US$
/tCO
2 avo
ided
Capturecostconfidencelevel(seeTable
3.6)
mod
erat
em
oder
ate
mod
erat
em
oder
ate
to h
igh
ConfidenceLevel(seeTable3.6)
Not
es: S
ee S
ectio
n 3.
6.1
for c
alcu
latio
n of
ene
rgy
requ
irem
ent f
or c
aptu
re p
lant
s. Va
lues
in it
alic
s wer
e ad
just
ed fr
om o
rigin
al re
porte
d va
lues
as e
xpla
ined
bel
ow.(a
) Ran
ges a
nd re
pres
enta
tive
valu
es a
re
base
d on
dat
a fr
om T
able
s 3.8
, 3.1
1, 3
.11
and
3.12
. All
cost
s in
this
tabl
e ar
e fo
r cap
ture
onl
y an
d do
not
incl
ude
the
cost
s of C
O2 t
rans
port
and
stor
age;
see
Cha
pter
8 fo
r tot
al C
CS
cost
s. (b
) All
PC a
nd
IGC
C d
ata
are
for b
itum
inou
s coa
ls o
nly
at c
osts
of U
S$1.
0-1.
5 G
J−1 (
LHV
); al
l PC
pla
nts a
re su
perc
ritic
al u
nits
. (c)
NG
CC
dat
a ba
sed
on n
atur
al g
as p
rices
of U
S$2.
8-4.
4 G
J−1(L
HV
bas
is).
(d) C
ost a
re
in c
onst
ant U
S do
llars
(app
rox.
yea
r 200
2 ba
sis)
. (e)
Pow
er p
lant
size
s ran
ge fr
om a
ppro
xim
atel
y 40
0-80
0 M
W w
ithou
t cap
ture
and
300
-700
MW
with
cap
ture
. (f)
Cap
acity
fact
ors v
ary
from
65-
85%
for
coal
pla
nts a
nd 5
0-95
% fo
r gas
pla
nts (
aver
age
for e
ach
= 80
%).
(g) H
ydro
gen
plan
t fee
dsto
cks a
re n
atur
al g
as (U
S$ 4
.7-5
.3 G
J−1 )
or c
oal (
US$
0.9
-1.3
GJ−
1 ); so
me
plan
ts in
dat
a se
t pro
duce
ele
ctric
ity in
ad
ditio
n to
hyd
roge
n. (h
) Fix
ed c
harg
e fa
ctor
s var
y fr
om 1
1-16
% fo
r pow
er p
lant
s and
13-
20%
for h
ydro
gen
plan
ts. (
i) A
ll co
sts i
nclu
de C
O2 c
ompr
essi
on b
ut n
ot a
dditi
onal
CO
2 tra
nspo
rt an
d st
orag
e co
sts
(see
Cha
pter
8 fo
r ful
l CC
S co
sts)
.
170 IPCC Special Report on Carbon dioxide Capture and Storage
The other category combines CO2 capture with upgrading or repowering the existing plant to significantly improveits efficiency andnet power output (seeSections 3.7.4.2 and3.7.5.2). In general, the latter option appears to be more cost-effective. However, further site-specific studies are requiredto systematically assess the feasibility and cost of alternative repowering options in conjunction with CO2 capture for existing power plants. New or improved methods of CO2 capture, combined with advanced power systems and industrial process designs, promise tosignificantlyreduceCO2 capture costs and associated energy requirements. Tables 3.12 to 3.14 summarize the results from recent studies that examine future options. As discussed earlier, there is considerable uncertainty about the magnitude and timing of future cost reductions, as well as the potential for costs to rise above current estimates, especially for technologies still in the early stages of research and development. The current assessment is based on studies of the specific technologiesin Tables 3.12 to 3.14 (and the supporting discussions and literature cited in Sections 3.7.9 to 3.7.12), as well as analyses of historical cost trends for related energy and environmental
technologies. This assessment suggests that improvements to current commercial technologies can reduce CO2 capture costs by at least 20-30% over approximately the next decade, while new technologies under development promise more substantial cost reductions. Achieving future cost reductions, however, will require deployment and adoption of commercial technologies in the marketplace as well as sustained R&D.
3.8 Gaps in knowledge
Gaps in knowledge are related to differences in the stages of development of component technologies for the capture systems reviewed in Sections 3.2 to 3.5. For CO2 capture from industrial processes, a number of technologies that are commonly used in natural gas sweetening and ammonia production are already used on a commercial scale. For other types of industrial systems capturing CO2 from steel and cement production, further work is still needed. For CO2 capture that might be reliant on post-combustion capture or oxy-fuel combustion, options are less well developed, or are available at a smaller scale than those required for applications such as in power generation, where
Figure 3.20 Cost of electricity (excluding transport and storage costs) compared to CO2 emission rate for different reference and capture plants based on current technology. The shaded areas show the Table 3.15 ranges of CO2 emission rates and levelized cost of electricity (COE) for new PC, IGCC and NGCC plants with and without CO2 capture. All coal plant data are for bituminous coals only. PC plants are supercritical units only (see Tables 3.7, 3.9, 3.10 and 3.15 for additional assumptions). The cost of CO2 avoided corresponds to the slope of a line connecting a plant with capture and a reference plant without capture (i.e., the change in electricity cost divided by the change in emission rate). Avoidance costs for the same type of plant with and without capture plant are given in Table 3.15. When comparing different plant types, the reference plant represents the least-cost plant that would ‘normally’ be built at a particular location in the absence of a carbon constraint. In many regions today, this would be either a PC plant or an NGCC plant. The cost per tonne of CO2 avoided can be highly variable and depends strongly on the costs and emissions of new plants being considered in a particular situation. See Chapter 8 for the full COE and full cost of CO2 avoided for different plant types.
Chapter 3: Capture of CO2 171
muchlargergasflowsarehandled.Forpre-combustioncapturemany of the required systems have been developed and applied in industry already. Although many of the component and/or enabling technologies required for CO2 capture in post-combustion, pre-combustion and oxy-fuel combustion are well known, gaps in knowledge are in the practical and/or commercial demonstration of integrated systems. This demonstration is essential to prove the cost of CO2 capture and its use on a large scale, particularly in power generation applications, but also for cement, steel and other large industries. Operating experience is also needed to test system reliability, improved methods of system integration, methods to reduce the energy requirements for CO2 capture, improved process control strategies and the use of optimized functional materials for the implementation of capture processeswith advanced, higher efficiency powercycles. As such developments are realized, environmental issues associated with the capture of CO2 and other deleterious pollutants in these systems should also be re-assessed from a perspective involving the whole capture-transport-storage operation. In an ongoing search to implement existing, new or improved methods of CO2 capture, most capture systems also rely on the applicationofarangeofenablingtechnologiesthatinfluencetheattractiveness of a given system. These enabling technologies have their own critical gaps of knowledge. For example, improved processes for the effective removal of sulphur, nitrogen, chlorine, mercury and other pollutants are needed for the effective performance of unit operations for CO2 separation in post- and pre-combustion capture systems, especially when coalisusedastheprimaryfuel.Improvedgasificationreactorsfor coals and biomass, the availability of hydrogen-burning gas turbines and fuel cells for stationary power generation also need further development in the pre-combustion route. Combustors and boilers operating at higher temperatures, or a new class of CO2 turbines and compressors, are important requirements for oxy-fuel systems. With reference to the development of novel CO2 capture and/or other enabling technologies, a wide range of options are currently being investigated worldwide. However, many technical details of the specific processes proposed or underdevelopment for these emerging technologies are still not well understood. This makes the assessment of their performance and cost highly uncertain. This is where intense R&D is needed to develop and bring to pilot scale testing the most promising concepts for commercial application. Membranes for H2, CO2 or O2 separation, new sorbents, O2 or CO2 solid carriers and materials for advanced combustors, boilers and turbines all require extensive performance testing. Multi-pollutant emission controls in these novel systems and the impact of fuel impurities and temperature on the functional materials, should also be an area of future work.
References
Abanades, J.C., E.J. Anthony, D. Alvarez, D.Y. Lu, and C. Salvador, 2004a: Capture of CO2 from Combustion Gases in a Fluidised Bed of CaO. AIChE J, 50, No. 7, 1614-1622.
Abanades, J.C., E.S. Rubin and E.J. Anthony, 2004b: Sorbent cost and performance in CO2 capture systems. Industrial and Engineering Chemistry Research, 43, 3462-3466.
Abbot,J.,B.Crewdson,andK.Elhius,2002:Efficientcosteffectiveand environmentally friendly synthesis gas technology for gas to liquids production. IBC Gas to Liquids Conference, London.
Aboudheir, A., P. Tontiwachwuthikul, A. Chakma, and R. Idem, 2003: Kinetics of the reactive absorption of carbon dioxide in high CO2-loaded, concentrated aqueuous monoethanolamine solutions. Chemical Engineering Science 58, 5195-5210.
Alic, J.A., D.C. Mowery, and E.S. Rubin, 2003: U.S. Technology and Innovation Policies: Lessons for Climate Change. Pew Center on Global Climate Change, Arlington, VA, November.
Allam, R.J., E.P. Foster, V.E. Stein, 2002: Improving GasificationEconomics through ITM Oxygen Integration. Proceedings of the Fifth Institution of Chemical Engineers (UK) European GasificationConference,Noordwijk,TheNetherlands.
Alstom Power inc., ABB Lummus Global Inc., Alstom Power Environmental Systems and American Electric Power, 2001: Engineering feasibility and economics of CO2 capture on an existingcoal-firedpowerplant.Report no. PPL-01-CT-09 to Ohio Department of Development, Columbus, OH and US Department of Energy/NETL, Pittsburgh, PA.
American institute of Chemical Engineers, 1995: Centre for Chemical Process Safety. Guidelines for Technical Planning for On-site Emergencies Wiley, New York.
Anderson, R., H. Brandt, S. Doyle, K. Pronske, and F. Viteri, 2003: Power generation with 100% carbon capture and sequestration. Second Annual Conference on Carbon Sequestration, Alexandria, VA.
Apple, M. 1997: Ammonia. Methanol. Hydrogen. Carbon Monoxide. Modern Production Technologies. A Review. Published by Nitrogen - The Journal of the World Nitrogen and Methanol Industries. CRU Publishing Ltd.
Aresta, M.A. and A. Dibenedetto, 2003: New Amines for the reversible absorption of carbon dioxide from gas mixtures. Greenhouse Gas Control Technologies, Proceedings of the 6th International Conference on Greenhouse Gas Control Technologies (GHGT-6), 1-4 Oct. 2002, Kyoto, Japan, J. Gale and Y. Kaya (eds.), Elsevier Science Ltd, Oxford, UK. 1599-1602.
Armstrong, P.A., D.L. Bennett, E.P. Foster, and V.E. Stein, 2002: Ceramicmembranedevelopmentforoxygensupplytogasificationapplications. Proceedings of the Gasification TechnologiesConference, San Francisco, CA, USA.
Arnold, D.S., D.A. Barrett and R.H. Isom, 1982: CO2 can be produced fromfluegas.Oil & Gas Journal, November, 130-136.
Aroonwilas, A., A. Chakma, P. Tontiwachwuthikul, and A. Veawab, 2003: Mathematical Modeling of Mass-Transfer and Hydrodynamics in CO2 Absorbers Packed with Structured Packings, Chemical Engineering Science, 58, 4037-4053.
172 IPCC Special Report on Carbon dioxide Capture and Storage
Astarita, G., D.W. Savage, and A. Bisio, 1983: Gas Treating with Chemical Solvents, Chapter 9 Removal of Carbon Dioxide. Wiley, New York.
Audus, H. and P. Freund, 2005: Climate change mitigation by biomass gasificationcombinedwithCO2 capture and storage. Proceedings of 7th International Conference on Greenhouse Gas Control Technologies. E.S. Rubin, D.W. Keith, and C.F. Gilboy (eds.), Vol. 1: Peer-Reviewed Papers and Overviews, E.S. Rubin, D.W. Keith and C.F. Gilboy (eds.), Elsevier Science, Oxford, UK, 187-200.
Babcock Energy Ltd, Air Products Ltd, University of Naples and University of Ulster, 1995: Pulverised coal combustion system for CO2 capture. Final report 2.1.1, European Commission JOULE II Clean Coal Technology Programme - Powdered Coal Combustion Project.
Babovic, M., A. Gough, P. Leveson, and C. Ramshaw, 2001: Catalytic Plate Reactors for Endo- and Exothermic Reactions. 4th International Conference on Process Intensification for theChemical Industry, Brugge, Belgium, 10-12 September.
Bachu, S., and W. Gunter, 2005: Overview of Acid Gas Injection in Western Canada. In E.S.Rubin, D.W. Keith, and C.F. Gilboy (eds.), Proceedings of 7th International Conference on Greenhouse Gas Control Technologies. Volume I: Peer Reviewed Papers and Overviews, Elsevier Science, Oxford, UK, 443-448.
Bai, H., A.C. Yeh, 1997: Removal of CO2 Greenhouse Gas by Ammonia Scrubbing. Ind. Eng. Chem. Res, 36 (6), 2490-2493.
Bandi, A., M. Specht, P. Sichler, and N. Nicoloso, 2002: In situ Gas Conditioning in Fuel Reforming for Hydrogen Generation. 5th International Symposium on Gas Cleaning at High Temperature. U.S. DOE National Energy Technology Laboratory, Morgantown, USA.
Barchas, R., R. Davis, 1992: The Kerr-McGee / ABB Lummus Crest Technology for the Recovery of CO2 from Stack Gases. Energy Conversion and Management, 33(5-8), 333-340.
Beecy, D.J. and Kuuskraa, V.A., 2005: Basic Strategies for Linking CO2 enhanced oil recovery and storage of CO2 emissions. In E.S.Rubin, D.W. Keith and C.F. Gilboy (eds.), Proceedings of the 7th International Conference on Greenhouse Gas Control Technologies (GHGT-7), September 5-9, 2004, Vancouver, Canada. Volume I: Peer Reviewed Papers and Overviews, Elsevier Science, Oxford, UK, 351-360.
Blomen, L.J.N.J. and M.N. Mugerwa, 1993: Fuel Cell systems, Plenum Press, New York, 1993, ISBN 0-36-44158-6.
Bock, B., R. Rhudy, H. Herzog, M. Klett, J. Davison, D. De la Torre Ugarte, and D.Simbeck, 2003: Economic Evaluation of CO2 Storage and Sink Options, DOE Research Report DE-FC26-00NT40937, U.S. Department of Energy, Pittsburgh Energy Technology Center, Pittsburgh, PA.
Bouwmeester, H.J.M., L.M.Van Der Haar, 2002: Oxygen permeation through mixed-conducting perovskite oxide membranes. Ceramic Transactions, 127, Materials for Electrochemical Energy Conversion and Storage, 49-57.
BP, 2004: Statistical Review of World Energy. Http:\www.bp.com. Bracht, M, Alderliesten P.T., R. Kloster, R. Pruschek, G. Haupt, E.
Xue, J.R.H. Ross, M.K. Koukou, and N. Papayannakos, 1997: Water gas shift membrane reactor for CO2 control in IGCC systems: techno-economic feasibility study, Energy Conversion
and Management, 38 (Suppl.), S159-S164, 1997.Brandvoll, Ø. and O. Bolland, 2004: Inherent CO2 capture using
chemicalloopingcombustioninanaturalgasfiredpowercycle.ASME Paper No. GT-2002-30129, ASME Journal of Engineering for Gas Turbines and Power, 126, 316-321.
Bredesen, R., K. Jordal and O. Bolland, 2004: High-Temperature Membranes in Power Generation with CO2 capture. Journal of Chemical Engineering and Processing, 43, 1129-1158.
Breton, D.L. and P. Amick, 2002: Comparative IGCC Cost and Performance for Domestic Coals, Preceedings of the 2002 GasificationTechnologyConference,SanFrancisco,October.
Campanari, S., 2002: Carbon dioxide separation from high temperature fuel cell power plants. Journal of Power Sources, 112 (2002), 273-289.
Carolan, M.F., P.N. Dyer, E. Minford, T.F. Barton, D.R. Peterson, A.F. Sammells, D.L. Butt, R.A. Cutler, and D.M. Taylor, 2001: Development of the High Pressure ITM Syngas Process, Proceedings of the 6th Natural Gas Conversion Symposium, Alaska, 17-22 June.
Castle, W.F., 1991: Modern liquid pump oxygen plants: Equipment and performance, Cryogenic Processes and Machinery, AIChE Series No: 294; 89:14-17, 8th Intersociety Cryogenic Symposium, Houston, Texas, USA.
CCP, 2005: Economic and Cost Analysis for CO2 Capture Costs in the CO2 Capture Project, Scenarios. In D.C. Thomas (Ed.), Volume 1 - Capture and Separation of Carbon Dioxide from Combustion Sources, Elsevier Science, Oxford, UK.
Celik, F., E.D. Larson, and R.H. Williams, 2005: Transportation Fuel from Coal with Low CO2 Emissions, Wilson, M., T. Morris, J. Gale and K. Thambimuthu (eds.), Proceedings of 7th International Conference on Greenhouse Gas Control Technologies. Volume II: Papers, Posters and Panel Discussion, Elsevier Science, Oxford UK, 1053-1058.
Chakma, A., P. Tontiwachwuthikul, 1999: Designer Solvents for Energy Efficient CO2 Separation from Flue Gas Streams. Greenhouse Gas Control Technologies. Riemer, P., B. Eliasson, A. Wokaun (eds.), Elsevier Science, Ltd., United Kingdom, 35-42.
Chakma, A., 1995: An Energy Efficient Mixed Solvent for theSeparation of CO2. Energy Conversion and Management, 36(6-9), 427-430.
Chakravarty, S., A. Gupta, B. Hunek, 2001: Advanced technology for thecaptureofcarbondioxidefromfluegases,PresentedatFirstNational Conference on Carbon Sequestration, Washington, DC.
Chapel, D.G., C.L. Mariz, and J. Ernest, 1999: Recovery of CO2 fromfluegases:commercialtrends,paperNo.340attheAnnualMeeting of the Canadian Society of Chemical Engineering, Saskatoon, Canada, October.
Chatel-Pelage, F., M. Ovidiu, R. Carty, G. Philo, H. Farzan, S. Vecci, 2003: A pilot scale demonstration of oxy-fuel combustion with fluegasrecirculationinapulverisedcoal-firedboiler,Proceedings28th International Technical Conference on Coal Utilization & Fuel Systems, Clearwater, Florida, March 10-13.
Chen, C., A.B. Rao, and E.S. Rubin, 2003: Comparative assessment of
Chapter 3: Capture of CO2 173
CO2captureoptionsforexistingcoal-firedpowerplants,presentedat the Second National Conference on Carbon Sequestration, Alexandria, VA, USA, 5-8 May.
Chen, H., A.S. Kovvali, S. Majumdar, K.K. Sirkar, 1999: Selective CO2 separation from CO2-N2 mixtures by immobilised carbonate-glycerol membranes, Ind. Eng. Chem., 38, 3489-3498.
Chiesa, P., S. Consonni, T. Kreutz, and R. Williams, 2005: Co-production of hydrogen, electricity and CO2 from coal with commercially ready technology. Part A: Performance and emissions, International Journal of Hydrogen Energy, 30 (7): 747-767.
Cho, P., T. Mattisson, and A. Lyngfelt, 2002: Reactivity of iron oxide withmethane in a laboratory fluidised bed - applicationof chemical-looping combustion, 7th International Conference on Circulating Fluidised Beds, Niagara Falls, Ontario, May 5-7, 2002, 599-606.
Croiset, E. and K.V. Thambimuthu, 2000: Coal combustion in O2/CO2 Mixtures Compared to Air. Canadian Journal of Chemical Engineering, 78, 402-407.
Cullinane, J.T. and G. T. Rochelle, 2003: Carbon Dioxide Absorption with Aqueous Potassium Carbonate Promoted by Piperazine, Greenhouse Gas Control Technologies, Vol. II, J. Gale, Y. Kaya, Elsevier Science, Ltd., United Kingdom, 1603-1606.
Curran, G P., C.E. Fink, and E. Gorin, 1967: Carbon dioxide-acceptor gasificationprocess.Studiesofacceptorproperties.Adv. Chem. Ser., 69, 141-165.
Damle, A.S. and T.P. Dorchak, 2001: Recovery of Carbon Dioxide in Advanced Fossil Energy Conversion Processes Using a Membrane Reactor, First National Conference on Carbon Sequestration, Washington, DC.
Davison, J.E., 2005: CO2 capture and storage and the IEA Greenhouse Gas R&D Programme. Workshop on CO2 issues, Middelfart, Denmark, 24 May, IEA Greenhouse Gas R&D Programme, Cheltenham, UK.
Dijkstra, J.W. and D. Jansen, 2003: Novel Concepts for CO2 capture with SOFC, Proceedings of the 6th International Conference on Greenhouse Gas Control Technologies (GHGT-6) Volume I, Page 161-166, 1-4 Oct. 2002, Kyoto, Japan, Gale J. and Y. Kaya (eds.), Elsevier Science Ltd, Kidlington, Oxford, UK.
Dillon, D.J., R.S. Panesar, R.A.Wall, R.J. Allam, V. White, J. Gibbins, and M.R. Haines, 2005: Oxy-combustion processes for CO2 capture from advanced supercritical PF and NGCC power plant, In: Rubin, E.S., D.W. Keith, and C.F. Gilboy (eds.), Proceedings of 7th International Conference on Greenhouse Gas Control Technologies. Volume I: Peer Reviewed Papers and Overviews, Elsevier Science, Oxford, UK, 211-220.
Dongke, M.A., L. Kong, and W.K. Lu, 1988: Heat and mass balance of oxygen enriched and nitrogen free blast furnace operations with coal injection. I.C.S.T.I. Iron Making Conference Proceedings.
Duarte, P.E. and E. Reich, 1998: A reliable and economic route for coal based D.R.I. production. I.C.S.T.I Ironmaking Conference Proceedings 1998.
Dyer, P.N., C.M. Chen, K.F. Gerdes, C.M. Lowe, S.R. Akhave, D.R. Rowley, K.I. Åsen and E.H. Eriksen, 2001: An Integrated ITM Syngas/Fischer-Tropsch Process for GTL Conversion, 6th Natural Gas Conversion Symposium, Alaska, 17-22 June 2001.
Dyer, P.N., R.E. Richards, S.L. Russek, D.M. Taylor, 2000: Ion transport membrane technology for oxygen separation and syngas production, Solid State Ionics, 134 (2000) 21-33.
EPRi, 1993: Technical Assessment Guide, Volume 1: Electricity Supply-1993 (Revision 7), Electric Power Research Institute, Palo Alto, CA, June.
Erga, O., O. Juliussen, H. Lidal, 1995: Carbon dioxide recovery by means of aqueous amines, Energy Conversion and Management, 36(6-9), 387-392.
European Chemicals Bureau, 2003: Technical Guidance Document on Risk Assessment. European Communities. EUR 20418, http://ecb.jrc.it/.
Falk-Pedersen, O., H. Dannström, M. Grønvold, D.-B. Stuksrud, and O. Rønning, 1999: Gas Treatment Using Membrane Gas/Liquid Contractors, Greenhouse Gas Control Technologies. B. Eliasson, P. Riemer and A. Wokaun (eds.), Elsevier Science, Ltd., United Kingdom 115-120.
Farla, J.C., C.A. Hendriks, and K. Blok, 1995: Carbon dioxide recovery from industrial processes, Climate Change, 29, (1995), 439-61.
Feron, P.H.M and A.E. Jansen, 2002: CO2Separationwithpolyolefinmembrane contactors and dedicated absorption liquids: Performances and prospects, Separation and PurificationTechnology, 27(3), 231-242.
Feron, P.H.M., 1992: Carbon dioxide capture: The characterisation of gas separation/removal membrane systems applied to the treatmentoffluegasesarisingfrompowerplantgenerationusingfossiel fuel. IEA/92/08, IEA Greenhouse Gas R&D programme, Cheltenham, UK.
Feron, P.H.M., 1994: Membranes for carbon dioxide recovery from power plants. In Carbon Dioxide Chemistry: Environmental Issues. J. Paul, C.M. Pradier (eds.), The Royal Society of Chemistry, Cambridge, United Kingdom, 236-249.
Gibbins, J., R.I. Crane, D. Lambropoulos, C. Booth, C.A. Roberts, and M. Lord, 2005: Maximising the effectiveness of post-combustion CO2 capture systems. Proceedings of the 7th International Conference on Greenhouse Gas Control Technologies. Volume I: Peer Reviewed Papers and Overviews, E.S. Rubin, D.W. Keith, and C.F.Gilboy (eds.), Elsevier Science, Oxford, UK, 139-146.
Gielen, D.J., 2003: CO2 removal in the iron and steel industry, Energy Conversion and Management, 44 (7), 1027-1037.
Göttlicher, G., 1999: Energetik der Kohlendioxidrückhaltung in Kraftwerken, Fortschritt-Berichte VDI, Reihe 6: Energietechnik Nr. 421, VDI Düsseldorf, Dissertation Universität Essen 1999, ISBN 3-18-342106-2.
Gray, D. and G. Tomlinson, 2001: Coproduction of Ultra Clean Transportation Fuels, Hydrogen, and Electric Power from Coal, Mitretek Technical Report MTR 2001-43, prepared for the National Energy Technology Laboratory, US DOE, July.
Gray, D. and G. Tomlinson, 2003: Hydrogen from Coal. Mitretek Technical Paper MTR-2003-13, prepared for the National Energy Technology Laboratory, US DOE, April.
174 IPCC Special Report on Carbon dioxide Capture and Storage
USA.Griffin, T., S.G. Sundkvist, K. Aasen, and T. Bruun, 2003: Advanced
Zero Emissions Gas Turbine Power Plant, ASME Turbo Expo Conference, paper# GT-2003-38120, Atlanta, USA.
Haines, M.R., 1999: Producing Electrical Energy from Natural Gas using a Solid Oxide Fuel Cell. Patent WO 99/10945, 1-14.
Hazardous Substances Data Bank, 2002: US National Library of Medicine, Specialized Information Services: Hazardous Substances Data Bank. Carbon dioxide. 55 pp.
Hendriks,C.,1994:Carbondioxide removal fromcoal-firedpowerplants, Dissertation, Utrecht University, Netherlands, 259 pp.
Herzog, H.J., 1999: The economics of CO2 capture. Proceedings of the Fourth International Conference on Greenhouse Gas Control Technologies, B. Eliasson, P. Riemer, and A. Wokaun (eds.), 30 August-2 September 1998, Interlaken, Switzerland, Elsevier Science Ltd., Oxford, UK, 101-106.
Herzog, H., D. Golomb, S. Zemba, 1991: Feasibility, modeling and economics of sequestering power plant CO2 emissions in the deep ocean, Environmental Progress, 10(1), 64-74.
Hoffman, J.S., D.J. Fauth., and H.W. Pennline, 2002: Development of novel dry regenerable sorbents for CO2 capture. 19th Annual International Pittsburgh Coal Conference. September 23-27, 2002 Pittsburgh, Pennsylvania, USA.
Holt, N., G. Booras, and D. Todd, 2003: Summary of recent IGCC studies of CO2 for sequestration, Proceedings of GasificationTechnologies Conference, October 12-15, San Francisco.
Hufton, J.R., R.J. Allam, R. Chiang, R.P. Middleton, E.L. Weist, and V. White, 2005: Development of a Process for CO2 Capture from Gas Turbines using a Sorption Enhanced Water Gas Shift Reactor System. Proceedings of 7th International Conference on Greenhouse Gas Control Technologies. Volume I: Peer Reviewed Papers and Overviews, E.S. Rubin, D.W. Keith, and C.F. Gilboy (eds.), Elsevier Science, Oxford, UK, 2005, 253-262.
Hufton, J.R., S. Mayorga, S. Sircar, 1999: Sorption Enhanced Reaction Process for Hydrogen Production AIChE J, 45, 248-254.
iEA WEO, 2004: IEA World Energy Outlook 2004, International Energy Agency, Paris France.
iEA, 2004: Prospects for CO2 capture and storage, ISBN 92-64-10881-5.
iEA CCC, 2005: IEA CCC (IEA Clean Coal Centre) The World Coal-fired Power Plants Database, Gemini House, Putney, London,United Kingdom.
iEA GHG, 1996: De-carbonisation of fossil fuels, Report PH2/2, March 1996, IEA Greenhouse Gas R&D Programme, Cheltenham, UK.
iEA GHG, 1999: The reduction of greenhouse gas emissions from the cement industry. Report PH3/7, May 1999, IEA Greenhouse Gas R&D Programme, Cheltenham, UK.
iEA GHG, 2000a: Greenhouse gas emissions from major industrial sources III - Iron and Steel Production Report PH3/30, IEA Greenhouse Gas R&D Programme, Cheltenham, UK.
iEA GHG, 2000b: Leading options for the capture of CO2 emissions at power stations, report PH3/14, Feb. 2000, IEA Greenhouse Gas R&D Programme, Cheltenham, UK.
Cheltenham, UK.iEA GHG, 2000d: Key Components for CO2 abatement: Gas turbines,
report PH3/12 July 2000, IEA Greenhouse Gas R&D Programme, Cheltenham, UK.
iEA GHG, 2001: CO2 abatement by the use of carbon-rejection processes, report PH3/36, February 2001, IEA Greenhouse Gas R&D Programme, Cheltenham, UK.
iEA GHG, 2002a: Transmission of CO2 and Energy, report PH4/6, March 2002, IEA Greenhouse Gas R&D Programme, Cheltenham, UK.
iEA GHG, 2002b: Opportunities for early application of CO2 sequestration technologies, report PH4/10, Sept. 2002, IEA Greenhouse Gas R&D Programme, Cheltenham, UK.
iEA GHG,2003:Potentialforimprovementsingasificationcombinedcycle power generation with CO2 Capture, report PH4/19, IEA Greenhouse Gas R&D Programme, Cheltenham, UK.
iEA GHG, 2004: Improvements in power generation with post-combustion capture of CO2, report PH4/33, Nov. 2004, IEA Greenhouse Gas R&D Programme, Cheltenham, UK.
iEA GHG, 2005: Retrofit of CO2 capture to natural gas combined cycle power plants, report 2005/1, Jan. 2005, IEA Greenhouse Gas R&D Programme, Cheltenham, UK.
ishibashi, M., K. Otake, S. Kanamori, and A. Yasutake, 1999: Study on CO2 Removal Technology from Flue Gas of Thermal Power Plant by Physical Adsorption Method, Greenhouse Gas Control Technologies. P. Riemer, B. Eliasson, and A. Wokaun (eds.), Elsevier Science, Ltd., United Kingdom, 95-100.
ishida, M. and H. Jin, 1994: A New Advanced Power-Generation System Using Chemical-Looping Combustion, Energy, 19(4), 415-422.
Jansen, D. and J.W. Dijkstra, 2003: CO2 capture in SOFC-GT systems, Second Annual Conference on Carbon Sequestration, Alexandria, Virginia USA, May 5-7.
Jericha, H., E. Göttlich, W. Sanz, F. Heitmeir, 2003: Design optimisation of the Graz cycle power plant, ASME Turbo Expo Conference, paper GT-2003-38120, Atlanta, USA.
Jordal, K., R. Bredesen, H.M. Kvamsdal, O. Bolland, 2003: Integration of H2-separating membrane technology in gas turbine processes for CO2 sequestration. Proceedings of the 6th International Conference on Greenhouse Gas Control Technologies (GHGT-6), Vol 1, 135-140, 1-4 Oct. 2002, Kyoto, Japan, J. Gale and Y. Kaya (eds.), Elsevier Science Ltd, Oxford, UK.
Karg, J. and F. Hannemann, 2004: IGCC - Fuel-Flexible Technology for the Future, Presented at the Sixth European GasificationConference, Brighton, UK, May 2004.
Klett, M.G., R.C. Maxwell, and M.D. Rutkowski, 2002: The Cost of Mercury Removal in an IGCC Plant. Final Report for the US Department of Energy National Energy Technology Laboratory, by Parsons Infrastructure and Technology Group Inc., September.
Kohl,A.O.andR.B.Nielsen,1997:Gaspurification,GulfPublishingCo., Houston, TX, USA.
Kovvali, A.S. and K.K. Sirkar, 2001: Dendrimer liquid membranes: CO2 separation from gas mixtures, Ind. Eng. Chem., 40, 2502-2511.
Kreutz, T., R. Williams, P. Chiesa, and S. Consonni, 2005: Co-production of hydrogen, electricity and CO2 from coal with commercially ready technology. Part B: Economic analysis,
Chapter 3: Capture of CO2 175
International Journal of Hydrogen Energy, 30 (7): 769-784.Kvamsdal, H., O. Maurstad, K. Jordal, and O. Bolland, 2004:
Benchmarking of gas-turbine cycles with CO2 capture. Proceedings of 7th International Conference on Greenhouse Gas Control Technologies. Volume I: Peer Reviewed Papers and Overviews, E.S. Rubin, D.W. Keith, and C.F. Gilboy (eds.), Elsevier Science, Oxford, UK, 2005, 233-242.
Lackner, K.S., 2003: Climate change: a guide to CO2 sequestration, Science, 300, issue 5626, 1677-1678, 13 June.
Lackner, K., H.J. Ziock, D.P. Harrison, 2001: Hydrogen Production from carbonaceous material. United States Patent WO 0142132.
Larson, E.D., and T. Ren, 2003: Synthetic fuels production by indirect coal liquefaction, Energy for Sustainable Development, vii(4), 79-102.
Latimer, R.E., 1967: Distillation of air. Chem Eng Progress, 63(2), 35-59.
Leites, I.L., D.A. Sama, and N. Lior, 2003: The theory and practice of energy saving in the chemical industry: some methods for reducing thermodynamic irreversibility in chemical technology processes. Energy, 28, N 1, 55-97.
Leites, I.L., 1998: The Thermodynamics of CO2 solubility in mixtures monoethanolamine with organic solvents and water and commercial experienceofenergysavinggaspurificationtechnology.Energy Conversion and Management, 39, 1665-1674.
Lin, S.Y., Y. Suzuki, H. Hatano, and M. Harada, 2002: Developing an innovative method, HyPr-RING, to produce hydrogen from hydrocarbons, Energy Conversion and Management, 43, 1283-1290.
Lowe, C., V. Francuz, and C. Behrens, 2003: Hydrogen Membrane Selection for a Water Gas Shift Reactor. Second DoE Annual Conference on Carbon Sequestration. May, Arlington, VA.
maddox, R.N. and D.J. Morgan, 1998: Gas Conditioning and Processing. Volume 4: Gas treating and sulfur recovery. Campbell Petroleum Series, Norman, OK, USA.
mano, H., S. Kazama, and K. Haraya, 2003: Development of CO2 separation membranes (1) Polymer membrane, In Greenhouse Gas Control Technologies. J. Gale and Y. Kaya (eds.), Elsevier Science, Ltd., United Kingdom, 1551-1554.
marin, O., Y. Bourhis, N. Perrin, P. DiZanno, F. Viteri, and R. Anderson, 2003:HighefficiencyZeroEmissionPowerGenerationbasedona high temperature steam cycle, 28th Int. Technical Conference On Coal Utilization and Fuel Systems, Clearwater, FL, March.
mathieu, P., 2003: Mitigation of CO2 emissions using low and near zero CO2 emission power plants. Clean Air, International Journal on Energy for a Clean Environment, 4, 1-16.
mcDaniel, J.E. and M.J. Hornick, 2002: Tampa Electric Polk Power Station Integrated Gasification Combined Cycle Project, FinalTechnical Report to the National Energy Technology Laboratory, US Department of Energy, August.
mcDonald, A. and L. Schrattenholzer, 2001: Learning rates for energy technologies. Energy Policy 29, pp. 255-261.
mcDonald, M. and M. Palkes, 1999: A design study for the application of CO2/O2combustiontoanexisting300MWcoal-firedboiler,Proceedings of Combustion Canada 99 Conference-Combustion and Global Climate Change, Calgary, Alberta.
merrow, E.W., K.E. Phillips and L.W. Myers, 1981: Understanding
cost growth and performance shortfalls in pioneer process plants, Rand Publication No. R-2569-DOE, Report to the U.S. Department of Energy by Rand Corporation, Santa Monica, California, September.
middleton, P., H. Solgaard-Andersen, T. Rostrup-Nielsen T. 2002: Hydrogen Production with CO2 Capture Using Membrane Reactors. 14th World Hydrogen Energy Conference, June 9-14, Montreal, Canada.
mimura, T., H. Simayoshi, T. Suda, M. Iijima, S. Mitsuoka, 1997: Development of Energy Saving Technology for Flue Gas Carbon Dioxide Recovery in Power Plant by Chemical Absorption Method and Steam System. Energy Conversion and Management, 38, S57-S62.
mimura, T., S. Satsumi, M. Iijima, S. Mitsuoka, 1999: Development on Energy Saving Technology for Flue Gas Carbon Dioxide Recovery by the Chemical Absorption Method and Steam System in Power Plant, Greenhouse Gas Control Technologies. P. Riemer, B. Eliasson, A. Wokaun (eds.), Elsevier Science, Ltd., United Kingdom, 71-76.
mimura, T., S. Shimojo, T. Suda, M. Iijima, S. Mitsuoka, 1995: Research and Development on Energy Saving Technology for Flue Gas Carbon Dioxide Recovery and Steam System in Power Plant, Energy Conversion and Management, 36(6-9), 397-400.
mimura, T., T. Nojo, M. Iijima, T. Yoshiyama and H. Tanaka, 2003: Recent developments in flue gas CO2 recovery technology. Greenhouse Gas Control Technologies, Proceedings of the 6th International Conference on Greenhouse Gas Control Technologies (GHGT-6), 1-4 Oct. 2002, Kyoto, Japan, J. Gale and Y. Kaya (eds.), Elsevier Science Ltd, Oxford, UK.
mitretek, 2003: Hydrogen from Coal, Technical Paper MTR-2003-13, Prepared by D. Gray and G. Tomlinson for the National Energy Technology Laboratory, US DOE, April.
möllersten, K., J. Yan, and J. Moreira, 2003: Potential market niches for biomass energy with CO2 capture and storage – opportunities for energy supply with negative CO2 emissions, Biomass and Bioenergy, 25(2003), 273-285.
möllersten,K.,L.Gao, J.Yan,andM.Obersteiner,2004:Efficientenergy systems with CO2 capture and storage from renewable biomass in pulp and paper mills, Renewable Energy, 29(2004), 1583-1598.
muramatsu, E. and M. Iijima, 2003: Life cycle assessment for CO2 capture technology from exhaust gas of coal power plant. Greenhouse Gas Control Technologies. Proceedings of the 6th International Conference on Greenhouse Gas Control Technologies (GHGT-6), 1-4 Oct. 2002, Kyoto, Japan, J. Gale and Y. Kaya (eds.), Elsevier Science Ltd, Oxford, UK.
Nakagawa, K., T. Ohashi 1998: A novel method of CO2 capture from high temperature gases, Journal Electrochem. Soc., 145(4): 1344-1346.
NEtL, 2002: Advanced fossil power systems comparison study, Final report prepared for NETL by E.L. Parsons (NETL, Morgantown, WV), W.W. Shelton and J.L. Lyons (EG&G Technical Services, Inc., Morgantown, WV), December.
NEtL-DOE, 2002: Worldwide Gasification Database online,Pittsburgh, PA, USA. http://www.netl.doe.gov/coalpower/gasification/models/dtbs(excel.pdf.
176 IPCC Special Report on Carbon dioxide Capture and Storage
Noble, R. and Stern (eds.), 1995: Membrane Separations Technology, Elsevier Science, Amsterdam, The Netherlands, 718 pp.
NRC, 2003: Review of DOE’s Vision 21 Research and Development Program - Phase I, Board on Energy and Environmental Systems of the National Research Council, The National Academies Press, Washington, DC, 97 p.
NRC, 2004: The Hydrogen Economy: Opportunities, Costs, Barriers, and R&D Needs, Prepared by the Committee on Alternatives and Strategies for Future Hydrogen Production and Use, Board on Energy and Environmental Systems of the National Research Council, The National Academies Press, Washington, DC.
Nsakala, N., G. Liljedahl, J. Marion, C. Bozzuto, H. Andrus, and R. Chamberland, 2003: Greenhouse gas emissions control by oxygenfiringincirculatingfluidisedbedboilers.PresentedattheSecond Annual National Conference on Carbon Sequestration. Alexandria, VA May 5-8, USA.
Nsakala, Y.N., J. Marion, C. Bozzuto, G. Liljedahl, M. Palkes, D. Vogel, J.C. Gupta, M. Guha, H. Johnson, and S. Plasynski, 2001: Engineering feasibility of CO2 capture on an existing US coal-firedpowerplant,PaperpresentedatFirstNationalConferenceonCarbon Sequestration, Washington DC, May 15-17.
Okabe, K., N. Matsumija, H. Mano, M. Teramoto, 2003: Development of CO2 separation membranes (1) Facilitated transport membrane, In Greenhouse Gas Control Technologies. J. Gale and Y. Kaya (eds.), Elsevier Science, Ltd., United Kingdom, 1555-1558.
Parsons infrastructure & technology Group, inc., 2002b: Updated cost and performance estimates for fossil fuel power plants with CO2 removal. Report under Contract No. DE-AM26-99FT40465 to U.S.DOE/NETL, Pittsburgh, PA, and EPRI, Palo Alto, CA., December.
Parsons infrastructure and technology Group, inc., 2002a: Hydrogen Production Facilities: Plant Performance and Cost Comparisons, Final Report, prepared for the National Energy Technology Laboratory, US DOE, March.
Quinn, R., D.V. Laciak, 1997: Polyelectrolyte membranes for acid gas separations, Journal of Membrane Science, 131, 49-60.
Ramsaier, M., H.J. Sternfeld, K. Wolfmuller, 1985: European Patent 0197 555 A2.
Rao, A.B. and E.S. Rubin, 2002: A technical, economic, and environmental assessment of amine-based CO2 capture technology for power plant greenhouse gas control. Environmental Science and Technology, 36, 4467-4475.
Rao, A.B., E.S. Rubin and M. Morgan, 2003: Evaluation of potential cost reductions from improved CO2 capture systems. 2nd Annual Conference on Carbon Sequestration, Alexandria, VA, USA, 5-8 May, U.S. Department of Energy, NETL, Pittsburgh, PA.
Reddy, S., J. Scherffius, S. Freguia and C. Roberts, 2003: Fluor’sEconamine FG PlusSM technology - an enhanced amine-based CO2 capture process, 2nd Annual Conference on Carbon Sequestration, Alexandria, VA, USA, 5-8 May, U.S. Department of Energy, National Energy Technology Laboratory, Pittsburgh, PA.
Renzenbrink, W., R. Wischnewski, J. Engelhard, A. Mittelstadt, 1998: High TemperatureWinkler (HTW) Coal Gasification: A FullyDeveloped Process for Methanol and Electricity Production, paper presented at the Gasification Technology Conference, October1998, San Francisco, CA, USA.
Richards, D., 2003: Dilute oxy-fuel technology for zero emmission power, First International Conference on Industrial Gas Turbine Technologies, Brussels (available on www.came-gt.com).
Richter, H.J., K. Knoche 1983: Reversibility of Combustion processes, EfficiencyandCosting-SecondLawAnalysisofProcesses,ACS Symposium series, 235, p. 71-85.
Riemer, P.W.F. and W.G. Ormerod, 1995: International perspectives and the results of carbon dioxide capture disposal and utilisation studies, Energy Conversion and Management, 36(6-9), 813-818.
Rizeq, G., R. Subia, J. West, A. Frydman, and V. Zamansky, 2002: Advanced-Gasification Combustion: Bench-Scale ParametricStudy. 19th Annual International Pittsburgh Coal Conference September 23-27, 2002, Pittsburgh, PA, USA.
Robinson, A.L., J.S. Rhodes, and D.W. Keith, 2003: Assessment of potentialcarbondioxidereductionsduetobiomass-coalcofiringin the United States, Environmental Science and Technology, 37(22), 5081-5089.
Rubin, E.S. and A.B. Rao, 2003: Uncertainties in CO2 capture and sequestration costs, Greenhouse Gas Control Technologies, Proceedings of the 6th International Conference on Greenhouse Gas Control Technologies (GHGT-6), 1-4 Oct. 2002, Kyoto, Japan, J. Gale and Y. Kaya (eds.), Elsevier Science Ltd, Oxford, UK.
Rubin, E.S., 2001: Introduction to Engineering and the Environment. McGraw-Hill, Boston, MA, 701 p.
Rubin, E.S., A.B. Rao, and C. Chen, 2005: Comparative Assessments of Fossil Fuel Power Plants with CO2 Capture and Storage. Proceedings of 7th International Conference on Greenhouse Gas Control Technologies, Volume 1: Peer-Reviewed Papers and Overviews, E.S. Rubin, D.W. Keith and C.F. Gilboy (eds.), Elsevier Science, Oxford, UK, 285-294.
Rubin, E.S., D.A. Hounshell, S. Yeh, M. Taylor, L. Schrattenholzer, K. Riahi, L. Barreto, and S. Rao, 2004b: The Effect of Government Actions on Environmental Technology Innovation: Applications to the Integrated Assessment of Carbon Sequestration Technologies, Final Report of Award No. DE-FG02-00ER63037 from Carnegie Mellon University, Pittsburgh, PA to Office of Biologicaland Environmental Research, U.S. Department of Energy, Germantown, MD, January, 153 p.
Rubin, E.S., S. Yeh, D.A. Hounshell, and M.R. Taylor, 2004a: Experience Curves for Power Plant Emission Control Technologies, International Journal of Energy Technology and Policy, 2, No.1/2, 52-68, 2004.
Ruthven, D.M., S. Farooq, and K.S. Knaebel, 1994: Pressure Swing Adsorption. VCH, New York, 352 pp.
Sander, M.T., C.L. Mariz, 1992: The Fluor Daniel® Econamine™ FG Process: Past Experience and Present Day Focus, Energy Conversion Management, 33(5-8), 341-348.
Shilling, N. and R. Jones, 2003: The Response of Gas Turbines to a CO2ConstrainedEnvironmentPaperPresentedattheGasificationTechnology Conference, October 2003, San Francisco, CA, USA, Availableatwww.gasfication.org.
Shimizu, T, T. Hirama, H. Hosoda, K. Kitano, M. Inagaki, and K. Tejima, 1999: A Twin Fluid-Bed Reactor for removal of CO2 from combustion processes. IChemE., 77- A, 62-70.
Sikdar, S.K. and U. Diwekar (eds.), 1999: Tools and Methods for
Chapter 3: Capture of CO2 177
Pollution Prevention. Proceedings of NATO Advanced Research Workshop. NATO Science Series, No. 2: Environmental Security - Vol. 62. Dordrecht: Kluwer. 12-14 October 1998, Prague, Czech Republic.
Simbeck, D.R., 1999: A portfolio selection approach for power plant CO2 capture, separation and R&D options. Proceedings of the 4th International Conference on Greenhouse Gas Control Technologies, 30 Aug. - 2 Sept. 1998, Interlaken, Switzerland, B. Eliasson, P. Riemer and A. Wokaun (eds.), Elsevier Science Ltd., Oxford, UK.
Simbeck, D. R. and M. McDonald, 2001b: Existing coal power plant retrofit CO2 control options analysis, Greenhouse Gas Control Technologies, Proceedings of the 5th International Conference on Greenhouse Gas Control Technologies, 13-16 Aug. 2000, Cairns, Australia, D. Williams et al. (eds.), CSIRO Publishing, Collingwood, Vic., Australia.
Simbeck, D.R., 2002: New power plant CO2 mitigation costs, SFA Pacific,Inc.,MountainView,California,April.
Simbeck, D.R., 2004: Overview and insights on the three basic CO2 capture options, Third Annual Conference on Carbon Capture and Sequestration, Alexandria, Virginia, May.
Simbeck, D.R., 2005: Hydrogen Costs with CO2 Capture. M. Wilson, T. Morris, J. Gale and K. Thambimuthu (eds.): Proceedings of 7th International Conference on Greenhouse Gas Control Technologies. Volume II: Papers, Posters and Panel Discussion, Elsevier Science, Oxford UK, 1059-1066.
Singh, D., E. Croiset, P.L. Douglas and M.A. Douglas, 2003: Techno-economic study of CO2capturefromanexistingcoal-firedpowerplant: MEA scrubbing vs. O2/CO2 recycle combustion. Energy Conversion and Management, 44, p. 3073-3091.
Sircar, S., 1979: Separation of multi-component gas mixtures, US Patent No. 4171206, October 16th.
Sircar, S., C.M.A. Golden, 2001: PSA process for removal of bulk carbon dioxide from a wet high-temperature gas. US Patent No. 6322612.
Skinner, S.J.and J.A. Kilner, 2003: Oxygen ion conductors. Materials Today, 6(3), 30-37.
Stobbs, R. and Clark, P., 2005: Canadian Clean Power Coalition: The Evaluation of Options for CO2 Capture From Existing and New Coal-Fired Power Plants, In, Wilson, M., T. Morris, J. Gale and K. Thambimuthu (eds.), Proceedings of 7th International Conference on Greenhouse Gas Control Technologies. Volume II: Papers, Posters and Panel Discussion, Elsevier Science, Oxford, UK, 1187-1192.
Sundnes, A., 1998: Process for generating power and/or heat comprising a mixed conducting membrane reactor. International patent number WO98/55394 Dec. 1998.
tabe-mohammadi, A., 1999: A review of the application of membrane separation technology in natural gas treatment, Sep. Sci. & Tech., 34(10), 2095-2111.
takamura, Y. Y. Mori, H. Noda, S. Narita, A. Saji, S. Uchida, 1999: Study on CO2 Removal Technology from Flue Gas of Thermal
Power Plant by Combined System with Pressure Swing Adsorption and Super Cold Separator. Proceedings of the 5th International Conference on Greenhouse Gas Control Technologies, 13-16 Aug. 2000, Cairns, Australia, D. Williams et al. (eds.), CSIRO Publishing, Collingwood, Vic., Australia.
tan, Y., M.A., Douglas, E. Croiset, and K.V. Thambimuthu, 2002: CO2 Capture Using Oxygen Enhanced Combustion Strategies for Natural Gas Power Plants, Fuel, 81, 1007-1016.
teramoto, M., K. Nakai, N. Ohnishi, Q. Huang, T. Watari, H. Matsuyama, 1996: Facilitated transport of carbon dioxide through supported liquid membranes of aqueous amine solutions, Ind. Eng. Chem., 35, 538-545.
todd, D.M. and Battista, R.A., 2001: Demonstrated Applicability ofHydrogenFuel forGasTurbines, 4thEuropeanGasificationConference 11-13th April, Noordwijk Netherlands.
van der Sluijs, J.P, C.A. Hendriks, and K. Blok, 1992: Feasibility of polymermembranesforcarbondioxiderecoveryfromfluegases,Energy Conversion Management, 33(5-8), 429-436.
von Bogdandy, L., W. Nieder, G. Schmidt, U. Schroer, 1989: Smelting reduction of iron ore using the COREX process in power compound systems. Stahl und Eisen, 109(9,10), p 445.
Wabash River Energy Ltd., 2000:WabashRiverCoalGasificationRepowering Project, Final Technical Report to the National Energy Technology Laboratory, US Department of Energy, August.
Wang,J.,E.J.Anthony,J.C.Abanades,2004:Cleanandefficientuseof petroleum coke for combustion and power generation. Fuel, 83, 1341-1348.
Wilkinson, M.B. and Clarke, S.C., 2002: Hydrogen Fuel Production: Advanced Syngas Technology Screening Study.14th World Hydrogen Energy Conference, June 9-14, 2002, Montreal, Canada.
Wilkinson, M.B., J.C. Boden, T. Gilmartin, C. Ward, D.A. Cross, R.J. Allam, and N.W. Ivens, 2003b: CO2 capture from oil refineryprocess heaters through oxy-fuel combustion, Greenhouse Gas Control Technologies, Proc. of the 6th International Conference on Greenhouse Gas Control Technologies (GHGT-6), 1-4 Oct. 2002, Kyoto, Japan, J. Gale and Y. Kaya (eds.), Elsevier Science Ltd, Oxford, UK. 69-74.
Wilkinson, M.B., M. Simmonds, R.J. Allam, and V. White, 2003a: Oxy-fuel conversion of heaters and boilers for CO2 capture, 2nd Annual Conf on Carbon Sequestration, Virginia (USA), May 2003.
Williams, R.H. (Convening Lead Author), 2000: Advanced energy supply technologies, Chapter 8, 274-329, in Energy and the Challenge of Sustainability - the World Energy Assessment World Energy Assessment, 508 pp., UN Development Programme, New York.
World Bank, 1999: Pollution Prevention and Abatement Handbook: Toward Cleaner Production. Washington: The World Bank Group in collaboration with United Nations Industrial Development Organization and United Nations Environment Programme.
yantovskii, E.I., K.N. Zvagolsky, and V.A. Gavrilenko, 1992: Computer exergonomics of power plants without exhaust gases Energy Conversion and Management, 33, No. 5-8, 405-412.
yokoyama, T., 2003: Japanese R&D on CO2 Capture. Greenhouse Gas Control Technologies, Proc. of the 6th International Conference on
178 IPCC Special Report on Carbon dioxide Capture and Storage
Greenhouse Gas Control Technologies (GHGT-6), 1-4 Oct. 2002, Kyoto, Japan, J. Gale and Y. Kaya (eds.), Elsevier Science Ltd, Oxford, UK. 13-18.
Zafar, Q., T. Mattisson, and B. Gevert, 2005: Integrated Hydrogen and Power Production with CO2 Capture Using Chemical-Looping Reforming-Redox Reactivity of Particles of CuO, Mn2O3, NiO, and Fe2O3 Using SiO2 as a Support, Industrial and Engineering Chemistry Research, 44(10), 3485-3496.
Zheng, X.Y, Y.-F. Diao, B.-S. He, C.-H. Chen, X.-C. Xu, and W. Feng, 2003: Carbon Dioxide Recovery from Flue Gases by Ammonia Scrubbing. Greenhouse Gas Control Technologies, Proc. of the 6th International Conference on Greenhouse Gas Control Technologies (GHGT-6), 1-4 Oct. 2002, Kyoto, Japan, J. Gale and Y. Kaya (eds.), Elsevier Science Ltd, Oxford, UK. 193-200.