34
Strictly Private & Confidential CARABAO GROUP 2Q21 Analyst Meeting 19 August 2021
Strictly Private & Confidential
CARABAO GROUP2Q21 Analyst Meeting 19 August 2021
Disclaimer
3
The provision herein does not constitute legal advice or investment opinions of any kind, neither is it intended as an offer, solicitation
for Carabao Group PCL. (“CBG” or “The Group”). The information presented within this material is regarded only as indicative,
preliminary and for illustrative purposes and to be used, downloaded, and distributed for this meeting with CBG. No representation,
warranties, or undertakings, express or implied, are made by CBG, or any of its respective members, directors, officers, employees,
agents, affiliates, advisers or representatives or any other person as to, and no reliance should be placed on, the fairness, accuracy,
completeness or correctness of, the information or opinions presented or contained therein. The information and opinions presented or
contained therein are provided as at the date of this meeting based on the economic, regulatory, market and other conditions as in
effect on the date hereof and are subject to verification, completion, updating, revision and change without notice and the accuracy of
the information is not guaranteed. This presentation contains forward-looking statements that may be identified by their use of words
like “plans,” “expects,” “will,” “anticipates,” “believes,” “intends,” “depends,” “projects,” “estimates” or other words of similar meaning
and that involve assumptions, risks and uncertainties. Such forward looking statements are not necessarily indicative of the future or
likely performance or projection of CBG and involve known and unknown risks, uncertainties and other important factors beyond the
control of CBG. CBG’s actual results may vary materially from those expressed or implied in its forward-looking statements, and no
assurance is made as to whether such future events will occur. The Group accepts no liability whatsoever for any loss arising directly
or indirectly from the use or endorsement of any information contained herein by any users and/or third parties.
Agenda
4
Financial Performance
CBG Summary
Business Update
Q&A
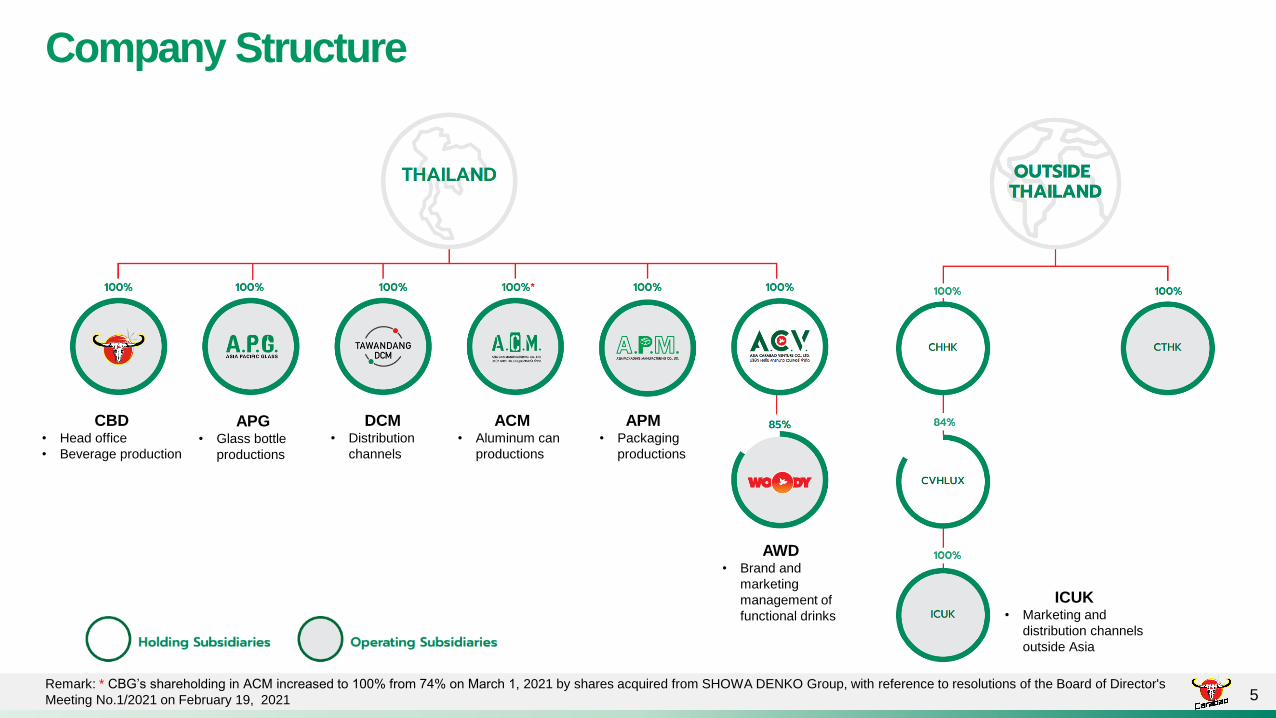
Company Structure
5
CBD• Head office
• Beverage production
APG• Glass bottle
productions
DCM• Distribution
channels
ACM• Aluminum can
productions
APM• Packaging
productions
AWD• Brand and
marketing
management of
functional drinks
ICUK• Marketing and
distribution channels
outside Asia
Remark: * CBG’s shareholding in ACM increased to 100% from 74% on March 1, 2021 by shares acquired from SHOWA DENKO Group, with reference to resolutions of the Board of Director's
Meeting No.1/2021 on February 19, 2021
CBG 2Q21 Summary
6Remark: * Contributing to major shareholders of the company 6
2Q21 Review Business HighlightsFinancial Performance
Revenue (THB mn)
Gross Profit Margin
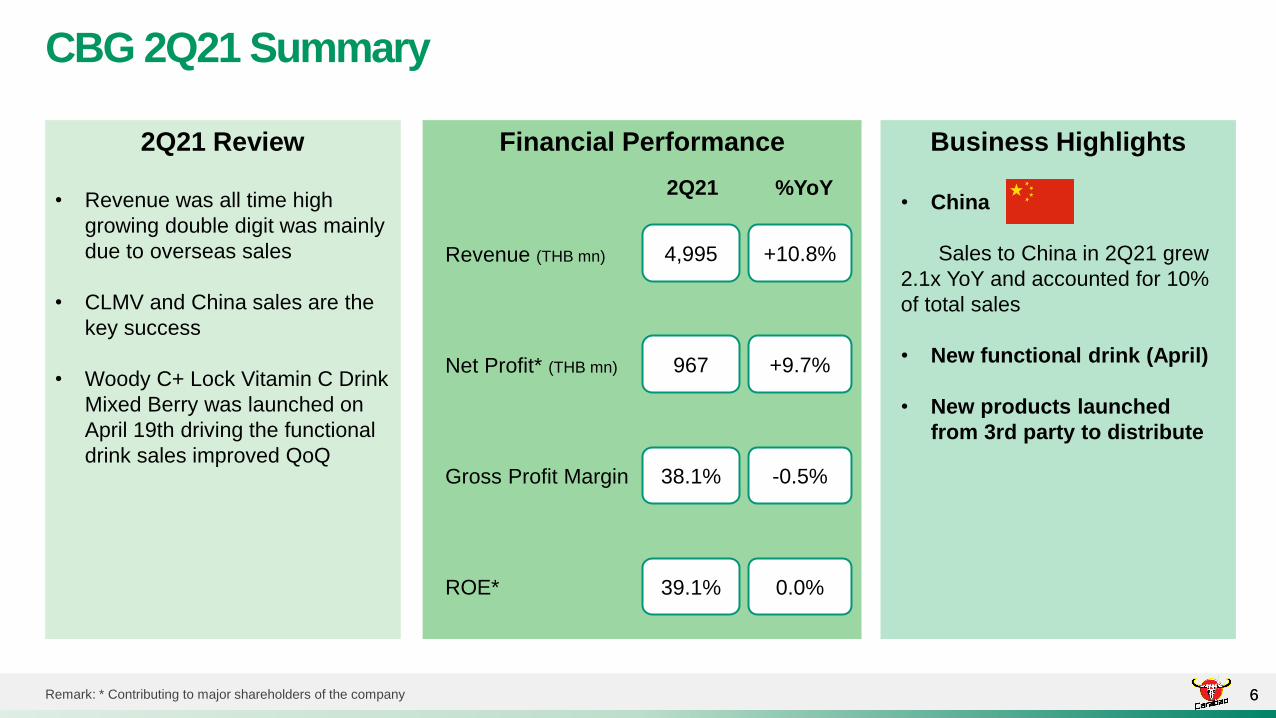
• China
Sales to China in 2Q21 grew
2.1x YoY and accounted for 10%
of total sales
• New functional drink (April)
• New products launched
from 3rd party to distribute
Net Profit* (THB mn)
4,995
38.1%
967
• Revenue was all time high
growing double digit was mainly
due to overseas sales
• CLMV and China sales are the
key success
• Woody C+ Lock Vitamin C Drink
Mixed Berry was launched on
April 19th driving the functional
drink sales improved QoQ
ROE* 39.1%
+10.8%
-0.5%
+9.7%
0.0%
2Q21 %YoY
Agenda
7
Financial Performance
CBG Summary
Business Update
Q&A
PerformanceSales Mix
8
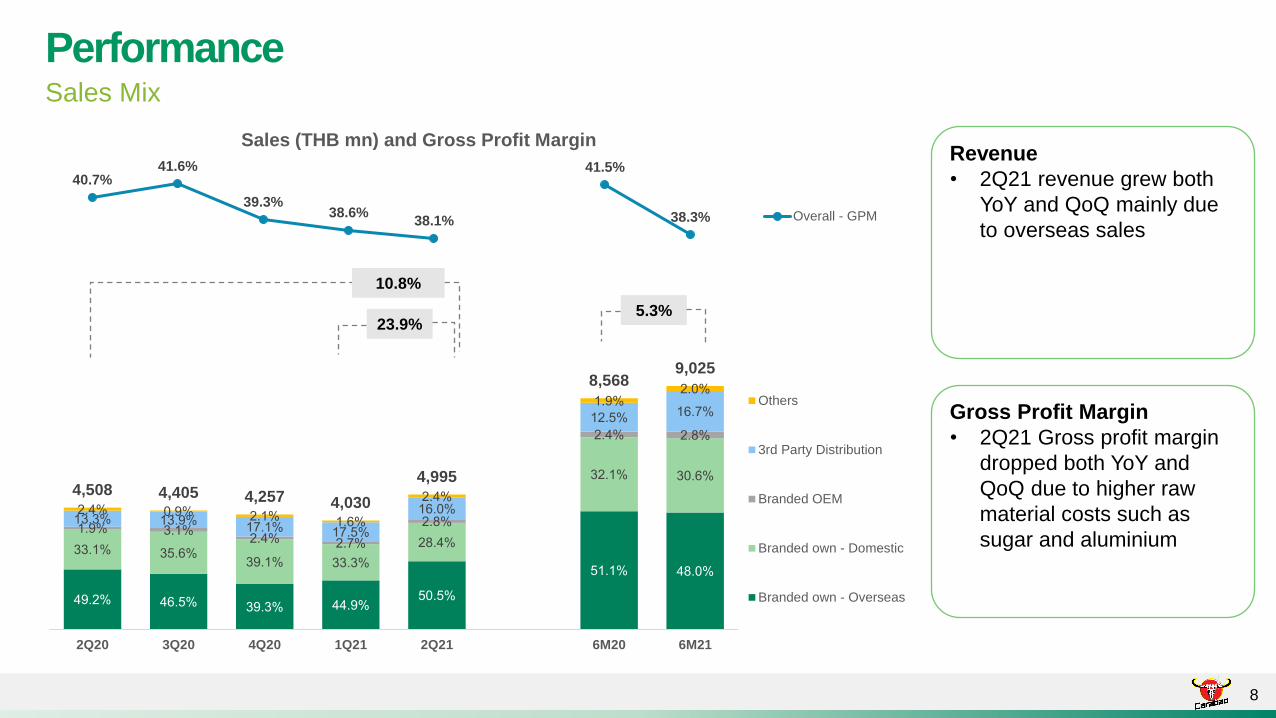
Revenue
• 2Q21 revenue grew both
YoY and QoQ mainly due
to overseas sales
Gross Profit Margin
• 2Q21 Gross profit margin
dropped both YoY and
QoQ due to higher raw
material costs such as
sugar and aluminium
4 . % 4 . % . % 44. % 0. %
1.1% 4 .0%
.1% . % .1% . %
.4%
.1% 0. %
1. % .1% .4% .7%
. %
.4% . %
1 . % 1 . %17.1% 17. %
1 .0%
1 . % 1 .7%
.4% 0. % .1% 1. %
.4%
1. % .0%
4,508 4,405 4,257 4,030
4,995
8,568 9,025
2Q20 3Q20 4Q20 1Q21 2Q21 6M20 6M21
Others
3rd Party Distribution
Branded OEM
Branded own - Domestic
Branded own - Overseas
23.9%
40.7%41.6%
39.3%38.6%
38.1%
41.5%
38.3%
Sales (THB mn) and Gross Profit Margin
Overall - GPM
10.8%
5.3%
Branded OwnRevenue breakdown (Domestic and Overseas)
9
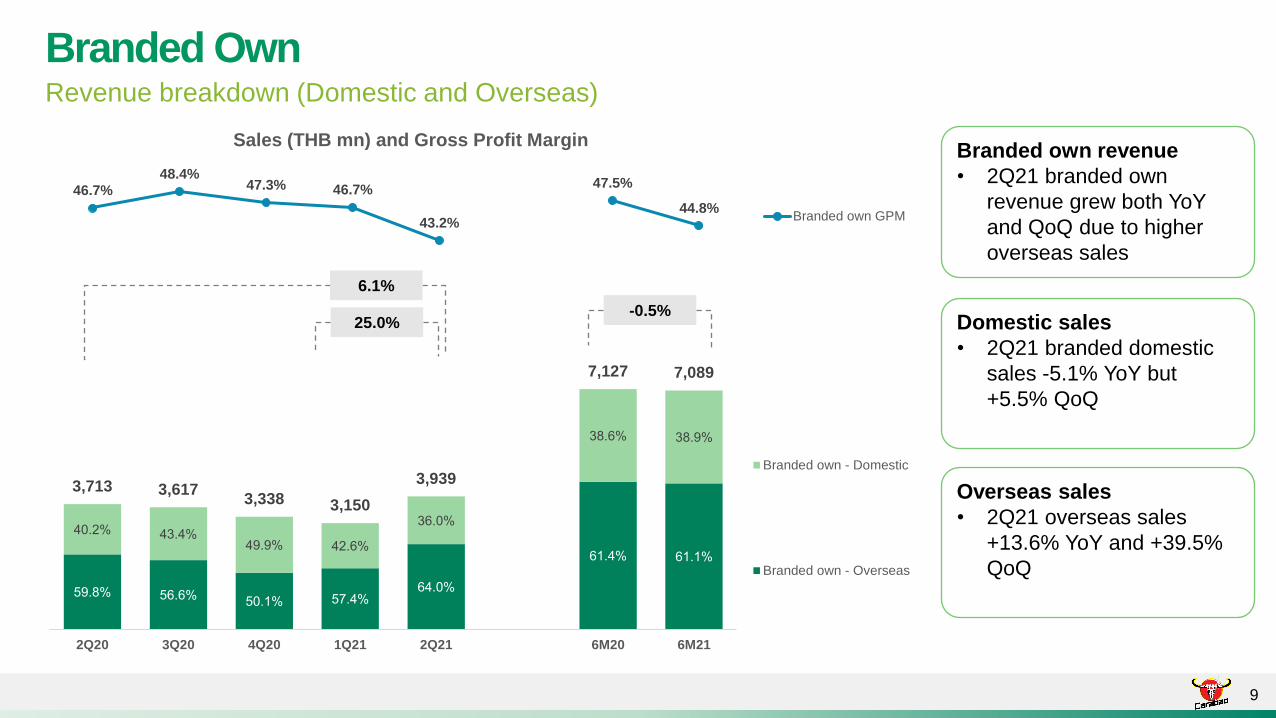
Branded own revenue
• 2Q21 branded own
revenue grew both YoY
and QoQ due to higher
overseas sales
Overseas sales
• 2Q21 overseas sales
+13.6% YoY and +39.5%
QoQ
Domestic sales
• 2Q21 branded domestic
sales -5.1% YoY but
+5.5% QoQ
. % . % 0.1% 7.4%
4.0%
1.4% 1.1%
40. % 4 .4%4 . % 4 . %
.0%
. % . %
3,713 3,617 3,338 3,150
3,939
7,127 7,089
2Q20 3Q20 4Q20 1Q21 2Q21 6M20 6M21
Branded own - Domestic
Branded own - Overseas
25.0%
46.7%48.4%
47.3% 46.7%
43.2%
47.5%
44.8%
Sales (THB mn) and Gross Profit Margin
Branded own GPM
6.1%
-0.5%
Branded OwnRevenue breakdown (Overseas)
10
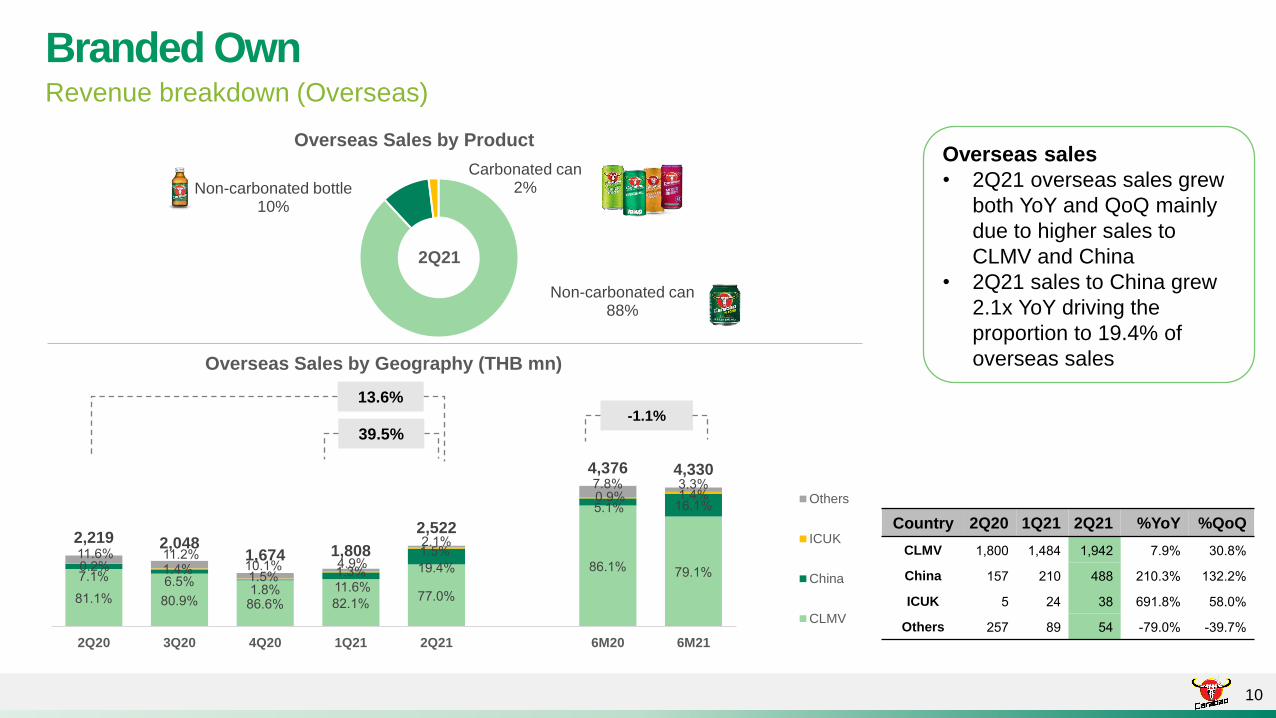
Overseas sales
• 2Q21 overseas sales grew
both YoY and QoQ mainly
due to higher sales to
CLMV and China
• 2Q21 sales to China grew
2.1x YoY driving the
proportion to 19.4% of
overseas sales
Country 2Q20 1Q21 2Q21 %YoY %QoQ
CLMV 1, 00 1,4 4 1, 4 7. % 0. %
China 1 7 10 4 10. % 1 . %
ICUK 4 1. % .0%
Others 7 4 -7 .0% - .7%
1.1% 0. % . % .1%77.0%
.1% 7 .1%7.1% . %1. % 11. %
1 .4%
.1% 1 .1%
0. % 1.4%1. % 1. %
1. %
0. % 1.4%
11. % 11. %10.1% 4. %
.1%
7. % . %
2,219 2,048 1,674 1,808
2,522
4,376 4,330
2Q20 3Q20 4Q20 1Q21 2Q21 6M20 6M21
Overseas Sales by Geography (THB mn)
Others
ICUK
China
CLMV
39.5%
13.6%
Non-carbonated can88%
Non-carbonated bottle10%
Carbonated can2%
Overseas Sales by Product
2Q21
-1.1%
Distribution for 3rd PartyRevenue breakdown
11
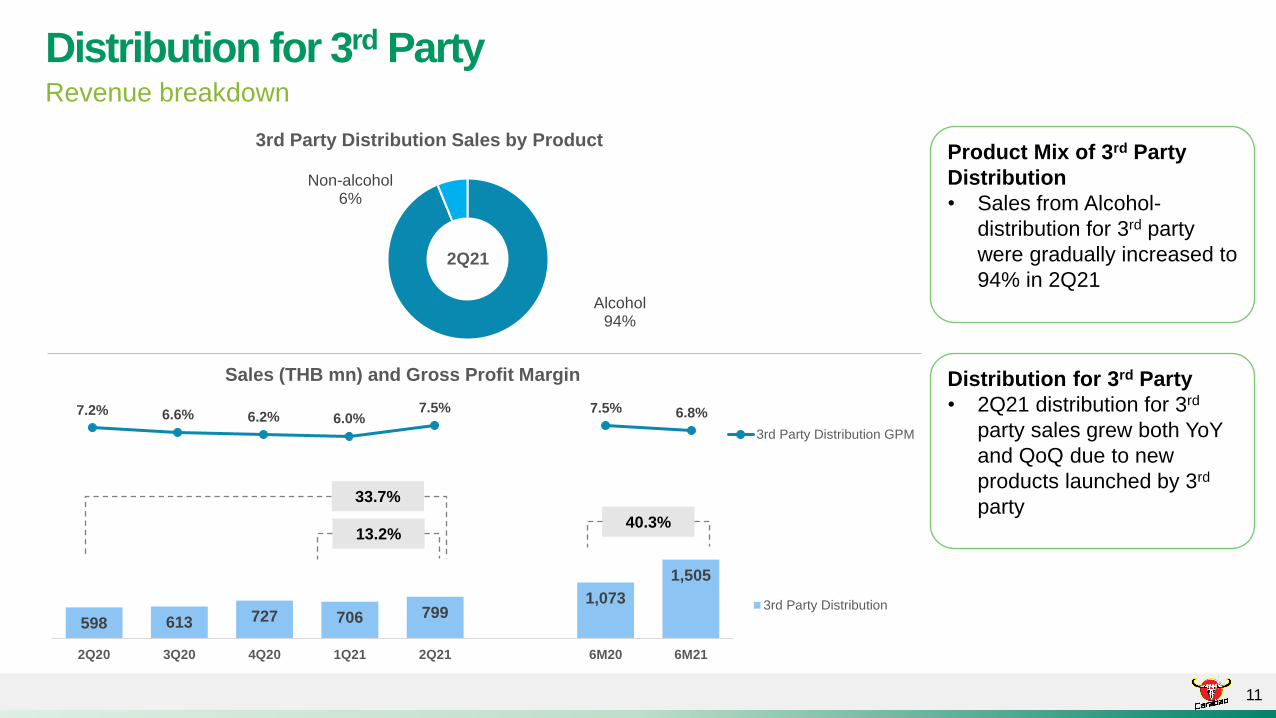
Distribution for 3rd Party
• 2Q21 distribution for 3rd
party sales grew both YoY
and QoQ due to new
products launched by 3rd
party
Product Mix of 3rd Party
Distribution
• Sales from Alcohol-
distribution for 3rd party
were gradually increased to
94% in 2Q21
598 613 727 706 799 1,073
1,505
2Q20 3Q20 4Q20 1Q21 2Q21 6M20 6M21
3rd Party Distribution
13.2%
Alcohol94%
Non-alcohol6%
3rd Party Distribution Sales by Product
2Q21
7.2% 6.6% 6.2% 6.0%7.5% 7.5% 6.8%
Sales (THB mn) and Gross Profit Margin
3rd Party Distribution GPM
33.7%
40.3%
Branded OEMRevenue breakdown
12
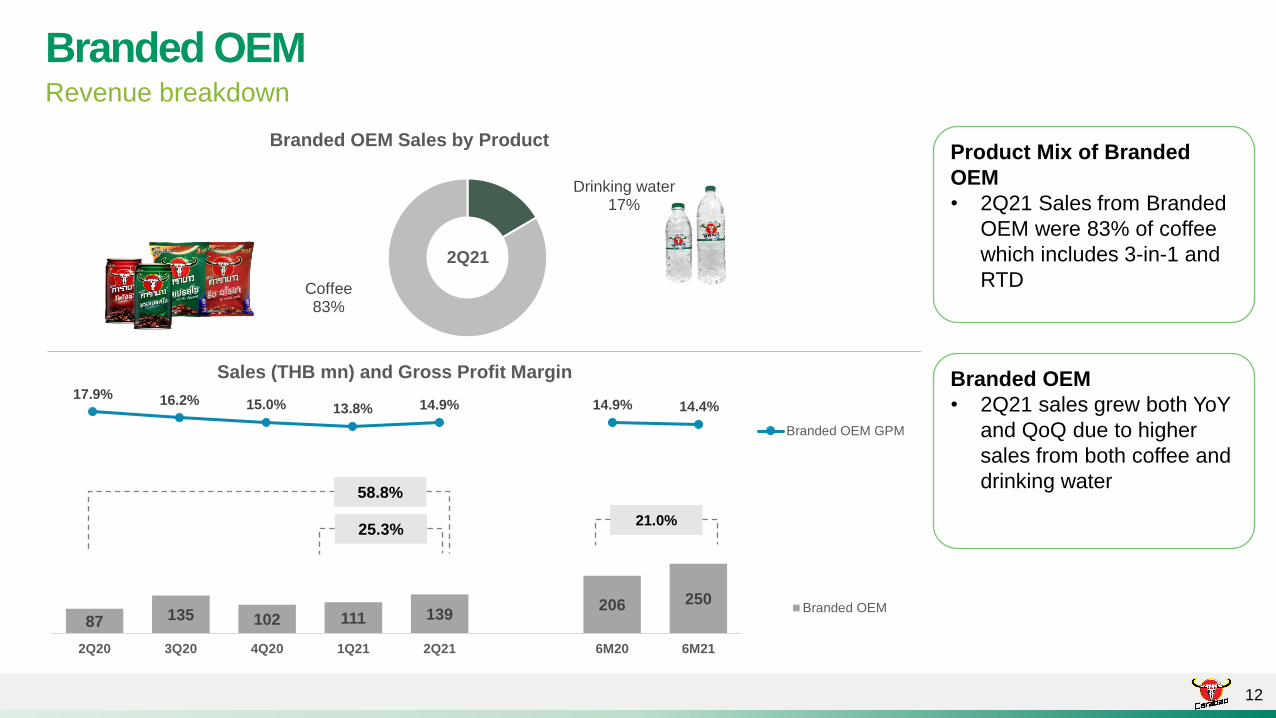
Branded OEM
• 2Q21 sales grew both YoY
and QoQ due to higher
sales from both coffee and
drinking water
Product Mix of Branded
OEM
• 2Q21 Sales from Branded
OEM were 83% of coffee
which includes 3-in-1 and
RTD
87 135 102 111 139 206 250
2Q20 3Q20 4Q20 1Q21 2Q21 6M20 6M21
Branded OEM
25.3%
Drinking water17%
Coffee83%
Branded OEM Sales by Product
2Q21
17.9% 16.2% 15.0% 13.8% 14.9% 14.9% 14.4%
Sales (THB mn) and Gross Profit Margin
Branded OEM GPM
58.8%
21.0%
SG&ASG&A breakdown
13
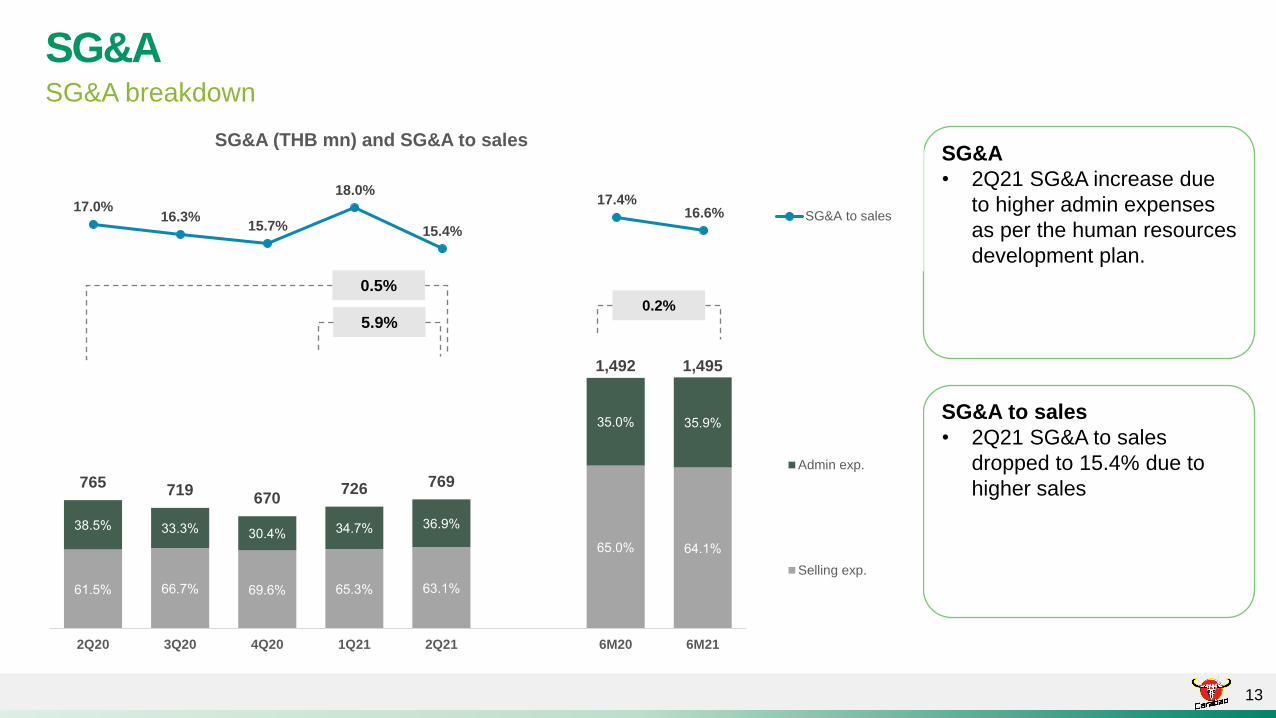
SG&A
• 2Q21 SG&A increase due
to higher admin expenses
as per the human resources
development plan.
SG&A to sales
• 2Q21 SG&A to sales
dropped to 15.4% due to
higher sales
1. % .7% . % . % .1%
.0% 4.1%
. % . % 0.4% 4.7% . %
.0% . %
765 719
670 726 769
1,492 1,495
2Q20 3Q20 4Q20 1Q21 2Q21 6M20 6M21
Admin exp.
Selling exp.
5.9%
17.0%16.3%
15.7%
18.0%
15.4%
17.4%16.6%
SG&A (THB mn) and SG&A to sales
SG&A to sales
0.5%
0.2%
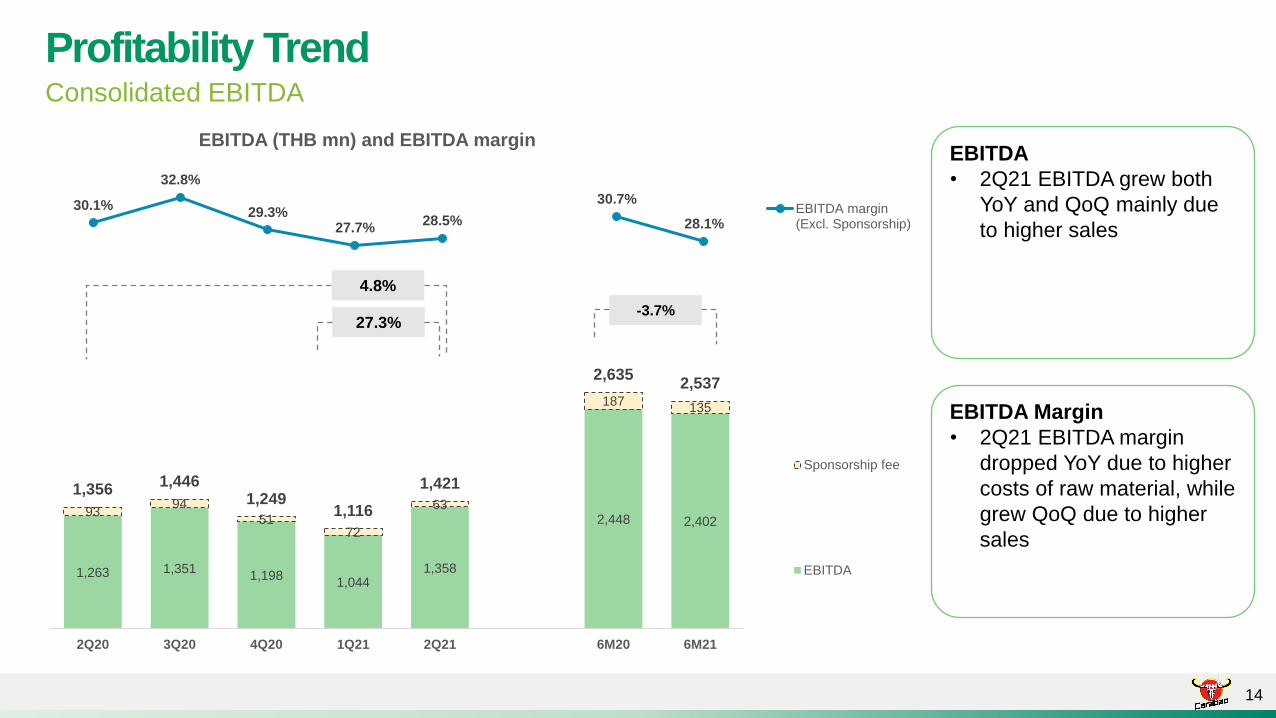
Profitability TrendConsolidated EBITDA
14
EBITDA
• 2Q21 EBITDA grew both
YoY and QoQ mainly due
to higher sales
EBITDA Margin
• 2Q21 EBITDA margin
dropped YoY due to higher
costs of raw material, while
grew QoQ due to higher
sales
1,263 1,351 1,198
1,044 1,358
2,448 2,402 93
94
51 72
63
187 135
1,356 1,446
1,249 1,116
1,421
2,635 2,537
2Q20 3Q20 4Q20 1Q21 2Q21 6M20 6M21
Sponsorship fee
EBITDA
27.3%
30.1%
32.8%
29.3%27.7%
28.5%
30.7%
28.1%
EBITDA (THB mn) and EBITDA margin
EBITDA margin(Excl. Sponsorship)
4.8%
-3.7%
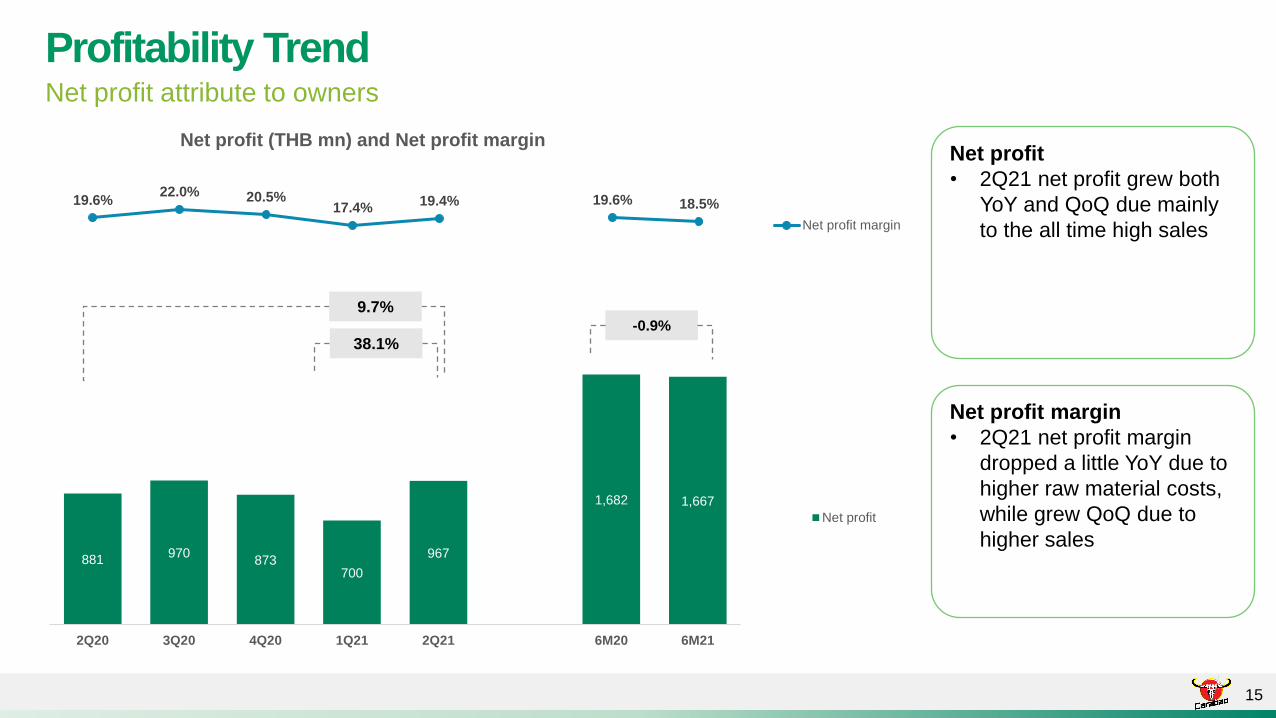
Profitability TrendNet profit attribute to owners
15
Net profit
• 2Q21 net profit grew both
YoY and QoQ due mainly
to the all time high sales
Net profit margin
• 2Q21 net profit margin
dropped a little YoY due to
higher raw material costs,
while grew QoQ due to
higher sales881
970 873
700
967
1,682 1,667
2Q20 3Q20 4Q20 1Q21 2Q21 6M20 6M21
Net profit
38.1%
19.6%22.0% 20.5%
17.4%19.4% 19.6% 18.5%
Net profit (THB mn) and Net profit margin
Net profit margin
9.7%-0.9%
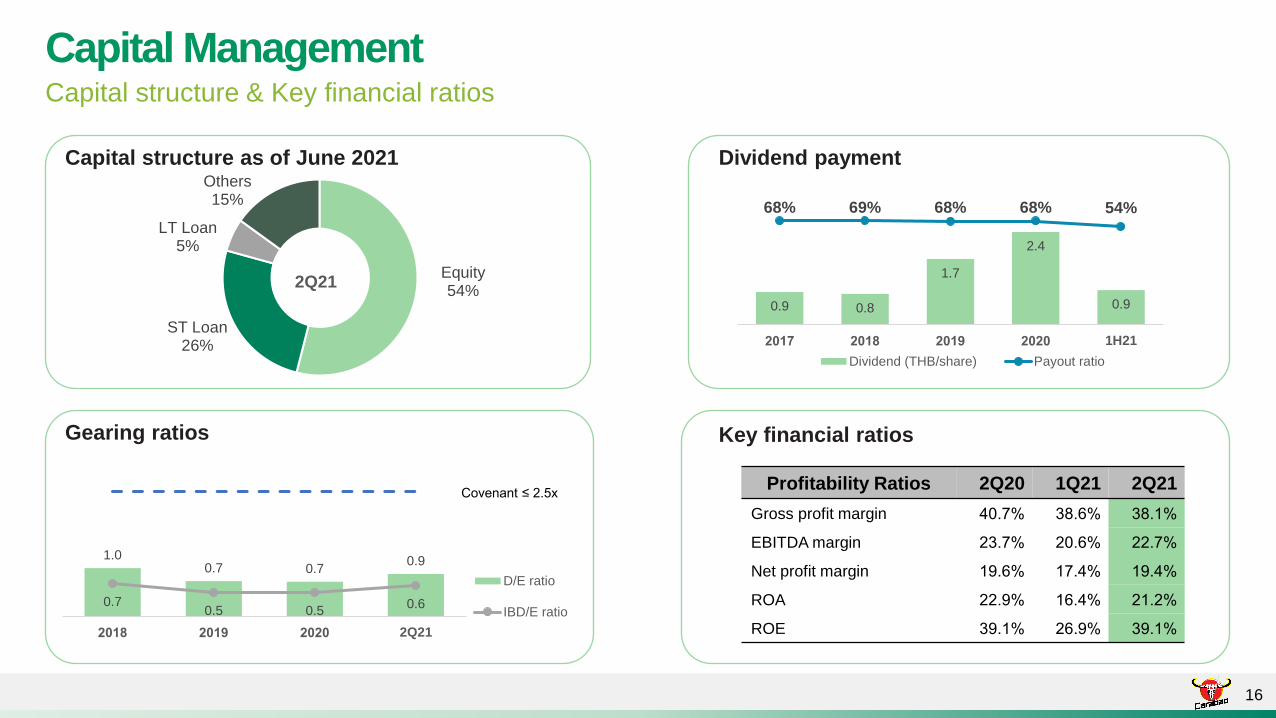
Equity54%
ST Loan26%
LT Loan5%
Others15%
2Q21
Capital ManagementCapital structure & Key financial ratios
16
Profitability Ratios 2Q20 1Q21 2Q21
Gross profit margin 40.7% . % .1%
EBITDA margin .7% 0. % .7%
Net profit margin 1 . % 17.4% 1 .4%
ROA . % 1 .4% 1. %
ROE .1% . % .1%
Capital structure as of June 2021 Dividend payment
Gearing ratios Key financial ratios
1.0 0.7 0.7
0.9
0.7 0.5 0.5
0.6
2Q21
D/E ratio
IBD/E ratio
Covenant ≤ . x
0.9 0.8
1.7
2.4
0.9
68% 69% 68% 68% 54%
-200%
-100%
0%
100%
0.0
1.0
2.0
3.0
1H21
Dividend (THB/share) Payout ratio
Agenda
17
Financial Performance
Company Overview
Business Update
Q&A
Industry Outlook
Source: Fiscal Policy Office - Ministry of Finance, Bank of Thailand, Ministry of Commerce, Thailand Board of investment 18
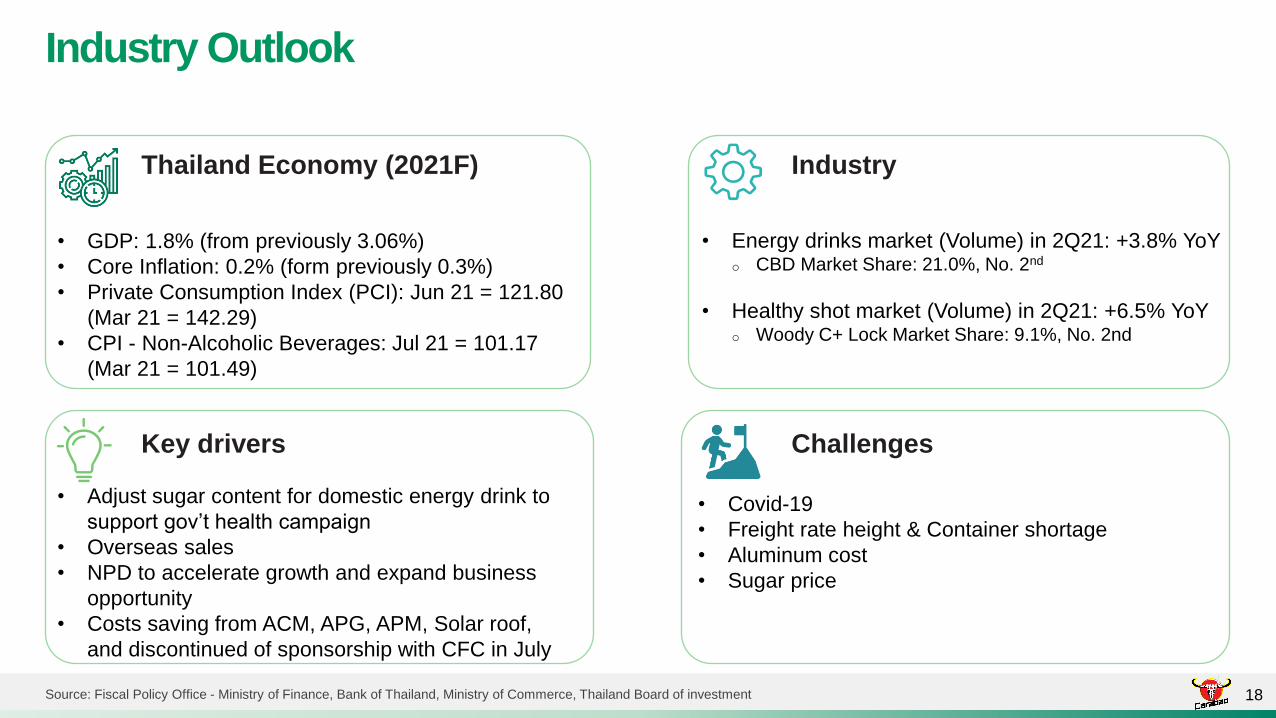
Key drivers
Industry
Challenges
Thailand Economy (2021F)
• Adjust sugar content for domestic energy drink to
support gov’t health campaign
• Overseas sales
• NPD to accelerate growth and expand business
opportunity
• Costs saving from ACM, APG, APM, Solar roof,
and discontinued of sponsorship with CFC in July
• Covid-19
• Freight rate height & Container shortage
• Aluminum cost
• Sugar price
• GDP: 1.8% (from previously 3.06%)
• Core Inflation: 0.2% (form previously 0.3%)
• Private Consumption Index (PCI): Jun 21 = 121.80
(Mar 21 = 142.29)
• CPI - Non-Alcoholic Beverages: Jul 21 = 101.17
(Mar 21 = 101.49)
• Energy drinks market (Volume) in 2Q21: +3.8% YoYo CBD Market Share: 21.0%, No. 2nd
• Healthy shot market (Volume) in 2Q21: +6.5% YoYo Woody C+ Lock Market Share: 9.1%, No. 2nd
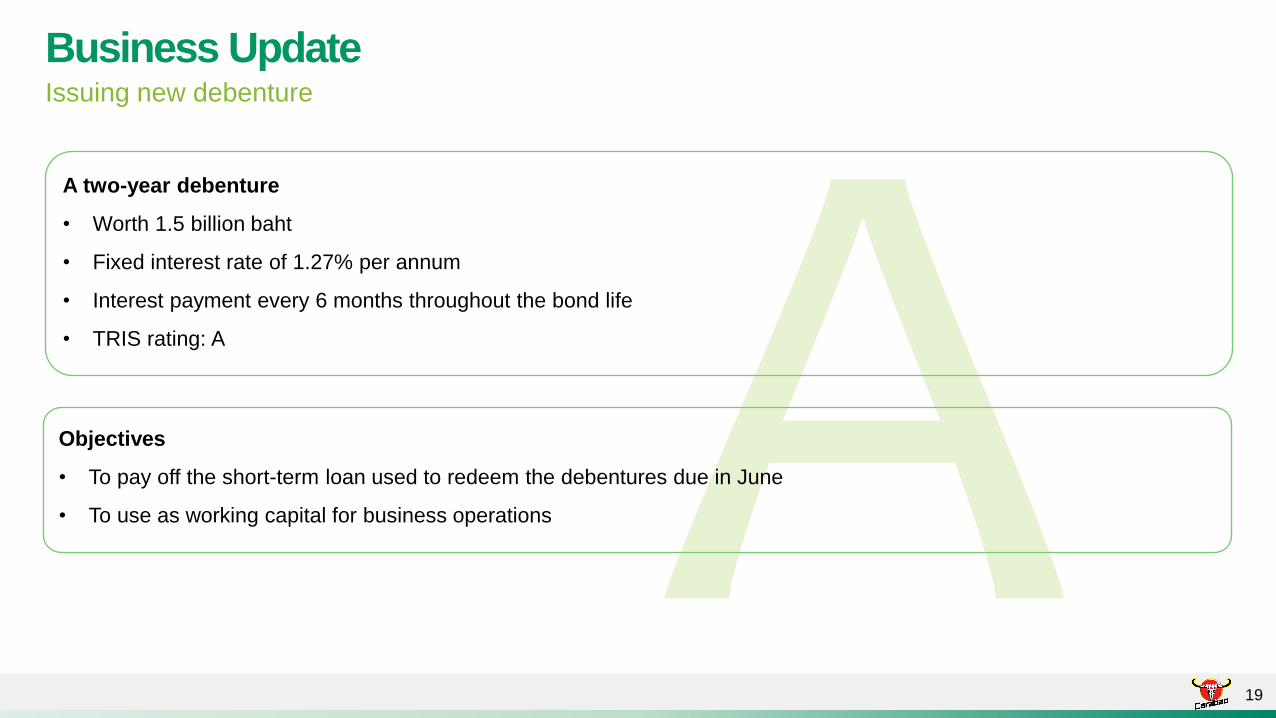
Business UpdateIssuing new debenture
19
A two-year debenture
• Worth 1.5 billion baht
• Fixed interest rate of 1.27% per annum
• Interest payment every 6 months throughout the bond life
• TRIS rating: A
Objectives
• To pay off the short-term loan used to redeem the debentures due in June
• To use as working capital for business operations
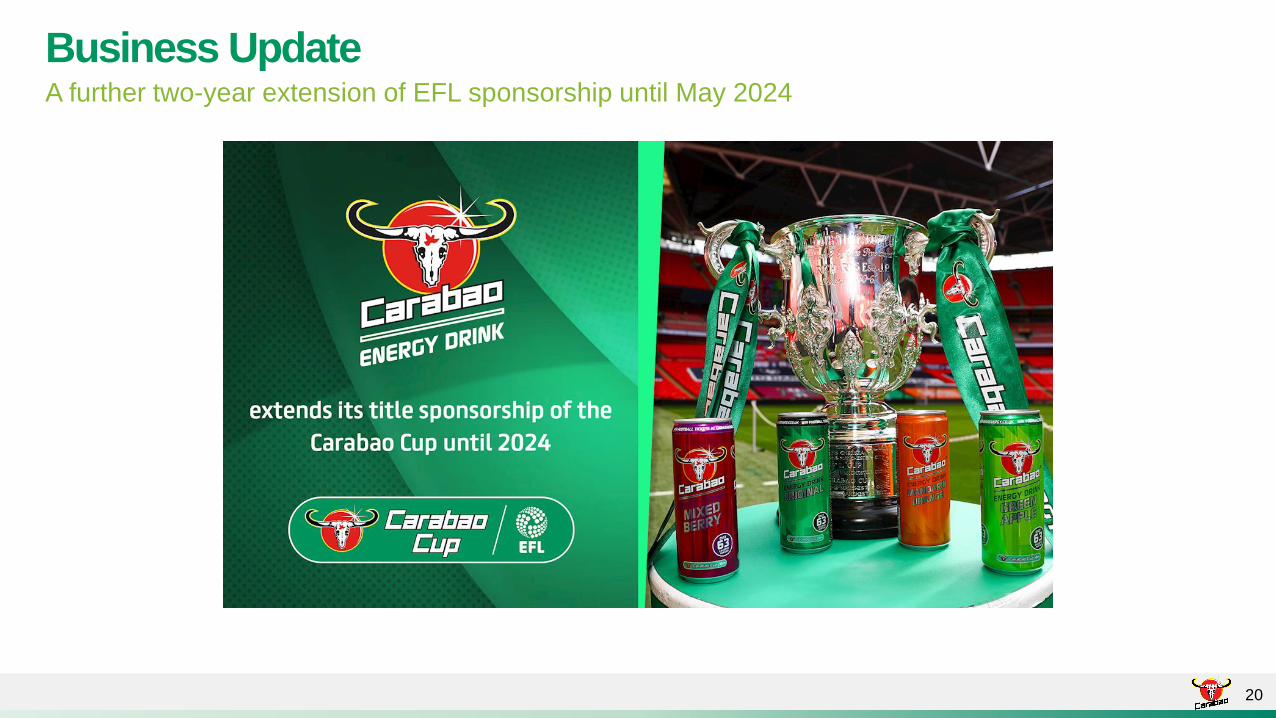
Business UpdateA further two-year extension of EFL sponsorship until May 2024
20
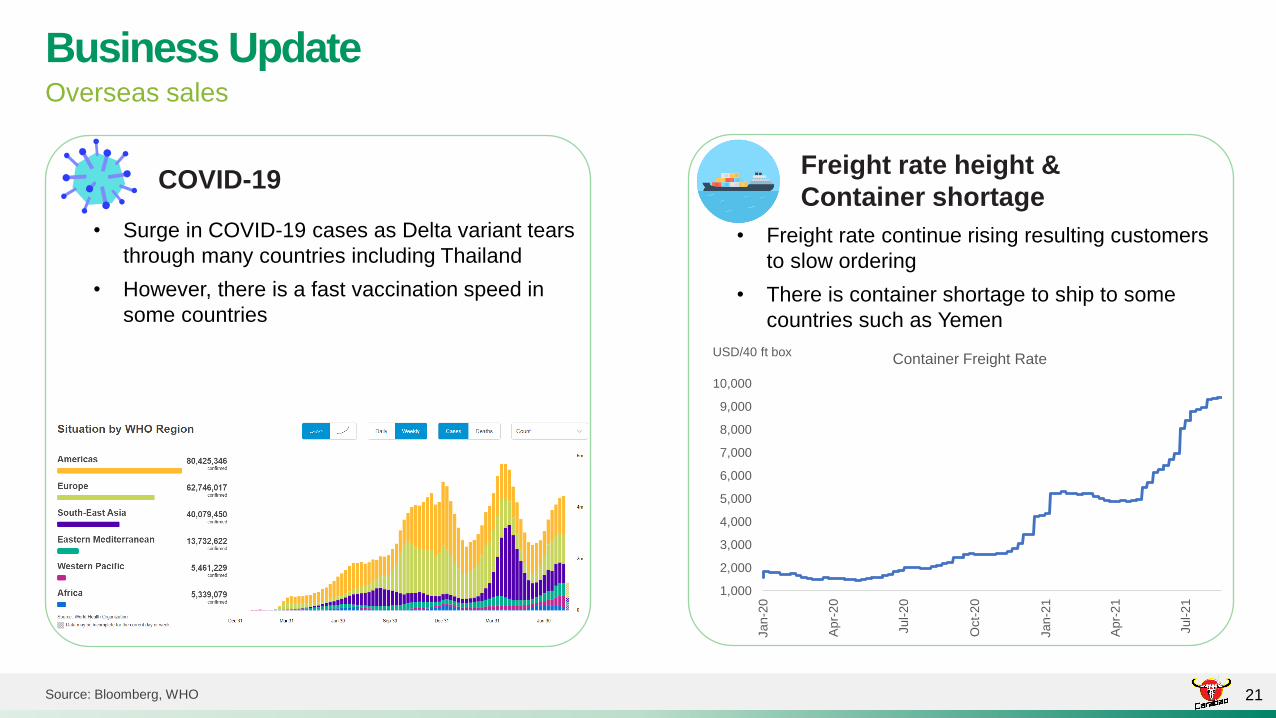
Business UpdateOverseas sales
21Source: Bloomberg, WHO
COVID-19
• Surge in COVID-19 cases as Delta variant tears
through many countries including Thailand
• However, there is a fast vaccination speed in
some countries
Freight rate height &
Container shortage
• Freight rate continue rising resulting customers
to slow ordering
• There is container shortage to ship to some
countries such as Yemen
1,000
2,000
3,000
4,000
5,000
6,000
7,000
8,000
9,000
10,000
Jan-2
0
Apr-
20
Jul-2
0
Oct-
20
Jan-2
1
Ap
r-2
1
Jul-2
1
USD/40 ft boxContainer Freight Rate
Agenda
22
Financial Performance
Company Overview
Business Update
Q&A
24
Appendix
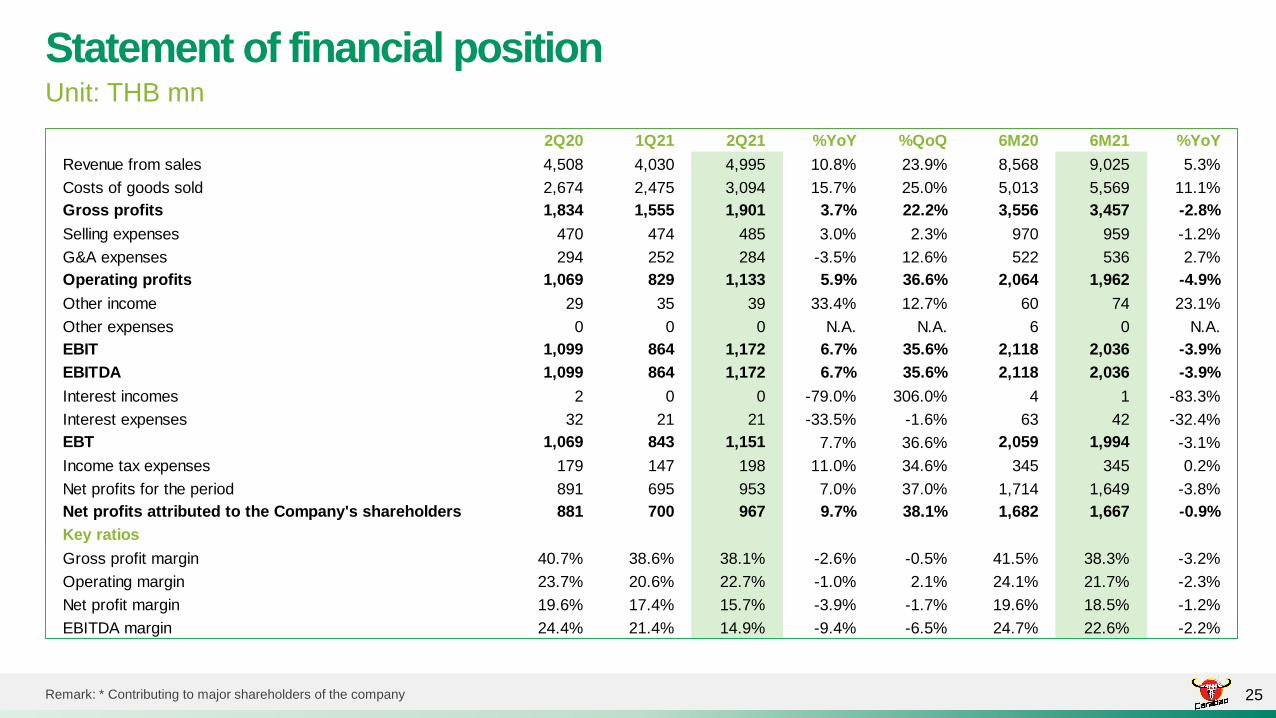
Statement of financial positionUnit: THB mn
Remark: * Contributing to major shareholders of the company 25
2Q20 1Q21 2Q21 %YoY %QoQ 6M20 6M21 %YoY
Revenue from sales 4,508 4,030 4,995 10.8% 23.9% 8,568 9,025 5.3%
Costs of goods sold 2,674 2,475 3,094 15.7% 25.0% 5,013 5,569 11.1%
Gross profits 1,834 1,555 1,901 3.7% 22.2% 3,556 3,457 -2.8%
Selling expenses 470 474 485 3.0% 2.3% 970 959 -1.2%
G&A expenses 294 252 284 -3.5% 12.6% 522 536 2.7%
Operating profits 1,069 829 1,133 5.9% 36.6% 2,064 1,962 -4.9%
Other income 29 35 39 33.4% 12.7% 60 74 23.1%
Other expenses 0 0 0 N.A. N.A. 6 0 N.A.
EBIT 1,099 864 1,172 6.7% 35.6% 2,118 2,036 -3.9%
EBITDA 1,099 864 1,172 6.7% 35.6% 2,118 2,036 -3.9%
Interest incomes 2 0 0 -79.0% 306.0% 4 1 -83.3%
Interest expenses 32 21 21 -33.5% -1.6% 63 42 -32.4%
EBT 1,069 843 1,151 7.7% 36.6% 2,059 1,994 -3.1%
Income tax expenses 179 147 198 11.0% 34.6% 345 345 0.2%
Net profits for the period 891 695 953 7.0% 37.0% 1,714 1,649 -3.8%
Net profits attributed to the Company's shareholders 881 700 967 9.7% 38.1% 1,682 1,667 -0.9%
Key ratios
Gross profit margin 40.7% 38.6% 38.1% -2.6% -0.5% 41.5% 38.3% -3.2%
Operating margin 23.7% 20.6% 22.7% -1.0% 2.1% 24.1% 21.7% -2.3%
Net profit margin 19.6% 17.4% 15.7% -3.9% -1.7% 19.6% 18.5% -1.2%
EBITDA margin 24.4% 21.4% 14.9% -9.4% -6.5% 24.7% 22.6% -2.2%
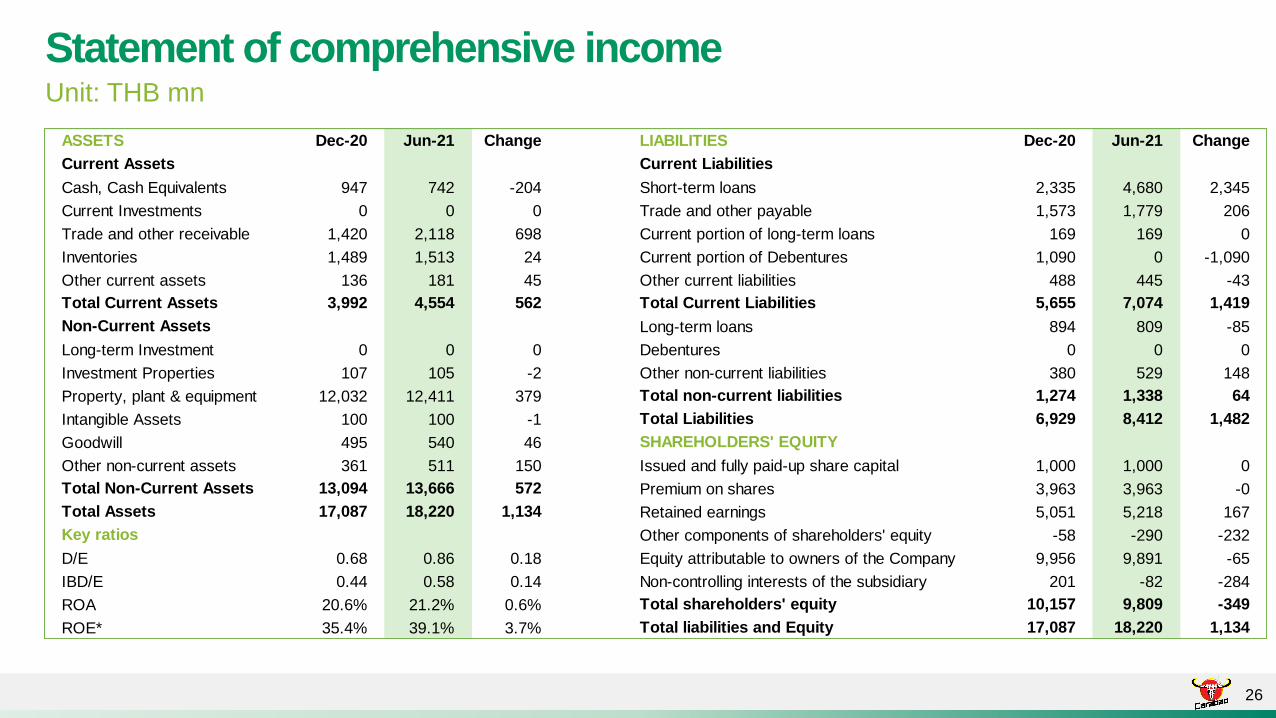
Statement of comprehensive incomeUnit: THB mn
26
ASSETS Dec-20 Jun-21 Change LIABILITIES Dec-20 Jun-21 Change
Current Assets Current Liabilities
Cash, Cash Equivalents 947 742 -204 Short-term loans 2,335 4,680 2,345
Current Investments 0 0 0 Trade and other payable 1,573 1,779 206
Trade and other receivable 1,420 2,118 698 Current portion of long-term loans 169 169 0
Inventories 1,489 1,513 24 Current portion of Debentures 1,090 0 -1,090
Other current assets 136 181 45 Other current liabilities 488 445 -43
Total Current Assets 3,992 4,554 562 Total Current Liabilities 5,655 7,074 1,419
Non-Current Assets Long-term loans 894 809 -85
Long-term Investment 0 0 0 Debentures 0 0 0
Investment Properties 107 105 -2 Other non-current liabilities 380 529 148
Property, plant & equipment 12,032 12,411 379 Total non-current liabilities 1,274 1,338 64
Intangible Assets 100 100 -1 Total Liabilities 6,929 8,412 1,482
Goodwill 495 540 46 SHAREHOLDERS' EQUITY
Other non-current assets 361 511 150 Issued and fully paid-up share capital 1,000 1,000 0
Total Non-Current Assets 13,094 13,666 572 Premium on shares 3,963 3,963 -0
Total Assets 17,087 18,220 1,134 Retained earnings 5,051 5,218 167
Key ratios Other components of shareholders' equity -58 -290 -232
D/E 0.68 0.86 0.18 Equity attributable to owners of the Company 9,956 9,891 -65
IBD/E 0.44 0.58 0.14 Non-controlling interests of the subsidiary 201 -82 -284
ROA 20.6% 21.2% 0.6% Total shareholders' equity 10,157 9,809 -349
ROE* 35.4% 39.1% 3.7% Total liabilities and Equity 17,087 18,220 1,134
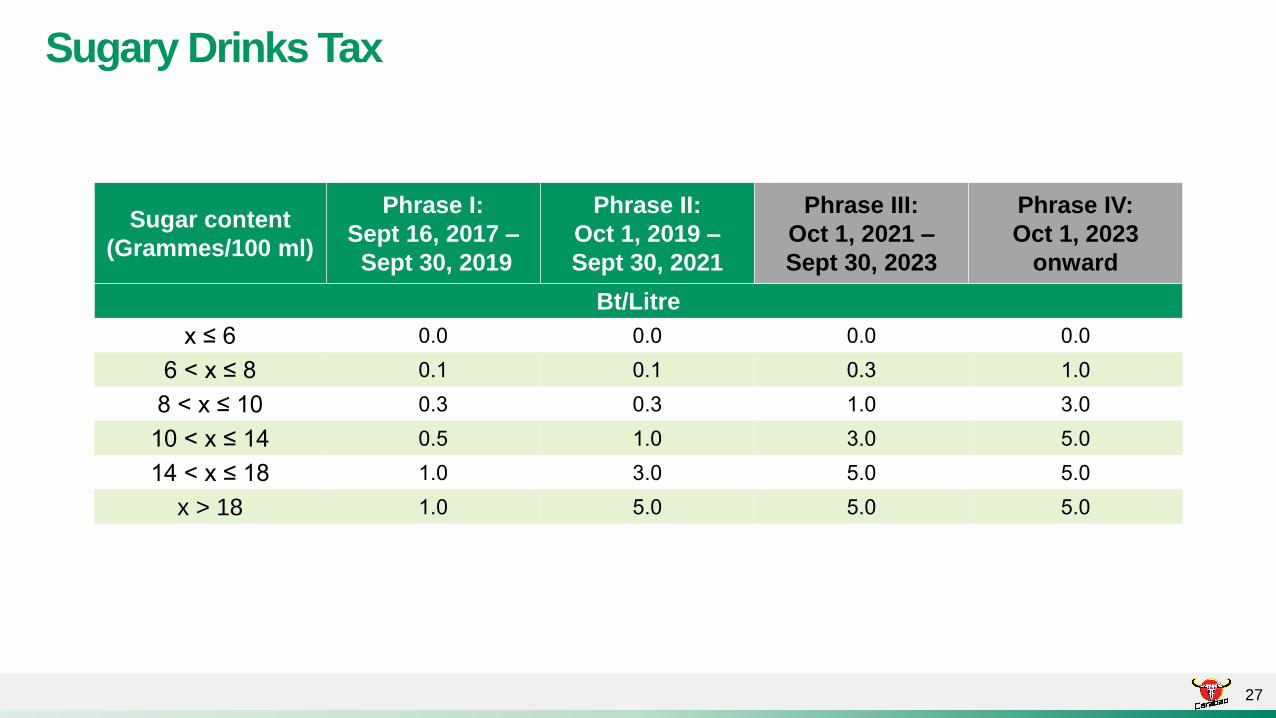
Sugary Drinks Tax
27
Sugar content
(Grammes/100 ml)
Phrase I:
Sept 16, 2017 –
Sept 30, 2019
Phrase II:
Oct 1, 2019 –
Sept 30, 2021
Phrase III:
Oct 1, 2021 –
Sept 30, 2023
Phrase IV:
Oct 1, 2023
onward
Bt/Litre
x ≤ 0.0 0.0 0.0 0.0
< x ≤ 0.1 0.1 0. 1.0
< x ≤ 10 0. 0. 1.0 .0
10 < x ≤ 14 0. 1.0 .0 .0
14 < x ≤ 1 1.0 .0 .0 .0
x > 18 1.0 .0 .0 .0
21.1%21.5% 21.7%
23.6%24.2%
23.2%22.6%
21.4%21.0%
2Q21
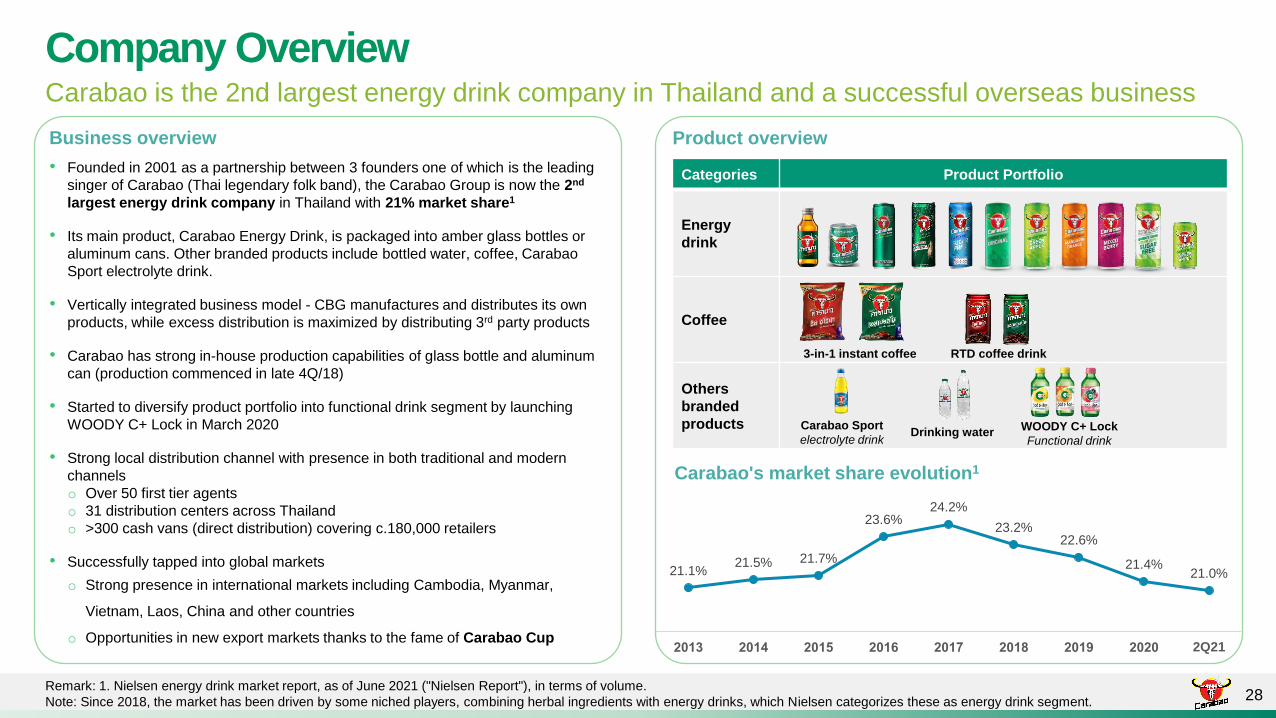
Company Overview
28
• Founded in 2001 as a partnership between 3 founders one of which is the leading
singer of Carabao (Thai legendary folk band), the Carabao Group is now the 2nd
largest energy drink company in Thailand with 21% market share1
• Its main product, Carabao Energy Drink, is packaged into amber glass bottles or
aluminum cans. Other branded products include bottled water, coffee, Carabao
Sport electrolyte drink.
• Vertically integrated business model - CBG manufactures and distributes its own
products, while excess distribution is maximized by distributing 3rd party products
• Carabao has strong in-house production capabilities of glass bottle and aluminum
can (production commenced in late 4Q/18)
• Started to diversify product portfolio into functional drink segment by launching
WOODY C+ Lock in March 2020
• Strong local distribution channel with presence in both traditional and modern
channels
o Over 50 first tier agents
o 31 distribution centers across Thailand
o >300 cash vans (direct distribution) covering c.180,000 retailers
• Successfully tapped into global markets
o Strong presence in international markets including Cambodia, Myanmar,
Vietnam, Laos, China and other countries
o Opportunities in new export markets thanks to the fame of Carabao Cup
Carabao is the 2nd largest energy drink company in Thailand and a successful overseas business
Remark: 1. Nielsen energy drink market report, as of June 2021 ("Nielsen Report"), in terms of volume.
Note: Since 2018, the market has been driven by some niched players, combining herbal ingredients with energy drinks, which Nielsen categorizes these as energy drink segment.
Business overview Product overview
Categories Product Portfolio
Energy
drink
Coffee
Others
branded
products
3-in-1 instant coffee RTD coffee drink
Carabao Sport
electrolyte drinkDrinking water
WOODY C+ Lock
Functional drink
Carabao's market share evolution1
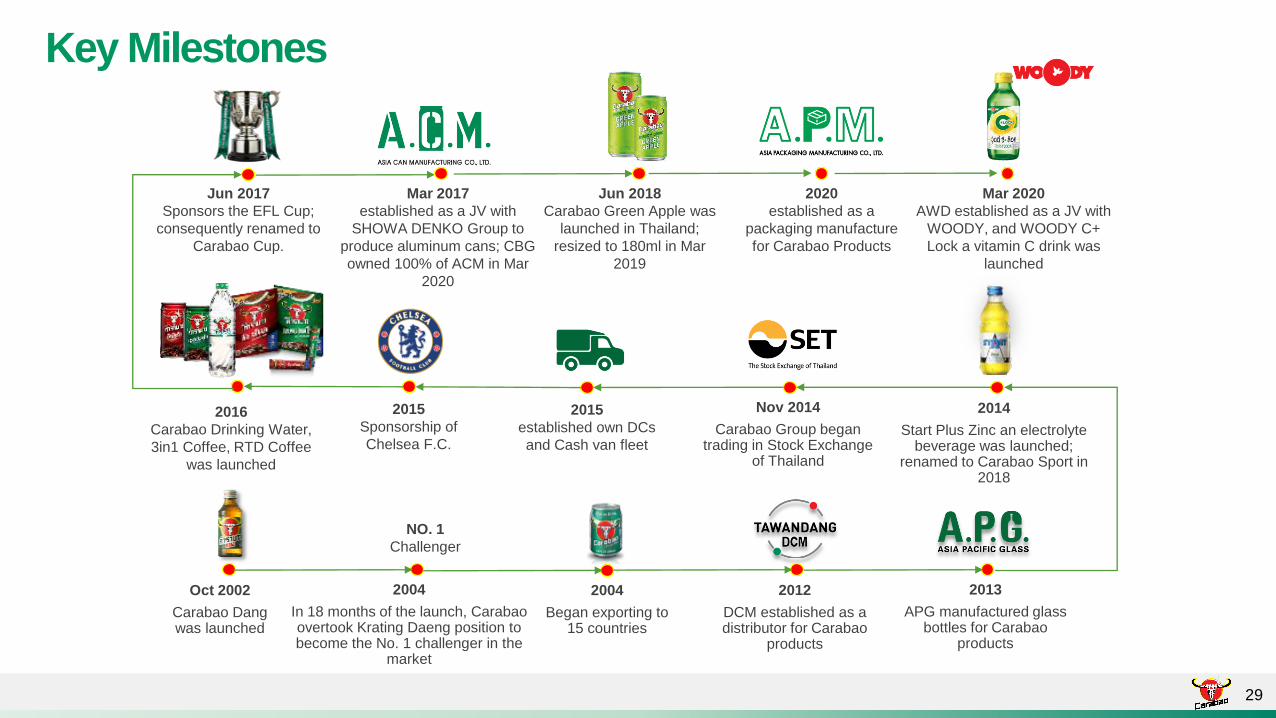
Key Milestones
29
NO. 1
Challenger
2004
Began exporting to 15 countries
Oct 2002
Carabao Dang was launched
2012
DCM established as a distributor for Carabao
products
2013
APG manufactured glass bottles for Carabao
products
2004
In 18 months of the launch, Carabao overtook Krating Daeng position to become the No. 1 challenger in the
market
2014
Start Plus Zinc an electrolyte beverage was launched;
renamed to Carabao Sport in 2018
Nov 2014
Carabao Group began trading in Stock Exchange
of Thailand
2015
established own DCs
and Cash van fleet
2016
Carabao Drinking Water,
3in1 Coffee, RTD Coffee
was launched
2015
Sponsorship of
Chelsea F.C.
Jun 2017
Sponsors the EFL Cup;
consequently renamed to
Carabao Cup.
Mar 2017
established as a JV with
SHOWA DENKO Group to
produce aluminum cans; CBG
owned 100% of ACM in Mar
2020
Jun 2018
Carabao Green Apple was
launched in Thailand;
resized to 180ml in Mar
2019
2020
established as a
packaging manufacture
for Carabao Products
Mar 2020
AWD established as a JV with
WOODY, and WOODY C+
Lock a vitamin C drink was
launched
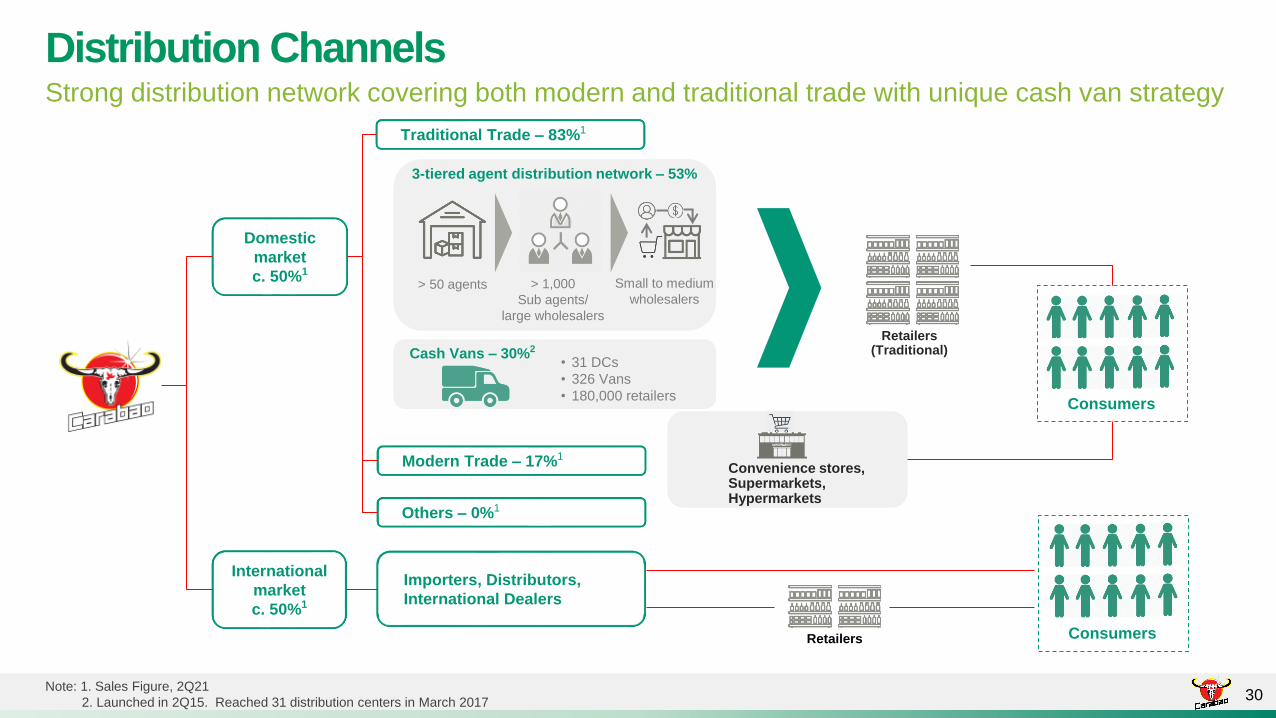
Distribution ChannelsStrong distribution network covering both modern and traditional trade with unique cash van strategy
30Note: 1. Sales Figure, 2Q21
2. Launched in 2Q15. Reached 31 distribution centers in March 2017
Domestic
market
c. 50%1
Traditional Trade – 83%1
Modern Trade – 17%1
Importers, Distributors,
International Dealers
> 50 agents > 1,000
Sub agents/
large wholesalers
Cash Vans – 30%2
3-tiered agent distribution network – 53%
• 31 DCs
• 326 Vans
• 180,000 retailers
International
market
c. 50%1
Retailers (Traditional)
Retailers
Small to medium
wholesalers
Convenience stores, Supermarkets, Hypermarkets
Others – 0%1
Consumers
Consumers
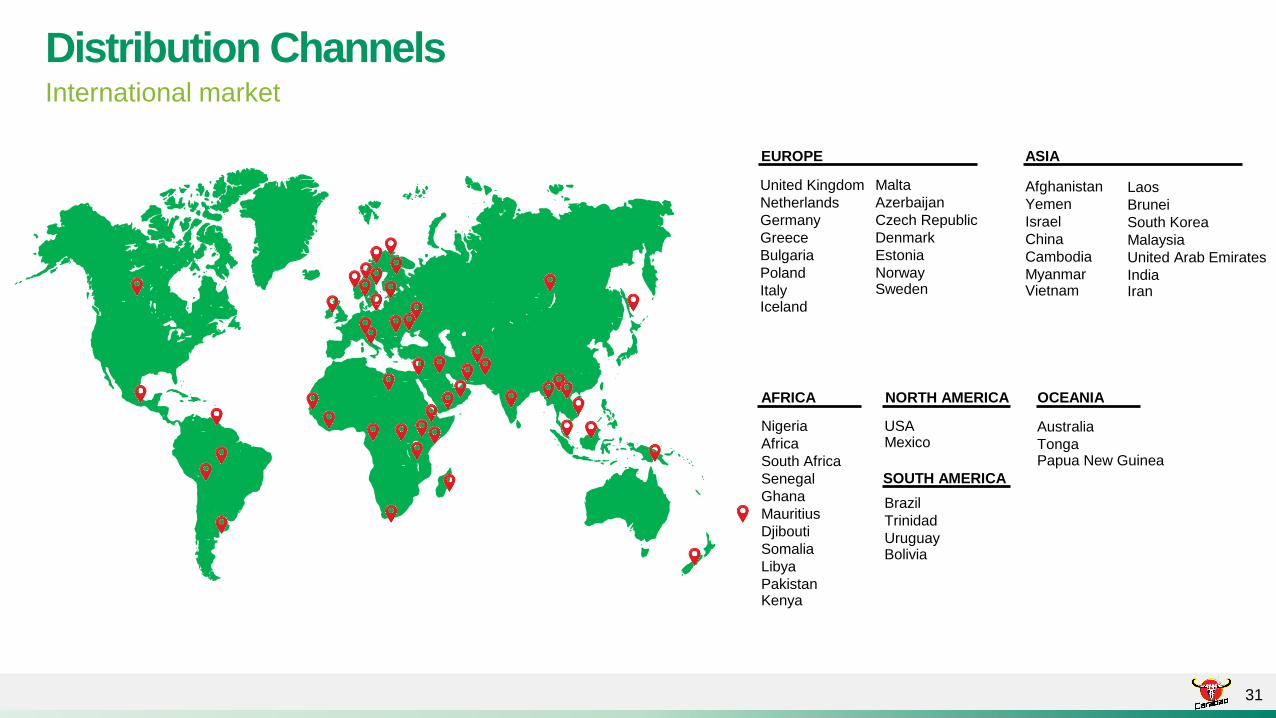
Distribution ChannelsInternational market
31
EUROPE
United Kingdom
Netherlands
Germany
Greece
Bulgaria
Poland
ItalyIceland
Malta
Azerbaijan
Czech Republic
Denmark
Estonia
NorwaySweden
AFRICA
Nigeria
Africa
South Africa
Senegal
Ghana
Mauritius
Djibouti
Somalia
Libya
PakistanKenya
NORTH AMERICA
USAMexico
SOUTH AMERICA
Brazil
Trinidad
UruguayBolivia
ASIA
Afghanistan
Yemen
Israel
China
Cambodia
MyanmarVietnam
Laos
Brunei
South Korea
Malaysia
United Arab Emirates
IndiaIran
OCEANIA
Australia
TongaPapua New Guinea
• On-ground marketing
• More than 80
BaoDang Girl Teams,
consisting of c.600
members, promote
social activities
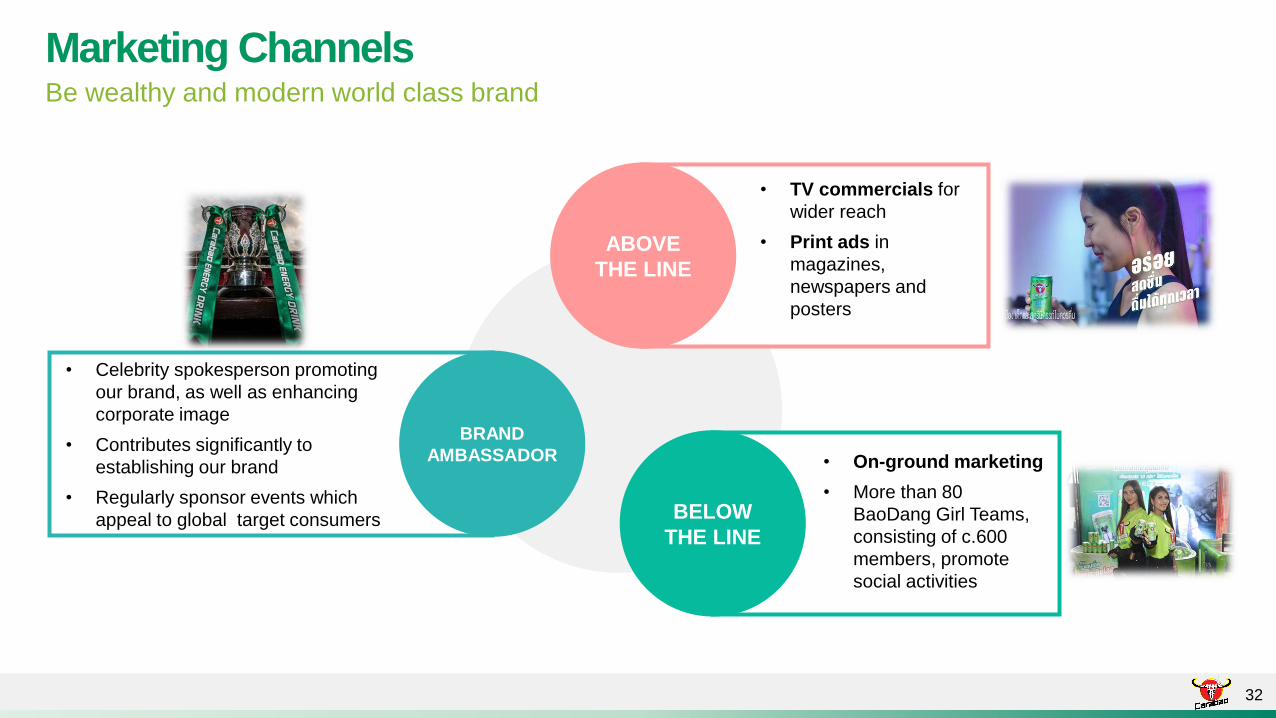
Marketing ChannelsBe wealthy and modern world class brand
32
ABOVE
THE LINE
BELOW
THE LINE
BRAND
AMBASSADOR
• TV commercials for
wider reach
• Print ads in
magazines,
newspapers and
posters
• Celebrity spokesperson promoting
our brand, as well as enhancing
corporate image
• Contributes significantly to
establishing our brand
• Regularly sponsor events which
appeal to global target consumers
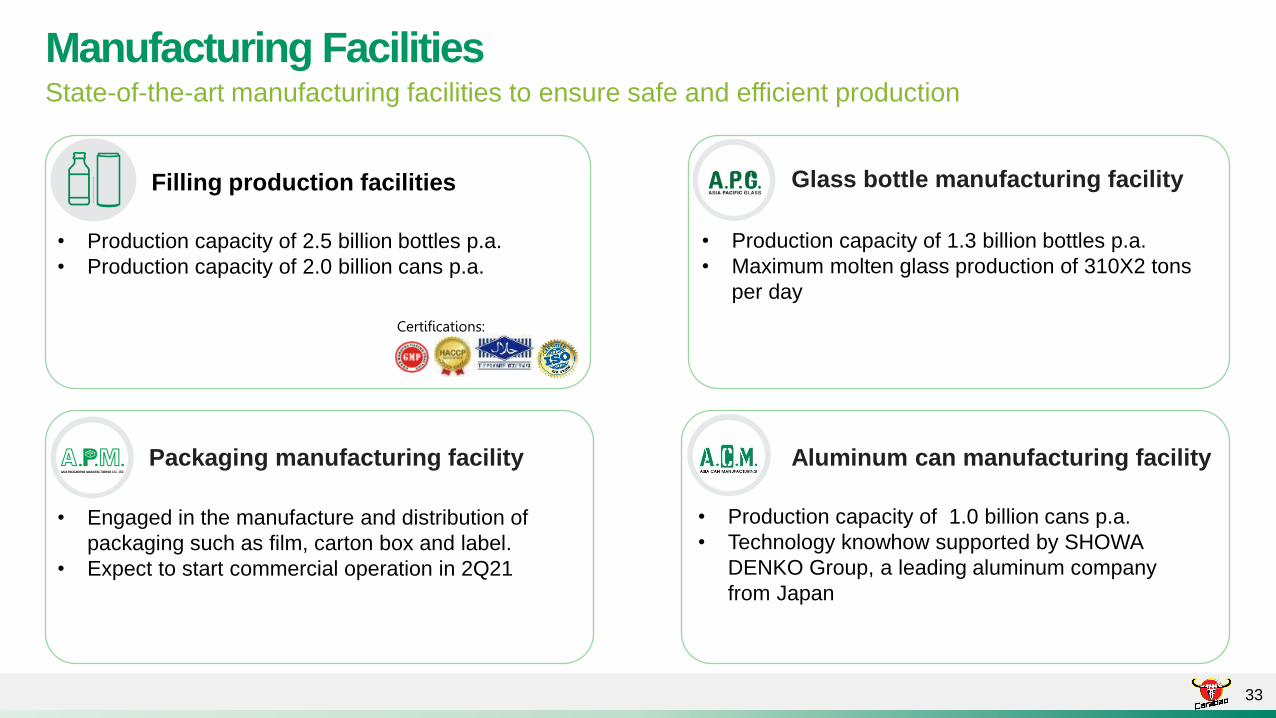
Manufacturing Facilities State-of-the-art manufacturing facilities to ensure safe and efficient production
33
Packaging manufacturing facility
Glass bottle manufacturing facilityFilling production facilities
• Engaged in the manufacture and distribution of
packaging such as film, carton box and label.
• Expect to start commercial operation in 2Q21
• Production capacity of 1.0 billion cans p.a.
• Technology knowhow supported by SHOWA
DENKO Group, a leading aluminum company
from Japan
• Production capacity of 2.5 billion bottles p.a.
• Production capacity of 2.0 billion cans p.a.
• Production capacity of 1.3 billion bottles p.a.
• Maximum molten glass production of 310X2 tons
per day
Aluminum can manufacturing facility
Certifications:
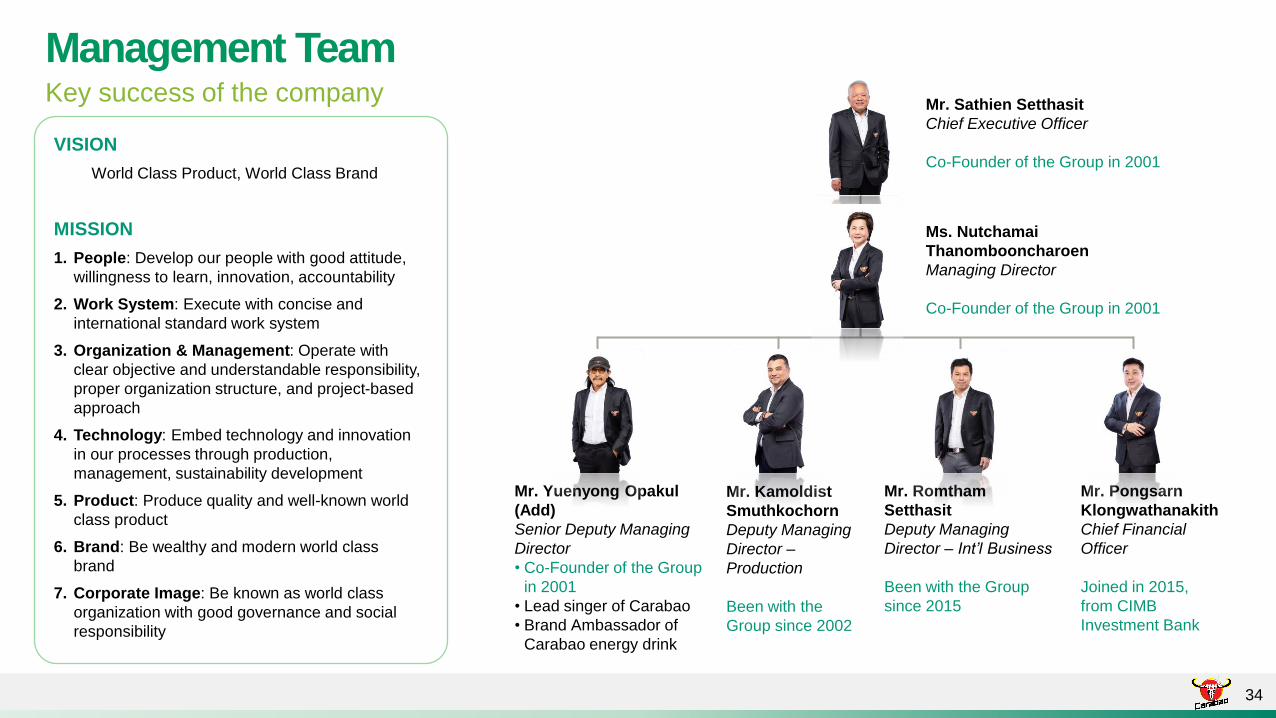
Management TeamKey success of the company
34
VISION
World Class Product, World Class Brand
MISSION
1. People: Develop our people with good attitude,
willingness to learn, innovation, accountability
2. Work System: Execute with concise and
international standard work system
3. Organization & Management: Operate with
clear objective and understandable responsibility,
proper organization structure, and project-based
approach
4. Technology: Embed technology and innovation
in our processes through production,
management, sustainability development
5. Product: Produce quality and well-known world
class product
6. Brand: Be wealthy and modern world class
brand
7. Corporate Image: Be known as world class
organization with good governance and social
responsibility
Mr. Sathien Setthasit
Chief Executive Officer
Co-Founder of the Group in 2001
Ms. Nutchamai
Thanombooncharoen
Managing Director
Co-Founder of the Group in 2001
Mr. Yuenyong Opakul
(Add)
Senior Deputy Managing
Director
• Co-Founder of the Group
in 2001
• Lead singer of Carabao
• Brand Ambassador of
Carabao energy drink
Mr. Kamoldist
Smuthkochorn
Deputy Managing
Director –
Production
Been with the
Group since 2002
Mr. Pongsarn
Klongwathanakith
Chief Financial
Officer
Joined in 2015,
from CIMB
Investment Bank
Mr. Romtham
Setthasit
Deputy Managing
Director – Int’l Business
Been with the Group
since 2015
Brand RecognitionCarabao is Thailand’s legendary music-for-life & one of the most respected band in Thailand
35
36
Carabao Group Public Co., Ltd.
+66 2636 6111 Ext. 882
www.carabaogroup.com/en
393, 393 Silom Building 7th - 10th floor,Silom Road Silom,Bangrak, Bangkok 10500Thailand
Investor Relations


