PNNL-29771 Prepared for the U.S. Department of Energy under Contract DE-AC05-76RL01830 Carbide Particle Redistribution in U-10Mo Alloy during Hot and Cold Rolling Processes Synthetic Microstructure-Based Finite-Element Approach December 2019 KS Choi C Lavender C Wang VV Joshi WE Frazier
Transcript
PNNL-29771
Prepared for the U.S. Department of Energy under Contract DE-AC05-76RL01830
Carbide Particle Redistribution in U-10Mo Alloy during Hot and Cold Rolling Processes Synthetic Microstructure-Based Finite-Element Approach
December 2019
KS Choi C Lavender C Wang VV Joshi WE Frazier
PNNL-29771
Carbide Particle Redistribution in U-10Mo Alloy during Hot and Cold Rolling Processes Synthetic Microstructure-Based Finite-Element Approach KS Choi C Lavender C Wang VV Joshi WE Frazier December 2019 Prepared for the U.S. Department of Energy under Contract DE-AC05-76RL01830 Pacific Northwest National Laboratory Richland, Washington 99354
iii
Summary
The influence of initial carbide particle distribution features on particle fracture and the evolution of stringer distribution within an alloy of uranium with 10 weight percent molybdenum during cold rolling was investigated in this study. This work will provide guidance to casting optimization work and identify actionable process changes to eliminate the surface features directly attributed to carbides. In a previous study, various synthetic microstructure-based finite-element (FE) models were generated with consideration of different parameters (i.e., particle shape, particle volume fraction, and particle distribution), and used to examine the effects of hot rolling on the microstructure evolution. In this study, microstructures after ~80% hot rolling were used as the initial microstructures for the subsequent cold rolling simulation. Plane-strain compression loading was employed in the FE models to simulate cold rolling with reductions from ~80% to ~94%. Stringer analyses with the consideration of particle fracture were then performed with the simulated cold rolling results.
The results of void evolution analyses show that microstructures with elliptical particles incorporate a much larger (almost double) void volume fraction than those with circular particles, indicating that the elliptical particles are fractured more easily than the circular ones. The results from the fracture mode analyses show that, under the adopted simple compression loading assumption, almost all the particles (i.e., >99%) were fractured by tensile separation. The results of stringer analyses show that, during cold rolling, the stringer volume fractions increase substantially due to the particle fracture, especially for the microstructures with the elliptical particles, and that the stringer volume fractions from stringers comprising many particles tend to increase faster. The maximum stringer lengths for the microstructures with circular particles tend to remain constant or decrease during cold rolling, whereas those for elliptical particles tend to slightly increase after a slight decrease. The number of particles at the surface increases very rapidly due to particle fracture during cold rolling.
v
Acknowledgments
This work was supported by the U.S. Department of Energy’s National Nuclear Security Administration. The authors would like to acknowledge Drs. Xiaohua Hu and Guang Cheng, who were previously Pacific Northwest National Laboratory staff members, for their preliminary contributions to this work.
vii
Acronyms and Abbreviations
FE finite element LEU low-enriched uranium PVF particle volume fraction SEM scanning electron microscopy SVF stringer volume fraction U10Mo uranium alloy with ten weight percent molybdenum (22 atomic percent Mo) VVF void volume fraction wt% weight percent
ix
Contents
Summary ...................................................................................................................................................... iii Acknowledgments ......................................................................................................................................... v Acronyms and Abbreviations ..................................................................................................................... vii 1.0 Introduction .......................................................................................................................................... 1 2.0 Finite-Element Modeling ...................................................................................................................... 2
2.1 Model Description ........................................................................................................................ 2 2.2 Synthetic Microstructure-Based Models ...................................................................................... 4 2.3 Hot Rolling Simulation ................................................................................................................ 7 2.4 Cold Rolling Simulation............................................................................................................... 9
2.4.1 Void Volume Fractions after Cold Rolling ....................................................................... 9 2.4.2 Fracture Criterion for Carbide Particles .......................................................................... 11 2.4.3 Determination of Material Parameters ............................................................................ 13
3.0 Results and Discussion ....................................................................................................................... 15 3.1 Evolution of Void Volume Fraction during Cold Rolling.......................................................... 15 3.2 Evolution of Stringers during Cold Rolling ............................................................................... 17
3.2.1 Definition of Stringers and Stringer Volume Fraction .................................................... 17 3.2.2 Stringer Volume Fraction during Hot/Cold Rolling ........................................................ 20 3.2.3 Maximum Stringer Length during Hot/Cold Rolling ...................................................... 28
3.3 Evolution of Surface Particles during Hot/Cold Rolling ............................................................ 31 4.0 Conclusions ........................................................................................................................................ 34 5.0 References .......................................................................................................................................... 35
x
Figures
1 SEM images showing the initial cast, homogenized microstructures of three samples ........................ 2 2 Particle fractures that occurred during the rolling process.................................................................... 3 3 Measured particle size distributions in the three samples compared to a log-normal distribution ....... 3 4 Examples of synthetic microstructures with random particle distributions .......................................... 5 5 Examples of synthetic microstructures with particles distributed along grain boundaries ................... 6 6 Particle distributions in the example models ........................................................................................ 8 7 SEM images of two cold-rolled U10Mo samples and the corresponding processed images showing
carbide particles with voided area ....................................................................................................... 10 8 Schematics of two different fracture modes in the 2D version of Griffith’s brittle fracture criterion 12 9 Representation of particle fracture and the corresponding voided area .............................................. 12 10 Flow curves used for matrix and particles in U10Mo samples for cold rolling simulations .............. 14 11 VVF evolution due to particle fracture during cold rolling simulations for microstructures with
elliptical particles along grain boundaries and different PVFs ........................................................... 14 12 Evolution of VVFs during cold rolling ............................................................................................... 16 13 A sketch showing the approximation of particles using ellipses and a sketch of stringer identification
criteria used in this study .................................................................................................................... 18 14 Microstructure and stringer distributions of a 2.0% PVF model with random distribution of elliptical
particles after 40% hot and cold rolling .............................................................................................. 19 15 SVFs for random particle distributions ............................................................................................... 22 16 SVFs for particle distributions along grain boundaries ...................................................................... 23 17 Comparison of SVFs during hot and cold rolling for random particle distributions .......................... 24 18 Comparison of SVFs during hot and cold rolling for particle distributions along grain boundaries .. 25 19 SVFs based on many-particle stringers for random particle distributions .......................................... 26 20 SVFs based on many-particle stringers for particle distribution along grain boundaries ................... 27 21 Maximum stringer length for random particle distributions ............................................................... 29 22 Maximum stringer length for particle distribution along grain boundaries ........................................ 30 23 Number of particles on the surface during rolling .............................................................................. 32 24 Comparison of numbers of particles on the surface during hot and cold rolling ................................ 33
xi
Tables
1 Parameters for synthetic microstructure-based models ........................................................................ 3 2 Measured PVF and VVF of two cold-rolled U10Mo samples .............................................................. 9
1
1.0 Introduction
Since the 1980s, the U.S. Department of Energy’s United States High Performance Research Reactor Conversion Program has investigated low-enriched uranium (LEU) as an alternative to highly enriched uranium. Because of its high density and favorable performance during fabrication and irradiation, uranium alloyed with 10 weight percent (wt%) molybdenum (U-10Mo) has been identified as the most promising candidate LEU fuel (Snelgrove et al. 1997; Meyer et al. 2002; Burkes et al. 2010). U-10Mo alloy fabrication involves a complex series of material processing steps, including casting, homogenization, hot roll bonding of a zirconium interlayer, cold rolling, annealing, and hot isostatic pressing (Sease et al. 2007). Various analysis and modeling methods have been developed for many of these individual processes (Devaraj et al. 2016; Xu et al. 2016; Jana et al. 2017; Soulami et al. 2017).
Generally, the as-cast U10Mo alloys include second-phase carbide particles in the matrix. Hot rolling and cold rolling are then performed to reduce the thickness of as-cast alloys, improve their strength, and optimize their microstructures. During such processing, the particles in the initial microstructures are likely to align along the rolling direction and form clustered particles, or stringers (Snelgrove et al. 1997; Meyer et al. 2002; Burkes et al. 2010). The stringers or stringer-type particle clusters provide a possible propagation path for cracks or fractures, which reduce the material’s resistance to damage (Hannard et al. 2017; Cheng et al. 2018).
Hu et al. (Hu et al. 2009; Hu et al. 2010; Hu et al. 2011) studied the correlation between particle volume fraction (PVF), stringer volume fraction (SVF), and stringer length in aluminum alloys by generating microstructure-based finite-element (FE) models, and they elucidated the effects of stringers on the local fracture strain. Recently, Cheng et al. (Cheng et al. 2018) investigated the effect of secondary carbide particles and stringers on the microstructural evolution of U10Mo alloys after rolling and recrystallization using actual microstructure-based FE models. Six material samples were selected for their study, which may not provide enough information on the influence of particle distribution features on the microstructural evolution during rolling.
As presented in Cheng et al. (Cheng et al. 2018), the particle sizes, distribution, and volume fractions in U10Mo alloys can be quite different depending on their thermomechanical processing, and the final carbide particle distributions can have direct effects on the fuel performance. It is therefore important to control the particle behavior in the initial microstructures to obtain the desired material performance after hot rolling (Allison et al. 2006; Nyberg et al. 2013; Joshi et al. 2015a; Joshi et al. 2015b; Hu et al. 2016). This requires fundamental understanding of the general influence of initial microstructural features on the microstructural evolution during subsequent fabrication processes.
In a previous report (Choi et al. 2018), the influence of initial carbide particle distribution features on the evolution of particle and stringer distribution within a U10Mo alloy during hot rolling was investigated using synthetic microstructure-based FE models. In the current report, cold rolling is subsequently applied to the resulting microstructures after hot rolling in order to examine the effects of initial microstructural features on the final microstructures after the entire hot/cold rolling process, with consideration of carbide particle fracture. For this purpose, a 2D version of Griffith’s fracture criterion was first selected to describe the brittle fracture of carbide particles during cold rolling. Material parameters were then calibrated based on comparison of the results of simulation and experiment. The plane-strain compression loading condition was employed to simulate the cold rolling process. Stringer statistics analyses were then performed on the simulated results of cold rolling. SVFs and maximum stringer lengths during cold rolling were compared among the models with different initial microstructural features. Evolution of surface particle distributions during cold rolling were also examined. Finally, conclusions based on the results of these investigations were made.
2
2.0 Finite-Element Modeling
2.1 Model Description
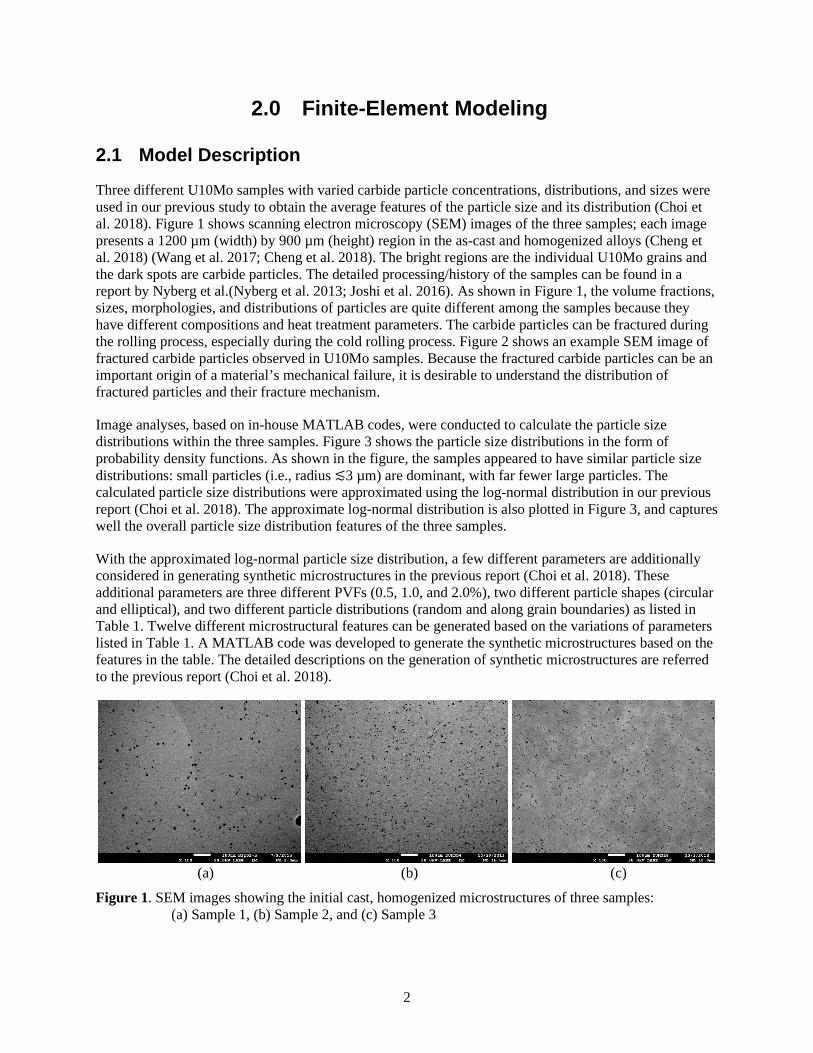
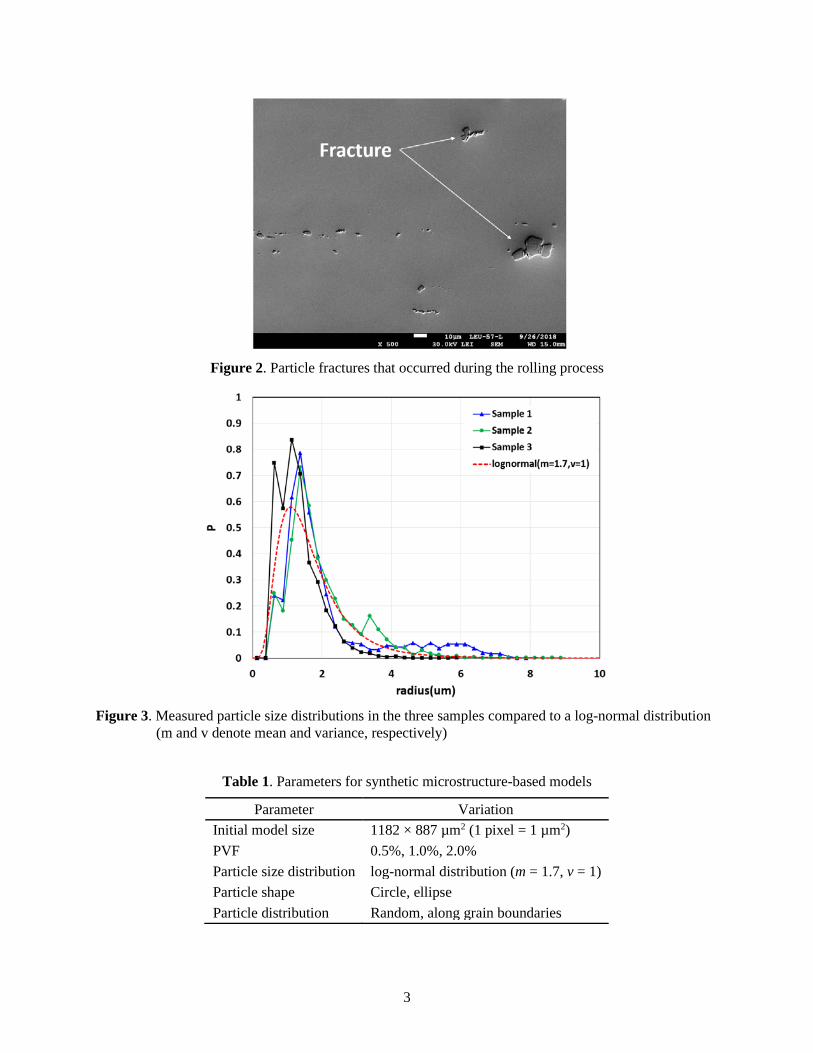
Three different U10Mo samples with varied carbide particle concentrations, distributions, and sizes were used in our previous study to obtain the average features of the particle size and its distribution (Choi et al. 2018). Figure 1 shows scanning electron microscopy (SEM) images of the three samples; each image presents a 1200 µm (width) by 900 µm (height) region in the as-cast and homogenized alloys (Cheng et al. 2018) (Wang et al. 2017; Cheng et al. 2018). The bright regions are the individual U10Mo grains and the dark spots are carbide particles. The detailed processing/history of the samples can be found in a report by Nyberg et al.(Nyberg et al. 2013; Joshi et al. 2016). As shown in Figure 1, the volume fractions, sizes, morphologies, and distributions of particles are quite different among the samples because they have different compositions and heat treatment parameters. The carbide particles can be fractured during the rolling process, especially during the cold rolling process. Figure 2 shows an example SEM image of fractured carbide particles observed in U10Mo samples. Because the fractured carbide particles can be an important origin of a material’s mechanical failure, it is desirable to understand the distribution of fractured particles and their fracture mechanism.
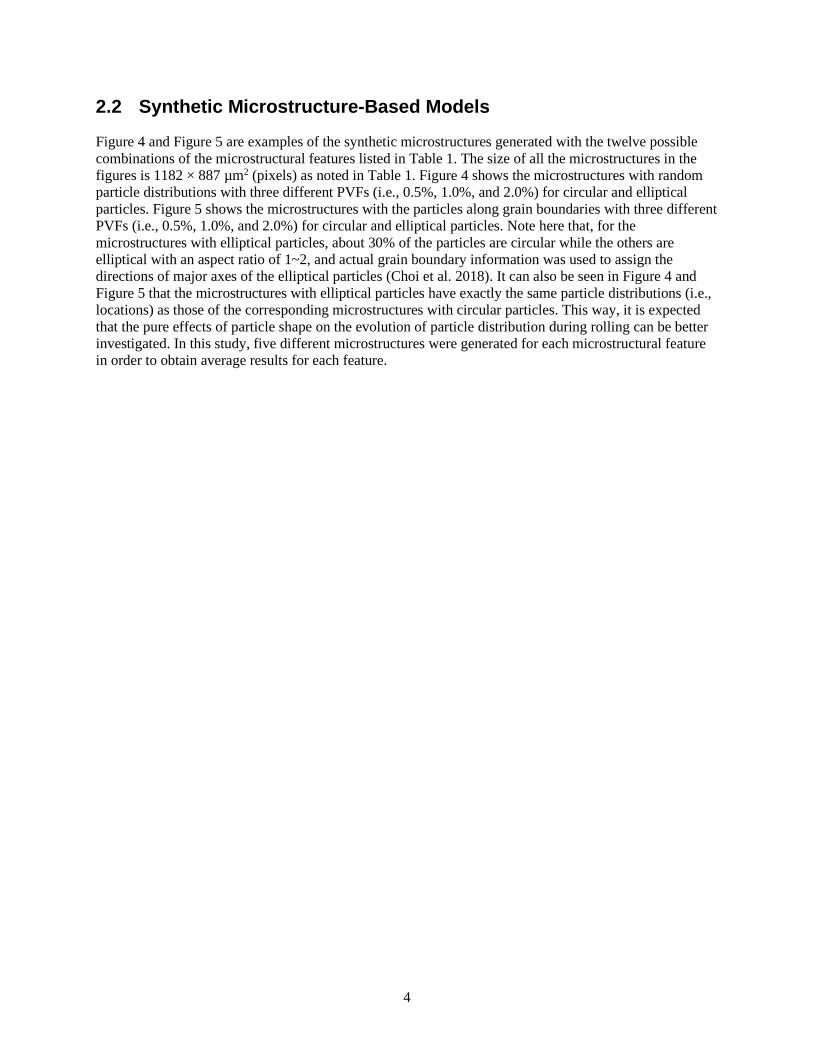
Image analyses, based on in-house MATLAB codes, were conducted to calculate the particle size distributions within the three samples. Figure 3 shows the particle size distributions in the form of probability density functions. As shown in the figure, the samples appeared to have similar particle size distributions: small particles (i.e., radius ≲3 µm) are dominant, with far fewer large particles. The calculated particle size distributions were approximated using the log-normal distribution in our previous report (Choi et al. 2018). The approximate log-normal distribution is also plotted in Figure 3, and captures well the overall particle size distribution features of the three samples.
With the approximated log-normal particle size distribution, a few different parameters are additionally considered in generating synthetic microstructures in the previous report (Choi et al. 2018). These additional parameters are three different PVFs (0.5, 1.0, and 2.0%), two different particle shapes (circular and elliptical), and two different particle distributions (random and along grain boundaries) as listed in Table 1. Twelve different microstructural features can be generated based on the variations of parameters listed in Table 1. A MATLAB code was developed to generate the synthetic microstructures based on the features in the table. The detailed descriptions on the generation of synthetic microstructures are referred to the previous report (Choi et al. 2018).
(a) (b) (c)
Figure 1. SEM images showing the initial cast, homogenized microstructures of three samples: (a) Sample 1, (b) Sample 2, and (c) Sample 3
3
Figure 2. Particle fractures that occurred during the rolling process
Figure 3. Measured particle size distributions in the three samples compared to a log-normal distribution
(m and v denote mean and variance, respectively)
Table 1. Parameters for synthetic microstructure-based models
Parameter Variation Initial model size 1182 × 887 µm2 (1 pixel = 1 µm2) PVF 0.5%, 1.0%, 2.0% Particle size distribution log-normal distribution (m = 1.7, v = 1) Particle shape Circle, ellipse Particle distribution Random, along grain boundaries
4
2.2 Synthetic Microstructure-Based Models
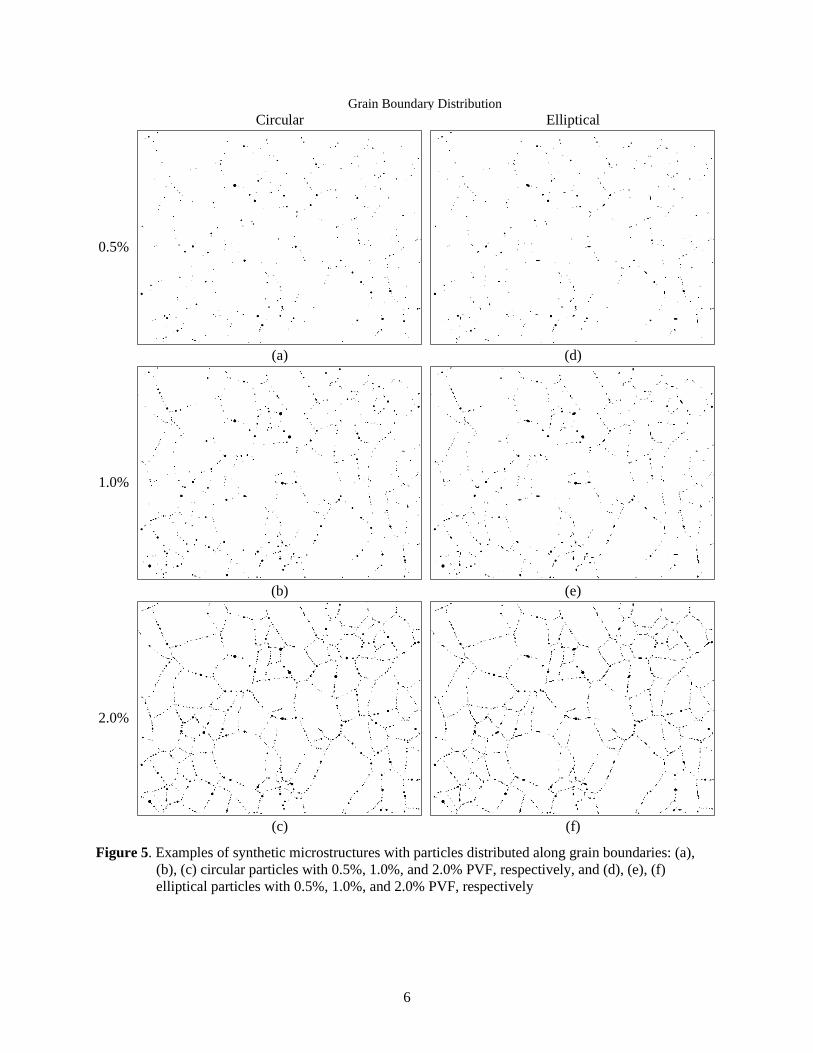
Figure 4 and Figure 5 are examples of the synthetic microstructures generated with the twelve possible combinations of the microstructural features listed in Table 1. The size of all the microstructures in the figures is 1182 × 887 µm2 (pixels) as noted in Table 1. Figure 4 shows the microstructures with random particle distributions with three different PVFs (i.e., 0.5%, 1.0%, and 2.0%) for circular and elliptical particles. Figure 5 shows the microstructures with the particles along grain boundaries with three different PVFs (i.e., 0.5%, 1.0%, and 2.0%) for circular and elliptical particles. Note here that, for the microstructures with elliptical particles, about 30% of the particles are circular while the others are elliptical with an aspect ratio of 1~2, and actual grain boundary information was used to assign the directions of major axes of the elliptical particles (Choi et al. 2018). It can also be seen in Figure 4 and Figure 5 that the microstructures with elliptical particles have exactly the same particle distributions (i.e., locations) as those of the corresponding microstructures with circular particles. This way, it is expected that the pure effects of particle shape on the evolution of particle distribution during rolling can be better investigated. In this study, five different microstructures were generated for each microstructural feature in order to obtain average results for each feature.
5
Random Distribution Circular Elliptical
0.5%
(a)
(d)
1.0%
(b)
(e)
2.0%
(c)
(f)
Figure 4. Examples of synthetic microstructures with random particle distributions: (a), (b), (c) circular particles with 0.5%, 1.0%, and 2.0% PVF, respectively, and (d), (e), (f) elliptical particles with 0.5%, 1.0%, and 2.0% PVF, respectively
6
Grain Boundary Distribution Circular Elliptical
0.5%
(a)
(d)
1.0%
(b)
(e)
2.0%
(c)
(f)
Figure 5. Examples of synthetic microstructures with particles distributed along grain boundaries: (a), (b), (c) circular particles with 0.5%, 1.0%, and 2.0% PVF, respectively, and (d), (e), (f) elliptical particles with 0.5%, 1.0%, and 2.0% PVF, respectively
7
2.3 Hot Rolling Simulation
In the previous report (Choi et al. 2018), simulations for two-step hot rolling reductions (i.e., 40% and 80%) were conducted using a simple 2D plane-strain compression loading condition to investigate the evolution of particle distribution during multi-pass hot rolling of annealed U10Mo coupons. All the generated microstructures shown in Figure 4 and Figure 5 were converted to plane-strain FE models. Here, each 1 µm × 1 µm pixel in a microstructure image was represented by one element in the FE models. The commercial FE code ABAQUS/Explicit was used for the simulations. The detailed procedures for two-step hot rolling simulations including the material property information can be found in the earlier report (Choi et al. 2018).
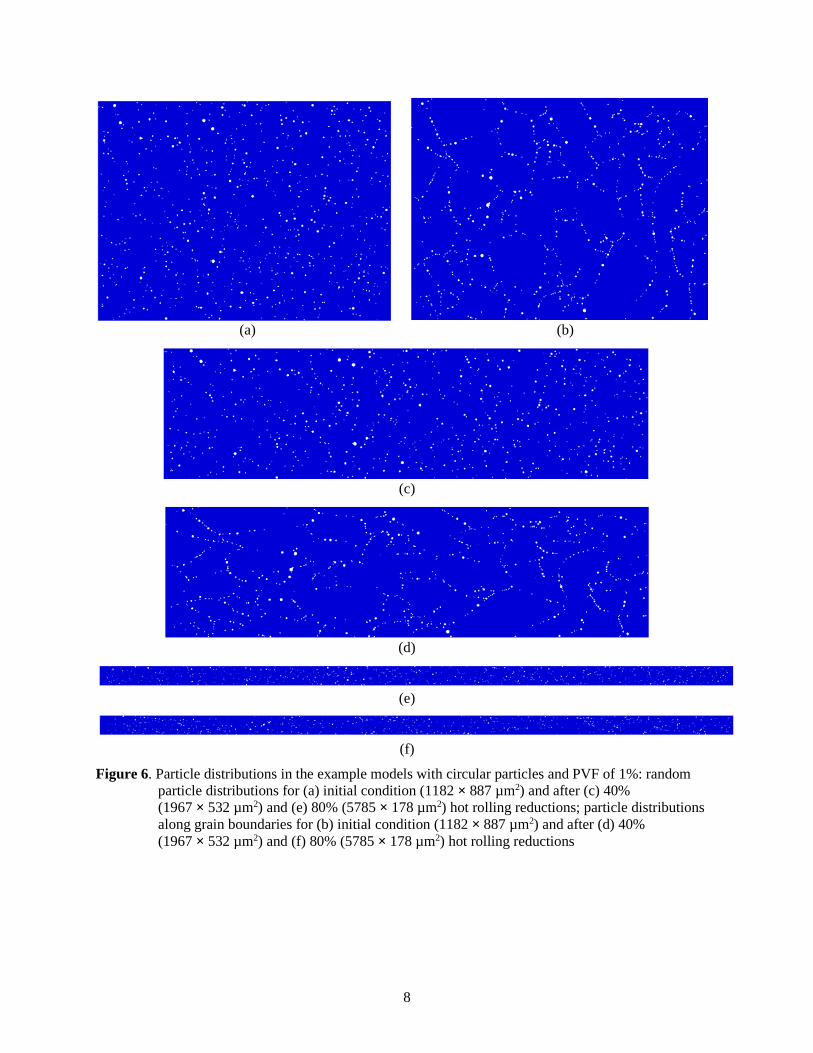
Figure 6 shows the particle distributions after each rolling process in example models with circular particles and 1% PVF for random particle distribution and for particle distribution along grain boundaries. As shown in the figure, with progressive rolling reduction, the carbide particles redistribute and tend to align as stringers along the rolling direction. Note here that carbide particle fracture was not considered for hot rolling simulations. Statistical analysis results of the particle distributions for different microstructures after 40~80% hot rolling reductions were reported in detail in the previous report (Choi et al. 2018).
8
(a) (b)
(c)
(d)
(e)
(f)
Figure 6. Particle distributions in the example models with circular particles and PVF of 1%: random particle distributions for (a) initial condition (1182 × 887 µm2) and after (c) 40% (1967 × 532 µm2) and (e) 80% (5785 × 178 µm2) hot rolling reductions; particle distributions along grain boundaries for (b) initial condition (1182 × 887 µm2) and after (d) 40% (1967 × 532 µm2) and (f) 80% (5785 × 178 µm2) hot rolling reductions
9
2.4 Cold Rolling Simulation
After hot rolling, cold rolling is also performed on U10Mo samples, down to 70~80% reduction (Choi et al. 2018). In order to investigate the redistributions and fractures of carbide particles during the combined hot and cold rolling reductions, the microstructures after hot rolling reduction need to be used as the initial microstructures for the subsequent cold rolling simulations. In this study, the resulting microstructures (~5785 × 178 µm2) after 80% hot rolling reductions (e.g., Figure 6(e),(f)) were remeshed using 1 × 1 µm2 elements for the cold rolling simulations. A 2D plane-strain compression loading condition was also applied to simulate the cold rolling reduction of U10Mo samples, including their carbide particle fractures. The same boundary conditions were applied as those used for hot rolling simulations, where a multipoint constraint was applied to keep the right and left edges of the model straight vertically during the compression (i.e., rolling) process. One-step simulations were performed on the initial microstructure after hot rolling down to 70% rolling reduction. The final dimensions of the 70% cold-rolled microstructure were ~18,500 × 53 µm2.
In the following subsections, the fracture criterion for the carbide particles and the determination of material parameters used in the cold rolling simulations are discussed.
2.4.1 Void Volume Fractions after Cold Rolling
Volume fractions (VVFs) of voids created by carbide particle fracture were first estimated in this study because the estimated void volume fraction (VVF) values are to be used for calibrating the material parameters of the fracture criterion used for carbide particles. Two cold-rolled U10Mo samples were selected for estimating VVF.
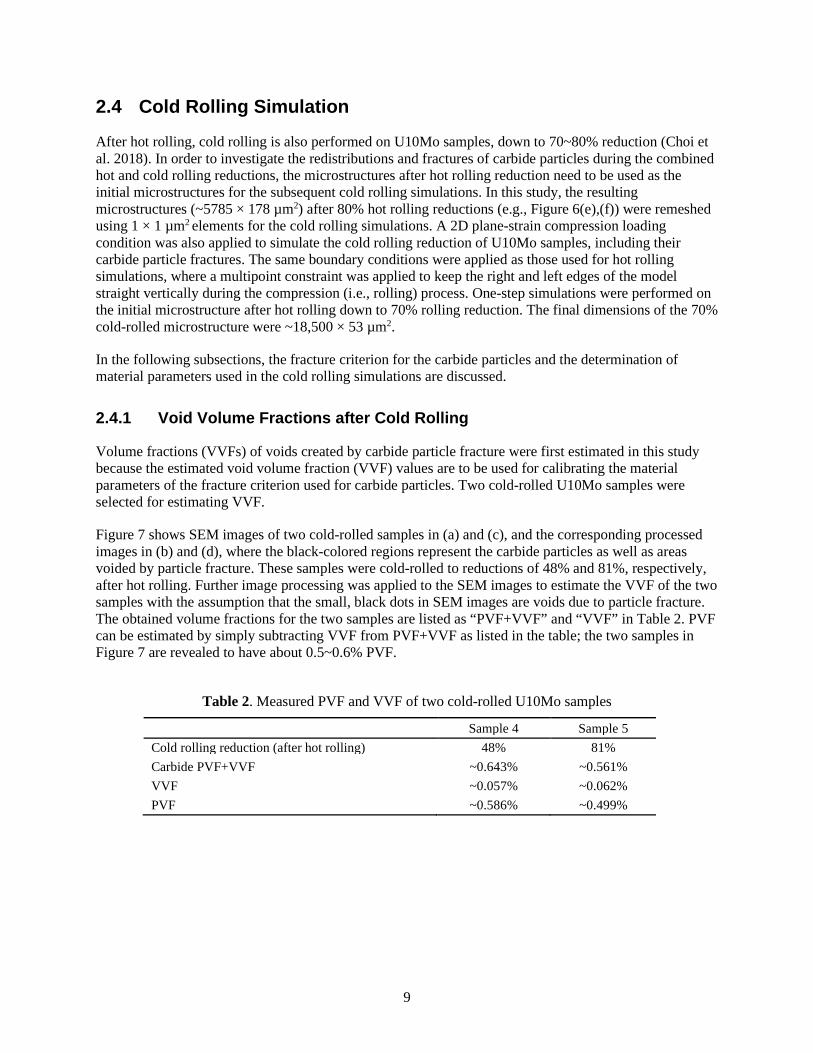
Figure 7 shows SEM images of two cold-rolled samples in (a) and (c), and the corresponding processed images in (b) and (d), where the black-colored regions represent the carbide particles as well as areas voided by particle fracture. These samples were cold-rolled to reductions of 48% and 81%, respectively, after hot rolling. Further image processing was applied to the SEM images to estimate the VVF of the two samples with the assumption that the small, black dots in SEM images are voids due to particle fracture. The obtained volume fractions for the two samples are listed as “PVF+VVF” and “VVF” in Table 2. PVF can be estimated by simply subtracting VVF from PVF+VVF as listed in the table; the two samples in Figure 7 are revealed to have about 0.5~0.6% PVF.
Table 2. Measured PVF and VVF of two cold-rolled U10Mo samples
Figure 7. SEM images of two cold-rolled U10Mo samples and the corresponding processed images showing carbide particles with voided area. (a), (b) Sample 4 (after 48% cold rolling reduction) and (c), (d) Sample 5 (after 81% cold rolling reduction)
11
2.4.2 Fracture Criterion for Carbide Particles
The fracture of brittle materials is mainly induced by the stresses that they are subject to. Two different stress-based brittle fracture criteria were tested in this study for their capability to describe the carbide particle fracture and the resulting VVF evolution with an increase of cold rolling reduction. One was the ABAQUS built-in tensile failure criterion in which the particle fracture depends on the hydrostatic tensile stress, and the other was a modified 2D version of Griffith’s brittle failure criterion (Jaeger 1970) in which the fracture depends on the combination of the maximum and minimum principal stresses. After testing the two failure criteria under various circumstances, the Griffith’s failure criterion was selected to describe the carbide particle fracture. This is because the results based on the Griffith’s criterion appear to be in better agreement with VVF evolution trend estimated in the previous section, and because the primary fracture mode can be tracked for each particle with this criterion, which is of interest as well.
Based on the 2D version of Griffith’s fracture criterion, a brittle material fractures when the following conditions are satisfied:
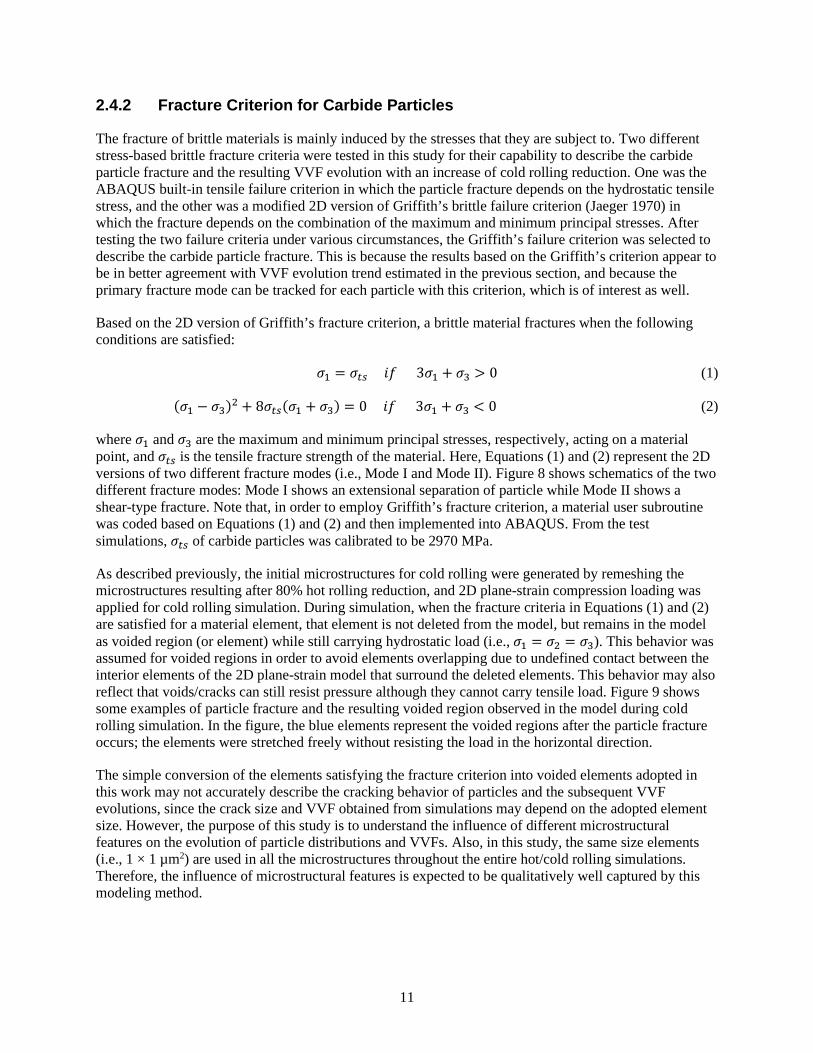
where 𝜎𝜎1 and 𝜎𝜎3 are the maximum and minimum principal stresses, respectively, acting on a material point, and 𝜎𝜎𝑡𝑡𝑡𝑡 is the tensile fracture strength of the material. Here, Equations (1) and (2) represent the 2D versions of two different fracture modes (i.e., Mode I and Mode II). Figure 8 shows schematics of the two different fracture modes: Mode I shows an extensional separation of particle while Mode II shows a shear-type fracture. Note that, in order to employ Griffith’s fracture criterion, a material user subroutine was coded based on Equations (1) and (2) and then implemented into ABAQUS. From the test simulations, 𝜎𝜎𝑡𝑡𝑡𝑡 of carbide particles was calibrated to be 2970 MPa.
As described previously, the initial microstructures for cold rolling were generated by remeshing the microstructures resulting after 80% hot rolling reduction, and 2D plane-strain compression loading was applied for cold rolling simulation. During simulation, when the fracture criteria in Equations (1) and (2) are satisfied for a material element, that element is not deleted from the model, but remains in the model as voided region (or element) while still carrying hydrostatic load (i.e., 𝜎𝜎1 = 𝜎𝜎2 = 𝜎𝜎3). This behavior was assumed for voided regions in order to avoid elements overlapping due to undefined contact between the interior elements of the 2D plane-strain model that surround the deleted elements. This behavior may also reflect that voids/cracks can still resist pressure although they cannot carry tensile load. Figure 9 shows some examples of particle fracture and the resulting voided region observed in the model during cold rolling simulation. In the figure, the blue elements represent the voided regions after the particle fracture occurs; the elements were stretched freely without resisting the load in the horizontal direction.
The simple conversion of the elements satisfying the fracture criterion into voided elements adopted in this work may not accurately describe the cracking behavior of particles and the subsequent VVF evolutions, since the crack size and VVF obtained from simulations may depend on the adopted element size. However, the purpose of this study is to understand the influence of different microstructural features on the evolution of particle distributions and VVFs. Also, in this study, the same size elements (i.e., 1 × 1 µm2) are used in all the microstructures throughout the entire hot/cold rolling simulations. Therefore, the influence of microstructural features is expected to be qualitatively well captured by this modeling method.
12
Figure 8. Schematics of two different fracture modes in the 2D version of Griffith’s brittle fracture
criterion
Figure 9. Representation of particle fracture and the corresponding voided area
13
2.4.3 Determination of Material Parameters
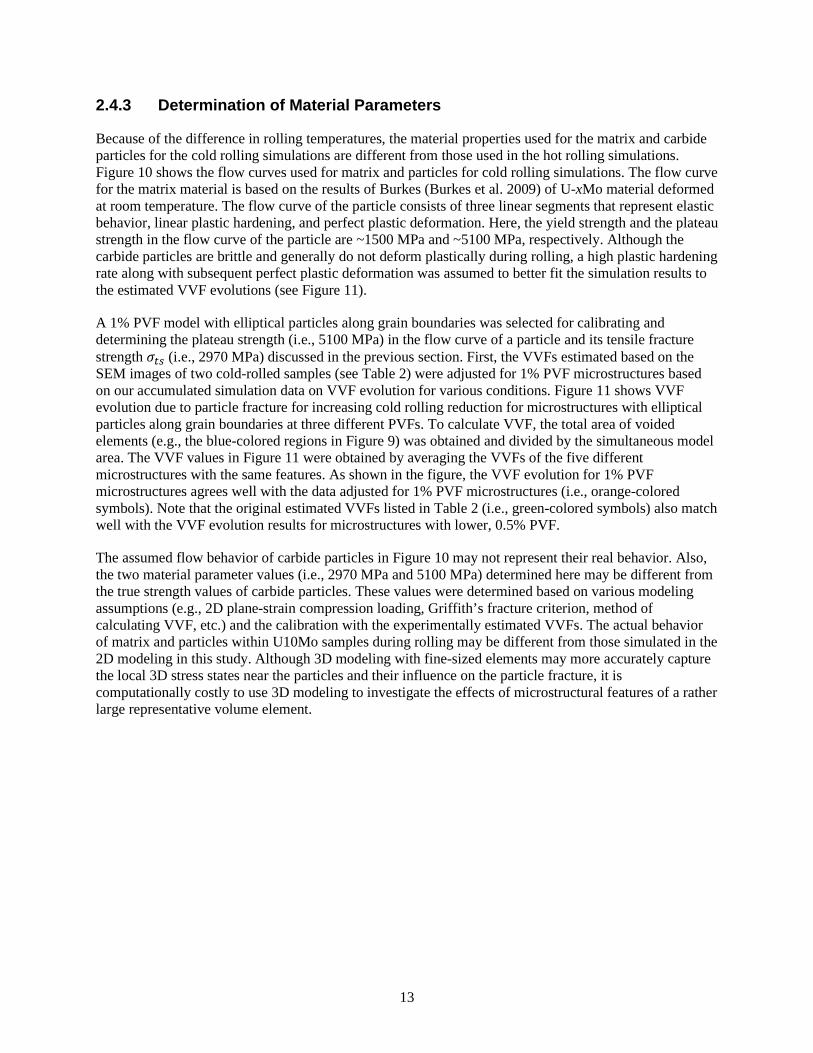
Because of the difference in rolling temperatures, the material properties used for the matrix and carbide particles for the cold rolling simulations are different from those used in the hot rolling simulations. Figure 10 shows the flow curves used for matrix and particles for cold rolling simulations. The flow curve for the matrix material is based on the results of Burkes (Burkes et al. 2009) of U-xMo material deformed at room temperature. The flow curve of the particle consists of three linear segments that represent elastic behavior, linear plastic hardening, and perfect plastic deformation. Here, the yield strength and the plateau strength in the flow curve of the particle are ~1500 MPa and ~5100 MPa, respectively. Although the carbide particles are brittle and generally do not deform plastically during rolling, a high plastic hardening rate along with subsequent perfect plastic deformation was assumed to better fit the simulation results to the estimated VVF evolutions (see Figure 11).
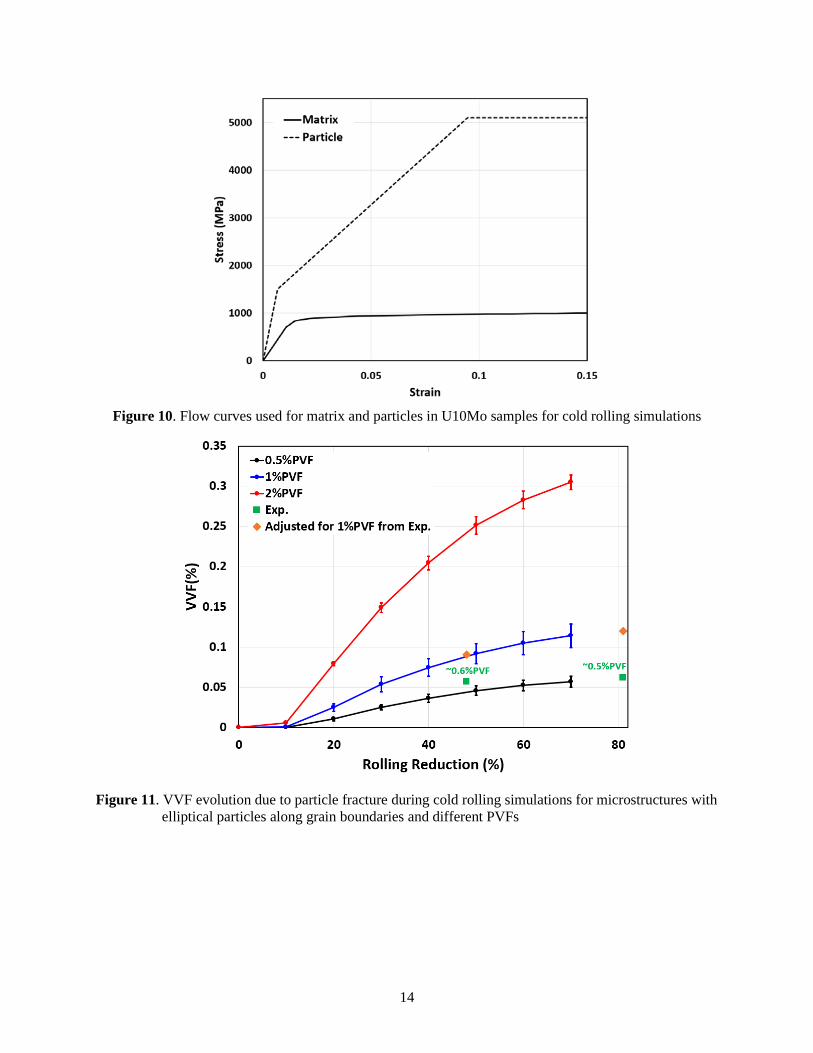
A 1% PVF model with elliptical particles along grain boundaries was selected for calibrating and determining the plateau strength (i.e., 5100 MPa) in the flow curve of a particle and its tensile fracture strength 𝜎𝜎𝑡𝑡𝑡𝑡 (i.e., 2970 MPa) discussed in the previous section. First, the VVFs estimated based on the SEM images of two cold-rolled samples (see Table 2) were adjusted for 1% PVF microstructures based on our accumulated simulation data on VVF evolution for various conditions. Figure 11 shows VVF evolution due to particle fracture for increasing cold rolling reduction for microstructures with elliptical particles along grain boundaries at three different PVFs. To calculate VVF, the total area of voided elements (e.g., the blue-colored regions in Figure 9) was obtained and divided by the simultaneous model area. The VVF values in Figure 11 were obtained by averaging the VVFs of the five different microstructures with the same features. As shown in the figure, the VVF evolution for 1% PVF microstructures agrees well with the data adjusted for 1% PVF microstructures (i.e., orange-colored symbols). Note that the original estimated VVFs listed in Table 2 (i.e., green-colored symbols) also match well with the VVF evolution results for microstructures with lower, 0.5% PVF.
The assumed flow behavior of carbide particles in Figure 10 may not represent their real behavior. Also, the two material parameter values (i.e., 2970 MPa and 5100 MPa) determined here may be different from the true strength values of carbide particles. These values were determined based on various modeling assumptions (e.g., 2D plane-strain compression loading, Griffith’s fracture criterion, method of calculating VVF, etc.) and the calibration with the experimentally estimated VVFs. The actual behavior of matrix and particles within U10Mo samples during rolling may be different from those simulated in the 2D modeling in this study. Although 3D modeling with fine-sized elements may more accurately capture the local 3D stress states near the particles and their influence on the particle fracture, it is computationally costly to use 3D modeling to investigate the effects of microstructural features of a rather large representative volume element.
14
Figure 10. Flow curves used for matrix and particles in U10Mo samples for cold rolling simulations
Figure 11. VVF evolution due to particle fracture during cold rolling simulations for microstructures with elliptical particles along grain boundaries and different PVFs
15
3.0 Results and Discussion
3.1 Evolution of Void Volume Fraction during Cold Rolling
The general trend of VVF evolution is presented in Figure 11. In the figure, the voids begin to appear after ~10% cold rolling reduction, and the VVF increases with rolling reduction although its rate of increase gradually declines. The VVFs were then obtained for all microstructure models to examine the influence of microstructural features. In this examination, the VVFs were calculated only for 40% and 70% cold rolling reductions.
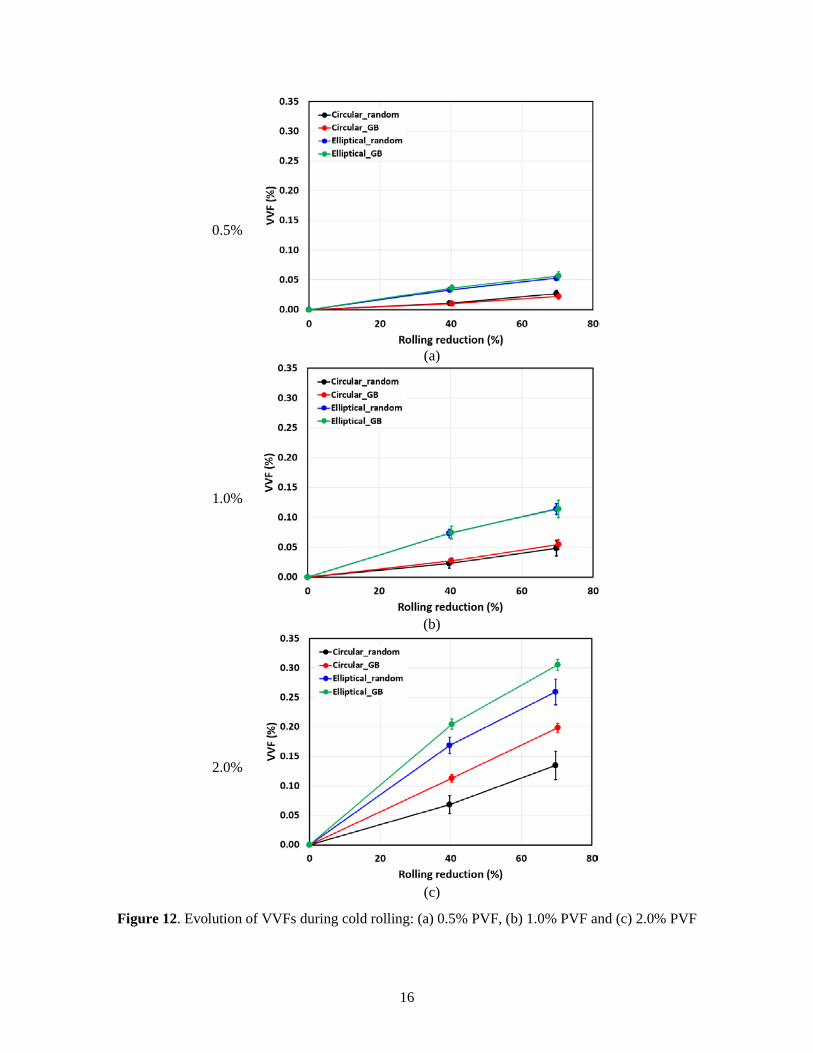
Figure 12 compares VVF evolution for different microstructural features. As shown in the figure, the microstructures with elliptical particles show much larger (almost twice as large) VVFs than those with circular particles. This indicates that the elliptical particles are fractured more easily than the circular ones. The results also show that, for the microstructures with lower PVFs (i.e., 0.5% and 1.0% PVF), the particle distributions (i.e., random or along grain boundaries) have insignificant effects on the VVF evolution, whereas for the microstructures with higher PVF (i.e., 2.0%), the microstructures with particles along grain boundaries may have larger VVFs than the ones with random particle distributions. This indicates that the effects of particle distribution on VVFs of U10Mo samples are negligible for actual samples, since the real PVFs of various U10Mo samples are lower than the 1.0% from experimental estimation used here.
As mentioned in Section 2.4.2, the fracture mode can be tracked for each particle based on the adopted fracture criterion. Strictly speaking, rather than the fracture mode of a particle itself, the fracture mode for each deleted (i.e., voided) element can be tracked, since the fracture criterion is applied only to elements composing a particle. Tracking the fracture modes for all the deleted elements revealed that almost all the deleted elements (i.e., ~99%) were fractured by tensile separation in Mode I. This is probably because the simple compression loading condition was adopted in this study, which may well describe the deformation mode in the center region of the rolled samples. The particles near the actual sample surface may experience severe shearing deformation during rolling, and then fracture in Mode II.
16
0.5%
(a)
1.0%
(b)
2.0%
(c)
Figure 12. Evolution of VVFs during cold rolling: (a) 0.5% PVF, (b) 1.0% PVF and (c) 2.0% PVF
17
3.2 Evolution of Stringers during Cold Rolling
The stringers or stringer-type particle clusters provide a possible propagation path for cracks or fractures, which lowers the damage resistance of the materials (Hannard et al. 2017; Cheng et al. 2018). It is therefore important to control the particles in the initial microstructures to obtain the desired material performance after the final rolling process. In this study, the effects of different microstructural features on their SVF and stringer length are examined.
3.2.1 Definition of Stringers and Stringer Volume Fraction
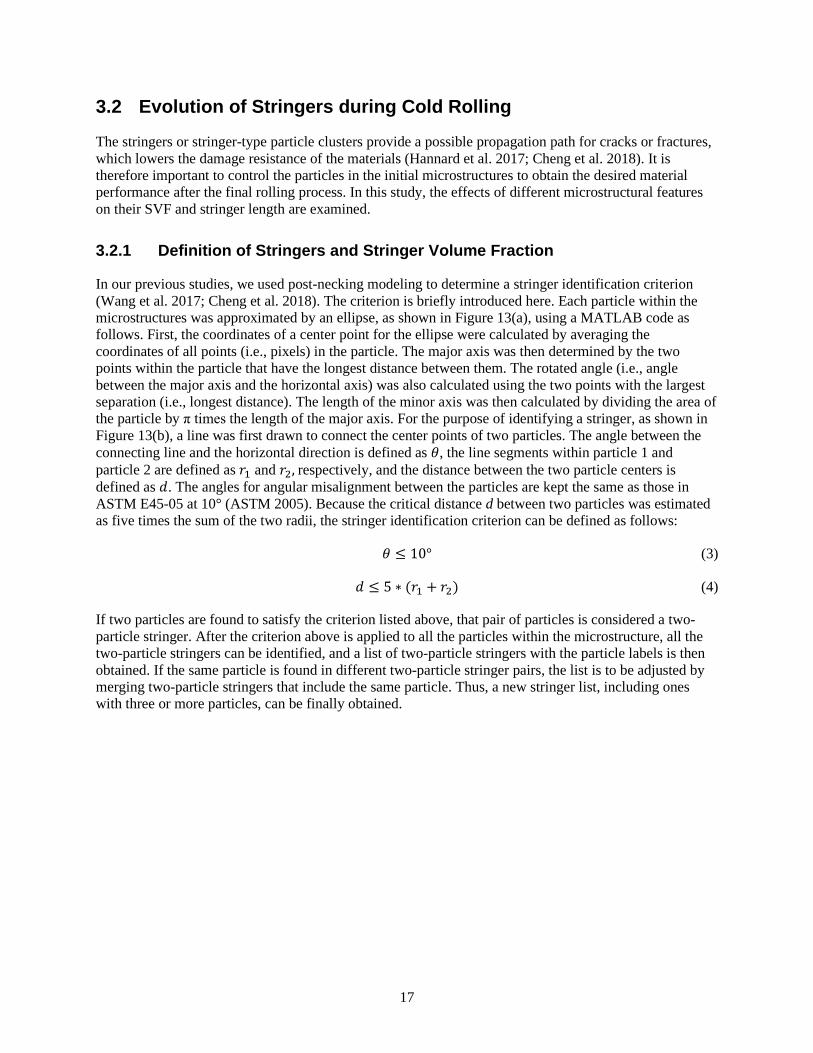
In our previous studies, we used post-necking modeling to determine a stringer identification criterion (Wang et al. 2017; Cheng et al. 2018). The criterion is briefly introduced here. Each particle within the microstructures was approximated by an ellipse, as shown in Figure 13(a), using a MATLAB code as follows. First, the coordinates of a center point for the ellipse were calculated by averaging the coordinates of all points (i.e., pixels) in the particle. The major axis was then determined by the two points within the particle that have the longest distance between them. The rotated angle (i.e., angle between the major axis and the horizontal axis) was also calculated using the two points with the largest separation (i.e., longest distance). The length of the minor axis was then calculated by dividing the area of the particle by π times the length of the major axis. For the purpose of identifying a stringer, as shown in Figure 13(b), a line was first drawn to connect the center points of two particles. The angle between the connecting line and the horizontal direction is defined as 𝜃𝜃, the line segments within particle 1 and particle 2 are defined as 𝑟𝑟1 and 𝑟𝑟2, respectively, and the distance between the two particle centers is defined as 𝑑𝑑. The angles for angular misalignment between the particles are kept the same as those in ASTM E45-05 at 10° (ASTM 2005). Because the critical distance d between two particles was estimated as five times the sum of the two radii, the stringer identification criterion can be defined as follows:
𝜃𝜃 ≤ 10° (3)
𝑑𝑑 ≤ 5 ∗ (𝑟𝑟1 + 𝑟𝑟2) (4)
If two particles are found to satisfy the criterion listed above, that pair of particles is considered a two-particle stringer. After the criterion above is applied to all the particles within the microstructure, all the two-particle stringers can be identified, and a list of two-particle stringers with the particle labels is then obtained. If the same particle is found in different two-particle stringer pairs, the list is to be adjusted by merging two-particle stringers that include the same particle. Thus, a new stringer list, including ones with three or more particles, can be finally obtained.
18
Figure 13. (a) A sketch showing the approximation of particles using ellipses and (b) a sketch of stringer
identification criteria used in this study
Stringer analyses were conducted for all the initial microstructures (i.e., the structures before cold rolling) with different features as well as the corresponding deformed microstructures after 40% and 70% cold rolling reduction. Stringer analyses on the deformed microstructures were conducted with the remeshed microstructure data after rolling reduction. In the remeshing, smaller elements (i.e., 0.5 × 0.5 µm2) were used to increase the resolution of particle shapes in the very thin microstructures deformed by 40~70% cold rolling reduction. For example, the final dimension of the 70% cold-rolled microstructure (i.e., ~18,500 × 53 µm2) was remeshed into the image data with ~37,000 × 106 pixels.
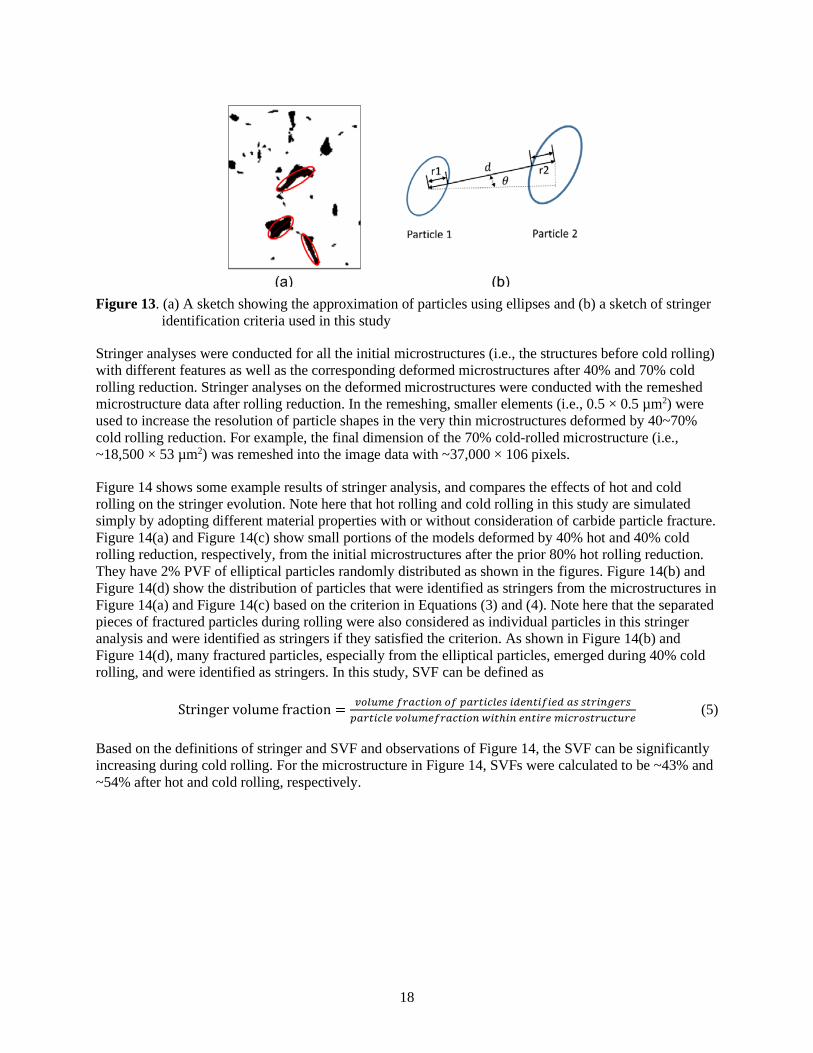
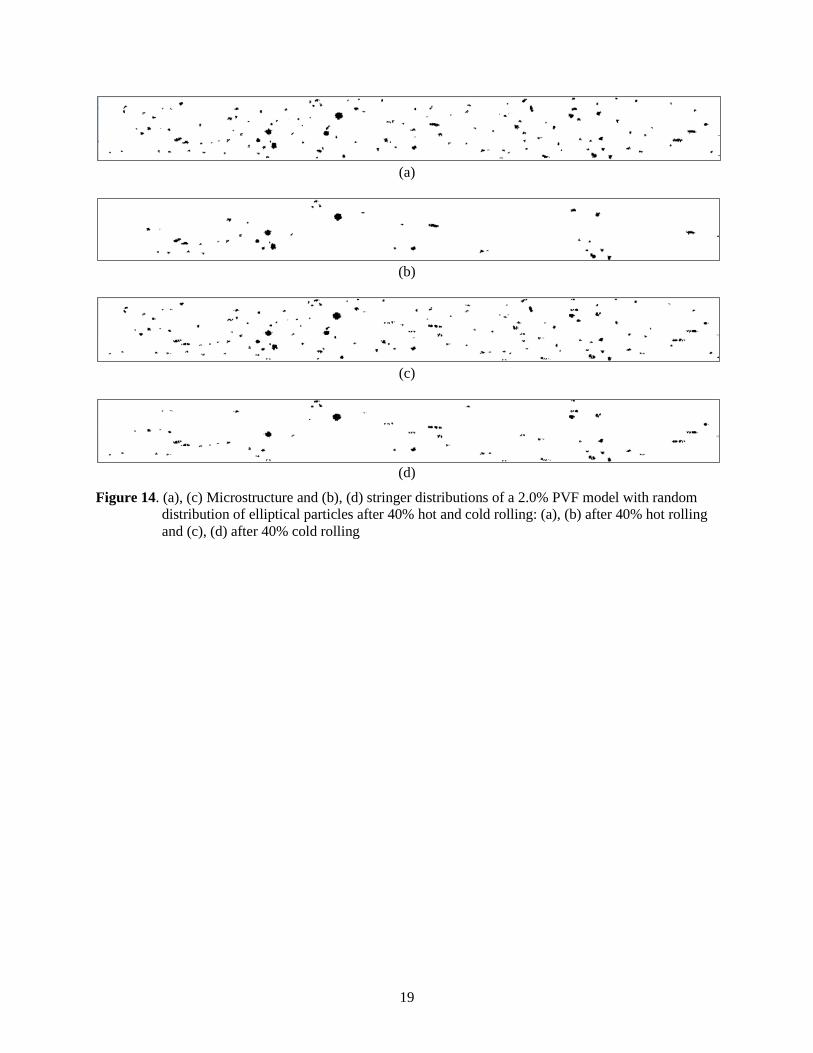
Figure 14 shows some example results of stringer analysis, and compares the effects of hot and cold rolling on the stringer evolution. Note here that hot rolling and cold rolling in this study are simulated simply by adopting different material properties with or without consideration of carbide particle fracture. Figure 14(a) and Figure 14(c) show small portions of the models deformed by 40% hot and 40% cold rolling reduction, respectively, from the initial microstructures after the prior 80% hot rolling reduction. They have 2% PVF of elliptical particles randomly distributed as shown in the figures. Figure 14(b) and Figure 14(d) show the distribution of particles that were identified as stringers from the microstructures in Figure 14(a) and Figure 14(c) based on the criterion in Equations (3) and (4). Note here that the separated pieces of fractured particles during rolling were also considered as individual particles in this stringer analysis and were identified as stringers if they satisfied the criterion. As shown in Figure 14(b) and Figure 14(d), many fractured particles, especially from the elliptical particles, emerged during 40% cold rolling, and were identified as stringers. In this study, SVF can be defined as
Based on the definitions of stringer and SVF and observations of Figure 14, the SVF can be significantly increasing during cold rolling. For the microstructure in Figure 14, SVFs were calculated to be ~43% and ~54% after hot and cold rolling, respectively.
19
(a)
(b)
(c)
(d)
Figure 14. (a), (c) Microstructure and (b), (d) stringer distributions of a 2.0% PVF model with random distribution of elliptical particles after 40% hot and cold rolling: (a), (b) after 40% hot rolling and (c), (d) after 40% cold rolling
20
3.2.2 Stringer Volume Fraction during Hot/Cold Rolling
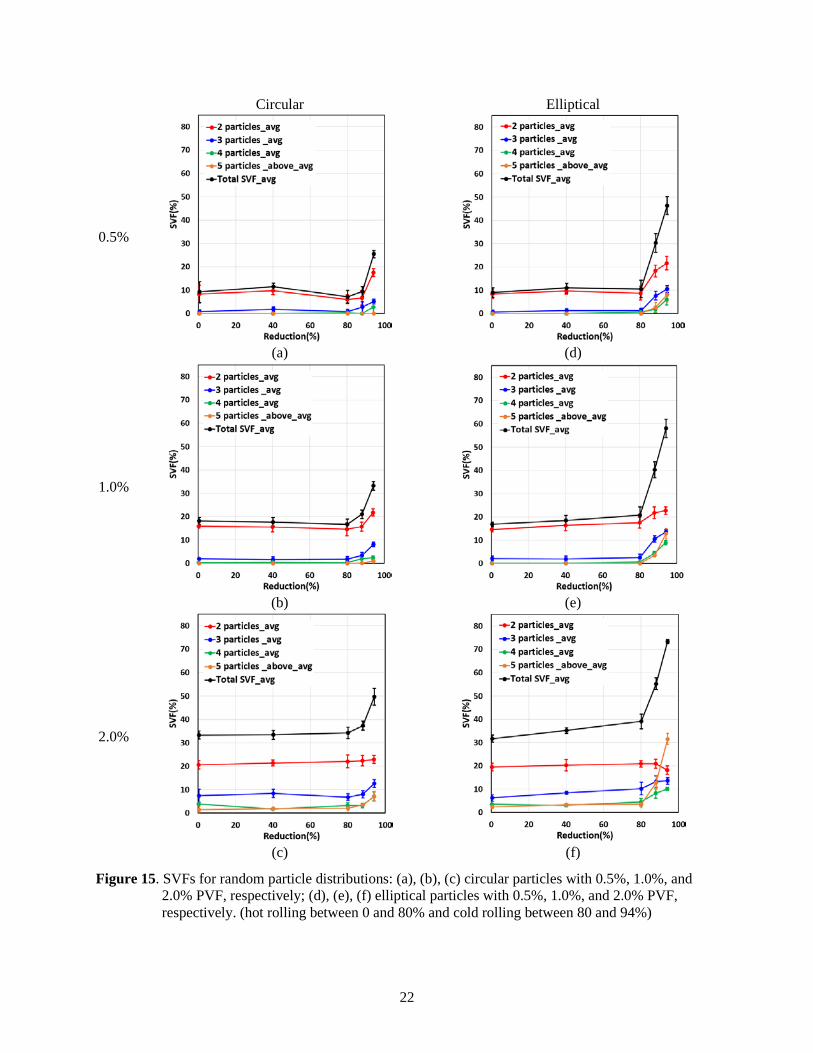
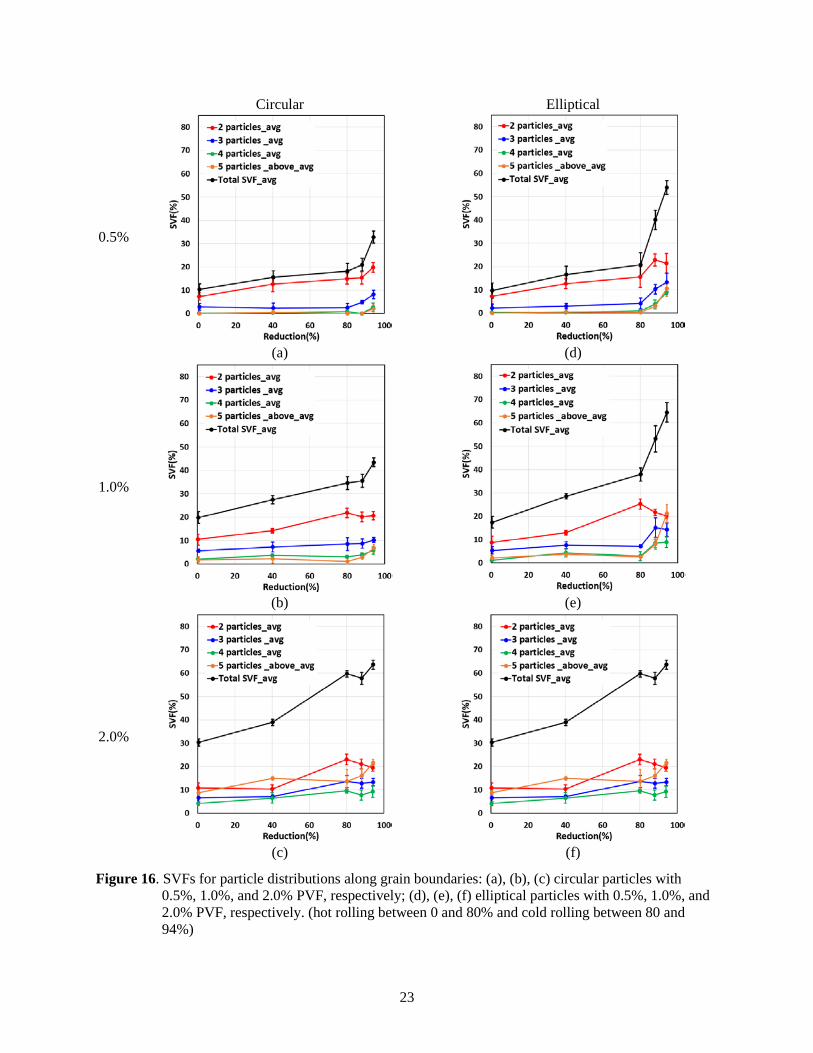
The effects of microstructural features on the evolution of SVFs during rolling are presented in this section. Figure 15 and Figure 16 show the evolution of total SVF with an increase of rolling reduction for different microstructural features. The volume fractions of stringers containing two, three, four, and five or more particles are also plotted as additional information. The results in these figures represent the average values and deviations of five models that have the same microstructural features. It should be noted that the results in these figures show the SVF evolution during the entire hot and cold rolling process, so that the trend of SVF evolution during hot and cold rolling can be easily compared. Here, the results from 0% to 80% reduction are based on hot rolling simulations, whereas those from 80% to 94% are based on cold rolling simulations. Note that the cold rolling of an additional ~70% after ~80% hot rolling, mentioned in the previous section, can be converted to a rolling reduction from 80% to 94% in the figures.
In Figure 15, the SVFs for the microstructures with random particle distributions remain generally the same (for circular particles) or increase only slightly (for elliptical particles) with the increase of hot rolling reduction up to ~80%. However, during cold rolling from 80 to 94%, the SVFs substantially increase due to particle fracture, especially for elliptical particles (see the black curves). Note again that the elliptical particles were found to fracture more easily than the circular ones in a previous section. Interestingly, for these random particle distributions, the increased percentage points of SVFs during cold rolling remains similar even for different PVF microstructures (i.e., ~15 percentage points for circular particles and ~35 percentage points for elliptical particles). It is also of interest that, as the PVF increases, the rate of increase of SVFs from small-number particle stringers (i.e., two-, three- and four-particle stringers) decreases (see the red, blue and green curves) while that from large-number particle stringers (i.e., stringers with five or more particles) increases greatly (see the orange curves). For example, for 0.5% PVF microstructures, the SVFs from two-particle stringer increase significantly for both the circular and elliptical particles, whereas those for 2% PVF microstructures remain the same for circular particles or decrease for elliptical particles.
In Figure 16, the SVFs for the microstructures with particle distributions along grain boundaries are initially similar to those for random particle distributions before rolling, and then substantially increase with hot rolling reduction up to ~80%. During cold rolling from 80 to 94%, the SVFs also increase due to particle fracture, especially for elliptical particles, as observed above in the cases of random particle distributions (see the black curves). Unlike the results presented in Figure 15, for the particle distributions along grain boundaries, the increased percentage points of SVFs during cold rolling depend on the PVFs of microstructure, and decline with the increase of PVF. The same trend as in the random particle distributions is also observed: as the PVF increases, the rate of increase of SVFs from stringers comprising few particles decreases, while that from many-particle stringers increases significantly. It is observed from Figure 15 and Figure 16 that, in general, the SVFs substantially increase due to particle fractures during cold rolling, and the SVFs from many-particle stringers increase greatly, especially for high-PVF microstructures.
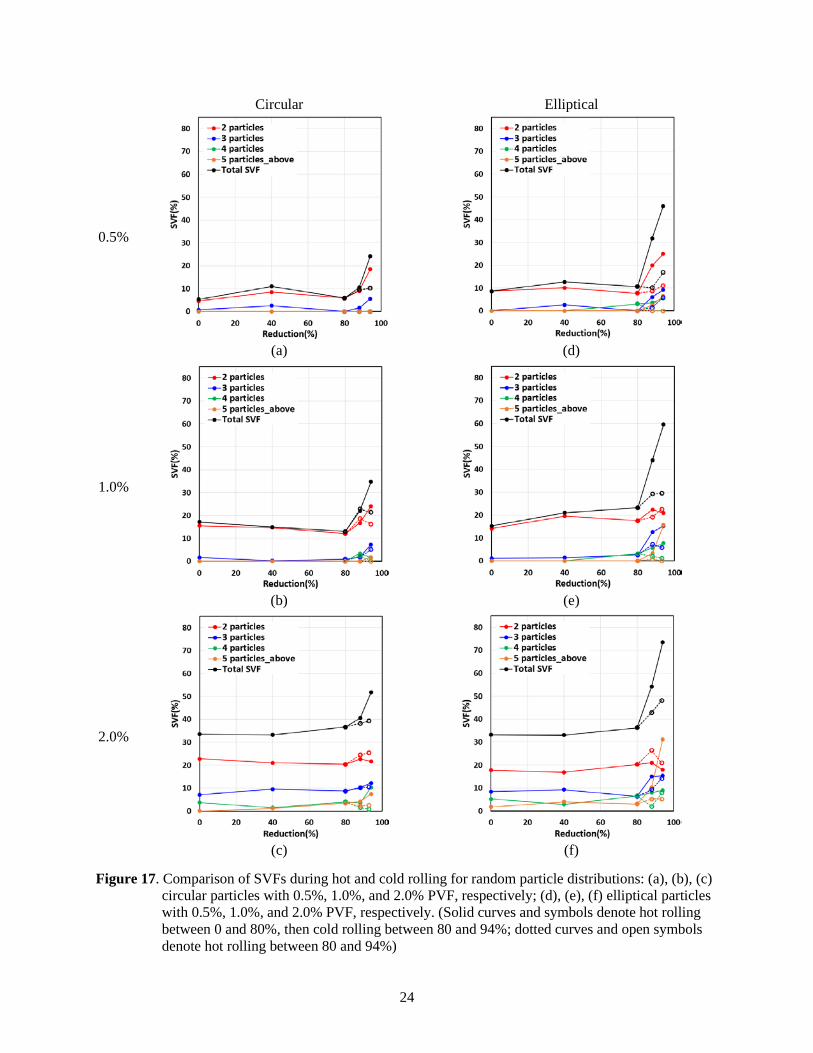
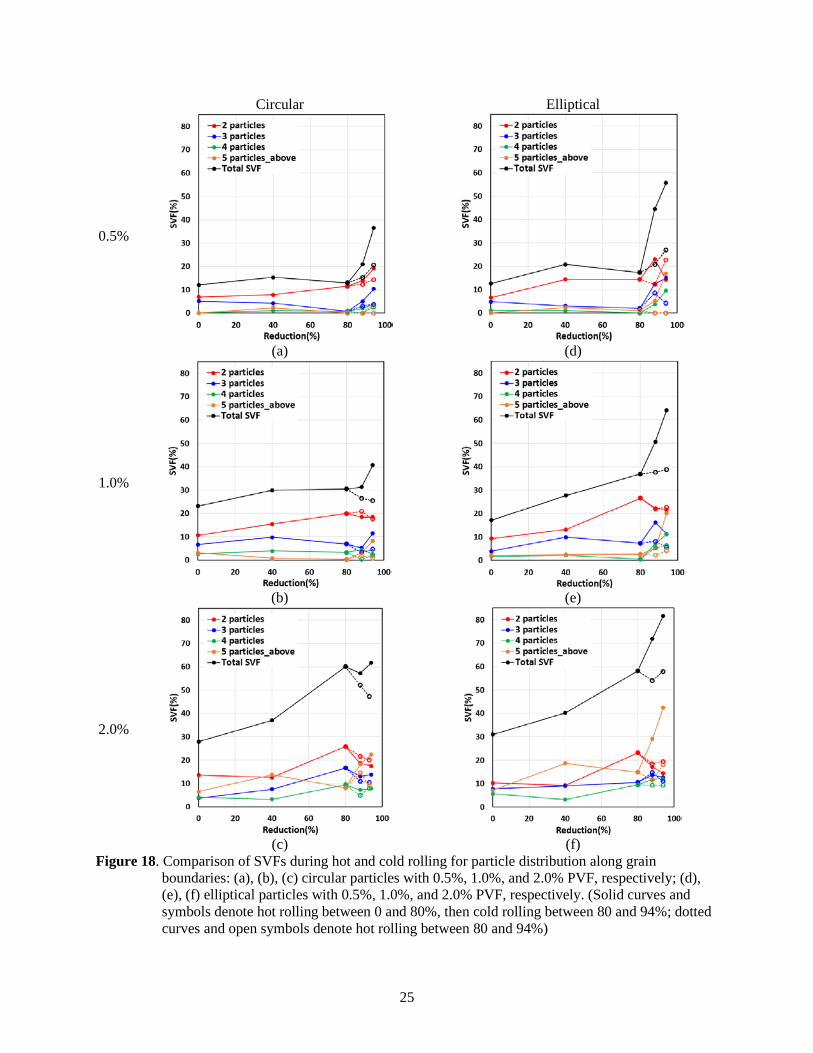
To gain better understanding of the influence of particle fracture on SVF evolution during cold rolling, twelve representative microstructures showing the SVF evolution features in Figure 15 and Figure 16 were selected and simulated based on an assumption of hot rolling from 80% to 94% without any particle fracture. The results obtained based on hot rolling simulation are compared with those based on a cold rolling assumption in Figure 17 for random particle distribution and Figure 18 for particles along grain boundaries. In the figures, the solid curves with solid symbols are based on hot rolling reduction up to 80% and subsequent cold rolling reduction from 80% to 94%, whereas the dotted curves with open symbols are based on hot rolling reduction from 80% to 94%. Details on SVF evolution during the initial hot rolling from 0% to 80% were discussed in the previous report (Choi et al. 2018).
21
For hot rolling from 80% to 94%, the total SVFs (i.e., black, dotted curves) either remain similar, decrease, or increase by some small amount depending on the microstructural features. A rolling reduction this extensive has two effects relevant to the SVF evolution: (1) the horizontal spaces between the particles can be significantly increased, which tends to decrease the SVF, and (2) particles may fill in the newly increased horizontal spaces between the particles, which contrarily tends to increase the SVF. These two factors interact differently depending on the PVF and the particle shapes and distributions. For example, for hot rolling from 80% to 94%, the SVFs for the microstructures with random particle distributions tend to remain similar or increase, while those for the particle distributions along grain boundaries and larger PVFs (i.e., 1.0%, 2.0%) tend to decrease. For the random particle distributions, it appears that the contributions from the two factors mentioned above are similar or the contribution from interposing particles is dominant due to their intrinsic random particle distribution. However, for the microstructures with particles distributed along grain boundaries, the contribution from interposing particles appears to be insignificant due to their aligned particle distributions. Note that the random particle distribution has rather high chance to satisfy the criterion in Equation (3) by interposing between particles during rolling while the aligned particle distribution has less chance to satisfy the criterion.
The SVF differences between cold-rolled and hot-rolled material (i.e., the solid curve vs. dotted curve from 80% to 94%) are induced primarily by particle fracture (and secondarily by different matrix properties), and increase with the rolling reduction. Interestingly, the SVF differences between hot and cold rolling after 94% rolling reduction does not depend much on the PVF or particle distributions, but depend primarily on the particle shapes. This SVF difference is 15~20 percentage points for circular particles, and 25~30 percentage points for elliptical particles. This indicates again that the particle shape, rather than other microstructural features, dominates particle fracture during cold rolling. Also, the SVFs for stringers with many particles (i.e., orange curves) significantly increase with cold rolling because the number of particles in a stringer increases when the original particles fracture.
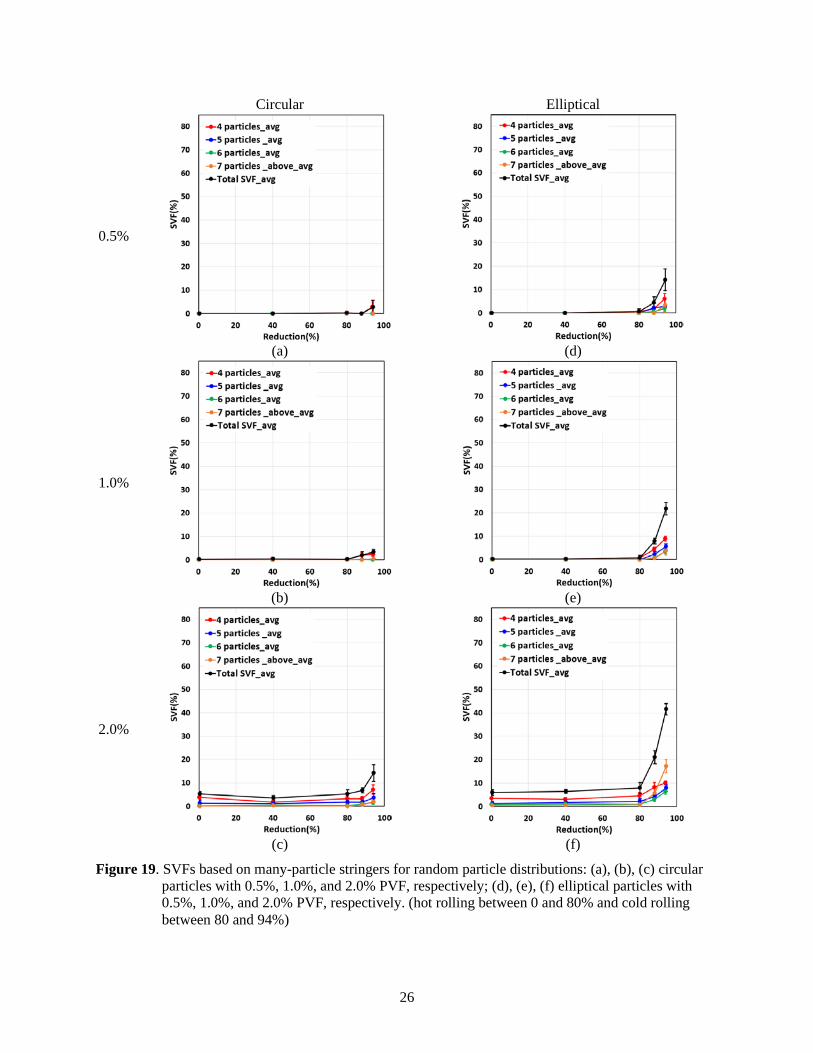
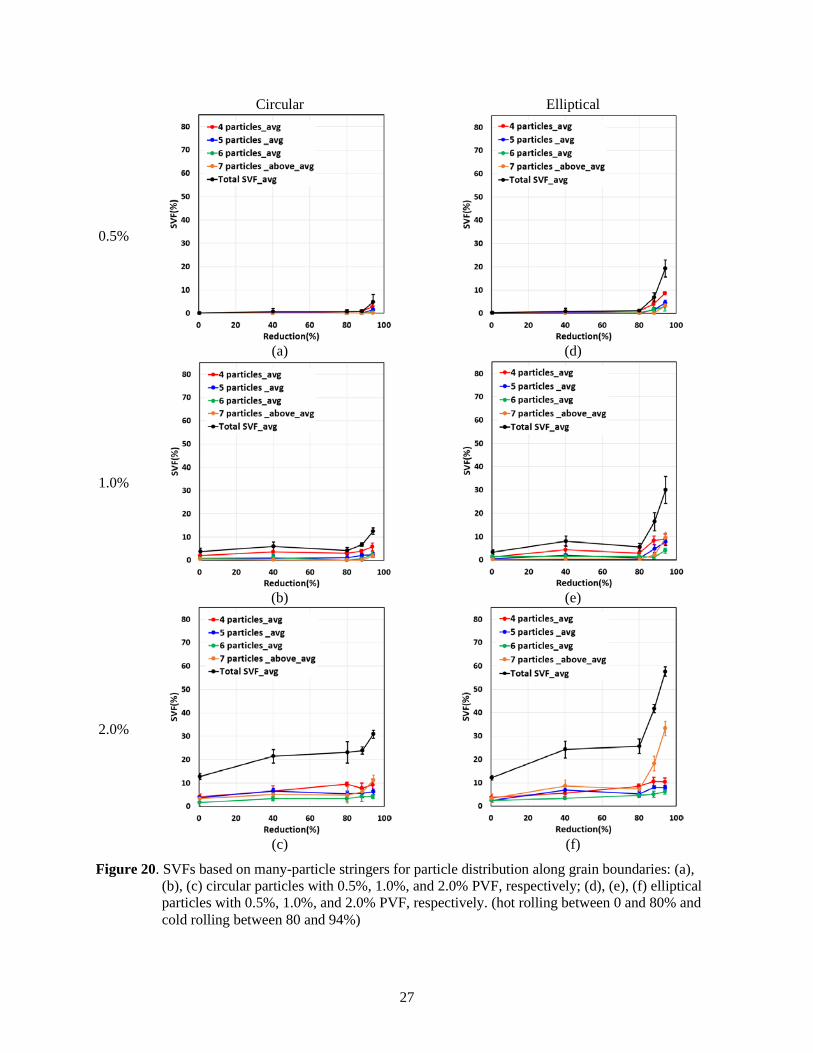
In this study, the separate pieces of particles fractured during rolling were considered to be individual particles in the stringer analysis for Figure 15‒Figure 18. For this reason, the two- and three-particle stringers used to plot the figures may consist primarily of fractured particles. Hence, the SVF evolution from only many-particle stringers may also be of interest in this study. SVFs were recalculated after neglecting the fewer- (i.e., two- and three-) particle stringers. Figure 19 and Figure 20 show the SVF evolution based on many-particle stringers. Unlike the results in Figure 15 and Figure 16, the total SVFs in Figure 19 and Figure 20 tend to depend on the PVF in the microstructure, resulting in higher SVFs for higher PVFs during cold rolling reduction.
22
Circular Elliptical
0.5%
(a)
(d)
1.0%
(b)
(e)
2.0%
(c)
(f)
Figure 15. SVFs for random particle distributions: (a), (b), (c) circular particles with 0.5%, 1.0%, and 2.0% PVF, respectively; (d), (e), (f) elliptical particles with 0.5%, 1.0%, and 2.0% PVF, respectively. (hot rolling between 0 and 80% and cold rolling between 80 and 94%)
23
Circular Elliptical
0.5%
(a)
(d)
1.0%
(b)
(e)
2.0%
(c)
(f)
Figure 16. SVFs for particle distributions along grain boundaries: (a), (b), (c) circular particles with 0.5%, 1.0%, and 2.0% PVF, respectively; (d), (e), (f) elliptical particles with 0.5%, 1.0%, and 2.0% PVF, respectively. (hot rolling between 0 and 80% and cold rolling between 80 and 94%)
24
Circular Elliptical
0.5%
(a)
(d)
1.0%
(b)
(e)
2.0%
(c)
(f)
Figure 17. Comparison of SVFs during hot and cold rolling for random particle distributions: (a), (b), (c) circular particles with 0.5%, 1.0%, and 2.0% PVF, respectively; (d), (e), (f) elliptical particles with 0.5%, 1.0%, and 2.0% PVF, respectively. (Solid curves and symbols denote hot rolling between 0 and 80%, then cold rolling between 80 and 94%; dotted curves and open symbols denote hot rolling between 80 and 94%)
25
Circular Elliptical
0.5%
(a)
(d)
1.0%
(b)
(e)
2.0%
(c)
(f)
Figure 18. Comparison of SVFs during hot and cold rolling for particle distribution along grain boundaries: (a), (b), (c) circular particles with 0.5%, 1.0%, and 2.0% PVF, respectively; (d), (e), (f) elliptical particles with 0.5%, 1.0%, and 2.0% PVF, respectively. (Solid curves and symbols denote hot rolling between 0 and 80%, then cold rolling between 80 and 94%; dotted curves and open symbols denote hot rolling between 80 and 94%)
26
Circular Elliptical
0.5%
(a)
(d)
1.0%
(b)
(e)
2.0%
(c)
(f)
Figure 19. SVFs based on many-particle stringers for random particle distributions: (a), (b), (c) circular particles with 0.5%, 1.0%, and 2.0% PVF, respectively; (d), (e), (f) elliptical particles with 0.5%, 1.0%, and 2.0% PVF, respectively. (hot rolling between 0 and 80% and cold rolling between 80 and 94%)
27
Circular Elliptical
0.5%
(a)
(d)
1.0%
(b)
(e)
2.0%
(c)
(f)
Figure 20. SVFs based on many-particle stringers for particle distribution along grain boundaries: (a), (b), (c) circular particles with 0.5%, 1.0%, and 2.0% PVF, respectively; (d), (e), (f) elliptical particles with 0.5%, 1.0%, and 2.0% PVF, respectively. (hot rolling between 0 and 80% and cold rolling between 80 and 94%)
28
3.2.3 Maximum Stringer Length during Hot/Cold Rolling
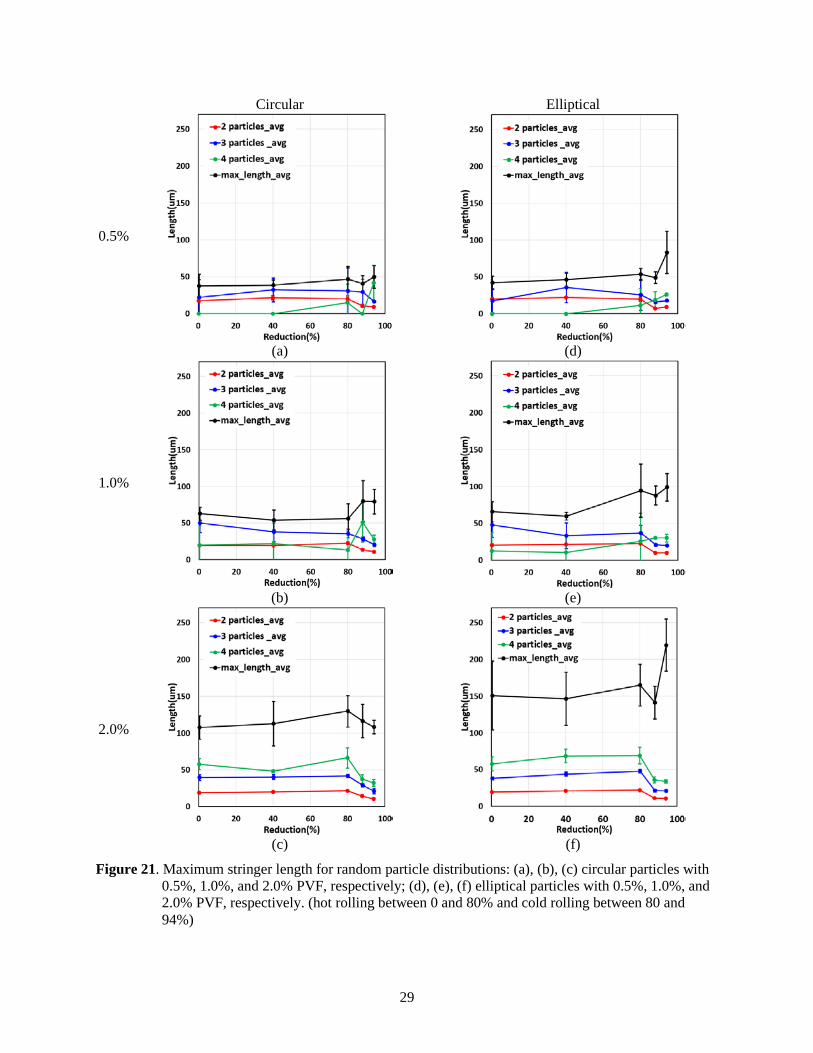
As shown in Figure 14(b) and Figure 14(d), stringers can have different numbers of particles and different lengths. The stringer length is an important factor because it may affect the damage resistance of the materials. In this study, the stringer length is simply determined as the direct distance between the two particles on each end of the stringer.
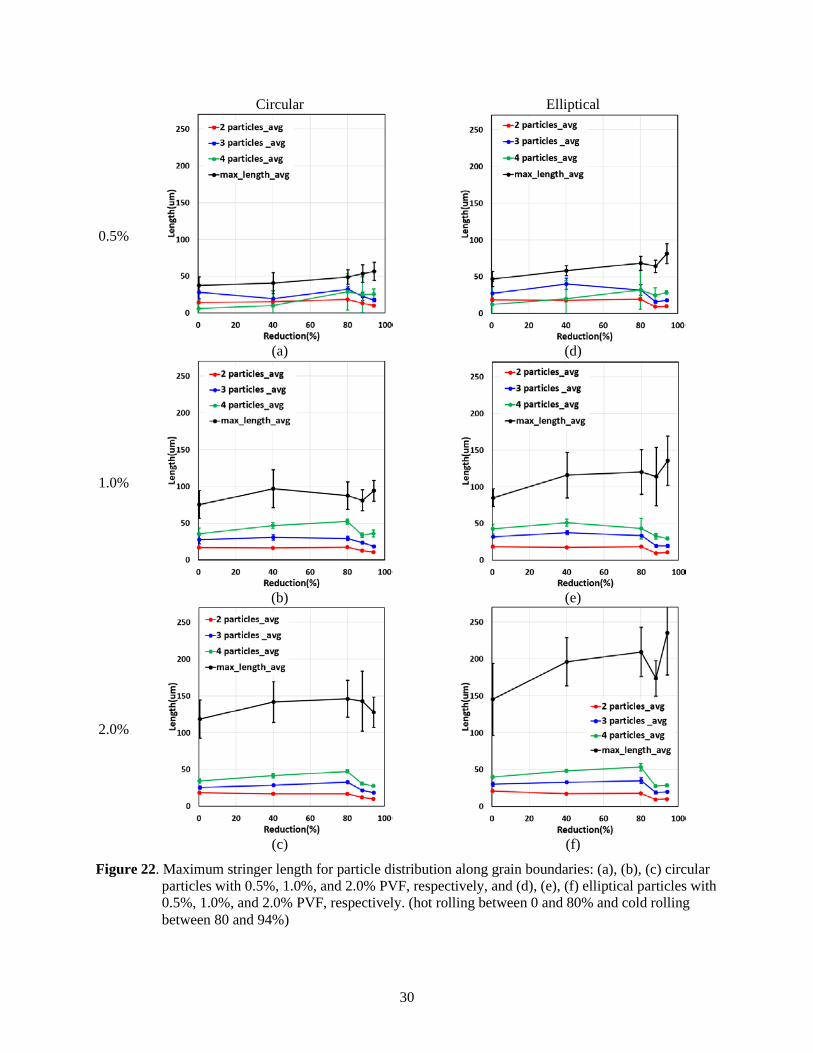
Figure 21 and Figure 22 show the evolution of maximum stringer length during the entire hot/cold rolling reduction to 94% for different microstructural features. Average lengths of two-, three-, and four-particle-stringers are also plotted. In the figures, the averaged maximum stringer length (i.e., black curves) generally have large deviations, which indicates the maximum stringer length data is scattered. However, it appears that the curves for maximum stringer length still show some noticeable trends in the effects of microstructural features. The trends during hot rolling up to 80% reduction were discussed in our previous report. In the current study, the maximum stringer lengths for the microstructures with circular particles tend to remain similar or decrease during cold rolling reduction from 80% to 94%. Those for elliptical particles tend to slightly increase, although they decrease a little at 88% reduction. As mentioned previously, in general, the horizontal spaces between the particles are significantly increased during an extensive rolling reduction; this can shorten the maximum stringer length, because the previously longest stringer may have become several short stringers. Note, however, that the particle fracture may also connect neighboring particles, forming stringers, even when the horizontal spaces are increasing. Because a substantial portion of particle fractures occurred in elliptical particles, (which fracture more easily than circular particles), microstructures with the elliptical particles can show slightly increased maximum stringer length at 94% rolling reduction.
29
Circular Elliptical
0.5%
(a)
(d)
1.0%
(b)
(e)
2.0%
(c)
(f)
Figure 21. Maximum stringer length for random particle distributions: (a), (b), (c) circular particles with 0.5%, 1.0%, and 2.0% PVF, respectively; (d), (e), (f) elliptical particles with 0.5%, 1.0%, and 2.0% PVF, respectively. (hot rolling between 0 and 80% and cold rolling between 80 and 94%)
30
Circular Elliptical
0.5%
(a)
(d)
1.0%
(b)
(e)
2.0%
(c)
(f)
Figure 22. Maximum stringer length for particle distribution along grain boundaries: (a), (b), (c) circular particles with 0.5%, 1.0%, and 2.0% PVF, respectively, and (d), (e), (f) elliptical particles with 0.5%, 1.0%, and 2.0% PVF, respectively. (hot rolling between 0 and 80% and cold rolling between 80 and 94%)
31
3.3 Evolution of Surface Particles during Hot/Cold Rolling
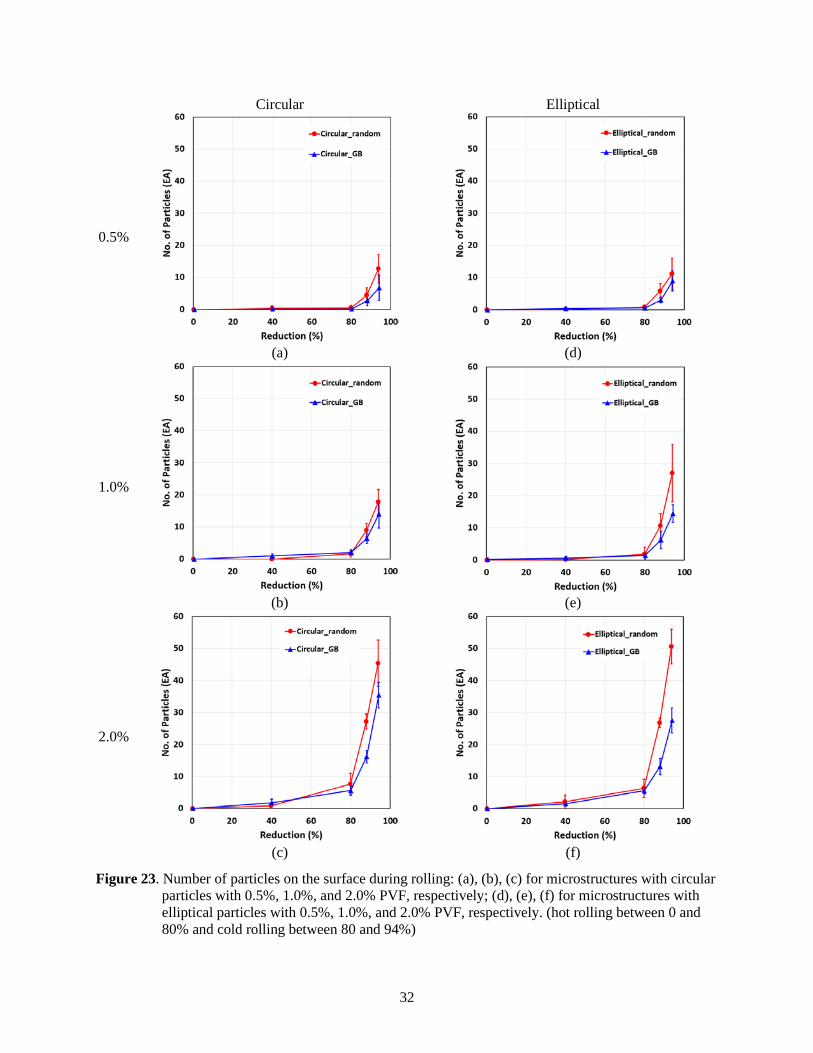
Because carbide particles near the surface can influence the fuel quality and stability, evolution of the number of particles on the surface was investigated.
Figure 23 shows the evolution of the number of particles at the surface during the entire hot/cold rolling reduction to ~94% for the microstructures with circular and elliptical particles. Here, only particles touching the surface are counted as surface particles, regardless of size. As shown in the figure, the number of particles at the surface increases with increased rolling reduction and PVF. In particular, during the cold rolling reduction from 80% to 94%, the number of particles at the surface increases very rapidly. This rapid increase is caused by particle fracture during cold rolling. Again, the separate pieces of particles fractured during rolling were considered to be individual particles. The results for elliptical particles in Figure 23(d)‒Figure 23(f) show more particles on the surface than for the circular particles in Figure 23(a)‒Figure 23(c). This reflects the elliptical particles being more easily fractured than the circular particles. The figure also shows that random particle distributions result in more particles at the surface after rolling. Particles aligned along grain boundaries may have less chance of touching the surface during rolling than randomly distributed particles.
In order to examine the effects of particle fracture on the number of particles at the surface during cold rolling, twelve microstructures specially selected and simulated for hot rolling in the previous SVF analysis were also analyzed to calculate the number of particles at the surface. The results are plotted as the dotted curves in Figure 24 and compared with those from cold rolling. As shown in the figure, during hot rolling from 80% to 94%, the number of particles at the surface remains similar. The difference in the number of particles at the surface is primarily due to particle fracture, with secondary effects coming from different matrix properties. As mentioned previously, the remeshed data were used for the analysis of stringer and surface particles. Errors stemming from remeshing may also have some effects on the difference in the number of particles at the surface between hot and cold rolling. In counting the number of particles at the surface, a new criterion may need to be developed that considers the particle size and its depth below the surface, because large particles below the surface may have more substantial interaction with the surface than small particles exposed on the surface have.
32
Circular Elliptical
0.5%
(a)
(d)
1.0%
(b)
(e)
2.0%
(c)
(f)
Figure 23. Number of particles on the surface during rolling: (a), (b), (c) for microstructures with circular particles with 0.5%, 1.0%, and 2.0% PVF, respectively; (d), (e), (f) for microstructures with elliptical particles with 0.5%, 1.0%, and 2.0% PVF, respectively. (hot rolling between 0 and 80% and cold rolling between 80 and 94%)
33
Circular Elliptical
0.5%
(a)
(d)
1.0%
(b)
(e)
2.0%
(c)
(f)
Figure 24. Comparison of numbers of particles on the surface during hot and cold rolling: (a), (b), (c) for microstructures with circular particles with 0.5%, 1.0%, and 2.0% PVF, respectively; (d), (e), (f) for microstructures with elliptical particles with 0.5%, 1.0%, and 2.0% PVF, respectively. (hot rolling between 0 and 80% and cold rolling between 80 and 94%)
34
4.0 Conclusions
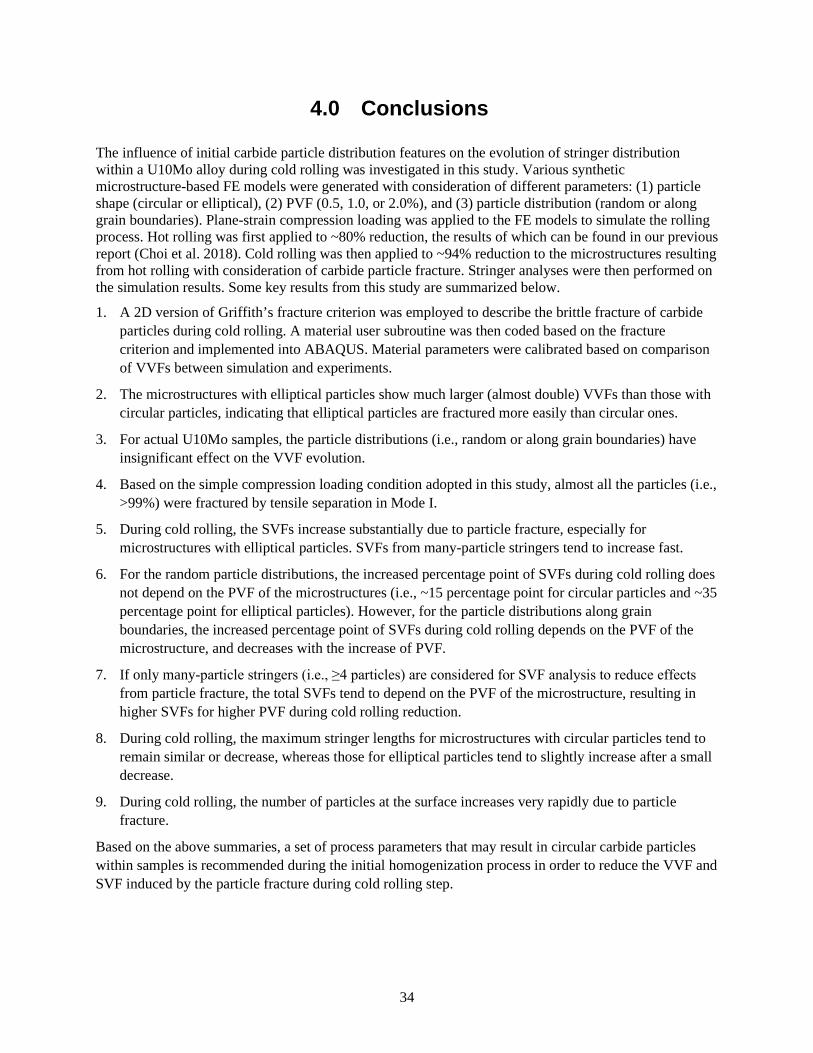
The influence of initial carbide particle distribution features on the evolution of stringer distribution within a U10Mo alloy during cold rolling was investigated in this study. Various synthetic microstructure-based FE models were generated with consideration of different parameters: (1) particle shape (circular or elliptical), (2) PVF (0.5, 1.0, or 2.0%), and (3) particle distribution (random or along grain boundaries). Plane-strain compression loading was applied to the FE models to simulate the rolling process. Hot rolling was first applied to ~80% reduction, the results of which can be found in our previous report (Choi et al. 2018). Cold rolling was then applied to ~94% reduction to the microstructures resulting from hot rolling with consideration of carbide particle fracture. Stringer analyses were then performed on the simulation results. Some key results from this study are summarized below.
1. A 2D version of Griffith’s fracture criterion was employed to describe the brittle fracture of carbide particles during cold rolling. A material user subroutine was then coded based on the fracture criterion and implemented into ABAQUS. Material parameters were calibrated based on comparison of VVFs between simulation and experiments.
2. The microstructures with elliptical particles show much larger (almost double) VVFs than those with circular particles, indicating that elliptical particles are fractured more easily than circular ones.
3. For actual U10Mo samples, the particle distributions (i.e., random or along grain boundaries) have insignificant effect on the VVF evolution.
4. Based on the simple compression loading condition adopted in this study, almost all the particles (i.e., >99%) were fractured by tensile separation in Mode I.
5. During cold rolling, the SVFs increase substantially due to particle fracture, especially for microstructures with elliptical particles. SVFs from many-particle stringers tend to increase fast.
6. For the random particle distributions, the increased percentage point of SVFs during cold rolling does not depend on the PVF of the microstructures (i.e., ~15 percentage point for circular particles and ~35 percentage point for elliptical particles). However, for the particle distributions along grain boundaries, the increased percentage point of SVFs during cold rolling depends on the PVF of the microstructure, and decreases with the increase of PVF.
7. If only many-particle stringers (i.e., ≥4 particles) are considered for SVF analysis to reduce effects from particle fracture, the total SVFs tend to depend on the PVF of the microstructure, resulting in higher SVFs for higher PVF during cold rolling reduction.
8. During cold rolling, the maximum stringer lengths for microstructures with circular particles tend to remain similar or decrease, whereas those for elliptical particles tend to slightly increase after a small decrease.
9. During cold rolling, the number of particles at the surface increases very rapidly due to particle fracture.
Based on the above summaries, a set of process parameters that may result in circular carbide particles within samples is recommended during the initial homogenization process in order to reduce the VVF and SVF induced by the particle fracture during cold rolling step.
35
5.0 References
Allison J, D Backman and L Christodoulou. 2006. "Integrated computational materials engineering: a new paradigm for the global materials profession." JOM 58(11):25-27. DOI: 10.1007/s11837-006-0223-5.
ASTM. 2005. "Standard Test Methods for Determining the Inclusion Content of Steel." ASTM International, West Conshohocken, PA. https://www.astm.org/Standards/E45.htm.
Burkes DE, R Prabhakaran, T Hartmann, J-F Jue and FJ Rice. 2010. "Properties of DU–10wt% Mo alloys subjected to various post-rolling heat treatments." Nuclear Engineering and Design 240(6):1332-1339. DOI: 10.1016/j.nucengdes.2010.02.008.
Burkes DE, R Prabhakaran, J-F Jue and FJ Rice. 2009. "Mechanical Properties of DU-xMo Alloys with x = 7 to 12 Weight Percent." Metallurgical and Materials Transactions A 40(5):1069-1079. DOI: 10.1007/s11661-009-9805-5.
Cheng G, XH Hu, WE Frazier, CA Lavender and VV Joshi. 2018. "Effect of second phase particles and stringers on microstructures after rolling and recrystallization." Materials Science and Engineering a-Structural Materials Properties Microstructure and Processing 736:41-52. DOI: 10.1016/j.msea.2018.08.040.
Choi KS, C Wang, CA Lavender and VV Joshi. 2018. Carbide Particle Redistribution in U10Mo Alloy during Hot Rolling Process. Pacific Northwest National Laboratory (PNNL), Richland, Washington 99354 (United States), Richland, Washington USA. Available at https://www.pnnl.gov/main/publications/external/technical_reports/PNNL-28383.pdf.
Devaraj A, R Prabhakaran, EJ McGarrah, VV Joshi, SY Hu and C Lavender. 2016. Theoretical Model for Volume Fraction of UC, 235U Enrichment, and Effective Density of Final U-10Mo Alloy. PNNL-SA-117284, Pacific Northwest National Laboratory, Richland, WA (United States). Available at https://www.pnnl.gov/main/publications/external/technical_reports/PNNL-SA-117284.pdf.
Hannard F, S Castin, E Maire, R Mokso, T Pardoen and A Simar. 2017. "Ductilization of aluminium alloy 6056 by friction stir processing." Acta Materialia 130:121-136. DOI: 10.1016/j.actamat.2017.01.047.
Hu S, D Burkes, CA Lavender and V Joshi. 2016. "Effect of grain morphology on gas bubble swelling in UMo fuels – A 3D microstructure dependent Booth model." Journal of Nuclear Materials 480:323-331. DOI: 10.1016/j.jnucmat.2016.08.038.
Hu X, DS Wilkinson, M Jain and RK Mishra. 2010. "A parametric finite element study and an analytical model of particle distributions on post-necking deformation and failure mode in AA5754 aluminum alloy sheets." International Journal of Fracture 164(2):167-183. DOI: 10.1007/s10704-010-9466-9.
Hu XH, DS Wilkinson, M Jain and RK Mishra. 2009. "The influence of particle shape, volume fraction and distribution on post-necking deformation and fracture in uniaxial tension of AA5754 sheet materials." International Journal of Solids and Structures 46(13):2650-2658. DOI: 10.1016/j.ijsolstr.2009.02.012.
Hu XH, DS Wilkinson, M Jain, PD Wu and RK Mishra. 2011. "The impact of particle distributions and grain-level inhomogeneities on post-necking deformation and fracture in AA5754 sheet alloys during uniaxial tension." Materials Science and Engineering a-Structural Materials Properties Microstructure and Processing 528(4-5):2002-2016. DOI: 10.1016/j.msea.2010.11.051.
Jaeger JC. 1970. Elasticity, fracture and flow: with engineering and geological applications, Springer Netherlands. 268. ISBN 978-94-011-6024-7.
Jana S, A Devaraj, L Kovarik, B Arey, L Sweet, T Varga, C Lavender and V Joshi. 2017. "Kinetics of cellular transformation and competing precipitation mechanisms during sub-eutectoid annealing of U10Mo alloys." Journal of Alloys and Compounds 723:757-771. DOI: 10.1016/j.jallcom.2017.06.292.
Joshi VV, EA Nyberg, CA Lavender, D Paxton and DE Burkes. 2015a. "Thermomechanical process optimization of U-10wt% Mo – Part 2: The effect of homogenization on the mechanical properties and microstructure." Journal of Nuclear Materials 465:710-718. DOI: 10.1016/j.jnucmat.2015.07.005.
Joshi VV, EA Nyberg, CA Lavender, D Paxton, H Garmestani and DE Burkes. 2015b. "Thermomechanical process optimization of U-10 wt% Mo – Part 1: high-temperature compressive properties and microstructure." Journal of Nuclear Materials 465:805-813. DOI: 10.1016/j.jnucmat.2013.10.065.
Joshi VV, DM Paxton, CA Lavender and D Burkes. 2016. The Effect of Rolling As-Cast and Homogenized U-10Mo Samples on the Microstructure Development and Recovery Curves. Pacific Northwest National Laboratory (PNNL), Richland, WA (United States). Available at https://www.pnnl.gov/main/publications/external/technical_reports/PNNL-25781.pdf.
Nyberg EA, VV Joshi, CA Lavender, DM Paxton and D Burkes. 2013. The Influence of Casting Conditions on the Microstructure of As-Cast U-10Mo Alloys: Characterization of the Casting Process Baseline. Pacific Northwest National Laboratory (PNNL), Richland, WA (US). Available at https://www.pnnl.gov/main/publications/external/technical_reports/PNNL-23049.pdf.
Sease JD, RT Primm, III and JH Miller. 2007. Conceptual process for the manufacture of low-enriched uranium/molybdenum fuel for the high flux isotope reactor. Oak Ridge, Tennessee. DOI: 10.2172/921766. Available at https://www.osti.gov/servlets/purl/921766.
Snelgrove JL, GL Hofman, MK Meyer, CL Trybus and TC Wiencek. 1997. "Development of very-high-density low-enriched-uranium fuels." Nuclear Engineering and Design 178(1):119-126. DOI: 10.1016/S0029-5493(97)00217-3.
Soulami A, DE Burkes, VV Joshi, CA Lavender and D Paxton. 2017. "Finite-element model to predict roll-separation force and defects during rolling of U-10Mo alloys." Journal of Nuclear Materials 494(Supplement C):182-191. DOI: 10.1016/j.jnucmat.2017.07.006.
Wang C, A Soulami, Z Xu, G Cheng, S Hu, D Burkes, W Frazier, KS Choi, X Wang, X Hu, C Lavender and VV Joshi. 2017. Process Modeling of U-10wt% Mo Alloys Using Integrated Computational Materials Engineering. Pacific Northwest National Laboratory, Richland, Washington. Available at https://www.osti.gov/servlets/purl/1518489.
Xu Z, V Joshi, S Hu, D Paxton, C Lavender and D Burkes. 2016. "Modeling the homogenization kinetics of as-cast U-10wt% Mo alloys." Journal of Nuclear Materials 471:154-164. DOI: 10.1016/j.jnucmat.2015.11.026.