80
STRENGTH 2012 ANNUAL REPORT ® AT THE CORE

STRENGTH
2 0 1 2 A n n u A l R e p o R t
®
at the core
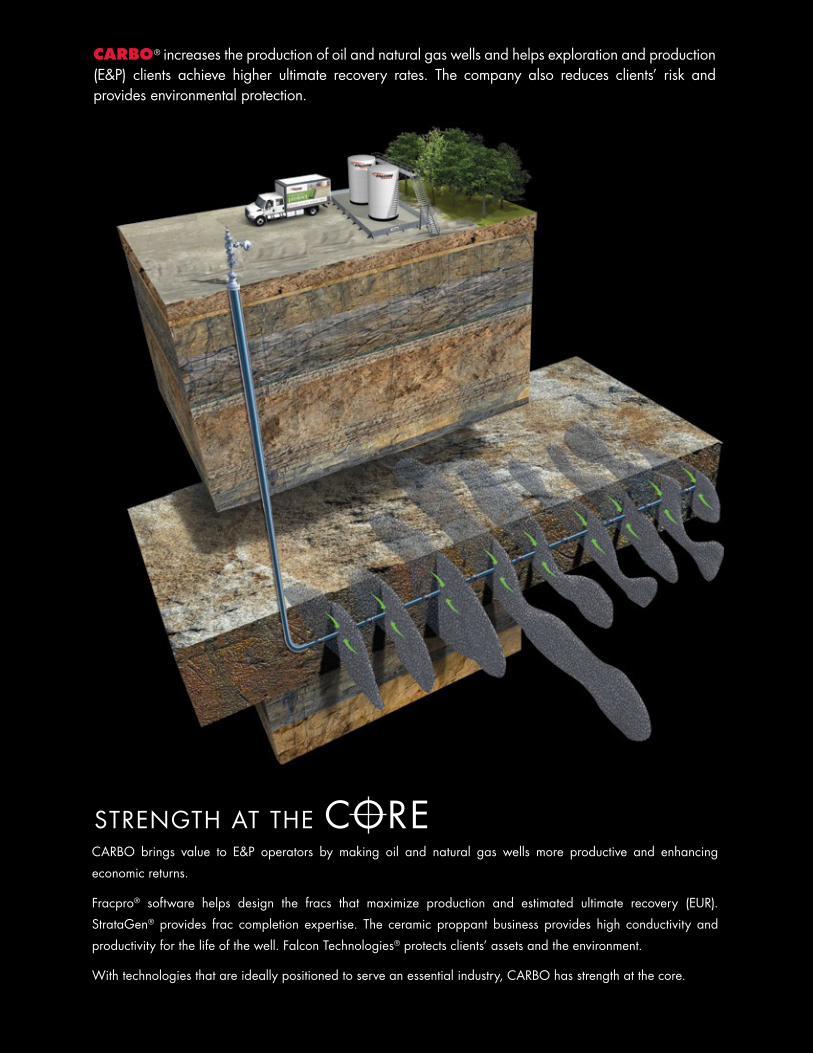
CARBO® increases the production of oil and natural gas wells and helps exploration and production (e&P) clients achieve higher ultimate recovery rates. the company also reduces clients’ risk and provides environmental protection.
carBo brings value to e&P operators by making oil and natural gas wells more productive and enhancing economic returns.
Fracpro® software helps design the fracs that maximize production and estimated ultimate recovery (eUr). StrataGen® provides frac completion expertise. the ceramic proppant business provides high conductivity and productivity for the life of the well. Falcon technologies® protects clients’ assets and the environment.
With technologies that are ideally positioned to serve an essential industry, carBo has strength at the core.
StrenGth at the core

CARBO 2012 annUaL rePort 1
Years ended December 31, 2007 2008 2009 2010 2011 2012
SuMMARY StAteMent oF InCoMe DAtA (In thousands, except per share amounts)
Revenue $ 299,996 $ 387,828 $ 341,872 $ 473,082 $ 625,705 $ 645,536
Gross profit 101,926 127,434 120,503 174,671 261,715 223,505
Operating profit 71,459 87,083 79,450 119,610 197,602 158,886
Income before income taxes 74,579 88,349 79,794 119,349 197,450 158,590
Income from continuing operations 49,641 60,405 52,810 78,716 130,136 105,933
Diluted earnings per share $ 2.02 $ 2.46 $ 2.27 $ 3.40 $ 5.62 $ 4.59
Average shares outstanding – diluted 24,451 24,418 23,112 22,977 23,012 22,969
SuMMARY BAlAnCe SHeet DAtA (In thousands)
Current assets $ 190,924 $ 293,310 $ 218,870 $ 237,655 $ 302,565 $ 349,917
Total assets 451,523 546,877 513,412 599,571 740,865 808,878
Current liabilities 33,264 83,848 32,458 51,247 79,066 50,830
Shareholders’ equity 389,439 442,534 457,316 521,979 630,158 713,078
otHeR DAtA (In thousands)
Depreciation and amortization $ 19,895 $ 24,638 $ 24,905 $ 27,728 $ 36,015 $ 44,893
Capital expenditures 53,944 23,343 46,127 96,566 90,395 77,189
2007 2008 2007 20082009 2009
$600
$500
$700
$400
$300
$200
$100
2007 2008 20092010 201020102011 201120112012 20122012
REVENUE($ in millions)
SHAREHOLDERS’ EQUITY($ in millions)
INCOME FROM CONTINUING OPERATIONS($ in millions)
$500
$700
$400
$600
$300
$200
$100
$30
$60
$90
$120
2006 200620062005 20052005
FInAnCIAl HIgHlIgHtS

2
For CARBO, 2012 was a year of challenge, opportunity and accomplishment.
In a year marked by a dramatically shifting marketplace
and increased competition, carBo achieved record
revenues and generated positive results for shareholders.
We faced challenges as the supply and demand
dynamics of the industry were rebalancing. as we have
done through more than 30 years of industry leadership,
carBo focused on managing the business through these
swings in activity while positioning the company for long-
term success. our mission—to increase production and
recovery in oil and natural gas wells around the globe—
remains intact.
FInAnCIAl oVeRVIeWFor the fiscal year ended December 31, 2012, revenues
were a record $645.5 million, increasing three percent
from the prior year. carBo’s worldwide proppant sales
volume totaled 1.71 billion pounds in 2012, an increase of
seven percent compared to 2011. net income decreased
19 percent, or $24.2 million, compared to 2011. the
decrease in income was primarily the result of a decrease
in average selling price and higher distribution costs,
partially offset by the increase in proppant sales volume.
the company continued to return cash to our
shareholders, increasing the quarterly dividend by
13 percent in 2012. this marked the twelfth consecutive
year of dividend increases.
For the fiscal year ended December 31, 2012, our
balance sheet includes $90.6 million of cash and cash
equivalents, and the company remains debt-free.
A DYnAMIC MARKetplACeat carBo, our main mission is to increase the production
of oil and natural gas wells by increasing the effectiveness
of hydraulic fractures. During 2012, the industry’s overall
drilling activity declined in north america as lower
natural gas prices continued to shift activity away from
natural gas and toward liquids-rich plays. Wells in these
liquid plays realize significant benefit from the increased
conductivity provided by the high-quality ceramic
proppant that makes up the majority of our business. We
continue to differentiate our products and our company
with our technical marketing campaign that communicates
the advantages and benefits of economic conductivity®.
We worked directly with clients to demonstrate the
superior results that can be gained by using our products.
DIStRIButIon CHAllengeSone of the primary challenges we faced during 2012
was the industry’s relocation of equipment, services and
supplies into the liquids-rich basins in north america.
While carBo sales volumes were healthy in the Bakken
and eagle Ford formations, infrastructure to support
industry activity remained limited. as a result, associated
logistics costs increased.
During 2012, carBo made strategic investments in
facilities that enable us to more efficiently serve clients in
these areas. to serve the eagle Ford we expanded our
distribution center in South texas, and in the Bakken we
added two transloading facilities. Future Bakken plans
include building a large distribution center.
CoMpetItIonIn 2012, the proppant industry experienced a significant
over-supply of chinese ceramic proppant. although
this proppant varies greatly in quality, the over-supply
placed substantial pricing pressure on the entire
proppant industry. While we have had to react to this
industry disruption, carBo remains steadfast regarding
our commitment to quality and pricing strategy: to be
prudent about increasing price during cycle upturns, and
disciplined regarding decreases during cycle downturns.
our strategy to educate the industry of the risks to
well production when using a low quality chinese
ceramic proppant has been straightforward. We
have demonstrated that carBo ceramic proppant is
measurably superior in terms of product quality and in the
to ouR SHAReHolDeRS, ClIentS AnD eMploYeeS:

CARBO 2012 annUaL rePort 3
performance it produces in our clients’ wells. In addition,
our lightweight ceramic product lines offer a volume
advantage compared to the intermediate density products
offered by competitors, meaning that our proppant will
provide greater fracture volume and conductivity per
pound—in most cases approximately 20 percent greater
effective frac width and length. carBo also provides a
high level of customer service, adding important value to
our products. We have seen that many e&P companies
are turning away from the inferior products as their
inventories are consumed.
R&D AnD neW teCHnologYWe have continued our investment in the development of
new products, and I am pleased to report that each of our
businesses—proppant, Fracpro, StrataGen and Falcon—
has introduced or successfully commercialized market-
driven products in 2012.
Perhaps most exciting is that we have developed a
new technique to produce ceramic proppant. this new
technique produces a ceramic proppant with increased
strength and conductivity when compared to traditional
ceramics. We are in the process of scaling up to
commercial quantities, and anticipate a new product
introduction in the near future.
outlooK AnD FoCuSFor 2013, we anticipate industry activity will be similar
to that in 2012. In north america, we expect liquids-
rich drilling activity to remain high, offset by low natural
gas drilling activity. We are cautiously optimistic that
completion activity will increase as the year unfolds,
due to drilling efficiencies. In the proppant market, we
believe the supply-demand balance will continue to
improve. We also believe the long-term positive trend in
our sales volume remains intact. carBo is differentiating
its products through the technical and quality marketing
campaign launched in 2012, which highlights important
differences between a carBo ceramic proppant and a
lower quality chinese ceramic proppant.
I am excited about carBo’s future because our mission
has never been more focused and our product offering
so advanced.
•Ourclientswillbenefitfromthehighestconductivity
proppant, and we provide the best.
•Wearedrivenbytechnologytobetheleaderineach
of our businesses.
•Wehavebuilttheleadingceramicproppantbusiness
through quality products and innovation.
•FalconTechnologies’“EngineeredtoProtect™”solutions
are experiencing good revenue growth due to an
expanding client base.
•Wewillmaintainourplannedcourseandmoveforward
with a long-term view.
of course, our greatest strength comes from the
people who make carBo the company it is. to our
shareholders, clients and employees, I extend my
appreciation and thanks.
Sincerely,
Gary Kolstad
President and chief executive officer
ellen Smith Vice President,
Human Resources
Mark edmunds Vice President,
Operations
ernesto Bautista, III Vice President and
Chief Financial Officer
gary Kolstad President and Chief Executive Officer
Don Conkle Vice President,
Marketing and Sales
Sean elliott Vice President and General Counsel

4
STRENGTHp R o D u C t S t H At S H A p e A n I n D u S t R Y
CARBO is the world’s largest supplier of ceramic proppant with the industry’s highest conductivity and
the leader in technology including production assurance and frac detection.
Fracturing, proppant and productionoil and natural gas are typically contained in the pores of sedimentary rock formations thousands
of feet underground. to enable the hydrocarbons to flow through the rock and to the surface,
fluids are pumped down the well bore at pressures sufficient to create fractures in the rock
formation—a process called hydraulic fracturing. A granular material, called proppant,
is transported in the fluid to fill the fractures, thus “propping” them open once the
high-pressure pumping stops. the proppant-filled fracture creates a permeable
channel through which the hydrocarbons can flow more freely, thereby
increasing both production rates and the total amount of oil or natural
gas recovered from the well.
CARBOHSP®
CARBOPROP®
CARBOECONOPROP®
CARBOLITE®
CARBOHYDROPROP®
CARBONRT®
CARBOBOND® LITE®
New ProppantDeveloped in 2012
1979 2012

STRENGTH
PROPPANT TYPES AND THEIR CONDUCTIVITY
Tier 1 – High ConductivityCERAMIC
Tier 2 – Medium ConductivityRESIN-COATED SAND
Tier 3 – Low ConductivitySAND
HIG
HES
T C
ON
DU
CTI
VIT
Y
HIG
HES
T PR
OD
UC
TIO
N E
UR,
RO
I
Low strengthIrregular size and shapeNaturally Occurring Product
Medium strengthIrregular size and shape
Engineered, Manufactured ProductHigh strength (minimizes crush)Uniform size and shape(maximizes frac porosity and permeability)Thermal resistant(durable, minimizes degradation)
In tier 1 and tier 2, CARBO produces proppant of the highest quality that gives the highest conductivity in the reservoir.© 2013 CARBO Ceramics Inc. All rights reserved.
economic ConductivitycarBo engineers perform economic conductivity
analysis to determine a well’s production for various
amounts invested in proppant and stimulation treatments.
the result is designed to optimize economic performance
and return on investment.
our Ceramic proppant Value propositionUsing carBo’s ceramic proppant versus a sand-based
proppant, an operator can expect:
•20%+increaseinproductionrates
•20%+increaseinestimatedultimaterecovery(EUR)
•HighROIandrapidpayoutoninitialinvestment (weeks or a few months)
CARBO 2012 annUaL rePort 5
STRENGTHM A R K e t- D R I V e n p R o D u C t S

CARBO 2012 annUaL rePort 7
CARBo pRoppAntS continue to lead the industry through product development.
In 2012, carBo sold 1.7 billion pounds of proppant,
compared to 1.6 billion pounds in 2011. During 2012,
the most active resource plays were liquids-rich shale
formations that employed horizontal drilling coupled with
multi-stage fracturing and proppants to optimize economic
production.
Superior products, effective marketingcarBo’s technical marketing campaign, which
communicates the benefits of economic conductivity,
effectively demonstrates the value of a premium quality
product that measurably increases the client’s return on
investment. although the operating environment was
challenging, we continued to focus on what carBo does
best: making oil and natural gas wells produce better and
achieve higher ultimate recovery rates.
A competitive advantagethe north american proppant market in 2012 was greatly
impacted by competition in the form of an oversupply of
lower quality chinese ceramic proppant. the quality of
the chinese proppant varied greatly, and was generally
inferior in terms of crush resistance and irregular size
and shape.
carBo’s ceramic proppant provides its clients two
important technical advantages over the chinese
intermediate density ceramic (IDc) proppant. First, our
clients achieve superior conductivity due to the consistency
of the high quality proppant we manufacture. Second,
our clients benefit from using carBo’s lightweight
ceramic proppant, which provides approximately
20 percent more proppant volume for every pound
purchased. In other words, users of IDc proppant would
have to purchase roughly 20 percent more IDc to achieve
the same fracture volume compared to a well that uses
carBo’s lightweight ceramic proppant. We refer to this
as the Lightweight advantage.
International growthInternational sales volumes continued their positive trend,
with sales in china leading our international growth year-
over-year. Given the excess supply of chinese ceramic
proppant in the market today, the growth we are witnessing
in china is a testament to the carBo brand name as well
as our history of product performance and quality.
CARBoNRT non-radioactive detectable proppantcarBo has successfully demonstrated the value of
carBoNRT, a proppant incorporating a non-radioactive
tracer, on five continents around the globe. the product
was introduced to the market in 2011; in 2012 its sales
volume tripled. carBoNRT interest continues to grow
as e&P operators choose to measure fracture height
without the environmental concerns associated with
radioactive material.
enhanced proppant—an entirely new categoryDuring 2012, carBo developed an engineered porous
proppant that can be infused with chemicals which help
prevent problems that occur as the well produces. these
special proppants are added to the primary proppant
load when the reservoir is fractured. When liquid
hydrocarbons flow through the well bore, suspended
solids such as scale, paraffin and asphaltene can build up
on the well casing, causing production problems. this new
proppant platform can provide in situ remediation. the
first commercial application of carBoScaleGuard™is
planned for 2013.
the next generation of ceramic proppantcarBo has identified a new technique for the production
of ceramic proppant that will redefine the boundaries of
performance. Using this new technique, we will be able to
produce a ceramic proppant with increased strength and
conductivity compared to traditional ceramic proppants.
We are now in the process of scaling production up
to commercial quantities and preparing for a product
introduction.
STRENGTH

FRACpRo SoFtWARe: Fracpro is the industry’s most widely used fracture modeling software.
Used by e&P firms, service companies, consultants
and universities the world over, Fracpro is the de facto
standard for fracture design and simulation.
Fracpro’s power and versatility are important to our
mission of increasing production of oil and natural gas
wells. It can model almost limitless combinations of
well configuration, proppant placement, conductivity
improvements and fracture dimensions, in any type of
reservoir. In addition to its thorough built-in libraries,
Fracpro can capture data and be calibrated in real time,
allowing users to customize models for their specific
application.
Building on record sales in 2011, Fracpro sales increased
more than 40 percent to set another record in 2012, and
the client base continues to grow.
Fracpro Remote for the ipadIn 2012, we introduced Fracpro remote, an application
for the apple® iPad®. as the name suggests, Fracpro
remote allows an iPad user to connect remotely to another
computer’s Fracpro program. Fracpro remote enables
complete sharing of the host computer’s Fracpro files.
Users in an office or remote location can view Fracpro
data from the job site in real time. no other software
package allows such complete sharing of valuable
information.
Xchange offers exceptional valueFracpro Xchange is a specialized version of the software
designed for use in well-site fracture monitoring vans.
It has enhanced plotting and graphing capabilities that
enable it to calculate what is happening in the well bore
and display the information on the array of video monitors
used in the van.
Users can create a design file in the office, take it to the
well site while the fracture is being done, and bring back
the information and play it back in Fracpro. having one
program with the flexibility to run designs and real-time
displays provides clients with a lower-cost solution.
Added versatilityFracpro has been upgraded to provide greater real-
timefunctionalityfor“plugandperf”and”balldrop”
operations on horizontal wells with multiple fracture
treatments.
International growthFracpro user activity was strong in Western europe,
russia, romania, Poland and algeria. In china, growing
interest in drilling in shale formations drove strong
Fracpro sales. During 2012, a record number of Fracpro
user schools were taught around the world in locations
including argentina, austria, canada, china, Germany,
Italy and Mexico.
Apple and iPad are registered trademarks of Apple Inc.
STRENGTH8

STRENGTHI n n o VAt I o n t H At I M p R o V e S p e R F o R M A n C e

STRENGTHt H o u g H t l e A D e R S H I p t H At o p e n S n e W p o S S I B I l I t I e S
CARBO 2012 annUaL rePort 11
StRAtAgen: One distinction that has always set CARBO apart is the expertise and customer service of our engineering staff, which enables clients to get the most out of their reservoirs. In recent years, we have taken that to new levels.
StrataGen is carBo’s independent consulting group.
StrataGen is renowned for its specialized expertise in
unconventional reservoirs and horizontal well stimulation,
complementing carBo’s proppant and software
businesses. In 2012, to delineate and broaden our
services, we restructured the group into three components:
office practice, field services, and Data and neural
analysis® (Dana).
Improving production and controlling costsour office practice provides specialized knowledge to
help clients improve their return on investment by lowering
capital and operating costs and by improving production.
During 2012, we built upon a strong track record of helping
operators develop horizontal plays in the Bakken, Permian
and eagle Ford formations. We also worked with operators
to determine proper stimulation practices for the Vaca
Muerta formation in argentina. the Vaca Muerta is widely
considered to be one of the largest shale formations outside
of north america, possibly matching the potential of the
Barnett, eagle Ford, haynesville or Marcellus formations
in the U.S. In addition, our office practice worked on key
basins with offshore operators around the globe.
Representing clients’ best interests Field services range from fracture design and engineering
to supervision and quality control. our engineers bring
critical experience to see that clients get the best job for
their money by performing pre-stimulation evaluations of
fluid and proppant selection; audits regarding equipment
and materials; analysis of diagnostic fracture injection tests;
detailed supervision of actual stimulation jobs, including
fracturing fluids, additives and viscosity; pre- and post-
treatment inventories; and post-stimulation evaluation.
In 2012, we worked with numerous e&P companies in
north america and select international locations.
Reservoir-specific, data-driven modelsDana is our analysis and modeling process that uses
geology, reservoir, completion and fracture data to
develop a model that explains production variation
for wells in a field. StrataGen Dana projects have
discovered best completion and stimulation practices;
created holistic completion models; selected horizontal
well placement; evaluated fracture spacing; performed
prospect evaluation; and identified re-stimulation
candidates.
our WorX family of predictive models helps operators
find the optimum balance between cost, efficiency and
return on investment for their unconventional resource
developments. BakkenWorXSM and eFWorXSM (for the
eagle Ford) allow operators to model different scenarios
to determine the effects of various completion and fracture
designs. In 2012, in response to the shift from natural
gas to oil production, we expanded the functionality
of the predictive eFWorX model for the oil window,
which generally has lower pressure, and thinner pay
zones. During the year, we also introduced netWorXSM,
a predictive fracture model for brittle shale reservoirs.
Visible expertisecarBo’s thought leadership within the industry was
demonstrated in 2012 with engineers from our proppant,
StrataGen and Fracpro businesses publishing eleven
peer-reviewed Society of Petroleum engineers (SPe)
papers. they also made presentations at dozens of
conferences worldwide.
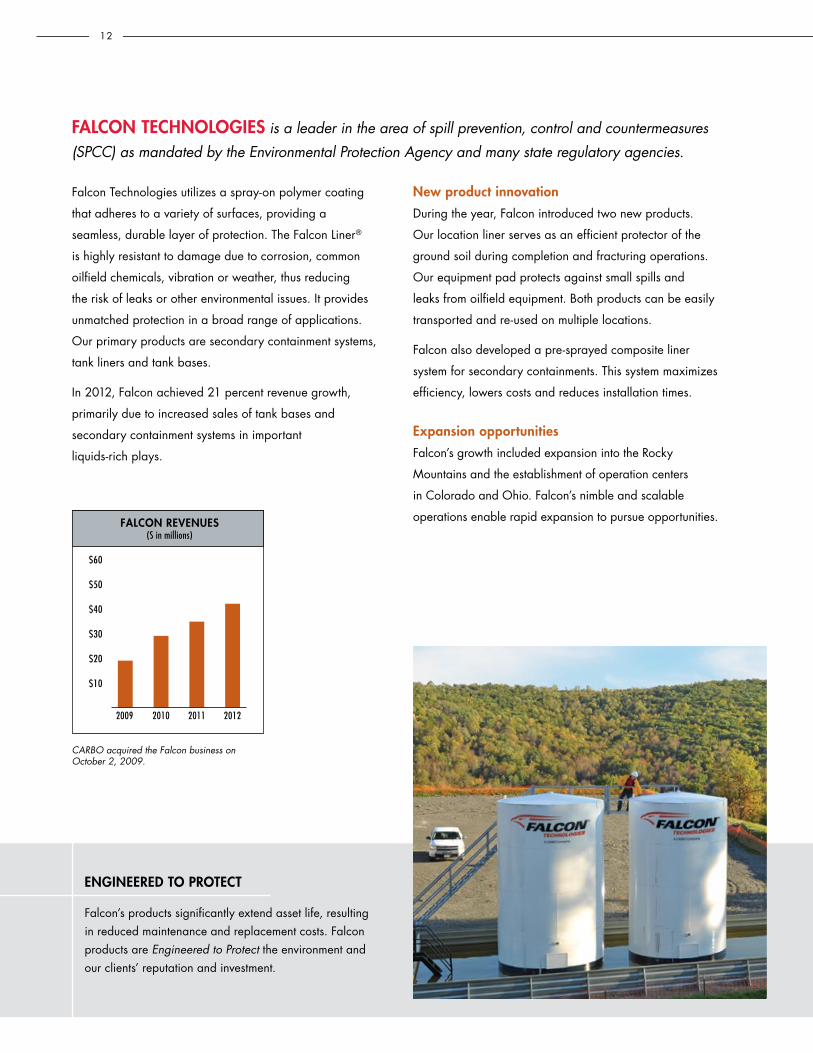
FAlCon teCHnologIeS is a leader in the area of spill prevention, control and countermeasures (SPCC) as mandated by the Environmental Protection Agency and many state regulatory agencies.
Falcon technologies utilizes a spray-on polymer coating
that adheres to a variety of surfaces, providing a
seamless, durable layer of protection. the Falcon Liner®
is highly resistant to damage due to corrosion, common
oilfield chemicals, vibration or weather, thus reducing
the risk of leaks or other environmental issues. It provides
unmatched protection in a broad range of applications.
our primary products are secondary containment systems,
tank liners and tank bases.
In 2012, Falcon achieved 21 percent revenue growth,
primarily due to increased sales of tank bases and
secondary containment systems in important
liquids-rich plays.
new product innovationDuring the year, Falcon introduced two new products.
our location liner serves as an efficient protector of the
ground soil during completion and fracturing operations.
our equipment pad protects against small spills and
leaks from oilfield equipment. Both products can be easily
transported and re-used on multiple locations.
Falcon also developed a pre-sprayed composite liner
system for secondary containments. this system maximizes
efficiency, lowers costs and reduces installation times.
expansion opportunitiesFalcon’s growth included expansion into the rocky
Mountains and the establishment of operation centers
in colorado and ohio. Falcon’s nimble and scalable
operations enable rapid expansion to pursue opportunities.
engIneeReD to pRoteCt
Falcon’s products significantly extend asset life, resulting in reduced maintenance and replacement costs. Falcon products are Engineered to Protect the environment and our clients’ reputation and investment.
12
FALCON REVENUES(S in millions)
$60
$50
$40
$30
$20
$10
2009 2010 2011 2012
CARBO acquired the Falcon business on October 2, 2009.

STRENGTHSolutIonS tHAt ARe engIneeReD to pRoteCt

STRENGTHADAptIng to CHAngIng MARKetS

STRENGTHCARBO 2012 annUaL rePort 15
FACIlItIeS AnD DIStRIButIon: With our extensive global distribution network, CARBO has the ability to serve any client, anywhere in the world.
In 2012, however, changes in industry distribution patterns
in north america presented a challenge.
A shift from natural gas to liquids-richthroughout the year, low natural gas prices caused the
industry to continue its shift away from natural gas plays
and toward liquids-rich plays. at the end of 2012, the U.S.
natural gas rig count had declined 47 percent from the
prior year. the oil rig count increased by 11 percent over
the same time period, while the total rig count was down
12 percent.
new distribution facilitiestwo of the most active oil plays were the Bakken formation
of north Dakota, Montana and canada, and the eagle
Ford formation of South texas. carBo proppant sales in
those areas were strong, but infrastructure to adequately
support industry activity was lacking.
carBo responded with strategic investments to allow us to
better serve clients in these areas, including expansion of
a distribution facility in South texas and new transloading
facilities in the Bakken. Future Bakken plans include
building a large distribution center.
Construction on other plantsour sand processing plant in Marshfield, Wisconsin,
became operational and began shipping our high quality,
carBo northern White sand to our resin-coating facility
in new Iberia, Louisiana. We elected to defer construction
of our Marshfield resin-coating plant until market
conditions improve. Work on the Millen, Georgia, ceramic
manufacturing plant project continues, and we estimate
the plant could commence production near the end of the
first quarter of 2014.

16
StRong ReSultS AnD A SolID plAn
through what has become a down cycle in the industry, carBo was able to achieve record revenues
and strong performance in 2012. In 34 years as an industry leader, we have seen better times and
worse times. We have managed through the cycles while keeping a long-term vision.
With that vision, we are excited about the future. the investments we made in 2012 will help us continue
to serve our clients well into the future. our businesses performed as industry leaders and positioned
themselves for further strong performance. the products we introduced show promise of great success
and should continue to redefine the industry.
We will continue to build on the company’s distinctive attributes that enable carBo to perform with
strength at the core.

UNITED STATESSECURITIES AND EXCHANGE COMMISSION
Washington, D.C. 20549
Form 10-KÈ ANNUAL REPORT PURSUANT TO SECTION 13 OR 15(D) OF THE SECURITIES EXCHANGE
ACT OF 1934For the fiscal year ended December 31, 2012
or‘ TRANSITION REPORT PURSUANT TO SECTION 13 OR 15(D) OF THE SECURITIES
EXCHANGE ACT OF 1934For the transition period from to
Commission File No. 001-15903
CARBO Ceramics Inc.(Exact name of registrant as specified in its charter)
DELAWARE 72-1100013(State or other jurisdiction of
incorporation or organization)(I.R.S. Employer
Identification Number)
575 North Dairy AshfordSuite 300
Houston, Texas 77079(Address of principal executive offices)
(281) 921-6400(Registrant’s telephone number)
Securities registered pursuant to Section 12(b) of the Act:Title of each class Name of each exchange on which registered
Common Stock, par value $0.01 per share New York Stock ExchangeSecurities registered pursuant to Section 12(g) of the Act: None
Indicate by check mark if the registrant is a well-known seasoned issuer, as defined in Rule 405 of the Securities Act. Yes È No ‘
Indicate by check mark if the registrant is not required to file reports pursuant to Section 13 or Section 15(d) of theAct. Yes ‘ No È
Indicate by check mark whether the registrant (1) has filed all reports required to be filed by Section 13 or 15(d) of the SecuritiesExchange Act of 1934 during the preceding 12 months (or for such shorter period that the registrant was required to file such reports), and(2) has been subject to such filing requirements for the past 90 days. Yes È No ‘
Indicate by check mark whether the registrant has submitted electronically and posted on its corporate Web site, if any, every InteractiveData File required to be submitted and posted pursuant to Rule 405 of Regulation S-T (§232.405 of this chapter) during the preceding 12months (or for such shorter period that the registrant was required to submit and post such files). Yes È No ‘
Indicate by check mark if disclosure of delinquent filers pursuant to Item 405 of Regulation S-K is not contained herein, and will not becontained, to the best of registrant’s knowledge, in definitive proxy or information statements incorporated by reference in Part III of this Form10-K or any amendment to this Form 10-K. È
Indicate by check mark whether the registrant is a large accelerated filer, an accelerated filer, a non-accelerated filer or a smaller reportingcompany. See the definitions of “large accelerated filer,” “accelerated filer” and “smaller reporting company” in Rule 12b-2 of the ExchangeAct:
Large accelerated filer È Accelerated filer ‘
Non-accelerated filer ‘ (Do not check if a smaller reporting company) Smaller reporting company ‘
Indicate by check mark whether the registrant is a shell company (as defined in Rule 12b-2 of the Act). Yes ‘ No È
The aggregate market value of the Common Stock held by non-affiliates of the Registrant, based upon the closing sale price of theCommon Stock on June 30, 2012, as reported on the New York Stock Exchange, was approximately $1,516,456,041. Shares of CommonStock held by each director and executive officer and each person who owns 10% or more of the outstanding Common Stock have beenexcluded in that such persons may be deemed to be affiliates. This determination of affiliate status is not necessarily a conclusivedetermination for other purposes.
As of February 21, 2013, the Registrant had 23,137,201 shares of Common Stock outstanding.
DOCUMENTS INCORPORATED BY REFERENCEPortions of the Proxy Statement for Registrant’s Annual Meeting of Stockholders to be held May 21, 2013, are incorporated by reference
in Part III.
TABLE OF CONTENTS
PART I
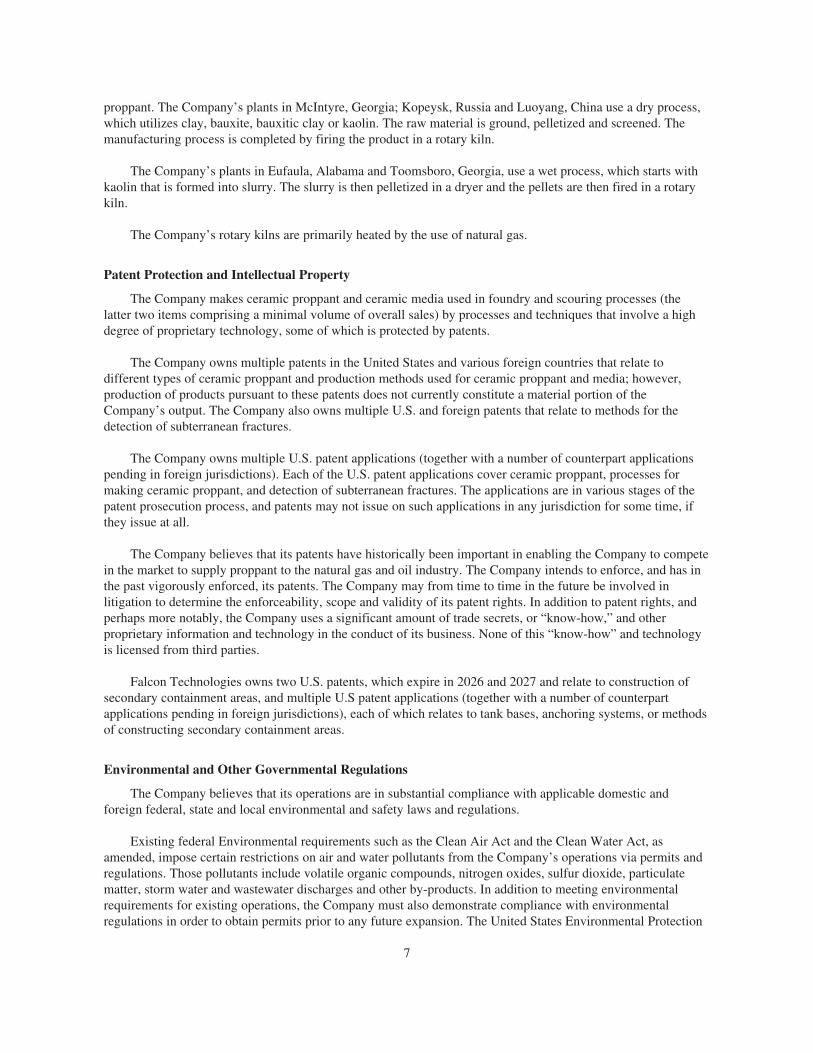
Item 1. Business . . . . . . . . . . . . . . . . . . . . . . . . . . . . . . . . . . . . . . . . . . . . . . . . . . . . . . . . . . . . . . . . . . . . . . 1Item 1A. Risk Factors . . . . . . . . . . . . . . . . . . . . . . . . . . . . . . . . . . . . . . . . . . . . . . . . . . . . . . . . . . . . . . . . . . . 10Item 1B. Unresolved Staff Comments . . . . . . . . . . . . . . . . . . . . . . . . . . . . . . . . . . . . . . . . . . . . . . . . . . . . . . 15Item 2. Properties . . . . . . . . . . . . . . . . . . . . . . . . . . . . . . . . . . . . . . . . . . . . . . . . . . . . . . . . . . . . . . . . . . . . . 15Item 3. Legal Proceedings . . . . . . . . . . . . . . . . . . . . . . . . . . . . . . . . . . . . . . . . . . . . . . . . . . . . . . . . . . . . . . 16Item 4. Mine Safety Disclosure . . . . . . . . . . . . . . . . . . . . . . . . . . . . . . . . . . . . . . . . . . . . . . . . . . . . . . . . . . 17
PART II
Item 5. Market for Registrant’s Common Equity, Related Stockholder Matters and Issuer Purchases ofEquity Securities . . . . . . . . . . . . . . . . . . . . . . . . . . . . . . . . . . . . . . . . . . . . . . . . . . . . . . . . . . . . . 18
Item 6. Selected Financial Data . . . . . . . . . . . . . . . . . . . . . . . . . . . . . . . . . . . . . . . . . . . . . . . . . . . . . . . . . . 20Item 7. Management’s Discussion and Analysis of Financial Condition and Results of Operations . . . . . 22Item 7A. Quantitative and Qualitative Disclosures about Market Risk . . . . . . . . . . . . . . . . . . . . . . . . . . . . . 29Item 8. Financial Statements and Supplementary Data . . . . . . . . . . . . . . . . . . . . . . . . . . . . . . . . . . . . . . . . 30Item 9. Changes in and Disagreements with Accountants on Accounting and Financial Disclosure . . . . . 30Item 9A. Controls and Procedures . . . . . . . . . . . . . . . . . . . . . . . . . . . . . . . . . . . . . . . . . . . . . . . . . . . . . . . . . 30Item 9B. Other Information . . . . . . . . . . . . . . . . . . . . . . . . . . . . . . . . . . . . . . . . . . . . . . . . . . . . . . . . . . . . . . 30
PART III
Item 10. Directors, Executive Officers and Corporate Governance . . . . . . . . . . . . . . . . . . . . . . . . . . . . . . . 31Item 11. Executive Compensation . . . . . . . . . . . . . . . . . . . . . . . . . . . . . . . . . . . . . . . . . . . . . . . . . . . . . . . . . 31Item 12. Security Ownership of Certain Beneficial Owners and Management and Related Stockholder
Matters . . . . . . . . . . . . . . . . . . . . . . . . . . . . . . . . . . . . . . . . . . . . . . . . . . . . . . . . . . . . . . . . . . . . . 31Item 13. Certain Relationships and Related Transactions, and Director Independence . . . . . . . . . . . . . . . . 31Item 14. Principal Accounting Fees and Services . . . . . . . . . . . . . . . . . . . . . . . . . . . . . . . . . . . . . . . . . . . . . 31
PART IV
Item 15. Exhibits and Financial Statement Schedules . . . . . . . . . . . . . . . . . . . . . . . . . . . . . . . . . . . . . . . . . 32Signatures . . . . . . . . . . . . . . . . . . . . . . . . . . . . . . . . . . . . . . . . . . . . . . . . . . . . . . . . . . . . . . . . . . . . . . . . . . . . . 33Management’s Report on Internal Control Over Financial Reporting . . . . . . . . . . . . . . . . . . . . . . . . . . . . . . . F-1Reports of Independent Registered Public Accounting Firm . . . . . . . . . . . . . . . . . . . . . . . . . . . . . . . . . . . . . . F-2Consolidated Financial Statements . . . . . . . . . . . . . . . . . . . . . . . . . . . . . . . . . . . . . . . . . . . . . . . . . . . . . . . . . . F-4
PART I
Item 1. Business
General
CARBO Ceramics Inc. (the “Company”) is the world’s largest supplier of ceramic proppant and, during2010, commenced the sale of resin-coated sand in order to broaden its proppant suite of products. The Companyis the provider of the industry’s most popular fracture simulation software, and a provider of fracture design andconsulting services, and a broad range of technologies for spill prevention, containment and countermeasures.The Company sells the majority of its products and services to operators of oil and natural gas wells and tooilfield service companies to help increase the production rates and the amount of oil and natural gas ultimatelyrecoverable from these wells. The Company’s products and services are primarily used in the hydraulicfracturing of natural gas and oil wells. The Company was incorporated in 1987 in Delaware. As used herein,“Company”, “we”, “our” and “us” may refer to the Company and/or its consolidated subsidiaries.
Hydraulic fracturing is the most widely used method of increasing production from oil and natural gaswells. The hydraulic fracturing process consists of pumping fluids down a natural gas or oil well at pressuressufficient to create fractures in the hydrocarbon-bearing rock formation. A granular material, called proppant, issuspended and transported in the fluid and fills the fracture, “propping” it open once high-pressure pumpingstops. The proppant-filled fracture creates a conductive channel through which the hydrocarbons can flow morefreely from the formation to the well and then to the surface.
There are three primary types of proppant that can be utilized in the hydraulic fracturing process: sand,resin-coated sand and ceramic. Sand is the least expensive proppant, resin-coated sand is more expensive andceramic proppant is typically the most expensive. The higher initial cost of ceramic proppant is justified by thefact that the use of these proppants in certain well conditions results in an increase in the production rate of oiland natural gas, an increase in the total oil or natural gas that can be recovered from the well and, consequently,an increase in cash flow for the operators of the well. The increased production rates are primarily attributable tothe higher strength and more uniform size and shape of ceramic proppant versus alternative materials.
The Company primarily manufactures five distinct ceramic proppants. CARBOHSP® and CARBOPROP®
are high strength proppants designed primarily for use in deep oil and gas wells. CARBOHSP® has the higheststrength of any of the ceramic proppants manufactured by the Company and is used primarily in the fracturing ofdeep oil and gas wells. CARBOPROP® is slightly lower in weight and strength than CARBOHSP® and wasdeveloped for use in deep oil and gas wells that do not require the strength of CARBOHSP®.
CARBOLITE®, CARBOECONOPROP® and CARBOHYDROPROP® are lightweight ceramic proppants.CARBOLITE® is used in medium depth oil and gas wells, where the additional strength of ceramic proppant maynot be essential, but where higher production rates can be achieved due to the product’s uniform size andspherical shape. CARBOECONOPROP® was introduced to compete directly with sand-based proppant, andCARBOHYDROPROP® was introduced in late 2007 to improve performance in “slickwater” fracture treatments.
During 2010, the Company began production of resin-coated ceramic (CARBOBOND® LITE®) and resin-coated sand (CARBOBOND®RCS) proppants. The introduction of CARBOBOND®LITE® addresses a nichemarket in which oil and natural gas wells are subject to the risk of proppant flow-back. In the case ofCARBOBOND®RCS, the Company made the strategic decision to offer a lower cost, lower conductivityalternative proppant, in addition to its ceramic proppant products thereby broadening its proppant suite ofproducts.
In addition, the Company manufactures CARBONRT®, a detectable proppant that utilizes a non-radioactivetracer material to assist operators in determining the locations of fractures in a natural gas or oil well. This traceris incorporated into proppant granules during the manufacturing process, and can be added to any of the types ofceramic proppant that the Company makes.
1

During the year ended December 31, 2012, the Company generated approximately 77% of its revenues inthe United States and 23% in international markets.
The Company also sells fracture simulation software and provides fracture design, engineering andconsulting services to oil and natural gas companies worldwide through its wholly-owned subsidiary, StrataGen,Inc. The Company provides a suite of stimulation software solutions to the industry that have marked capabilitiesfor on-site real-time analysis. This has enabled recognition and remediation of potential stimulation problems.This stimulation software is tightly integrated with reservoir simulators, thus allowing for stimulation treatmentand production optimization. The Company’s specialized engineering team consults and works with operatorsaround the world to help optimize well placement, fracture treatment design and production stimulation. Thebroad range of expertise of the Company’s consultants includes: fracture treatment design; completionengineering support; on-site treatment supervision, engineering and quality control; post-treatment evaluationand optimization; reservoir and fracture engineering studies; rock mechanics and software application andtraining.
Demand for most of the Company’s products and services depends primarily upon the demand for naturalgas and oil and on the number of natural gas and oil wells drilled, completed or re-completed worldwide. Morespecifically, the demand for the Company’s products and services is dependent on the number of oil and naturalgas wells that are hydraulically fractured to stimulate production.
The Company also provided a broad range of technologies and products for geotechnical monitoringthrough its wholly owned subsidiary Applied Geomechanics, Inc. (“AGI”). The AGI business was wound down,and the Company exited this business in late 2012.
Falcon Technologies and Services, Inc. (“Falcon Technologies”), a wholly-owned subsidiary of theCompany, provides spill prevention, containment and countermeasure systems for the oil and gas industry.Falcon Technologies uses proprietary technology to provide products that are designed to enable its clients toextend the life of their storage assets, reduce the potential for hydrocarbon spills and provide containment ofstored materials.
Competition
As the demand for resin-coated and ceramic proppant continues to be amplified by the large resource plays,the Company expects more entrants into the market for its products. One of the Company’s worldwide proppantcompetitors is Saint-Gobain Proppants (“Saint-Gobain”). Saint-Gobain is a division of Compagnie de Saint-Gobain, a large French glass and materials company. Saint-Gobain manufactures a variety of ceramic proppantsthat it markets in competition with each of the Company’s products. Saint-Gobain’s primary manufacturingfacility is located in Fort Smith, Arkansas. Saint-Gobain also manufactures ceramic proppant in China.Mineracao Curimbaba (“Curimbaba”), based in Brazil, is also a competitor and manufactures ceramic proppantsthat it markets in competition with some of the Company’s products. Imerys, S.A., based in France (“Imeyrs”),has begun to manufacture ceramic proppant in the State of Georgia, and is also a competitor of the Company. Inaddition, Pyramax, LLC is constructing a ceramic proppant plant in the State of Georgia, and may become acompetitor of the Company once the plant is completed.
There are two major manufacturers of ceramic proppant in Russia. Borovichi Refractory Plant (“Borovichi”)located in Borovichi, Russia, and FORES Refractory Plant (“FORES”) located in Ekaterinburg, Russia. Althoughthe Company has limited information about Borovichi and FORES, the Company believes that Borovichiprimarily manufactures intermediate strength ceramic proppants and markets its products principally withinRussia, and that FORES manufactures intermediate strength and lightweight ceramic proppant lines and marketsits products both inside and outside of Russia. The Company further believes that these companies have addedmanufacturing capacity in recent years and now provide a majority of the ceramic proppant used in Russia. The
2

Company is also aware of an increasing number of manufacturers in China. Most of these companies produceintermediate strength ceramic proppants that are marketed both inside and outside of China. Chinese proppantimports into the United States increased beginning in 2011.
Competition for CARBOHSP® and CARBOPROP® principally includes ceramic proppant manufactured bySaint-Gobain, Curimbaba and various producers located in China. The Company’s CARBOLITE®,CARBOECONOPROP® and CARBOHYDROPROP® products compete primarily with ceramic proppantproduced by Saint-Gobain, Curimbaba and Imerys and with sand-based proppant for use in the hydraulicfracturing of medium depth natural gas and oil wells. The leading suppliers of mined sand are Unimin Corp.,U.S. Silica Company, Badger Mining Corp., Fairmount Minerals Limited, Inc., and Ogelbay-Norton Company.The leading suppliers of resin-coated sand are Momentive Specialty Chemicals (formerly known as Hexion) andSantrol, a subsidiary of Fairmount Minerals.
The Company believes that the most significant factors that influence a customer’s decision to purchase theCompany’s ceramic proppant are (i) price/performance ratio, (ii) on-time delivery performance, (iii) technicalsupport and (iv) proppant availability. The Company believes that its products are competitively priced and thatits delivery performance is good. The Company also believes that its superior technical support has enabled it topersuade customers to use ceramic proppant in an increasingly broad range of applications and thus increased theoverall market for the Company’s products. Over the past five years, the Company has increased itsmanufacturing and resin-coating capacity by nearly 60% and plans to continue its strategy of adding capacity, asneeded, to meet anticipated future increases in sales demand.
Product Development
The Company continually conducts testing and development activities with respect to alternative rawmaterials to be used in the Company’s existing and alternative production methods. More specifically, theCompany has developed a new ceramic proppant with increased strength and conductivity when compared to itstraditional products. This new product is intended for use in ultra-high stress wells. The Company is currentlyscaling up its research and development pilot plant for commercial production, and plans to introduce thisproduct before the end of 2013. Accordingly, quantities of this new product are expected to be limited during2013. The Company continues to evaluate ways in which the technology utilized in this new productdevelopment may be applicable to its other product offerings. For information regarding the Company’s researchand development expenditures see Note 1 to the “Notes to Consolidated Financial Statements.”
The Company is actively involved in the development of alternative products for use as proppant in thehydraulic fracturing process and is aware of others engaged in similar development activities. The Companybelieves that while there are potential specialty applications for these products, they will not significantly impactthe use of ceramic proppants. The Company believes that the “know-how” and trade secrets necessary toefficiently manufacture a product of consistently high quality are difficult barriers to entry to overcome.
Customers and Marketing
The Company’s largest customers are participants in the petroleum pressure pumping industry. Specifically,Halliburton Energy Services, Inc. and Schlumberger Limited each accounted for more than 10% of theCompany’s 2012 and 2011 revenues. However, the end users of the Company’s products are the operators ofnatural gas and oil wells that hire the pressure pumping service companies to hydraulically fracture wells. TheCompany works both with the pressure pumping service companies and with the operators of natural gas and oilwells to present the technical and economic advantages of using ceramic proppant. The Company generallysupplies its customers with products on a just-in-time basis, as specified in individual purchase orders.Continuing sales of product depend on the Company’s direct customers and the well operators being satisfiedwith product quality, availability and delivery performance. The Company provides its software simulationproducts and consulting services directly to owners and/or operators of oil and gas wells and service companies.
3

The Company recognizes the importance of a technical marketing program in demonstrating long-termeconomic advantages when selling products and services that offer financial benefits over time. The Companyhas a broad technical sales force to advise end users on the benefits of using ceramic proppant, resin-coated sandand performing fracture simulation and consultation services.
Although the Company’s initial products were originally intended for use in deep wells that require high-strength proppant, the Company believes that there is economic benefit to well operators of using ceramicproppant in shallower wells that do not necessarily require a high-strength proppant. The Company believes thatits new product introductions and education-based technical marketing efforts have allowed it to capture sales inrecent years and will continue to do so in the future.
The Company provides a variety of technical support services and has developed computer software thatmodels the return on investment achievable by using the Company’s ceramic proppant versus alternatives in thehydraulic fracturing of a natural gas or oil well. In addition to the increased technical marketing effort, theCompany from time to time engages in field trials to demonstrate the economic benefits of its products andvalidate the findings of its computer simulations. Periodically, the Company provides proppant to productioncompanies for field trials, on a discounted basis, in exchange for a production company’s agreement to provideproduction data for direct comparison of the results of fracturing with ceramic proppant as compared toalternative proppants.
The Company’s international marketing efforts are conducted primarily through its sales offices in Dubai,United Arab Emirates; Aberdeen, Scotland; Beijing, China; and Moscow, Russia, and through commissionedsales agents located in South America. The Company’s products and services are used worldwide by U.S.customers operating domestically and abroad, and by foreign customers. Sales outside the United Statesaccounted for 23%, 21% and 23% of the Company’s sales for 2012, 2011 and 2010, respectively. Thedistribution of the Company’s international and domestic revenues is shown below, based upon the region inwhich the customer used the products and services:
For the years ended December 31,
2012 2011 2010
($ in millions)
LocationUnited States $500.1 $495.8 $365.4International 145.4 129.9 107.7
Total $645.5 $625.7 $473.1
Production Capacity
The Company believes that constructing adequate capacity ahead of demand while incorporating newtechnology to reduce manufacturing costs are important competitive strategies to increase its overall share of themarket for proppant.
Between 2006 and 2011, the Company, in successive phases, completed construction of four productionlines at its manufacturing facility in Toomsboro, Georgia. The stated annual production capacity at this facility is1.0 billion pounds per year.
During 2010, the Company began production from a resin-coating plant that was built within the existingmanufacturing infrastructure of its New Iberia, Louisiana facility. The resin-coating plant is utilized to coat bothceramic proppant manufactured at other Company locations and raw frac sand. A second resin-coatingproduction line at the facility was completed in 2012. The facility also functions as a distribution center.
During 2012, the Company began to utilize its own CARBO Northern White sand in its sand processingfacility in Marshfield, Wisconsin. This facility supplies sand to the resin-coating facility in New Iberia.
4

The following table sets forth the current stated capacity of each of the Company’s existing manufacturingand resin-coating facilities:
LocationAnnualCapacity
(millions of pounds)
Eufaula, Alabama 275McIntyre, Georgia 275Toomsboro, Georgia 1,000Luoyang, China 100Kopeysk, Russia 100
Total manufacturing capacity 1,750New Iberia, Louisiana – resin-coating 400 *
Total current capacity 2,150
* Processing activities at the New Iberia facility involve resin-coating of previously manufactured ceramicproppant substrate and raw frac sand.
In 2011, the Company completed the acquisition of real estate to construct a ceramic proppant plant in theMillen, Georgia area. The Company is moving forward with initial site preparation and construction of the first250 million pound line and anticipates the Millen plant could commence operation near the end of the firstquarter of 2014. Engineering and procurement activities commenced for a 600 million pound per year resin-coating plant in Marshfield, Wisconsin but the Company has deferred construction at this time. The Companywill consider resuming construction activities on this resin-coating plant when warranted by market conditions.Additionally, the Company is currently scaling up its research and development pilot plant for commercialproduction of the new ceramic proppant product that it plans to introduce before the end of 2013. Theconstruction of additional manufacturing capacity beyond these new facilities will be dependent on the expectedfuture demand for the Company’s products and the ability to obtain necessary environmental permits.
The Company generally supplies its domestic pumping service customers with products on a just-in-timebasis and operates without any material backlog.
Long-Lived Assets By Geographic Area
Long-lived assets, consisting of net property, plant and equipment, goodwill, intangibles, and other long-term assets as of December 31 in the United States and other countries are as follows:
2012 2011 2010
($ in millions)
Long-lived assets:United States . . . . . . . . . . . . . . . . . . . . . . . . . . . . . . . . . . $422.3 $397.5 $315.5International (primarily China and Russia) . . . . . . . . . . . 36.7 40.8 46.4
Total . . . . . . . . . . . . . . . . . . . . . . . . . . . . . . . . . . . . . $459.0 $438.3 $361.9
Distribution
The Company maintains finished goods inventories at each of its manufacturing facilities and at remotestocking facilities. The North American remote stocking facilities consist of bulk storage silos with truck trailerloading facilities, as well as rail yards for direct transloading from rail car to tank trucks. International remotestocking sites are duty-free warehouses operated by independent owners. North American sites are typicallysupplied by rail, and international sites are typically supplied by container ship. In total, the Company leases
5

approximately 2,100 rail cars for use in the distribution of its products and expects to add approximately 250more railcars by the end of 2013. The price of the Company’s products sold for delivery in the lower 48 UnitedStates and Canada typically includes just-in-time delivery of proppant to the operator’s well site, whicheliminates the need for customers to maintain an inventory of ceramic proppant. The Company expands itsdistribution network as needed, including rail car additions as well as increasing finished goods storage capacityat stocking locations. During the fourth quarter of 2012, the Company completed an expansion of its distributionfacility in South Texas and is targeting completion of an additional distribution center in the Bakken region in thesecond half of 2013.
Raw Materials
Ceramic proppant is made from alumina-bearing ores (commonly referred to as clay, bauxite, bauxitic clayor kaolin, depending on the alumina content) that are readily available on the world market. Bauxite is largelyused in the production of aluminum metal, refractory material and abrasives. The main known deposits ofalumina-bearing ores in the United States are in Arkansas, Alabama and Georgia; other economically mineableknown deposits are located in Australia, Brazil, China, Gabon, Guyana, India, Jamaica, Russia and Surinam.
For the production of CARBOHSP® and CARBOPROP® in the United States the Company uses bauxite,and has historically purchased its annual requirements at the seller’s current prices. The Company believes thatits ability to purchase bauxite on the open market and current bauxite inventories will sufficiently provide for itsbauxite needs in the United States during 2013.
The Company’s Eufaula, McIntyre and Toomsboro facilities primarily use locally mined kaolin for theproduction of CARBOLITE®, CARBOECONOPROP® and CARBOHYDROPROP®. The Millen facility, currentlyunder construction, will also use locally mined kaolin in its productions processes. The Company has entered intobi-lateral contracts that require a supplier to sell to the Company, and the Company to purchase from the supplier, atleast fifty percent of the Eufaula facility’s and Millen facility’s annual kaolin requirements. The Eufaula contractruns through 2017, with options to extend this agreement for additional three year terms. The Millen contract willbegin upon the date in which the plant commences operations and extend for an initial period of five years, withoptions to extend the agreement for an additional five years. The Company has obtained ownership rights in acreagein Wilkinson County, Georgia, which contains in excess of a fifteen year supply of kaolin for its Georgia facilities atcurrent production rates. The Company has entered into a long-term agreement with a third party to mine andtransport this material at a fixed price subject to annual adjustment. The agreement requires the Company to utilizethe third party to mine and transport a majority of the McIntyre facility’s annual kaolin requirement.
The Company’s production facility in Luoyang, China, uses both kaolin and bauxite for the production ofCARBOPROP® and CARBOLITE®. Certain of these materials are purchased under a long-term contract thatstipulates fixed prices subject to periodic adjustment and provides for minimum purchase requirements.
The Company’s production facility in Kopeysk, Russia currently uses bauxite for the production ofCARBOPROP®. Bauxite is purchased under annual agreements that stipulate fixed prices for up to a specifiedquantity of material.
The Company continues to explore options for the purchase of high quality raw materials for its resin-coatedsand business. In 2011, the Company secured a five-year contract with a supplier and consummated the purchaseof two parcels of property containing sand reserves. During 2012, the Company began to utilize its own CARBONorthern White sand in its sand processing facility in Marshfield, Wisconsin, which supplies the Company’sresin-coating facility in New Iberia, Louisiana.
Ceramic Production Process
Ceramic proppants are made by grinding or dispersing ore to a fine powder, combining the powder intosmall pellets and firing the pellets in a rotary kiln. The Company uses two different methods to produce ceramic
6
proppant. The Company’s plants in McIntyre, Georgia; Kopeysk, Russia and Luoyang, China use a dry process,which utilizes clay, bauxite, bauxitic clay or kaolin. The raw material is ground, pelletized and screened. Themanufacturing process is completed by firing the product in a rotary kiln.
The Company’s plants in Eufaula, Alabama and Toomsboro, Georgia, use a wet process, which starts withkaolin that is formed into slurry. The slurry is then pelletized in a dryer and the pellets are then fired in a rotarykiln.
The Company’s rotary kilns are primarily heated by the use of natural gas.
Patent Protection and Intellectual Property
The Company makes ceramic proppant and ceramic media used in foundry and scouring processes (thelatter two items comprising a minimal volume of overall sales) by processes and techniques that involve a highdegree of proprietary technology, some of which is protected by patents.
The Company owns multiple patents in the United States and various foreign countries that relate todifferent types of ceramic proppant and production methods used for ceramic proppant and media; however,production of products pursuant to these patents does not currently constitute a material portion of theCompany’s output. The Company also owns multiple U.S. and foreign patents that relate to methods for thedetection of subterranean fractures.
The Company owns multiple U.S. patent applications (together with a number of counterpart applicationspending in foreign jurisdictions). Each of the U.S. patent applications cover ceramic proppant, processes formaking ceramic proppant, and detection of subterranean fractures. The applications are in various stages of thepatent prosecution process, and patents may not issue on such applications in any jurisdiction for some time, ifthey issue at all.
The Company believes that its patents have historically been important in enabling the Company to competein the market to supply proppant to the natural gas and oil industry. The Company intends to enforce, and has inthe past vigorously enforced, its patents. The Company may from time to time in the future be involved inlitigation to determine the enforceability, scope and validity of its patent rights. In addition to patent rights, andperhaps more notably, the Company uses a significant amount of trade secrets, or “know-how,” and otherproprietary information and technology in the conduct of its business. None of this “know-how” and technologyis licensed from third parties.
Falcon Technologies owns two U.S. patents, which expire in 2026 and 2027 and relate to construction ofsecondary containment areas, and multiple U.S patent applications (together with a number of counterpartapplications pending in foreign jurisdictions), each of which relates to tank bases, anchoring systems, or methodsof constructing secondary containment areas.
Environmental and Other Governmental Regulations
The Company believes that its operations are in substantial compliance with applicable domestic andforeign federal, state and local environmental and safety laws and regulations.
Existing federal Environmental requirements such as the Clean Air Act and the Clean Water Act, asamended, impose certain restrictions on air and water pollutants from the Company’s operations via permits andregulations. Those pollutants include volatile organic compounds, nitrogen oxides, sulfur dioxide, particulatematter, storm water and wastewater discharges and other by-products. In addition to meeting environmentalrequirements for existing operations, the Company must also demonstrate compliance with environmentalregulations in order to obtain permits prior to any future expansion. The United States Environmental Protection
7

Agency (“EPA”) and state programs require covered facilities to obtain individual permits or have coverageunder an EPA general permit issued to groups of facilities. A number of federal and state agencies, including butnot limited to, the EPA, the Texas Commission of Environmental Quality, the Louisiana Department ofEnvironmental Quality, the Alabama Department of Environmental Management, the Wisconsin Department ofNatural Resources, and the Georgia Environmental Protection Division, in states in which we do business, haveenvironmental regulations applicable to our operations. Historically we have been able to obtain permits, wherenecessary, to build new facilities and modify existing facilities that allow us to continue compliant operations andobtaining these permits in a timely manner will continue to be an important factor in the Company’s ability to doso in the future.
Employees
As of December 31, 2012, the Company had 992 employees worldwide. In addition to the services of itsemployees, the Company employs the services of consultants as required. The Company’s employees are notrepresented by labor unions. There have been no work stoppages or strikes during the last three years that haveresulted in the loss of production or production delays. The Company believes its relations with its employees aresatisfactory.
Executive Officers of the Registrant
Gary A. Kolstad (age 54) was elected in June 2006, by the Company’s Board of Directors to serve asPresident and Chief Executive Officer and a Director of the Company. Mr. Kolstad previously served in a varietyof positions over 21 years with Schlumberger, Ltd. Mr. Kolstad became a Vice President of Schlumberger, Ltd.in 2001, where he last held the positions of Vice President, Oilfield Services – U.S. Onshore and Vice President,Global Accounts.
Ernesto Bautista III (age 41) joined the Company as a Vice President and Chief Financial Officer in January2009. From July 2006 until joining the Company, Mr. Bautista served as Vice President and Chief FinancialOfficer of W-H Energy Services, Inc., a Houston, Texas based diversified oilfield services company (“W-HEnergy”). From July 2000 to July 2006, he served as Vice President and Corporate Controller of W-H Energy.From September 1994 to May 2000, Mr. Bautista served in various positions at Arthur Andersen LLP, mostrecently as a manager in the assurance practice, specializing in emerging, high growth companies. Mr. Bautista isa certified public accountant in the State of Texas.
Mark L. Edmunds (age 57) has been the Vice President, Operations since April 2002. From 2000 untiljoining the Company, Mr. Edmunds served as Business Unit Manager and Plant Manager for FMC Corporation.Prior to 2000, Mr. Edmunds served Union Carbide Corporation and The Dow Chemical Company in a variety ofmanagement positions, including Director of Operations, Director of Internal Consulting and ManufacturingOperations Manager.
Don P. Conkle (age 48) was appointed Vice President, Marketing and Sales in October 2012. Mr. Conklepreviously held a variety of domestic and international managerial positions in engineering, marketing and sales,and technology development over a 26 year period with Schlumberger, Ltd. He served in the positions of VicePresident of Stimulation Services from 2007 until 2009, as GeoMarket Manager (Qatar & Yemen) from 2009until 2011 and as Production Group Marketing and Technology Director from 2011 until he joined the Company.
R. Sean Elliott (age 38) joined the Company in November 2007 as General Counsel, and was appointed asCorporate Secretary and Chief Compliance Officer in January 2008 and as a Vice President of the Company inMay 2011. Previously, Mr. Elliott served as legal counsel to Aviall, Inc. (an international aviation company)from 2004 to 2007, where he last held the positions of Assistant General Counsel and Assistant Secretary. From1999 until 2004, Mr. Elliott practiced law with Haynes and Boone, LLP, a Dallas, Texas-based law firm.
8

All officers are elected for one-year terms or until their successors are duly elected. There are noarrangements between any officer and any other person pursuant to which he was selected as an officer. There isno family relationship between any of the named executive officers or between any of them and the Company’sdirectors.
Forward-Looking Information
The Private Securities Litigation Reform Act of 1995 provides a “safe harbor” for forward-lookingstatements. This Form 10-K, the Company’s Annual Report to Shareholders, any Form 10-Q or any Form 8-K ofthe Company or any other written or oral statements made by or on behalf of the Company may include forward-looking statements which reflect the Company’s current views with respect to future events and financialperformance. The words “believe”, “expect”, “anticipate”, “project”, “estimate”, “forecast”, “plan” or “intend”and similar expressions identify forward-looking statements. Readers are cautioned not to place undue relianceon these forward-looking statements, each of which speaks only as of the date the statement was made. TheCompany undertakes no obligation to publicly update or revise any forward-looking statements, whether as aresult of new information, future events or otherwise. The Company’s forward-looking statements are based onassumptions that we believe to be reasonable but that may not prove to be accurate. All of the Company’sforward-looking information is subject to risks and uncertainties that could cause actual results to differmaterially from the results expected. Although it is not possible to identify all factors, these risks anduncertainties include the risk factors discussed below.
The Company’s results of operations could be adversely affected if its business assumptions do not prove tobe accurate or if adverse changes occur in the Company’s business environment, including but not limited to:
• a potential decline in the demand for oil and natural gas;
• potential declines or increased volatility in oil and natural gas prices that would adversely affect ourcustomers, the energy industry or our production costs;
• potential reductions in spending on exploration and development drilling in the oil and natural gasindustry that would reduce demand for our products and services;
• an increase in competition in the proppant market;
• logistical and distribution challenges relating to certain resource plays that do not have the type ofinfrastructure systems that are needed to efficiently support oilfield services activities;
• the development of alternative stimulation techniques, such as extraction of oil or gas withoutfracturing;
• increased governmental regulation of hydraulic fracturing;
• increased regulation of emissions from our manufacturing facilities;
• the development of alternative proppants for use in hydraulic fracturing;
• general global economic and business conditions;
• an increase in raw materials costs;
• fluctuations in foreign currency exchange rates; and
• the potential expropriation of assets by foreign governments.
The Company’s results of operations could also be adversely affected as a result of worldwide economic,political and military events, including, but not limited to, war, terrorist activity or initiatives by the Organizationof the Petroleum Exporting Countries (“OPEC”). For further information, see “Item 1A. Risk Factors.”
9

Available Information
The Company’s annual reports on Form 10-K, proxy statements, quarterly reports on Form 10-Q, currentreports on Form 8-K and amendments to those reports filed or furnished pursuant to Section 13(a) or 15(d) of theSecurities Exchange Act of 1934 (“Exchange Act”) are made available free of charge on the Company’s internetwebsite at http://www.carboceramics.com as soon as reasonably practicable after such material is filed with, orfurnished to, the Securities and Exchange Commission (“SEC”).
The public may read and copy any materials that the Company files with the SEC at the SEC’s PublicReference Room at 100 F Street, Room 1580, N.E., Washington, D.C. 20549. The public may obtain informationon the operation of the Public Reference Room by calling the SEC at 1-800-SEC-0330. The SEC maintains anInternet site that contains reports, proxy and information statements, and other information regarding issuers thatfile electronically with the SEC, at http://www.sec.gov.
Item 1A. Risk Factors
You should consider carefully the trends, risks and uncertainties described below and other information inthis Form 10-K and subsequent reports filed with the SEC before making any investment decision with respect toour securities. If any of the following trends, risks or uncertainties actually occurs or continues, our business,financial condition or operating results could be materially adversely affected, the trading prices of our securitiescould decline, and you could lose all or part of your investment.
Our business and financial performance depend on the level of activity in the natural gas and oil industries.
Our operations are materially dependent upon the levels of activity in natural gas and oil exploration,development and production. More specifically, the demand for our products is closely related to the number ofnatural gas and oil wells completed in geologic formations where ceramic or resin-coated sand proppants areused in fracture treatments. These activity levels are affected by both short-term and long-term trends in naturalgas and oil prices. In recent years, natural gas and oil prices and, therefore, the level of exploration, developmentand production activity, have experienced significant fluctuations. Worldwide economic, political and militaryevents, including war, terrorist activity, events in the Middle East and initiatives by OPEC, have contributed, andare likely to continue to contribute, to price volatility. Additionally, warmer than normal winters in NorthAmerica and other weather patterns may adversely impact the short-term demand for natural gas and, therefore,demand for our products and services. Natural gas prices experienced a significant decline during the second halfof 2011 and continued throughout 2012, which resulted in a decline in the United States drilling rig count during2012. A prolonged reduction in natural gas and oil prices would generally depress the level of natural gas and oilexploration, development, production and well completions activity and result in a corresponding decline in thedemand for our products. Such a decline could have a material adverse effect on our results of operations andfinancial condition.
Our business and financial performance could suffer if the levels of hydraulic fracturing decrease or ceaseas a result of the development of new processes, increased regulation or a decrease in horizontal drillingactivity.
Substantially all of our products are proppants used in the completion and re-completion of natural gas andoil wells through the process of hydraulic fracturing. In addition, demand for our proppants is substantiallyhigher in the case of horizontally drilled wells, which allow for multiple hydraulic fractures within the same wellbore but are more expensive to develop than vertically drilled wells. A reduction in horizontal drilling or thedevelopment of new processes for the completion of natural gas and oil wells leading to a reduction in, ordiscontinuation of the use of, hydraulic fracturing could cause a decline in demand for our products.Additionally, increased regulation or environmental restrictions on hydraulic fracturing or the materials used inthis process could negatively affect our business by increasing the costs of compliance or resulting in operational
10

delays, which could cause operators to abandon the process due to commercial impracticability. Moreover, it ispossible that future federal, state or foreign laws or regulations could otherwise limit or ban hydraulic fracturing.Any of these events could have a material adverse effect on our results of operations and financial condition.
We face distribution and logistical challenges in our business
As oil and natural gas prices fluctuate, our customers may shift their focus back and forth between differentresource plays, some of which can be located in geographic areas that do not have well-developed transportationand distribution infrastructure systems. Transportation and logistical operating expenses continue to comprise asignificant portion of our total delivered cost of sales. Therefore, serving our clients in these less-developed areaspresents distribution and other operational challenges that affect our sales and negatively impact our operatingcosts. Disruptions in transportation services, including shortages of rail cars or a lack of rail transportationservices or developed infrastructure, could affect our ability to timely and cost effectively deliver to ourcustomers and could provide a competitive advantage to competitors located in closer proximity to customers.Additionally, increases in the price of diesel fuel could negatively impact operating costs if we are unable to passthose increased costs along to our customers. While we made several distribution and infrastructure investmentsduring 2012, we continue to work on long-term solutions to the changing distribution environment. Failure tofind long-term solutions to these logistical challenges could adversely affect our ability to respond quickly to theneeds of our customers or result in additional increased costs, and thus could negatively impact our results ofoperations and financial condition.
We operate in an increasingly competitive market.
The proppant market is highly competitive and no one supplier is dominant. We compete with otherdomestic and international suppliers of ceramic proppant, as well as with suppliers of sand and resin-coated sandfor use as proppant, in the hydraulic fracturing of natural gas and oil wells. The expiration of key patents ownedby the Company has resulted in additional competition in the market for ceramic proppant. The entry ofadditional competitors into the market to supply ceramic proppant could have a material adverse effect on ourresults of operations and financial condition.
We may be adversely affected by decreased demand for our proppant or the development by our competitorsof effective alternative proppants.
Ceramic proppant is a premium product capable of withstanding higher pressure and providing more highlyconductive fractures than mined sand, which is the most commonly used proppant type. Although we believe thatthe use of ceramic proppant or resin-coated sand generates higher production rates and more favorableproduction economics than mined sand, a significant shift in demand from ceramic proppant or resin-coated sandto mined sand could have a material adverse effect on our results of operations and financial condition. Thedevelopment and use of effective alternative proppant could also cause a decline in demand for our products, andcould have a material adverse effect on our results of operations and financial condition.
We rely upon, and receive a significant percentage of our revenues from, a limited number of keycustomers.
During 2012, our key customers included several of the largest participants in the worldwide petroleumpressure pumping industry. Although the end users of our products are numerous operators of natural gas and oilwells that hire pressure pumping service companies to hydraulically fracture wells, two customers accountedcollectively for approximately 49% of our 2012 revenues. We generally supply our domestic pumping servicecustomers with products on a just-in-time basis, with transactions governed by individual purchase orders.Continuing sales of product depend on our direct customers and the end user well operators being satisfied withproduct quality, availability and delivery performance. Although we believe our relations with our customers andthe major well operators are satisfactory, a material decline in the level of sales to any one of our major
11

customers due to unsatisfactory product performance, delivery delays or any other reason could have a materialadverse effect on our results of operations and financial condition.
The operations of our customers are subject to a number of operational risks and interruptions andseasonal variations, including inclement weather.
As hydraulic fracturing jobs have increased in size and intensity, common issues such as weather,equipment delays or changes in the location and types of oil and natural gas plays can result in increasedvariability in proppant sales volumes. Our business operations and those of our customers involve a high degreeof operational risk. Natural disasters, adverse weather conditions, collisions and operator error could causepersonal injury or loss of life, severe damage to and destruction of property, equipment and the environment, andsuspension of operations. Our customers perform work that is subject to unexpected or arbitrary interruption ortermination. The occurrence of any of these events could result in work stoppage, loss of revenue, casualty loss,increased costs and significant liability to third parties. We have not historically considered seasonality to be asignificant risk, but with the increase in resource plays in the northern and eastern United States as well as ouroperations in Marshfield, Wisconsin, our results of operations are exposed to seasonal variations and inclementweather. Operations in these regions involve more seasonal risk in the winter months, and work is hinderedduring other inclement weather events. The ability of our customers to complete work, as well as our ability tomine sand from cold climate areas, could be affected during the winter months. Our revenue and profitabilitycould decrease during these periods and in other severe weather conditions because work is either prevented ormore costly to complete. If a substantial amount of production is interrupted, our cash flow and, in turn, ourresults of operations could be materially and adversely affected.
A significant portion of our ceramic proppant is manufactured at one of our plants. Any adversedevelopments at that plant could have a material adverse effect on our financial condition and results ofoperations.
Our Toomsboro, Georgia plant represents approximately 47% of our total annual capacity at our existingmanufacturing facilities. Any adverse developments at this plant, including a material disruption in production,an inability to supply the plant with raw materials at a competitive cost, or adverse developments due tocatastrophic events, could have a material adverse effect on our financial condition and results of operations.
We provide environmental warranties on certain of our containment and spill prevention products.
Falcon Technologies’ tank liners, secondary containments and related products and services are designed tocontain or avoid spills of hydrocarbons and other materials. If a release of these materials occurs, it could beharmful to the environment. Although we attempt to negotiate appropriate limitations of liability in the applicableterms of sale, some customers have required expanded warranties, indemnifications or other terms that couldhold Falcon Technologies responsible in the event of a spill or release under particular circumstances. If FalconTechnologies is held responsible for a spill or release of materials from one of its customer’s facilities, it couldhave a material adverse effect on our results of operations and financial condition.
We rely upon intellectual property to protect our proprietary rights. Failure to protect our intellectualproperty rights may affect our competitive position, and protecting our rights or defending against third-party allegations of infringement may be costly.
The Company uses a significant amount of trade secrets, or “know-how,” and other proprietary informationand technology in the conduct of its business. In some cases, we rely on trade secrets, trademarks or contractualrestrictions to protect intellectual property rights that are not patented. The steps we take to protect the non-patented intellectual property may not be sufficient to protect it and any loss or diminishment of such intellectualproperty rights could negatively impact our competitive advantage. Additionally, it is possible our competitorscould independently develop the same or similar technologies that are only protected by trade secret and thus do
12

not prevent third parties from competing with us. Furthermore, even protected intellectual property rights can beinfringed upon by third parties. Monitoring unauthorized use of Company intellectual property can be difficultand expensive, and adequate remedies may not be available.
Although the Company does not believe that it is infringing upon the intellectual property rights of others byusing such proprietary information and technology, it is possible that such a claim will be asserted against theCompany in the future. In the event any third party makes a claim against us for infringement of patents or otherintellectual property rights of a third party, such claims, with or without merit, could be time-consuming andresult in costly litigation. In addition, the Company could experience loss or cancellation of customer orders,experience product shipment delays, or be subject to significant liabilities to third parties. If our products orservices were found to infringe on a third party’s proprietary rights, the Company could be required to enter intoroyalty or licensing agreements to continue selling its products or services. Royalty or licensing agreements, ifrequired, may not be available on acceptable terms, if at all, which could seriously harm our business.Involvement in any patent dispute or other intellectual property dispute or action to protect trade secrets andexpertise could have a material adverse effect on the Company’s business.
Significant increases in fuel prices for any extended periods of time will increase our operating expenses.
The price and supply of natural gas are unpredictable, and can fluctuate significantly based on international,political and economic circumstances, as well as other events outside of our control, such as changes in supplyand demand due to weather conditions, actions by OPEC and other oil and gas producers, regional productionpatterns and environmental concerns. Natural gas is a significant component of our direct manufacturing costsand price escalations will likely increase our operating expenses and can have a negative impact on income fromoperations and cash flows. We operate in a competitive marketplace and may not be able to pass through all ofthe increased costs that could result from an increase in the cost of natural gas.
Environmental compliance costs and liabilities could reduce our earnings and cash available foroperations.
We are subject to increasingly stringent laws and regulations relating to environmental protection, includinglaws and regulations governing air emissions, water discharges and waste management. The technicalrequirements of complying with these environmental laws and regulations are becoming increasingly expensiveand complex, and may affect the Company’s ability to expand its operations. Our ability to continue theexpansion of our manufacturing capacity to meet market demand is contingent upon obtaining requiredenvironmental permits and compliance with their terms, which continue to be more restrictive and require longerlead times to obtain in anticipation of any efforts to expand and increase capacity. We incur, and expect tocontinue to incur, capital and operating costs to comply with environmental laws and regulations.
In addition, we use some hazardous substances and generate certain industrial wastes in our operations.Many of our current and former properties are or have been used for industrial purposes. Accordingly, we couldbecome subject to potentially material liabilities relating to the investigation and cleanup of contaminatedproperties, and to claims alleging personal injury or property damage as the result of exposures to, or releases of,hazardous substances. These laws also may provide for “strict liability” for damages to natural resources orthreats to public health and safety. Strict liability can render a party liable for environmental damage withoutregard to negligence or fault on the part of the party. Some environmental laws provide for joint and several strictliability for remediation of spills and releases of hazardous substances.
Stricter enforcement of existing laws and regulations, new laws and regulations, the discovery of previouslyunknown contamination or the imposition of new or increased requirements could restrict our expansion efforts,require us to incur costs, or become the basis of new or increased liabilities. Any of these events could reduce ourearnings and our cash available for operations.
13

Our international operations subject us to risks inherent in doing business on an international level thatcould adversely impact our results of operations.
International revenues accounted for approximately 23%, 21% and 23% of our total revenues in 2012, 2011and 2010, respectively. We may not succeed in overcoming the risks that relate to or arise from operating ininternational markets. Risks inherent in doing business on an international level include, among others, thefollowing:
• economic and political instability (including as a result of the threat or occurrence of armedinternational conflict or terrorist attacks);
• changes in regulatory requirements, tariffs, customs, duties and other trade barriers;
• transportation delays and costs;
• power supply shortages and shutdowns;
• difficulties in staffing and managing foreign operations and other labor problems;
• currency rate fluctuations, convertibility and repatriation;
• taxation of our earnings and the earnings of our personnel;
• potential expropriation of assets by foreign governments; and
• other risks relating to the administration of or changes in, or new interpretations of, the laws,regulations and policies of the jurisdictions in which we conduct our business.
In particular, we are subject to risks associated with our production facilities in Luoyang, China, andKopeysk, Russia. The legal systems in both China and Russia are still developing and are subject to change.Accordingly, our operations and orders for products in both countries could be adversely impacted by changes toor interpretation of each country’s law. Further, if manufacturing in either region is disrupted, our overallcapacity could be significantly reduced and sales and/or profitability could be negatively impacted.
The manufacture of resin-coated sand is a new process for us.
Resin-coated sand is an alternative to the Company’s traditional ceramic proppant and involves a differentmanufacturing process that utilizes a different raw material. The expansion of our resin-coated sand operations isdriven by market demand and involves capital expenditures and new operational requirements. If we are unableto secure adequate, cost effective supply commitments for the raw materials associated with resin-coated sand orif we are unable to timely and cost effectively construct additional manufacturing capacity and infrastructure toproduce resin-coated sand, our ability to sell this product to the marketplace at profitable margins may beadversely impacted. A lack of sales of resin-coated sand or the inability to control the costs associated withmanufacturing this product could have a material adverse effect on our results from operations and financialcondition.
Undetected defects in our fracture simulation software could adversely affect our business.
Despite extensive testing, our software could contain defects, bugs or performance problems. If any of theseproblems are not detected, the Company could be required to incur extensive development costs or costs relatedto product recalls or replacements. The existence of any defects, errors or failures in our software products maysubject us to liability for damages, delay the development or release of new products and adversely affect marketacceptance or perception of our software products or related services, any one of which could materially andadversely affect the Company’s business, results of operations and financial condition.
14

The market price of our common stock will fluctuate, and could fluctuate significantly.
The market price of the Company’s common stock will fluctuate, and could fluctuate significantly, inresponse to various factors and events, including the following:
• the liquidity of the market for our common stock;
• differences between our actual financial or operating results and those expected by investors andanalysts;
• changes in analysts’ recommendations or projections;
• new statutes or regulations or changes in interpretations of existing statutes and regulations affectingour business;
• changes in general economic or market conditions; and
• broad market fluctuations.
Our actual results could differ materially from results anticipated in forward-looking statements we make.
Some of the statements included or incorporated by reference in this Form 10-K are forward-lookingstatements. These forward-looking statements include statements relating to trends in the natural gas and oilindustries, the demand for ceramic proppant and our performance in the “Management’s Discussion and Analysisof Financial Condition and Results of Operations” and “Business” sections of this Form 10-K. In addition, wehave made and may continue to make forward-looking statements in other filings with the SEC, and in writtenmaterial, press releases and oral statements issued by us or on our behalf. Forward-looking statements includestatements regarding the intent, belief or current expectations of the Company or its officers. Our actual resultscould differ materially from those anticipated in these forward-looking statements. (See “Business–Forward-Looking Information.”)
Item 1B. Unresolved Staff Comments
Not applicable.
Item 2. Properties
The Company maintains its corporate headquarters in leased office space in Houston and also leases spacefor its technology center in Houston. The Company owns its manufacturing facilities, land and substantially all ofthe related production equipment in New Iberia, Louisiana, Eufaula, Alabama, and Kopeysk, Russia and leasesits McIntyre and Toomsboro, Georgia, facilities. The Company owns the buildings and production equipment atits facility in Luoyang, China, and has been granted use of the land on which the facility is located through 2051under the terms of a land use agreement with the People’s Republic of China.
The facilities in McIntyre and Toomsboro, Georgia, include real property, plant and equipment that areleased by the Company from the Development Authority of Wilkinson County. The original lease was executedin 1997 and was last amended in 2008. The term of the current lease, which covers both locations, terminates onNovember 1, 2013, subject to the Company’s ability to renew the lease through November 2022. Under the termsof the lease, the Company is responsible for all costs incurred in connection with the premises, including costs ofconstruction of the plant and equipment. At the termination of the lease, title to all of the real property, plant andequipment is to be conveyed to the Company in exchange for nominal consideration. The Company has the rightto purchase the property, plant and equipment at any time during the term of the lease for a nominal price.
In 2011, the Company purchased land in Millen, Georgia for development and construction of a newceramic proppant manufacturing facility. The Company is moving forward with initial site preparation andconstruction of the first 250 million pound line and anticipates the Millen plant could commence operation near
15

the end of the first quarter of 2014. In November 2012, the Company entered into a lease for the land andimprovements associated with the Millen facility. The lease term continues until the tenth anniversary of thecompletion of the last phase of the facility. Similar to lease terms of the two other Georgia facilities, the Millenlease requires the Company to be responsible for all costs (including construction costs) incurred in connectionwith the premises. Moreover, title to the real property, plant and equipment of the facility is to be conveyed to theCompany at the end of the lease term for nominal consideration, and may be purchased by the Company at anytime for a nominal price.
The Marshfield, Wisconsin sand processing plant, which became operational during 2012, and the resin-coating facility for which construction has been currently deferred are located on land owned by the Company.
The Company owns or otherwise utilizes distribution facilities in multiple locations around the world. See“Item 1. Business – Distribution.”
The Company owns approximately 4,150 acres of land and leasehold interests near its plants in Georgia andAlabama. The land contains raw material for use in the production of the Company’s lightweight ceramicproppants. The Company also holds approximately 490 acres of land and leasehold interests in Wisconsin near itsresin-coating facility under construction in Marshfield, Wisconsin.
Falcon Technologies owns its service facility located in Decatur, Texas, and leases other regional servicefacilities within the United States.
Item 3. Legal Proceedings
On February 9, 2012, the Company and two of its officers, Gary A. Kolstad and Ernesto Bautista III, werenamed as defendants in a purported class-action lawsuit filed in the United States District Court for the SouthernDistrict of New York (the “February SDNY Lawsuit”), brought on behalf of shareholders who purchased theCompany’s Common Stock between October 27, 2011 and January 26, 2012 (the “Relevant Time Period”). OnApril 10, 2012, a second purported class-action lawsuit was filed against the same defendants in the United StatesDistrict Court for the Southern District of New York, brought on behalf of shareholders who purchased or soldCARBO Ceramics Inc. option contracts during the Relevant Time Period (the “April SDNY Lawsuit”, andcollectively with the February SDNY Lawsuit, the “Federal Securities Lawsuit”). In June 2012, the FebruarySNDY Lawsuit and the April SDNY Lawsuit were consolidated, and will now proceed as one lawsuit. TheFederal Securities Lawsuit alleges violations of the federal securities laws arising from statements concerning theCompany’s business operations and business prospects that were made during the Relevant Time Period andrequests unspecified damages and costs. In September 2012, the Company and Messrs. Kolstad and Bautista fileda motion to dismiss this lawsuit. Response and reply briefs on this motion were filed during the fourth quarter of2012, and a decision from the Court is pending.
On June 13, 2012, the Directors of the Company and Mr. Bautista were named as defendants in a purportedderivative action lawsuit brought on behalf of the Company by a stockholder in District Court in Harris County,Texas (the “June Harris County Lawsuit”). This lawsuit alleges various breaches of fiduciary duty and otherduties by the defendants that generally are related to the February SDNY Lawsuit as well as a breach of duty bycertain defendants in connection with stock sales. This lawsuit also requests unspecified damages and costs. Theparties to the June Harris County Lawsuit have also entered into an agreement to stay further proceedingspending the outcome of a motion to dismiss the Federal Securities Lawsuit.
While each of the Federal Securities Lawsuit and the June Harris County Lawsuit are in their preliminarystages, the Company does not believe they have merit, and plans to vigorously contest and defend against them.
Additionally, from time to time, the Company is the subject of legal proceedings arising in the ordinarycourse of business. The Company does not believe that any of these proceedings will have a material effect on itsbusiness or its results of operations.
16

The Company cannot predict the ultimate outcome or duration of any lawsuit described in this report.
Item 4. Mine Safety Disclosure
Several of our U.S. manufacturing facilities process mined minerals, and therefore are viewed as mineoperations subject to regulation by the federal Mine Safety and Health Administration under the Federal MineSafety and Health Act of 1977. Information concerning mine safety violations or other regulatory mattersrequired by section 1503(a) of the Dodd-Frank Wall Street Reform and Consumer Protection Act and therecently proposed Item 106 of Regulation S-K (17 CFR 229.106) is included in Exhibit 95 to this annual report.
17

PART II
Item 5. Market for Registrant’s Common Equity, Related Stockholder Matters and Issuer Purchases ofEquity Securities
Common Stock Market Prices, Dividends and Stock Repurchases
The Company’s common stock is traded on the New York Stock Exchange (ticker symbol CRR). Thenumber of record and beneficial holders of the Company’s common stock as of February 1, 2013 wasapproximately 24,696.
The following table sets forth the high and low sales prices of the Company’s common stock on the NewYork Stock Exchange and dividends for the last two fiscal years:
2012 2011
Sales Price CashDividends
Declared (1)
Sales Price CashDividends
Declared (2)Quarter Ended High Low High Low
March 31 $133.99 $85.94 $0.48 $141.12 $ 98.80 $0.40June 30 105.45 72.33 — 162.95 127.54 —September 30 86.26 62.92 0.54 180.25 102.53 0.48December 31 81.67 61.00 — 155.94 94.18 —
(1) Represents quarters during which dividends were declared. The payment months for cash dividends wereFebruary 2012 ($0.24), May 2012 ($0.24), August 2012 ($0.27) and November 2012 ($0.27).
(2) Represents quarters during which dividends were declared. The payment months for cash dividends wereFebruary 2011 ($0.20), May 2011 ($0.20), August 2011 ($0.24) and November 2011 ($0.24).
The Company currently expects to continue its policy of paying quarterly cash dividends, although there canbe no assurance as to future dividends because they depend on future earnings, capital requirements and financialcondition.
On August 28, 2008, the Company’s Board of Directors authorized the repurchase of up to two millionshares of the Company’s common stock. Shares are effectively retired at the time of purchase. The Company didnot repurchase any shares under this repurchase plan during the fourth quarter of 2012. As of December 31,2012, the Company has repurchased and retired 1,877,576 shares at an aggregate price of $78.3 million.
The following table provides information about the Company’s repurchases of common stock during thequarter ended December 31, 2012, all of which represent shares surrendered to the Company for tax withholdingobligations upon the vesting of restricted stock:
ISSUER PURCHASES OF EQUITY SECURITIES
Period
Total Numberof Shares
Purchased
AveragePrice Paidper Share
Total Number of SharesPurchased as Part of Publicly
Announced Plan (1)
MaximumNumber of
Shares that MayYet be PurchasedUnder the Plan (2)
10/01/12 to 10/31/12 . . . . . . . . . . . . . . . . 3,737(3) $63.78 — 122,42411/01/12 to 11/30/12 . . . . . . . . . . . . . . . . 431(3) $76.44 — 122,42412/01/12 to 12/31/12 . . . . . . . . . . . . . . . . — $ — — 122,424Total . . . . . . . . . . . . . . . . . . . . . . . . . . . . . 4,168(3) —
(1) On August 28, 2008, the Company announced the authorization by its Board of Directors for the repurchaseof up to two million shares of its Common Stock.
18

(2) Represents the maximum number of shares that may be repurchased under the previously announcedauthorization as of period end. As of February 21, 2013, a maximum of 92,424 shares may be repurchasedunder the previously announced authorization.
(3) Represents shares of stock withheld for the payment of withholding taxes upon the vesting of restrictedstock.
Stock Performance Graph
The graph below compares the cumulative shareholder return on the Company’s common stock with thecumulative returns of the S&P 500 index and the S&P SmallCap 600 - Oil & Gas Equipment & Services index.The graph tracks the performance of a $100 investment in the Company’s common stock and in each of theindexes (with the reinvestment of all dividends) from December 31, 2007 to December 31, 2012.
COMPARISON OF 5 YEAR CUMULATIVE TOTAL RETURN*Among CARBO Ceramics, Inc., the S&P 500 Index,
and S&P SmallCap 600 - Oil & Gas Equipment & Services Index
$0
$50
$100
$150
$200
$250
$300
$350
$400
$450
$500
CARBO Ceramics, Inc. S&P 500 S&P SmallCap 600 - Oil & Gas Equipment & Services Index
12/07 12/08 12/09 12/10 12/11 12/12
* $100 invested on 12/31/07 in stock or index, including reinvestment of dividends. Fiscal year endingDecember 31
Copyright© 2013 S&P, a division of The McGraw-Hill Companies Inc. All rights reserved.
19

Item 6. Selected Financial Data
The following selected financial data are derived from the audited consolidated financial statements of theCompany. The data should be read in conjunction with Management’s Discussion and Analysis of FinancialCondition and Results of Operations and the consolidated financial statements and notes thereto includedelsewhere in this Form 10-K. The Company has determined that its outstanding non-vested restricted stockawards are participating securities. Accordingly, effective January 1, 2009, earnings per common share arecomputed using the two-class method prescribed by ASC Topic 260 “Earnings Per Share.” All previouslyreported earnings per common share data were retrospectively adjusted to conform to the new computationmethod.
Years ended December 31,
2012 2011 2010 2009 2008
($ in thousands, except per share data)
Statement of Income Data:Revenues . . . . . . . . . . . . . . . . . . . . . . . . . . . . . . . $645,536 $625,705 $473,082 $341,872 $387,828Cost of sales . . . . . . . . . . . . . . . . . . . . . . . . . . . . . 422,031 363,990 298,411 221,369 260,394
Gross profit . . . . . . . . . . . . . . . . . . . . . . . . . . . . . . 223,505 261,715 174,671 120,503 127,434Selling, general, & administrative and other
operating expenses (1) . . . . . . . . . . . . . . . . . . . 64,619 64,113 55,061 41,053 40,351
Operating profit . . . . . . . . . . . . . . . . . . . . . . . . . . 158,886 197,602 119,610 79,450 87,083Other (expense) income, net . . . . . . . . . . . . . . . . . (296) (152) (261) 344 1,266
Income before income taxes . . . . . . . . . . . . . . . . . 158,590 197,450 119,349 79,794 88,349Income taxes . . . . . . . . . . . . . . . . . . . . . . . . . . . . . 52,657 67,314 40,633 26,984 27,944
Income from continuing operations . . . . . . . . . . . 105,933 130,136 78,716 52,810 60,405Discontinued operations (2):Income from discontinued operations, net of
taxes . . . . . . . . . . . . . . . . . . . . . . . . . . . . . . . . . — — — — 5,784Gain on disposal of discontinued operations, net
of tax . . . . . . . . . . . . . . . . . . . . . . . . . . . . . . . . . — — — — 44,127
Net income . . . . . . . . . . . . . . . . . . . . . . . . . . . . . . $105,933 $130,136 $ 78,716 $ 52,810 $110,316
Earnings per basic share:Income from continuing operations . . . . . . . $ 4.59 $ 5.62 $ 3.41 $ 2.27 $ 2.47Income from discontinued operations . . . . . — — — — 0.24Gain on disposal of discontinued
operations . . . . . . . . . . . . . . . . . . . . . . . . . — — — — 1.81
Basic earnings per share . . . . . . . . . . . . . . . . $ 4.59 $ 5.62 $ 3.41 $ 2.27 $ 4.52
Earnings per diluted share:Income from continuing operations . . . . . . . $ 4.59 $ 5.62 $ 3.40 $ 2.27 $ 2.46Income from discontinued operations . . . . . — — — — 0.24Gain on disposal of discontinued
operations . . . . . . . . . . . . . . . . . . . . . . . . . — — — — 1.81
Diluted earnings per share . . . . . . . . . . . . . . $ 4.59 $ 5.62 $ 3.40 $ 2.27 $ 4.51
20

December 31,
2012 2011 2010 2009 2008
($ in thousands, except per share data)
Balance Sheet Data:Current assets . . . . . . . . . . . . . . . . . . . . . . . . . . . . $349,917 $302,565 $237,655 $218,870 $293,310Current liabilities . . . . . . . . . . . . . . . . . . . . . . . . . 50,830 79,066 51,247 32,458 83,848Property, plant and equipment, net . . . . . . . . . . . 426,232 392,659 338,483 270,722 244,902Total assets . . . . . . . . . . . . . . . . . . . . . . . . . . . . . . 808,878 740,865 599,571 513,412 546,877Total shareholders’ equity . . . . . . . . . . . . . . . . . . 713,078 630,158 521,979 457,316 442,534Cash dividends per share . . . . . . . . . . . . . . . . . . . $ 1.02 $ 0.88 $ 0.76 $ 0.70 $ 0.62
(1) Selling, general, & administrative (SG&A) and other operating expenses include costs of start-up activitiesand losses on disposal or impairment of assets.
(2) On October 10, 2008, the Company completed the sale of its fracture and reservoir diagnostics business, thePinnacle name and related trademarks. Consequently, these operations are presented as discontinuedoperations.
21
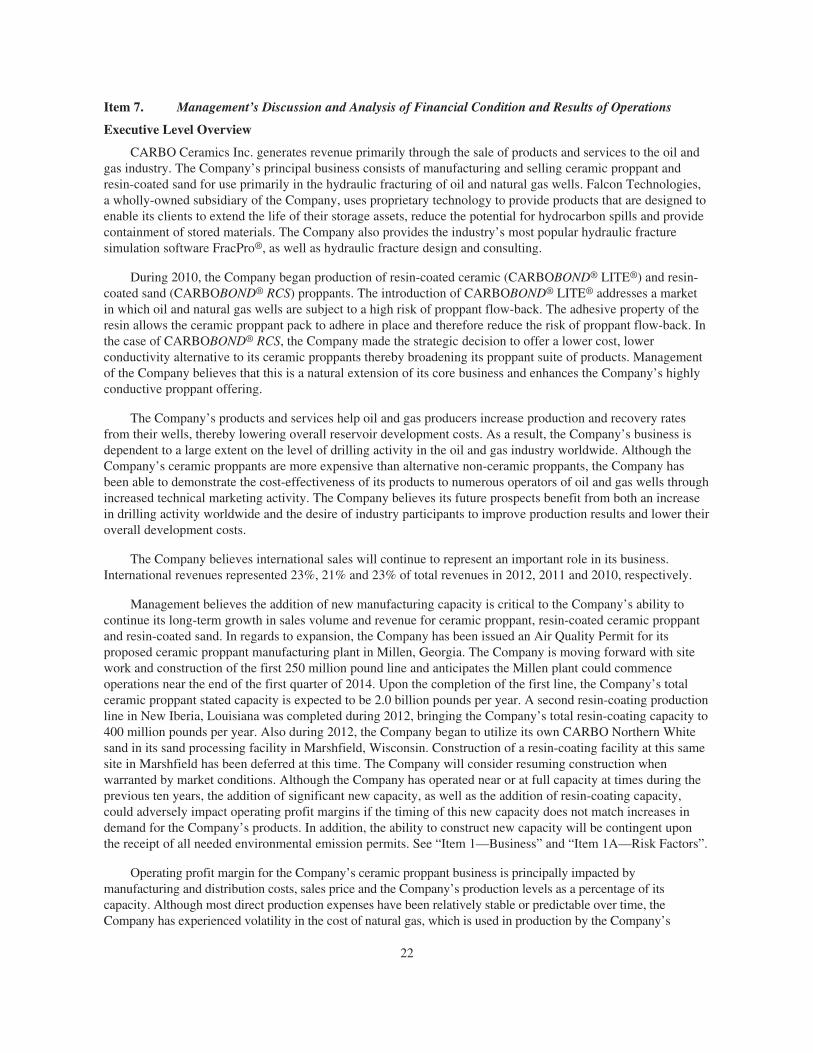
Item 7. Management’s Discussion and Analysis of Financial Condition and Results of Operations
Executive Level Overview
CARBO Ceramics Inc. generates revenue primarily through the sale of products and services to the oil andgas industry. The Company’s principal business consists of manufacturing and selling ceramic proppant andresin-coated sand for use primarily in the hydraulic fracturing of oil and natural gas wells. Falcon Technologies,a wholly-owned subsidiary of the Company, uses proprietary technology to provide products that are designed toenable its clients to extend the life of their storage assets, reduce the potential for hydrocarbon spills and providecontainment of stored materials. The Company also provides the industry’s most popular hydraulic fracturesimulation software FracPro®, as well as hydraulic fracture design and consulting.
During 2010, the Company began production of resin-coated ceramic (CARBOBOND® LITE®) and resin-coated sand (CARBOBOND® RCS) proppants. The introduction of CARBOBOND® LITE® addresses a marketin which oil and natural gas wells are subject to a high risk of proppant flow-back. The adhesive property of theresin allows the ceramic proppant pack to adhere in place and therefore reduce the risk of proppant flow-back. Inthe case of CARBOBOND® RCS, the Company made the strategic decision to offer a lower cost, lowerconductivity alternative to its ceramic proppants thereby broadening its proppant suite of products. Managementof the Company believes that this is a natural extension of its core business and enhances the Company’s highlyconductive proppant offering.
The Company’s products and services help oil and gas producers increase production and recovery ratesfrom their wells, thereby lowering overall reservoir development costs. As a result, the Company’s business isdependent to a large extent on the level of drilling activity in the oil and gas industry worldwide. Although theCompany’s ceramic proppants are more expensive than alternative non-ceramic proppants, the Company hasbeen able to demonstrate the cost-effectiveness of its products to numerous operators of oil and gas wells throughincreased technical marketing activity. The Company believes its future prospects benefit from both an increasein drilling activity worldwide and the desire of industry participants to improve production results and lower theiroverall development costs.
The Company believes international sales will continue to represent an important role in its business.International revenues represented 23%, 21% and 23% of total revenues in 2012, 2011 and 2010, respectively.
Management believes the addition of new manufacturing capacity is critical to the Company’s ability tocontinue its long-term growth in sales volume and revenue for ceramic proppant, resin-coated ceramic proppantand resin-coated sand. In regards to expansion, the Company has been issued an Air Quality Permit for itsproposed ceramic proppant manufacturing plant in Millen, Georgia. The Company is moving forward with sitework and construction of the first 250 million pound line and anticipates the Millen plant could commenceoperations near the end of the first quarter of 2014. Upon the completion of the first line, the Company’s totalceramic proppant stated capacity is expected to be 2.0 billion pounds per year. A second resin-coating productionline in New Iberia, Louisiana was completed during 2012, bringing the Company’s total resin-coating capacity to400 million pounds per year. Also during 2012, the Company began to utilize its own CARBO Northern Whitesand in its sand processing facility in Marshfield, Wisconsin. Construction of a resin-coating facility at this samesite in Marshfield has been deferred at this time. The Company will consider resuming construction whenwarranted by market conditions. Although the Company has operated near or at full capacity at times during theprevious ten years, the addition of significant new capacity, as well as the addition of resin-coating capacity,could adversely impact operating profit margins if the timing of this new capacity does not match increases indemand for the Company’s products. In addition, the ability to construct new capacity will be contingent uponthe receipt of all needed environmental emission permits. See “Item 1—Business” and “Item 1A—Risk Factors”.
Operating profit margin for the Company’s ceramic proppant business is principally impacted bymanufacturing and distribution costs, sales price and the Company’s production levels as a percentage of itscapacity. Although most direct production expenses have been relatively stable or predictable over time, theCompany has experienced volatility in the cost of natural gas, which is used in production by the Company’s
22

domestic manufacturing facilities, and bauxite, which is the primary raw material for production of the Company’shigh strength ceramic proppant. The cost of natural gas has been a significant component of total monthly domesticdirect production expense over the last four years. In an effort to mitigate volatility in the cost of natural gaspurchases and reduce exposure to short term spikes in the price of this commodity, the Company contracts inadvance for portions of its future natural gas requirements. Despite the efforts to reduce exposure to changes innatural gas prices, it is possible that, given the significant portion of manufacturing costs represented by this item,gross margins as a percentage of sales may decline and changes in net income may not directly correlate to changesin revenue. Investments continue to be made to enhance the Company’s distribution capabilities. The Companyrecently completed an expansion of its distribution center in South Texas. The Company is targeting the completionof an additional distribution center in the Bakken region in the second half of 2013.
With regard to resin-coating and sand operations, during 2012 the Company completed a second resin-coating line at its New Iberia, Louisiana facility and began to utilize its Northern White sand in its sandprocessing facility in Marshfield, Wisconsin. The production of resin-coated sand is a different process than themanufacture of ceramic proppant, and profit margins associated with resin-coated sand are not as high as thosehistorically received for the Company’s manufactured ceramic proppant.
As the Company has expanded its operations in both domestic and international markets, there has been anincrease in activities and expenses related to marketing, research and development, and finance andadministration. As a result, selling, general and administrative expenses have increased in recent years. In thefuture, the Company expects to continue to actively pursue new business opportunities by:
• increasing marketing activities globally; and
• focusing on new product development.
The Company expects that these activities will generate increased revenue. As such, selling, general andadministrative expenses may increase in 2013 from 2012 levels as the Company pursues these opportunities andcontinues to expand its operations.
General Business Conditions
The Company’s proppant business is impacted by the number of natural gas and oil wells drilled in NorthAmerica, and the need to hydraulically fracture these wells. In markets outside North America, sales of theCompany’s products are also influenced by the overall level of drilling and hydraulic fracturing activity.Furthermore, because the decision to use ceramic proppant is based on comparing the higher initial costs to thefuture value derived from increased production and recovery rates, the Company’s business is influenced by thecurrent and expected prices of natural gas and oil.
During the second half of 2009, the North American drilling rig count improved from the lows experiencedduring the second half of 2008 and stabilized during 2010. Late in 2011, a severe decline in natural gas prices ledcertain customers to reduce drilling activities and capital spending in natural gas basins and increase these items inliquids-rich basins. Low natural gas prices continued throughout 2012 and operations were impacted by the shift indrilling activity away from natural gas basins. The impact resulting from this shift included higher distribution costsdue to the logistical challenges in these infrastructure limited regions and competitive pricing pressures resultingfrom an over-supply of Chinese ceramic proppant. While natural gas fundamentals remain weak, the continuedstrength in oilfield activity by the Company’s clients in oily, liquids-rich plays is encouraging.
Critical Accounting Policies
The Consolidated Financial Statements are prepared in accordance with accounting principles generallyaccepted in the U.S., which require the Company to make estimates and assumptions (see Note 1 to theConsolidated Financial Statements). The Company believes that, of its significant accounting policies, thefollowing may involve a higher degree of judgment and complexity.
23
Revenue is recognized when title passes to the customer (generally upon delivery of products) or at the timeservices are performed. The Company generates a significant portion of its revenues and corresponding accountsreceivable from sales to the petroleum pressure pumping industry. In addition, the Company generates asignificant portion of its revenues and corresponding accounts receivable from sales to two major customers,both of which are in the petroleum pressure pumping industry. As of December 31, 2012, approximately 46% ofthe balance in trade accounts receivable was attributable to those two customers. The Company records anallowance for doubtful accounts based on its assessment of collectability risk and periodically evaluates theallowance based on a review of trade accounts receivable. Trade accounts receivable are periodically reviewedfor collectability based on customers’ past credit history and current financial condition, and the allowance isadjusted, if necessary. If a prolonged economic downturn in the petroleum pressure pumping industry were tooccur or, for some other reason, any of the Company’s primary customers were to experience significant adverseconditions, the Company’s estimates of the recoverability of accounts receivable could be reduced by a materialamount and the allowance for doubtful accounts could be increased by a material amount. At December 31,2012, the allowance for doubtful accounts totaled $1.8 million.
The Company values inventory using the weighted average cost method. Assessing the ultimate realizationof inventories requires judgments about future demand and market conditions. The Company regularly reviewsinventories to determine if the carrying value of the inventory exceeds market value and the Company records anadjustment to reduce the carrying value to market value, as necessary. Future changes in demand and marketconditions could cause the Company to be exposed to additional obsolescence or slow moving inventory. Ifactual market conditions are less favorable than those projected by management, lower of cost or marketadjustments may be required.
Income taxes are provided for in accordance with ASC Topic 740, “Income Taxes”. This standard takes intoaccount the differences between financial statement treatment and tax treatment of certain transactions. Deferredtax assets and liabilities are recognized for the future tax consequences attributable to differences between thefinancial statement carrying amounts of existing assets and liabilities and their respective tax bases. Deferred taxassets and liabilities are measured using enacted tax rates expected to apply to taxable income in the years inwhich those temporary differences are expected to be recovered or settled. The effect of a change in tax rates isrecognized as income or expense in the period that includes the enactment date. This calculation requires theCompany to make certain estimates about its future operations. Changes in state, federal and foreign tax laws, aswell as changes in the Company’s financial condition, could affect these estimates.
Long-lived assets, which include net property, plant and equipment, goodwill, intangibles and other long-term assets, comprise a significant amount of the Company’s total assets. The Company makes judgments andestimates in conjunction with the carrying values of these assets, including amounts to be capitalized,depreciation and amortization methods and useful lives. Additionally, the carrying values of these assets areperiodically reviewed for impairment or whenever events or changes in circumstances indicate that the carryingamounts may not be recoverable. An impairment loss is recorded in the period in which it is determined that thecarrying amount is not recoverable. This requires the Company to make long-term forecasts of its future revenuesand costs related to the assets subject to review. These forecasts require assumptions about demand for theCompany’s products and services, future market conditions and technological developments. Significant andunanticipated changes to these assumptions could require a provision for impairment in a future period.
Results of Operations
Net Income
($ in thousands) 2012PercentChange 2011
PercentChange 2010
Net Income $105,933 (19)% $130,136 65% $78,716
24

For the year ended December 31, 2012, the Company reported net income of $105.9 million, a decrease of19% compared to the $130.1 million reported in the previous year. Operations in 2012 were impacted by the shiftin drilling activity away from natural gas basins due to the severe decline in natural gas prices in late 2011. Theimpact resulting from this shift included higher distribution costs due to the logistical challenges in infrastructurelimited regions and competitive pricing pressures resulting from an over-supply of Chinese ceramic proppant.Net income in 2012 decreased primarily as a result of a 5% decrease in the average proppant selling price and adecrease in the proppant gross profit margin as a percentage of sales, partially offset by a 7% increase inproppant sales volume and a greater contribution from the Company’s other business units. Income tax expensein 2012 decreased primarily due to lower pretax income.
For the year ended December 31, 2011, the Company reported net income of $130.1 million, an increase of65% compared to the $78.7 million reported in the previous year. During 2011, operations continued to befavorably impacted by continued acceptance of the Company’s products and service offerings. Further, additionalproduction capacity from the completion of the third and fourth production lines at the Company’s Toomsboro,Georgia production facility in 2010 and 2011, respectively, enabled the Company to increase sales volumes. Netincome in 2011 increased primarily as a result of a 19% increase in proppant sales volume, a 12% increase in theaverage proppant selling price, and an increase in the gross profit margin as a percentage of sales, partially offsetby higher selling, general and administrative expenses. Income tax expense in 2011 increased due to higherpretax income.
Individual components of financial results are discussed below.
Revenues
($ in thousands) 2012PercentChange 2011
PercentChange 2010
Consolidated revenues $645,536 3% $625,705 32% $473,082
Revenues of $645.5 million for the year ended December 31, 2012 increased 3% compared to $625.7million in 2011. Revenues increased primarily due to a 7% increase in proppant sales volume and an increase inthe revenues of some of the Company’s other business units, partially offset by a 5% decrease in the averageproppant selling price resulting from competitive pricing pressures. Worldwide proppant sales volume totaled1.712 billion pounds during 2012 compared to 1.605 billion pounds in 2011. North American (defined as Canadaand the U.S.) sales volume increased 3% primarily attributed to an increase in the oil rig count in the U.S. as wellas acceptance of the Company’s products in oily, liquids-rich basins. International (excluding Canada) salesvolume increased 25% primarily due to increases in China, Russia and Mexico, partially offset by a decrease inEurope. Other Proppants (defined as resin-coated sand, ceramic proppant manufactured on an outsourced basis,and raw sand sold in the course of producing substrate for the resin-coated sand business) represented169 million pounds of the Company’s worldwide sales volume in 2012, as compared to 129 million pounds in2011. The average selling price per pound of all proppant, including Company-produced ceramic proppant andOther Proppant, was $0.343 per pound in 2012 compared to $0.360 per pound in 2011.
Revenues of $625.7 million for the year ended December 31, 2011 increased 32% compared to $473.1million in 2010. Revenues increased primarily due to a 19% increase in proppant sales volume, a 12% increase inthe average proppant selling price as a result of price increases and an increase in the revenues of FalconTechnologies. The Company’s worldwide proppant sales volume totaled 1.605 billion pounds during 2011compared to 1.348 billion pounds in 2010. North American (defined as Canada and the United States) salesvolume increased 21% and International (excluding Canada) sales volume increased 12%. North Americandemand was driven primarily by an increase in the drilling rig count in the United States and Canada as well ascontinued acceptance of the Company’s products in unconventional resource plays, including shale formations.Additional production capacity from the completion of the third and fourth production lines at the Company’sToomsboro, Georgia production facility in 2010 and 2011, respectively, enabled the Company to increase sales
25
volumes. Completion of the first resin-coating line at the Company’s New Iberia, Louisiana production facilityduring the second quarter of 2010, as well as the purchase of ceramic proppant that meets API and ISO standardsand is manufactured on an outsourced basis, also contributed toward improved ability to meet customer demand.Other Proppants represented 129 million pounds of the Company’s worldwide sales volume in 2011, ascompared to 66 million pounds in 2010. International sales volume increased primarily due to increases inRussia, Europe and the Asia-Pacific region (including China), partially offset by decreases in Africa and theMiddle East. The average selling price per pound of all proppant, including both Company-produced ceramicproppant and Other Proppant, was $0.360 per pound in 2011 compared to $0.322 per pound in 2010.
Gross Profit
($ in thousands) 2012PercentChange 2011
PercentChange 2010
Consolidated gross profit $223,505 (15)% $261,715 50% $174,671As a % of revenues 35% 42% 37%
The Company’s cost of sales related to proppant manufacturing consists of manufacturing costs, packagingand transportation expenses associated with the delivery of the Company’s products to its customers andhandling costs related to maintaining finished goods inventory and operating the Company’s remote stockingfacilities. Variable manufacturing costs include raw materials, labor, utilities and repair and maintenancesupplies. Fixed manufacturing costs include depreciation, property taxes on production facilities, insurance andfactory overhead.
Gross profit for the year ended December 31, 2012 was $223.5 million, or 35% of revenues, compared to$261.7 million, or 42% of revenues, for 2011. Operations in 2012 were impacted by the shift in drilling activityaway from natural gas basins due to the severe decline in natural gas prices in late 2011 and the resultinglogistical challenges and costs and the competitive pricing pressures created by this shift. Despite a 7% increasein proppant sales volume, gross profit and gross profit as a percentage of revenues decreased primarily as a resultof a decrease in the average proppant selling price, an increase in freight and logistics costs, higher fixed costabsorption, and a shift in sales mix towards lower-margin heavyweight and Other Proppant products. Greatercontribution from the Company’s other business units partially offset the decrease in gross profit from proppantsales.
Gross profit for the year ended December 31, 2011 was $261.7 million, or 42% of revenues, compared to$174.7 million, or 37% of revenues, for 2010. The increase in gross profit, as well as gross profit as a percentageof revenues, were primarily the result of higher proppant sales volume, an increase in the average proppantselling price, a change in product mix, and greater contribution from some of the Company’s other businessunits.
Selling, General & Administrative (SG&A) and Other Operating Expenses
($ in thousands) 2012PercentChange 2011
PercentChange 2010
Consolidated SG&A and other $64,619 1% $64,113 16% $55,061As a % of revenues 10% 10% 12%
Operating expenses consisted of $64.0 million of SG&A expenses and $0.6 million of other operatingexpenses for the year ended December 31, 2012 compared to $62.4 million and $1.7 million, respectively, for2011. The increase in SG&A expenses primarily resulted from higher administrative spending. Other operatingexpenses in 2012 consisted primarily of a $0.5 million loss on disposal of assets related to the wind down of thegeotechnical monitoring business. Other operating expenses in 2011 consisted primarily of an impairment ofgoodwill of $0.9 million related to the Company’s geotechnical monitoring business and a write-down of $0.8
26

million related to a 6% interest in an investment accounted for under the cost method as a result of the sale of thebusiness by majority shareholders. As a percentage of revenues, SG&A and other operating expenses for 2012remained consistent to 2011.
Operating expenses consisted of $62.4 million of SG&A expenses and $1.7 million of other operatingexpenses for the year ended December 31, 2011 compared to $52.6 million and $2.4 million, respectively, for2010. The increase in SG&A expenses primarily resulted from higher marketing, research and development, andadministrative spending associated with supporting revenue growth. Other operating expenses in 2011 consistedof start-up costs of $0.2 million primarily related to the start-up of the fourth production line at the Company’sToomsboro, Georgia facility, an impairment of goodwill of $0.9 million related to the Company’s geotechnicalmonitoring business and a write-down of $0.8 million related to a 6% interest in an investment accounted forunder the cost method as a result of the sale of the business by majority shareholders. Other operating expensesin 2010 consisted of start-up costs of $1.0 million related to the start-up of the first resin-coating line within theCompany’s existing manufacturing infrastructure at the New Iberia, Louisiana facility and the third productionline at the Company’s Toomsboro, Georgia facility, an impairment of goodwill of $0.4 million related to theCompany’s geotechnical monitoring business and a $1.0 million loss on equipment disposals mainly related tothe Company’s U.S. manufacturing facilities. As a percentage of revenues, SG&A and other operating expensesin 2011 decreased to 10% compared to 12% for the same period in 2010.
Income Tax Expense
($ in thousands) 2012PercentChange 2011
PercentChange 2010
Income Tax Expense $52,657 (22)% $67,314 66% $40,633Effective Income Tax Rate 33.2% 34.1% 34.0%
Consolidated income tax expense was $52.7 million, or 33.2% of pretax income, for the year endedDecember 31, 2012 compared to $67.3 million, or 34.1% of pretax income for 2011. The $14.7 million decreaseis due to lower pre-tax income and a lower effective tax rate primarily associated with the final preparation andfiling of the Company’s prior year income tax returns and additional tax benefits relating to mining depletiondeductions.
Consolidated income tax expense was $67.3 million, or 34.1% of pretax income, for the year endedDecember 31, 2011 compared to $40.6 million, or 34.0% of pretax income for 2010. The $26.7 million increaseis primarily due to higher pretax income.
Outlook
The Company anticipates that industry activity during 2013 will be similar to that in 2012 and that liquids-rich drilling activity in North America will remain high, offset by low natural gas drilling activity. Overall, theCompany believes its operating results for 2013 will continue to be influenced by the level of oil and natural gasdrilling in North America. The Company is cautiously optimistic that well completion activity will increase asthe year unfolds, however, quarterly fluctuations are possible. Accordingly, the Company believes the supply-demand balance in the proppant market should improve during the year and expects its ability to demonstrate thevalue of ceramic proppant relative to alternatives will allow it to continue to generate new sales opportunities,especially in oily, liquids-rich plays.
The Company expects to support near-term demand with its current ceramic production capacity of 1.75billion pounds per year, along with existing inventories of ceramic proppant. The Company has been issued anAir Quality Permit for its proposed ceramic proppant manufacturing plant in Millen, Georgia and is movingforward with site preparation and construction of the first 250 million pound line, which it anticipates couldcommence operation near the end of the first quarter of 2014.
27

The increased amount of activity in infrastructure-limited, liquids-rich basins introduced supply chainchallenges to the industry and resulted in higher distribution costs during 2012. Although the Company expectsthese costs will continue at current levels for the near-term, it is making capital investments in certain of thesechallenged regions to facilitate a reduction of these costs and promote further customer service.
Liquidity and Capital Resources
At December 31, 2012, the Company had cash and cash equivalents of $90.6 million compared to cash andcash equivalents of $41.3 million at December 31, 2011. During 2012, the Company generated $156.4 million ofcash from operating activities, retained $1.4 million from excess tax benefits relating to stock basedcompensation and retained $0.2 million from the effect of exchange rate changes on cash. Uses of cash included$77.2 million for capital expenditures, $23.6 million for the payment of cash dividends and $7.9 million forrepurchases of the Company’s common stock. In addition, during 2012, the Company borrowed and fully repaida total of $10.0 million on its credit facility. Major capital spending in 2012 included engineering, procurementand construction of sand processing and resin-coating facilities in Marshfield, Wisconsin and New Iberia,Louisiana, expansion of the Company’s distribution infrastructure, engineering and procurement activities relatedto the new manufacturing facility in Millen, Georgia, as well as upgrades and improvements at existingmanufacturing facilities.
Subject to its financial condition, the amount of funds generated from operations and the level of capitalexpenditures, the Company’s current intention is to continue to pay quarterly dividends to holders of its commonstock. On January 22, 2013, the Company’s Board of Directors approved the payment of a quarterly cashdividend of $0.27 per share to shareholders of the Company’s common stock on February 1, 2013. The dividendis payable on February 15, 2013. The Company estimates its total capital expenditures in 2013 will be between$115.0 million and $135.0 million, which include costs associated with the construction of the newmanufacturing facility in the Millen, Georgia area, expansion of the Company’s distribution infrastructure, aswell as various other projects and additions.
The Company has historically maintained an unsecured line of credit with a bank. In March 2012, theCompany entered into a first amendment to this credit agreement to (i) extend its maturity date from January 29,2013 to July 29, 2013, (ii) increase the size from $10.0 million to $25.0 million, and (iii) make otheradministrative changes to certain covenants and provisions. As of December 31, 2012, there was no outstandingdebt under the new credit agreement. The Company anticipates that cash on hand, cash provided by operatingactivities and funds provided by its line of credit will be sufficient to meet planned operating expenses, taxobligations, capital expenditures and other cash needs for the next 12 months. The Company also believes that itcould acquire additional debt financing, if needed. Based on these assumptions, the Company believes that itsfixed costs could be met even with a moderate decrease in demand for the Company’s products.
Off-Balance Sheet Arrangements
The Company had no off-balance sheet arrangements as of December 31, 2012.
28

Contractual Obligations
The following table summarizes the Company’s contractual obligations as of December 31, 2012:
Payments due in period
($ in thousands) TotalLess than
1 year1 - 3years
3 - 5years
More than5 years
Long-term debt obligations $ — $ — $ — $ — $ —Capital lease obligations — — — — —Operating lease obligations:
—Primarily railroad equipment 120,535 15,127 33,763 26,379 45,266Purchase obligations:
—Natural gas contracts 75,284 25,087 37,358 12,839 ——Raw materials contracts 4,945 1,676 3,269 — —
Other long-term obligations — — — — —
Total contractual obligations $200,764 $41,890 $74,390 $39,218 $45,266
See Note 4 and Note 13 to the Notes to the Consolidated Financial Statements.
Operating lease obligations relate primarily to railroad equipment leases and include leases of otherproperty, plant and equipment.
The Company uses natural gas to power its domestic manufacturing plants. From time to time, the Companyenters into contracts to purchase a portion of the anticipated natural gas requirements at specified prices. As ofDecember 31, 2012, the last such contract was due to expire in December 2017.
The Company has entered into contracts to supply raw materials, primarily kaolin, bauxite and hydro sizedsand, to each of its manufacturing plants. Each of the contracts is described in Note 13 to the Notes to theConsolidated Financial Statements. Two outstanding contracts do not require the Company to purchase minimumannual quantities, but do require the purchase of minimum annual percentages, ranging from 50% to 80% of therespective plants’ requirements for the specified raw materials. One outstanding contract requires the Companyto purchase a minimum annual quantity of material. The Company also has entered into a supply agreement forits Millen plant that will become effective upon the commencement of operations at the plant and requires thepurchase of a minimum annual percentage of 50% of the Millen plant’s requirements of kaolin.
Item 7A. Quantitative and Qualitative Disclosures about Market Risk
The Company’s major market risk exposure is to foreign currency fluctuations that could impact itsinvestments in China and Russia. As of December 31, 2012, the Company’s net investment that is subject toforeign currency fluctuations totaled $93.1 million, and the Company has recorded a cumulative foreign currencytranslation loss of $1.9 million, net of deferred income tax benefit. This cumulative translation loss is included inAccumulated Other Comprehensive Loss. From time to time, the Company may enter into forward foreignexchange contracts to hedge the impact of foreign currency fluctuations. There were no such foreign exchangecontracts outstanding at December 31, 2012.
The Company has a $25.0 million revolving credit agreement with a bank. Under the terms of theagreement, the Company has the option of choosing either the bank’s fluctuating Base Rate or LIBOR FixedRate, plus an Applicable Margin, all as defined in the credit agreement. There were no borrowings outstandingunder the agreement at December 31, 2012. The Company does not believe that it has any material exposure tomarket risk associated with interest rates.
The Company is subject to the risk of market price fluctuations of certain commodities, such as natural gas,and utilizes forward purchase contracts to manage or reduce market risks relating to these costs. The Company
29

does not enter into these transactions for speculative or trading purposes. The Company expects to take deliveryof the underlying natural gas and, as such, does not currently believe the market risk exposure on theseinstruments to be material. As of December 31, 2012, $75.3 million of natural gas forward contracts wereoutstanding for delivery of gas through 2017.
Item 8. Financial Statements and Supplementary Data
The information required by this Item is contained in pages F-3 through F-22 of this Report.
Item 9. Changes in and Disagreements with Accountants on Accounting and Financial Disclosure
Not applicable.
Item 9A. Controls and Procedures
(a) Evaluation of Disclosure Controls and Procedures
Disclosure controls and procedures are designed to ensure that information required to be disclosed in thereports filed or submitted under the Securities Exchange Act of 1934 (the “Exchange Act”) is recorded,processed, summarized and reported, within the time periods specified in the SEC’s rules and forms. Disclosurecontrols and procedures include, without limitation, controls and procedures designed to ensure that informationrequired to be disclosed in the reports filed under the Exchange Act is accumulated and communicated tomanagement, including the Chief Executive Officer and Chief Financial Officer, as appropriate to allow timelydecisions regarding required disclosure.
As of December 31, 2012, management carried out an evaluation, under the supervision and with theparticipation of the Chief Executive Officer and Chief Financial Officer, of the effectiveness of the design andoperation of the Company’s disclosure controls and procedures. There are inherent limitations to theeffectiveness of any system of disclosure controls and procedures. Accordingly, even effective disclosurecontrols and procedures can only provide reasonable assurances of achieving their control objectives. Based uponand as of the date of that evaluation, the Chief Executive Officer and Chief Financial Officer have concluded thatthe Company’s disclosure controls and procedures were effective to ensure that information required to bedisclosed by the Company in the reports it files or submits under the Exchange Act is recorded, processed,summarized and reported, within the time periods specified in the SEC’s rules and forms, and to ensure thatinformation required to be disclosed by the Company in the reports that it files or submits under the ExchangeAct is accumulated and communicated to the Company’s management, including its Chief Executive Officer andChief Financial Officer, as appropriate to allow timely decisions regarding required disclosure.
(b) Management’s Report on Internal Control Over Financial Reporting
For Management’s Report on Internal Control Over Financial Reporting, see page F-1 of this Report.
(c) Report of Independent Registered Public Accounting Firm
For the Report of Independent Registered Public Accounting Firm on the Company’s internal control overfinancial reporting, see page F-2 of this Report.
(d) Changes in Internal Control over Financial Reporting
There were no changes in the Company’s internal control over financial reporting during the quarter endedDecember 31, 2012, that materially affected, or are reasonably likely to materially affect, those controls.
Item 9B. Other Information
Not applicable.
30

PART III
Certain information required by Part III is omitted from this Report. The Company will file a definitiveproxy statement pursuant to Regulation 14A (the “Proxy Statement”) not later than 120 days after the end of thefiscal year covered by this Report and certain information included therein is incorporated herein by reference.Only those sections of the Proxy Statement that specifically address the items set forth herein are incorporated byreference. Such incorporation does not include the Compensation Committee Report included in the ProxyStatement.
Item 10. Directors, Executive Officers and Corporate Governance
Information concerning executive officers under Item 401 of Regulation S-K is set forth in Part I of thisForm 10-K. The other information required by this Item is incorporated by reference to the portions of theCompany’s Proxy Statement entitled “Security Ownership of Certain Beneficial Owners and Management,”“Election of Directors,” “Board of Directors, Committees of the Board of Directors and Meeting Attendance,”“Code of Business Conduct and Ethics,” “Section 16(a) Beneficial Ownership Reporting Compliance” and“Report of the Audit Committee.”
Item 11. Executive Compensation
The information required by this Item is incorporated by reference to the portions of the Company’s ProxyStatement entitled “Compensation of Executive Officers,” “Director Compensation” and “Potential Terminationand Change in Control Payments.”
Item 12. Security Ownership of Certain Beneficial Owners and Management and Related StockholderMatters
The information required by this Item is incorporated by reference from the Company’s Proxy Statementunder the captions “Securities Ownership of Certain Beneficial Owners and Management” and “EquityCompensation Plan Information.”
Item 13. Certain Relationships and Related Transactions, and Director Independence
The information required by this Item is incorporated by reference to the portion of the Company’s ProxyStatement entitled “Election of Directors.”
Item 14. Principal Accounting Fees and Services
The information required by this Item is incorporated by reference to the portion of the Company’s ProxyStatement entitled “Ratification of Appointment of the Company’s Independent Registered Public AccountingFirm.”
31

PART IV
Item 15. Exhibits, Financial Statement Schedules
(a) Exhibits, Financial Statements and Financial Statement Schedules:
1. Consolidated Financial Statements
The Consolidated Financial Statements of CARBO Ceramics Inc. listed below are contained in pages F-3through F-22 of this Report:
Report of Independent Registered Public Accounting FirmConsolidated Balance Sheets at December 31, 2012 and 2011Consolidated Statements of Income for each of the three years ended December 31, 2012, 2011 and 2010Consolidated Statements of Comprehensive Income for each of the three years ended December 31, 2012,2011 and 2010Consolidated Statements of Shareholders’ Equity for each of the three years ended December 31, 2012,2011 and 2010Consolidated Statements of Cash Flows for each of the three years ended December 31, 2012, 2011 and2010
2. Consolidated Financial Statement Schedules
All schedules have been omitted since they are either not required or not applicable.
3. Exhibits
The exhibits listed on the accompanying Exhibit Index are filed as part of, or incorporated by reference into,this Report.
32

SIGNATURES
Pursuant to the requirements of Section 13 or 15(d) of the Securities Exchange Act of 1934, the Registranthas duly caused this Report to be signed on its behalf by the undersigned, thereunto duly authorized.
CARBO Ceramics Inc.
By: /s/ Gary A Kolstad
Gary A. KolstadPresident and Chief Executive Officer
By: /s/ Ernesto Bautista III
Ernesto Bautista IIIVice President andChief Financial Officer
Dated: February 25, 2013
33

POWER OF ATTORNEY
KNOW ALL PERSONS BY THESE PRESENTS, that each person whose signature appears belowconstitutes and appoints Gary A. Kolstad and Ernesto Bautista III, jointly and severally, his attorneys-in-fact,each with the power of substitution, for him in any and all capacities, to sign any amendments to this Report onForm 10-K, and to file the same, with exhibits thereto and other documents in connection therewith, with theSecurities and Exchange Commission, hereby ratifying and confirming all that each of said attorneys-in-fact, orhis substitute or substitutes, may do or cause to be done by virtue hereof.
Pursuant to the requirements of the Securities Exchange Act of 1934, this Report has been signed below bythe following persons on behalf of the Registrant and in the capacities and on the dates indicated.
Signature Title Date
/s/ William C. Morris
William C. Morris
Chairman of the Board February 25, 2013
/s/ Gary A. Kolstad
Gary A. Kolstad
President, Chief Executive Officer andDirector (Principal Executive Officer)
February 25, 2013
/s/ Ernesto Bautista III
Ernesto Bautista III
Vice President andChief Financial Officer(Principal Financial and
Accounting Officer)
February 25, 2013
/s/ Sigmund L. Cornelius
Sigmund L. Cornelius
Director February 25, 2013
/s/ James B. Jennings
James B. Jennings
Director February 25, 2013
/s/ H.E. Lentz, Jr.
H.E. Lentz, Jr.
Director February 25, 2013
/s/ Randy L. Limbacher
Randy L. Limbacher
Director February 25, 2013
/s/ Robert S. Rubin
Robert S. Rubin
Director February 25, 2013
34
MANAGEMENT’S REPORT ON INTERNAL CONTROL OVER FINANCIAL REPORTING
Management is responsible for establishing and maintaining adequate internal control over financialreporting, as defined in Rules 13a-15(f) and 15d-15(f) under the Securities Exchange Act of 1934. TheCompany’s internal control over financial reporting is designed to provide reasonable assurance regarding thereliability of financial reporting and the preparation of financial statements for external reporting purposes inaccordance with generally accepted accounting principles.
Because of its inherent limitations, internal control over financial reporting may not prevent or detectmisstatements. Also, projections of any evaluation of effectiveness to future periods are subject to the risk thatcontrols may become inadequate because of changes in conditions, or that the degree of compliance with thepolicies or procedures may deteriorate.
Management, including our Chief Executive Officer and our Chief Financial Officer, assessed theeffectiveness of the Company’s internal control over financial reporting as of December 31, 2012. In making thisassessment, it used the criteria set forth by the Committee of Sponsoring Organizations of the TreadwayCommission (COSO) in Internal Control–Integrated Framework. Based on its assessment and those criteria,management has concluded that the Company maintained effective internal control over financial reporting as ofDecember 31, 2012.
The Company’s independent registered public accounting firm, Ernst & Young LLP, has issued anattestation report on the Company’s internal control over financial reporting. That report is included herein.
F-1

REPORT OF INDEPENDENT REGISTERED PUBLIC ACCOUNTING FIRM
The Board of Directors and ShareholdersCARBO Ceramics Inc.
We have audited CARBO Ceramics Inc.’s internal control over financial reporting as of December 31,2012, based on criteria established in Internal Control–Integrated Framework issued by the Committee ofSponsoring Organizations of the Treadway Commission (the COSO criteria). CARBO Ceramics Inc.’smanagement is responsible for maintaining effective internal control over financial reporting and for itsassessment of the effectiveness of internal control over financial reporting included in the accompanyingManagement’s Report on Internal Control Over Financial Reporting. Our responsibility is to express an opinionon the company’s internal control over financial reporting based on our audit.
We conducted our audit in accordance with the standards of the Public Company Accounting OversightBoard (United States). Those standards require that we plan and perform the audit to obtain reasonable assuranceabout whether effective internal control over financial reporting was maintained in all material respects. Ouraudit included obtaining an understanding of internal control over financial reporting, assessing the risk that amaterial weakness exists, testing and evaluating the design and operating effectiveness of internal control basedon the assessed risk, and performing such other procedures as we considered necessary in the circumstances. Webelieve that our audit provides a reasonable basis for our opinion.
A company’s internal control over financial reporting is a process designed to provide reasonable assuranceregarding the reliability of financial reporting and the preparation of financial statements for external purposes inaccordance with generally accepted accounting principles. A company’s internal control over financial reportingincludes those policies and procedures that (1) pertain to the maintenance of records that, in reasonable detail,accurately and fairly reflect the transactions and dispositions of the assets of the company; (2) provide reasonableassurance that transactions are recorded as necessary to permit preparation of financial statements in accordancewith generally accepted accounting principles, and that receipts and expenditures of the company are being madeonly in accordance with authorizations of management and directors of the company; and (3) provide reasonableassurance regarding prevention or timely detection of unauthorized acquisition, use, or disposition of thecompany’s assets that could have a material effect on the financial statements.
Because of its inherent limitations, internal control over financial reporting may not prevent or detectmisstatements. Also, projections of any evaluation of effectiveness to future periods are subject to the risk thatcontrols may become inadequate because of changes in conditions, or that the degree of compliance with thepolicies or procedures may deteriorate.
In our opinion, CARBO Ceramics Inc. maintained, in all material respects, effective internal control overfinancial reporting as of December 31, 2012, based on the COSO criteria.
We also have audited, in accordance with the standards of the Public Company Accounting Oversight Board(United States), the consolidated balance sheets of CARBO Ceramics Inc. as of December 31, 2012, and 2011,and the related consolidated statements of income, comprehensive income, shareholders’ equity, and cash flowsfor each of the three years in the period ended December 31, 2012 and our report dated February 25, 2013expressed an unqualified opinion thereon.
/s/ Ernst & Young LLPNew Orleans, LouisianaFebruary 25, 2013
F-2

REPORT OF INDEPENDENT REGISTERED PUBLIC ACCOUNTING FIRM
The Board of Directors and ShareholdersCARBO Ceramics Inc.
We have audited the accompanying consolidated balance sheets of CARBO Ceramics Inc. as ofDecember 31, 2012 and 2011, and the related consolidated statements of income, comprehensive income,shareholders’ equity, and cash flows for each of the three years in the period ended December 31, 2012. Thesefinancial statements are the responsibility of the Company’s management. Our responsibility is to express anopinion on these financial statements based on our audits.
We conducted our audits in accordance with standards of the Public Company Accounting Oversight Board(United States). Those standards require that we plan and perform the audit to obtain reasonable assurance aboutwhether the financial statements are free of material misstatement. An audit includes examining, on a test basis,evidence supporting the amounts and disclosures in the financial statements. An audit also includes assessing theaccounting principles used and significant estimates made by management, as well as evaluating the overallfinancial statement presentation. We believe that our audits provide a reasonable basis for our opinion.
In our opinion, the financial statements referred to above present fairly, in all material respects, theconsolidated financial position of CARBO Ceramics Inc. at December 31, 2012 and 2011, and the consolidatedresults of its operations and its cash flows for each of the three years in the period ended December 31, 2012, inconformity with U.S. generally accepted accounting principles.
We also have audited, in accordance with the standards of the Public Company Accounting Oversight Board(United States), CARBO Ceramics Inc.’s internal control over financial reporting as of December 31, 2012,based on criteria established in Internal Control – Integrated Framework issued by the Committee of SponsoringOrganizations of the Treadway Commission and our report dated February 25, 2013 expressed an unqualifiedopinion thereon.
/s/ Ernst & Young LLP
New Orleans, LouisianaFebruary 25, 2013
F-3

CARBO CERAMICS INC.
CONSOLIDATED BALANCE SHEETS($ in thousands, except per share data)
December 31,
2012 2011
ASSETSCurrent assets:
Cash and cash equivalents . . . . . . . . . . . . . . . . . . . . . . . . . . . . . . . . . . . . . . . . . . . . . . . . . . . $ 90,635 $ 41,270Trade accounts and other receivables, net . . . . . . . . . . . . . . . . . . . . . . . . . . . . . . . . . . . . . . . 103,258 112,014Inventories:
Finished goods . . . . . . . . . . . . . . . . . . . . . . . . . . . . . . . . . . . . . . . . . . . . . . . . . . . . . . . . 102,625 105,233Raw materials and supplies . . . . . . . . . . . . . . . . . . . . . . . . . . . . . . . . . . . . . . . . . . . . . . 38,061 26,783
Total inventories . . . . . . . . . . . . . . . . . . . . . . . . . . . . . . . . . . . . . . . . . . . . . . . . . . . 140,686 132,016Prepaid expenses and other current assets . . . . . . . . . . . . . . . . . . . . . . . . . . . . . . . . . . . . . . . 4,293 4,023Prepaid income taxes . . . . . . . . . . . . . . . . . . . . . . . . . . . . . . . . . . . . . . . . . . . . . . . . . . . . . . . — 3,279Deferred income taxes . . . . . . . . . . . . . . . . . . . . . . . . . . . . . . . . . . . . . . . . . . . . . . . . . . . . . . 11,045 9,963
Total current assets . . . . . . . . . . . . . . . . . . . . . . . . . . . . . . . . . . . . . . . . . . . . . . . . . . . . . 349,917 302,565Property, plant and equipment:
Land and land improvements . . . . . . . . . . . . . . . . . . . . . . . . . . . . . . . . . . . . . . . . . . . . . . . . . 19,700 14,512Land-use and mineral rights . . . . . . . . . . . . . . . . . . . . . . . . . . . . . . . . . . . . . . . . . . . . . . . . . . 9,559 8,610Buildings . . . . . . . . . . . . . . . . . . . . . . . . . . . . . . . . . . . . . . . . . . . . . . . . . . . . . . . . . . . . . . . . 67,866 67,120Machinery and equipment . . . . . . . . . . . . . . . . . . . . . . . . . . . . . . . . . . . . . . . . . . . . . . . . . . . 530,129 455,563Construction in progress . . . . . . . . . . . . . . . . . . . . . . . . . . . . . . . . . . . . . . . . . . . . . . . . . . . . . 39,564 48,778
Total . . . . . . . . . . . . . . . . . . . . . . . . . . . . . . . . . . . . . . . . . . . . . . . . . . . . . . . . . . . . . . . . 666,818 594,583Less accumulated depreciation and amortization . . . . . . . . . . . . . . . . . . . . . . . . . . . . . . . . . . 240,586 201,924
Net property, plant and equipment . . . . . . . . . . . . . . . . . . . . . . . . . . . . . . . . . . . . . . . . . 426,232 392,659Goodwill . . . . . . . . . . . . . . . . . . . . . . . . . . . . . . . . . . . . . . . . . . . . . . . . . . . . . . . . . . . . . . . . . . . . . 12,164 12,164Intangible and other assets, net . . . . . . . . . . . . . . . . . . . . . . . . . . . . . . . . . . . . . . . . . . . . . . . . . . . . 20,565 33,477
Total assets . . . . . . . . . . . . . . . . . . . . . . . . . . . . . . . . . . . . . . . . . . . . . . . . . . . . . . . . . . . $808,878 $740,865
LIABILITIES AND SHAREHOLDERS’ EQUITYCurrent liabilities:
Accounts payable . . . . . . . . . . . . . . . . . . . . . . . . . . . . . . . . . . . . . . . . . . . . . . . . . . . . . . . . . . $ 20,078 $ 38,192Accrued payroll and benefits . . . . . . . . . . . . . . . . . . . . . . . . . . . . . . . . . . . . . . . . . . . . . . . . . 13,986 17,237Accrued freight . . . . . . . . . . . . . . . . . . . . . . . . . . . . . . . . . . . . . . . . . . . . . . . . . . . . . . . . . . . . 4,925 10,911Accrued utilities . . . . . . . . . . . . . . . . . . . . . . . . . . . . . . . . . . . . . . . . . . . . . . . . . . . . . . . . . . . 3,707 3,704Accrued income taxes . . . . . . . . . . . . . . . . . . . . . . . . . . . . . . . . . . . . . . . . . . . . . . . . . . . . . . . 727 —Other accrued expenses . . . . . . . . . . . . . . . . . . . . . . . . . . . . . . . . . . . . . . . . . . . . . . . . . . . . . 7,407 9,022
Total current liabilities . . . . . . . . . . . . . . . . . . . . . . . . . . . . . . . . . . . . . . . . . . . . . . . . . . 50,830 79,066Deferred income taxes . . . . . . . . . . . . . . . . . . . . . . . . . . . . . . . . . . . . . . . . . . . . . . . . . . . . . . . . . . 44,970 31,641Shareholders’ equity:
Preferred stock, par value $0.01 per share, 5,000 shares authorized, none outstanding . . . . — —Common stock, par value $0.01 per share, 80,000,000 and 40,000,000 shares authorized at
December 31, 2012 and 2011, respectively; 23,092,906 and 23,106,358 shares issuedand outstanding at December 31, 2012 and 2011, respectively . . . . . . . . . . . . . . . . . . . . . 231 231
Additional paid-in capital . . . . . . . . . . . . . . . . . . . . . . . . . . . . . . . . . . . . . . . . . . . . . . . . . . . . 57,364 56,539Retained earnings . . . . . . . . . . . . . . . . . . . . . . . . . . . . . . . . . . . . . . . . . . . . . . . . . . . . . . . . . . 657,423 577,253Accumulated other comprehensive loss . . . . . . . . . . . . . . . . . . . . . . . . . . . . . . . . . . . . . . . . . (1,940) (3,865)
Total shareholders’ equity . . . . . . . . . . . . . . . . . . . . . . . . . . . . . . . . . . . . . . . . . . . . . . . 713,078 630,158
Total liabilities and shareholders’ equity . . . . . . . . . . . . . . . . . . . . . . . . . . . . . . . . . . . . $808,878 $740,865
See accompanying notes to consolidated financial statements.
F-4

CARBO CERAMICS INC.
CONSOLIDATED STATEMENTS OF INCOME($ in thousands, except per share data)
Years ended December 31,
2012 2011 2010
Revenues . . . . . . . . . . . . . . . . . . . . . . . . . . . . . . . . . . . . . . . . . . . . . . . . . . . . . . $645,536 $625,705 $473,082Cost of sales . . . . . . . . . . . . . . . . . . . . . . . . . . . . . . . . . . . . . . . . . . . . . . . . . . . . 422,031 363,990 298,411
Gross profit . . . . . . . . . . . . . . . . . . . . . . . . . . . . . . . . . . . . . . . . . . . . . . . . . . . . . 223,505 261,715 174,671Selling, general and administrative expenses . . . . . . . . . . . . . . . . . . . . . . . . . . . 64,033 62,381 52,635Start-up costs . . . . . . . . . . . . . . . . . . . . . . . . . . . . . . . . . . . . . . . . . . . . . . . . . . . 68 184 977Loss on disposal or impairment of assets . . . . . . . . . . . . . . . . . . . . . . . . . . . . . . 518 1,548 1,449
Operating profit . . . . . . . . . . . . . . . . . . . . . . . . . . . . . . . . . . . . . . . . . . . . . . . . . 158,886 197,602 119,610Other income (expense):
Interest income, net . . . . . . . . . . . . . . . . . . . . . . . . . . . . . . . . . . . . . . . . . . 64 197 178Foreign currency exchange loss, net . . . . . . . . . . . . . . . . . . . . . . . . . . . . . (76) (135) (96)Other, net . . . . . . . . . . . . . . . . . . . . . . . . . . . . . . . . . . . . . . . . . . . . . . . . . . (284) (214) (343)
(296) (152) (261)
Income before income taxes . . . . . . . . . . . . . . . . . . . . . . . . . . . . . . . . . . . . . . . . 158,590 197,450 119,349Income taxes . . . . . . . . . . . . . . . . . . . . . . . . . . . . . . . . . . . . . . . . . . . . . . . . . . . . 52,657 67,314 40,633
Net income . . . . . . . . . . . . . . . . . . . . . . . . . . . . . . . . . . . . . . . . . . . . . . . . . . . . . $105,933 $130,136 $ 78,716
Earnings per share:Basic . . . . . . . . . . . . . . . . . . . . . . . . . . . . . . . . . . . . . . . . . . . . . . . . . . . . . . $ 4.59 $ 5.62 $ 3.41
Diluted . . . . . . . . . . . . . . . . . . . . . . . . . . . . . . . . . . . . . . . . . . . . . . . . . . . . $ 4.59 $ 5.62 $ 3.40
See accompanying notes to consolidated financial statements.
F-5

CARBO CERAMICS INC.
CONSOLIDATED STATEMENTS OF COMPREHENSIVE INCOME($ in thousands)
Years ended December 31,
2012 2011 2010
Net income . . . . . . . . . . . . . . . . . . . . . . . . . . . . . . . . . . . . . . . . . . . . . . . . . . . . . . $105,933 $130,136 $78,716Other comprehensive income:
Foreign currency translation adjustment . . . . . . . . . . . . . . . . . . . . . . . . . . . 2,960 (1,198) 496Deferred income tax (expense) benefit . . . . . . . . . . . . . . . . . . . . . . . . . . . . (1,035) 1,447 599
Other comprehensive income, net of tax . . . . . . . . . . . . . . . . . . . . . . . . . . . . . . . 1,925 249 1,095
Comprehensive income . . . . . . . . . . . . . . . . . . . . . . . . . . . . . . . . . . . . . . . . . . . . $107,858 $130,385 $79,811
See accompanying notes to consolidated financial statements.
F-6

CARBO CERAMICS INC.
CONSOLIDATED STATEMENTS OF SHAREHOLDERS’ EQUITY($ in thousands, except per share data)
CommonStock
AdditionalPaid-InCapital
RetainedEarnings
AccumulatedOther
ComprehensiveIncome (Loss) Total
Balances at January 1, 2010 . . . . . . . . . . . . . . . . . . . $231 $54,361 $407,933 $(5,209) $457,316Net income . . . . . . . . . . . . . . . . . . . . . . . . . . . . — — 78,716 — 78,716Foreign currency translation adjustment, net of
tax benefit of ($599) . . . . . . . . . . . . . . . . . . . — — — 1,095 1,095
Comprehensive income . . . . . . . . . . . . . . . . . . 79,811Exercise of stock options . . . . . . . . . . . . . . . . . — 254 — — 254Tax benefit from stock based compensation . . — 801 — — 801Stock granted under restricted stock plan,
net . . . . . . . . . . . . . . . . . . . . . . . . . . . . . . . . . — 79 — — 79Stock based compensation . . . . . . . . . . . . . . . . — 3,192 — — 3,192Shares repurchased and retired . . . . . . . . . . . . . — (1,212) — — (1,212)Shares surrendered by employees to pay
taxes . . . . . . . . . . . . . . . . . . . . . . . . . . . . . . . — — (692) — (692)Cash dividends ($0.76 per share) . . . . . . . . . . . — — (17,570) — (17,570)
Balances at December 31, 2010 . . . . . . . . . . . . . . . . 231 57,475 468,387 (4,114) 521,979Net income . . . . . . . . . . . . . . . . . . . . . . . . . . . . — — 130,136 — 130,136Foreign currency translation adjustment, net of
tax benefit of ($1,447) . . . . . . . . . . . . . . . . . — — — 249 249
Comprehensive income . . . . . . . . . . . . . . . . . . 130,385Exercise of stock options . . . . . . . . . . . . . . . . . — 76 — — 76Tax benefit from stock based compensation . . — 1,412 — — 1,412Stock granted under restricted stock plan,
net . . . . . . . . . . . . . . . . . . . . . . . . . . . . . . . . . — 223 — — 223Stock based compensation . . . . . . . . . . . . . . . . — 4,002 — — 4,002Shares repurchased and retired . . . . . . . . . . . . . — (6,649) — — (6,649)Shares surrendered by employees to pay
taxes . . . . . . . . . . . . . . . . . . . . . . . . . . . . . . . — — (901) — (901)Cash dividends ($0.88 per share) . . . . . . . . . . . — — (20,369) — (20,369)
Balances at December 31, 2011 . . . . . . . . . . . . . . . . 231 56,539 577,253 (3,865) 630,158Net income . . . . . . . . . . . . . . . . . . . . . . . . . . . . — — 105,933 — 105,933Foreign currency translation adjustment, net of
tax expense of $1,035 . . . . . . . . . . . . . . . . . . — — — 1,925 1,925
Comprehensive income . . . . . . . . . . . . . . . . . . 107,858Exercise of stock options . . . . . . . . . . . . . . . . . — 54 — — 54Tax benefit from stock based compensation . . — 1,388 — — 1,388Stock granted under restricted stock plan,
net . . . . . . . . . . . . . . . . . . . . . . . . . . . . . . . . . 1 206 — — 207Stock based compensation . . . . . . . . . . . . . . . . — 4,903 — — 4,903Shares repurchased and retired . . . . . . . . . . . . . (1) (5,726) — — (5,727)Shares surrendered by employees to pay
taxes . . . . . . . . . . . . . . . . . . . . . . . . . . . . . . . — — (2,200) — (2,200)Cash dividends ($1.02 per share) . . . . . . . . . . . — — (23,563) — (23,563)
Balances at December 31, 2012 . . . . . . . . . . . . . . . . $231 $57,364 $657,423 $(1,940) $713,078
See accompanying notes to consolidated financial statements.
F-7

CARBO CERAMICS INC.
CONSOLIDATED STATEMENTS OF CASH FLOWS($ in thousands)
Years ended December 31,
2012 2011 2010
Operating activitiesNet income . . . . . . . . . . . . . . . . . . . . . . . . . . . . . . . . . . . . . . . . . . . . . . . . . . . . . $105,933 $130,136 $ 78,716Adjustments to reconcile net income to net cash provided by operating
activities:Depreciation and amortization . . . . . . . . . . . . . . . . . . . . . . . . . . . . . . . . . . 44,893 36,015 27,728Provision for doubtful accounts . . . . . . . . . . . . . . . . . . . . . . . . . . . . . . . . . 19 229 40Deferred income taxes . . . . . . . . . . . . . . . . . . . . . . . . . . . . . . . . . . . . . . . . 11,212 4,223 2,662Excess tax benefits from stock based compensation . . . . . . . . . . . . . . . . . (1,384) (1,399) (759)Loss on disposal or impairment of assets . . . . . . . . . . . . . . . . . . . . . . . . . . 518 1,548 1,449Foreign currency transaction loss, net . . . . . . . . . . . . . . . . . . . . . . . . . . . . 76 135 96Stock compensation expense . . . . . . . . . . . . . . . . . . . . . . . . . . . . . . . . . . . 5,335 4,719 3,812Changes in operating assets and liabilities:
Trade accounts and other receivables . . . . . . . . . . . . . . . . . . . . . . . . . 8,945 (23,101) (29,857)Inventories . . . . . . . . . . . . . . . . . . . . . . . . . . . . . . . . . . . . . . . . . . . . . . (7,589) (41,704) (10,818)Prepaid expenses and other current assets . . . . . . . . . . . . . . . . . . . . . (150) (1,142) (174)Long-term prepaid expenses . . . . . . . . . . . . . . . . . . . . . . . . . . . . . . . . 12,005 (24,083) (14)Accounts payable . . . . . . . . . . . . . . . . . . . . . . . . . . . . . . . . . . . . . . . . (18,201) 15,971 13,439Accrued expenses . . . . . . . . . . . . . . . . . . . . . . . . . . . . . . . . . . . . . . . . (10,628) 11,846 8,160Accrued income taxes, net . . . . . . . . . . . . . . . . . . . . . . . . . . . . . . . . . 5,397 (1,980) (2,695)
Net cash provided by operating activities . . . . . . . . . . . . . . . . . . . . . . . . . . . . . . 156,381 111,413 91,785Investing activitiesCapital expenditures . . . . . . . . . . . . . . . . . . . . . . . . . . . . . . . . . . . . . . . . . . . . . . (77,189) (90,395) (96,566)Acquisition of BBL Falcon Industries, Ltd. . . . . . . . . . . . . . . . . . . . . . . . . . . . . — — 193Purchase of short-term investment . . . . . . . . . . . . . . . . . . . . . . . . . . . . . . . . . . . — — (4,989)Proceeds from maturity of short-term investment . . . . . . . . . . . . . . . . . . . . . . . — — 4,989
Net cash used in investing activities . . . . . . . . . . . . . . . . . . . . . . . . . . . . . . . . . . (77,189) (90,395) (96,373)Financing activitiesProceeds from bank borrowings . . . . . . . . . . . . . . . . . . . . . . . . . . . . . . . . . . . . . 10,000 — —Repayments on bank borrowings . . . . . . . . . . . . . . . . . . . . . . . . . . . . . . . . . . . . (10,000) — —Net proceeds from stock based compensation . . . . . . . . . . . . . . . . . . . . . . . . . . 54 76 254Dividends paid . . . . . . . . . . . . . . . . . . . . . . . . . . . . . . . . . . . . . . . . . . . . . . . . . . (23,563) (20,369) (17,570)Purchase of common stock . . . . . . . . . . . . . . . . . . . . . . . . . . . . . . . . . . . . . . . . . (7,927) (7,550) (1,904)Excess tax benefits from stock based compensation . . . . . . . . . . . . . . . . . . . . . 1,384 1,399 759
Net cash used in financing activities . . . . . . . . . . . . . . . . . . . . . . . . . . . . . . . . . . (30,052) (26,444) (18,461)Effect of exchange rate changes on cash . . . . . . . . . . . . . . . . . . . . . . . . . . . . . . 225 40 148
Net increase (decrease) in cash and cash equivalents . . . . . . . . . . . . . . . . . . . . . 49,365 (5,386) (22,901)Cash and cash equivalents at beginning of year . . . . . . . . . . . . . . . . . . . . . . . . . 41,270 46,656 69,557
Cash and cash equivalents at end of year . . . . . . . . . . . . . . . . . . . . . . . . . . . . . . $ 90,635 $ 41,270 $ 46,656
Supplemental cash flow informationInterest paid . . . . . . . . . . . . . . . . . . . . . . . . . . . . . . . . . . . . . . . . . . . . . . . . . . . . . $ 78 $ 1 $ 2
Income taxes paid . . . . . . . . . . . . . . . . . . . . . . . . . . . . . . . . . . . . . . . . . . . . . . . . $ 36,036 $ 65,071 $ 40,667
See accompanying notes to consolidated financial statements.
F-8

CARBO CERAMICS INC.
NOTES TO CONSOLIDATED FINANCIAL STATEMENTS($ in thousands, except per share data)
1. Significant Accounting Policies
Description of Business
CARBO Ceramics Inc. (the “Company”) was formed in 1987 and is a manufacturer of ceramic proppants.During 2010, the Company began production of resin-coated ceramic and resin-coated sand proppants. TheCompany has six production plants in: New Iberia, Louisiana; Eufaula, Alabama; McIntyre, Georgia;Toomsboro, Georgia; Luoyang, China; and Kopeysk, Russia. The Company predominantly markets its proppantproducts through pumping service companies that perform hydraulic fracturing for oil and gas companies.Finished goods inventories are stored at the plant sites and various domestic and international remote distributionfacilities. The Company also provides the industry’s most popular hydraulic fracture simulation softwareFracPro®, as well as hydraulic fracture design and consulting services. In addition, the Company provides abroad range of technologies for spill prevention, containment and countermeasures. The Company wound-downits geotechnical monitoring business in late 2012.
Principles of Consolidation
The consolidated financial statements include the accounts of CARBO Ceramics Inc. and its operatingsubsidiaries. All significant intercompany transactions have been eliminated.
Concentration of Credit Risk, Accounts Receivable and Other Receivables
The Company performs periodic credit evaluations of its customers’ financial condition and generally doesnot require collateral. Receivables are generally due within 30 days. The majority of the Company’s receivablesare from customers in the petroleum pressure pumping industry. The Company establishes an allowance fordoubtful accounts based on its assessment of collectability risk and periodically evaluates the balance in theallowance based on a review of trade accounts receivable. Trade accounts receivable are periodically reviewedfor collectability based on customers’ past credit history and current financial condition, and the allowance isadjusted if necessary. Credit losses historically have been insignificant. The allowance for doubtful accounts atDecember 31, 2012 and 2011 was $1,844 and $1,933, respectively. Other receivables were $1,732 and $1,968 asof December 31, 2012 and 2011, respectively, of which 2012 related mainly to miscellaneous receivables in theUnited States and China. Other receivables for 2011 related mainly to miscellaneous receivables in the UnitedStates and China and value added tax receivables in Russia and China.
Cash Equivalents
The Company considers all highly liquid investments with a maturity of three months or less whenpurchased to be cash equivalents. The carrying amounts reported in the balance sheet for cash equivalentsapproximate fair value.
Inventories
Inventories are stated at the lower of cost (weighted average) or market. Finished goods inventories includecosts of materials, plant labor and overhead incurred in the production of the Company’s products and costs totransfer finished goods to distribution centers.
F-9
CARBO CERAMICS INC.
NOTES TO CONSOLIDATED FINANCIAL STATEMENTS—(Continued)($ in thousands, except per share data)
Property, Plant and Equipment
Property, plant and equipment are stated at cost. Repair and maintenance costs are expensed as incurred.Depreciation is computed on the straight-line method for financial reporting purposes using the followingestimated useful lives:
Buildings and improvements . . . . . . . . . . . . . . . . . . . . . 15 to 30 yearsMachinery and equipment . . . . . . . . . . . . . . . . . . . . . . . 3 to 30 yearsLand-use rights . . . . . . . . . . . . . . . . . . . . . . . . . . . . . . . . 30 years
The Company holds approximately 4,150 acres of land and leasehold interests containing kaolin reservesnear its plants in Georgia and Alabama. The Company also holds approximately 490 acres of land and leaseholdinterests near its resin-coating facility currently under construction in Marshfield, Wisconsin containing sandreserves for use as raw material in the production of its resin-coated sand products. The capitalized costs of landand mineral rights as well as costs incurred to develop such property are amortized using the units-of-productionmethod based on estimated total tons of these reserves.
Impairment of Long-Lived Assets and Intangible Assets
Long-lived assets to be held and used and intangible assets that are subject to amortization are reviewed forimpairment whenever events or circumstances indicate their carrying amounts might not be recoverable.Recoverability is assessed by comparing the undiscounted expected future cash flows from the assets with theircarrying amount. If the carrying amount exceeds the sum of the undiscounted future cash flows an impairmentloss is recorded. The impairment loss is measured by comparing the fair value of the assets with their carryingamounts. Intangible assets that are not subject to amortization are tested for impairment at least annually bycomparing their fair value with the carrying amount and recording an impairment loss for any excess of carryingamount over fair value. Fair values are generally determined based on discounted expected future cash flows orappraised values, as appropriate. During 2012, 2011 and 2010, the Company recognized losses of $518, $1,548and $1,449, respectively, on disposal or impairment of various assets. The loss in 2012 consisted primarily of thewind down of the geotechnical monitoring business. The loss in 2011 consisted of an impairment of goodwillrelated to the Company’s geotechnical monitoring business, a write-down of a 6% interest in an investmentaccounted for under the cost method as a result of the sale of the business by majority shareholders and certainequipment disposals. The loss in 2010 consisted of an impairment of goodwill related to the Company’sgeotechnical monitoring business and equipment disposals.
Capitalized Software
The Company capitalizes certain software costs, after technological feasibility has been established, whichare amortized utilizing the straight-line method over the economic lives of the related products, not to exceed fiveyears.
Goodwill
Goodwill represents the excess of the cost of companies acquired over the fair value of their net assets at thedate of acquisition. Goodwill relating to each of the Company’s reporting units is tested for impairment annually aswell as when an event, or change in circumstances, indicates an impairment is more likely than not to haveoccurred. As a result of changes in business conditions in the geotechnical monitoring business during 2011 and2010, the Company recorded an impairment charge of $889 and $470, respectively, on goodwill associated with thatreporting unit. The latest impairment review indicated goodwill related to other reporting units was not impaired.
F-10

CARBO CERAMICS INC.
NOTES TO CONSOLIDATED FINANCIAL STATEMENTS—(Continued)($ in thousands, except per share data)
Revenue Recognition
Revenue from proppant sales is recognized when title passes to the customer, generally upon delivery.Revenue from consulting and geotechnical services is recognized at the time service is performed. Revenue fromthe sale of fracture simulation software is recognized when title passes to the customer at time of shipment.Revenue from the sale of spill prevention services is recognized at the time service is performed. Revenue fromthe sale of containment goods is recognized at the time goods are delivered.
Shipping and Handling Costs
Shipping and handling costs are classified as cost of sales. Shipping costs consist of transportation costs todeliver products to customers. Handling costs include labor and overhead to maintain finished goods inventoryand operate distribution facilities.
Cost of Start-Up Activities
Start-up activities, including organization costs, are expensed as incurred. Start-up costs for 2012 primarilyrelated to the start-up of the second resin-coating line at the Company’s New Iberia, Louisiana facility. Start-upcosts for 2011 primarily related to the start-up of the fourth production line at the Company’s Toomsboro,Georgia facility. Start-up costs for 2010 related to the start-up of the first resin-coating line within the Company’sNew Iberia, Louisiana facility and the start-up of the third production line at the Company’s Toomsboro, Georgiafacility. Start-up costs include organizational and administrative costs associated with the facilities as well aslabor, materials, and utilities to bring installed equipment to operating condition.
Use of Estimates
The preparation of financial statements in conformity with accounting principles generally accepted in theUnited States requires management to make estimates and assumptions that affect the amounts reported in thefinancial statements and accompanying notes. Actual results could differ from those estimates.
Research and Development Costs
Research and development costs are charged to operations when incurred and are included in Selling,General and Administrative expenses. The amounts incurred in 2012, 2011 and 2010 were $6,916, $7,335 and$5,279, respectively.
Foreign Subsidiaries
Financial statements of the Company’s foreign subsidiaries are translated using current exchange rates forassets and liabilities; average exchange rates for the period for revenues, expenses, gains and losses; andhistorical exchange rates for equity accounts. Resulting translation adjustments are included in, and the onlycomponent of, Accumulated Other Comprehensive Loss as a separate component of shareholders’ equity.
New Accounting Pronouncements
In July 2012, the Financial Accounting Standards Board (“FASB”) issued ASU No. 2012-02,“Intangibles — Goodwill and Other (ASC Topic 350),” (“ASU 2012-02”). This accounting update allows entitiesto perform a qualitative assessment on intangible assets impairment to determine whether it is more likely thannot (defined as having a likelihood of more than 50 percent) that the intangible asset is impaired as a basis fordetermining whether it is necessary to perform the quantitative impairment test by comparing the fair value withthe carrying amount. This guidance is effective for intangible assets impairment tests performed in interim and
F-11
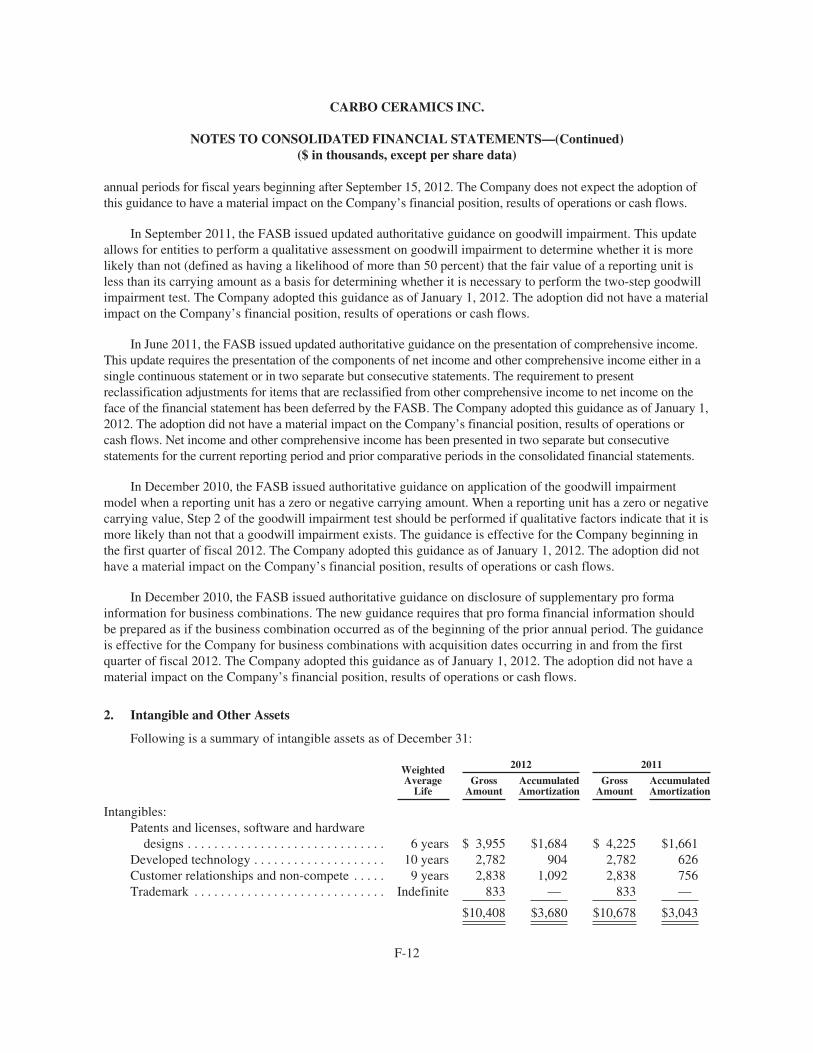
CARBO CERAMICS INC.
NOTES TO CONSOLIDATED FINANCIAL STATEMENTS—(Continued)($ in thousands, except per share data)
annual periods for fiscal years beginning after September 15, 2012. The Company does not expect the adoption ofthis guidance to have a material impact on the Company’s financial position, results of operations or cash flows.
In September 2011, the FASB issued updated authoritative guidance on goodwill impairment. This updateallows for entities to perform a qualitative assessment on goodwill impairment to determine whether it is morelikely than not (defined as having a likelihood of more than 50 percent) that the fair value of a reporting unit isless than its carrying amount as a basis for determining whether it is necessary to perform the two-step goodwillimpairment test. The Company adopted this guidance as of January 1, 2012. The adoption did not have a materialimpact on the Company’s financial position, results of operations or cash flows.
In June 2011, the FASB issued updated authoritative guidance on the presentation of comprehensive income.This update requires the presentation of the components of net income and other comprehensive income either in asingle continuous statement or in two separate but consecutive statements. The requirement to presentreclassification adjustments for items that are reclassified from other comprehensive income to net income on theface of the financial statement has been deferred by the FASB. The Company adopted this guidance as of January 1,2012. The adoption did not have a material impact on the Company’s financial position, results of operations orcash flows. Net income and other comprehensive income has been presented in two separate but consecutivestatements for the current reporting period and prior comparative periods in the consolidated financial statements.
In December 2010, the FASB issued authoritative guidance on application of the goodwill impairmentmodel when a reporting unit has a zero or negative carrying amount. When a reporting unit has a zero or negativecarrying value, Step 2 of the goodwill impairment test should be performed if qualitative factors indicate that it ismore likely than not that a goodwill impairment exists. The guidance is effective for the Company beginning inthe first quarter of fiscal 2012. The Company adopted this guidance as of January 1, 2012. The adoption did nothave a material impact on the Company’s financial position, results of operations or cash flows.
In December 2010, the FASB issued authoritative guidance on disclosure of supplementary pro formainformation for business combinations. The new guidance requires that pro forma financial information shouldbe prepared as if the business combination occurred as of the beginning of the prior annual period. The guidanceis effective for the Company for business combinations with acquisition dates occurring in and from the firstquarter of fiscal 2012. The Company adopted this guidance as of January 1, 2012. The adoption did not have amaterial impact on the Company’s financial position, results of operations or cash flows.
2. Intangible and Other Assets
Following is a summary of intangible assets as of December 31:
WeightedAverage
Life
2012 2011
GrossAmount
AccumulatedAmortization
GrossAmount
AccumulatedAmortization
Intangibles:Patents and licenses, software and hardware
designs . . . . . . . . . . . . . . . . . . . . . . . . . . . . . . 6 years $ 3,955 $1,684 $ 4,225 $1,661Developed technology . . . . . . . . . . . . . . . . . . . . 10 years 2,782 904 2,782 626Customer relationships and non-compete . . . . . 9 years 2,838 1,092 2,838 756Trademark . . . . . . . . . . . . . . . . . . . . . . . . . . . . . Indefinite 833 — 833 —
$10,408 $3,680 $10,678 $3,043
F-12

CARBO CERAMICS INC.
NOTES TO CONSOLIDATED FINANCIAL STATEMENTS—(Continued)($ in thousands, except per share data)
Amortization expense for 2012, 2011 and 2010 was $1,224, $1,131 and $1,043, respectively. Estimatedamortization expense for each of the ensuing years through December 31, 2017 is $1,117, $1,105, $1,030, $784and $638, respectively.
Following is a summary of other assets as of December 31:
2012 2011
Other assets:Bauxite raw materials:
Inventories . . . . . . . . . . . . . . . . . . . . . . . . . . . . . . . . . . . $13,143 $23,842Prepayments . . . . . . . . . . . . . . . . . . . . . . . . . . . . . . . . . 474 1,174
Other assets . . . . . . . . . . . . . . . . . . . . . . . . . . . . . . . . . . . . . . 220 826
$13,837 $25,842
Bauxite raw materials are used in the production of heavyweight ceramic products. As of December 31, 2012and 2011, the Company has classified as long-term assets those bauxite raw materials inventories and prepaymentsin the United States that are not expected to be consumed in production during the upcoming twelve month period.
3. Bank Borrowings
The Company has an unsecured revolving credit agreement with a bank. On March 5, 2012, the Companyentered into a first amendment to this credit agreement to (i) extend its maturity date from January 29, 2013 toJuly 29, 2013, (ii) increase the size from $10,000 to $25,000, and (iii) make other administrative changes tocertain covenants and provisions. The Company has the option of choosing either the bank’s fluctuating BaseRate or LIBOR Fixed Rate, plus an Applicable Margin, all as defined in the credit agreement. The terms of thecredit agreement provide for certain affirmative and negative covenants and require the Company to maintaincertain financial ratios. Commitment fees are payable quarterly at the annual rate of 0.50% of the unused line ofcredit. Commitment fees for 2012, 2011 and 2010 were $107, $51 and $47, respectively.
4. Leases
The Company leases certain property, plant and equipment under operating leases, primarily consisting ofrailroad equipment leases. Minimum future rental payments due under non-cancelable operating leases withremaining terms in excess of one year as of December 31, 2012 are as follows:
2013 . . . . . . . . . . . . . . . . . . . . . . . . . . . . . . . . . . . . . . . . . . . . $ 15,1272014 . . . . . . . . . . . . . . . . . . . . . . . . . . . . . . . . . . . . . . . . . . . . 17,1232015 . . . . . . . . . . . . . . . . . . . . . . . . . . . . . . . . . . . . . . . . . . . . 16,6402016 . . . . . . . . . . . . . . . . . . . . . . . . . . . . . . . . . . . . . . . . . . . . 13,9392017 . . . . . . . . . . . . . . . . . . . . . . . . . . . . . . . . . . . . . . . . . . . . 12,440Thereafter . . . . . . . . . . . . . . . . . . . . . . . . . . . . . . . . . . . . . . . . 45,266
Total . . . . . . . . . . . . . . . . . . . . . . . . . . . . . . . . . . . . . . . . . . . . $120,535
Leases of railroad equipment generally provide for renewal options at their fair rental value at the time ofrenewal. In the normal course of business, operating leases for railroad equipment are generally renewed or replacedby other leases. Rent expense for all operating leases was $21,452 in 2012, $11,590 in 2011 and $9,054 in 2010.
F-13

CARBO CERAMICS INC.
NOTES TO CONSOLIDATED FINANCIAL STATEMENTS—(Continued)($ in thousands, except per share data)
5. Income Taxes
Deferred income taxes reflect the net tax effects of temporary differences between the carrying amounts ofassets and liabilities for financial reporting purposes and the amounts used for income tax purposes. Significantcomponents of the Company’s deferred tax assets and liabilities as of December 31 are as follows:
2012 2011
Deferred tax assets:Employee benefits . . . . . . . . . . . . . . . . . . . . . . . . . . . . . . . . . $ 1,032 $ 1,501Inventories . . . . . . . . . . . . . . . . . . . . . . . . . . . . . . . . . . . . . . . 7,161 5,797Goodwill . . . . . . . . . . . . . . . . . . . . . . . . . . . . . . . . . . . . . . . . 1,842 2,323Other . . . . . . . . . . . . . . . . . . . . . . . . . . . . . . . . . . . . . . . . . . . 3,761 4,747
Total deferred tax assets . . . . . . . . . . . . . . . . . . . . . . . . 13,796 14,368
Deferred tax liabilities:Depreciation . . . . . . . . . . . . . . . . . . . . . . . . . . . . . . . . . . . . . 45,056 35,402Foreign earnings . . . . . . . . . . . . . . . . . . . . . . . . . . . . . . . . . . 2,665 644
Total deferred tax liabilities . . . . . . . . . . . . . . . . . . . . . 47,721 36,046
Net deferred tax liabilities . . . . . . . . . . . . . . . . . . . . . . . $33,925 $21,678
Foreign earnings in the table above are presented net of foreign tax credits of $4,432 and $3,868 as ofDecember 31, 2012 and 2011, respectively, which are expected to be utilized upon repatriation of the foreignearnings.
Significant components of the provision for income taxes for the years ended December 31 are as follows:
2012 2011 2010
Current:Federal . . . . . . . . . . . . . . . . . . . . . . . . . . . . . . . . . . . . $37,596 $57,429 $34,061State . . . . . . . . . . . . . . . . . . . . . . . . . . . . . . . . . . . . . . 2,268 4,288 3,303Foreign . . . . . . . . . . . . . . . . . . . . . . . . . . . . . . . . . . . . 1,581 1,374 607
Total current . . . . . . . . . . . . . . . . . . . . . . . . . . . . 41,445 63,091 37,971Deferred . . . . . . . . . . . . . . . . . . . . . . . . . . . . . . . . . . . . . . . 11,212 4,223 2,662
$52,657 $67,314 $40,633
Provision has been made for deferred U.S. income taxes on all foreign earnings based on the Company’sintent to repatriate foreign earnings. The reconciliation of income taxes computed at the U.S. statutory tax rate tothe Company’s income tax expense for the years ended December 31 is as follows:
2012 2011 2010
Amount Percent Amount Percent Amount Percent
U.S. statutory rate . . . . . . . . . . . . . . . . . . . . . . . . . . . . . $55,507 35.0% $69,107 35.0% $41,772 35.0%State income taxes, net of federal tax benefit . . . . . . . . 2,199 1.4 3,103 1.6 2,148 1.8Mining depletion . . . . . . . . . . . . . . . . . . . . . . . . . . . . . . (2,606) (1.6) (1,162) (0.6) (1,227) (1.0)Section 199 Manufacturing Benefit and other . . . . . . . (2,443) (1.6) (3,734) (1.9) (2,060) (1.8)
$52,657 33.2% $67,314 34.1% $40,633 34.0%
F-14

CARBO CERAMICS INC.
NOTES TO CONSOLIDATED FINANCIAL STATEMENTS—(Continued)($ in thousands, except per share data)
The Company had a recorded reserve of $227 associated with uncertain tax positions as of December 31,2012 and there were no significant changes to the recorded reserve during 2012. If these uncertain tax positionsare recognized, substantially all of this amount would impact the effective tax rate. Related accrued interest andpenalties are recorded in income tax expense and are not material.
The Company files its tax returns as prescribed by the tax laws of the jurisdictions in which it operates, themost significant of which are U.S. federal and certain state jurisdictions. The Company does not currently havematerial income tax exposure in foreign jurisdictions due to tax holidays, recent commencement of operations orimmaterial operations. The 2009 and subsequent tax years are still subject to examination. Various U.S. statejurisdiction tax years remain open to examination as well though the Company believes assessments, if any,would be immaterial to its consolidated financial statements.
6. Shareholders’ Equity
Common Stock
Holders of Common Stock are entitled to one vote per share on all matters to be voted on by shareholdersand do not have cumulative voting rights. Subject to preferences of any Preferred Stock, the holders of CommonStock are entitled to receive ratably such dividends, if any, as may be declared from time to time by the Board ofDirectors out of funds legally available for that purpose. In the event of liquidation, dissolution or winding up ofthe Company, holders of Common Stock are entitled to share ratably in all assets remaining after payment ofliabilities, subject to prior distribution rights of any Preferred Stock then outstanding. The Common Stock has nopreemptive or conversion rights or other subscription rights. There are no redemption or sinking fund provisionsapplicable to the Common Stock. All outstanding shares of Common Stock are fully paid and non-assessable.
On January 22, 2013, the Board of Directors declared a cash dividend of $0.27 per share. The dividend ispayable on February 15, 2013 to shareholders of record on February 1, 2013.
Preferred Stock
The Company’s charter authorizes 5,000 shares of Preferred Stock. The Board of Directors has the authorityto issue Preferred Stock in one or more series and to fix the rights, preferences, privileges and restrictionsthereof, including dividend rights, conversion rights, voting rights, terms of redemption, redemption prices,liquidation preferences and the number of shares constituting any series or the designation of such series, withoutfurther vote or action by the Company’s shareholders. In connection with adoption of a shareholder rights planon February 13, 2002, the Company created the Series A Preferred Stock and authorized 2,000 shares of theSeries A Preferred Stock.
Shareholder Rights Plan
On February 13, 2002, the Company adopted a shareholder rights plan and declared a dividend of one right foreach outstanding share of Common Stock to shareholders of record on February 25, 2002. With certain exceptions,the rights become exercisable if a tender offer for the Company is announced or any person or group acquiresbeneficial ownership of at least 15 percent of the Company’s Common Stock. If exercisable, each right entitles theholder to purchase one fifteen-thousandth of a share of Series A Preferred Stock at an exercise price of $133 and, ifany person or group acquires beneficial ownership of at least 15 percent of the Company’s Common Stock, toacquire a number of shares of Common Stock having a market value of two times the $133 exercise price. TheCompany may redeem the rights for $0.01 per right at any time before any person or group acquires beneficialownership of at least 15 percent of the Common Stock. The rights expired on February 13, 2012.
F-15

CARBO CERAMICS INC.
NOTES TO CONSOLIDATED FINANCIAL STATEMENTS—(Continued)($ in thousands, except per share data)
Common Stock Repurchase Program
On August 28, 2008, the Company’s Board of Directors authorized the repurchase of up to two millionshares of the Company’s Common Stock. Shares are effectively retired at the time of purchase. During the yearsended December 31, 2012, 2011 and 2010, the Company repurchased and retired 60,000, 55,000 and 19,500shares respectively, at an aggregate price of $5,727, $6,649 and $1,212, respectively. As of December 31, 2012,the Company has repurchased and retired 1,877,576 shares at an aggregate price of $78,301.
7. Stock Based Compensation
The CARBO Ceramics Inc. Omnibus Incentive Plan (the “Omnibus Incentive Plan”) provides for grantingof cash-based awards, stock options (both non-qualified and incentive) and other equity-based awards (includingstock appreciation rights, phantom stock, restricted stock, restricted stock units, performance shares, deferredshare units or share-denominated performance units) to employees and non-employee directors. The amount paidunder the Omnibus Incentive Plan to any single participant in any calendar year with respect to any cash-basedaward shall not exceed $2,000. Awards may be granted with respect to a number of shares of the Company’sCommon Stock that in the aggregate does not exceed 750,000 shares prior to the fifth anniversary of its effectivedate, plus (i) the number of shares that are forfeited, cancelled or returned, and (ii) the number of shares that arewithheld from the participants to satisfy an option exercise price or minimum statutory tax withholdingobligations. No more than 50,000 shares may be granted to any single participant in any calendar year. Equity-based awards may be subject to performance-based and/or service-based conditions. With respect to stockoptions and stock appreciation rights granted, the exercise price shall not be less than the market value of theunderlying Common Stock on the date of grant. The maximum term of an option is ten years. Restricted stockawards granted generally vest (i.e., transfer and forfeiture restrictions on these shares are lifted) in equal annualinstallments over a three-year period, but subject to certain limitations, awards may specify other vesting periods.As of December 31, 2012, 563,666 shares were available for issuance under the Omnibus Incentive Plan.
As of December 31, 2012, all compensation cost related to stock options granted under the expired stockoption plan has been recognized. During 2012, a total of 2,425 options, with a weighted-average exercise price of$22.35 per share, were exercised. There were no options outstanding at December 31, 2012. The total intrinsicvalue of options exercised during the years ended December 31, 2012, 2011 and 2010 was $118, $346, and $250,respectively.
A summary of restricted stock activity and related information for the year ended December 31, 2012 ispresented below:
Shares
Weighted-Average
Grant-DateFair Value
Nonvested at January 1, 2012 . . . . . . . . . . . . . . . . . . . . . . . 129,082 $ 75.00Granted . . . . . . . . . . . . . . . . . . . . . . . . . . . . . . . . . . . . . . . . 74,460 $105.22Vested . . . . . . . . . . . . . . . . . . . . . . . . . . . . . . . . . . . . . . . . . (74,887) $ 62.71Forfeited . . . . . . . . . . . . . . . . . . . . . . . . . . . . . . . . . . . . . . . (12,933) $101.02
Nonvested at December 31, 2012 . . . . . . . . . . . . . . . . . . . . 115,722 $ 99.50
As of December 31, 2012, there was $6,138 of total unrecognized compensation cost, net of estimatedforfeitures, related to restricted shares granted under the Omnibus Incentive Plan. That cost is expected to be
F-16

CARBO CERAMICS INC.
NOTES TO CONSOLIDATED FINANCIAL STATEMENTS—(Continued)($ in thousands, except per share data)
recognized over a weighted-average period of 1.8 years. The weighted-average grant date fair value of restrictedstock granted during the years ended December 31, 2011 and 2010 was $104.07 and $68.80, respectively. Thetotal fair value of shares vested during the years ended December 31, 2012, 2011 and 2010 was $4,696, $2,712and $2,141, respectively.
The Company has made phantom stock awards to key international employees pursuant to the OmnibusIncentive Plan. The units subject to an award vest and cease to be forfeitable in equal annual installments over athree-year period. Participants awarded units of phantom shares are entitled to a lump sum cash payment equal tothe fair market value of a share of Common Stock on the vesting date. In no event will Common Stock of theCompany be issued with regard to outstanding phantom shares. As of December 31, 2012, there were 10,105units of phantom shares granted under the plan, of which 3,429 have vested and 1,304 have been forfeited, with atotal value of $421, a portion of which is accrued as a liability within Accrued Payroll and Benefits.
8. Earnings Per Share
ASC Topic 260, “Earnings Per Share”, provides that unvested share-based payment awards that containnon-forfeitable rights to dividends or dividend equivalents (whether paid or unpaid) are participating securitiesand shall be included in the computation of earnings per share pursuant to the two-class method. The Company’soutstanding non-vested restricted stock awards are participating securities. Accordingly, earnings per commonshare are computed using the two-class method.
The following table sets forth the computation of basic and diluted earnings per share under the two-classmethod:
2012 2011 2010
Numerator for basic and diluted earnings per share:Net income . . . . . . . . . . . . . . . . . . . . . . . . . . . . . . . . . . . . . . . . . $ 105,933 $ 130,136 $ 78,716Effect of reallocating undistributed earnings of participating
securities . . . . . . . . . . . . . . . . . . . . . . . . . . . . . . . . . . . . . . . . . (553) (749) (485)
Net income available under the two-class method . . . . . . . $ 105,380 $ 129,387 $ 78,231
Denominator:Denominator for basic earnings per share—weighted-average
shares . . . . . . . . . . . . . . . . . . . . . . . . . . . . . . . . . . . . . . . . . . . . 22,968,696 23,011,087 22,969,360Effect of dilutive securities:Employee stock options (See Note 7) . . . . . . . . . . . . . . . . . . . . . 625 1,332 3,802Deferred stock awards (See Note 7) . . . . . . . . . . . . . . . . . . . . . . — — 4,034
Dilutive potential common shares . . . . . . . . . . . . . . . . . . . . . . . . . . . . 625 1,332 7,836
Denominator for diluted earnings per share—adjusted weighted-average shares . . . . . . . . . . . . . . . . . . . . . . . . . . . . . . . . . . . . . . . . . 22,969,321 23,012,419 22,977,196
Basic earnings per share . . . . . . . . . . . . . . . . . . . . . . . . . . . . . . . $ 4.59 $ 5.62 $ 3.41
Diluted earnings per share . . . . . . . . . . . . . . . . . . . . . . . . . . . . . . $ 4.59 $ 5.62 $ 3.40
F-17

CARBO CERAMICS INC.
NOTES TO CONSOLIDATED FINANCIAL STATEMENTS—(Continued)($ in thousands, except per share data)
9. Quarterly Operating Results—(Unaudited)
Quarterly results for the years ended December 31, 2012 and 2011 were as follows:
Three Months Ended
March 31 June 30 September 30 December 31
2012Revenues . . . . . . . . . . . . . . . . . . . . . . . . . . . . . . $163,166 $177,614 $151,134 $153,622Gross profit . . . . . . . . . . . . . . . . . . . . . . . . . . . . 63,464 64,253 50,150 45,638Net income . . . . . . . . . . . . . . . . . . . . . . . . . . . . 30,291 31,917 23,898 19,827Earnings per share:
Basic . . . . . . . . . . . . . . . . . . . . . . . . . . . . . $ 1.31 $ 1.38 $ 1.04 $ 0.86Diluted . . . . . . . . . . . . . . . . . . . . . . . . . . . $ 1.31 $ 1.38 $ 1.04 $ 0.86
2011Revenues . . . . . . . . . . . . . . . . . . . . . . . . . . . . . . $150,830 $149,669 $167,083 $158,123Gross profit . . . . . . . . . . . . . . . . . . . . . . . . . . . . 62,056 62,118 72,693 64,848Net income . . . . . . . . . . . . . . . . . . . . . . . . . . . . 30,164 29,944 36,911 33,117Earnings per share:
Basic . . . . . . . . . . . . . . . . . . . . . . . . . . . . . $ 1.30 $ 1.29 $ 1.59 $ 1.43Diluted . . . . . . . . . . . . . . . . . . . . . . . . . . . $ 1.30 $ 1.29 $ 1.59 $ 1.43
Quarterly data may not sum to full year data reported in the Consolidated Financial Statements due torounding.
10. Sales to Customers
The following schedule presents customers from whom the Company derived 10% or more of total revenuesfor the years ended December 31:
Major Customers
A B
2012 . . . . . . . . . . . . . . . . . . . . . . . . . . . . . . . . . . . . . . . . . . . . . . . . . . . . . . . . 13.7% 35.2%2011 . . . . . . . . . . . . . . . . . . . . . . . . . . . . . . . . . . . . . . . . . . . . . . . . . . . . . . . . 15.0% 33.3%2010 . . . . . . . . . . . . . . . . . . . . . . . . . . . . . . . . . . . . . . . . . . . . . . . . . . . . . . . . 15.0% 37.5%
11. Geographic Information
Long-lived assets, consisting of net property, plant and equipment and other long-term assets, as ofDecember 31 in the United States and other countries are as follows:
2012 2011 2010
Long-lived assets:United States . . . . . . . . . . . . . . . . . . . . . . . . . . . . $403,534 $377,667 $294,368International (primarily China and Russia) . . . . . 36,535 40,835 46,391
Total . . . . . . . . . . . . . . . . . . . . . . . . . . . . . . . $440,069 $418,502 $340,759
F-18

CARBO CERAMICS INC.
NOTES TO CONSOLIDATED FINANCIAL STATEMENTS—(Continued)($ in thousands, except per share data)
Revenues outside the United States accounted for 23%, 21% and 23% of the Company’s revenues for 2012,2011 and 2010, respectively. Revenues for the years ended December 31 in the United States, Canada and othercountries are as follows:
2012 2011 2010
Revenues:United States . . . . . . . . . . . . . . . . . . . . . . . . . . . . $500,106 $495,777 $365,346Canada . . . . . . . . . . . . . . . . . . . . . . . . . . . . . . . . . 30,929 34,001 28,926Other international . . . . . . . . . . . . . . . . . . . . . . . . 114,501 95,927 78,810
Total . . . . . . . . . . . . . . . . . . . . . . . . . . . . . . . $645,536 $625,705 $473,082
12. Benefit Plans
The Company has defined contribution savings and profit sharing plans pursuant to Section 401(k) of theInternal Revenue Code. Benefit costs recognized as expense under these plans consisted of the following for theyears ended December 31:
2012 2011 2010
Contributions:Profit sharing . . . . . . . . . . . . . . . . . . . . . . . . . . . . . . . . . . $2,132 $2,690 $1,606Savings . . . . . . . . . . . . . . . . . . . . . . . . . . . . . . . . . . . . . . . 1,241 1,081 847
$3,373 $3,771 $2,453
All contributions to the plans are 100% participant directed. Participants are allowed to invest up to 20% ofcontributions in the Company’s Common Stock.
13. Commitments
For the year ended December 31, 2010, the Company purchased $3,603 of kaolin for its Eufaula, Alabamaplant under an existing seven year agreement. This agreement expired December 31, 2010. Effective January 1,2011, the Company entered into a new agreement with another one of the Company’s existing suppliers. Theterm of the agreement was three years, with options to extend for an additional six years, and required theCompany to purchase from the supplier at least 70 percent of the annual kaolin requirements for the Eufaulaplant at specified contract prices. In May 2012, the agreement was amended to require the Company to purchasefrom the supplier at least 50 percent of the annual kaolin requirements for the Eufaula, Alabama plant atspecified contract prices for the remainder of 2012 and the ensuing five calendar years. The agreement hasoptions to extend the term for an additional three years. For the years ended December 31, 2012 and 2011, theCompany purchased from the supplier $3,012 and $3,205, respectively, of kaolin under the agreement.
In January 2003, the Company entered into a mining agreement with a contractor to provide kaolin for theCompany’s McIntyre plant at specified contract prices, from lands owned or leased by either the Company or thecontractor. The term of the agreement, which commenced on January 1, 2003, and remains in effect until suchtime as all Company-owned minerals have been depleted, requires the Company to accept delivery from thecontractor of at least 80 percent of the McIntyre plant’s annual kaolin requirements. For the years endedDecember 31, 2012, 2011 and 2010, the Company purchased $2,491, $2,900 and $1,687, respectively, of kaolinunder the agreement.
F-19
CARBO CERAMICS INC.
NOTES TO CONSOLIDATED FINANCIAL STATEMENTS—(Continued)($ in thousands, except per share data)
In October 2008, the Company entered into a ten-year agreement, with options to extend for an additionalten years, to purchase a minimum of 40,000 tons of uncalcined bauxite each year during the first three years ofthe agreement. Thereafter, the minimum required purchase increased to 70,000 tons annually. The bauxite ispurchased at specified contract prices. After meeting annual minimum requirements for the first three years, theagreement was terminated in 2012 with no further required minimum purchases. For the years endedDecember 31, 2011 and 2010, the Company purchased $1,400 and $1,400, respectively, of bauxite under theagreement.
In 2002, the Company entered into a five-year agreement and a ten-year agreement with two differentsuppliers to purchase bauxite and hard clays for its China plant at specified contract prices. The five-yearagreement, which was automatically renewed for an additional three years, expired in 2010. The ten-yearagreement, which expired in 2011, required the Company to accept delivery from the supplier for at least 80percent of the plant’s annual requirements. For the years ended December 31, 2011 and 2010, the Companypurchased $2,918 and $2,834, respectively, of material under these agreements.
In July 2011, the Company entered into a new agreement with a supplier to provide hydro sized sand for theCompany’s Marshfield, Wisconsin plant at a specified contract price. The term of the agreement was five yearscommencing on July 30, 2011 and required the Company to purchase a minimum of 40,000 tons and 100,000tons of hydro sized sand during 2011 and 2012, respectively. Effective January 30, 2012, the agreement wasamended and requires the Company to purchase a minimum of 150,000 tons of hydro sized sand annually during2012 and 2013 and a minimum of 350,000 tons of hydro sized sand in 2014, all at a stated contract price. For theyears ended December 31, 2012 and 2011, the Company purchased $2,538 and $462, respectively, of sand underthis agreement.
In May 2012, the Company entered into a new supply agreement to provide kaolin and bauxite to amanufacturing plant in Millen, Georgia, once operations commence. Construction of the facility is expected to becompleted in early 2014. The agreement requires the Company to purchase at least 50 percent of the plant’sannual requirements of such products, and has an initial term of five years with options to extend for anadditional five years.
The Company has entered into a lease agreement dated November 1, 2008 with the Development Authorityof Wilkinson County (the “Wilkinson County Development Authority”) and a lease agreement datedNovember 1, 2012 with the Development Authority of Jenkins County (the “Jenkins County DevelopmentAuthority” and together with the Wilkinson County Development Authority, the “Development Authorities”)each in the State of Georgia. Pursuant to the 2008 agreement, the Wilkinson County Development Authorityholds the title to the real and personal property of the Company’s McIntyre and Toomsboro manufacturingfacilities and leases the facilities to the Company for an annual rental fee of $50 per year through the year 2022.Pursuant to the 2012 agreement, the Jenkins County Development Authority holds title to the real estate andpersonal property of the Company’s Millen, Georgia manufacturing facility, which is currently underconstruction, and leases the facility to the Company until the tenth anniversary of completion of the final phaseof the facility. At any time prior to the scheduled termination of either lease, the Company has the option toterminate the lease and purchase the property for a nominal fee plus the payment of any rent payable through thebalance of the lease term. Furthermore, the Company has security interests in the titles held by the DevelopmentAuthorities. The Company has also entered into a Memorandum of Understanding (the “MOU”) with theDevelopment Authorities and other local agencies, under which the Company receives tax incentives in exchangefor its commitment to invest in the county and increase employment. The MOU with the Jenkins CountyDevelopment Authority also requires the Company to pay an administrative payment of $50 per year during the
F-20

CARBO CERAMICS INC.
NOTES TO CONSOLIDATED FINANCIAL STATEMENTS—(Continued)($ in thousands, except per share data)
term of the Millen lease. The Company is required to achieve certain employment levels in order to retain its taxincentives. In the event the Company does not meet the agreed-upon employment targets or the MOU isotherwise terminated, the Company would be subjected to additional property taxes annually. The propertiessubject to these lease agreements are included in Property, Plant and Equipment (net book value of $251,602 atDecember 31, 2012) in the accompanying consolidated financial statements.
The Company uses natural gas to power its domestic manufacturing plants. From time to time the Companyenters into contracts to purchase a portion of the anticipated natural gas requirements at specified prices. As ofDecember 31, 2012, the Company had natural gas contracts totaling $25,087, $18,679, $18,679, $11,619 and$1,220 for years ended 2013, 2014, 2015, 2016 and 2017, respectively.
14. Employment Agreements
The Company has an employment agreement through December 31, 2013 with its President and ChiefExecutive Officer. The agreement provides for an annual base salary and incentive bonus. If the President andChief Executive Officer is terminated early without cause, the Company will be obligated to pay two years basesalary and a prorated incentive bonus. Under the agreement, the timing of the payment of severance obligationsto the President in the event of the termination of his employment under certain circumstances has beenconformed so that a portion of such obligations will be payable in a lump sum, with the remainder of theobligations to be paid over an 18 month period. The agreement also contains a two-year non-competitioncovenant that would become effective upon termination for any reason. The employment agreement extendsautomatically for successive one-year periods without prior written notice.
15. Foreign Currencies
As of December 31, 2012, the Company’s net investment that is subject to foreign currency fluctuationstotaled $93,095, and the Company has recorded a cumulative foreign currency translation loss of $1,940, net ofdeferred income tax benefit. This cumulative translation loss is included in Accumulated Other ComprehensiveLoss.
16. Legal Proceedings and Regulatory Matters
The Company is subject to legal proceedings, claims and litigation arising in the ordinary course ofbusiness. While the outcome of these matters is currently not determinable, management does not expect that theultimate costs to resolve these matters will have a material adverse effect on the Company’s consolidatedfinancial position, results of operations, or cash flows.
On February 9, 2012, the Company and two of its officers, Gary A. Kolstad and Ernesto Bautista III, werenamed as defendants in a purported class-action lawsuit filed in the United States District Court for the SouthernDistrict of New York (the “February SDNY Lawsuit”), brought on behalf of shareholders who purchased theCompany’s Common Stock between October 27, 2011 and January 26, 2012 (the “Relevant Time Period”). OnApril 10, 2012, a second purported class-action lawsuit was filed against the same defendants in the United StatesDistrict Court for the Southern District of New York, brought on behalf of shareholders who purchased or soldCARBO Ceramics Inc. option contracts during the Relevant Time Period (the “April SDNY Lawsuit”, andcollectively with the February SDNY Lawsuit, the “Federal Securities Lawsuit”). In June 2012, the FebruarySNDY Lawsuit and the April SDNY Lawsuit were consolidated, and will now proceed as one lawsuit. TheFederal Securities Lawsuit alleges violations of the federal securities laws arising from statements concerning the
F-21

CARBO CERAMICS INC.
NOTES TO CONSOLIDATED FINANCIAL STATEMENTS—(Continued)($ in thousands, except per share data)
Company’s business operations and business prospects that were made during the Relevant Time Period andrequests unspecified damages and costs. In September 2012, the Company and Messrs. Kolstad and Bautista fileda motion to dismiss this lawsuit. Response and reply briefs on this motion were filed during the fourth quarter of2012, and a decision from the Court is pending.
On June 13, 2012, the Directors of the Company and Mr. Bautista were named as defendants in a purportedderivative action lawsuit brought on behalf of the Company by a stockholder in District Court in Harris County,Texas (the “June Harris County Lawsuit”). This lawsuit alleges various breaches of fiduciary duty and otherduties by the defendants that generally are related to the February SDNY Lawsuit as well as a breach of duty bycertain defendants in connection with stock sales. This lawsuit also requests unspecified damages and costs. Theparties to the June Harris County Lawsuit have also entered into an agreement to stay further proceedingspending the outcome of a motion to dismiss the Federal Securities Lawsuit.
While each of the Federal Securities Lawsuit and the June Harris County Lawsuit are in their preliminarystages, the Company does not believe they have merit, and plans to vigorously contest and defend against them.
The Company cannot predict the ultimate outcome or duration of these lawsuits.
17. Subsequent Events
In January 2013, the Company awarded 86,143 shares of restricted stock to certain employees. The fairvalue of the stock award on the date of grant totaled $6,942, which will be recognized as expense, net ofestimated forfeitures, on a straight-line basis over the three-year vesting period.
In January 2013, the Company awarded 4,485 units of phantom shares to certain key internationalemployees. The fair value of the stock award on the date of grant totaled $361.
In February 2013, the Company repurchased and retired 30,000 common shares at an aggregate price of$2,683 under the common stock repurchase program.
F-22

Exhibit Index
3.1 Restated Certificate of Incorporation of CARBO Ceramics Inc. (incorporated by reference toExhibit 3.1 of the Registrant’s Form 10-Q filed for the period ending June 30, 2012)
3.2 Second Amended and Restated By-Laws of CARBO Ceramics Inc. (incorporated by reference toExhibit 3.1 of the Registrant’s Form 8-K Current Report filed March 20, 2009)
4.1 Form of Common Stock Certificate of CARBO Ceramics Inc. (incorporated by reference toExhibit 4.1 of the Registrant’s Form S-1 Registration Statement No. 333-1884 filed July 19, 1996)
4.2 Certificate of Designations of Series A Preferred Stock (incorporated by reference to Exhibit 2 of theRegistrant’s Form 8-A12B Registration Statement No. 001-15903 filed February 25, 2002)
10.1 Mining Agreement dated as of January 1, 2003 between CARBO Ceramics Inc. and Arcilla Mining& Land Co. (incorporated by reference to Exhibit 10.8 of the Registrant’s Form 10-K Annual Reportfor the year ended December 31, 2002)
10.2 Addendum to Mining Agreement dated as of November 10, 2009 between CARBO Ceramics Inc.and Arcilla Mining & Land Co. (incorporated by reference to Exhibit 10.3 of the Registrant’sForm 10-K Annual Report for the year ended December 31, 2010)
*10.3 Second Amended and Restated Employment Agreement dated effective as of January 1, 2012, by andbetween CARBO Ceramics Inc. and Gary A. Kolstad (incorporated by reference to Exhibit 10.8 ofthe Registrant’s Form 10-K filed for the period ending December 31, 2011)
10.4 Proppant Supply Agreement dated as of August 28, 2008 between CARBO Ceramics Inc. andHalliburton Energy Services, Inc. (incorporated by reference to Exhibit 10.3 of the Registrant’sForm 10-Q Quarterly Report for the quarter ended September 30, 2008)
10.5 Amendment No. 1 to Proppant Supply Agreement dated as of February 28, 2011 between CARBOCeramics Inc. and Halliburton Energy Services, Inc. (incorporated by reference to Exhibit 10.1 of theRegistrant’s Form 10-Q Quarterly Report for the quarter ended March 31, 2011)
10.6 Side Letter to Proppant Supply Agreement dated as of August 26, 2011 between CARBO CeramicsInc. and Halliburton Energy Services, Inc. (incorporated by reference to Exhibit 10.1 of theRegistrant’s Form 10-Q Quarterly Report for the quarter ended September 30, 2011)
10.7 Lease Agreement dated as of November 1, 2008 between the Development Authority of WilkinsonCounty and CARBO Ceramics Inc. (incorporated by reference to Exhibit 10.1 of the Registrant’sForm 8-K Current Report filed December 30, 2008)
10.8 Option Agreement dated as of November 1, 2008 between the Development Authority of WilkinsonCounty and CARBO Ceramics Inc. (incorporated by reference to Exhibit 10.2 of the Registrant’sForm 8-K Current Report filed December 30, 2008)
10.9 Lease Agreement dated as of November 1, 2012 between the Development Authority of JenkinsCounty and CARBO Ceramics Inc.
*10.10 CARBO Ceramics Inc. Omnibus Incentive Plan (incorporated by reference to Exhibit 10.1 of theRegistrant’s Form 8-K Current Report filed May 21, 2009)
*10.11 Form of Officer Restricted Stock Award Agreement for Omnibus Incentive Plan (incorporated byreference to Exhibit 10.20 of the Registrant’s Form 10-K Annual Report for the year endedDecember 31, 2010)
*10.12 Form of Non-Employee Director Restricted Stock Award Agreement for Omnibus Incentive Plan(incorporated by reference to Exhibit 10.21 of the Registrant’s Form 10-K Annual Report for the yearended December 31, 2010)
*10.13 Form of Performance-Based Cash Award Agreement for Omnibus Incentive Plan (incorporated byreference to Exhibit 10.4 of the Registrant’s Form 8-K Current Report filed May 21, 2009)

*10.14 Description of Annual Non-Employee Director Stock Grants (incorporated by reference to Exhibit10.1 of the Registrant’s Form 10-Q Quarterly Report for the quarter ended June 30, 2010)
*10.15 Description of Modification to Annual Non-Employee Director Stock Grants (incorporated byreference to Exhibit 10.2 of the Registrant’s Form 10-Q Quarterly Report for the quarter endedMarch 31, 2011)
*10.16 Description of Modification to the Annual Non-Employee Director Stock Grants (incorporated byreference to Exhibit 10.2 of the Registrant’s Form 10-Q Quarterly Report for the quarter endedMarch 31, 2012).
*10.17 CARBO Ceramics Inc. Omnibus Incentive Plan Annual Incentive Arrangement (incorporated byreference to Exhibit 10.1 of the Registrant’s Form 8-K Current Report filed January 21, 2010)
10.18 Office Lease dated as of January 20, 2009 between I-10 EC Corridor #2 Limited Partnership andCARBO Ceramics Inc. (incorporated by reference to Exhibit 10.27 of the Registrant’s Form 10-KAnnual Report for the year ended December 31, 2009)
10.19 First Amendment to Lease dated as of January 15, 2010 between I-10 EC Corridor #2 LimitedPartnership and CARBO Ceramics Inc. (incorporated by reference to Exhibit 10.28 of theRegistrant’s Form 10-K Annual Report for the year ended December 31, 2009)
10.20 Credit Agreement, dated as of January 29, 2010, among CARBO Ceramics Inc., as borrower, WellsFargo Bank, National Association, as administrative agent, issuing lender and swing line lender, andthe lenders named therein (incorporated by reference to Exhibit 10.1 of the Registrant’s Form 8-KCurrent Report filed February 4, 2010).
10.21 Amendment No. 1, dated as of March 5, 2012, among CARBO Ceramics Inc., as borrower, WellsFargo Bank, National Association, as administrative agent, issuing lender and swing line lender, andthe lenders named therein. (Incorporated by reference to Exhibit 10.1 of the Registrant’s Form 8-KCurrent Report filed March 6, 2012).
*10.22 Form of Change in Control Severance Agreement (incorporated by reference to Exhibit 10.1 of theRegistrant’s Form 10-Q Quarterly Report for the quarter ended March 31, 2012).
10.23 Separation Agreement, made as of August 9, 2012, by and between David G. Gallagher and CARBOCeramics Inc. (incorporated by reference to Exhibit 10.1 of the Registrant’s Form 10-Q QuarterlyReport for the quarter ended September 30, 2012).
*10.24 Summary of initial compensation terms for Don P. Conkle (incorporated by reference to Exhibit 10.2of the Registrant’s Form 10-Q Quarterly Report for the quarter ended September 30, 2012).
21 Subsidiaries
23 Consent of Independent Registered Public Accounting Firm
31.1 Rule 13a-14(a)/15d-14(a) Certification by Gary A. Kolstad
31.2 Rule 13a-14(a)/15d-14(a) Certification by Ernesto Bautista III
32 Certification pursuant to 18 U.S.C. Section 1350, as adopted pursuant to Section 906 of the Sarbanes-Oxley Act of 2002
95 Mine Safety Disclosure
101 The following financial information from the Company’s Annual Report on Form 10-K for the yearended December 31, 2012, formatted in XBRL: (i) Consolidated Balance Sheets; (ii) ConsolidatedStatements of Income; (iii) Consolidated Statements of Shareholders’ Equity; (iv) ConsolidatedStatements of Cash Flows; and (v) Notes to the Consolidated Financial Statements.
* Management contract or compensatory plan or arrangement filed as an exhibit pursuant to Item 15(b) of therequirements for an Annual Report on Form 10-K.

CoRpoRAte InFoRMAtIon
BOARD OF DIRECTORSWilliam C. Morris Chairman of the Board Former Chairman of the Board, J. & W. Seligman & Co. Incorporated
Sigmund L. Cornelius Former Senior Vice President and Chief Financial Officer, ConocoPhillips
James B. Jennings Former Senior Advisor, Brown Brothers Harriman & Co. Chairman Emeritus, Hunt Oil Company
Gary A. Kolstad President and Chief Executive Officer, CARBO Ceramics Inc.
H. E. Lentz, Jr. Former Managing Director Lazard Frères & Co. Non-Executive Chairman, Rowan Companies, Inc.
Randy L. Limbacher Former Chairman of the Board, President and Chief Executive Officer, Rosetta Resources, Inc.
Robert S. Rubin Senior Vice President, JPMorgan Chase & Co.
CORPORATE OFFICERSGary A. Kolstad President and Chief Executive Officer
Ernesto Bautista, III Vice President and Chief Financial Officer
Mark L. Edmunds Vice President, Operations
Don P. Conkle Vice President, Marketing and Sales
Ellen M. Smith Vice President, Human Resources
R. Sean Elliott Vice President and General Counsel
CORPORATE OFFICESEnergy Center II 575 N. Dairy Ashford Suite 300 Houston, Texas 77079 281-921-6400
STOCK EXCHANGE LISTINGThe New York Stock Exchange Symbol: CRR
TRANSFER AGENT AND REGISTRARComputershare 250 Royall Street Canton, MA 02021 866-683-2970
INDEPENDENT AUDITORSErnst & Young LLP New Orleans, Louisiana
FORM 10-KA copy of the company’s Annual Report to the Securities and Exchange Commission (Form 10-K) is available free of charge by contacting:
Ernesto Bautista, III Chief Financial Officer CARBO Ceramics Inc. 575 N. Dairy Ashford Suite 300 Houston, Texas 77079
CERTIFICATIONSThe certifications required by Section 302 of the Sarbanes-Oxley Act of 2002 were filed as exhibits to the Form 10-K. In addition, we have submitted to the New York Stock Exchange the annual certification of our Chief Executive Officer regarding the Company’s compliance with the NYSE corporate governance listing standards.
INVESTOR RELATIONSAdditional corporate information is available from our website at www.carboceramics.com or by e-mailing the company at [email protected].
MISSION STATEMENT: Our primary mission is to improve E&P operators’ production and recovery rates in oil and natural gas reservoirs by improving the effectiveness of hydraulic fracturing, and reservoir recovery optimization.
How we achieve our primary mission –
• As the global market leader, we provide the highest conductivity proppant and fracture design software.
• We provide industry-leading, technical consulting for fracturing design & execution, as well as production/EUR optimization.
• We enhance our clients’ profitability by consistently providing leading technology and cost-effective products and services.
• We provide a safe working environment that encourages, supports and recognizes the contribution of each individual employee.
In addition –
• We provide environmental protection services through a broad range of technologies for spill prevention, containment and countermeasures.
• We strive to generate a superior return to our shareholders through cash flow growth and profitable business growth.
CORE VALUES: At CARBO, we achieve our mission within the framework established by our core values.
• Weconductourbusinesswiththehighestethicalstandards.
• Wearetruthfulandhonorourcommitmentsandresponsibilities.
• Wefosterasupportiveenvironmentbytreatingeachotherwith mutual respect and understanding.
• Wesetaggressivegoalsandstrivetoexceedthem.
• Wevalueandcelebrateahighlevelofindividualachievementandteamperformance.
• Weencourageinnovationandcontinuousimprovementtoensurefuturegrowth.

energy center II575 n. Dairy ashford
Suite 300houston, tX 77079
corporate office: 281-921-6400
www.carboceramics.com
®


