Natural organic matter is a heterogeneous mixture of organic molecules representing both compounds released from
living plant and microbial cells (e.g., extracellular enzymes, sur-
face-active proteins, chelating compounds, etc.) to plant, animal, microbial, and charred carbonaceous residues ranging in size and complexity from simple monomers to mixtures of complex biopolymers (Ladd et al., 1993; Solomon et al., 2007a). Natural organic matter is a highly active component of soils, water, and sediments and plays an important role in ecosystem processes. Present ubiquitously in the environment, NOM has defi ed mo-lecular-level structural and functional characterization for nearly a century, owing primarily to its existence mostly as highly func-tionalized polyelectrolytes, which as such do not lend themselves to analytical techniques for molecular characterization (Sleighter and Hatcher, 2007). Variations along the decomposition and size continuum, as well as its ability to form strong associations with minerals create further analytical problems that have made
Dawit Solomon*Johannes LehmannJames KinyangiBiqing LiangKaren HeymannLena DatheKelly HanleyCornell University College of Agriculture and Life SciencesIthaca, NY 14853
Sue WirickChris JacobsenState University of New York at Stony BrookDepartment of Physics and AstronomyStony Brook, NY 11794
SOIL C
HEM
ISTRY
Carbon (1s) NEXAFS Spectroscopy of Biogeochemically Relevant Reference Organic Compounds
Natural organic matter (NOM) is a highly active component of soils and sediments, and plays an important role in global C cycling. However, NOM has defi ed molecular-level structural characterization, owing to variations along the decomposition continuum and its existence as highly functionalized polyelectrolytes. We conducted a comprehensive systematic overview of spectral signatures and peak positions of major organic molecules that occur as part of NOM using near-edge x-ray absorption fi ne structure (NEXAFS) spectroscopy. Th e spectra of carbohydrates and amino sugars show resonances between 289.10 and 289.59 eV, attributed to 1s-3p/σ* transitions of O-alkyl (C-OH) moieties. Th ey also exhibited distinct peaks between 288.42 and 288.74 eV, representing C 1s–π*C = O transition from COOH functionalities. Amino acids produced a strong signal around 288.70 eV, which can be identifi ed as a C 1s–π*C=O transition of carboxyl/carbonyl (COOH/COO-) structures. Spectral features near 285.29 eV were ascribed to C 1s–π*C=C transition of ring structure of aromatic amino acids, while spectra between 287.14 and 287.86 eV were attributed to C 1s–π*C-H and C 1s–σ*C-H/3p Rydberg-like excitations from CH and CH2 groups. Phenols and benzoquinone produced strong resonances between 285.08 and 285.37 eV, attributed to the π* orbital of C (C 1s–π*C=C) atoms connected to either C or H (C–H) in the aromatic ring. Th e next higher excitation common to both phenols and quinone appeared between 286.05 and 286.35 eV, and could be associated with C 1s–π*C=C transitions of aromatic C bonded to O atom in phenols, and to C 1s–π*C=O transitions from aromatic C connected to O atom (C-OH) in phenols or to a C=O in p-benzoquinone and some phenols with carbonyl structures, respectively. Nucleobases exhibited complex spectral features with pronounced resonances between 286.02 and 286.84 eV and between 288.01 and 288.70 eV. Molecular markers for black C (benzenecarboxylic acid and biphenyl-4,4’-dicarboxylic acid) exhibit sharp absorption bands between 285.01 and at 285.43 eV, possibly from C 1s–π*C=C transition characteristic of C-H sites or unsaturated C (C=C) on aromatic ring structures. Th ese aromatic carboxylic acids also exhibit broad peaks between 288.35 and 288.48 eV, refl ecting C 1s–π*C=O transition of carboxyl functional groups bonded to unsaturated C. Th is investigation provides a more comprehensive NEXAFS spectral library of biogeochemically relevant organic C compounds. Th e spectra of these reference organic compounds reveal distinct spectral features and peak positions at the C K-edge that are characteristic of the molecular orbitals bonding C atoms. Detailed structural information can be derived from these distinctive spectral features that could be used to build robust peak assignment criteria to exploit the chemical sensitivity of NEXAFS spectroscopy for in situ molecular-level spatial investigation and fi ngerprinting of complex organic C compounds in environmental samples.
Abbreviations: EDX, energy dispersive x-ray; NEXAFS, near-edge x-ray absorption fi ne structure spectroscopy; NOM, natural organic matter; SEM, scanning electron microscopy; STXM, scanning transmission x-ray microscopy; TEM transmission electron microscope; XPS, x-ray photoelectron spectroscopy.
1818 SSSAJ: Volume 73: Number 6 • November–December 2009
studies on NOM composition and its implications for global biogeochemical C cycling extremely challenging.
Traditionally, several approaches using modern and fairly ef-fective wet-chemical and macroscopic analytical techniques were employed for structural characterization of NOM or its compo-nents. Th ese methods involve the use of (i) chemolytic (Zhang et al., 1999), (ii) pyrolysis (Chefetz et al., 2002), (iii) thermochemo-lysis (del Rio et al., 1998), and (iv) compound-specifi c stable and radiocarbon analysis (Eglinton et al., 1996) techniques. From these studies it becomes apparent that stabilization of NOM in terrestrial ecosystems is intimately associated with organic C structural chemistry (Kögel-Knabner, 2002). However, while important and meaningful information can be obtained from these approaches, they are not fully process-orientated and usu-ally fall short of providing explicit molecular-level information about the linkage between organic C functionalities and miner-alogy, as well as the micro- and nano-scale spatial features of or-gano-mineral assemblages to help bridge the gap between these multi-scale processes. It is, therefore, necessary to incorporate data from direct atomic-level probing techniques to develop realistic mechanistic models that are crucial for understanding the basic mechanisms of stabilization of organic C in terrestrial ecosystems (Zimmerman et al., 2004; Rasmussen et al., 2005).
An abundance of atomic-level probing techniques such as scanning electron microscopy (SEM), energy dispersive x-ray (EDX) analysis, x-ray photoelectron spectroscopy (XPS) and transmission electron microscope (TEM) are currently available to obtain information about the chemical composition, micro-heterogeneity, and physical allocation of organic and mineral ma-terials in soils and sediments (Kögel-Knabner, 2000; Scheinost et al., 2001). However, many of these techniques are invasive since experiments may need to be performed under adverse conditions (e.g., desiccation, high vacuum, heating, or particle bombard-ment). Th ere is also a potential that the sample may be damaged by the electron beam, particularly in the case of biological mate-rials and may yield data that may be misleading due to the result-ing experimental artifacts.
Scanning transmission x-ray microscopy (STXM), a pow-erful method created through recent advances in x-ray micro-focusing techniques and access to a high-fl ux source of soft er x-ray photons (spanning in the energy range of ~100 to 2000 eV, Sham et al., 1989; Hähner, 2006) generated by synchrotron light source, coupled with near-edge x-ray absorption fi ne structure (NEXAFS) spectroscopy provides an excellent opportunity not only to identify and fi ngerprint the fi ne structures of organic C in various molecular groups, but also help to visualize and map the nano-scale variations of C forms of biogeochemically rele-vant organic compounds ( Jacobsen et al., 2000; Akabayov et al., 2005; Lehmann et al., 2005, 2008; Kinyangi et al., 2006). Using a tunable monochromator, NEXAFS spectra can be collected just below and up to about 50 eV above the ionization threshold of C by increasing the photon energy through the absorption edge of this element (K-edge of C = 284.20 eV) (Stöhr, 1992). Th ese features make NEXAFS an element specifi c structural tool that provides information on the electronic structure and orientation of molecules or molecular fragments (Stöhr, 1992). Synchrotron–based STXM-NEXAFS spectromicroscopy could also access the K- or L-edges of other elements such as K, Ca, N, O, F, Fe, Al, Si etc., and may lead to accusation of spatially de-
fi ned novel high resolution (about 50 nm; Schulze and Bertsch, 1995; Akabayov et al., 2005) mechanistic information for an in situ geobiological investigations of structural and architectural arrangements of organomineral assemblages organic matter and minerals, polyvalent metal ions and other surfi cial and interac-tive features of complex organomineral interfaces at the sub-mi-croscopic level that may have practical relevance for stabilization of organic C and global biogeochemical cycling of elements.
Th e chemical sensitivity of C K-edge NEXAFS spectros-copy and the high spatial resolution of x-ray microscopy have been explored through extensive experimental and computa-tional studies involving polymers (Smith et al., 2001; Urquhart and Ade, 2002; Dhez et al., 2003). Although these techniques have been eff ectively employed to characterize organic C forms in interplanetary dust particles (Flynn et al., 2003), geomicrobial samples (Benzerara et al., 2004), marine particulate organic mat-ter (Brandes et al., 2004), humic fractions (Schäfer et al., 2003, 2005; Myneni et al., 1999; Solomon et al., 2005, 2007a, 2007b; Christl and Kretzschmar, 2007), black C (Lehmann et al., 2005; Haberstroh et al., 2006; Liang et al., 2006), soot (Braun et al., 2008), microaggregates (Kinyangi et al., 2006; Lehmann et al., 2007, 2008), and in coal and other geological materials (Cody et al., 1995), its application in environmental sciences in general is still in a stage of infancy (Braun et al., 2005). For example, un-like in polymer research where extensive NEXAFS studies of well characterized materials provide generally robust peak assign-ment criteria; knowledge of the sample’s origin, processing, and history were used for the most part to interpret the NEXAFS spectra in many of the environmental studies. Most environmen-tal investigations also deal with extremely complex carbonations matrices and in many cases the origin and history of a sample may be unknown or subject to conjecture. Th erefore, careful spectral characterization of representative compounds is a neces-sary fi rst step in the application of NEXAFS to complex systems of ecological importance (Zubavichus et al., 2005; Braun et al., 2007). However, with the exception of some C (1s) NEXAFS studies involving amino acids (Boese, 1996; Boese et al., 1997; Kaznacheyev et al., 2002; Zubavichus et al., 2005), aromatic ac-ids and phenols (Scheinost et al., 2001; Christl and Kretzschmar, 2007), no comprehensive NEXAFS spectral library of system-atically selected major organic molecules that constitute NOM have been published for C to date.
Th e objectives of the present study were: (i) to provide a comprehensive systematic overview of spectral signatures and peak positions of major organic molecules that potentially occur in soils and sediments as part of NOM to improve our under-standing of the molecular structure and chemistry of this com-plex organic material, and (ii) to integrate the conjugated surface and bulk sensitivity potentials of this complementary spectro-microscopic tool to the ensemble of micro-scale physical and chemical characterization techniques to address a broad range of environmental issues related to the impacts of climate change on C sequestration in terrestrial and aquatic ecosystems.
EXPERIMENTALCharacterization of the reference compounds using C (1s)
(NEXAFS) was performed at the X-1A1 beamline of the NSLS using the STXM endstation. Th e essential components of the STXM were a tun-able undulator inserted in the 2.8 GeV electron storage ring generating
SSSAJ: Volume 73: Number 6 • November –December 2009 1819
a high fl ux of photons at 107 spatially coherent photons s–1 in the soft x-ray region, a spherical grating monochromator with maximum spectra resolving power of 5000 lines mm–1 (i.e., ~0.05 eV at 250 eV), a 160-μm Fresnel zone plate with spatial resolution of 45 nm, and a proportional counter located behind the sample to detect the transmitted photons. Th e beamline slit width was set to 45 × 25 × 25 μm (Plaschke et al., 2004). Th e monochromator was calibrated at the beginning of the experiment following the standard calibration procedure at the X-1A1 beamline by collecting a background point spectrum (Io) from He over the appro-priate energy range (280 –310 eV) for this experiment, aft er fi lling the chamber with this gas; and later by introducing a calibration gas (CO2) and recording a calibration spectrum (I) from this calibration gas (C (1s) adsorption threshold resonance of CO2 is at 290.74 ± 0.10 eV). Th is pro-cedure was repeated before each run aft er each beam fi lling to ensure that there are no detectable drift between measurements. All chemicals used as reference compounds were obtained commercially from Sigma-Aldrich (Sigma-Aldrich Corp., St. Louis, Mo). Th in fi lms of reference compounds were prepared by dissolving 1 mg of the sample (1 mL in the case of liq-uid samples) in 400 μL of pure trifl uoroacetic acid (TFA, Sigma-Aldrich Corp. St. Louis, Mo) and by transferring 1 μL of solution onto 100-nm thick silicon nitride (Si3N4) sample windows (Silson Ltd, Northampton, UK) as described by Boese (1996) and Boese et al. (1997). Aft er a high resolution STXM micrograph was taken to locate an area of uniform sample thickness of about 200 nm, the illuminated spot was increased to 10 μm by defocusing the zoneplate to minimize radiation damage by dis-tributing the required signal over a large area (Boese et al., 1997). Spectra of the samples (I) were acquired under He atmosphere from three diff er-ent spots through the fi lms and SiN3 windows by moving the grating from 280 to 310 eV on a single spot with 0.1 eV energy step and 120 ms dwell time and averaged. Before each sample scan, background spectra (Io) were collected in triplicates from sample-free regions of the Si3N4 windows and used to correct any form of distortions from both the beamline and the windows. Raw spectral data is available online at the Knowledge Network for Biocomplexity webpage (http://knb.ecoinformatics.org/knb/meta-cat/datastar.50.3/knb; verifi ed 20 Aug. 2009)
Th e spectra were baseline corrected and normalized using WinXAS version 3.1 (WinXAS Soft ware, Hamburg, Germany) to avoid spectral dependence on the total C content; therefore, spectral properties are indicative of the changes in the molecular structure and chemistry of C. Deconvolution and curve fi tting of the diff erent C functional groups of the C (1s) NEXAFS spectra to identify the various peak positions was conducted using extended x-ray absorption fi ne structure (EXAFS) analysis soft ware Athena 0.8.052 (Ravel and Newville, 2005). Th e arctangent function was fi xed at 290 eV, with a full width at half maxi-mum (FWHM) set at 1.0 eV (Liang et al., 2008). Loosely constrained Gaussian functions between 0.2 and 0.5 eV were fi tted to resolve the main C 1s-π* and 1s-3p/σ* valence transitions (Rydberg/mixed valence transitions) and identify the peak positions of the various electronic transitions. Since the fi ne structure in the C NEXAFS region represent-ing multi-electron excitations, as well as ‘shape resonances’ (1s-σ* transi-tions) leading to the continuum part beyond 290 eV tends to be very broad and overlap (Cody et al., 1998; Schäfer et al., 2003; Plaschke et al., 2005), in the present investigation, only the main C 1s-π* and 1s-3p/σ* transitions in the discrete part of the spectra (284 and 290 eV) below the ionization potential were used for subsequent qualitative interpreta-tion of the C (1s) NEXAFS results.
RESULTS AND DISCUSSIONC (1s) NEXAFS Spectral Features of Carbohydrates and Amino SugarsCarbohydrates
Polysaccharides are polymers whose monomer units are simple aldose (aldehyde) and/or ketose (ketone) sugars (mono-saccharides). Th e number of monosaccharide units in polysac-charides could vary from about 35 to approximately 60,000 (BeMiller, 2001). Th e monosaccharide units are either in fi ve- (furanosyl) or six-membered (pyranosyl) ring forms, most oft en the latter, joined together in a head-to-tail fashion by glycosidic linkages. In addition to monosaccharide units, polysaccharides may contain ester, ether, and/or cyclic acetal moieties.
Polysaccharides are structural components of cell walls of bacteria, fungi, algae, and higher plants, and serve as energy- and C-storage substances, and various other functions as extracel-lular materials of plants, animals, and microbial origin in the environment. In the soil environment, carbohydrates represent a signifi cant portion of NOM (5 to 20% of total soil organic C), and are partly responsible for binding primary particles into stable aggregates (Cheshire, 1979; Tisdall and Oades, 1982). Polysaccharides have a range of general structures (from linear to various branched structures) and shapes. However, because their synthesis does not involve a template molecule, polysaccharides are polydisperse; that is, molecules of a specifi c polysaccharide from a single source are present in a range of molecular weights. In addition, the degree of polydispersity, the average molecular weight, and the range of molecular weights in a polysaccharide preparation vary from source to source. For example, plant cellu-lar polysaccharides are characterized by a high proportion of pen-toses (arabinose and xylose), whereas microbial polysaccharides are enriched in hexoses (galactose and mannose), deoxysugars (rhamnose and fucose) and other minor sugars (Cheshire, 1977). Most polysaccharides are also polymolecular; that is, their fi ne structures vary from molecule to molecule. With the exception of cellulose and a few other plant polysaccharides, only bacterial polysaccharides have repeating-unit structures. Structures of oth-er polysaccharides with regard to non-carbohydrate components can vary between taxa and with growth conditions of the plant or microorganism and even between tissues of the same plant. Th e variability created due to the proportions of monosaccharide constituents and linkage types, as well as growth conditions may create signifi cant chemical heterogeneity making identifi cation of specifi c polysaccharide groups in NOM extremely diffi cult.
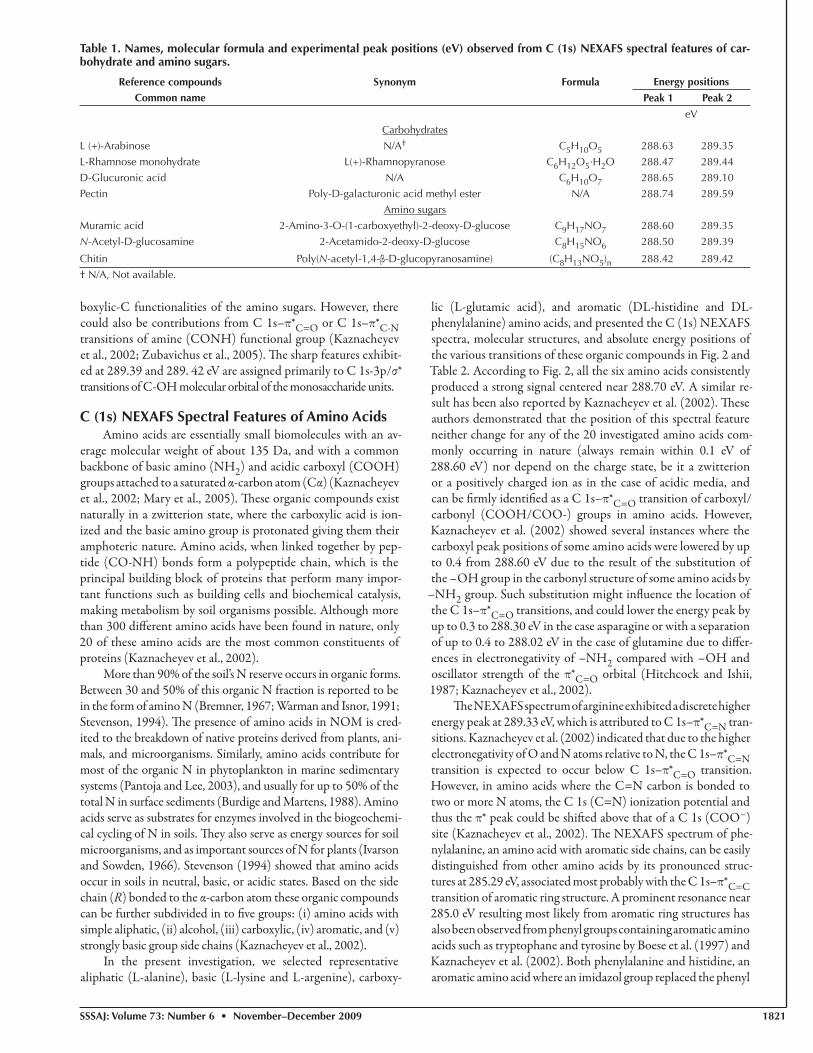
We applied C (1s) NEXAFS spectroscopy to characterize the various spectral features and identifi ed peak positions of stan-dard reference carbohydrates that are likely to be present in soils and sediments as part of NOM. Th e stacked C K-edge NEXAFS spectra of the various carbohydrates that include an aldopentose (arabinose), deoxyaldohexose (rhamnose)(Fig. 1) revealed mul-tiple peaks between 288.47 and 289.44 eV. According to Fig. 1, both arabinose and rhamnose show strong resonance at 289.35 and 289.44 eV (Table 1), respectively, mainly attribute to the 1s-3p/σ* transitions of O-alkyl (C-OH) moieties representing monosaccharides. Sharp absorption band near 289.5 eV from the 1s-3p/σ* transitions of alcohols and other hydroxylated- and ether-linked C species were also reported by Ishii and Hitchcock (1988), Sham et al. (1989), Hitchcock and Mancini (1994), Cody
1820 SSSAJ: Volume 73: Number 6 • November–December 2009
et al. (1998), Plaschke et al. (2004), di Stasio and Braun (2006) and Braun et al. (2008). A less intense but distinct second peak was observed at 288.47 eV from the 6-member pyranose ring of rhamnose most probably due to C 1s–π*C = O transitions of the aldehyde functionalities of this deoxyaldohexose sugar, while this resonance appeared as a weak shoulder at 288.63 eV in the case of the 5-member furanose ring of arabinose. Unlike these neu-tral sugars, however, the spectra from the two uronic acids that is, glucuronic and polygalacturonic acid (pectin) were largely domi-nated by strong absorption bands at 288.65 and 288.74 eV, re-spectively (Table 1), representing mostly C 1s–π*C=O transitions from the carboxylic-C (COOH) functional group (Darmon and Rudall, 1950; Cody et al., 1998; Braun et al., 2005).
Amino SugarsAmino sugars are derivatives of monosaccharides where one
or more of nonglycosidic hydroxyl group is replaced by an amino group (-NH2), which is mostly acetylated in biopolymers. Th ey are mainly present as glucosamine, galactosamine, and muramic acid; and may account for about 5 to 10% of the organic N pool
(Bremner, 1958; Stevenson, 1957). Amino sugars are widely distrib-uted as building blocks of abundant biopolymers in terrestrial and aquatic ecosystems, and represent an important compound class of NOM involved in the biogeochemical cycling of both C and N. For example, glucosamine is a constituent of fungal cell-wall known as chitin, which is also a structural polymer in algae, exoskeleton of arthropods and in many other soil and aquatic invertebrates. Th e proportion of total microbial glucosamine derived from fungal chitin was estimated to be between 90 and 95% in cultivated soils (Chantigny et al., 1997; Zhang et al., 1999). Glucosamine, in a one-to-one ratio with N-acetyl muramic acid and interlinked by peptides, can also form peptidoglycan, which is a major constituent of bacte-rial cell wall that provide structural and other functional roles as well as a major component of refractory dissolved organic matter in the aquatic ecosystems (Boon et al., 1998; Benner and Kaiser, 2003).
Th e experimental C (1s) NEXAFS spectra recorded from three amino sugars show that muramic acid, glucosamine, and chitin show strong resonances at 288.60, 288.50, and 288.42 eV, respectively (Fig. 1). Similar to carbohydrates, these resonances arise mainly from C 1s–π*C=O transitions characteristic of car-
Fig. 1. Carbon K-edge NEXAFS spectra and chemical structures of carbohydrate and amino sugars.
SSSAJ: Volume 73: Number 6 • November –December 2009 1821
boxylic-C functionalities of the amino sugars. However, there could also be contributions from C 1s–π*C=O or C 1s–π*C-N transitions of amine (CONH) functional group (Kaznacheyev et al., 2002; Zubavichus et al., 2005). Th e sharp features exhibit-ed at 289.39 and 289. 42 eV are assigned primarily to C 1s-3p/σ* transitions of C-OH molecular orbital of the monosaccharide units.
C (1s) NEXAFS Spectral Features of Amino AcidsAmino acids are essentially small biomolecules with an av-
erage molecular weight of about 135 Da, and with a common backbone of basic amino (NH2) and acidic carboxyl (COOH) groups attached to a saturated α-carbon atom (Cα) (Kaznacheyev et al., 2002; Mary et al., 2005). Th ese organic compounds exist naturally in a zwitterion state, where the carboxylic acid is ion-ized and the basic amino group is protonated giving them their amphoteric nature. Amino acids, when linked together by pep-tide (CO-NH) bonds form a polypeptide chain, which is the principal building block of proteins that perform many impor-tant functions such as building cells and biochemical catalysis, making metabolism by soil organisms possible. Although more than 300 diff erent amino acids have been found in nature, only 20 of these amino acids are the most common constituents of proteins (Kaznacheyev et al., 2002).
More than 90% of the soil’s N reserve occurs in organic forms. Between 30 and 50% of this organic N fraction is reported to be in the form of amino N (Bremner, 1967; Warman and Isnor, 1991; Stevenson, 1994). Th e presence of amino acids in NOM is cred-ited to the breakdown of native proteins derived from plants, ani-mals, and microorganisms. Similarly, amino acids contribute for most of the organic N in phytoplankton in marine sedimentary systems (Pantoja and Lee, 2003), and usually for up to 50% of the total N in surface sediments (Burdige and Martens, 1988). Amino acids serve as substrates for enzymes involved in the biogeochemi-cal cycling of N in soils. Th ey also serve as energy sources for soil microorganisms, and as important sources of N for plants (Ivarson and Sowden, 1966). Stevenson (1994) showed that amino acids occur in soils in neutral, basic, or acidic states. Based on the side chain (R) bonded to the α-carbon atom these organic compounds can be further subdivided in to fi ve groups: (i) amino acids with simple aliphatic, (ii) alcohol, (iii) carboxylic, (iv) aromatic, and (v) strongly basic group side chains (Kaznacheyev et al., 2002).
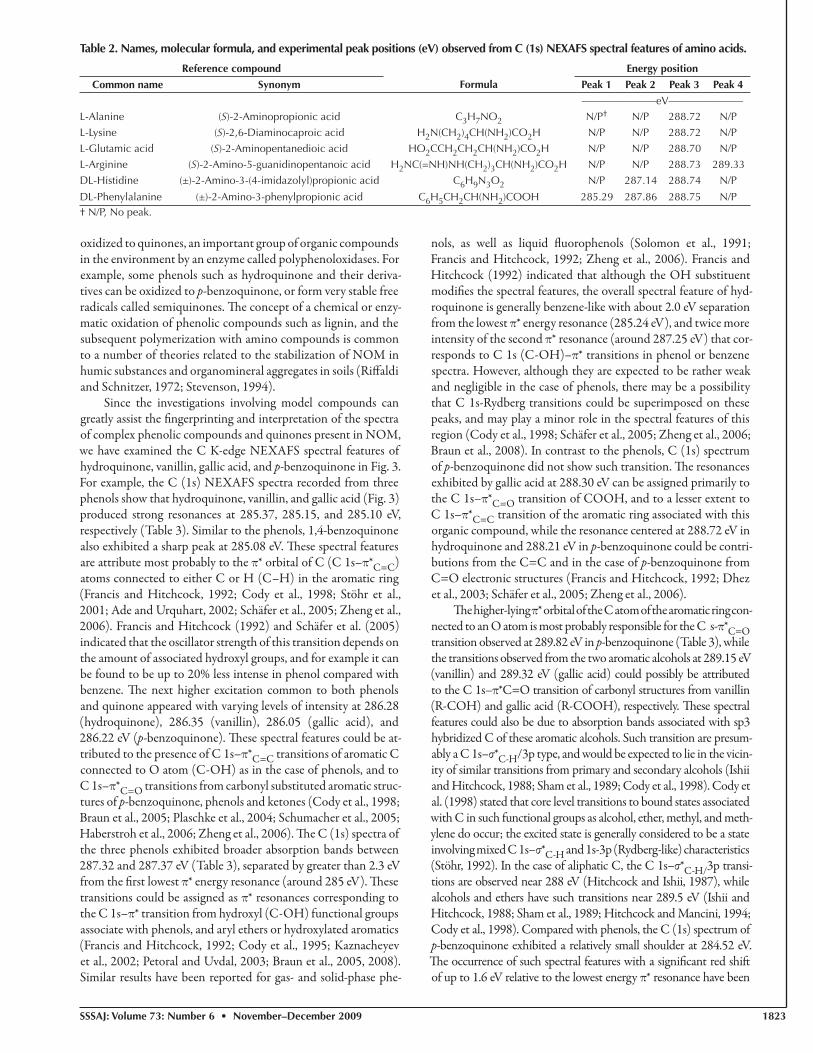
In the present investigation, we selected representative aliphatic (L-alanine), basic (L-lysine and L-argenine), carboxy-
lic (L-glutamic acid), and aromatic (DL-histidine and DL-phenylalanine) amino acids, and presented the C (1s) NEXAFS spectra, molecular structures, and absolute energy positions of the various transitions of these organic compounds in Fig. 2 and Table 2. According to Fig. 2, all the six amino acids consistently produced a strong signal centered near 288.70 eV. A similar re-sult has been also reported by Kaznacheyev et al. (2002). Th ese authors demonstrated that the position of this spectral feature neither change for any of the 20 investigated amino acids com-monly occurring in nature (always remain within 0.1 eV of 288.60 eV) nor depend on the charge state, be it a zwitterion or a positively charged ion as in the case of acidic media, and can be fi rmly identifi ed as a C 1s–π*C=O transition of carboxyl/carbonyl (COOH/COO-) groups in amino acids. However, Kaznacheyev et al. (2002) showed several instances where the carboxyl peak positions of some amino acids were lowered by up to 0.4 from 288.60 eV due to the result of the substitution of the –OH group in the carbonyl structure of some amino acids by
–NH2 group. Such substitution might infl uence the location of the C 1s–π*C=O transitions, and could lower the energy peak by up to 0.3 to 288.30 eV in the case asparagine or with a separation of up to 0.4 to 288.02 eV in the case of glutamine due to diff er-ences in electronegativity of –NH2 compared with –OH and oscillator strength of the π*C=O orbital (Hitchcock and Ishii, 1987; Kaznacheyev et al., 2002).
Th e NEXAFS spectrum of arginine exhibited a discrete higher energy peak at 289.33 eV, which is attributed to C 1s–π*C=N tran-sitions. Kaznacheyev et al. (2002) indicated that due to the higher electronegativity of O and N atoms relative to N, the C 1s–π*C=N transition is expected to occur below C 1s–π*C=O transition. However, in amino acids where the C=N carbon is bonded to two or more N atoms, the C 1s (C=N) ionization potential and thus the π* peak could be shift ed above that of a C 1s (COO–) site (Kaznacheyev et al., 2002). Th e NEXAFS spectrum of phe-nylalanine, an amino acid with aromatic side chains, can be easily distinguished from other amino acids by its pronounced struc-tures at 285.29 eV, associated most probably with the C 1s–π*C=C transition of aromatic ring structure. A prominent resonance near 285.0 eV resulting most likely from aromatic ring structures has also been observed from phenyl groups containing aromatic amino acids such as tryptophane and tyrosine by Boese et al. (1997) and Kaznacheyev et al. (2002). Both phenylalanine and histidine, an aromatic amino acid where an imidazol group replaced the phenyl
Table 1. Names, molecular formula and experimental peak positions (eV) observed from C (1s) NEXAFS spectral features of car-bohydrate and amino sugars.
Reference compounds Synonym Formula Energy positions
1822 SSSAJ: Volume 73: Number 6 • November–December 2009
ring, exhibited a strong peak at 287.86 and 287.14 eV, respective-ly. Th ese spectral features are attributed to the C 1s–π*C-H and C 1s–σ*C-H/3p Rydberg-like excitations possibly from CH and CH2 groups (Kaznacheyev et al., 2002). Similar peaks around 287.6 eV have been reported for saturated hydrocarbons, where they were assigned to mixed π* CH3, CH2/3p Rydberg transi-tions (Hitchcock and Ishii, 1987). However, Boese et al. (1997) suggested that the asymmetric peak near 287.0 eV in amino ac-ids could also arise from π* resonances of C=N bonds from the imidazol ring. Kaznacheyev et al. (2002) indicated that a broad peak around 287.1 eV is not in a single state, rather it could be the result of a number of unresolved C 1s–π* transitions of the C atoms, while the resonance at the higher energy side of the same peak could be a contribution from the σ*C-H states forming broad bands instead of individual peaks.
C (1s) NEXAFS Spectral Features of Phenols and Quinone
Phenols (C6H5OH), sometimes called aromatic alcohols, are aromatic chemical compounds in which the hydroxyl group (-OH) is directly attached to a six-membered aromatic hydrocar-bon ring. However, these hydroxybenzene compounds exhibit a much higher acidity compared with ordinary aliphatic alcohols. Phenolic compounds are secondary metabolites that are second only to carbohydrates in abundance among higher plants. Th ey display a great variety of structures ranging from derivatives of simple phenols such as hydroquinone to materials of complex and variable composition such as hydrolyzable tannins and phe-nylpropanoids that include lignins, fl avonoids, and condensed tannins (Haslam and Cai, 1994; Ferguson, 2001). Part of these plant phenolic fractions are bound to the cell wall as lignin or ferulic acid esterifi ed to hemicellulose, while the remaining frac-tion is present in water soluble-form in glycosidic combination and perform a variety of functions. Plant phenols can be further
Fig. 2. Carbon K-edge NEXAFS spectra and chemical structures of amino acids.
SSSAJ: Volume 73: Number 6 • November –December 2009 1823
oxidized to quinones, an important group of organic compounds in the environment by an enzyme called polyphenoloxidases. For example, some phenols such as hydroquinone and their deriva-tives can be oxidized to p-benzoquinone, or form very stable free radicals called semiquinones. Th e concept of a chemical or enzy-matic oxidation of phenolic compounds such as lignin, and the subsequent polymerization with amino compounds is common to a number of theories related to the stabilization of NOM in humic substances and organomineral aggregates in soils (Riff aldi and Schnitzer, 1972; Stevenson, 1994).
Since the investigations involving model compounds can greatly assist the fi ngerprinting and interpretation of the spectra of complex phenolic compounds and quinones present in NOM, we have examined the C K-edge NEXAFS spectral features of hydroquinone, vanillin, gallic acid, and p-benzoquinone in Fig. 3. For example, the C (1s) NEXAFS spectra recorded from three phenols show that hydroquinone, vanillin, and gallic acid (Fig. 3) produced strong resonances at 285.37, 285.15, and 285.10 eV, respectively (Table 3). Similar to the phenols, 1,4-benzoquinone also exhibited a sharp peak at 285.08 eV. Th ese spectral features are attribute most probably to the π* orbital of C (C 1s–π*C=C) atoms connected to either C or H (C–H) in the aromatic ring (Francis and Hitchcock, 1992; Cody et al., 1998; Stöhr et al., 2001; Ade and Urquhart, 2002; Schäfer et al., 2005; Zheng et al., 2006). Francis and Hitchcock (1992) and Schäfer et al. (2005) indicated that the oscillator strength of this transition depends on the amount of associated hydroxyl groups, and for example it can be found to be up to 20% less intense in phenol compared with benzene. Th e next higher excitation common to both phenols and quinone appeared with varying levels of intensity at 286.28 (hydroquinone), 286.35 (vanillin), 286.05 (gallic acid), and 286.22 eV (p-benzoquinone). Th ese spectral features could be at-tributed to the presence of C 1s–π*C=C transitions of aromatic C connected to O atom (C-OH) as in the case of phenols, and to C 1s–π*C=O transitions from carbonyl substituted aromatic struc-tures of p-benzoquinone, phenols and ketones (Cody et al., 1998; Braun et al., 2005; Plaschke et al., 2004; Schumacher et al., 2005; Haberstroh et al., 2006; Zheng et al., 2006). Th e C (1s) spectra of the three phenols exhibited broader absorption bands between 287.32 and 287.37 eV (Table 3), separated by greater than 2.3 eV from the fi rst lowest π* energy resonance (around 285 eV). Th ese transitions could be assigned as π* resonances corresponding to the C 1s–π* transition from hydroxyl (C-OH) functional groups associate with phenols, and aryl ethers or hydroxylated aromatics (Francis and Hitchcock, 1992; Cody et al., 1995; Kaznacheyev et al., 2002; Petoral and Uvdal, 2003; Braun et al., 2005, 2008). Similar results have been reported for gas- and solid-phase phe-
nols, as well as liquid fl uorophenols (Solomon et al., 1991; Francis and Hitchcock, 1992; Zheng et al., 2006). Francis and Hitchcock (1992) indicated that although the OH substituent modifi es the spectral features, the overall spectral feature of hyd-roquinone is generally benzene-like with about 2.0 eV separation from the lowest π* energy resonance (285.24 eV), and twice more intensity of the second π* resonance (around 287.25 eV) that cor-responds to C 1s (C-OH)–π* transitions in phenol or benzene spectra. However, although they are expected to be rather weak and negligible in the case of phenols, there may be a possibility that C 1s-Rydberg transitions could be superimposed on these peaks, and may play a minor role in the spectral features of this region (Cody et al., 1998; Schäfer et al., 2005; Zheng et al., 2006; Braun et al., 2008). In contrast to the phenols, C (1s) spectrum of p-benzoquinone did not show such transition. Th e resonances exhibited by gallic acid at 288.30 eV can be assigned primarily to the C 1s–π*C=O transition of COOH, and to a lesser extent to C 1s–π*C=C transition of the aromatic ring associated with this organic compound, while the resonance centered at 288.72 eV in hydroquinone and 288.21 eV in p-benzoquinone could be contri-butions from the C=C and in the case of p-benzoquinone from C=O electronic structures (Francis and Hitchcock, 1992; Dhez et al., 2003; Schäfer et al., 2005; Zheng et al., 2006).
Th e higher-lying π* orbital of the C atom of the aromatic ring con-nected to an O atom is most probably responsible for the C s-π*C=O transition observed at 289.82 eV in p-benzoquinone (Table 3), while the transitions observed from the two aromatic alcohols at 289.15 eV (vanillin) and 289.32 eV (gallic acid) could possibly be attributed to the C 1s–π*C=O transition of carbonyl structures from vanillin (R-COH) and gallic acid (R-COOH), respectively. Th ese spectral features could also be due to absorption bands associated with sp3 hybridized C of these aromatic alcohols. Such transition are presum-ably a C 1s–σ*C-H/3p type, and would be expected to lie in the vicin-ity of similar transitions from primary and secondary alcohols (Ishii and Hitchcock, 1988; Sham et al., 1989; Cody et al., 1998). Cody et al. (1998) stated that core level transitions to bound states associated with C in such functional groups as alcohol, ether, methyl, and meth-ylene do occur; the excited state is generally considered to be a state involving mixed C 1s–σ*C-H and 1s-3p (Rydberg-like) characteristics (Stöhr, 1992). In the case of aliphatic C, the C 1s–σ*C-H/3p transi-tions are observed near 288 eV (Hitchcock and Ishii, 1987), while alcohols and ethers have such transitions near 289.5 eV (Ishii and Hitchcock, 1988; Sham et al., 1989; Hitchcock and Mancini, 1994; Cody et al., 1998). Compared with phenols, the C (1s) spectrum of p-benzoquinone exhibited a relatively small shoulder at 284.52 eV. Th e occurrence of such spectral features with a signifi cant red shift of up to 1.6 eV relative to the lowest energy π* resonance have been
Table 2. Names, molecular formula, and experimental peak positions (eV) observed from C (1s) NEXAFS spectral features of amino acids.
Reference compound Energy position
Common name Synonym Formula Peak 1 Peak 2 Peak 3 Peak 4
1824 SSSAJ: Volume 73: Number 6 • November–December 2009
observed in both pure compounds (Hitchcock et al., 1987; Francis and Hitchcock, 1992) and complex environmental samples (Schäfer et al., 2005). Such resonances were largely associated with a lower π*LUMO (lowest unoccupied molecular orbital) energy, and seen as a clear indication of a loss of aromatic stabilization due to quinoid distortion (Francis and Hitchcock, 1992).
C (1s) NEXAFS Spectral Features of NucleobasesNucleobases are central building blocks of both deoxyribonu-
cleic acid (DNA) and ribonucleic acid (RNA), which are essential to all life. Although all nucleobases are heterocyclic compounds, cyto-sine, uracil, and thymine can be viewed as analogs of benzene with endocyclic heteroatoms and exocyclic substitutions, while adenine
and guanine are of a more complex molecular nature, and could be seen as benzene fused with a fi ve-membered ring pyrrole (Sun and Nicklaus, 2007). Th e presence of nucleic acids in mineral soils was fi rst reported by Anderson (1957, 1958) from Scottish soils. Cortez and Schnitzer (1979) indicated that humic acids were richer in gua-nine and adenine but poorer in cytosine, thymine, and uracil. Th ese authors also suggested that the absence of methylcytosine in the hu-mic acids is an indication that the extracted nucleic acid bases were of microbial DNA origin. Schulten and Schnitzer (1998) reported that an average of 3.1% of the total N in agricultural soils was found to occur in nucleic acid bases, and because nucleic acids contain N, they could be important sources of this nutrient in soils.
Fig. 3. Carbon K-edge NEXAFS spectra and chemical structures of phenols and quinine.
SSSAJ: Volume 73: Number 6 • November –December 2009 1825
We selected two structurally contrasting nucleobases (ad-enine and thymine), and presented their chemical structure and experimental C K-edge NEXAFS spectra, as well as the respec-tive peak positions for the diff erent orbitals in Fig. 4 and Table 4, respectively. Th e NEXAFS spectra of thymine show pronounced sharp resonance at 286.02 eV and another weakly developed peak at 286.84 eV that could be associated with the π* orbital of the C 1s–π*C=O transitions of the ring structure connected to an O atom (Samuel et al., 2006). Th ese absorption bands could also be due to the presence of C 1s–π*C=C and C 1s–π*C-N transi-tions originating from the C=C-N structures of this nucleobase (Kaznacheyev et al., 2002; Samuel et al., 2006). According to Fig. 4, the C (1s) spectra show also pronounced structures near 288.00 eV common to both nucleobases (Table 4). Th e thymine peak at 288.01 eV can be assigned to C 1s–π*C=O transitions from π* orbital of O=C-NH group. Urquhart and Ade (2002) and Samuel et al. (2006) indicated that the π*C=O peak nor-mally appears at 286.60 eV. However, it could shift signifi cantly up to 288.10 eV, if a N atom is attached to the carbonyl struc-ture (O=C-NH), most likely due to the inductive eff ect of this neighboring atom. Th e π*C=O peak could shift even further to 289.4 eV (289.47 eV according to this study, Table 4), if two N atoms are present in the carbonyl structure (π* HNCONH) as is the case for example in thymine and uracil (Samuel et al., 2006). Th e narrow signal observed at 285.13 eV in the thymine spec-trum (Fig. 4) could be assigned to the characteristic ring signal of π*C=C species similar to the features found commonly in C (1s) NEXAFS spectra of aromatic polymers and amino acids (Stöhr, 1992; Kaznacheyev et al., 2002; Samuel et al., 2006).
Adenine, with its double ring structures that contain C, N, and H atoms but a clear absence of the carbonyl group (Fig. 4), show a very intense peak at 286.75 eV with a prominent shoulder attached to it at 287.17 eV. Th ese resonances most likely correspond to C 1s–π*C=C transition from the ring structures (C=C-N), and to C 1s–π*C-N transition the C-Nx species of adenine (Samuel et al., 2006). Samuel et al. (2006) demonstrated that the C-N peak does not change its location even with the change in the location of the amine group on the six-membered-ring, and an addition of a carbo-nyl structure in the guanosine spectrum. Adenine also exhibited a sharp but less intense resonance at 287.92 eV and an intense broad
peak at 288.70 eV that is most likely due to contributions from π* orbital of C=C-NH (C 1s–π*C = N) and C-NHx (C 1s–π*C-N) structures of this nucleobase. Similar results have also been report-ed for adenine, cytosine, and guanosine by Samuel et al. (2006), and for C 1s-π* transition of C=N carbon bonded to two or more N atoms in amino acids by Kaznacheyev et al. (2002).
C (1s) NEXAFS Spectral Features of Molecular Markers for Black C
Black C is one of the most ubiquitous materials in the envi-ronment, comprising a spectrum of C-rich heterogeneous materi-als ranging in complexity from highly polyaromatic to elemental or graphitic C produced by the incomplete combustion of fossil-fuels and biomass (Goldberg, 1985; Kuhlbusch, 1998; Schmidt and Noack, 2000; Masiello, 2004; Lehmann et al., 2005; Solomon et al., 2007b). Black C is regarded as a chemically and biologically very stable C pool, and can persist in nature for long periods of time (Goldberg, 1985; Schmidt and Noack, 2000). A recent study of the world soils archive by Krull et al. (2009) indicated that a sig-nifi cant (in many cases more than 50%) but highly variable pro-portion of the total NOM pool in soils could be constituted of black C, making it a signifi cant sink for atmospheric CO2 in the global C cycle (Seiler and Crutzen, 1980). In fact, charring biomass into black C has been proposed as a way to divert C from a rapid biological C cycle into a slow geological C cycle (Kuhlbusch and Crutzen, 1995), and prompts investigations into actively managing black C as a means to sequester atmospheric C in soils (Lehmann et al., 2006). Th e long-term persistence of black C, however, does not mean that the properties of black C remain unchanged aft er its deposition. Cheng et al. (2006) have reported rapid oxidation of black C in short-term incubations, whereby its properties were altered through the formation of O-containing functional groups.
Hayatsu et al. (1982) and Shafi zadeh and Sekiguchi (1983) stated that during oxidative degradation of black C rich materials such as char, coal etc., polycyclic or substituted aromatic centers are converted to benzenepolycarboxylic acids. Schnitzer and Khan (1972) and Schnitzer (1978) identifi ed varying amounts of aromatic carboxylic acids among the oxidation products of humic substanc-es, and concluded that these compounds originated from benzene rings repeatedly substituted by C and not from the ones substituted
Table 3. Names, molecular formula and experimental peak positions (eV) observed from C (1s) NEXAFS spectral features of phe-nols and quinone.
Reference compound Energy position
Common name Synonym Formula Peak 1 Peak 2 Peak 3 Peak 4 Peak 5 Peak 6
1826 SSSAJ: Volume 73: Number 6 • November–December 2009
by O (Glaser et al., 1998). High yields of benzenecarboxylic acids were also obtained from highly aromatic humic acids (Schnitzer and Calderoni, 1985), a type of humic materials supposed to be derived from black C (Haumaier and Zech, 1995; Skjemstad et al., 1996). Th us, these structural features are considered as typical to black C, and they have been extensively used as molecular mark-ers in investigations involving black C in soils (Glaser et al., 1998; Glaser and Amelung, 2003; Brodowski et al., 2005).
In the present investigation, we selected the simplest forms of these aromatic carboxylic acids that is, benzenecarboxylic acid and a biphenyl-4,4’-dicarboxylic acid, and presented their chemi-cal structure, experimental C K-edge NEXAFS spectra and re-spective peak positions for the diff erent orbitals in Fig. 5 and Table 5. We have also presented C (1s) NEXAFS spectra from citric acid, a purely tricarboxylic acid structure and an internal standard oft en used in black C analysis, as well as 1,2 benzanthra-cene, a polycyclic aromatic hydrocarbon containing four closed aromatic ring structures, to provide an eff ective comparison with the two benzenecarboxylic structure. Both benzoic acid and bi-phenyl-4,4’-dicarboxylic acid exhibit a sharp absorption band at 285.01 and at 285.43 eV possibly from C 1s–π*C=C transition characteristic of C-H sites or unsaturated C bonds (C=C) on ar-omatic ring structures (Cody et al., 1996; Cooney and Urquhart, 2004; Solomon et al., 2007b). Similar results have been reported for graphite (Braun et al., 2005; Haberstroh et al., 2006), charred carbonaceous residues (Lehmann et al., 2005) and for vitrinite (Cody et al., 1998), a macromolecular material derived from the
biomacromolecular plant constituents which have undergone substantial chemical and structural modifi cation through perva-sive diagenetic alteration; including losses in O containing func-tionalities (carboxylic acids, ketones, and hydroxylated aromatics) and an increase in polycyclic aromatic hydrocarbons.
Th e C (1s) spectra of both benzenecarboxylic acids also exhibit a broad but well-defi ned absorption peak at 288.35 eV (benzoic acid) and at 288.48 eV (biphenyl-4,4’-dicarboxylic acid) refl ecting the C 1s–π*C=O transition of carboxyl func-tional groups bonded to unsaturated C (Cody et al., 1998; Kuznetsova et al., 2001; Urquhart and Ade, 2002; Braun et al., 2005). In contrast, the C 1s–π* transition of carbonyl C (C=O) from the tricarboxylic acid spectrum produced an intense reso-nance at slightly higher energy of 288.72 eV. Haberstroh et al. (2006) stated that in general, the lowest energy absorption bands, from around 284 to 285 eV, are for functional groups with unusually low energy π* states such as quinones. An aro-matic or unsaturated C atom bonded to another C atom has a strong 1s–π* transition at about 285.0 eV. However, as more electron-drawing atoms such as O are added or substituted, the binding energy of C (1s) electron increases. Th is increase in binding energy shift s the 1s–π* transitions of aromatic C to higher energies for example up to about 286.9 eV in the case of one O atom in phenols or up to 288.50 eV for the two O atoms bonded to saturated C in carboxylic functional groups.
Th e fused aromatic ring structures of benzantharacene ex-hibited a prominent resonance at 284.30 eV and a weak peak at
Fig. 4. Carbon K-edge NEXAFS spectra and chemical structures of nucleobases.
SSSAJ: Volume 73: Number 6 • November –December 2009 1827
286.13 eV. Similar results have been reported by Kolczewski et al. (2006) for the six-ring-containing molecules where the experi-mental C (1s) NEXAFS spectrum of 1,3-cyclohexadiene exhib-ited a broad symmetric peak that appeared by 0.6 eV lower than the benzene peak at 284.6 eV, as well as some weaker peaks above 286.6 eV. Based on the results of both experimental and theoreti-cal analysis these authors assigned the resonance at 284.4 eV to C 1s-π* excitations originating from the C atoms with a double
bond from benzene or diene structures, while the 286.6 eV was assigned to the σ* C-C oribitals (Dhez et al., 2003; Schäfer et al., 2005; Kolczewski et al., 2006). Similar eff ects in the low energy feature of the C 1s-π*C=C transitions can also occur by extensive conjugation, and hence delocalization of orbitals, resulting in an energy splitting as for example observed in polyethylene naph-thalate shown by Dhez et al. (2003).
Table 5. Names, molecular formula and experimental peak positions (eV) observed from C (1s) NEXAFS spectral features of molecular markers for black C.
Reference compounds Energy position
Common name Synonym Formula Peak 1 Peak 2 Peak 3 Peak 4 Peak 5
Fig. 5. Carbon K-edge NEXAFS spectra and chemical structures of molecular
1828 SSSAJ: Volume 73: Number 6 • November–December 2009
SUMMARY AND FUTURE CONSIDERATIONSTh e present investigation is the fi rst attempt to provide a
more comprehensive C K-edge NEXAFS spectral library of bio-geochemically relevant organic C compounds (carbohydrates, amino sugars, amino acids, phenols, quinine as well as benzenep-olycarboxylic acid and other molecular markers for black C) that commonly occur in soils and sediments as part of NOM. Our study indicate that the spectra of these model organic compounds reveal distinct spectral features and peak positions at the C K-edge that are characteristics of the molecular orbitals bonding C atoms. Th erefore, detailed structural chemical information can be derived from these distinctive spectral features that may well be used to build robust peak assignment criteria to exploit the chemical sensi-tivity of NEXAFS spectroscopy for fi ngerprinting complex organ-ic C compounds of ecological importance by environmental scien-tists. Th is is especially important in light of the results of our recent investigation of the microscopic- and sub-microscopic scale distri-bution of NOM in organomineral assemblages using STXM and NEXAFS spectromicroscopy (Kinyangi et al., 2006; Lehmann et al., 2007, 2008), which demonstrated that organic matter in soils may to a signifi cant extent consist of well identifi able and distinct molecular forms (e.g., microbial and plant biopolymers, charred carbonations residues etc.) not only as a complex mixture but also in very intricate but spatially distinct arrangements that as a sum correspond to total NOM but individually are very diff erent from the molecular characteristics of total NOM.
Unlike studies of polymers and other man-made organic mate-rials, however, the structural complexity of the total organic matter and the resulting broad spectral features at various energy positions (Lehmann et al., 2008; Schäfer et al., 2003, 2005; Solomon et al., 2005, 2007a, 2007b) makes it impossible to use spectral modeling approaches based on the limited compound classes investigated in this study to determine absolute molecular structure of the bulk NOM in soils and sediments. Th erefore, it is possible to suggest that due to the extremely complex carbonaceous matrices and het-erogeneous nature of NOM, and given the overlapping nature and very subtle variations even among the spectral features of organic C compounds belonging to the same group that share very similar molecular structures, it is unlikely that NEXAFS spectroscopy can be used exclusively as an independent bulk NOM characterization technique in its current state. Th is study provides the basis for the rigorous assignment of the NEXAFS spectra of the molecular com-ponents of bulk NOM, and will help further develop the potentials of NEXAFS spectroscopy for both qualitative and quantitative determination of the structural composition of NOM in environ-mental samples. However, there is a clear need for a concerted sys-tematic eff ort to expand the compound classes analyzed to include an even wider range of organic molecules constituting NOM, tak-ing in to account environmental variables such as origin (both natu-ral and anthropogenic sources), level of decomposition, history and ecosystems under which it developed to obtain a more systematic and complete overview of the NEXAFS spectral signatures and peak positions of organic molecules constituting NOM to improve our understanding of the molecular structure and chemistry of this complex organic material. Incorporating the information generated by the present study will improve the conjugated surface and bulk sensitivity potentials of NEXAFS spectromicroscopic techniques; and integrating these analytical tools with the ensemble of already well-established molecular-level physical and chemical character-
ization techniques that undoubtedly will provide environmental scientists with a valuable tool to obtain explicit element-specifi c in-formation about local structural and compositional environments of neighboring atoms and superfi cial interactions, micro- and nano-scale spatial heterogeneity and other molecular-level features to tackle a broad range of environmental issues ranging from the impacts of climate change on biogeochemical cycling of C to micro- and nanoscale level spatial features of organomineral assemblages to help bridge the gap between multi-scale processes in terrestrial and aquatic ecosystems.
ACKNOWLEDGMENTSTh is study was fi nancially supported by grants from the NSF- Division of Environmental Biology (DEB-0425995), the Coupled Natural and Human Systems Program of the Biocomplexity Initiative of the NSF (BCS-0215890), and USDA-CSREES (2002-35107-122269). Any opinions, fi ndings, and conclusions or recommendations expressed in this material are those of the authors and do not necessarily refl ect the views of USDA or the National Science Foundation. Th e C (1s) NEXAFS data under the project No. 4988 was collected using the X-1A1 STXM developed by the group of J. Kirz and C. Jacobsen at SUNY Stony Brook with support from the Offi ce of Biological and Environmental Research, U.S. Department of Energy under contract DE-FG02-89ER60858, and the NSF under grant DBI-9605045. Th e zone plates were developed by S. Spector and C. Jacobsen of Stony Brook and D. Tennant of Lucent Technologies Bell Labs, with support from the NSF under grant ECS-9510499.
REFERENCESAde, H., and S.G. Urquhart. 2002. NEXAFS spectroscopy and microscopy of natural
and synthetic polymers. p. 285–355. In T.K. Sham (ed.) Chemical applications of synchrotron radiation. World Scientifi c Publishing, River Edge, NJ.
Akabayov, B., C.J. Doonan, I.J. Pickering, G.N. George, and I. Sagi. 2005. Using soft er x-ray absorption spectroscopy to probe biological systems. J. Synchrotron Radiat. 12:392–401.
Anderson, G. 1957. Nucleic acid derivatives in soil. Nature 180:287–288.Anderson, G. 1958. Identifi cation of derivatives of deoxyribonucleic acid in
humic acid. Soil Sci. 86:169–174.BeMiller. J.N. 2001. Polysaccharides. p. 1–7. In Encyclopedia of life sciences. John
Wiley & Sons Inc., Chichester.Benner, R., and K. Kaiser. 2003. Abundance of amino sugars and peptidoglycan
in marine particulate and dissolved organic matter. Limnol. Oceanogr. 48:118–128.
Benzerara, K., T.H. Yoon, T. Tyliszczak, B. Constantz, A.M. Spormann, and G. Brown. 2004. Scanning transmission x-ray microscopy study of microbial calcifi cation. Geobiology 2:249–259.
Boese, J.M. 1996. X-ray absorption near edge structure of amino acids and peptides. M.A. thesis. Dep. of Physics, State University of New York. Stony Brook, NY.
Boese, J., A. Osanna, C. Jacobsen, and J. Kirz. 1997. Carbon edge XANES spectroscopy of amino acids and peptides. J. Electr. Spectr. Rel. Phen. 85:9–15.
Boon, J.J., V.A. Klap, and T.I. Eglinton. 1998. Molecular characterization of microgram amounts of oceanic colloidal organic matter by direct temperature-resolved ammonia chemical ionization mass spectrometry. Org. Geochem. 29:1051–1061.
Brandes, J.A., C. Lee, S. Wakeham, M. Peterson, C. Jacobsen, S. Wirick, and G.D. Cody. 2004. Examining marine particulate organic matter at sub-micron scales using scanning transmission x-ray microscopy and carbon x-ray absorption near edge structure spectroscopy. Mar. Chem. 92:107–121.
Braun, A., F.E. Huggins, N. Shah, Y. Chen, S. Wirick, S.B. Mun, C. Jacobsen, and G.P. Huff man. 2005. Advantages of soft x-ray absorption over TEM-EELS for solid carbon studies—A comparative study on diesel soot with EELS and NEXAFS. Carbon 43:117–124.
Braun, A., B.S. Mun, F.E. Huggins, and G.P. Huff man. 2007. Carbon speciation of diesel exhaust and urban particulate matter NIST standard reference materials with C(1s) NEXAFS spectroscopy. Environ. Sci. Technol. 41:173–178.
SSSAJ: Volume 73: Number 6 • November –December 2009 1829
Braun, A., F.E. Huggins, A. Kubátová, S. Wirick, M.M. Maricq, B.S. Mun, J.D. McDonald, K.E. Kelly, N. Shah, and G.P. Huff man. 2008. Toward distinguishing woodsmoke and diesel exhaust in ambient particulate matter. Environ. Sci. Technol. 42:374–380.
Bremner, J.M. 1958. Amino sugars in soils. J. Sci. Food Agric. 9:528–532.Bremner, J.M. 1967. Th e nitrogenous constituents of soil organic matter and
their role in soil fertility. Pontif. Acad. Sci. Scr. Varia. 32:143–193.Burdige, D.J., and C.S. Martens. 1988. Biogeochemical cycling in an organic-rich
coastal marine basin: 10. Th e role of amino acids in sedimentary carbon and nitrogen cycling. Geochim. Cosmochim. Acta 52:1571–1584.
Brodowski, S., A. Rodionov, L. Haumaier, B. Glaser, and W. Amelung. 2005. Revised black carbon assessment using benzene polycarboxylic acids. Org. Geochem. 36:1299–1310.
Chantigny, M.H., D.A. Angers, D. Prevost, L.P. Vezina, and F.P. Chalifour. 1997. Soil aggregation and fungal and bacterial biomass under annual and perennial cropping systems. Soil Sci. Soc. Am. J. 61:262–267.
Chefetz, B., M.J. Salloum, A.P. Deshmukh, and P.G. Hatcher. 2002. Structural components of humic acids as determined by chemical modifi cations and carbon-13 NMR, pyrolysis-, and thermochemolysis-gas chromatography/mass spectrometry. Soil Sci. Soc. Am. J. 66:1159–1171.
Cheng, C.H., J. Lehmann, J.E. Th ies, S.D. Burton, and M.H. Engelhard. 2006. Oxidation of black carbon by biotic and abiotic processes. Org. Geochem. 37:1477–1488.
Cheshire, M.V. 1977. Origin and stability of soil polysaccharide. J. Soil Sci. 28:1–10.
Cheshire, M.V. 1979. Nature and origin of carbohydrates in soils. Academic Press, London.
Christl, I., and R. Kretzschmar. 2007. C-1s NEXAFS spectroscopy reveals chemical fractionation of humic acid by cation-induced coagulation. Environ. Sci. Technol. 41:1915–1920.
Cody, G.D., R.E. Botto, H. Ade, S. Behal, M. Disko, and S. Wirick. 1995. C-NEXAFS microanalysis and scanning x-ray microscopy of microheterogeneities in a high-volatile A bituminous coal. Energy Fuels 9:75–84.
Cody, G.D., R.E. Botto, H. Ade, and S. Wirick. 1996. Th e application of soft x-ray microscopy to the in situ analysis of sporinite in coal. Int. J. Coal Geol. 32:69–86.
Cody, G.D., H. Ade, S. Wirick, G.D. Mitchell, and A. Davis. 1998. Determination of chemical-structural changes in vitrinite accompanying luminescence alteration using C-NEXAFS analysis. Org. Geochem. 28:441–455.
Cooney, R.R., and S.G. Urquhart. 2004. Chemical trends in the near-edge x-ray absorption fi ne structure of monosubstituted and para-bisubstituted benzenes. J. Phys. Chem. B 108:18185–18191.
Cortez, J., and M. Schnitzer. 1979. Purines and pyrimidines in soils and humic substances. Soil Sci. Soc. Am. J. 43:958–961.
Darmon, S.E., and K.M. Rudall. 1950. Infra-red and x-ray studies of chitin. Discuss. Faraday Soc. 9:251–260.
del Rio, J.C., D.E. McKinney, H. Knicker, M.A. Nanny, R.D. Minard, and P.G. Hatcher. 1998. Structural characterization of bio- and geo-macromolecules by off -line thermochemolysis with tetramethylammonium hydroxide. J. Chrom. 823:433–448.
Dhez, O., H. Ade, and S.G. Urquhart. 2003.Calibrated NEXAFS sprectra of some common polymers. J. Electron Sprectosc. Relat. Phenomenon. 128:85–98.
di Stasio, S., and A. Braun. 2006. Comparative NEXAFS study on soot obtained from an ethylene/air fl ame, a diesel engine, and graphite. Energy Fuels 20:187–194.
Eglinton, T.I., L.I. Aluwihari, J.E. Bauer, E.R.M. Druff el, and A.P. McNichol. 1996. Gas chromatographic isolation of individual compounds from complex matrices for radiocarbon dating. Anal. Chem. 68:904–912.
Ferguson, L.R. 2001. Role of plant polyphenols in genomic stability. Mut. Res. Fund. Mol. Mech. Mutagen. 475:89–111.
Flynn, G.J., L.P. Keller, C. Jacobsen, and S. Wirick. 2003. Th e origin of organic matter in the solar system: Evidence from the interplanetary dust particles. Geochim. Cosmochim. Acta 67:4791–4806.
Francis, J.T., and A.P. Hitchcock. 1992. Inner-shell spectroscopy of para-benzoquinone, hydroquinone, and phenol: Distinguishing quinoid and benzenoid structures. J. Phys. Chem. 96:6598–6610.
Glaser, B., L. Haumaier, G. Guggenberger, and W. Zech. 1998. Black carbon in soils: Th e use of benzenecarboxylic acids as specifi c markers. Org. Geochem. 29:811–819.
Glaser, B., and W. Amelung. 2003. Pyrogenic carbon in native grassland soils along a climosequence in North America. Global Biogeochem. Cycles
17:1064 10.1029/2002GB002019.Goldberg, E.D. 1985. Black carbon in the environment. John Wiley & Sons,
New York.Haberstroh, P.R., J.A. Brandes, Y. Gelinas, A.F. Dickens, S. Wirick, and G.
Cody. 2006. Chemical composition of the graphitic black carbon fraction in riverine and marine sediments at submicron scales using carbon x-ray spectromicroscopy. Geochim. Cosmochim. Acta 70:1483–1494.
Hähner, G. 2006. Near edge x-ray absorption fi ne structure spectroscopy as a tool to probe electronic and structural properties of thin organic fi lms and liquids. Chem. Soc. Rev. 35:1244–1255.
Haslam, E., and Y. Cai. 1994. Plant polyphenols (vegetable tannins): Gallic acid metabolism. Nat. Prod. Rep. 11:41–66.
Haumaier, L., and W. Zech. 1995. Black carbon- possible source of highly aromatic components of soil humic acids. Org. Geochem. 23:191–196.
Hayatsu, R., R.G. Scott, and R.E. Winans. 1982. Oxidation of coal. p. 279–354. In. W.S. Trahanovsky (ed.) Oxidation in organic chemistry. Pt. D. Academic Press, New York.
Hitchcock, A.P., and I. Ishii. 1987. Carbon K-shell excitation-spectra of linear and branched alkanes. J. Electron Spectrosc. Relat. Phenom. 42:11–26.
Hitchcock, A.P., P. Fischer, A. Gedanken, and M.B. Robin. 1987. Antibonding σ* valence MOs in the inner shell and outer shell spectra of the fl uorobenzenes. J. Phys. Chem. 91:531–540.
Hitchcock, A.P., and D.C. Mancini. 1994. Bibliography of atomic and molecular inner-shell excitation studies. J. Elec. Spec. Rel. Pheno. 67:1–132.
Ishii, I., and A.P. Hitchcock. 1988. Th e oscillator strengths for C1s and O1s excitation of some saturated and unsaturated organic alcohols, acids, and esters. J. Elec. Spec. Rel. Pheno. 46:55–84.
Ivarson, K.C., and F.J. Sowden. 1966. Eff ect of freezing on the free amino acids in soil. Can. J. Soil Sci. 46:115–120.
Jacobsen, C., S. Wirick, G. Flynn, and C. Zimba. 2000. Soft x-ray spectroscopy from image sequences with sub-100 nm spatial resolution. J. Microsc. 197:173–184.
Kaznacheyev, K., A. Osanna, C. Jacobsen, O. Plashkevych, O. Vahtras, H. Ågren, V. Carravetta, and A.P. Hitchcock. 2002. Inner-shell absorption spectroscopy of amino acids. J. Chem. Phys. 106:3153–3168.
Kinyangi, J., D. Solomon, B. Liang, M. Lerotic, S. Wirick, and J. Lehmann. 2006. Nanoscale biogeocomplexity of the organo-mineral assemblage in soil: Application of STXM microscopy and C 1s-NEXAFS spectroscopy. Soil Sci. Soc. Am. J. 70:1708–1718.
Kögel-Knabner, I. 2000. Analytical approaches for characterizing soil organic matter. Org. Geochem. 31:609–625.
Kögel-Knabner, I. 2002. Th e macromolecular organic composition in plant and microbial residues as input to soil. Soil Biol. Biochem. 34:139–162.
Kolczewski, C., R. Püttner, M. Martins, and A.S. Schlachter. 2006. Spectroscopic analysis of small organic molecules: A comprehensive near-edge x-ray-absorption fi ne-structure study of C6-ring-containing molecules. J. Chem. Phys. 124:034302 10.1063/1.2139674.
Krull, E., J. Lehmann, J. Skjemstad, L. Spouncer, and J. Baldock. 2009. Th e global extent of black C in soils: Is it everywhere? In F. Columbus (ed.) Grasslands: Ecology, management and restoration. Nova Science Publishers Inc. Hauppauge, NY. (In Press).
Kuhlbusch, T.A.J., and P.J. Crutzen. 1995. Toward a global estimate of black carbon in residues of vegetation fi res representing a sink of atmospheric CO2 and a source of O2. Global Biogeochem. Cycles 9:491–501.
Kuhlbusch, T.A.J. 1998. Black carbon in soil, sediments, and ice cores. P. 813–823. In R.A. Meyers (ed.) Th e Encyclopaedia of environmental analysis and remediation. John Wiley & Sons, New York.
Kuznetsova, A., I. Popova, J.T. Yates, M.J. Bronikowski, C.B. Huff man, J. Liu, R.E. Smalley, H.H. Hwu, and J.G.G. Chen. 2001. Oxygen-containing functional groups on single-wall carbon nanotubes: NEXAFS and vibrational spectroscopic studies. J. Am. Chem. Soc. 123:10699–10704.
Ladd, J.N., R.C. Foster, and J.O. Skjemstad. 1993. Soil structure: Carbon and nitrogen metabolism. Geoderma 56:401–434.
Lehmann, J., B. Liang, D. Solomon, M. Lerotic, F. Luizão, F. Kinyangi, T. Schäfer, S. Wirick, and C. Jacobsen. 2005. Near-edge X-ray absorption fi ne structure (NEXAFS) spectroscopy for mapping nano-scale distribution of organic carbon forms in soil: Application to black carbon particles. Global Biogeochem. Cycles 19:1013–1025.
Lehmann, J., J. Gaunt, and M. Rondon. 2006. Bio-char sequestration in terrestrial ecosystems—A review. Mit. Adapt. Strat. Global Change 11:403–427.
Lehmann, J., J. Kinyangi, and D. Solomon. 2007. Organic matter stabilization
1830 SSSAJ: Volume 73: Number 6 • November–December 2009
in soil microaggregates: Implications from spatial heterogeneity of organic carbon contents and carbon forms. Biogeochemistry 85:45–57.
Lehmann, J., D. Solomon, J. Kinyangi, L. Dathe, S. Wirick, and C. Jacobson. 2008. Spatial Complexity of soil organic matter forms at nanometer scales. Nature Geosci. 1:238–242.
Liang, B., J. Lehmann, D. Solomon, J. Kinyangi, J. Grossman, B. O’Neill, J.O. Skjemstad, J. Th ies, F.J. Luizao J. Petersen, and E.G. Neves. 2006. Black carbon increases cation exchange capacity in soils. Soil Sci. Soc. Am. J. 70:1719–1730.
Liang, B., J. Lehmann, D. Solomon, S. Sohi, J.E. Th ies, J.O. Skjemstad, F.J. Luizão, M.H. Engelhard, E.G. Neves, and S. Wirick. 2008. Stability of biomass-derived black carbon in soils. Geochim. Cosmochim. Acta 72:6069–6078.
Mary, M.B., V. Sasirekha, and V. Ramakrishnan. 2005. Laser raman and infrared spectral studies of DL-phenylalaninium nitrate. Spectrochim. Acta. Part A: Mol. Biomol 62(Spec.):446–452.
Masiello, C.A. 2004. New directions in black carbon organic geochemistry. Mar. Chem. 92:201–213.
Myneni, S.C.B., J.T. Brown, G.A. Martinez, and W. Meyer-Ilse. 1999. Imaging of humic substance macromolecular structures in water and soils. Science 286:1335–1337.
Petoral, R.M., Jr., and K. Uvdal. 2003. XPS and NEXAFS study of tyrosine-terminated propanethiol assembled on gold. J. Elec. Spec. Rel. Pheno. 128:159–164.
Plaschke, M., J. Rothe, M.A. Denecke, and T. Fanghänel. 2004. Soft X-ray spectromicroscopy of humic acid europium(III) somplexation by comparison to model substances. J. Elec. Spec. Rel. Pheno. 135:53–62.
Plaschke, M., J. Rothe, M. Altmaier, M.A. Denecke, and T. Fanghänel. 2005. Near edge x-ray absorption fi ne structure (NEXAFS) of model compounds for the humic acid/actinide ion interaction. J. Elec. Spec. Rel. Pheno. 148:151–157.
Pantoja, S., and C. Lee. 2003. Amino acid remineralization and ammonium production in Chilean coastal sediments with and without fi lamentous bacterial mats. Org. Geochem. 34:1047–1056.
Rasmussen, C., M.S. Torn, and R.J. Southard. 2005. Mineral assemblage and aggregates control carbon dynamics in a California conifer forest. Soil Sci. Soc. Am. J. 69:1711–1721.
Ravel, B., and M. Newville. 2005. Athena, artemis, hephaestus. J. Synchrotron Radiat. 12:537–541.
Riff aldi, R., and M. Schnitzer. 1972. Electron spin resonance spectrometry of humic substances. Soil Sci. Soc. Am. Proc. 36:301–305.
Samuel, N.T., C.Y. Lee, L.J. Gamble, D.A. Fischer, and D.G. Castner. 2006. NEXAFS characterization of DNA components and molecular-orientation of surfacebound DNA oligomers. J. Elec. Spec. Rel. Pheno. 152:134–142.
Schnitzer, M., and S.U. Khan. 1972. Humic substances in the environment. Marcel Dekker, New York.
Schnitzer, M. 1978. Humic substances: Chemistry and reactions. p. 1–64. In M. Schnitzer and S.U. Khan (ed.) Soil organic matter. Elsevier, Amsterdam, Th e Netherlands.
Schnitzer, M., and G. Calderoni. 1985. Some chemical characteristics of paleosol humic acids. Chem. Geol. 53:175–184.
Schäfer, T., N. Hertkorn, R. Artinger, F. Claret, and A. Bauer. 2003. Functional group analysis of natural organic colloids and clay association kinetics using C(1s) spectromicroscopy. J. Phys. IV France. 104:409–412.
Schäfer, T., G. Buckau, R. Artinger, J.I. Kim, S. Geyer, M. Wolf, W.F. Bleam, S. Wirick, and C. Jacobsen. 2005. Origin and mobility of fulvic acids in the Gorleben aquifer system: Implifi cations from isotopic data and carbon/sulfur XANES. Org. Geochem. 36:567–582.
Shafi zadeh, F., and Y. Sekiguchi. 1983. Development of aromaticity in cellulosic chars. Carbon 21:511–516.
Scheinost, A.C., R. Kretzschmar, I. Christl, and C. Jacobsen. 2001. Carbon group chemistry of humic and fulvic acid: A comparison of C-1s NEXAFS and 13C-NMR spectroscopies. p. 39–47. In E.A. Ghabbour and G. Davies (ed.) Humic substances: Structures, models and functions. Royal Society of Chemistry, Gateshead, UK.
Schmidt, M.W.I., and A.G. Noack. 2000. Black carbon in soils and sediments: Analysis, distribution, implications, and current challenges. Global Biogeochem. Cycles 14:777–793.
Schulten, H.-R., and M. Schnitzer. 1998. Th e chemistry of soil organic nitrogen:
A review. Biol. Fertil. Soils 26:1–15.Schumacher, M., I. Christl, A.C. Scheinost, C. Jacobsen, and R. Kretzschmar. 2005.
Heterogeneity of water-dispersible soil colloids investigated by scanning transmission x-ray microscopy and C-1s XANES microspectroscopy. Environ. Sci. Technol. 39:9094–9100.
Seiler, W., and P.J. Crutzen. 1980. Estimates of gross and net fuxes of carbon between the biosphere and the atmosphere from biomass burning. Clim. Change 2:207–247.
Sham, T.K., B.X. Yang, J. Kirz, and J.S. Tse. 1989. K-edge near-edge x-ray-absorption fi ne structure of oxygen- and carbon-containing molecules in the gas phase. Phys. Rev. A 40:652–669.
Schulze, D.G., and P.M. Bertsch. 1995. Synchrotron X-ray techniques in soil, plant, and environmental research. Adv. Agron. 55:1–66.
Skjemstad, J.O., P. Clarke, J.A. Taylor, J.M. Oades, and S.G. McClure. 1996. Th e chemistry and nature of protected carbon in soil. Aust. J. Soil Res. 34:251–271.
Sleighter, R.L., and P.G. Hatcher. 2007. Th e application of electrospray ionization coupled to ultrahigh resolution mass spectrometry for the molecular characterization of natural organic matter. J. Mass Spectrom. 42:559–574.
Smith, A.P., S.G. Urquhart, D.A. Winesett, G. Mithchell, and H. Ade. 2001. Use of near-edge X-ray absorption fi ne structure spectromicroscopy to characterize multicomponent polymeric systems. Appl 55(Spec.):1676–1681.
Solomon, J.L., R.J. Madix, and J. Stöhr. 1991. Orientation and absolute coverage of benzene, aniline, and phenol on Ag(110) determined by NEXAFS and XPS. Surf. Sci. 255:12–30.
Solomon, D., J. Lehmann, J. Kinyangi, B. Liang, and T. Schäfer. 2005. Carbon K-edge NEXAFS and FTIR-ATR Spectroscopic Investigation of Organic Carbon Speciation in Soils. Soil Sci. Soc. Am. J. 69:107–119.
Solomon, D., J. Lehmann, J. Kinyangi, W. Amelung, I. Lobe, S. Ngoze, S. Riha, A. Pell, L. Verchot, D. Mbugua, J. Skjemstad, and T. Schäfer. 2007a. Long-term impacts of anthropogenic perturbations on the dynamics and molecular speciation of organic carbon in tropical forest and subtropical grassland ecosystems. Glob. Change Biol. 13:511–530.
Solomon, D., J. Lehmann, J. Th ies, T. Schäfer, B. Liang, J. Kinyangi, E. Neves, J. Petersen, F. Luizão, and J. Skjemstad. 2007b. Molecular signature and sources of biochemical recalcitrance of organic C in Amazonian Dark Earths. Geochim. Cosmochim. Acta 71:2285–2298.
Stevenson, F.J. 1957. Investigations of aminopolysaccharides in soils: I. Colorimetric determination of hexosamines in soils hydrolysates. Soil Sci. 83:113–122.
Stevenson, F.J. 1994. Humus chemistry: Genesis, composition, reactions. 2nd. John Wiley, New York.
Stöhr, J. 1992. NEXAFS spectroscopy. Springer series in surface sciences. Vol. 25. Springer, Berlin, Germany.
Stöhr, J., M.G. Samant, J. Lüning, A.C. Callegari, P. Chaudhari, J.P. Doyle, J.A. Lacey, S.A. Lien, S. Purushothaman, and J.L. Speidell. 2001. Liquid crystal alignment on carbonaceous surfaces with orientational order. Science 292:2299–2302.
Sun, G.Y., and M.C. Nicklaus. 2007. Natural resonance structures and aromaticity of the nucleobases. Th eor. Chem. Acc. 17:323–332.
Tisdall, J.M., and J.M. Oades. 1982. Organic matter and water-stable aggregates in soils. Eur. J. Soil Sci. 33:141–163.
Urquhart, S.G., and H. Ade. 2002. Trends in the carbonyl core (C 1S, O 1S) pi* C = O transition in the near-edge x-ray absorption fi ne structure
spectra of organic molecules. J. Phys. Chem. B 106:8531–8538.Warman, P.R., and R.A. Isnor. 1991. Amino acid composition of peptides present
in organic matter fractions of sandy loam soil. Soil Sci. 152:7–13.Zhang, X., W. Amelung, Y. Yuan, and W. Zech. 1999. Land-use eff ects on amino
sugars in particle size fractions of an Argiudoll. Appl. Soil Ecol. 11:271–275.Zheng, F., J.L. McChesney, X. Liu, and F.J. Himpsel. 2006. Orientation of
fl uorophenols on Si(111) by near edge x-ray absorption fi ne structure spectroscopy. Phys. Rev. B 73:205315–1-7.
Zimmerman, A.R., J. Chorover, K.W. Goyne, and S.L. Brantley. 2004. Protection of mesopore adsorbed organic matter from enzymatic degradation. Environ. Sci. Technol. 38:4542–4548.
Zubavichus, Y., A. Shaporenko, M. Grunze, and M. Zharnikov. 2005. Innershell absorption spectroscopy of amino acids at all relevant absorption edges. J. Phys. Chem. A 109:6998–7000.


![Difração de Raios-X [7]€¦ · 11> Diffractometer Bragg-Brentano geometry (Primary monochromator) (Secondary monochromator) Bragg’s Law 12> • For parallel planes of atoms,](https://static.documents.pub/doc/80x56/5f1df254a656886cb012e66b/difrao-de-raios-x-7-11-diffractometer-bragg-brentano-geometry-primary.jpg)


