Carbon and Nitrogen Provisions Alter the Metabolic Fluxin Developing Soybean Embryos1[W][OA]
Doug K. Allen* and Jamey D. Young
United States Department of Agriculture-Agricultural Research Service, Plant Genetic Research Unit, St. Louis,Missouri 63132 (D.K.A.); Donald Danforth Plant Science Center, St. Louis, Missouri 63132 (D.K.A.); andDepartment of Chemical and Biomolecular Engineering and Department of Molecular Physiology andBiophysics, Vanderbilt University, Nashville, Tennessee 37235 (J.D.Y.)
Soybean (Glycine max) seeds store significant amounts of their biomass as protein, levels of which reflect the carbon and nitrogenreceived by the developing embryo. The relationship between carbon and nitrogen supply during filling and seed compositionwas examined through a series of embryo-culturing experiments. Three distinct ratios of carbon to nitrogen supply were furtherexplored through metabolic flux analysis. Labeling experiments utilizing [U-13C5]glutamine, [U-13C4]asparagine, and [1,2-13C2]glucose were performed to assess embryo metabolism under altered feeding conditions and to create corresponding flux maps.Additionally, [U-14C12]sucrose, [U-14C6]glucose, [U-14C5]glutamine, and [U-14C4]asparagine were used to monitor differencesin carbon allocation. The analyses revealed that: (1) protein concentration as a percentage of total soybean embryo biomasscoincided with the carbon-to-nitrogen ratio; (2) altered nitrogen supply did not dramatically impact relative amino acid orstorage protein subunit profiles; and (3) glutamine supply contributed 10% to 23% of the carbon for biomass production,including 9% to 19% of carbon to fatty acid biosynthesis and 32% to 46% of carbon to amino acids. Seed metabolismaccommodated different levels of protein biosynthesis while maintaining a consistent rate of dry weight accumulation. Fluxthrough ATP-citrate lyase, combined with malic enzyme activity, contributed significantly to acetyl-coenzyme A production.These fluxes changed with plastidic pyruvate kinase to maintain a supply of pyruvate for amino and fatty acids. The flux mapswere independently validated by nitrogen balancing and highlight the robustness of primary metabolism.
The legume soybean (Glycine max) is one of the mostimportant oilseed crops, providing large amounts ofprotein for food and feed applications and supplying asignificant proportion of the vegetable oil used forcooking and for chemical feedstocks. Given these de-mands, there is considerable interest in manipulationof the underlying biochemical pathways that produceoil and protein in the seed. The proportions of thesestorage reserves are established by both the supply ofmaternal precursors and the metabolic processes of thedeveloping embryo. Embryos receive sugars andamino acids and convert them into storage reservesthrough primary metabolism. Thus, the accumulationof protein and oil is controlled by both the maternal(Fabre and Planchon, 2000; Nakasathien et al., 2000;Pipolo et al., 2004) and seed (Wilcox, 1998; Narvelet al., 2000; Hernández-Sebastià et al., 2005) genotypes,
which complicates efforts to gain fundamental under-standing of the process.
This complexity can be partially circumvented bystudying the growth of cultured embryos. In planta,embryos receive carbon and nitrogen apoplastically(Thorne, 1980, 1981). An environment suitable forembryo growth can be recreated within a laboratorysetting using known apoplastic nutrients (Hsu et al.,1984; Rainbird et al., 1984). Experimentally providingprecise levels of substrates to filling embryos (i.e. re-productive stage R5–R5.5) allows them to grow in acontrolled way (Thompson et al., 1977; Obendorf andWettlaufer, 1984), leads to compositions similar tothose in planta (Hsu and Obendorf, 1982; Allen et al.,2009b; Bates et al., 2009), and confines the “maternal”influence to defined substrate concentrations. In thisdesign, the influence of carbon and nitrogen provisionson seed metabolism and the production of storagereserves can be probed.
The impact of carbon and nitrogen availability onprotein levels in seeds has been studied in maturingplants, which remobilize leaf nitrogen to increaseprotein in the seed (Saravitz and Raper, 1995). Like-wise, cultured embryos supplied with increasingamounts of nitrogen produce more protein in both thewild type (Saravitz and Raper, 1995; Nakasathienet al., 2000; Pipolo et al., 2004) and high-protein mu-tants (Hayati et al., 1996). Although plant-suppliedsubstrates impact resource allocation and affect final
1 This work was supported by the U.S. Department of Agriculture-Agricultural Research Service and the U.S. National Science Founda-tion (grant no. EF–1105249).
* Corresponding author; e-mail [email protected] author responsible for distribution of materials integral to the
findings presented in this article in accordance with the policy de-scribed in the Instructions for Authors (www.plantphysiol.org) is:Doug K. Allen ([email protected]).
[W] The online version of this article contains Web-only data.[OA] Open Access articles can be viewed online without a subscrip-
1458 Plant Physiology�, March 2013, Vol. 161, pp. 1458–1475, www.plantphysiol.org � 2013 American Society of Plant Biologists. All Rights Reserved. www.plantphysiol.orgon May 29, 2018 - Published by Downloaded from
storage reserve compositions within the soybean seed,there are no existing quantitative flux models thatdescribe how changes in provisions alter the underly-ing metabolism.Metabolic flux analysis (MFA) aims to provide a
quantitative description of the flow of matter within abiological network and relies on 13C or other isotopesto track, or enrich, metabolites according to biochem-ical fluxes and pathways (Stephanopoulos et al., 1998).The metabolic reactions in the network rearrange car-bon atoms as metabolites are interconverted, withoutaccumulation or depletion of the intermediates. Thus,adherence to the laws of mass conservation allows thecalculation of in vivo fluxes. The flux models establishnetwork function (Ratcliffe and Shachar-Hill, 2006)and can occasionally identify unique roles for enzymes(Schwender et al., 2004). Most MFA studies in plantshave focused on seeds (Troufflard et al., 2007; Iyeret al., 2008; Allen et al., 2009b; Lonien and Schwender,2009; Alonso et al., 2010, 2011) because of theirpseudo-steady-state metabolism and economic im-portance, although plant cell suspensions have beenused (Rontein et al., 2002; Baxter et al., 2007; Williamset al., 2008; Masakapalli et al., 2010) because of theirexperimental versatility. Together, these studies havequantified roles for metabolic pathways, such as theuse of the tricarboxylic acid cycle (Schwender, 2008;Sweetlove et al., 2008, 2010; Allen et al., 2009b; Krugerand Ratcliffe, 2009) to produce ATP (Alonso et al.,2007a) or to supply citrate for cytosolic acetyl-CoAwhen operating as an incomplete cycle (Schwenderet al., 2006). Additionally, MFA has been used to assessthe impact of genetic and environmental perturbationsin plants (Rontein et al., 2002; Spielbauer et al., 2006;Alonso et al., 2007b; Junker et al., 2007; Iyer et al., 2008;Williams et al., 2008; Lonien and Schwender, 2009)and, therefore, should be useful in probing the influ-ence of carbon and nitrogen on the resulting compo-sition of the filling embryo.This study examines how the flux through primary
metabolism within developing soybeans is altered bychanges in carbon and nitrogen supply. The modelingproduced detailed flux maps that described the re-distribution of resources within the seed and thatmatched observed biomass compositions (i.e. aminoacid fluxes to biomass were fitted as part of the mod-eling). Developing seeds were supplied varying levelsof substrate (unlabeled or 14C enriched) in differentcarbon-to-nitrogen (C:N) ratios and were analyzed forthe production of oil, protein, and carbohydrate. Next,the flow of carbon through primary metabolism wasmonitored in separate culture experiments providingGlc, Gln, or Asn labeled with 13C. Three labeling ex-periments with four to five replicates for each of thethree C:N conditions resulted in approximately 40 in-dependent 13C-enriched cultures. The enrichment ofamino acids and the direct measurement of biomasswere used as inputs for modeling steady-state fluxes ofthe developing embryo. The analyses indicate the fol-lowing: (1) soybean protein concentration ranged from
approximately 14% to 47% of total biomass andchanged consistently as a function of C:N ratio; (2)altered nitrogen supply did not dramatically alterstorage protein subunit profiles or affect the relativelevels for most amino acids; and (3) Gln supply con-tributed 10% to 23% of the carbon for biomass pro-duction, including 9% to 19% of carbon to fatty acidbiosynthesis and approximately 32% to 46% of carbonto amino acids. These results suggest that seed me-tabolism can accommodate different levels of proteinproduction, although it may constrain total biomassaccumulation. Additionally, ATP-citrate lyase andmalic enzyme flux changes are offset with plastidicpyruvate kinase to maintain flow through pyruvateand to acetyl-CoA for the C:N conditions. The fluxmaps have been independently validated by nitrogenbalancing and are discussed in the context of metabolicengineering.
RESULTS
C:N Ratio Influence over Seed Growth Rate
Soybean plants were grown under summer-likeconditions to generate seeds for embryo culturing.Once the embryos had finished cell division, startedlinear seed filling (Egli, 1998), and weighed 30 to 40 mgfresh weight, the embryos were dissected from theseed coat and cultured in medium with unlabeled, 14C-labeled, or 13C-labeled substrates (Table I). Fourteendays of culturing resulted in growth rates between 4.7and 7.9 mg dry weight per day per embryo and ap-proximately 90 to 100 mg of added biomass (Table II),consistent with both in planta growth measured at 5 to7 mg dry weight per day per embryo (Rubel et al.,1972; Egli et al., 1985) and previous culturing studies insoybean (Hsu and Obendorf, 1982; Allen et al., 2009b).
Table I. Provision of varied C:N molar ratios in culture medium
Growth and total biomass compositions were determined fromsoybean ‘Jack’ embryos grown on medium supplied with variousconcentrations of Suc, Glc, Gln, and Asn. An example calculation ofthe resulting C:N ratio, taking into account carbon coming from sup-plied amino acids, is shown in Figure 2. Culture compositions inboldface were chosen for 13C-metabolic flux analysis. Other cultureparameters are described in “Materials and Methods.”
Biomass production and doubling rates (3.65 6 0.17doublings per 14 d of culture) were independent ofC:N ratio except possibly in the extreme cases (Fig. 1A;Table II). The embryos provided with the lowest C:Nratio generally grew at a slower rate and, along withthe highest C:N ratio cultures (i.e. C:N = 60 and 91),were visually different from other cultures and thusnot used for further studies. The light level and tem-perature for all cultures were maintained at 30 to35 mmol m22 s21 and 26°C to 27°C to minimize changesin metabolism of the growing embryos. These culturingconditions are sufficient to meet metabolic and isotopicsteady-state assumptions (Allen et al., 2009b) and, inthis study, produced growth that accounted for greaterthan 93% of all embryo biomass.
Effect of C:N Ratio on Protein Concentration
Different levels of carbon and organic nitrogen in theculture medium resulted in different biomass compo-sitions (Fig. 1B; Table II). Embryos receiving more or-ganic nitrogen (i.e. lower C:N ratio; defined in Fig. 2A)produced more protein per unit of biomass, consistentwith other reports (Saravitz and Raper, 1995; Hayatiet al., 1996). Protein changed from approximately 47%to 14% of total biomass (Table II; Supplemental DataSet S1 as the carbon supplied from amino acids wasreduced from 40% to 3% of total (Table I).
The profile and subunit composition of storageproteins were inspected by separating equal amountsof either total protein or biomass by SDS-PAGE. Im-ages in Figure 2, B and C, representative of three gelseach, revealed a similar storage protein pattern fordifferent C:N ratios. Densitometry analyses confirmedthe change in protein levels across C:N ratios (Fig. 2D).At the lowest supplied nitrogen level, the productionof a storage protein at 48 kD was diminished. Pro-teomic analysis of this band identified it as theb-subunit of b-conglycinin (Supplemental Data Set S2).This subunit lacks sulfur-containing amino acids but
has similar nitrogen content to other subunits; there-fore, its disappearance was unexpected. While differ-ent inorganic nitrogen forms have been found to alterthe concentration of b-subunits (Paek et al., 1997), theregulation of b-conglycinin is both transcriptional andposttranscriptional (Harada et al., 1989) and specific toindividual a-, a9-, and b-subunits. Thus, the variable
Table II. Biomass composition of soybean ‘Jack’ embryos from altered carbon and nitrogen provision
Protein, oil, and starch content were determined (unless indicated otherwise [ND]), and percentage wascalculated as mg/100 mg 3 100. Protein was established by C:N analysis, total oil was established withgas chromatography-flame ionization detection, and starch was determined by spectrophotometricallymonitoring starch hydrolysis to Glc. Cell wall and soluble metabolites are presumed to represent theremainder of the composition. Boldface C:N ratios were used in further experiments.
Figure 1. Variation in biomass growth and composition of developingsoybean embryos from provision of altered amounts of carbon andnitrogen. The amount of biomass produced (A) and the percentage ofstorage in the forms of protein, oil, and starch (B) were measuredacross molar C:N ratios that varied from 6:1 to 91:1. Each point witherror bars represents three to six separate culture replicates; in total,184 cultures were examined. DW, Dry weight.
quality and quantity of subunits in b-conglycinin andglycinin (Wilson, 1987) remain a point of interest(Yaklich, 2001).The amino acid profiles (micromoles of amino acid
relative to the production of 1 mg of biomass) fromhydrolyzed protein were compared for three differentC:N ratios (13:1, 21:1, and 37:1) and used to calculateamino acid biosynthetic rates per milligram of bio-mass. Although total protein content increased withdecreasing C:N ratios, the overall composition of theprotein-bound amino acids did not drasticallychange, with the exception of Arg (Fig. 2E; Table III;Supplemental Data Set S3). The increased proteinlevels in embryos cultured in medium with a C:N ratioof 13:1 resulted in larger fluxes for most amino acids(on average, the 13:1 C:N ratio resulted in amino acidbiosynthetic fluxes 71% greater than the 37:1 C:N ra-tio). These data indicated that total protein concen-tration responded to nitrogen levels but that relativeamino acid composition varied more modestly. Theprotein levels for flux analysis were determined usingJones factors for the measured amino acid compo-sitions as described in “Materials and Methods”and Supplemental Data Set S1 (Salo-Väänänen andKoivistoinen, 1996).Seed storage compounds contain different amounts
of carbon (i.e. a typical triacylglycerol with trioleincomposition, C57H104O6, is 77% carbon by weight; Glcpolymers in carbohydrates [C6H12O6 minus H2O] are44% carbon; and protein with the observed aminoacid composition is 51% carbon); therefore, 14C labelingwas used to monitor the changes in carbon allocation
into biomass (Table IV). Soybeans were cultured inmedium containing a combination of [U-14C12]Suc,[U-14C6]Glc, [U-14C5]Gln, and [U-14C4]Asn at levels con-sistent with the molar composition of carbon for eachsubstrate (Goffman et al., 2005). Embryos were grownfor 14 d before the biomass was processed as describedin “Materials and Methods.” Briefly, oil, ethanol-soluble material, and protein were sequentiallyextracted. The ethanol fraction was further subjected toion-exchange chromatography and HPLC to establishits contents. HPLC indicated that the only significantradioactivity in the cationic fraction eluted completelyin the column void volume and may have representeda small amount of hydrophobic protein solubilized bythe 80% ethanol (i.e. amino acid pools that did notcome in the void volume were sensitively detected byUV [254 nm] and were present at low concentrationsthat did not result in measureable dpm values). Nei-ther sugars, which represent part of the carbohydratepool, nor organic acids changed with C:N ratio, con-sistent with their roles as stored intermediates in me-tabolism that have measureable levels in the vacuole.Organic acids accounted for 3.2% to 3.4% of total bio-mass (Table IV), indicating possible vacuolar pools ofmalate or citrate in soybeans as has been reported inplant cells (Adams and Rinne, 1981; Adams et al., 1982;Gout et al., 1993; Martinoia et al., 2007; Sweetloveet al., 2010; Etxeberria et al., 2012).
Total dry weight accumulation was not dependenton C:N conditions (4.8–5.1 mg of biomass per day perembryo) and resulted in similar amounts of total14C incorporation (56,942–59,626 dpmmg21 dry weight;
Figure 2. Fluxes to protein-derivedamino acids. The protein compositionand amino acid concentrations derivedfrom protein were experimentally de-termined and used to calculate meta-bolic fluxes. A, Sample calculation forC:N ratio for the values described. B,Analysis of 10 mg of total protein bySDS-PAGE. The 48-kD missing banddescribed in the text is highlighted byan asterisk. C, Analysis of 25 mg ofbiomass. D, Analysis of equivalentamounts of dry weight (DW) over in-creasing C:N ratios by gel densitometryanalysis. E, Individual amino acidfluxes relative to the production of1 mg of biomass.
Table IV). Quantitative extraction of protein requiredurea (detergents alone were insufficient), which co-extracts some carbohydrates and results in modestlyoverestimated protein levels but reduced differencesbetween them for C:N conditions (SupplementalData Set S1). Together, the measurements of dryweight accumulation and composition (Table II) and14C-labeling experiments (Table IV) indicated that seedfilling is capable of sustaining increased protein pro-duction but may restrict the total stored carbon inbiomass.
13C Labeling in Biomass
13C-labeling experiments were performed to assessthe carbon sources used for protein production. In
each culturing experiment, only one labeled substratewas provided, while the other carbon substratesremained unlabeled (i.e. isotopic natural abundance).Therefore, any change in 13C abundance in aminoacids derived from hydrolyzed protein reflected thefractional contribution of a particular carbon source.The amount of labeled, protein-derived amino acidswas examined by gas chromatography-mass spec-trometry (GC-MS), except for Arg, Lys, and Cys,which were approximated by levels of other aminoacids that share the same precursors (i.e. Glu, Ile, andSer, respectively). Together, the average isotopic en-richments and the measured flux to amino acids wereused to determine what fraction of each carbon sourceflows to which amino acids (Supplemental Data SetS4). Amino acids were grouped by family for simpleinterpretation (Fig. 3), with Ile and Lys split betweenthe pyruvate and Asp families, consistent with theirknown biosynthetic origins.
Labeling experiments for the C:N ratios of 13:1, 21:1,and 37:1 revealed the carbon allocation into the fouramino acid families (Fig. 3, with only 21:1 shown in thetop panel; Supplemental Data Set S4). Carbon parti-tioning varied between the three C:N ratios (Fig. 3,bottom panel; Supplemental Data Set S4), with sugarsproviding more carbon at higher C:N ratios. The con-tribution of each carbon source to a particular aminoacid family relative to other carbon sources is indicatedby looking across the rows (i.e. the sum across eachrow is 100; Fig. 3). Triose/pentose phosphate-derivedamino acids were made predominantly from sugars(95%–96% of their carbon composition), with smallcontributions to this family from Gln (3%–4%) and Asn(1%–2%) for the biosynthesis of Gly, consistent withour previous findings (Allen et al., 2009b). The lowlabeling in His, Ser, and Gly from the [U-13C]Glnprovision (Supplemental Data Set S5) indicated thatthe phosphoenolpyruvate carboxykinase and gluco-neogenic pathways are less active in embryo sinktissues. Furthermore, the absence of gluconeogenicactivities across all three C:N ratios suggested that thisform of metabolic activity was not induced or regu-lated by Gln, which serves as a precursor of organicacids in developing seeds.
Gln provided 32% to 46% of carbon for amino acids(shaded cells in the table in Fig. 3). Gln was a signifi-cant source of carbon for the Glu (71%–87%), Asp(26%–44%), and pyruvate (13%–24%) amino acidfamilies and provided significantly more carbon to
Table IV. 14C labeling of embryos cultured with altered concentrations of substrates
Embryos cultured in 14C-labeled substrates were grown for 14 d and then processed (see “Materials and Methods”) to assess biomass compositionand production. A comparison of the numbers with those measured by other means is provided in Supplemental Data Set S1.
C:N Ratio Biomass Growth Biomass Organic Acids Protein Oil Carbohydrates
Table III. Fluxes to protein-bound amino acids, acetyl groups, andhexose units
The fluxes to amino acids from hydrolyzed protein were determinedexperimentally by a combination of C:N and amino acid analyses, asdescribed in “Materials and Methods,” and resulted in higher fluxvalues for all amino acids in C:N 13:1. The model fluxes were deter-mined relative to the measured fatty acid fluxes determined per twoacetyl units (i.e. four acetyl carbons), and carbohydrates representingthe remainder of the biomass were determined on a per hexose unitbasis. All fluxes are reported as micromoles of metabolite per milli-gram dry weight.
amino acids as the C:N ratio decreased. Since Glncontributed significantly to the biosynthesis of three ofthe four amino acid families, we examined the specificallocation of Gln-derived carbon (Supplemental DataSet S6). Gln partitioned predominantly into Glu-derived amino acids (64%–66% of supplied carbon)and to a lesser extent into Asp (18%–19%) and pyru-vate (14%–16%) amino acid families. The relativeallocation varied by less than 3% among the C:Nconditions (Supplemental Data Set S6). Thus, the in-creased use of Gln-derived carbon (relative to sugars)at low C:N ratios reflected a concomitant increase influx from Gln to each amino acid family. Amino acidsderived from pyruvate (Ala, Val, Leu, Ile, and Lys) hadsignificant incorporation of carbon from the Gln source(i.e. varied levels from 6% to 18% of total carbon; Fig.4). Likewise, fatty acids derived from pyruvate con-sisted of 9% to 19% Gln-derived carbon (Fig. 4), adoubling through the range of the C:N experiments.Computationally fitted uptake fluxes indicated thatGln supply provided between 10% and 23% of allcarbon for biomass, changing inversely with C:Nconditions. Coordinated increases in the absolutevalues (i.e. unchanged relative flux values) have beenreported in the primary metabolism of plant tissueswhere other environmental perturbations were con-sidered (Williams et al., 2008) and emphasizes theplasticity of primary metabolism.
Generation of Flux Maps for Three C:N Ratios fromMultiple Labeling Experiments
MFA was used to investigate changes in the storagereserve composition of filling soybean embryos. MFAis a computational approach that mathematically bal-ances the flow of carbon through metabolite pools in agiven stoichiometric network. The network descriptionincluded the carbon atom rearrangements catalyzed
Figure 3. Carbon source allocation into amino acid families. Provisionof fully labeled substrates (Gln or Asn) resulted in the redistribution oflabel to amino acids and was used to establish the source of carbon foreach amino acid family. Distribution of label to each amino acid alongwith carbon composition and corresponding biosynthetic fluxes wereused to calculate the fractional contributions of different carbonsources to amino acids (for details, see Supplemental Data Set S4).Amino acids were grouped according to biosynthetic families by av-eraging. The results of the 21:1 C:N ratio culture are provided in thetop panel, with the 13:1 and 37:1 C:N ratios that indicated similartrends provided in the table. The contributions of Gln-derived carbonto the Glu, Asp, and pyruvate amino acid families are highlighted bythe shaded regions in the table.
Figure 4. Fatty acid synthesis utilizes Gln-derived carbon in soybeans.[U-13C5]Gln supplied to filling embryos resulted in pyruvate-derivedmetabolic products that were 13C labeled. The average proportion oflabeled carbon was measured in pyruvate-derived amino acids andterminal acetate groups of fatty acids. The percentage of carbon la-beled was similar between the two pyruvate-derived compound clas-ses at each C:N ratio. The amount of incorporated carbon derived fromGln increases with decreasing C:N ratio.
by enzymes and, therefore, accounted for isotope labelredistribution through different metabolic pathways.Through a x2
fitting process, the values for fluxes (i.e.the computational variables) were optimized to reca-pitulate both the experimentally measured label andflux data, resulting in “best estimates” of global fluxvalues. The combination of isotopic labeling experi-ments with MFA provided a quantitative descriptionof the flow of metabolites through biochemicalpathways.
Three independent labeling experiments using [U-13C4]Asn, [U-13C5]Gln, or [1,2-13C2]Glc were used toassess central carbon metabolism under variable car-bon and nitrogen supply. Measurements used formodeling were taken from label deposition into aminoacids from hydrolyzed protein, which is commonlyevaluated for flux analysis (Dauner et al., 2001). Intotal, between the three to five replicates for each of thethree conditions, 6,337 isotopomer measurements wererecorded (i.e. 152 distinct mass isotopomers for mul-tiple conditions and replicates; Supplemental Data SetS5). Each model comprised 63 metabolites with 70 netand 20 exchange fluxes. The optimized flux networkfor each of the three culture variations (Fig. 5; Table V;Supplemental Data Set S7) was based upon a previousmodel (Allen et al., 2009b) that represented the keycarbon transitions in primary metabolism and wasexpanded with information from a third labelingexperiment. Figure 5 and Table V depict the fluxesthat varied significantly with C:N ratio, whileSupplemental Data Set S7 provides the entire
description of the model and fluxes. Fluxes that in-creased most dramatically with the highest provisionof Gln (i.e. C:N of 13:1) are designated by thick blackarrows (Fig. 5).
Differences in label incorporation in Ala and otherpyruvate-derived amino acids were modeled as sepa-rate pyruvate kinase and malic enzyme activities in thecytosol and plastid. The existence of nonequilibratedpyruvate pools in developing seeds is supportedthrough isotopic labeling experiments (Schwenderet al., 2006; Williams et al., 2008). Furthermore, plas-tidic pyruvate kinase-based production of pyruvate isan important metabolic step for fatty acid biosynthesis(Andre et al., 2007). The data also indicated that citratetransport and cleavage by ATP-citrate lyase and malicenzyme supply carbon for amino and fatty acids.Small fluxes through Thr aldolase and the glyoxylatecycle were supported by labeling data but did notchange with the C:N conditions. Labeling in otherparts of the metabolism was inspected for furtherevidence of compartmentation (Wahrheit et al., 2011;Zamboni, 2011). However, additional subcellular de-tails, such as vacuolar pools or the duplication of cy-tosolic and plastidic components of glycolysis orpentose phosphate pathways, were not necessary todevelop models that passed statistical criteria (sum ofsquared residuals [SSR] of 221, 228, and 209 for 13:1,21:1, and 37:1 that are less than the upper 95% confi-dence cutoff of 298) and, therefore, were not included.
A comparison of fitted and simulated data indicatedno gross errors (Fig. 6). The largest deviations were
Figure 5. Metabolic flux maps of developing soybean embryos supplied three different C:N ratios. The values have units ofmicromoles of metabolite per milligram dry weight produced. For easy visualization, arrows that are increased in thickness anddarkness emphasize differences in fluxes. Colored numbers indicate the fluxes from the 13:1 (blue), 21:1 (green), and 37:1 (red)C:N ratios. Flux values that changed most significantly are provided in Table V, and a complete list of all fluxes, 95% CIs, and aflux map that includes metabolism into phosphoenolpyruvate is provided in Supplemental Data Set S7. Metabolite abbrevia-tions are in uppercase letters, and key enzymes are indicated in italics.
from measurements of Pro and C1 efflux. The evalu-ation of standards and reports by others (Antoniewiczet al., 2007) have indicated that Pro is less trustworthy.C1 efflux was loosely established from differences inits production and utilization that do not sensitivelycontribute to other flux estimates. The statisticalagreement between fitted and measured data sup-ported the accuracy of the model. Further additions tothe network resulted in overparameterization that wasindicated by SSR values significantly below the cutoffvalue (less than noise-based error) and by large con-fidence intervals (CIs). Advanced experimental tech-niques (Allen et al., 2012) or alternative labelingstrategies that probe particular paths of interest wouldbe necessary to further increase the network com-plexity (Allen et al., 2009a).
The Effect of Combined Labeling Experiments on CIs forFlux Estimates
The coordinated modeling of multiple indepen-dent labeling experiments has been done previously(Schwender et al., 2006; Allen et al., 2009b; Masakapalliet al., 2010) and has resulted in confident flux es-timates. We combined different labeling data setsinto our simulations for central metabolism. The CIs(Antoniewicz et al., 2006; Young et al., 2008) estab-lished from one, two, or all three labeling experimentswere compared with the flux values from which theywere derived along with the degrees of freedom andthe SSR (Table VI). The number of fluxes (out of 90modeled) that had a CI less than the magnitude of theflux estimate were counted. The use of three labeling
experiments generated 60 fluxes with CIs less than theflux magnitude. As the number of labeling experi-ments used in the simulation decreased, the systembecame poorly parameterized and fewer fluxes weresensitively determined (Table VI; i.e. their CIs becamelarger than their flux value). Sorting the data by thehighest percentage of confidently established netfluxes (Table VI, last column) revealed that inclusionof the Gln labeling experiment better determined agreater number of fluxes than either of the other twoexperiments (Table VI).
Flux through Plastidic Pyruvate in DevelopingSoybean Embryos
Each of the models reported significant flux throughglycolysis from hexose to pyruvate (plastidic pyruvatekinase flux was 70%–76% of total flux to pyruvate),indicating that sugars are an important source of car-bon for fatty acid metabolism. Together, the actions ofglycolysis and pyruvate dehydrogenase provide tworeducing equivalents and one ATP that are stoichio-metrically required for the incorporation of an acetyl-CoA group in fatty acid biosynthesis. However, sugarsare not the only source of carbon, since supplied Glncan also be used for the biosynthesis of pyruvate-derived compounds. Changes in the supplied C:N ra-tio affected the contribution of Gln as a source of carbonfor C4 dicarboxylic acids (such as malate), plastidicpyruvate, pyruvate-derived amino acids (Val andLeu), and fatty acids. These four classes of metabolitesincorporated more Gln-derived carbon when lesssugar was supplied (Fig. 4).
Table V. Net fluxes of pathway intermediates determined through metabolic flux analysis in developing soybean embryos provided three differentC:N ratios
Flux value rates are shown in units of micromoles per milligram dry weight produced. The 95% CIs are shown in brackets. A complete list of allfluxes including exchange fluxes is given in Supplemental Data Set S6.
Reaction Description13:1 21:1 37:1
Flux Value 95% CI Flux Value 95% CI Flux Value 95% CI
Significant changes in dicarboxylic acid-derivedproducts were seen as the C:N ratio decreased andthe soybean embryos relied more heavily on Gln astheir carbon source (Fig. 7). Results from [13C]Gln la-beling experiments revealed that the labeling of allfour carbons in Thr increased with the decreased C:Nratios, indicating a significant proportion of fully la-beled precursors such as C4 dicarboxylic acids likeoxaloacetate or malate. Changes were also seen inpyruvate-derived amino acids (Fig. 7). Leu displayedan enrichment in [M+2]+ and [M+4]+ isotopomers, in-dicating derivation from acetyl-CoA that was labeledin both carbon positions. This double labeling ofacetyl-CoA is consistent with malic enzyme and py-ruvate dehydrogenase using malate that was labeledin multiple positions. The flux models indicated thatcitrate cleaved by ATP-citrate lyase provides 33% to46% of the acetyl groups for fatty acid metabolism andcan supply dicarboxylic acids used to generate pyru-vate with malic enzyme (Fig. 5). Together, ATP-citratelyase and plastidic malic enzyme contribute 43% to51% of the carbon used for the biosynthesis ofpyruvate-derived products (i.e. pyruvate-derived amino
acids and fatty acids). Based upon the relative contri-butions of plastidic malic enzyme and pyruvate kinaseto the pyruvate supply, malic enzyme and ATP-citratelyase provide 47% to 59% of the carbon for acetyl-CoAproduction. Flux from a-ketoglutarate to malate in-creased by 90% with a change from high to low C:Nratio (1.05–1.98 mmol mg21 dry weight), resulting in theutilization of more labeled organic acids for amino andfatty acid biosynthesis relative to plastidic pyruvate ki-nase (Fig. 5; Table V; Supplemental Data Set S7).
Using MFA to Distinguish Amino AcidBiosynthetic Precursors
While Asn in the apoplastic space of developingsoybean embryos represents the second largest sourceof nitrogen for the developing seed (Rainbird et al.,1984), flux analysis and labeling experiments indicatedthat it made a smaller contribution to metabolism. Asnuptake was approximately 9% to 37% of Gln uptakeflux. Nonetheless, 13C-labeled Asn was also an infor-mative tracer for probing metabolism and decipheringbetween alternative network descriptions. Feeding la-beled Asn resulted in Met and Thr labeling percent-ages that significantly differed from the combination oflabeled Asp and Asn (ASX; Supplemental Data Set S8).Supplying labeled [13C]Asn (at 21:1 C:N) resulted in a5-fold greater final label of ASX over Met or Thr(Supplemental Data Set S8, black bars). Conversely,labeled Gln experiments resulted in a 2-fold lowerlevel of labeled ASX (Supplemental Data Set S8,hatched bars). These data indicate that Asp and Asnare not in isotopic equilibrium and that Asp is notderived predominantly from supplied Asn. The dataalso support ATP-citrate lyase-based generation ofoxaloacetate in the plastid, as the cytosolic pool ofoxaloacetate could not be fitted as a precursor to la-beling in Thr, Ile, or ASX (Supplemental Data Set S9)when all three labeling experiments were considered.
The use of [U-13C4]Asn did not result in labeledproducts of phosphoenolpyruvate or pyruvate-derivedmetabolites. Aromatic amino acids were less than 1%labeled, and pyruvate-derived amino acids were la-beled at only low levels (less than 5%) due to malicenzyme activity (Supplemental Data Set S5). Theseobservations resulted in optimized flux maps withlimited phosphoenolpyruvate carboxykinase (or re-versible phosphoenolpyruvate carboxylase) activity(exchange flux of 3%–21% of net phosphoenolpyruvatecarboxylase flux), consistent with sink metabolism indeveloping seeds lacking gluconeogenesis.
Multiple network descriptions were considered todescribe carbon allocation for amino and fatty acidmetabolism. We observed that [U-13C5]Gln labelingresulted in asymmetric enrichment in Asp familyamino acids such as Thr and Ile, a pattern furtherconfirmed qualitatively by inspection of Met. Previ-ously observed reversibility in isocitrate dehydrogen-ase (Schwender et al., 2006; Allen et al., 2009b) was
Figure 6. Measured versus fitted data. The experimentally determinedmass isotopomers were compared with the simulated values frommetabolic flux analysis for each of the three flux maps. Measurementswere in agreement, indicating that gross errors were not present andthat the models were a reasonable description of metabolism.
required to create citrate with higher mass isotopomerfractions. Four example networks that represent dif-ferent alternatives are summarized in Figure 8 withadditional description provided in Supplemental DataSet S9. The table in Figure 8 indicated that the SSRwere minimized when the model included ATP-citratelyase accompanied by reversible isocitrate dehydro-genase. Provision of [U-13C5]Gln resulted in [M+3]+
mass isotopomers of Thr and Ile that could not besimulated through malate transport (Fig. 8B) andresulted in a higher SSR. A network containing com-partmentalized phosphoenolpyruvate with a pyruvatetransporter (Fig. 8C) resulted in incompatibility be-tween pyruvate-derived amino acids from differentsubcellular locations (i.e. Ala and Val) and also gave ahigher SSR value. When pyruvate transport andphosphoenolpyruvate subcellular descriptions weretogether included with the optimized model (Fig. 8D),the flux estimates remained consistent with the opti-mized model (Fig. 8A) and indicated that pyruvatetransport was not significant. These steps furtherconfirmed the optimized model description (Fig. 8A).The small pyruvate transport flux was not added tothe final model because genes for plastidial pyruvatetransporters in oilseeds have not been established(Linka and Weber, 2010) and the flux is poorly deter-mined (CI in the table was larger for plastidic pyruvatekinase in model D). Similarly, steps to describe hypo-thetical vacuolar pools were not included, as they werenot necessary to fit the data (Fig. 6) and would requirefurther experimental labeling descriptions to avoidlow-confidence determination (Allen et al., 2009a).
Oxidative and Nonoxidative Activities in PentosePhosphate Metabolism
Experiments with [1,2-13C2]Glc resulted in similarquantities of [M+1]+ (12%–15%) and [M+2]+ (11%–14%) mass isotopomers in His (Supplemental Data Set
S10). These labeled species of His support the existenceof both an oxidative and a reversible, nonoxidativeoperation of the pentose phosphate pathway or alter-native sources of pentoses. The [M+2]+ labeling wouldresult from the conversion of Glc-6-P (hexose phos-phate) into ribulose-5-phosphate using trans-ketolase(tk1/tk2) and aldolase (ta) enzymes, both of which
Table VI. Additional labeling experiments affect flux sensitivity
Fluxes were determined through the combination of one, two, or three labeling experiments. The 95% CIs were calculated from the flux valuesusing a parameter continuation method described elsewhere (Antoniewicz et al., 2006). The CIs were then compared with the value of their cor-responding flux. The number of net fluxes that have CIs that are smaller than the magnitude of the flux are presented along with the SSR and degreesof freedom (i.e. overdetermination). All simulations were based upon the presented model (90 fluxes, including 70 net fluxes and 20 exchange fluxes)and using measurements from C:N 21:1. Nineteen net fluxes, although not constrained, represent fluxes to biomass (e.g. amino acid biosyntheticfluxes to protein) and therefore have smaller measured errors and are established regardless of labeling. Therefore, the number of highly confidentfluxes calculated minus the 19 biosynthetic fluxes are shown in parentheses. The number of fluxes determined with high confidence increases withthe number of labeling experiments and the degrees of freedom.
Figure 7. 13C label in Thr and Leu. [U-13C5]Gln was provided to de-veloping embryos in different amounts to reflect three different C:Nratios (13:1, 21:1, 37:1). The mass isotopomer distribution in Thr andLeu, which are made from C4 dicarboxylic acids and acetyl-CoA, arepresented. Labeling of all four carbons in Thr (i.e. [M+4]+) indicated asignificant amount of labeling in organic acid precursors, such asmalate and citrate. Leu was labeled in even-weighted mass iso-topomers, indicating that these fractions were derived from acetyl-CoA, which was labeled in both carbons.
maintain an intact bond between the first and secondcarbons of labeled hexose. On the other hand, oxida-tive metabolic steps break this bond and produce[M+1]+ labeling. The presence of both [M+1]+ and[M+2]+ isotopomers may indicate partial pentosephosphate pathway activities in both the plastid andcytosol that are connected by pentose or other trans-ported molecules (Linka and Weber, 2010; Weber andLinka, 2011), as the oxidative and reductive pathwaysare controlled by multiple levels of regulation (Buchanan,1980; Buchanan and Luan, 2005). Given the presence ofRubisco in green oilseeds (Ruuska et al., 2004), thedetailed operation of pentose phosphate pathways willrequire more labeling experiments. Because the dif-ferences in His labeling between C:N ratios were small(Supplemental Data Set S10) and not significant, the
poorly determined fluxes in this part of the metabo-lism were not further considered.
DISCUSSION
Primary metabolism results in diverse storage com-positions in seeds. The creation of organic nitrogen andmore highly reduced carbon compounds is energeti-cally costly for a plant; therefore, the optimal use ofelements benefits plant growth. Given both the im-portance and the differing contributions of carbon andnitrogen to various storage reserves, we altered theprovision of these compounds as one parameter: theC:N ratio. We varied the molar ratio of carbon tonitrogen (provided as sugars and amino acids) and
Figure 8. Alternative pathways for carbon import into plastids for amino and fatty acid biosynthesis. Development of theoptimal model was the result of considering many network descriptions with the three combined labeling experiments for C:Nof 37:1: A, Optimal model as described in the text. B, Export of malate. C, Export of citrate but with additional compart-mentation of phosphoenolpyruvate and a hypothetical pyruvate transporter but without reversible isocitrate dehydrogenase. D,Optimal model plus inclusion of phosphoenolpyruvate compartmentation and a pyruvate transporter (cPYR→PYR is positiveflux), which results in overfitting. The table includes the SSR of each model and the flux values for six key enzymes along withtheir CIs in brackets. cPYR, Cytosolic pyruvate; MAL, malate; cOAA, cytosolic oxaloacetate; aKG, a-ketoglutarate; CIT, citrate;PYR, plastidic pyruvate; pMAL, plastidic malate; CitSyn, citrate synthase; mep: plastidic malic enzyme; CitLys, citrate lyase;pPYRt, pyruvate transporter; cPK, cytosolic pyruvate kinase.
found altered production of storage biomass, withprotein going from 14% to 47% of total biomass. Thechange in protein and associated metabolic fluxes in-dicated that seeds are not merely a receptacle forstored reserves but are dynamically involved ininfluencing final composition. Gln is a major source ofboth carbon and nitrogen for developing soybeans.Our culture experiments revealed that approximately10% to 23% of all carbon (32%–46% of amino acidcarbon and 9%–19% of carbon in fatty acids) and 63%to 91% of all nitrogen comes from Gln, values that aregreater than in other plant systems. Furthermore, thesedata support the hypothesis that seed nitrogen de-mand is greater than the available supply and maylimit protein yield (Sinclair and de Wit, 1975; Egli andBruening, 2007; Rotundo et al., 2009; Rotundo andWestgate, 2009).Storage reserves are generated by primary metabo-
lism, implying that carbon, energy, and redox alloca-tion are regulated differently in different plant seeds(e.g. maize [Zea mays], soybean, oilseed rape [Brassicanapus]). Correlations between the two pairs of proteinand yield and of protein and other reserves in soy-beans have been discussed (Wilcox and Shibles, 2001;Clemente and Cahoon, 2009), although associatedfluxes through primary metabolism have not consid-ered variations in carbon and nitrogen. While we havepreviously used 13C metabolic flux analysis to generateflux map descriptions of soybeans ‘Amsoy’, this studyprobed the influence of substrates on seed-filling me-tabolism (in soybean ‘Jack’) in order to better assessfluxes that direct seed reserve composition.
Limitations and Validation
Solving flux analysis problems is both a forward andinverse mathematical problem, involving relationshipsbetween parameters (fluxes) that can be nonlinear withhigh degrees of branching. The derivation of themaximum information about a flux map involves apriori sensitivity analysis. When possible, differentlabeling experiments are performed, but this is limitedby the commercial availability of labeled metabolitesand the biological relevance of substrates in vivo(Metallo et al., 2009). Past work dedicated to optimalexperimental design (Möllney et al., 1999; Libourelet al., 2007; Masakapalli et al., 2010) has specified thatthe choice and number of labeling experiments areimportant considerations that depend upon whetherall or only specific fluxes are of interest. Performing acombined labeling experiment (i.e. multiple labeledsubstrates per experiment) can provide nearly as muchinformation as separate labeling experiments andminimizes the number of experimental replicates(Libourel et al., 2007). However, the multiple labelingsources result in more complex labeling patterns thatare less intuitive and challenging to evaluate.Investigations using isotopic labeling contribute to
our understanding of metabolism and, when coupledwith metabolic flux analysis, can help uncover new
enzyme activities or describe unique pathway regula-tion (Schwender et al., 2004). MFA is also used toevaluate the impact of environmental (Williams et al.,2008) and genotypical (Spielbauer et al., 2006; Alonsoet al., 2007b; Lonien and Schwender, 2009) changes.However, conclusions from flux analyses remain afunction of the assumptions and conditions used inmodeling and experiments. Namely, the estimation offluxes requires pseudo-steady-state metabolism overthe labeling duration with a consistent environmentfor each set of experiments. Therefore, diurnal cyclesand temperature variations are not reflected in theseexperiments. Additionally, the media provided toembryo cultures may lack some micronutrients re-ceived in planta. These considerations are presumed tobe less critical, since the use of substrates at levelssimilar to those measured in planta (Hsu et al., 1984;Rainbird et al., 1984) combined with salts and vitamins(Obendorf et al., 1978) can capably mimic the pro-duction of storage reserves (Allen et al., 2009b). Em-bryo cultures have been used to study the metabolismof developing soybeans (Thompson et al., 1977;Obendorf et al., 1979; Hsu and Obendorf, 1982; Sriramet al., 2004; Allen et al., 2007, 2009b; Iyer et al., 2008).Furthermore, the changes in protein levels reportedhere are consistent with other studies that investigatednitrogen sources (Saravitz and Raper, 1995; Nakasathienet al., 2000; Pipolo et al., 2004). Therefore, flux esti-mates should be consistent with general features of inplanta seed metabolism and relevant for metabolicengineering efforts.
Additionally, inferred fluxes are derived numeri-cally by probing the mathematically feasible solutionspace posed through network constraints and, there-fore, represent “best estimates.” Evaluation of allpoints within a continuous solution space is not pos-sible. However, by providing label measurements, themodels consistently and rapidly converge to the samesolution from many different starting points. Reas-surance in flux estimates was also achieved by in-dependently validating the balance of nitrogen.Nitrogen, like carbon, must be conserved, but it is notused as a constraint for modeling. From modeled fluxvalues, we found that nitrogen uptake ranged from86% to 93% of the nitrogen used in metabolite gener-ation. The balance exceeded 100% in some cases whenthe SE in measured fluxes was considered (SupplementalData Set S11).
ATP Production Changes to Accommodate ProteinBiosynthetic Demands
Protein polymerization is an energetically expensiveprocess requiring approximately 4.3 units of ATP per aminoacid added to an elongating peptide (Stephanopoulos et al.,1998). The change in amino acid production and theaccompanying ATP expense of protein polymerizationwere compared between the altered fluxes (Fig. 5,thicker arrows), which resulted from altered Gln uptake.
The altered fluxes provided an additional 7.3 to8.6 mmol ATP mg21 dry weight depending upon thepresumed phosphate:oxygen relationship (Hinkle,2005). The biosynthetic fluxes to amino acids increasedby 1.5 mmol mg21 dry weight (between the 37:1 and13:1 C:N ratios). This increased amino acid polymeri-zation required an additional 6.45 mmol of ATP (i.e.1.50 3 4.3). Although cellular maintenance and futilecycles are not considered, the altered ATP demand(6.45 mmol mg21 dry weight) was less than the calcu-lated increase in ATP production (7.3–8.6 mmol mg21
dry weight), indicating that metabolism can accom-modate the increase in protein production.
Carbon Partitioning through Pyruvate for Oil and Protein
Fatty acid labeling derived from Gln doubles withincreased nitrogen provision (Fig. 4). The flux mapsindicated that this was a consequence of changes inplastidic pyruvate kinase activity relative to plastidicmalic enzyme and citrate lyase activities (Fig. 5; TableV; Supplemental Data Set S7). The flux through py-ruvate and to acetyl-CoA may be an important point ofregulation that can partially account for the reportednegative correlations between oil and protein (Wilcoxand Shibles, 2001), because carbon reallocated fromfatty acid biosynthesis to pyruvate-derived amino acidproduction could result in more dramatic changes inprotein levels. Additionally, acetyl-CoA is a centralnode of metabolism important to a number of sec-ondary metabolites. Some acetyl-CoA could be used toproduce saponins, sterols, and mevalonate-derivedproducts (Berhow et al., 2006; Kim et al., 2006) or to
decorate amino sugars, histones, or other proteins andpolymers.
The role of Gln in soybean carbon metabolism hasbeen noted (Allen et al., 2009b). Others have recentlysuggested the importance of malic enzyme for redoxprovision to fatty acids in maize (Alonso et al., 2011)and of ATP-citrate lyase in fatty acid elongation(Schwender et al., 2006) or fatty acid biosynthesis ofsoybean (Nelson and Rinne, 1975; Nelson and Rinne,1977a, 1977b) and oilseed rape (Rangasamy and Ratledge,2000). In comparison with other plant tissues analyzedby flux analysis (Table VII; Rontein et al., 2002;Schwender et al., 2006; Alonso et al., 2007a, 2010, 2011;Williams et al., 2008; Allen et al., 2009b; Lonien andSchwender, 2009; Xiong et al., 2010), modeled malicenzyme in soybean provides more carbon for oil (23%–29% of flux to plastidic pyruvate) than in other de-veloping seeds. Thus, systems that take up less Glnmay have alternate roles for anaplerotic reactions thatreflect evolved differences in carbon utilization strate-gies. In our models, soybean has both fluxes for malicenzyme that are comparable to the rate of Gln uptakeand higher ratios of Gln consumption relative to fattyacid biosynthesis, indicating that both are importantfor pyruvate-derived products (Table VII). Further-more, an increased demand for nitrogen throughaminotransferase reactions will generate organic acidsthat can serve as sources of carbon, such as malate andcitrate. Thus, the transport and cleavage of citrate alongwith the activities of pyruvate kinase and malic enzymecoordinate both glycolysis and sugar utilization withthe uptake of amino acids.
Malic enzyme, in combination with pyruvate dehydro-genase, yields acetyl-CoA and two reducing equivalents,
Table VII. Comparison of malic enzyme with other fluxes in other seeds and plant cells
The flux through plastidic malic enzyme [mep] or total malic enzyme [metot] was compared with otherfluxes as a percentage (e.g. 1003 [plastidic malic enzyme flux/plastidic pyruvate biosynthesis]). [fa], Fattyacid biosynthesis; [gln_upt], Gln uptake; [pyrp], plastidic pyruvate biosynthesis. Fluxes for calculatedratios were extracted from the literature as described in the footnotes.
Plant Species [mep]/[pyrp] [metot]/[gln_upt] [gln_upt]/[fa]
aSchwender et al. (2006). bWilliams et al. (2008). cXiong et al. (2010). dLonienand Schwender (2009). eAlonso et al. (2007a). fAlonso et al. (2011). gRontein et al.(2002). hAllen et al. (2009b) [pyruvate supply not compartmentalized]. iAlonso et al.(2010). jThis study.
which match the stoichiometric demands necessary tosustain fatty acid biosynthesis. Additionally, an in-crease in the production of pyruvate-derived aminoacids (Val, Ile, Lys, and Leu) for protein could comeat the expense of oil biosynthesis but relies less onpyruvate dehydrogenase and utilizes less NADPH.An increase in protein production could be compen-sated for by malic enzyme activity. However, in-creased flux through malic enzyme to fatty acidswould require an additional supply of ATP and re-duce carbon use efficiency by the generation of CO2.The calculated carbon conversion efficiencies of 85%to 87% for our C:N models are similar to previousembryo studies (Allen et al., 2009b) and consistentwith examples of carbon refixation in soybean re-productive tissues (Quebedeaux and Chollet, 1975;Sambo et al., 1977; Satterlee and Koller, 1984; Sugimotoet al., 1987; Willms et al., 1999; Allen et al., 2009b) andother legumes (Flinn et al., 1977; Furbank et al., 2004).Tissues that limit CO2 escape, such as the seed coat orpod wall, may serve to concentrate inorganic carbonand enhance its refixation via phosphoenolpyruvatecarboxylase or Rubisco, although these carbon-recoverymechanisms frequently require additional ATP. Todate, no studies have considered the combined fluxesthrough multiple tissues.
CONCLUSION
Three metabolic flux models associated with isotopiclabeling experiments over diverse carbon and nitrogenconditions demonstrated the plasticity of central car-bon metabolism. Maternally provided substrates co-ordinated with the operation of primary metabolismresulted in the production of different oil, protein, andcarbohydrate concentrations. Changes in protein levelswere accommodated by more modest differences influxes through metabolic steps. Notably, the fluxesfrom Gln to C4 acids and other amino acids generallyincreased as protein levels increased, indicating the useof additional carbon from Gln supplied by the media.The increased fluxes from Gln to C4 acids, aminoacids, and pyruvate-derived products, such as oil,further imply that sink strength does not limit proteinproduction in soybeans. The elasticity of central carbonmetabolism represents a significant impediment tometabolic engineering because the changes needed toachieve biotechnological goals may be subtle. Con-versely, this work implies that small changes in mul-tiple enzymatic steps can have a dramatic impact atthe phenotypic level, consistent with theories of dis-tributed control of metabolism.
MATERIALS AND METHODS
Labeled Isotopes
[U-13C5]Gln, [1,2-13C2]Glc, and [U-13C4]Asn were purchased from Sigma[U-14C6]Glc and [U-14C5]Gln were purchased from Moravek Biochemical.
[U-14C12]Suc and [U-14C4]Asn were purchased from American RadiolabeledChemicals.
Plant Material, Growth, and Culturing Conditions
Soybean seeds (Glycine max ‘Jack’) were obtained from the U.S. Departmentof Agriculture-Agricultural Research Service National Plant Germplasm Sys-tem. Three soybeans were planted in a 1-gallon pot containing Fafard 4M andmaintained in a greenhouse or growth chambers mimicking summer inSt. Louis. Pots were thinned to two seedlings after several weeks, and theremaining seeds were grown at 25°C to 27°C/21°C to 23°C day/night tem-peratures and maintained at more than 35% humidity. Sunlight was supple-mented with additional light (400–1,000 W m22) to maintain a 14-h-day/10-h-night photoperiod. Plants were watered daily and received Jack’s15-16-17 (JR Peters) fertilizer three times per week. Early in the R5 repro-ductive stage of embryo development (i.e. early seed-filling stage), pods wereharvested and directly placed on ice.
The pods were immediately surface sterilized by washing in 5% bleachfollowed by sterile water. Embryos (approximately 30–40 mg fresh weight and10 mg dry weight) were removed from pods, dissected from seed coats, andtransferred to sterile culture medium containing 150 mM Suc, 75 mM Glc,45 mM Gln, and 16 mM Asn, which represents the carbon and nitrogen sourcesfor the C:N ratio of 21:1. Other C:N ratios were varied as reported elsewhere inthis article. For each labeling experiment, the labeled substrate was providedas 100% of that particular carbon source (i.e. in the case of Gln labeling, allunlabeled Gln was supplanted by [U-13C5]Gln while other carbon sourcesremained unlabeled). A modified Linsmaier and Skoog medium (Thompsonet al., 1977; Hsu and Obendorf, 1982) was supplied along with Gamborg’svitamins (Sigma) and 5 mM MES buffer adjusted to pH 5.8. The salts and vi-tamins were identical for all cultures. Each embryo was cultured in a 250-mLErlenmeyer flask with a foam plug for 14 d at approximately 30 to 35 mmolm22 s21 continuous light at 26°C to 27°C. At the conclusion of the culturingperiod, embryos were washed and then quickly sliced into pieces, frozen inliquid nitrogen, lyophilized to dryness, and stored at 280°C until furtherprocessing.
Quantification of Protein, Starch, and Lipid
Protein was quantified by elemental C:N ratio analysis. The composition ofcarbon and nitrogen in biomass was determined at the Duke EnvironmentalStable Isotope Laboratory at Duke University by dry combustion using a CEInstruments NC2100 elemental analyzer (ThermoQuest Italia). From eachseed, 2 to 4 mg of tissue was accurately weighed and combusted at 900°C in anelemental analyzer in the presence of chemical catalysts to produce CO2 andNOx. The measured nitrogen fraction was converted to protein by multipli-cation using a factor for all cultures within the initial C:N curve as describedelsewhere in this article. This multiplication factor is commonly used forreporting protein and therefore appropriate for biological comparisons;however, for flux analysis, more accurate factors that reflect the actual aminoacid composition of soybeans were used. Factors of 5.05, 5.30, and 5.55 for thecultured C:N variations of 13:1, 21:1, and 37:1, respectively, were determinedexperimentally from amino acid analysis of molar composition. This calcula-tion assumes an equivalent amount of Gln to Glu and of Asn to Asp, which isconsistent with their prevalence in soybean storage protein amino acid se-quences. Amino acid compositional analysis was established by convertingamino acids to their AccQ-Tag derivatives (Waters) and measuring peaksrelative to external standards.
Amino acid quantification was performed by the Proteomics and MassSpectrometry Facility within the Donald Danforth Plant Science Center.Samples were hydrolyzed for 24 h at 116°C in the presence of 6 N HCl con-taining 0.5% phenol in sealed glass tubes, dried, and resuspended in 20 mM
HCl (20 mL). Derivatization with the AccQ-Tag reagent was performed per themanufacturer’s instructions (Waters), including the addition of 70 mL of AccQ-Fluor Borate buffer and 20 mL of derivatization reagent to 10 mL of eachsample. Following incubation for 1 min at room temperature, samples wereheated at 55°C for 10 min, separated and identified with standards, andquantified by UV detection at 260 nm using reverse-phase ultra-HPLC(UHPLC).
UHPLC was performed using a Waters Acquity Ultra Performance liquidchromatograph with the 2996 PDA UV detector. A 9.5-min UHPLC methodused the Waters proprietary AccQ-Tag Ultra column (2.1 3 100 mm) withgradient using 5% Waters proprietary buffer A in milli-Q water and 100%
Waters proprietary buffer B at a flow rate of 0.7 mL min21. The gradient wasinitiated with 99.9% buffer A/0.1% buffer B and held for 0.54 min, buffer Awas decreased to 90.9% in 5.2 min, further decreased to 78.8% in 2 min, thendecreased to 40.4% in 0.3 min, held for 0.64 min, after which the column wasregenerated and equilibrated.
Lipids were analyzed by transesterification to fatty acid methyl esters withsubsequent quantification using triheptadecanoin internal standard (Li et al.,2006). Briefly, seed biomass of approximately 5 to 10 mg was weighed andcombined with 5% sulfuric acid in methanol prepared directly before use.Butylated hydroxyltoluene (25 mL of a 0.2% solution in methanol) was addedto prevent oxidation. The reactions were incubated at 95°C for 2 h with oc-casional vortexing. After cooling, 1.5 mL of 0.9% NaCl (w/v) was added.Hexane was used to extract the methyl esters from the reaction liquid. Fattyacid methyl esters were concentrated by nitrogen evaporation and thenquantitated by gas chromatography-flame ionization detection. Gas chroma-tography employed a DB23 column (30 m, 0.25-mm i.d., 0.25-mm film; J&WScientific). The gas chromatograph was operated in a split mode (40:1), andthe flame ionization detector temperature was 260°C with an oven programthat ramped from 150°C to 240°C at a rate of 10°C min21 followed by aprogrammed hold time of 5 min. Peak area comparison with the internalstandard was used for quantification.
Starch was quantified enzymatically by measuring spectroscopic Glc ab-sorbance according to the manufacturer’s protocol (Megazyme), a modifiedversion of AOAC International Official method 996.11. Alternatively, biomassthat had been extracted for oil and protein measurements was hydrated byincubation in 0.1 M sodium acetate buffer, pH 4.8 to 5.0, at 121°C for 1 h.Amyloglucosidase, amylase, and isoamylase were added from a fresh stocksolution of 10 mg each in 15 mL of acetate buffer or using reagents providedby the manufacturer (Megazyme). After incubation for 1 h at 55°C, 1 mL ofethanol was added, and enzymes were heat denatured for 15 min at 95°C. Thesolution was centrifuged, and the supernatant was removed and extractedtwice more with 80% ethanol before spectroscopic measurement.
SDS-PAGE Analysis
Proteins from 2 mg mL21 dry weight of cultured soybeans were extractedwith 23 Laemmli sample buffer + 5% b-mercaptoethanol and boiled for15 min. Gels were processed either for equivalent amounts of dry weight (25 mg)or for equivalent amounts of protein loaded per lane (10 mg, as determined byprior total nitrogen analysis of dry material). Samples and SeeBlue_2Mr markers(Invitrogen) were separated on a 10-well, 4% to 12% Nu-PAGE gel with MOPSbuffer run at 200 V constant for 35 min. Protein bands were visualized withSimply Blue Coomassie blue stain (Invitrogen) for 2 h and destained with water.Bands were quantified using Genetix Gelpix analyzer.
Radiolabeled Embryo Culturing and Processing
Soy embryos were aseptically cultured for 14 d with [U-14C12]Suc, [U-14C6]Glc, [U-14C5]Gln, and [U-14C4]Asn provided in proportional representation ofthe molar carbon composition of the substrates in media. Embryos were re-moved from cultures, washed briefly with water, quickly sliced into smallpieces, frozen with liquid nitrogen, lyophilized, and then pulverized into afine powder with a bead mill (Retsch) and a 4-mm stainless-steel ball. Drypowder (10–15 mg) was placed into a 2-mL plastic screw cap tube and se-quentially extracted using a bead mill and centrifugation at each step. Allextractions were repeated four times for quantitative recovery, and superna-tants were combined unless indicated otherwise. Initially, the pellet wasextracted with 80% ethanol. The 80% ethanol extract was separated into waterand oil phases with the addition of equal volumes of chloroform and water.The oily chloroform phase was later combined with additional oil fractions,including two extractions with hexane:isopropanol:chloroform (2:1:3, v/v/v)followed by two extractions of hexane-isopropanol (v/v). The 80% ethanolfraction was further fractionated to separate unmetabolized neutral sugars,Gln and Asn taken up from the media from organic acids, remaining aminoacids, and solubilized hydrophobic proteins. Cationic, anionic, and neutralfractions were separated by ion-exchange chromatography (Yazdi-Samadiet al., 1977) using Dowex 50 and Dowex 1 columns (Sigma), with HPLCused to inspect the cationic fraction for hydrophobic proteins and amino acids.Protein was extracted with 7.5 M urea, 0.07% b-mercaptoethanol, and 10 mM
Tris, pH 8.1, twice, followed by two further extractions excluding the urea;aliquots were combined. The remaining pellet, which represents carbohy-drates, was solubilized with ScintiGest (Fisher Scientific) overnight at 50°C.
Each sample (0.5 mL) was counted by scintillation using Hionic-Fluor (Perkin-Elmer).
GC-MS Analyses of Isotopic Labeling
Protein was extracted from biomass using a buffer containing 10 mM
Tris, pH 8.5, 138 mM NaCl, 2.7 mM KCl, 295 mg L21 Na-EDTA, 700 mL ofb-mercaptoethanol, 202 mg L21 sodium azide, and 125 mg L21 SDS. Extracts wereprecipitated by the addition of one-tenth volume of 50% TCA (w/v) and in-cubated on ice for 30 min. The supernatant was discarded, and the pellet wascarefully washed in 1:1 ethanol:ether. After drying with nitrogen, proteinswere hydrolyzed by the addition of 6 N HCl in the presence of a nitrogenhead space at 100°C for 24 h. HCl was evaporated under a stream ofnitrogen. The amino acids were dried and derivatized with N-methyl-N-(tertbutyldimethylsilyl)-trifluoroacetamide (100 mL) in the presence of an equalvolume of acetonitrile. The derivatization ensued for 1 h at 120°C, after which analiquot was analyzed by GC-MS. Accepted fragments for label quantificationwere based upon standards and previous analyses (Antoniewicz et al., 2007).
For fatty acid labeling, dried seed tissue was ground in liquid nitrogen usinga mortar and pestle, and a 10- to 15-mg sample was weighed and homogenizedwith hexane:isopropanol (2:1, v/v) on a Retsch MM 301 bead mill at a fre-quency of 3,000 per min for 5 min. After centrifugation at 12,000g, the su-pernatant was decanted and the extraction process was repeated threeadditional times. Pooled extracts were dried and derivatized to butylamidesfor labeling analysis as described previously (Allen et al., 2007). Briefly, lipidswere amidated by reacting at 100°C with 2 mL of n-butylamine (Sigma) and3 mL of hexane as a cosolvent. Reactions were allowed to proceed for severaldays and quenched with the addition of concentrated HCl, resulting in phasepartitioning of unreacted butylamine-HCl and amide products. The hexanephase was collected and analyzed by GC-MS as detailed by Allen et al. (2007)using the same mass spectrometer as for amino acid label evaluation.
Metabolic Modeling
A flux model was built based upon biochemical reaction networks forcentral carbon metabolism in developing seeds with slight modification of aprevious soybean model to account for additional labeling experiments with[U-13C4]Asn. Implementation of the isotopomer model that included all carbonrearrangements within reactions, mass conservation of metabolic intermedi-ates, parameter (flux) fitting, and statistical and sensitivity analyses wereperformed using the INCA software platform under development (J.D.Young, Vanderbilt University; Young et al., 2008). The INCA software plat-form is MATLAB based, utilizing statistical and optimization toolboxes butwith additional in-house-developed algorithms. Identical to other isotopiclabeling-based metabolic flux analysis software, INCA requires the provisionof a stoichiometric description of the network model, individual experimentsthat indicate the form of the proffered label, mass spectrometer isotopic la-beling measurements, and direct flux measurements. INCA can performMonte Carlo or parameter continuation-based assessment of nonlinear CIsand is being developed for further extensions.
Flux model values were constrained by a network topology that imposedstoichiometric relationships between molecules and the measured biomasscomposition of embryos, including protein and oil, with the remainder at-tributed to carbohydrates such as cell wall and starch. 13C isotopic descriptionsprovided additional constraining information through the fitting process thatestablished the best estimates for fluxes from minimization of the sum ofsquared differences of all label measurements. The choice of free variables wasrandomly established through the software, and feasible starting points wereassigned by orthogonal projection of random flux values into the flux solutionspace (Schuster and Schuster, 1993; Young et al., 2008; Allen et al., 2009b).Labeled isotopomer measurements and labeled substrates entered into the modelwere corrected for the natural abundance of heteroatoms (i.e. nitrogen, oxygen,sulfur, silicon) as well as carbon that was not part of the labeling experiment (i.e.carbon in the derivative; Lee et al., 1991; Fernandez et al., 1996).
Statistical Analysis
Each experiment was performed with five biological replicates (n = 5). Foreach variant in C:N ratio, three labeling experiments were performed thatcomplement each other, for a total of 15 experiments per condition. However,biological replication assesses the precision of measurement but notnecessarily biases in processing or instrument measurement that impact
measurement accuracy. To assess the accuracy of the measurements, stan-dards of unlabeled metabolites were measured, and fragments from GC-MSwere chosen accordingly and in agreement with previous descriptions of ac-ceptable measurements from our laboratory (Allen et al., 2009b) as well asothers (Dauner and Sauer, 2000; Antoniewicz et al., 2007). Model simulationswere performed by assigning a minimal 0.25% error for all measurements thathad greater precision than this. CIs are reported for each flux estimate (95%) inaccordance with described methods (Antoniewicz et al., 2006).
Supplemental Data
The following materials are available in the online version of this article.
Supplemental Data Set S1. Changes in protein levels and fatty acidcomposition.
Supplemental Data Set S2. Proteomic analysis of soybean storage proteinsubunits.
Supplemental Data Set S3. Amino acid concentrations of culturedsoybeans.
Supplemental Data Set S4. Calculation of 13C labeling in biomassfractions.
Supplemental Data Set S5. 13C-labeling measurements.
Supplemental Data Set S6. Carbon allocation from Gln.
Supplemental Data Set S7. Metabolic flux maps, values, CIs, and reactiondescriptions.
Supplemental Data Set S8. Labeling in C4 dicarboxylic acids.
Supplemental Data Set S9. Description of the modeling process.
Supplemental Data Set S10. Labeling in His.
Supplemental Data Set S11. Balance of nitrogen.
ACKNOWLEDGMENTS
We gratefully acknowledge James Gierse for excellent technical help withexperiments and the Proteomics and Mass Spectrometry Facility at the DonaldDanforth Plant Science Center for amino acid analysis. We also thank multipleanonymous reviewers for helpful comments that improved the manuscript.Any product or trademark mentioned here does not imply a warranty,guarantee, or endorsement by the U.S. Department of Agriculture over othersuitable products.
Received July 7, 2012; accepted January 9, 2013; published January 11, 2013.
LITERATURE CITED
Adams CA, Broman TH, Rinne RW (1982) Use of [3,4-C]glucose to assessin vivo competition for phosphoenolpyruvate between phosphoenol-pyruvate carboxylase and pyruvate kinase in developing soybean seeds.Plant Cell Physiol 23: 959–965
Adams CA, Rinne RW (1981) Interactions of phosphoenolpyruvate car-boxylase and pyruvic kinase in developing soybean seeds. Plant CellPhysiol 22: 1011–1021
Allen DK, Laclair RW, Ohlrogge JB, Shachar-Hill Y (2012) Isotope label-ling of Rubisco subunits provides in vivo information on subcellularbiosynthesis and exchange of amino acids between compartments. PlantCell Environ 35: 1232–1244
Allen DK, Libourel IGL, Shachar-Hill Y (2009a) Metabolic flux analysis inplants: coping with complexity. Plant Cell Environ 32: 1241–1257
Allen DK, Ohlrogge JB, Shachar-Hill Y (2009b) The role of light in soybeanseed filling metabolism. Plant J 58: 220–234
Allen DK, Shachar-Hill Y, Ohlrogge JB (2007) Compartment-specificlabeling information in 13C metabolic flux analysis of plants. Phyto-chemistry 68: 2197–2210
Alonso AP, Dale VL, Shachar-Hill Y (2010) Understanding fatty acidsynthesis in developing maize embryos using metabolic flux analysis.Metab Eng 12: 488–497
Alonso AP, Goffman FD, Ohlrogge JB, Shachar-Hill Y (2007a) Carbonconversion efficiency and central metabolic fluxes in developing sun-flower (Helianthus annuus L.) embryos. Plant J 52: 296–308
Alonso AP, Raymond P, Hernould M, Rondeau-Mouro C, de Graaf A,Chourey P, Lahaye M, Shachar-Hill Y, Rolin D, Dieuaide-NoubhaniM (2007b) A metabolic flux analysis to study the role of sucrose synthasein the regulation of the carbon partitioning in central metabolism inmaize root tips. Metab Eng 9: 419–432
Alonso AP, Val DL, Shachar-Hill Y (2011) Central metabolic fluxes in theendosperm of developing maize seeds and their implications for meta-bolic engineering. Metab Eng 13: 96–107
Andre C, Froehlich JE, Moll MR, Benning C (2007) A heteromeric plastidicpyruvate kinase complex involved in seed oil biosynthesis in Arabi-dopsis. Plant Cell 19: 2006–2022
Antoniewicz MR, Kelleher JK, Stephanopoulos G (2006) Determination ofconfidence intervals of metabolic fluxes estimated from stable isotopemeasurements. Metab Eng 8: 324–337
Antoniewicz MR, Kelleher JK, Stephanopoulos G (2007) Accurate as-sessment of amino acid mass isotopomer distributions for metabolic fluxanalysis. Anal Chem 79: 7554–7559
Bates PD, Durrett TP, Ohlrogge JB, Pollard M (2009) Analysis of acylfluxes through multiple pathways of triacylglycerol synthesis in devel-oping soybean embryos. Plant Physiol 150: 55–72
Baxter CJ, Liu JL, Fernie AR, Sweetlove LJ (2007) Determination of met-abolic fluxes in a non-steady-state system. Phytochemistry 68: 2313–2319
Berhow MA, Kong SB, Vermillion KE, Duval SM (2006) Completequantification of group A and group B soyasaponins in soybeans. J AgricFood Chem 54: 2035–2044
Buchanan BB (1980) Role of light in the regulation of chloroplast enzymes.Annu Rev Plant Physiol Plant Mol Biol 31: 341–374
Buchanan BB, Luan S (2005) Redox regulation in the chloroplast thylakoidlumen: a new frontier in photosynthesis research. J Exp Bot 56: 1439–1447
Clemente TE, Cahoon EB (2009) Soybean oil: genetic approaches formodification of functionality and total content. Plant Physiol 151: 1030–1040
Dauner M, Bailey JE, Sauer U (2001) Metabolic flux analysis with a com-prehensive isotopomer model in Bacillus subtilis. Biotechnol Bioeng 76:144–156
Dauner M, Sauer U (2000) GC-MS analysis of amino acids rapidly providesrich information for isotopomer balancing. Biotechnol Prog 16: 642–649
Egli DB (1998) Seed Biology and the Yield of Grain Crops. CAB Interna-tional, New York
Egli DB, Bruening WP (2007) Accumulation of nitrogen and dry matter bysoybean seeds with genetic differences in protein concentration. CropSci 47: 359–366
Egli DB, Guffy RD, Meckel LW, Leggett JE (1985) The effect of source sinkalterations on soybean seed growth. Ann Bot (Lond) 55: 395–402
Etxeberria E, Pozueta-Romero J, Gonzalez P (2012) In and out of the plantstorage vacuole. Plant Sci 190: 52–61
Fabre F, Planchon C (2000) Nitrogen nutrition, yield and protein content insoybean. Plant Sci 152: 51–58
Fernandez CA, Des Rosiers C, Previs SF, David F, Brunengraber H (1996)Correction of 13C mass isotopomer distributions for natural stable iso-tope abundance. J Mass Spectrom 31: 255–262
Flinn AM, Atkins CA, Pate JS (1977) Significance of photosynthetic andrespiratory exchanges in the carbon economy of the developing peafruit. Plant Physiol 60: 412–418
Furbank RT, White R, Palta JA, Turner NC (2004) Internal recycling ofrespiratory CO2 in pods of chickpea (Cicer arietinum L.): the role of podwall, seed coat, and embryo. J Exp Bot 55: 1687–1696
Goffman FD, Alonso AP, Schwender J, Shachar-Hill Y, Ohlrogge JB(2005) Light enables a very high efficiency of carbon storage in devel-oping embryos of rapeseed. Plant Physiol 138: 2269–2279
Gout E, Bligny R, Pascal N, Douce R (1993) 13C nuclear magnetic reso-nance studies of malate and citrate synthesis and compartmentation inhigher plant cells. J Biol Chem 268: 3986–3992
Harada JJ, Barker SJ, Goldberg RB (1989) Soybean b-conglycinin genes areclustered in several DNA regions and are regulated by transcriptionaland posttranscriptional processes. Plant Cell 1: 415–425
Hayati R, Egli DB, Crafts-Brandner SJ (1996) Independence of nitrogensupply and seed growth in soybean: studies using an in vitro culturesystem. J Exp Bot 47: 33–40
Hernández-Sebastià C, Marsolais F, Saravitz C, Israel D, Dewey RE,Huber SC (2005) Free amino acid profiles suggest a possible role forasparagine in the control of storage-product accumulation in developingseeds of low- and high-protein soybean lines. J Exp Bot 56: 1951–1963
Hinkle PC (2005) P/O ratios of mitochondrial oxidative phosphorylation.Biochim Biophys Acta 1706: 1–11
Hsu FC, Bennett AB, Spanswick RM (1984) Concentrations of sucrose andnitrogenous compounds in the apoplast of developing soybean seedcoats and embryos. Plant Physiol 75: 181–186
Hsu FC, Obendorf RL (1982) Compositional analysis of in vitro maturedsoybean seeds. Plant Sci Lett 27: 129–135
Iyer VV, Sriram G, Fulton DB, Zhou R, Westgate ME, Shanks JV (2008)Metabolic flux maps comparing the effect of temperature on protein andoil biosynthesis in developing soybean cotyledons. Plant Cell Environ31: 506–517
Junker BH, Lonien J, Heady LE, Rogers A, Schwender J (2007) Paralleldetermination of enzyme activities and in vivo fluxes in Brassica napusembryos grown on organic or inorganic nitrogen source. Phytochemis-try 68: 2232–2242
Kim S-L, Berhow MA, Kim J-T, Chi H-Y, Lee S-J, Chung I-M (2006)Evaluation of soyasaponin, isoflavone, protein, lipid, and free sugaraccumulation in developing soybean seeds. J Agric Food Chem 54:10003–10010
Lee WNP, Byerley LO, Bergner EA, Edmond J (1991) Mass isotopomeranalysis: theoretical and practical considerations. Biol Mass Spectrom20: 451–458
Li YH, Beisson F, Pollard M, Ohlrogge J (2006) Oil content of Arabidopsisseeds: the influence of seed anatomy, light and plant-to-plant variation.Phytochemistry 67: 904–915
Libourel IGL, Gehan JP, Shachar-Hill Y (2007) Design of substrate labelfor steady state flux measurements in plant systems using the metabolicnetwork of Brassica napus embryos. Phytochemistry 68: 2211–2221
Linka N, Weber APM (2010) Intracellular metabolite transporters in plants.Mol Plant 3: 21–53
Lonien J, Schwender J (2009) Analysis of metabolic flux phenotypes fortwo Arabidopsis mutants with severe impairment in seed storage lipidsynthesis. Plant Physiol 151: 1617–1634
Martinoia E, Maeshima M, Neuhaus HE (2007) Vacuolar transporters andtheir essential role in plant metabolism. J Exp Bot 58: 83–102
Masakapalli SK, Le Lay P, Huddleston JE, Pollock NL, Kruger NJ,Ratcliffe RG (2010) Subcellular flux analysis of central metabolism in aheterotrophic Arabidopsis cell suspension using steady-state stableisotope labeling. Plant Physiol 152: 602–619
Metallo CM, Walther JL, Stephanopoulos G (2009) Evaluation of 13Cisotopic tracers for metabolic flux analysis in mammalian cells. J Bio-technol 144: 167–174
Möllney M, Wiechert W, Kownatzki D, de Graaf AA (1999) Bidirectionalreaction steps in metabolic networks. IV. Optimal design of isotopomerlabeling experiments. Biotechnol Bioeng 66: 86–103
Nakasathien S, Israel DW, Wilson RF, Kwanyuen P (2000) Regulation ofseed protein concentration in soybean by supra-optimal nitrogen sup-ply. Crop Sci 40: 1277–1284
Narvel JM, Fehr WR, Ininda J, Welke GA, Hammond EG, Duvick DN,Cianzio SR (2000) Inheritance of elevated palmitate in soybean seed oil.Crop Sci 40: 635–639
Nelson DR, Rinne RW (1975) Citrate cleavage enzymes from developingsoybean cotyledons: incorporation of citrate carbon into fatty acids.Plant Physiol 55: 69–72
Nelson DR, Rinne RW (1977a) In vivo citrate studies with developingsoybean cotyledons. Plant Cell Physiol 18: 399–404
Nelson DR, Rinne RW (1977b) The role of citrate in lipid synthesis indeveloping soybean cotyledons. Plant Cell Physiol 18: 1021–1027
Obendorf RL, Rytko GT, Byrne MC (1978) Soya bean seed growth andmaturation by in vitro pod culture. Ann Bot 51: 217–227
Obendorf RL, Wettlaufer SH (1984) Precocious germination during in vi-tro growth of soybean seeds. Plant Physiol 76: 1024–1028
Pipolo AE, Sinclair TR, Camara GMS (2004) Protein and oil concentrationof soybean seed cultured in vitro using nutrient solutions of differingglutamine concentration. Ann Appl Biol 144: 223–227
Quebedeaux B, Chollet R (1975) Growth and development of soybean(Glycine max [L.] Merr.) pods: CO2 exchange and enzyme studies. PlantPhysiol 55: 745–748
Rainbird RM, Thorne JH, Hardy RWF (1984) Role of amides, amino acids,and ureides in the nutrition of developing soybean seeds. Plant Physiol74: 329–334
Rangasamy D, Ratledge C (2000) Genetic enhancement of fatty acid syn-thesis by targeting rat liver ATP:citrate lyase into plastids of tobacco.Plant Physiol 122: 1231–1238
Rontein D, Dieuaide-Noubhani M, Dufourc EJ, Raymond P, Rolin D(2002) The metabolic architecture of plant cells: stability of central me-tabolism and flexibility of anabolic pathways during the growth cycle oftomato cells. J Biol Chem 277: 43948–43960
Rotundo JL, Borrás L, Westgate ME, Orf JH (2009) Relationship betweenassimilate supply per seed during seed filling and soybean seed com-position. Field Crops Res 112: 90–96
Rotundo JL, Westgate ME (2009) Meta-analysis of environmental effects onsoybean seed composition. Field Crops Res 110: 147–156
Rubel A, Rinne RW, Canvin DT (1972) Protein, oil, and fatty-acid in de-veloping soybean seeds. Crop Sci 12: 739–741
Ruuska SA, Schwender J, Ohlrogge JB (2004) The capacity of green oil-seeds to utilize photosynthesis to drive biosynthetic processes. PlantPhysiol 136: 2700–2709
Salo-Väänänen PP, Koivistoinen PE (1996) Determination of protein infoods: comparison of net protein and crude protein (N 3 6.25) values.Food Chem 57: 27–31
Sambo EY, Moorby J, Milthorpe FL (1977) Photosynthesis and respirationof developing soybean pods. Aust J Plant Physiol 4: 713–721
Saravitz CH, Raper CD (1995) Responses to sucrose and glutamine bysoybean embryos grown in vitro. Physiol Plant 93: 799–805
Satterlee LD, Koller HR (1984) Response of soybean fruit respiration tochanges in whole plant light and CO2 environment. Crop Sci 24: 1007–1010
Schuster R, Schuster S (1993) Refined algorithm and computer program forcalculating all non-negative fluxes admissible in steady states of bio-chemical reaction systems with or without some flux rates fixed. Com-put Appl Biosci 9: 79–85
Schwender J (2008) Metabolic flux analysis as a tool in metabolic engi-neering of plants. Curr Opin Biotechnol 19: 131–137
Schwender J, Goffman F, Ohlrogge JB, Shachar-Hill Y (2004) Rubiscowithout the Calvin cycle improves the carbon efficiency of developinggreen seeds. Nature 432: 779–782
Schwender J, Shachar-Hill Y, Ohlrogge JB (2006) Mitochondrial metabo-lism in developing embryos of Brassica napus. J Biol Chem 281: 34040–34047
Sinclair TR, de Wit CT (1975) Photosynthate and nitrogen requirements forseed production by various crops. Science 189: 565–567
Spielbauer G, Margl L, Hannah LC, Römisch W, Ettenhuber C, Bacher A,Gierl A, Eisenreich W, Genschel U (2006) Robustness of central car-bohydrate metabolism in developing maize kernels. Phytochemistry 67:1460–1475
Sriram G, Fulton DB, Iyer VV, Peterson JM, Zhou RL, Westgate ME,Spalding MH, Shanks JV (2004) Quantification of compartmentedmetabolic fluxes in developing soybean embryos by employing bio-synthetically directed fractional 13C labeling, two-dimensional [13C,1H]nuclear magnetic resonance, and comprehensive isotopomer balancing.Plant Physiol 136: 3043–3057
Stephanopoulos G, Aristidou A, Nielsen J (1998) Metabolic Engineering:Principles and Methodologies. Academic Press, San Diego
Sugimoto T, Tanaka K, Momma M, Saio K (1987) Photosynthetic activityin the developing cotyledon of soybean seeds. Agric Biol Chem 51: 1227–1230
Sweetlove LJ, Beard KFM, Nunes-Nesi A, Fernie AR, Ratcliffe RG (2010)Not just a circle: flux modes in the plant TCA cycle. Trends Plant Sci 15:462–470
Sweetlove LJ, Fell D, Fernie AR (2008) Getting to grips with the plantmetabolic network. Biochem J 409: 27–41
Thompson JF, Madison JT, Muenster AME (1977) In vitro culture of im-mature cotyledons of soya bean (Glycine max L Merr). Ann Bot (Lond)41: 29–39
Thorne JH (1980) Kinetics of C-photosynthate uptake by developing soy-bean fruit. Plant Physiol 65: 975–979
Thorne JH (1981) Morphology and ultrastructure of maternal seed tissues ofsoybean in relation to the import of photosynthate. Plant Physiol 67: 1016–1025
Troufflard S, Roscher A, Thomasset B, Barbotin JN, Rawsthorne S,Portais JC (2007) In vivo 13C NMR determines metabolic fluxes andsteady state in linseed embryos. Phytochemistry 68: 2341–2350
Wahrheit J, Nicolae A, Heinzle E (2011) Eukaryotic metabolism: measur-ing compartment fluxes. Biotechnol J 6: 1071–1085
Weber APM, Linka N (2011) Connecting the plastid: transporters of theplastid envelope and their role in linking plastidial with cytosolic me-tabolism. Annu Rev Plant Biol 62: 53–77
Wilcox JR (1998) Increasing seed protein in soybean with eight cycles ofrecurrent selection. Crop Sci 38: 1536–1540
Wilcox JR, Shibles RM (2001) Interrelationships among seed quality at-tributes in soybean. Crop Sci 41: 11–14
Williams TCR, Miguet L, Masakapalli SK, Kruger NJ, Sweetlove LJ,Ratcliffe RG (2008) Metabolic network fluxes in heterotrophic Arabi-dopsis cells: stability of the flux distribution under different oxygenationconditions. Plant Physiol 148: 704–718
Willms JR, Salon C, Layzell DB (1999) Evidence for light-stimulated fattyacid synthesis in soybean fruit. Plant Physiol 120: 1117–1128
Wilson RF (1987) Soybeans: Improvement, Production and Uses. AmericanSociety of Agronomy, Madison, WI
Xiong W, Liu L, Wu C, Yang C, Wu Q (2010) 13C-tracer and gaschromatography-mass spectrometry analyses reveal metabolic flux dis-tribution in the oleaginous microalga Chlorella protothecoides. PlantPhysiol 154: 1001–1011
Yaklich RW (2001) b-Conglycinin and glycinin in high-protein soybeanseeds. J Agric Food Chem 49: 729–735
Yazdi-Samadi B, Rinne RW, Seif RD (1977) Components of developingsoybean seeds: oil, protein, sugars, starch, organic acids, and aminoacids. Agron J 69: 481–486
Young JD, Walther JL, Antoniewicz MR, Yoo H, Stephanopoulos G (2008)An elementary metabolite unit (EMU) based method of isotopicallynonstationary flux analysis. Biotechnol Bioeng 99: 686–699
Zamboni N (2011) 13C metabolic flux analysis in complex systems. CurrOpin Biotechnol 22: 103–108
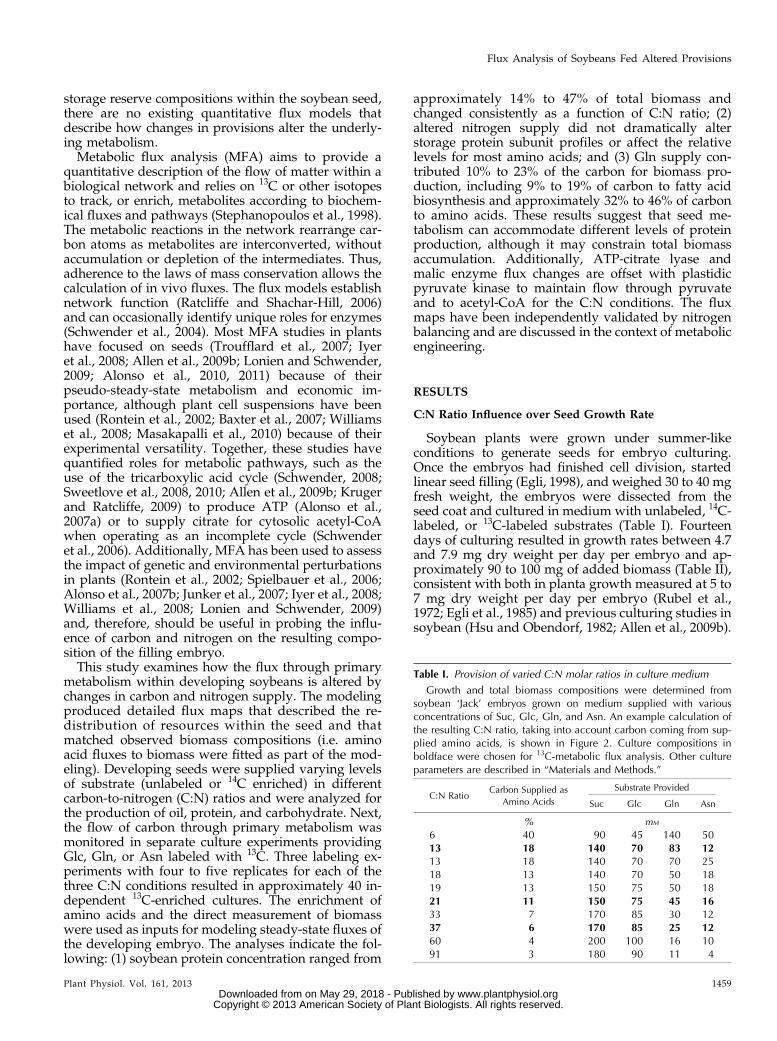
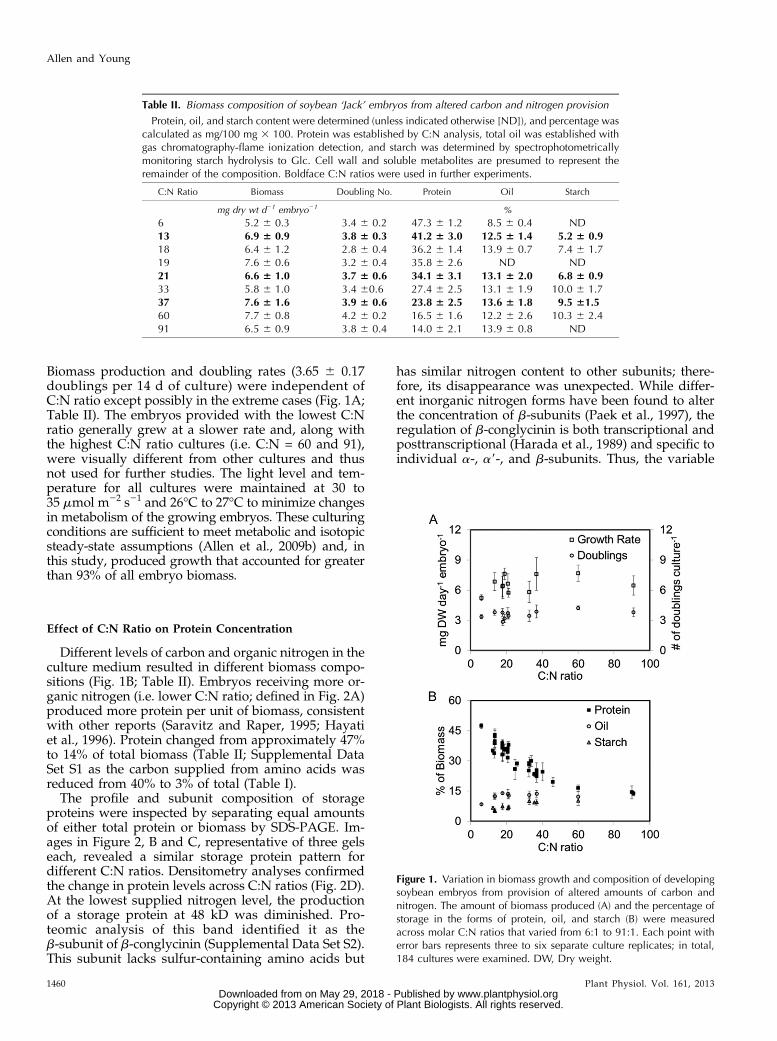

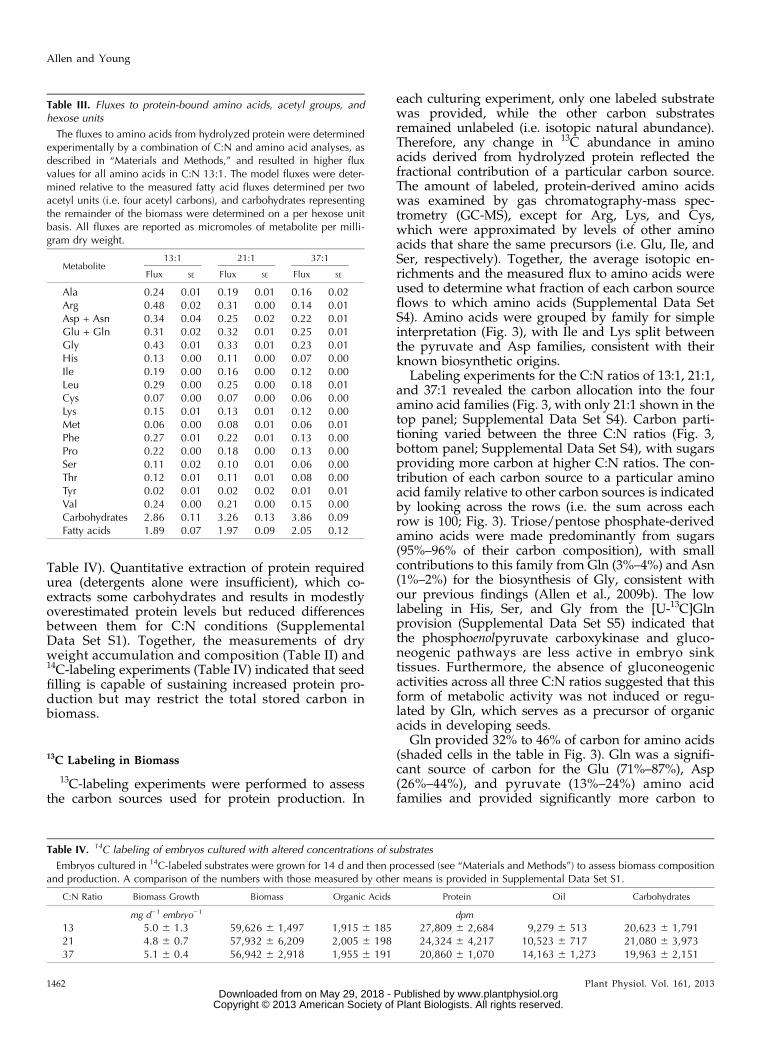
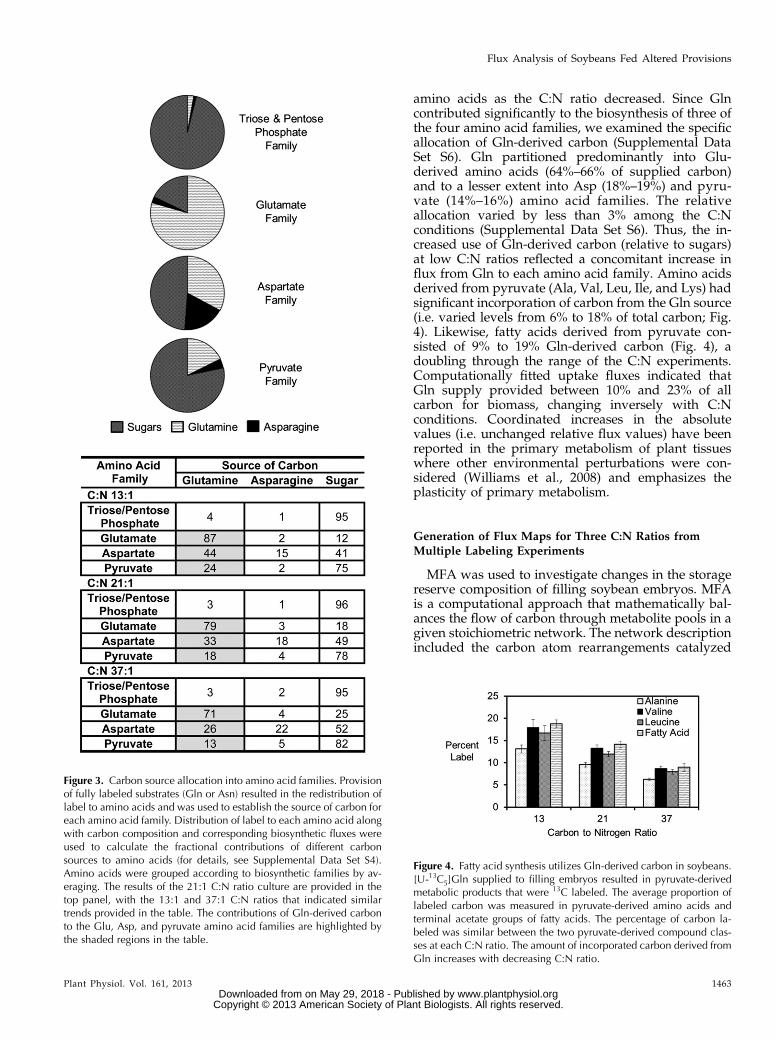


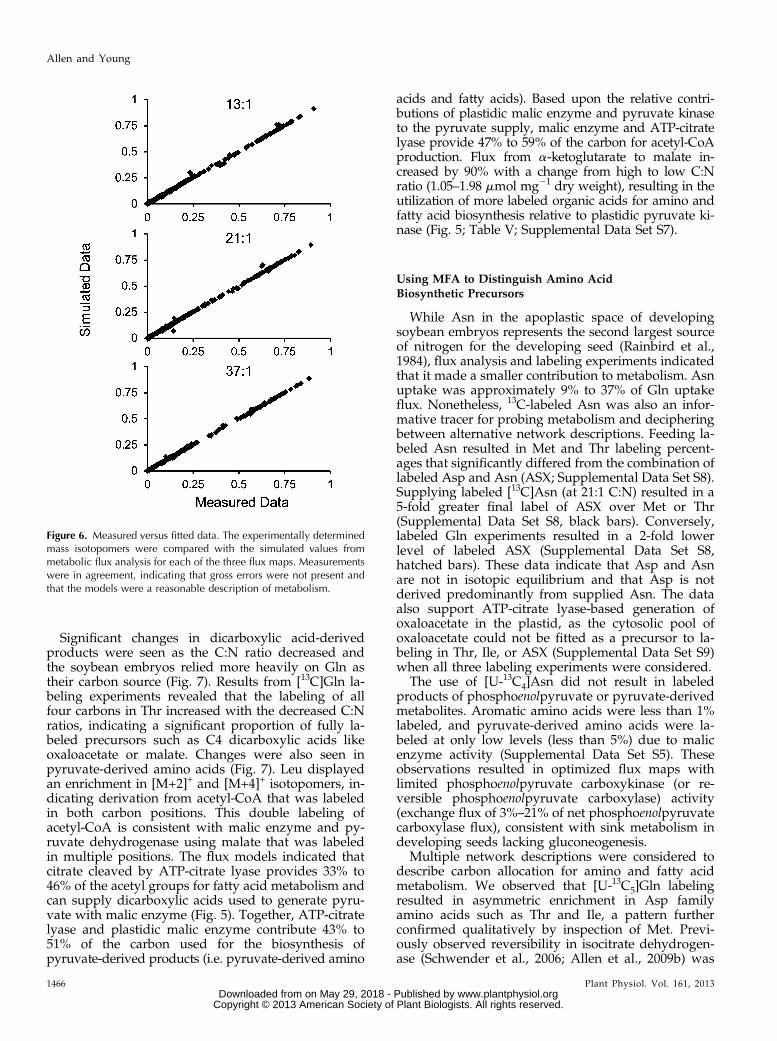
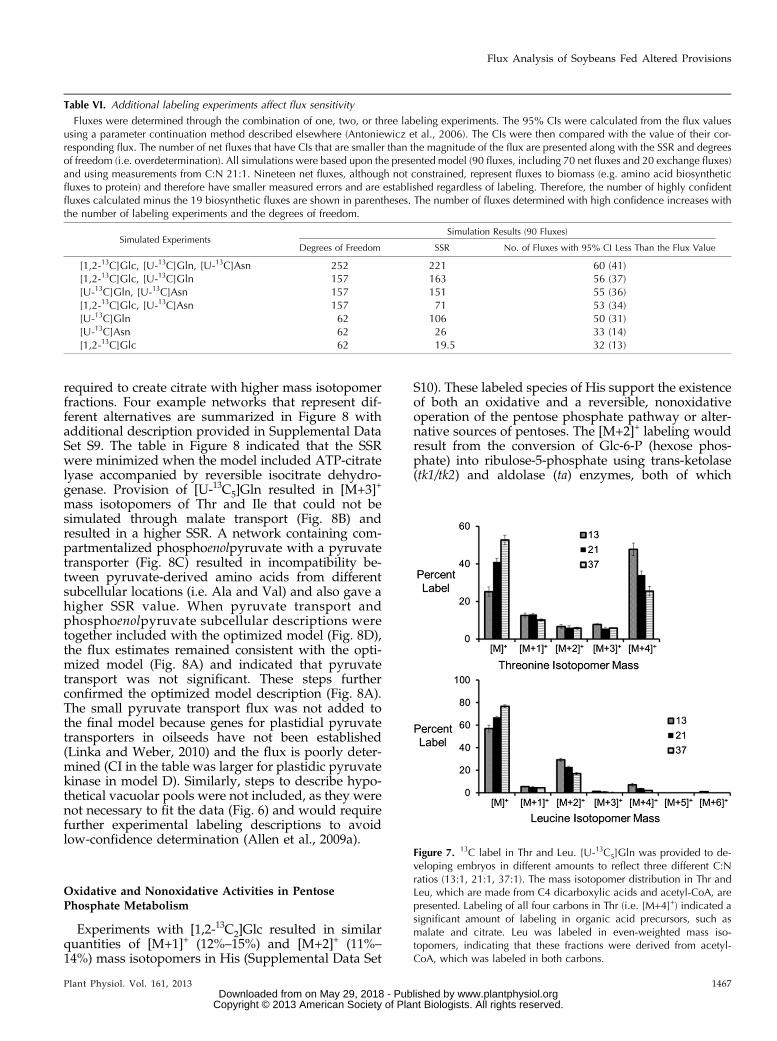
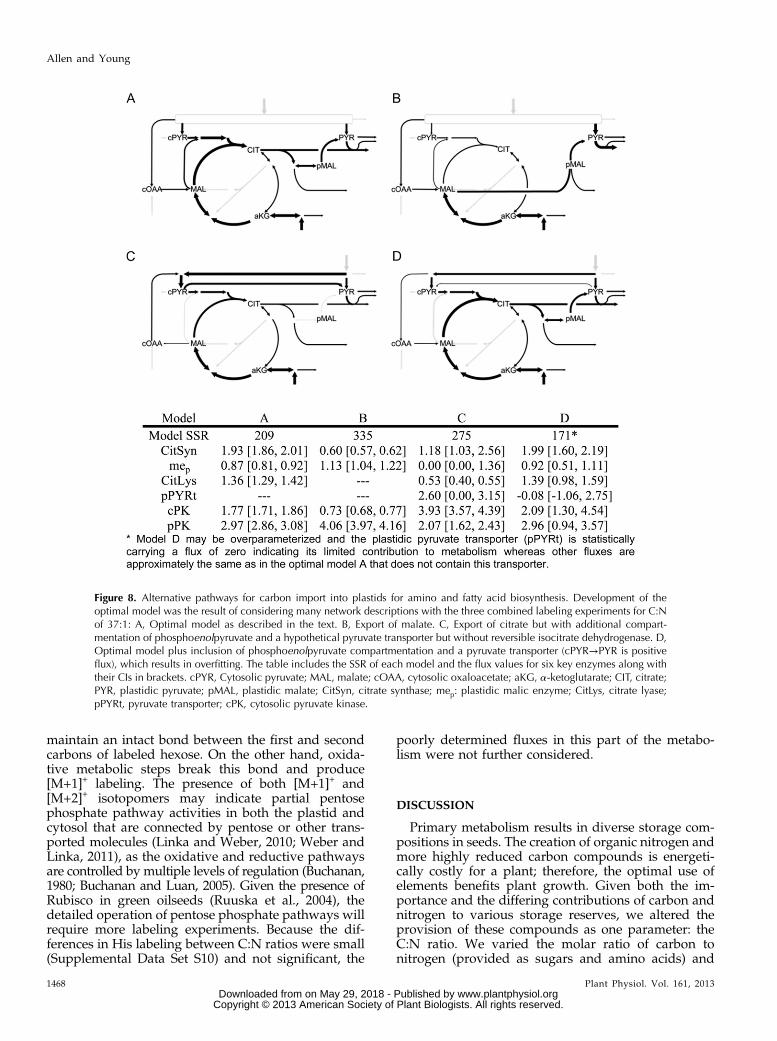
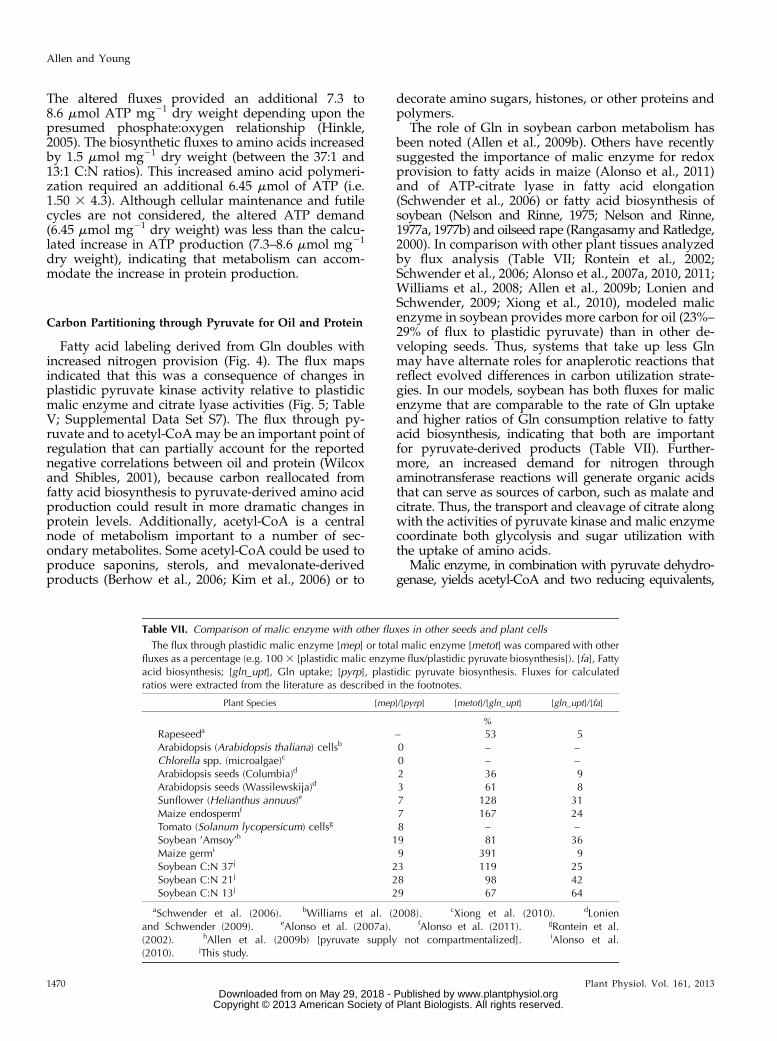


![Quantitative Metabolomics and Instationary 13C-Metabolic Flux Analysis ... · Recently, Jordà and co-workers [25] applied transient 13C metabolic flux analysis to analyze P. pastoris](https://static.documents.pub/doc/80x56/5eba3c5ae3b2371ce01c915b/quantitative-metabolomics-and-instationary-13c-metabolic-flux-analysis-recently.jpg)


![Metabolic Networks [Flux Balance Analysis]users.isy.liu.se/en/rt/claal20/SysBio2015/Notes_SysBio_2015_partE.… · 5 Metabolic Networks [Flux Balance Analysis] In this Chapter we](https://static.documents.pub/doc/80x56/5eba3bff36cf861e3c1ac9a1/metabolic-networks-flux-balance-analysisusersisyliuseenrtclaal20sysbio2015notessysbio2015parte.jpg)


![Genome-Based Metabolic Mapping and 13C Flux Analysis ... · Genome-Based Metabolic Mapping and13C Flux Analysis Reveal Systematic Properties of an Oleaginous Microalga Chlorella protothecoides1[OPEN]](https://static.documents.pub/doc/80x56/5eba3cbedcb7624207539cc5/genome-based-metabolic-mapping-and-13c-flux-analysis-genome-based-metabolic.jpg)


