Page 1
Carbon cost of plant nitrogen acquisition: global carboncycle impact from an improved plant nitrogen cycle inthe Community Land ModelMING J I E SH I 1 , 2 , J O SHUA B . F I SHER 1 , 2 , EDWARD R . BRZOSTEK 3 and RICHARD P. PHILLIPS4
1Jet Propulsion Laboratory, California Institute of Technology, 4800 Oak Grove Drive, Pasadena, CA 91109, USA, 2Joint Institute
for Regional Earth System Science and Engineering, University of California at Los Angeles, Los Angeles, CA 90095, USA,3Department of Biology, West Virginia University, 53 Campus Drive, Morgantown, WV 26506, USA, 4Department of Biology,
Indiana University, 702 N. Walnut Grove Avenue, Bloomington, IN 47405, USA
Abstract
Plants typically expend a significant portion of their available carbon (C) on nutrient acquisition – C that could other-
wise support growth. However, given that most global terrestrial biosphere models (TBMs) do not include the C cost
of nutrient acquisition, these models fail to represent current and future constraints to the land C sink. Here, we inte-
grated a plant productivity-optimized nutrient acquisition model – the Fixation and Uptake of Nitrogen Model – into
one of the most widely used TBMs, the Community Land Model. Global plant nitrogen (N) uptake is dynamically
simulated in the coupled model based on the C costs of N acquisition from mycorrhizal roots, nonmycorrhizal
roots, N-fixing microbes, and retranslocation (from senescing leaves). We find that at the global scale, plants spend
2.4 Pg C yr�1 to acquire 1.0 Pg N yr�1, and that the C cost of N acquisition leads to a downregulation of global net
primary production (NPP) by 13%. Mycorrhizal uptake represented the dominant pathway by which N is acquired,
accounting for ~66% of the N uptake by plants. Notably, roots associating with arbuscular mycorrhizal (AM) fungi –generally considered for their role in phosphorus (P) acquisition – are estimated to be the primary source of global
plant N uptake owing to the dominance of AM-associated plants in mid- and low-latitude biomes. Overall, our
coupled model improves the representations of NPP downregulation globally and generates spatially explicit
patterns of belowground C allocation, soil N uptake, and N retranslocation at the global scale. Such model improve-
ments are critical for predicting how plant responses to altered N availability (owing to N deposition, rising
atmospheric CO2, and warming temperatures) may impact the land C sink.
Keywords: carbon cost, Community Land Model, Fixation and Uptake of Nitrogen, mycorrhizal fungi, nitrogen uptake, net
primary production
Received 23 May 2015 and accepted 28 September 2015
Introduction
Terrestrial biosphere models (TBMs) simulate the
response of the terrestrial carbon (C) source/sink
dynamics to global change (Huntzinger et al., 2013;
Fisher et al., 2014; Zaehle et al., 2014). Given that recent
empirical evidence has reaffirmed the role of nutrient
availability in regulating net ecosystem production and
ecosystem C use efficiency at the global scale (Fisher
et al., 2012; Fern�andez-Mart�ınez et al., 2014), accurate
predictions of the land C sink in the future rely on how
well TBMs capture nutrient constraints (Wieder et al.,
2015). Many TBMs now include some representation of
the nitrogen (N) cycle, reflecting the importance of N as
the primary limiting nutrient across much of the Earth’s
land surface (Vitousek & Howarth, 1991; Lebauer &
Treseder, 2008). In the latest Multi-scale Synthesis and
Terrestrial Model Intercomparison Project (MsTMIP),
12 of 22 models included some representation of how
N constrains primary production (Huntzinger et al.,
2013). However, all of these models assume that N is
acquired at no C cost to plants. This directly contradicts
empirical evidence from individual plants that shows
that nearly every pathway by which a plant acquires N
requires a significant amount of energy; energy that
would otherwise be allocated as C to aboveground
growth. Thus, by omitting the C cost of N acquisition,
TBMs fail to capture a critical coupling of the C and N
cycles and as a consequence likely overestimate the size
and dynamic N-sensitivity of the land C sink (Ostle
et al., 2009; Fisher et al., 2010).
The energy or C costs for N acquisition come from
resorbing N from senescing leaves, fixing N2 gas into
biological reactive forms, or mobilizing and taking up
N that is locked in soil solution or organic matter
(Vitousek & Field, 1999; Rastetter et al., 2001; DickinsonCorrespondence: Joshua B. Fisher, tel. +1 818 354 0934, fax
+1 818 354 9476, e-mail: [email protected]
1299© 2015 John Wiley & Sons Ltd
Global Change Biology (2016) 22, 1299–1314, doi: 10.1111/gcb.13131
Page 2
et al., 2002; Vitousek et al., 2002; Wang et al., 2007).
While it is well-known that plants allocate C to acquire
N from more than one pathway, few studies have
quantified the variable costs of mobilizing N from each
pathway, or the degree to which such costs differ
dynamically within and among ecosystems. For exam-
ple, while trees allocate up to 20% of net primary pro-
duction (NPP) to both symbiotic and free-living
microbes at the root surface to increase their access to
N (H€ogberg & H€ogberg, 2002; Hobbie, 2006; Brzostek
et al., 2015), the amount of C allocated to N uptake from
fixation vs. mycorrhizal uptake can vary by a factor of
two depending on stand age, soil fertility, or the domi-
nant tree species (Brzostek et al., 2014). Moreover, as
the availability of N in a given ecosystem declines, the
C costs of taking up N increases, leading to a smaller
return of N per unit C invested (Fisher et al., 2010;
Brzostek et al., 2014). Thus, ‘N-limitation’ is a function
of two dynamics: (i) minimal N available in the soil; or,
(ii) available N, but not enough C to acquire it. Most
TBMs are missing the second dynamic (Thornton et al.,
2007, 2009; Ostle et al., 2009).
To account for the lack of a C cost to N acquisition in
TBMs, Fisher et al. (2010) developed the Fixation and
Uptake of Nitrogen (FUN) model. FUN is grounded in
optimal allocation theory whereby plants optimize the
allocation of C used to acquire N from the soil (directly
through roots or from mycorrhizal symbionts), senesc-
ing leaves, and symbiotic biological N fixation (BNF) to
maximize growth (Bloom et al., 1985; Rastetter et al.,
1997). In contrast to other efforts, FUN was explicitly
developed to be coupled into TBMs and as a result it
has relatively few required model inputs (e.g., tempera-
ture, NPP, and leaf N) and parameters. FUN is also
highly modular leading to rapid model development.
Brzostek et al. (2014) showed that integrating C–Ntrade-offs between the two major types of fungi that
plants associate with – arbuscular mycorrhizal (AM) or
ectomycorrhizal (ECM) fungi – into FUN2.0 improved
the dynamic predictions of the N retranslocated from
leaves and taken up from the soil. While these improve-
ments were validated against six forested sites (includ-
ing four experimental free air CO2 enrichment or FACE
sites), the global implications on the land C sink remain
to be tested.
Here, we coupled FUN2.0 into the Community Land
Model version 4.0 (CLM4.0) to examine the sensitivity
of the land C sink to a dynamic C cost of N acquisition
that varies across plant functional types (PFTs). We
evaluated modern era global model runs to address the
following questions in the updated model: (i) Which
ecosystems take up the most N and which are the most
N-limited? (ii) How does the C cost of N acquisition
vary spatially and temporally? (iii) How sensitive is the
land C sink to a dynamic prediction of the C cost of N
acquisition?
Materials and methods
Model description
Fixation and Uptake of Nitrogen is a mathematical and com-
putational model of plant N acquisition (Fisher et al., 2010). In
the original FUN1.0, plants obtain N through the following
pathways: (i) passive uptake, (ii) active uptake, (iii) retranslo-
cation, and (iv) symbiotic BNF, which are briefly described
here (see Fisher et al., 2010 for full model description). Passive
uptake refers to plants taking up soluble N through the tran-
spiration stream at no C cost to the plant. It varies as a func-
tion of transpiration rates and the amount of mineral N
dissolved in the soil. Active N uptake encapsulates the energy
needed to move N into root cells and the C expended into the
soil to prime nutrient mobilization from soil organic matter
(SOM). The C spent on active N uptake decreases as root bio-
mass or soil N availability increase. Retranslocation is the N
resorption in leaves before senescence (Fisher et al., 2010); N
resorption needs C to synthesize the enzymes and regulatory
elements and to drive the translocation stream (Holopainen &
Peltonen, 2002; Wright & Westoby, 2003). The cost of
retranslocation is modeled to increase as leaf N decreases
(Brzostek et al., 2014). Symbiotic BNF is the process by which
atmospheric N is converted into ammonium. The cost of sym-
biotic BNF is modeled to vary as a function of temperature
based on empirical relationships between temperature and
nitrogenase activity (Houlton et al., 2008).
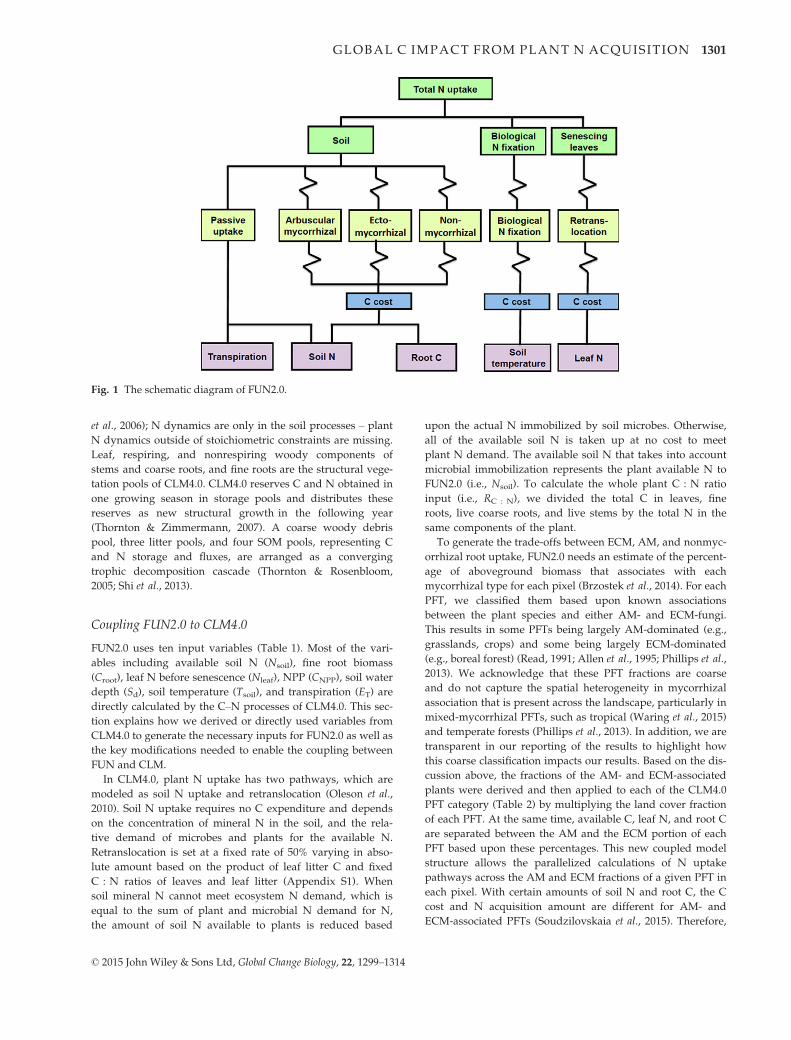
The modularity of FUN allows it to be easily modified.
FUN2.0 (Brzostek et al., 2014) included two main improve-
ments: (i) integrated trade-offs between ECM, AM, and non-
mycorrhizal roots in their C costs of N acquisition and (ii) a
resistance network to allow simultaneous uptake across all
pathways (Fig. 1). In FUN2.0, when soil N is relatively abun-
dant, plants supporting AM have the lowest C costs; when soil
N is limiting, plants supporting ECM have the most optimal
strategy. At extremely high levels of soil N (i.e., at the level of
fertilized agricultural fields), passive and nonmycorrhizal root
uptake dominates (Cai et al., 2015). Each pathway occupies
positions in the root biomass and N availability space where it
is the optimal strategy for taking up N from the soil. Both
Fisher et al. (2010) and Brzostek et al. (2014) stated an assumed
nonpreference for the uptake of ammonium (NHþ4 ) and nitrate
(NO�3 ) in the two FUN model versions, as it is still unclear
how generalizable plant preference for uptake of NHþ4 , NO�
3 ,
and dissolved organic N is at the global scale (Falkengren-
Grerup, 1995; Marschner, 1995; Nordin et al., 2001; Jones et al.,
2005).
The full TBM used in this study is CLM4.0 (Oleson et al.,
2010; Lawrence et al., 2011), which is the land component of
the Community Earth System Model (CESM) (Gent et al.,
2011). Specifically, we use CLM4.0 with C and N dynamics
(i.e., CLM4.0CN), which was originally developed by integrat-
ing the Biome-BGC model (Thornton et al., 2002) into CLM
version 3.0 (Oleson et al., 2004; Bonan & Levis, 2006; Dickinson
© 2015 John Wiley & Sons Ltd, Global Change Biology, 22, 1299–1314
1300 M. SHI et al.
Page 3
et al., 2006); N dynamics are only in the soil processes – plant
N dynamics outside of stoichiometric constraints are missing.
Leaf, respiring, and nonrespiring woody components of
stems and coarse roots, and fine roots are the structural vege-
tation pools of CLM4.0. CLM4.0 reserves C and N obtained in
one growing season in storage pools and distributes these
reserves as new structural growth in the following year
(Thornton & Zimmermann, 2007). A coarse woody debris
pool, three litter pools, and four SOM pools, representing C
and N storage and fluxes, are arranged as a converging
trophic decomposition cascade (Thornton & Rosenbloom,
2005; Shi et al., 2013).
Coupling FUN2.0 to CLM4.0
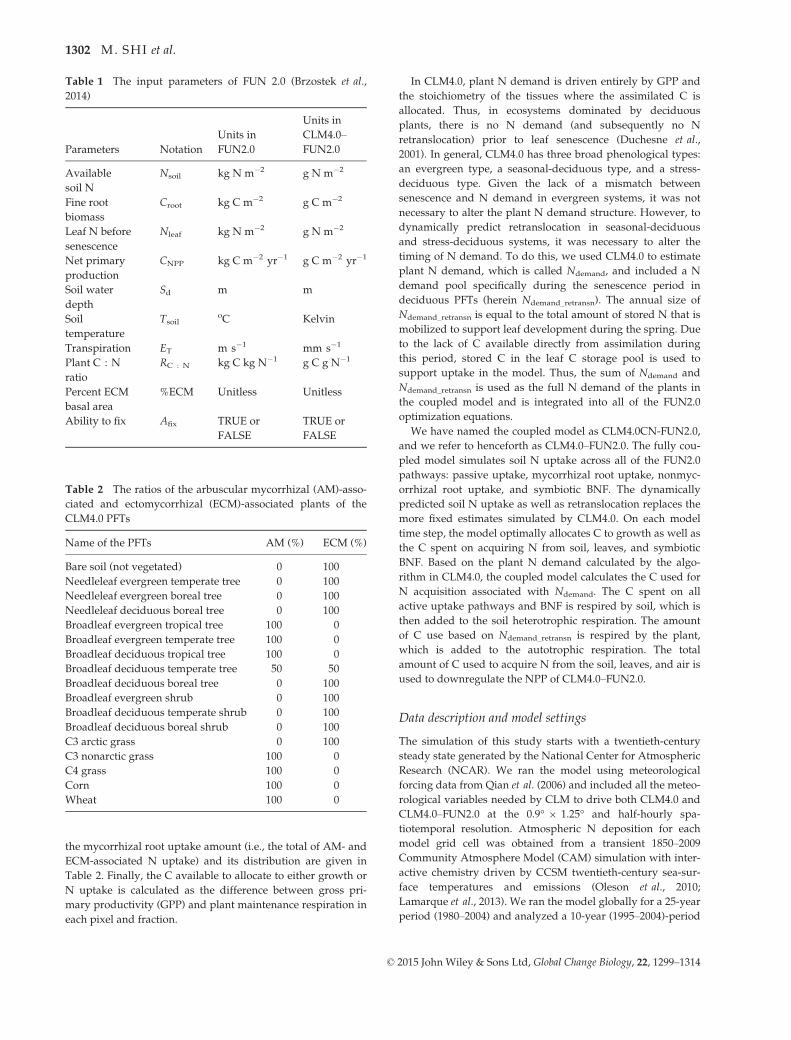
FUN2.0 uses ten input variables (Table 1). Most of the vari-
ables including available soil N (Nsoil), fine root biomass
(Croot), leaf N before senescence (Nleaf), NPP (CNPP), soil water
depth (Sd), soil temperature (Tsoil), and transpiration (ET) are
directly calculated by the C–N processes of CLM4.0. This sec-
tion explains how we derived or directly used variables from
CLM4.0 to generate the necessary inputs for FUN2.0 as well as
the key modifications needed to enable the coupling between
FUN and CLM.
In CLM4.0, plant N uptake has two pathways, which are
modeled as soil N uptake and retranslocation (Oleson et al.,
2010). Soil N uptake requires no C expenditure and depends
on the concentration of mineral N in the soil, and the rela-
tive demand of microbes and plants for the available N.
Retranslocation is set at a fixed rate of 50% varying in abso-
lute amount based on the product of leaf litter C and fixed
C : N ratios of leaves and leaf litter (Appendix S1). When
soil mineral N cannot meet ecosystem N demand, which is
equal to the sum of plant and microbial N demand for N,
the amount of soil N available to plants is reduced based
upon the actual N immobilized by soil microbes. Otherwise,
all of the available soil N is taken up at no cost to meet
plant N demand. The available soil N that takes into account
microbial immobilization represents the plant available N to
FUN2.0 (i.e., Nsoil). To calculate the whole plant C : N ratio
input (i.e., RC : N), we divided the total C in leaves, fine
roots, live coarse roots, and live stems by the total N in the
same components of the plant.
To generate the trade-offs between ECM, AM, and nonmyc-
orrhizal root uptake, FUN2.0 needs an estimate of the percent-
age of aboveground biomass that associates with each
mycorrhizal type for each pixel (Brzostek et al., 2014). For each
PFT, we classified them based upon known associations
between the plant species and either AM- and ECM-fungi.
This results in some PFTs being largely AM-dominated (e.g.,
grasslands, crops) and some being largely ECM-dominated
(e.g., boreal forest) (Read, 1991; Allen et al., 1995; Phillips et al.,
2013). We acknowledge that these PFT fractions are coarse
and do not capture the spatial heterogeneity in mycorrhizal
association that is present across the landscape, particularly in
mixed-mycorrhizal PFTs, such as tropical (Waring et al., 2015)
and temperate forests (Phillips et al., 2013). In addition, we are
transparent in our reporting of the results to highlight how
this coarse classification impacts our results. Based on the dis-
cussion above, the fractions of the AM- and ECM-associated
plants were derived and then applied to each of the CLM4.0
PFT category (Table 2) by multiplying the land cover fraction
of each PFT. At the same time, available C, leaf N, and root C
are separated between the AM and the ECM portion of each
PFT based upon these percentages. This new coupled model
structure allows the parallelized calculations of N uptake
pathways across the AM and ECM fractions of a given PFT in
each pixel. With certain amounts of soil N and root C, the C
cost and N acquisition amount are different for AM- and
ECM-associated PFTs (Soudzilovskaia et al., 2015). Therefore,
Fig. 1 The schematic diagram of FUN2.0.
© 2015 John Wiley & Sons Ltd, Global Change Biology, 22, 1299–1314
GLOBAL C IMPACT FROM PLANT N ACQUISITION 1301
Page 4
the mycorrhizal root uptake amount (i.e., the total of AM- and
ECM-associated N uptake) and its distribution are given in
Table 2. Finally, the C available to allocate to either growth or
N uptake is calculated as the difference between gross pri-
mary productivity (GPP) and plant maintenance respiration in
each pixel and fraction.
In CLM4.0, plant N demand is driven entirely by GPP and
the stoichiometry of the tissues where the assimilated C is
allocated. Thus, in ecosystems dominated by deciduous
plants, there is no N demand (and subsequently no N
retranslocation) prior to leaf senescence (Duchesne et al.,
2001). In general, CLM4.0 has three broad phenological types:
an evergreen type, a seasonal-deciduous type, and a stress-
deciduous type. Given the lack of a mismatch between
senescence and N demand in evergreen systems, it was not
necessary to alter the plant N demand structure. However, to
dynamically predict retranslocation in seasonal-deciduous
and stress-deciduous systems, it was necessary to alter the
timing of N demand. To do this, we used CLM4.0 to estimate
plant N demand, which is called Ndemand, and included a N
demand pool specifically during the senescence period in
deciduous PFTs (herein Ndemand_retransn). The annual size of
Ndemand_retransn is equal to the total amount of stored N that is
mobilized to support leaf development during the spring. Due
to the lack of C available directly from assimilation during
this period, stored C in the leaf C storage pool is used to
support uptake in the model. Thus, the sum of Ndemand and
Ndemand_retransn is used as the full N demand of the plants in
the coupled model and is integrated into all of the FUN2.0
optimization equations.
We have named the coupled model as CLM4.0CN-FUN2.0,
and we refer to henceforth as CLM4.0–FUN2.0. The fully cou-
pled model simulates soil N uptake across all of the FUN2.0
pathways: passive uptake, mycorrhizal root uptake, nonmyc-
orrhizal root uptake, and symbiotic BNF. The dynamically
predicted soil N uptake as well as retranslocation replaces the
more fixed estimates simulated by CLM4.0. On each model
time step, the model optimally allocates C to growth as well as
the C spent on acquiring N from soil, leaves, and symbiotic
BNF. Based on the plant N demand calculated by the algo-
rithm in CLM4.0, the coupled model calculates the C used for
N acquisition associated with Ndemand. The C spent on all
active uptake pathways and BNF is respired by soil, which is
then added to the soil heterotrophic respiration. The amount
of C use based on Ndemand_retransn is respired by the plant,
which is added to the autotrophic respiration. The total
amount of C used to acquire N from the soil, leaves, and air is
used to downregulate the NPP of CLM4.0–FUN2.0.
Data description and model settings
The simulation of this study starts with a twentieth-century
steady state generated by the National Center for Atmospheric
Research (NCAR). We ran the model using meteorological
forcing data from Qian et al. (2006) and included all the meteo-
rological variables needed by CLM to drive both CLM4.0 and
CLM4.0–FUN2.0 at the 0.9° 9 1.25° and half-hourly spa-
tiotemporal resolution. Atmospheric N deposition for each
model grid cell was obtained from a transient 1850–2009Community Atmosphere Model (CAM) simulation with inter-
active chemistry driven by CCSM twentieth-century sea-sur-
face temperatures and emissions (Oleson et al., 2010;
Lamarque et al., 2013). We ran the model globally for a 25-year
period (1980–2004) and analyzed a 10-year (1995–2004)-period
Table 1 The input parameters of FUN 2.0 (Brzostek et al.,
2014)
Parameters Notation
Units in
FUN2.0
Units in
CLM4.0–
FUN2.0
Available
soil N
Nsoil kg N m�2 g N m�2
Fine root
biomass
Croot kg C m�2 g C m�2
Leaf N before
senescence
Nleaf kg N m�2 g N m�2
Net primary
production
CNPP kg C m�2 yr�1 g C m�2 yr�1
Soil water
depth
Sd m m
Soil
temperature
TsoiloC Kelvin
Transpiration ET m s�1 mm s�1
Plant C : N
ratio
RC : N kg C kg N�1 g C g N�1
Percent ECM
basal area
%ECM Unitless Unitless
Ability to fix Afix TRUE or
FALSE
TRUE or
FALSE
Table 2 The ratios of the arbuscular mycorrhizal (AM)-asso-
ciated and ectomycorrhizal (ECM)-associated plants of the
CLM4.0 PFTs
Name of the PFTs AM (%) ECM (%)
Bare soil (not vegetated) 0 100
Needleleaf evergreen temperate tree 0 100
Needleleaf evergreen boreal tree 0 100
Needleleaf deciduous boreal tree 0 100
Broadleaf evergreen tropical tree 100 0
Broadleaf evergreen temperate tree 100 0
Broadleaf deciduous tropical tree 100 0
Broadleaf deciduous temperate tree 50 50
Broadleaf deciduous boreal tree 0 100
Broadleaf evergreen shrub 0 100
Broadleaf deciduous temperate shrub 0 100
Broadleaf deciduous boreal shrub 0 100
C3 arctic grass 0 100
C3 nonarctic grass 100 0
C4 grass 100 0
Corn 100 0
Wheat 100 0
© 2015 John Wiley & Sons Ltd, Global Change Biology, 22, 1299–1314
1302 M. SHI et al.
Page 5
result. For global validation, we used a new global nutrient
limitation product that is derived from remote sensing of
evapotranspiration and plant productivity (Fisher et al., 2012)
and analyzed whether the downregulation of NPP predicted
by CLM4.0–FUN2.0 agreed with this product. However, as we
note later in the Discussion, this product includes both N and
P limitations, so is not directly comparable to our N-only limi-
tation; we use this product only qualitatively in comparison.
Results
Which ecosystems take up the most N and which are themost N-limited?
Globally, both the amount of N uptake and the path-
way of N acquisition varied as a function of ecosys-
tem productivity and dominant mycorrhizal type.
CLM4.0–FUN2.0 simulated the mean annual global
total N uptake of 1023.9 Tg N yr�1, compared to that
simulated by CLM4.0 of 1203.8 Tg N yr�1, a difference
of 15%. Global total passive N uptake through the
transpiration stream is minor, amounting to 0.7 Tg N
yr�1, which is less than 1% of the global total N
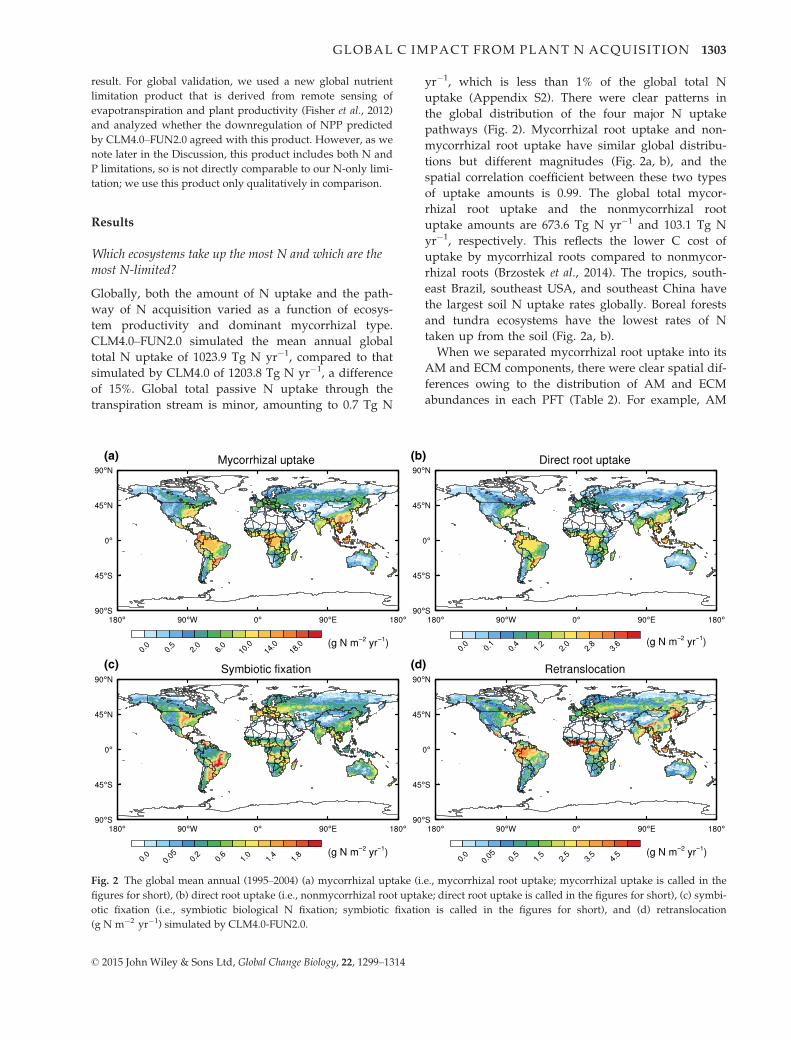
uptake (Appendix S2). There were clear patterns in
the global distribution of the four major N uptake
pathways (Fig. 2). Mycorrhizal root uptake and non-
mycorrhizal root uptake have similar global distribu-
tions but different magnitudes (Fig. 2a, b), and the
spatial correlation coefficient between these two types
of uptake amounts is 0.99. The global total mycor-
rhizal root uptake and the nonmycorrhizal root
uptake amounts are 673.6 Tg N yr�1 and 103.1 Tg N
yr�1, respectively. This reflects the lower C cost of
uptake by mycorrhizal roots compared to nonmycor-
rhizal roots (Brzostek et al., 2014). The tropics, south-
east Brazil, southeast USA, and southeast China have
the largest soil N uptake rates globally. Boreal forests
and tundra ecosystems have the lowest rates of N
taken up from the soil (Fig. 2a, b).
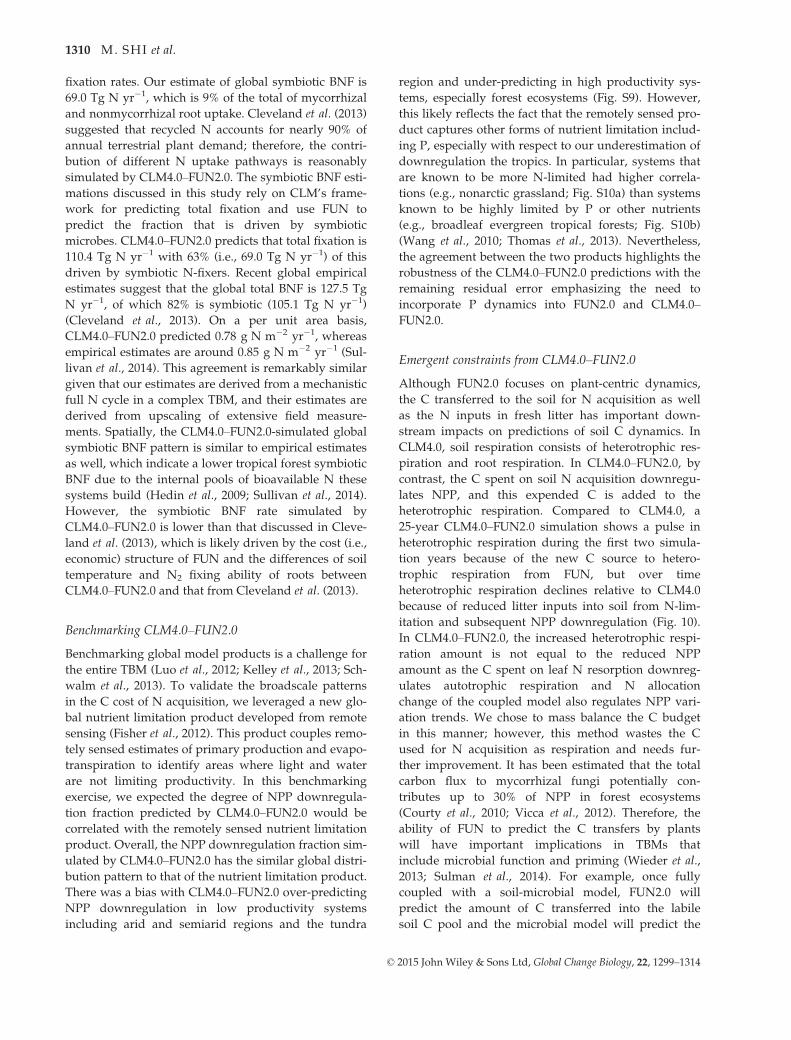
When we separated mycorrhizal root uptake into its
AM and ECM components, there were clear spatial dif-
ferences owing to the distribution of AM and ECM
abundances in each PFT (Table 2). For example, AM
(a) (b)
(c) (d)
Fig. 2 The global mean annual (1995–2004) (a) mycorrhizal uptake (i.e., mycorrhizal root uptake; mycorrhizal uptake is called in the
figures for short), (b) direct root uptake (i.e., nonmycorrhizal root uptake; direct root uptake is called in the figures for short), (c) symbi-
otic fixation (i.e., symbiotic biological N fixation; symbiotic fixation is called in the figures for short), and (d) retranslocation
(g N m�2 yr�1) simulated by CLM4.0-FUN2.0.
© 2015 John Wiley & Sons Ltd, Global Change Biology, 22, 1299–1314
GLOBAL C IMPACT FROM PLANT N ACQUISITION 1303
Page 6
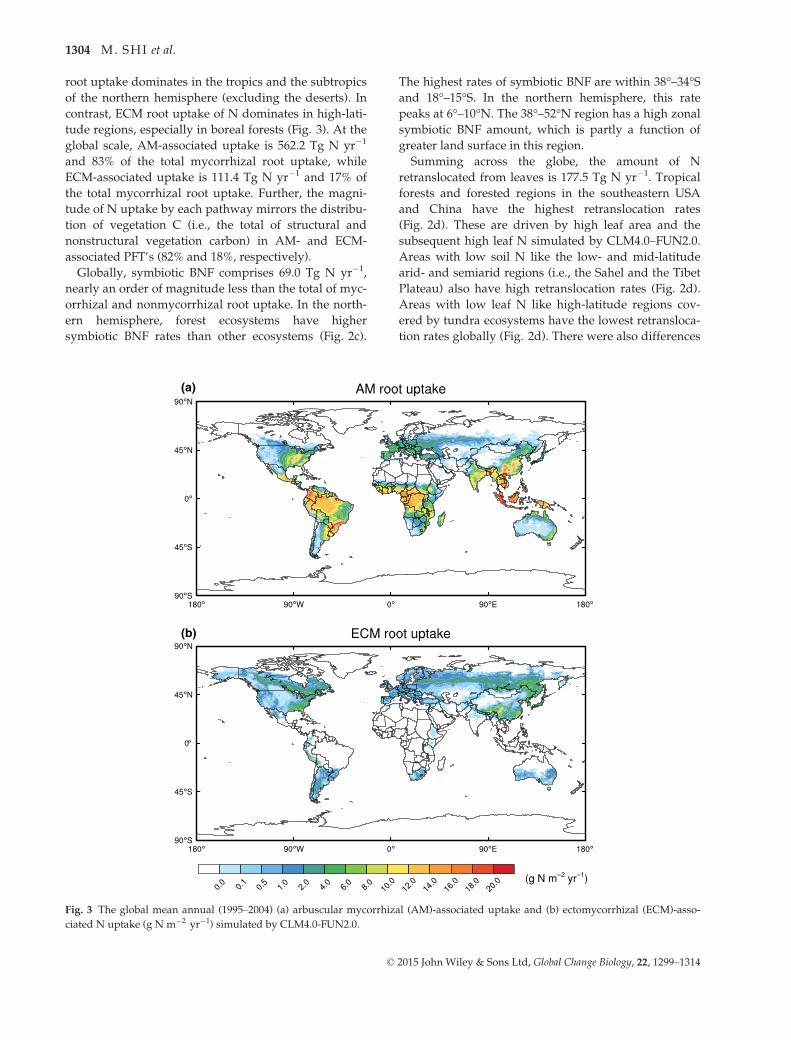
root uptake dominates in the tropics and the subtropics
of the northern hemisphere (excluding the deserts). In
contrast, ECM root uptake of N dominates in high-lati-
tude regions, especially in boreal forests (Fig. 3). At the
global scale, AM-associated uptake is 562.2 Tg N yr�1
and 83% of the total mycorrhizal root uptake, while
ECM-associated uptake is 111.4 Tg N yr�1 and 17% of
the total mycorrhizal root uptake. Further, the magni-
tude of N uptake by each pathway mirrors the distribu-
tion of vegetation C (i.e., the total of structural and
nonstructural vegetation carbon) in AM- and ECM-
associated PFT’s (82% and 18%, respectively).
Globally, symbiotic BNF comprises 69.0 Tg N yr�1,
nearly an order of magnitude less than the total of myc-
orrhizal and nonmycorrhizal root uptake. In the north-
ern hemisphere, forest ecosystems have higher
symbiotic BNF rates than other ecosystems (Fig. 2c).
The highest rates of symbiotic BNF are within 38°–34°Sand 18°–15°S. In the northern hemisphere, this rate
peaks at 6°–10°N. The 38°–52°N region has a high zonal
symbiotic BNF amount, which is partly a function of
greater land surface in this region.
Summing across the globe, the amount of N
retranslocated from leaves is 177.5 Tg N yr�1. Tropical
forests and forested regions in the southeastern USA
and China have the highest retranslocation rates
(Fig. 2d). These are driven by high leaf area and the
subsequent high leaf N simulated by CLM4.0–FUN2.0.
Areas with low soil N like the low- and mid-latitude
arid- and semiarid regions (i.e., the Sahel and the Tibet
Plateau) also have high retranslocation rates (Fig. 2d).
Areas with low leaf N like high-latitude regions cov-
ered by tundra ecosystems have the lowest retransloca-
tion rates globally (Fig. 2d). There were also differences
(a)
(b)
Fig. 3 The global mean annual (1995–2004) (a) arbuscular mycorrhizal (AM)-associated uptake and (b) ectomycorrhizal (ECM)-asso-
ciated N uptake (g N m�2 yr�1) simulated by CLM4.0-FUN2.0.
© 2015 John Wiley & Sons Ltd, Global Change Biology, 22, 1299–1314
1304 M. SHI et al.
Page 7
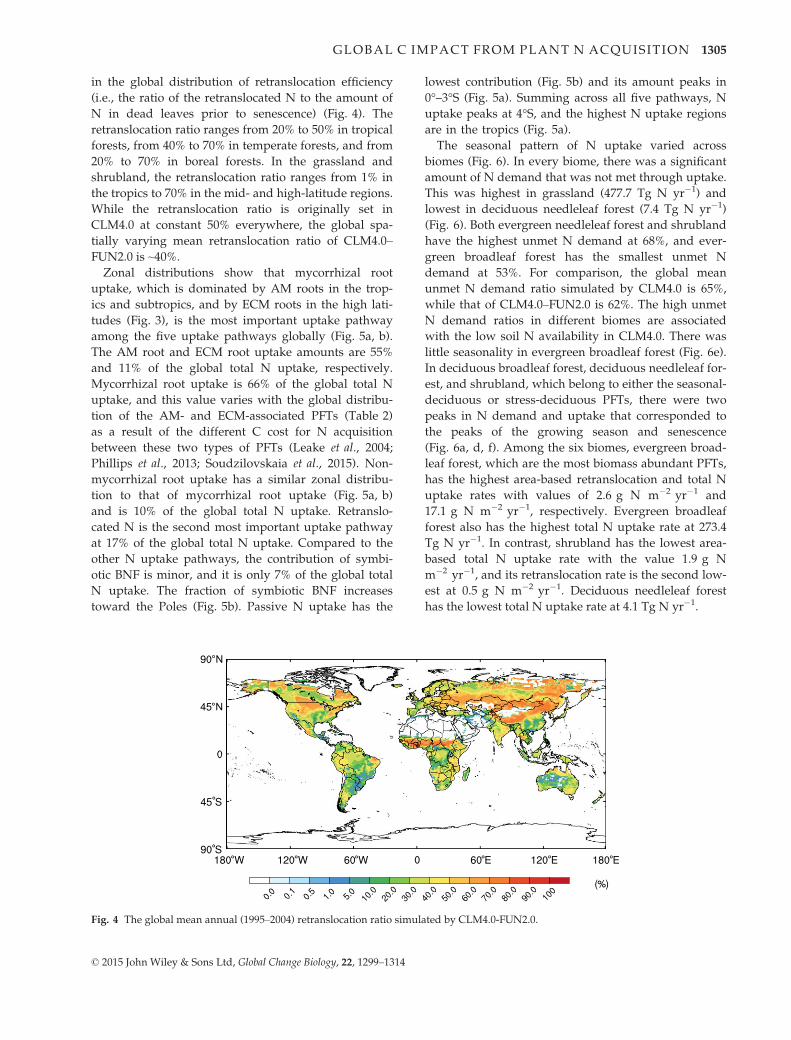
in the global distribution of retranslocation efficiency
(i.e., the ratio of the retranslocated N to the amount of
N in dead leaves prior to senescence) (Fig. 4). The
retranslocation ratio ranges from 20% to 50% in tropical
forests, from 40% to 70% in temperate forests, and from
20% to 70% in boreal forests. In the grassland and
shrubland, the retranslocation ratio ranges from 1% in
the tropics to 70% in the mid- and high-latitude regions.
While the retranslocation ratio is originally set in
CLM4.0 at constant 50% everywhere, the global spa-
tially varying mean retranslocation ratio of CLM4.0–FUN2.0 is ~40%.
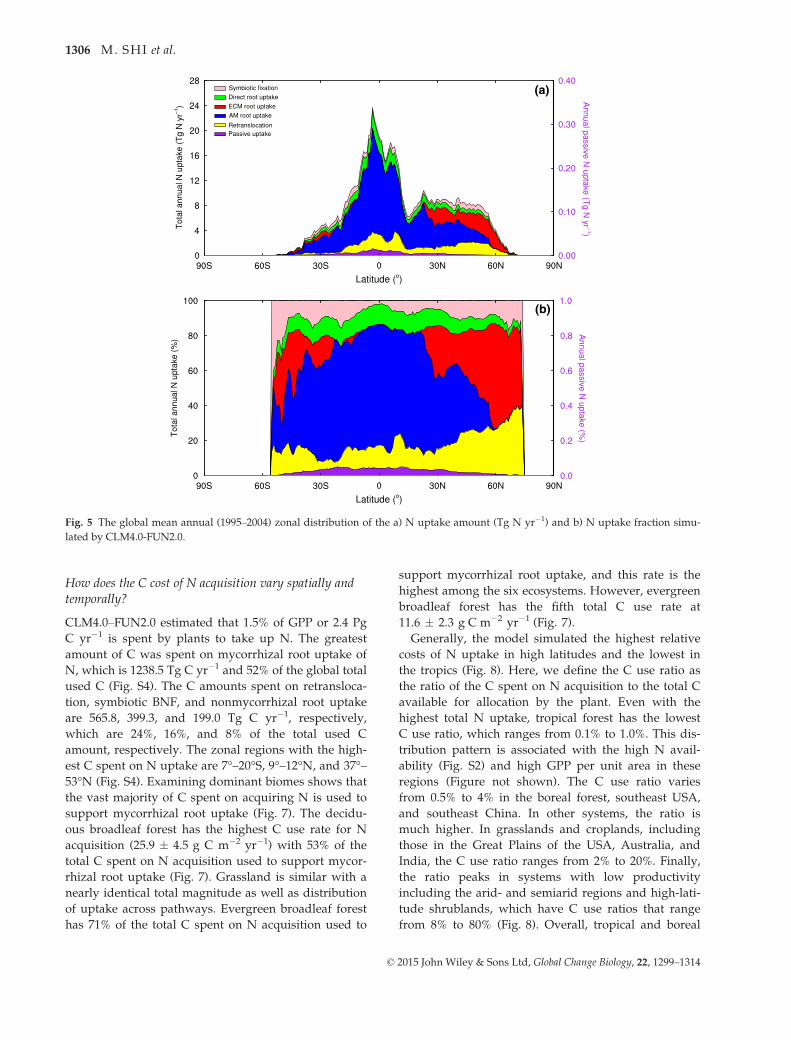
Zonal distributions show that mycorrhizal root
uptake, which is dominated by AM roots in the trop-
ics and subtropics, and by ECM roots in the high lati-
tudes (Fig. 3), is the most important uptake pathway
among the five uptake pathways globally (Fig. 5a, b).
The AM root and ECM root uptake amounts are 55%
and 11% of the global total N uptake, respectively.
Mycorrhizal root uptake is 66% of the global total N
uptake, and this value varies with the global distribu-
tion of the AM- and ECM-associated PFTs (Table 2)
as a result of the different C cost for N acquisition
between these two types of PFTs (Leake et al., 2004;
Phillips et al., 2013; Soudzilovskaia et al., 2015). Non-
mycorrhizal root uptake has a similar zonal distribu-
tion to that of mycorrhizal root uptake (Fig. 5a, b)
and is 10% of the global total N uptake. Retranslo-
cated N is the second most important uptake pathway
at 17% of the global total N uptake. Compared to the
other N uptake pathways, the contribution of symbi-
otic BNF is minor, and it is only 7% of the global total
N uptake. The fraction of symbiotic BNF increases
toward the Poles (Fig. 5b). Passive N uptake has the
lowest contribution (Fig. 5b) and its amount peaks in
0°–3°S (Fig. 5a). Summing across all five pathways, N
uptake peaks at 4°S, and the highest N uptake regions
are in the tropics (Fig. 5a).
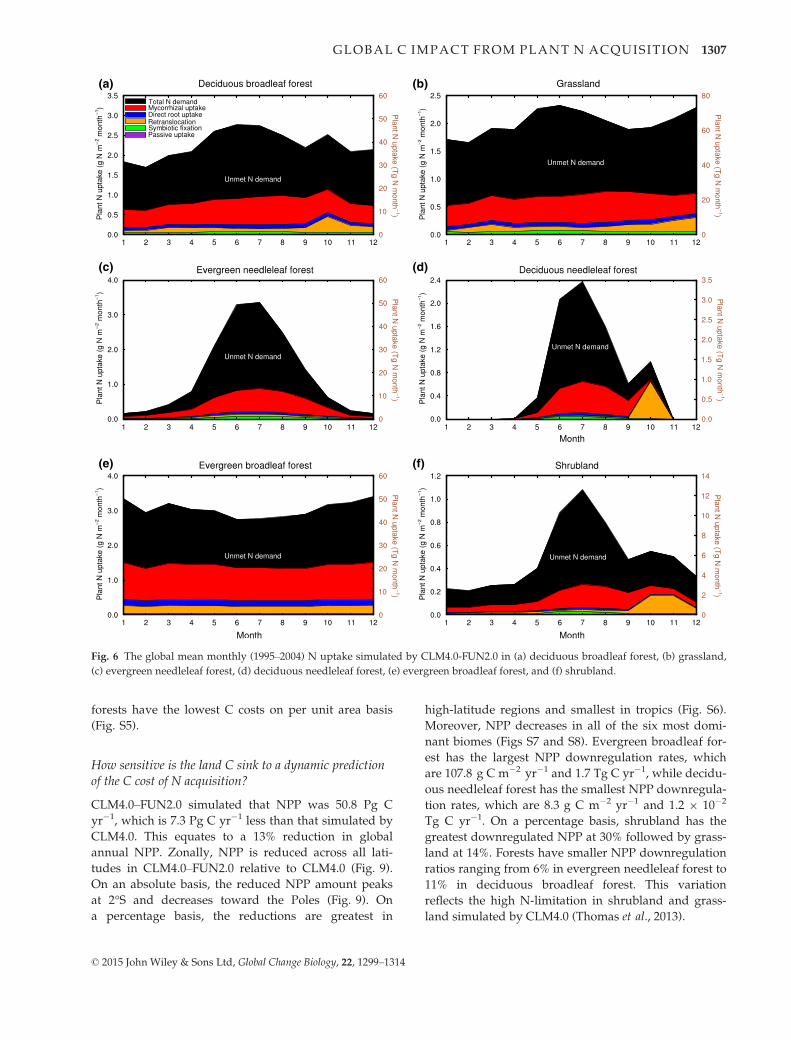
The seasonal pattern of N uptake varied across
biomes (Fig. 6). In every biome, there was a significant
amount of N demand that was not met through uptake.
This was highest in grassland (477.7 Tg N yr�1) and
lowest in deciduous needleleaf forest (7.4 Tg N yr�1)
(Fig. 6). Both evergreen needleleaf forest and shrubland
have the highest unmet N demand at 68%, and ever-
green broadleaf forest has the smallest unmet N
demand at 53%. For comparison, the global mean
unmet N demand ratio simulated by CLM4.0 is 65%,
while that of CLM4.0–FUN2.0 is 62%. The high unmet
N demand ratios in different biomes are associated
with the low soil N availability in CLM4.0. There was
little seasonality in evergreen broadleaf forest (Fig. 6e).
In deciduous broadleaf forest, deciduous needleleaf for-
est, and shrubland, which belong to either the seasonal-
deciduous or stress-deciduous PFTs, there were two
peaks in N demand and uptake that corresponded to
the peaks of the growing season and senescence
(Fig. 6a, d, f). Among the six biomes, evergreen broad-
leaf forest, which are the most biomass abundant PFTs,
has the highest area-based retranslocation and total N
uptake rates with values of 2.6 g N m�2 yr�1 and
17.1 g N m�2 yr�1, respectively. Evergreen broadleaf
forest also has the highest total N uptake rate at 273.4
Tg N yr�1. In contrast, shrubland has the lowest area-
based total N uptake rate with the value 1.9 g N
m�2 yr�1, and its retranslocation rate is the second low-
est at 0.5 g N m�2 yr�1. Deciduous needleleaf forest
has the lowest total N uptake rate at 4.1 Tg N yr�1.
Fig. 4 The global mean annual (1995–2004) retranslocation ratio simulated by CLM4.0-FUN2.0.
© 2015 John Wiley & Sons Ltd, Global Change Biology, 22, 1299–1314
GLOBAL C IMPACT FROM PLANT N ACQUISITION 1305
Page 8
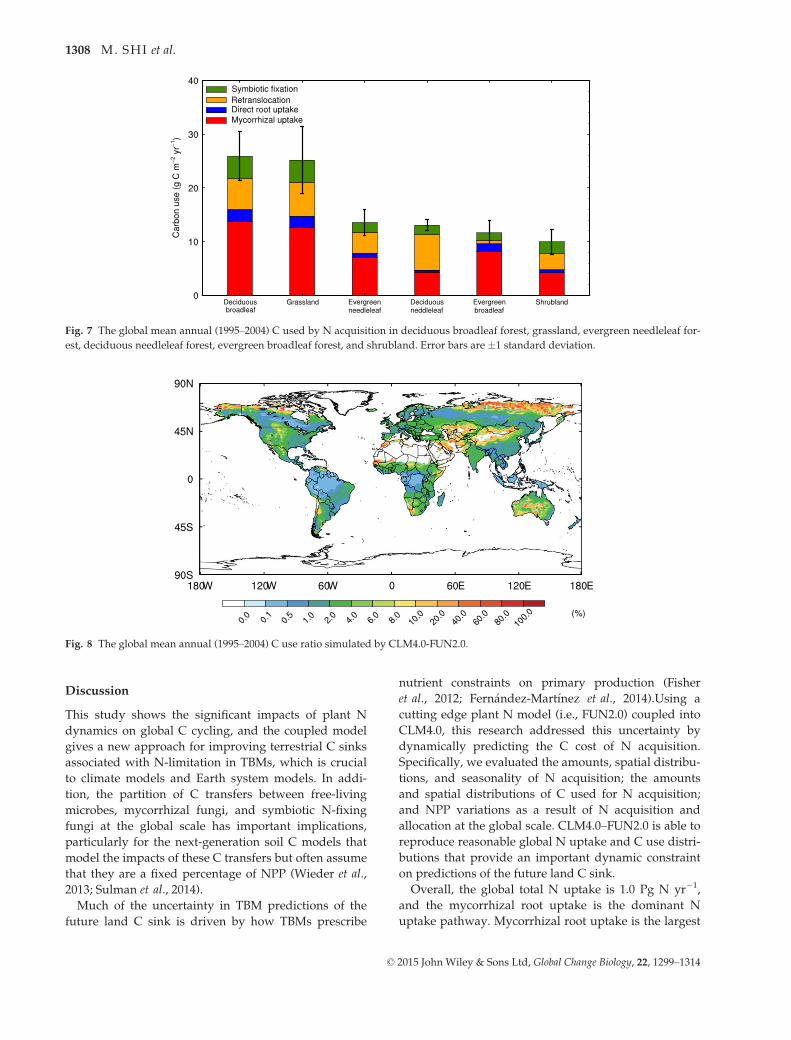
How does the C cost of N acquisition vary spatially andtemporally?
CLM4.0–FUN2.0 estimated that 1.5% of GPP or 2.4 Pg
C yr�1 is spent by plants to take up N. The greatest
amount of C was spent on mycorrhizal root uptake of
N, which is 1238.5 Tg C yr�1 and 52% of the global total
used C (Fig. S4). The C amounts spent on retransloca-
tion, symbiotic BNF, and nonmycorrhizal root uptake
are 565.8, 399.3, and 199.0 Tg C yr�1, respectively,
which are 24%, 16%, and 8% of the total used C
amount, respectively. The zonal regions with the high-
est C spent on N uptake are 7°–20°S, 9°–12°N, and 37°–53°N (Fig. S4). Examining dominant biomes shows that
the vast majority of C spent on acquiring N is used to
support mycorrhizal root uptake (Fig. 7). The decidu-
ous broadleaf forest has the highest C use rate for N
acquisition (25.9 � 4.5 g C m�2 yr�1) with 53% of the
total C spent on N acquisition used to support mycor-
rhizal root uptake (Fig. 7). Grassland is similar with a
nearly identical total magnitude as well as distribution
of uptake across pathways. Evergreen broadleaf forest
has 71% of the total C spent on N acquisition used to
support mycorrhizal root uptake, and this rate is the
highest among the six ecosystems. However, evergreen
broadleaf forest has the fifth total C use rate at
11.6 � 2.3 g C m�2 yr�1 (Fig. 7).
Generally, the model simulated the highest relative
costs of N uptake in high latitudes and the lowest in
the tropics (Fig. 8). Here, we define the C use ratio as
the ratio of the C spent on N acquisition to the total C
available for allocation by the plant. Even with the
highest total N uptake, tropical forest has the lowest
C use ratio, which ranges from 0.1% to 1.0%. This dis-
tribution pattern is associated with the high N avail-
ability (Fig. S2) and high GPP per unit area in these
regions (Figure not shown). The C use ratio varies
from 0.5% to 4% in the boreal forest, southeast USA,
and southeast China. In other systems, the ratio is
much higher. In grasslands and croplands, including
those in the Great Plains of the USA, Australia, and
India, the C use ratio ranges from 2% to 20%. Finally,
the ratio peaks in systems with low productivity
including the arid- and semiarid regions and high-lati-
tude shrublands, which have C use ratios that range
from 8% to 80% (Fig. 8). Overall, tropical and boreal
(a)
(b)
Fig. 5 The global mean annual (1995–2004) zonal distribution of the a) N uptake amount (Tg N yr�1) and b) N uptake fraction simu-
lated by CLM4.0-FUN2.0.
© 2015 John Wiley & Sons Ltd, Global Change Biology, 22, 1299–1314
1306 M. SHI et al.
Page 9
forests have the lowest C costs on per unit area basis
(Fig. S5).
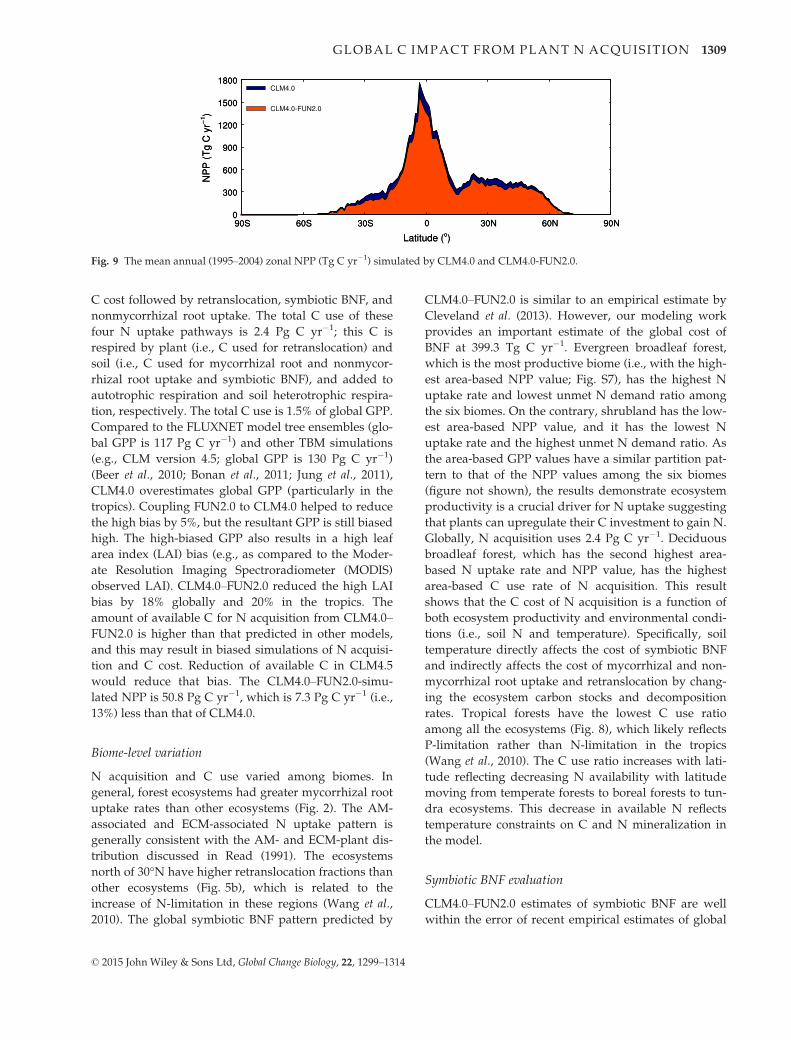
How sensitive is the land C sink to a dynamic predictionof the C cost of N acquisition?
CLM4.0–FUN2.0 simulated that NPP was 50.8 Pg C
yr�1, which is 7.3 Pg C yr�1 less than that simulated by
CLM4.0. This equates to a 13% reduction in global
annual NPP. Zonally, NPP is reduced across all lati-
tudes in CLM4.0–FUN2.0 relative to CLM4.0 (Fig. 9).
On an absolute basis, the reduced NPP amount peaks
at 2°S and decreases toward the Poles (Fig. 9). On
a percentage basis, the reductions are greatest in
high-latitude regions and smallest in tropics (Fig. S6).
Moreover, NPP decreases in all of the six most domi-
nant biomes (Figs S7 and S8). Evergreen broadleaf for-
est has the largest NPP downregulation rates, which
are 107.8 g C m�2 yr�1 and 1.7 Tg C yr�1, while decidu-
ous needleleaf forest has the smallest NPP downregula-
tion rates, which are 8.3 g C m�2 yr�1 and 1.2 9 10�2
Tg C yr�1. On a percentage basis, shrubland has the
greatest downregulated NPP at 30% followed by grass-
land at 14%. Forests have smaller NPP downregulation
ratios ranging from 6% in evergreen needleleaf forest to
11% in deciduous broadleaf forest. This variation
reflects the high N-limitation in shrubland and grass-
land simulated by CLM4.0 (Thomas et al., 2013).
(a) (b)
(c) (d)
(e) (f)
Fig. 6 The global mean monthly (1995–2004) N uptake simulated by CLM4.0-FUN2.0 in (a) deciduous broadleaf forest, (b) grassland,
(c) evergreen needleleaf forest, (d) deciduous needleleaf forest, (e) evergreen broadleaf forest, and (f) shrubland.
© 2015 John Wiley & Sons Ltd, Global Change Biology, 22, 1299–1314
GLOBAL C IMPACT FROM PLANT N ACQUISITION 1307
Page 10
Discussion
This study shows the significant impacts of plant N
dynamics on global C cycling, and the coupled model
gives a new approach for improving terrestrial C sinks
associated with N-limitation in TBMs, which is crucial
to climate models and Earth system models. In addi-
tion, the partition of C transfers between free-living
microbes, mycorrhizal fungi, and symbiotic N-fixing
fungi at the global scale has important implications,
particularly for the next-generation soil C models that
model the impacts of these C transfers but often assume
that they are a fixed percentage of NPP (Wieder et al.,
2013; Sulman et al., 2014).
Much of the uncertainty in TBM predictions of the
future land C sink is driven by how TBMs prescribe
nutrient constraints on primary production (Fisher
et al., 2012; Fern�andez-Mart�ınez et al., 2014).Using a
cutting edge plant N model (i.e., FUN2.0) coupled into
CLM4.0, this research addressed this uncertainty by
dynamically predicting the C cost of N acquisition.
Specifically, we evaluated the amounts, spatial distribu-
tions, and seasonality of N acquisition; the amounts
and spatial distributions of C used for N acquisition;
and NPP variations as a result of N acquisition and
allocation at the global scale. CLM4.0–FUN2.0 is able to
reproduce reasonable global N uptake and C use distri-
butions that provide an important dynamic constraint
on predictions of the future land C sink.
Overall, the global total N uptake is 1.0 Pg N yr�1,
and the mycorrhizal root uptake is the dominant N
uptake pathway. Mycorrhizal root uptake is the largest
Fig. 7 The global mean annual (1995–2004) C used by N acquisition in deciduous broadleaf forest, grassland, evergreen needleleaf for-
est, deciduous needleleaf forest, evergreen broadleaf forest, and shrubland. Error bars are �1 standard deviation.
Fig. 8 The global mean annual (1995–2004) C use ratio simulated by CLM4.0-FUN2.0.
© 2015 John Wiley & Sons Ltd, Global Change Biology, 22, 1299–1314
1308 M. SHI et al.
Page 11
C cost followed by retranslocation, symbiotic BNF, and
nonmycorrhizal root uptake. The total C use of these
four N uptake pathways is 2.4 Pg C yr�1; this C is
respired by plant (i.e., C used for retranslocation) and
soil (i.e., C used for mycorrhizal root and nonmycor-
rhizal root uptake and symbiotic BNF), and added to
autotrophic respiration and soil heterotrophic respira-
tion, respectively. The total C use is 1.5% of global GPP.
Compared to the FLUXNET model tree ensembles (glo-
bal GPP is 117 Pg C yr�1) and other TBM simulations
(e.g., CLM version 4.5; global GPP is 130 Pg C yr�1)
(Beer et al., 2010; Bonan et al., 2011; Jung et al., 2011),
CLM4.0 overestimates global GPP (particularly in the
tropics). Coupling FUN2.0 to CLM4.0 helped to reduce
the high bias by 5%, but the resultant GPP is still biased
high. The high-biased GPP also results in a high leaf
area index (LAI) bias (e.g., as compared to the Moder-
ate Resolution Imaging Spectroradiometer (MODIS)
observed LAI). CLM4.0–FUN2.0 reduced the high LAI
bias by 18% globally and 20% in the tropics. The
amount of available C for N acquisition from CLM4.0–FUN2.0 is higher than that predicted in other models,
and this may result in biased simulations of N acquisi-
tion and C cost. Reduction of available C in CLM4.5
would reduce that bias. The CLM4.0–FUN2.0-simu-
lated NPP is 50.8 Pg C yr�1, which is 7.3 Pg C yr�1 (i.e.,
13%) less than that of CLM4.0.
Biome-level variation
N acquisition and C use varied among biomes. In
general, forest ecosystems had greater mycorrhizal root
uptake rates than other ecosystems (Fig. 2). The AM-
associated and ECM-associated N uptake pattern is
generally consistent with the AM- and ECM-plant dis-
tribution discussed in Read (1991). The ecosystems
north of 30°N have higher retranslocation fractions than
other ecosystems (Fig. 5b), which is related to the
increase of N-limitation in these regions (Wang et al.,
2010). The global symbiotic BNF pattern predicted by
CLM4.0–FUN2.0 is similar to an empirical estimate by
Cleveland et al. (2013). However, our modeling work
provides an important estimate of the global cost of
BNF at 399.3 Tg C yr�1. Evergreen broadleaf forest,
which is the most productive biome (i.e., with the high-
est area-based NPP value; Fig. S7), has the highest N
uptake rate and lowest unmet N demand ratio among
the six biomes. On the contrary, shrubland has the low-
est area-based NPP value, and it has the lowest N
uptake rate and the highest unmet N demand ratio. As
the area-based GPP values have a similar partition pat-
tern to that of the NPP values among the six biomes
(figure not shown), the results demonstrate ecosystem
productivity is a crucial driver for N uptake suggesting
that plants can upregulate their C investment to gain N.
Globally, N acquisition uses 2.4 Pg C yr�1. Deciduous
broadleaf forest, which has the second highest area-
based N uptake rate and NPP value, has the highest
area-based C use rate of N acquisition. This result
shows that the C cost of N acquisition is a function of
both ecosystem productivity and environmental condi-
tions (i.e., soil N and temperature). Specifically, soil
temperature directly affects the cost of symbiotic BNF
and indirectly affects the cost of mycorrhizal and non-
mycorrhizal root uptake and retranslocation by chang-
ing the ecosystem carbon stocks and decomposition
rates. Tropical forests have the lowest C use ratio
among all the ecosystems (Fig. 8), which likely reflects
P-limitation rather than N-limitation in the tropics
(Wang et al., 2010). The C use ratio increases with lati-
tude reflecting decreasing N availability with latitude
moving from temperate forests to boreal forests to tun-
dra ecosystems. This decrease in available N reflects
temperature constraints on C and N mineralization in
the model.
Symbiotic BNF evaluation
CLM4.0–FUN2.0 estimates of symbiotic BNF are well
within the error of recent empirical estimates of global
Fig. 9 The mean annual (1995–2004) zonal NPP (Tg C yr�1) simulated by CLM4.0 and CLM4.0-FUN2.0.
© 2015 John Wiley & Sons Ltd, Global Change Biology, 22, 1299–1314
GLOBAL C IMPACT FROM PLANT N ACQUISITION 1309
Page 12
fixation rates. Our estimate of global symbiotic BNF is
69.0 Tg N yr�1, which is 9% of the total of mycorrhizal
and nonmycorrhizal root uptake. Cleveland et al. (2013)
suggested that recycled N accounts for nearly 90% of
annual terrestrial plant demand; therefore, the contri-
bution of different N uptake pathways is reasonably
simulated by CLM4.0–FUN2.0. The symbiotic BNF esti-
mations discussed in this study rely on CLM’s frame-
work for predicting total fixation and use FUN to
predict the fraction that is driven by symbiotic
microbes. CLM4.0–FUN2.0 predicts that total fixation is
110.4 Tg N yr�1 with 63% (i.e., 69.0 Tg N yr�1) of this
driven by symbiotic N-fixers. Recent global empirical
estimates suggest that the global total BNF is 127.5 Tg
N yr�1, of which 82% is symbiotic (105.1 Tg N yr�1)
(Cleveland et al., 2013). On a per unit area basis,
CLM4.0–FUN2.0 predicted 0.78 g N m�2 yr�1, whereas
empirical estimates are around 0.85 g N m�2 yr�1 (Sul-
livan et al., 2014). This agreement is remarkably similar
given that our estimates are derived from a mechanistic
full N cycle in a complex TBM, and their estimates are
derived from upscaling of extensive field measure-
ments. Spatially, the CLM4.0–FUN2.0-simulated global
symbiotic BNF pattern is similar to empirical estimates
as well, which indicate a lower tropical forest symbiotic
BNF due to the internal pools of bioavailable N these
systems build (Hedin et al., 2009; Sullivan et al., 2014).
However, the symbiotic BNF rate simulated by
CLM4.0–FUN2.0 is lower than that discussed in Cleve-
land et al. (2013), which is likely driven by the cost (i.e.,
economic) structure of FUN and the differences of soil
temperature and N2 fixing ability of roots between
CLM4.0–FUN2.0 and that from Cleveland et al. (2013).
Benchmarking CLM4.0–FUN2.0
Benchmarking global model products is a challenge for
the entire TBM (Luo et al., 2012; Kelley et al., 2013; Sch-
walm et al., 2013). To validate the broadscale patterns
in the C cost of N acquisition, we leveraged a new glo-
bal nutrient limitation product developed from remote
sensing (Fisher et al., 2012). This product couples remo-
tely sensed estimates of primary production and evapo-
transpiration to identify areas where light and water
are not limiting productivity. In this benchmarking
exercise, we expected the degree of NPP downregula-
tion fraction predicted by CLM4.0–FUN2.0 would be
correlated with the remotely sensed nutrient limitation
product. Overall, the NPP downregulation fraction sim-
ulated by CLM4.0–FUN2.0 has the similar global distri-
bution pattern to that of the nutrient limitation product.
There was a bias with CLM4.0–FUN2.0 over-predicting
NPP downregulation in low productivity systems
including arid and semiarid regions and the tundra
region and under-predicting in high productivity sys-
tems, especially forest ecosystems (Fig. S9). However,
this likely reflects the fact that the remotely sensed pro-
duct captures other forms of nutrient limitation includ-
ing P, especially with respect to our underestimation of
downregulation the tropics. In particular, systems that
are known to be more N-limited had higher correla-
tions (e.g., nonarctic grassland; Fig. S10a) than systems
known to be highly limited by P or other nutrients
(e.g., broadleaf evergreen tropical forests; Fig. S10b)
(Wang et al., 2010; Thomas et al., 2013). Nevertheless,
the agreement between the two products highlights the
robustness of the CLM4.0–FUN2.0 predictions with the
remaining residual error emphasizing the need to
incorporate P dynamics into FUN2.0 and CLM4.0–FUN2.0.
Emergent constraints from CLM4.0–FUN2.0
Although FUN2.0 focuses on plant-centric dynamics,
the C transferred to the soil for N acquisition as well
as the N inputs in fresh litter has important down-
stream impacts on predictions of soil C dynamics. In
CLM4.0, soil respiration consists of heterotrophic res-
piration and root respiration. In CLM4.0–FUN2.0, by
contrast, the C spent on soil N acquisition downregu-
lates NPP, and this expended C is added to the
heterotrophic respiration. Compared to CLM4.0, a
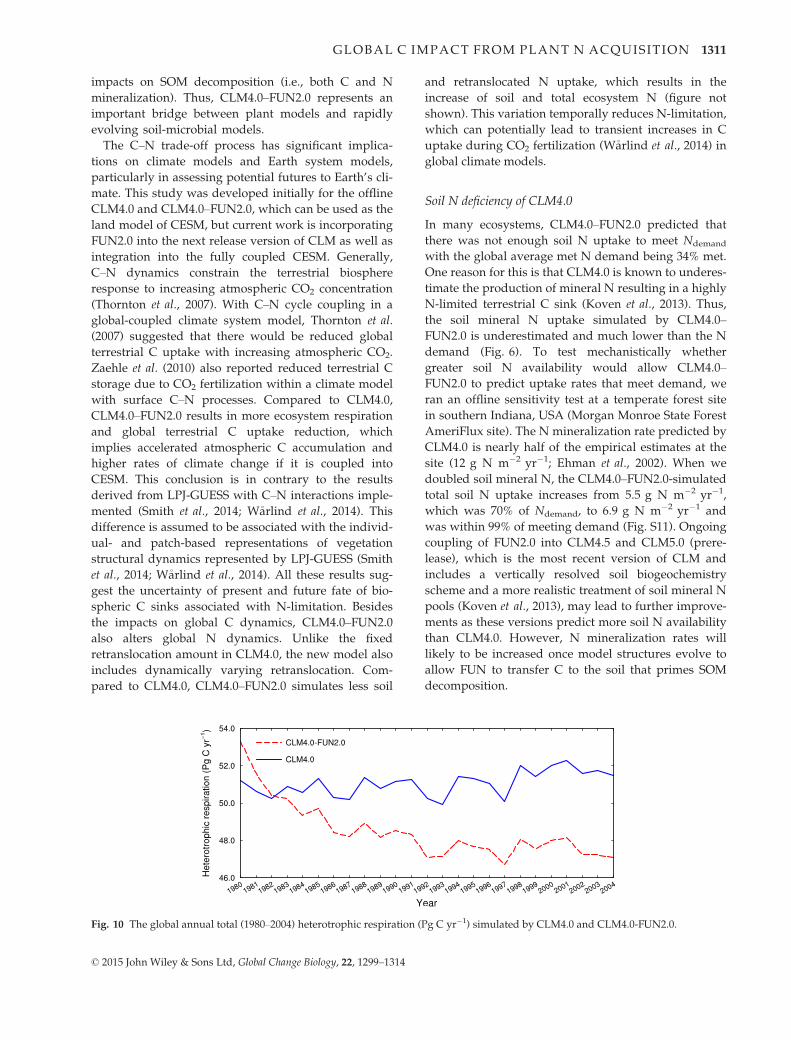
25-year CLM4.0–FUN2.0 simulation shows a pulse in
heterotrophic respiration during the first two simula-
tion years because of the new C source to hetero-
trophic respiration from FUN, but over time
heterotrophic respiration declines relative to CLM4.0
because of reduced litter inputs into soil from N-lim-
itation and subsequent NPP downregulation (Fig. 10).
In CLM4.0–FUN2.0, the increased heterotrophic respi-
ration amount is not equal to the reduced NPP
amount as the C spent on leaf N resorption downreg-
ulates autotrophic respiration and N allocation
change of the coupled model also regulates NPP vari-
ation trends. We chose to mass balance the C budget
in this manner; however, this method wastes the C
used for N acquisition as respiration and needs fur-
ther improvement. It has been estimated that the total
carbon flux to mycorrhizal fungi potentially con-
tributes up to 30% of NPP in forest ecosystems
(Courty et al., 2010; Vicca et al., 2012). Therefore, the
ability of FUN to predict the C transfers by plants
will have important implications in TBMs that
include microbial function and priming (Wieder et al.,
2013; Sulman et al., 2014). For example, once fully
coupled with a soil-microbial model, FUN2.0 will
predict the amount of C transferred into the labile
soil C pool and the microbial model will predict the
© 2015 John Wiley & Sons Ltd, Global Change Biology, 22, 1299–1314
1310 M. SHI et al.
Page 13
impacts on SOM decomposition (i.e., both C and N
mineralization). Thus, CLM4.0–FUN2.0 represents an
important bridge between plant models and rapidly
evolving soil-microbial models.
The C–N trade-off process has significant implica-
tions on climate models and Earth system models,
particularly in assessing potential futures to Earth’s cli-
mate. This study was developed initially for the offline
CLM4.0 and CLM4.0–FUN2.0, which can be used as the
land model of CESM, but current work is incorporating
FUN2.0 into the next release version of CLM as well as
integration into the fully coupled CESM. Generally,
C–N dynamics constrain the terrestrial biosphere
response to increasing atmospheric CO2 concentration
(Thornton et al., 2007). With C–N cycle coupling in a
global-coupled climate system model, Thornton et al.
(2007) suggested that there would be reduced global
terrestrial C uptake with increasing atmospheric CO2.
Zaehle et al. (2010) also reported reduced terrestrial C
storage due to CO2 fertilization within a climate model
with surface C–N processes. Compared to CLM4.0,
CLM4.0–FUN2.0 results in more ecosystem respiration
and global terrestrial C uptake reduction, which
implies accelerated atmospheric C accumulation and
higher rates of climate change if it is coupled into
CESM. This conclusion is in contrary to the results
derived from LPJ-GUESS with C–N interactions imple-
mented (Smith et al., 2014; W�arlind et al., 2014). This
difference is assumed to be associated with the individ-
ual- and patch-based representations of vegetation
structural dynamics represented by LPJ-GUESS (Smith
et al., 2014; W�arlind et al., 2014). All these results sug-
gest the uncertainty of present and future fate of bio-
spheric C sinks associated with N-limitation. Besides
the impacts on global C dynamics, CLM4.0–FUN2.0
also alters global N dynamics. Unlike the fixed
retranslocation amount in CLM4.0, the new model also
includes dynamically varying retranslocation. Com-
pared to CLM4.0, CLM4.0–FUN2.0 simulates less soil
and retranslocated N uptake, which results in the
increase of soil and total ecosystem N (figure not
shown). This variation temporally reduces N-limitation,
which can potentially lead to transient increases in C
uptake during CO2 fertilization (W�arlind et al., 2014) in
global climate models.
Soil N deficiency of CLM4.0
In many ecosystems, CLM4.0–FUN2.0 predicted that
there was not enough soil N uptake to meet Ndemand
with the global average met N demand being 34% met.
One reason for this is that CLM4.0 is known to underes-
timate the production of mineral N resulting in a highly
N-limited terrestrial C sink (Koven et al., 2013). Thus,
the soil mineral N uptake simulated by CLM4.0–FUN2.0 is underestimated and much lower than the N
demand (Fig. 6). To test mechanistically whether
greater soil N availability would allow CLM4.0–FUN2.0 to predict uptake rates that meet demand, we
ran an offline sensitivity test at a temperate forest site
in southern Indiana, USA (Morgan Monroe State Forest
AmeriFlux site). The N mineralization rate predicted by
CLM4.0 is nearly half of the empirical estimates at the
site (12 g N m�2 yr�1; Ehman et al., 2002). When we
doubled soil mineral N, the CLM4.0–FUN2.0-simulated
total soil N uptake increases from 5.5 g N m�2 yr�1,
which was 70% of Ndemand, to 6.9 g N m�2 yr�1 and
was within 99% of meeting demand (Fig. S11). Ongoing
coupling of FUN2.0 into CLM4.5 and CLM5.0 (prere-
lease), which is the most recent version of CLM and
includes a vertically resolved soil biogeochemistry
scheme and a more realistic treatment of soil mineral N
pools (Koven et al., 2013), may lead to further improve-
ments as these versions predict more soil N availability
than CLM4.0. However, N mineralization rates will
likely to be increased once model structures evolve to
allow FUN to transfer C to the soil that primes SOM
decomposition.
Fig. 10 The global annual total (1980–2004) heterotrophic respiration (Pg C yr�1) simulated by CLM4.0 and CLM4.0-FUN2.0.
© 2015 John Wiley & Sons Ltd, Global Change Biology, 22, 1299–1314
GLOBAL C IMPACT FROM PLANT N ACQUISITION 1311
Page 14
Further improvements to CLM4.0–FUN2.0
The nonstructural N pools in CLM4.0 need to be
improved in the future. Generally, nonstructural carbo-
hydrates, which are represented as the storage pools in
TBMs, accumulate throughout the plant including
leaves, stems, and roots (Millard & Grelet, 2010). Both
retranslocated N and root N uptake can be used to aug-
ment N storage. Seasonal remobilization uses N from
the storage pools by translocating N to other tissues for
growth (Millard & Proe, 1991; Millard & Grelet, 2010).
CLM4.0 includes vegetation C and N storage pools for
leaves, stems, and roots, and the storage pools and the
display pools are connected with the transfer pools.
However, the retranslocated N pool is separated from
the leaf N storage pool, and these two pools have dif-
ferent seasonality (Fig. S12). Compared to the leaf N
storage pool, which has an onset-period decreasing
trend, the retranslocated N pool has an offset-period
decreasing trend at the Morgan Monroe site
(Fig. S12a, b).
To better describe the season cycle of the nonstruc-
tural N and obtain the dynamic simulation of remobi-
lization, we suggest combining the leaf N storage pool
and the retranslocated N pool in CLM4.0. In deciduous
forest, for example, the leaf N storage pool, which decli-
nes rapidly as soon as the growing season starts, is
used as remobilization. The leaf N storage pool starts
rising in the late growing season as a result of the slow
growth and replenished nonstructural N pools (Dietze
et al., 2014). During the senescence period, the N stor-
age pool would have another quick growth, which is
associated with leaf N retranslocation. During the dor-
mant season, the leaf N storage pool would decrease
slowly to meet respiratory demand. This cycle can be
applied to most seasonal-deciduous species (Dietze
et al., 2014) (Fig. S13) and the nonstructural pools of
other phenological types can be similarly improved.
Compared to the original CLM4.0, the new leaf N stor-
age pool is more realistic and can potentially improve
the N dynamics of CLM4.0.
Integrating P constraints to C uptake represents the
next challenge for TBMs. Soil P dynamics, which limits
C uptake at low latitudes, have been included in the
biogeochemistry process module (i.e., Carnegie-Ames-
Stanford Approach with C, N, and P cycles or CASA-
CNP) of the Community Atmosphere Biosphere Land
Exchange (CABLE) model (Wang et al., 2010, 2011) as
well as in CLM-CNP (Yang et al., 2014). CABLE esti-
mated that NPP was reduced by 20% on average as a
result of P-limitation in tropical ecosystems (i.e., tropi-
cal evergreen broadleaf forests and tropical savannahs)
(Wang et al., 2010). Considering C–nutrient (i.e., N and
P) interaction reduces both the benefits of reforestation
and the cost of deforestation as indicated by the global
terrestrial carbon balance (Wang et al., 2015). The
research presented here does not model the C cost of P
acquisition. However, the integration of P dynamics
into CLM-CNP and continued development of global P
data products are now making it feasible to add P
uptake strategies into the cost structure of FUN. Given
the modular structure of FUN, dynamic costs of P
acquisition can easily be added to the resistance
network. Thus, FUN is well poised for meeting the
challenge of including plant P dynamics into the next
generation of TBMs.
Acknowledgements
Funding was provided by the US Department of Energy Officeof Biological and Environmental Research Terrestrial EcosystemScience Program; and the US National Science FoundationEcosystem Science Program. The computations were performedat the Texas Advanced Computing Center and at NASA AmesResearch Center; we acknowledge Dr. Zong-Liang Yang and Dr.Junjie Liu for providing the computational resources. Theauthors appreciate valuable suggestions from David Schimel,Rosie Fisher, William Wieder, Sam Levis, Jinyun Tang, andQing Zhu. The authors also want to acknowledge the anony-mous reviewers for providing the valuable comments. JBF andMS carried out the research at the Jet Propulsion Laboratory,California Institute of Technology, under a contract with theNational Aeronautics and Space Administration, and at theJoint Institute for Regional Earth System Science and Engineer-ing, University of California at Los Angeles.
References
Allen EB, Allen MF, Helm DJ, Trappe JM, Molina R, Rincon E (1995) Patterns and
regulation of mycorrhizal plant and fungal diversity. Plant and Soil, 170, 47–62.
Beer C, Reichstein M, Tomelleri E et al. (2010) Terrestrial gross carbon dioxide uptake:
global distribution and covariation with climate. Science, 329, 834–838.
Bloom AJ, Chapin FS, Mooney HA (1985) Resource limitation in plants – an economic
analogy. Annual Review of Ecology and Systematics, 16, 363–392.
Bonan GB, Levis S (2006) Evaluating aspects of the Community Land and Atmo-
sphere Models (CLM3 and CAM3) using a dynamic global vegetation model. Jour-
nal of Climate, 19, 2290–2301.
Bonan GB, Lawrence PJ, Oleson KW et al. (2011) Improving canopy processes in the
Community Land Model version 4 (CLM4) using global flux fields empirically
inferred from FLUXNET data. Journal of Geophysical Research: Biogeosciences, 116,
G02014.
Brzostek ER, Fisher JB, Phillips RP (2014) Modeling the carbon cost of plant nitrogen
acquisition: mycorrhizal trade-offs and multipath resistance uptake improve pre-
dictions of retranslocation. Journal of Geophysical Research: Biogeosciences, 119, 1684–
1697.
Brzostek ER, Dragoni D, Brown ZA, Phillips RP (2015) Mycorrhizal type determines
the magnitude and direction of root-induced changes in decomposition in a tem-
perate forest. New Phytologist, 206, 1274–1282.
Cai X, Yang Z-L, Fisher JB, Zhang X, Barlage M, Chen F (2015) Integration of nitrogen
dynamics into the Noah-MP land surface model for climate and environmental
predictions. Submitted to Geoscientific Model Development Discussion, 8, 4113–
4153.
Cleveland CC, Houlton BZ, Smith WK et al. (2013) Patterns of new versus recycled
primary production in the terrestrial biosphere. Proceedings of the National Academy
of Sciences of the United States of America, 110, 12733–12737.
Courty P-E, Bu�ee M, Diedhiou AG et al. (2010) The role of ectomycorrhizal communi-
ties in forest ecosystem processes: new perspectives and emerging concepts. Soil
Biology and Biochemistry, 42, 679–698.
© 2015 John Wiley & Sons Ltd, Global Change Biology, 22, 1299–1314
1312 M. SHI et al.
Page 15
Dickinson RE, Berry JA, Bonan GB et al. (2002) Nitrogen controls on climate model
evapotranspiration. Journal of Climate, 15, 278–295.
Dickinson RE, Oleson KW, Bonan GB et al. (2006) The Community Land Model and
its climate statistics as a component of the Community Climate System Model.
Journal of Climate, 19, 2302–2324.
Dietze MC, Sala A, Carbone MS, Czimczik CI, Mantooth JA, Richardson AD, Vargas
R (2014) Nonstructural carbon in woody plants. Annual Review of Plant Biology, 65,
667–687.
Duchesne L, Ouimet R, Camir�e C, Houle D (2001) Seasonal nutrient transfers by foliar
resorption, leaching, and litter fall in a northern hardwood forest at Lake Clair
Watershed, Quebec, Canada. Canadian Journal of Forest Research, 31, 333–344.
Ehman JL, Schmid HP, Grimmond CSB, Randolph JC, Hanson PJ, Wayson CA, Crop-
ley FD (2002) An initial intercomparison of micrometeorological and ecological
inventory estimates of carbon exchange in a mid-latitude deciduous forest. Global
Change Biology, 8, 575–589.
Falkengren-Grerup U (1995) Interspecies differences in the preference of ammonium
and nitrate in vascular plants. Oecologia, 102, 305–311.
Fern�andez-Mart�ınez M, Vicca S, Janssens IA et al. (2014) Nutrient availability as the
key regulator of global forest carbon balance. Nature Climate Change, 4, 471–476.
Fisher JB, Sitch S, Malhi Y, Fisher RA, Huntingford C, Tan S-Y (2010) Carbon cost of
plant nitrogen acquisition: a mechanistic, globally applicable model of plant nitro-
gen uptake, retranslocation, and fixation. Global Biogeochemical Cycles, 24, GB1014.
Fisher JB, Badgley G, Blyth E (2012) Global nutrient limitation in terrestrial vegeta-
tion. Global Biogeochemical Cycles, 26, GB3007.
Fisher JB, Huntzinger DN, Schwalm CR, Sitch S (2014) Modeling the terrestrial bio-
sphere. Annual Review of Environment and Resources, 39, 91–123.
Gent PR, Danabasoglu G, Donner LJ et al. (2011) The community climate system
model version 4. Journal of Climate, 24, 4973–4991.
Hedin LO, Brookshire ENJ, Menge DNL, Barron AR (2009) The nitrogen paradox in
tropical forest ecosystems. Annual Review of Ecology, Evolution, and Systematics, 40,
613–635.
Hobbie EA (2006) Carbon allocation to ectomycorrhizal fungi correlates with below-
ground allocation in culture studies. Ecology, 87, 563–569.
H€ogberg MN, H€ogberg P (2002) Extramatrical ectomycorrhizal mycelium contributes
one-third of microbial biomass and produces, together with associated roots, half
the dissolved organic carbon in a forest soil. New Phytologist, 154, 791–795.
Holopainen JK, Peltonen P (2002) Bright autumn colours of deciduous trees attract
aphids: nutrient retranslocation hypothesis. Oikos, 99, 184–188.
Houlton BZ, Wang Y-P, Vitousek PM, Field CB (2008) A unifying framework for dini-
trogen fixation in the terrestrial biosphere. Nature, 454, 327–330.
Huntzinger DN, Schwalm C, Michalak AM et al. (2013) The North American carbon
program multi-scale synthesis and terrestrial model intercomparison project – part
1: overview and experimental design. Geoscientific Model Development, 6, 2121–
2133.
Jones DL, Healey JR, Willett VB, Farrar JF, Hodge A (2005) Dissolved organic nitro-
gen uptake by plants – an important N uptake pathway? Soil Biology and Biochem-
istry, 37, 413–423.
Jung M, Reichstein M, Margolis HA et al. (2011) Global patterns of land-atmosphere
fluxes of carbon dioxide, latent heat, and sensible heat derived from eddy covari-
ance, satellite, and meteorological observations. Journal of Geophysical Research: Bio-
geosciences, 116, G00J07.
Kelley DI, Prentice IC, Harrison SP, Wang H, Simard M, Fisher JB, Willis KO (2013) A
comprehensive benchmarking system for evaluating global vegetation models.
Biogeosciences, 10, 3313–3340.
Koven CD, Riley WJ, Subin ZM et al. (2013) The effect of vertically resolved soil bio-
geochemistry and alternate soil C and N models on C dynamics of CLM4. Biogeo-
sciences, 10, 7109–7131.
Lamarque J-F, Dentener F, Mcconnell J et al. (2013) Multi-model mean nitrogen and
sulfur deposition from the Atmospheric Chemistry and Climate Model Intercom-
parison Project (ACCMIP): evaluation of historical and projected future changes.
Atmospheric Chemistry and Physics, 13, 7997–8018.
Lawrence DM, Oleson KW, Flanner MG et al. (2011) Parameterization improvements
and functional and structural advances in Version 4 of the Community Land
Model. Journal of Advances in Modeling Earth Systems, 3, M03001.
Leake J, Johnson D, Donnelly D, Muckle G, Boddy L, Read D (2004) Networks of
power and influence: the role of mycorrhizal mycelium in controlling plant com-
munities and agroecosystem functioning. Canadian Journal of Botany, 82, 1016–1045.
Lebauer DS, Treseder KK (2008) Nitrogen limitation of net primary produ tivity in
terrestrial ecosystems is globally distributed. Ecology, 89, 371–379.
Luo YQ, Randerson JT, Abramowitz G et al. (2012) A framework for benchmarking
land models. Biogeosciences, 9, 1899–1944.
Marschner H (1995) Mineral Nutrition of Higher Plants, 2nd edn. Academic, New York.
ISBN 978-0-12-473542-2.
Millard P, Grelet GA (2010) Nitrogen storage and remobilization by trees: ecophysio-
logical relevance in a changing world. Tree Physiology, 30, 1083–1095.
Millard P, Proe MF (1991) Leaf demography and the seasonal internal cycling of
nitrogen in sycamore (Acer pseudoplatanus L.) seedlings in relation to nitrogen
supply. New Phytologist, 117, 587–596.
Nordin A, H€ogberg P, N€asholm T (2001) Soil nitrogen form and plant nitrogen
uptake along a boreal forest productivity gradient. Oecologia, 129, 125–132.
Oleson KW, Dai Y, Bonan GB et al. (2004) Technical description of the Community
Land Model (CLM). NCAR Technical Note, NCAR/TN-461 + STR, National
Center for Atmospheric Research, Boulder, CO.
Oleson KW, Lawrence DM, Bonan GB et al. (2010) Technical description of version
4.0 of the Community Land Model. NCAR Technical Note, NCAR/TN-478 + STR,
National Center for Atmospheric Research, Boulder, CO.
Ostle NJ, Smith P, Fisher RA et al. (2009) Integrating plant–soil interactions into glo-
bal carbon cycle models. Journal of Ecology, 97, 851–863.
Phillips RP, Brzostek ER, Midgley MG (2013) The mycorrhizal-associated nutrient
economy: a new framework for predicting carbon–nutrient couplings in temperate
forests. New Phytologist, 199, 41–51.
Qian T, Dai A, Trenberth KW, Oleson KW (2006) Simulation of global land surface
conditions from 1948 to 2004. part I: forcing data and evaluations. Journal of
Hydrometeorology, 7, 953–975.
Rastetter EB, �Agren GI, Shaver GR (1997) Responses of N-limited ecosystems to
increased CO2: a balanced-nutrition, coupled-element-cycles model. Ecological
Applications, 7, 444–460.
Rastetter EB, Vitousek PM, Field C, Shaver GR, Herbert D, �Agren GI (2001) Resource
optimization and symbiotic nitrogen fixation. Ecosystems, 4, 369–388.
Read DJ (1991) Mycorrhizas in ecosystems. Experientia, 47, 376–391.
Schwalm CR, Huntinzger DN, Michalak AM et al. (2013) Sensitivity of inferred cli-
mate model skill to evaluation decisions: a case study using CMIP5 evapotranspi-
ration. Environmental Research Letters, 8, 024028.
Shi M, Yang Z-L, Lawrence DM, Dickinson RE, Subin ZM (2013) Spin-up processes in
the Community Land Model Version 4 with explicit carbon and nitrogen compo-
nents. Ecological Modelling, 263, 308–325.
Smith B, W�arlind D, Arneth A, Hickler T, Leadley P, Siltberg J, Zaehle S (2014)
Implications of incorporating N cycling and N limitations on primary produc-
tion in an individual-based dynamic vegetation model. Biogeosciences, 11,
2027–2054.
Soudzilovskaia NA, van der Heijden MGA, Cornelissen JHC et al. (2015) Quantitative
assessment of the differential impacts of arbuscular and ectomycorrhiza on soil
carbon cycling. New Phytologist, 208, 280–293.
Sullivan BW, Smith WK, Townsend AR, Nasto MK, Reed SC, Chazdon RL, Cleveland
CC (2014) Spatially robust estimates of biological nitrogen (N) fixation imply sub-
stantial human alteration of the tropical N cycle. Proceedings of the National Acad-
emy of Sciences of the United States of America, 111, 8101–8106.
Sulman BN, Phillips RP, Oishi AC, Shevliakova E, Pacala SW (2014) Microbe-driven
turnover offsets mineral-mediated storage of soil carbon under elevated CO2. Nat-
ure Climate Change, 4, 1099–1102.
Thomas RQ, Zaehle S, Templer PH, Goodale CL (2013) Global patterns of nitrogen
limitation: confronting two global biogeochemical models with observations. Glo-
bal Change Biology, 19, 2986–2998.
Thornton PE, Rosenbloom NA (2005) Ecosystem model spin-up: estimating steady
state conditions in a coupled terrestrial carbon and nitrogen cycle model. Ecological
Modelling, 189, 25–48.
Thornton PE, Zimmermann NE (2007) An improved canopy integration scheme for a
land surface model with prognostic canopy structure. Journal of Climate, 20, 3902–
3923.
Thornton PE, Law BE, Gholz HL et al. (2002) Modeling and measuring the effects of
disturbance history and climate on carbon and water budgets in evergreen needle-
leaf forests. Agricultural and Forest Meteorology, 113, 185–222.
Thornton PE, Lamarque J-F, Rosenbloom NA, Mahowald NM (2007) Influence of car-
bon-nitrogen cycle coupling on land model response to CO2 fertilization and cli-
mate variability. Global Biogeochemical Cycles, 21, GB4018.
Thornton PE, Doney SC, Lindsay K et al. (2009) Carbon-nitrogen interactions regulate
climate-carbon cycle feedbacks: results from an atmosphere-ocean general circula-
tion model. Biogeosciences, 6, 2099–2120.
Vicca S, Luyssaert S, Penuelas J et al. (2012) Fertile forests produce biomass more effi-
ciently. Ecology Letters, 15, 520–526.
Vitousek PM, Field CB (1999) Ecosystem constraints to symbiotic nitrogen fixers: a
simple model and its implications. Biogeochemistry, 46, 179–202.
© 2015 John Wiley & Sons Ltd, Global Change Biology, 22, 1299–1314
GLOBAL C IMPACT FROM PLANT N ACQUISITION 1313
Page 16
Vitousek PM, Howarth RW (1991) Nitrogen limitation on land and in the sea: how
can it occur? Biogeochemistry, 13, 87–115.
Vitousek PM, Cassman K, Cleveland CC et al. (2002) Towards an ecological under-
standing of biological nitrogen fixation. Biogeochemistry, 57 (58), 1–45.
Wang Y-P, Houlton BZ, Field CB (2007) A model of biogeochemical cycles of carbon,
nitrogen, and phosphorus including symbiotic nitrogen fixation and phosphatase
production. Global Biogeochemical Cycles, 21, GB1018.
Wang Y-P, Law RM, Pak B (2010) A global model of carbon, nitrogen and phosphorus
cycles for the terrestrial biosphere. Biogeosciences, 7, 2261–2282.
Wang Y-P, Kowalczyk E, Leuning R et al. (2011) Diagnosing errors in a land surface
model (CABLE) in the time and frequency domains. Journal of Geophysical Research:
Biogeosciences (2005–2012), 116, G01034
Wang Y-P, Zhang Q, Pitman AJ, Dai Y (2015) Nitrogen and phosphorous limitation
reduces the effects of land use change on land carbon uptake or emission. Environ-
mental Research Letters, 10, 014001.
Waring BG, Adams R, Branco S, Powers JS (2015) Scale-dependent variation in nitro-
gen cycling and soil fungal communities along gradients of forest composition
and age in regenerating tropical dry forests. New Phytologist,. doi:10.1111/
nph.13654.
W�arlind D, Smith B, Hickler T, Arneth A (2014) Nitrogen feedbacks increase future
terrestrial ecosystem carbon uptake in an individual-based dynamic vegetation
model. Biogeosciences, 11, 6131–6146.
Wieder WR, Bonan GB, Allison SD (2013) Global soil carbon projections are improved
by modelling microbial processes. Nature Climate Change, 3, 909–912.
Wieder WR, Cleveland CC, Smith WK, Todd-Brown K (2015) Future productivity
and carbon storage limited by terrestrial nutrient availability. Nature Geoscience, 8,
441–444.
Wright IJ, Westoby M (2003) Nutrient concentration, resorption and lifespan: leaf
traits of Australian sclerophyll species. Functional Ecology, 17, 10–19.
Yang X, Thornton PE, Ricciuto DM, Post WM (2014) The role of phosphorus dynam-
ics in tropical forests – a modeling study using CLM-CNP. Biogeosciences, 11, 1667–
1681.
Zaehle S, Friedlingstein P, Friend AD (2010) Terrestrial nitrogen feedbacks may accel-
erate future climate change. Geophysical Research Letters, 37, L01401.
Zaehle S, Medlyn BE, De Kauwe MG et al. (2014) Evaluation of 11 terrestrial carbon–
nitrogen cycle models against observations from two temperate free-air CO2
enrichment studies. New Phytologist, 202, 803–822.
Supporting Information
Additional Supporting Information may be found in the online version of this article:
Appendix S1. CLM4.0 leaf litter N and retranslocated N calculation.Appendix S2. The CLM4.0–FUN2.0-simulated passive N uptake.Fig. S1. The annual mean (1995–2004) passive N uptake (g N m�2 yr�1) simulated by CLM4.0–FUN2.0.Fig. S2. The monthly mean (1995–2004) soil mineral N (g N m�2 month�1) simulated by CLM4.0–FUN2.0.Fig. S3. The annual mean (1995–2004) transpiration (mm yr�1) simulated by CLM4.0–FUN2.0.Appendix S3. The global distribution of C spent on N acquisition.Fig. S4. The global mean annual (1995–2004) zonal distribution of the C used for N acquisition (Tg C yr�1).Fig. S5. The annual mean (1995–2004) C spent on N acquisition (g C m�2 yr�1) simulated by CLM4.0–FUN2.0.Appendix S4. Net primary productivity (NPP) variations in different biomes.Fig. S6. The mean annual (1995–2004) zonal net primary productivity (NPP) variation fraction between CLM4.0 and CLM4.0–FUN2.0.Fig. S7. The global mean annual (1995–2004) net primary productivity (NPP) per unit area (g C m�2 yr�1) in deciduous broadleafforest, grassland, evergreen needleleaf forest, deciduous needleleaf forest, evergreen broadleaf forest, and shrubland.Fig. S8. The global mean annual (1995–2004) net primary productivity (NPP) (Pg C yr�1) in deciduous broadleaf forest, grassland,evergreen needleleaf forest, evergreen broadleaf forest, deciduous needleleaf forest, and shrubland.Appendix S5. The figures in Discussion.Fig. S9. (a) The global nutrient-limitation product developed from remote sensing (Fisher et al., 2012), and (b) the global meanannual (1995–2004) net primary productivity (NPP) down-regulation fraction between CLM4.0 and CLM4.0–FUN2.0.Fig. S10. The regressed net primary productivity (NPP) variation with the nutrient limitation data discussed in Fisher et al. (2012) in:(a) C3 grassland (non-arctic) and (b) broadleaf evergreen tropical forest.Fig. S11. The seasonality of N uptake (g N m�2 month�1) at the Morgan Monroe (MM) site with doubled soil mineral N.Fig. S12. CLM4.0 simulations at the Morgan Monroe (MM) site for (a) the leaf N storage pool (g N m�2 day�1) and (b) the retranslo-cated N pool (g N m�2 day�1).Fig. S13. The normalized new leaf N storage pool in temperate deciduous forests. This new pool combines the leaf N storage pooland retranslocated N pool of CLM4.0.
© 2015 John Wiley & Sons Ltd, Global Change Biology, 22, 1299–1314
1314 M. SHI et al.