CFI Mapping Tool (V6.01) Help Manual Department of the Environment Page 1 What’s New – 28 July 2015 New data added to the CMT to support the new ERF methodology “ Estimating sequestration of carbon in soils using default values” What’s New - 5 August 2014 CMT has been upgraded to support the following new functionality Simplified access to the Tool - no need to remember login details! Access additional Forest Cover and Landsat datasets from 1990 to 2013 Ability to compare datasets Ability to import external data Ability to select and download Forest Cover Data A. Definitions: What is … The CMT? A CEA? A Boundary? An Exclusion? Carbon Farming Mapping Tool Help Manual (V6.01)
Transcript
CFI Mapping Tool (V6.01) Help Manual Department of the Environment Page 1
What’s New – 28 July 2015
New data added to the CMT to support the new ERF methodology
“ Estimating sequestration of carbon in soils using default values”
What’s New - 5 August 2014
CMT has been upgraded to support the following new functionality
Simplified access to the Tool - no need to remember login details!
Access additional Forest Cover and Landsat datasets from 1990 to 2013
Ability to compare datasets
Ability to import external data
Ability to select and download Forest Cover Data
A. Definitions:
What is …
The CMT?
A CEA?
A Boundary?
An Exclusion?
Carbon Farming Mapping Tool Help Manual (V6.01)
CFI Mapping Tool (V6.01) Help Manual Department of the Environment Page 2
A Model Point?
A Data Layer?
A Report?
Default Extent?
Full Extent?
B. Using the map:
How do I …
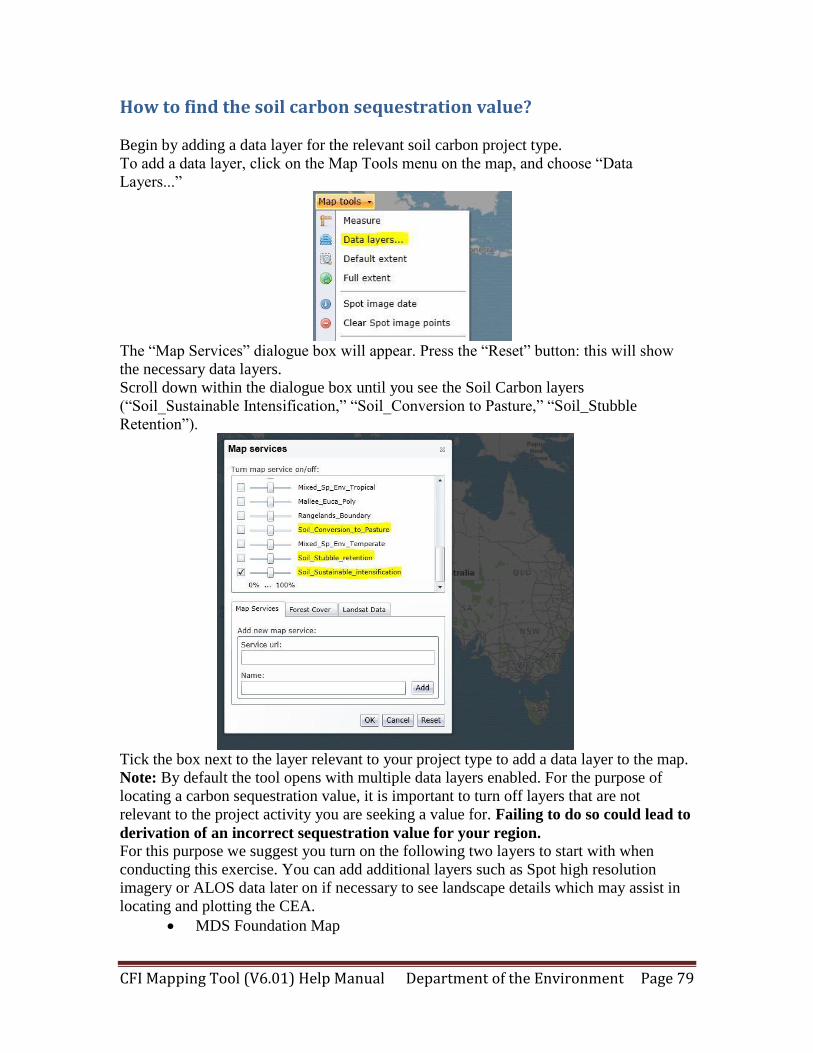
Find soil carbon sequestration values for a given CEA?
Navigate the map?
Search for a specific location on the map?
Measure distances and areas?
Add new data layers?
Remove existing data layers?
Adjust the transparency of a data layer?
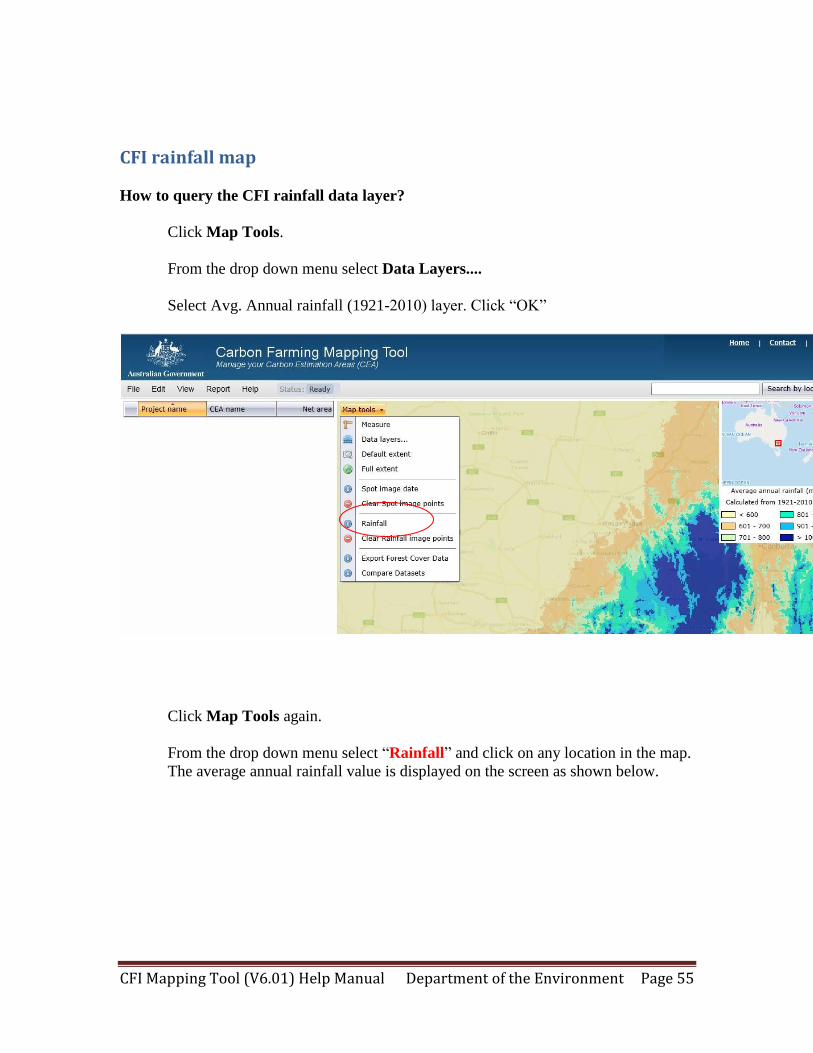
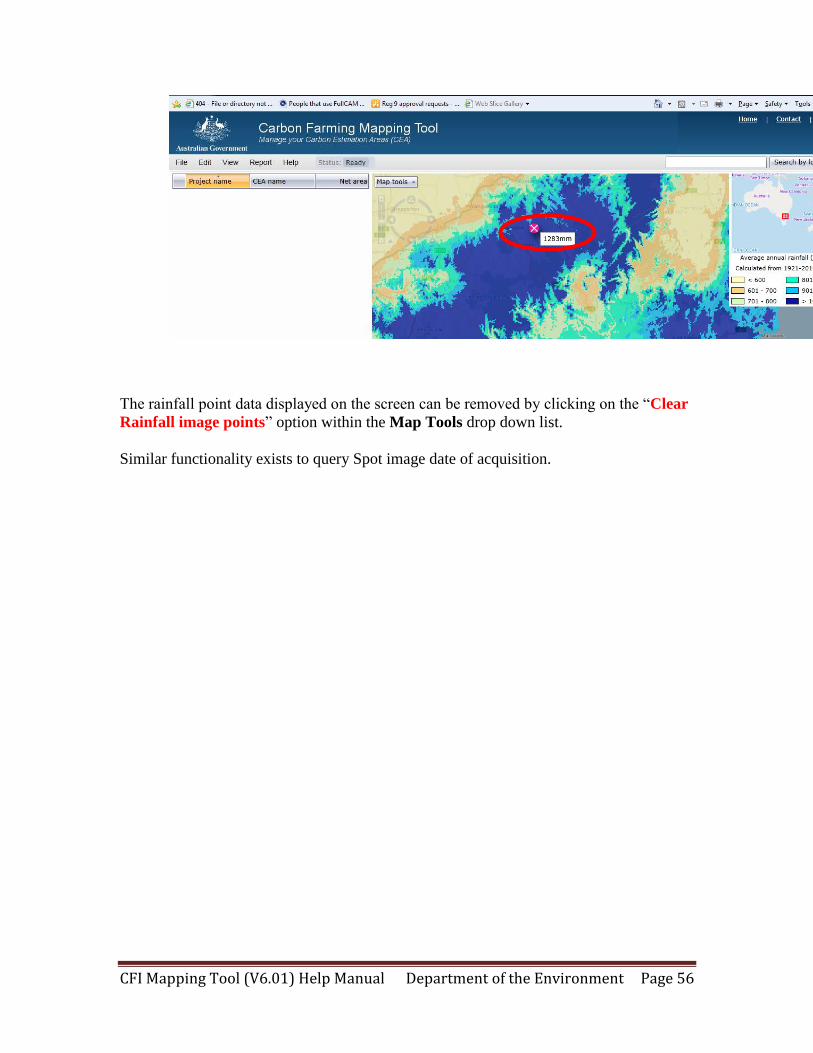
Query the CFI rainfall map?
Add a new Forest Cover or Landsat layer?
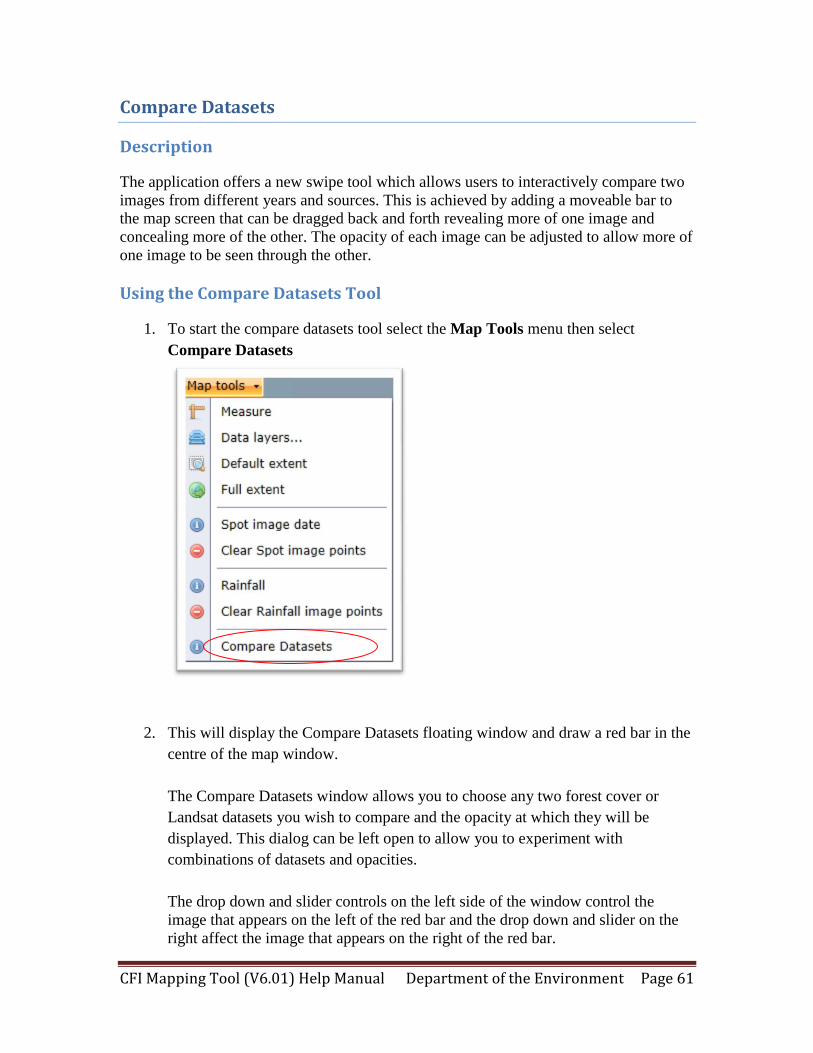
Compare Datasets?
Import a shapefile?
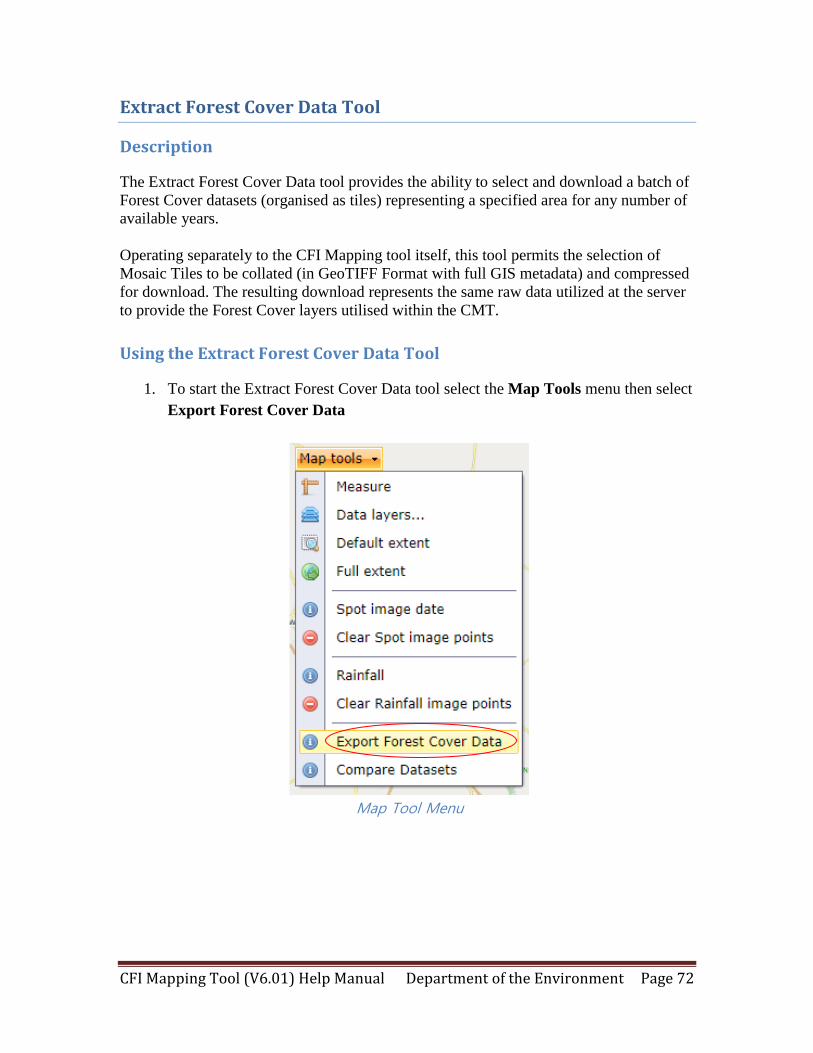
Extract Forest Cover Data?
CFI Mapping Tool (V6.01) Help Manual Department of the Environment Page 3
C. Managing a single Carbon Estimation Area (CEA):
How do I …
Create a new CEA?
Delete a CEA?
Edit a CEA?
Move a CEA?
Draw a Boundary?
Draw an Exclusion?
Create a Model Point?
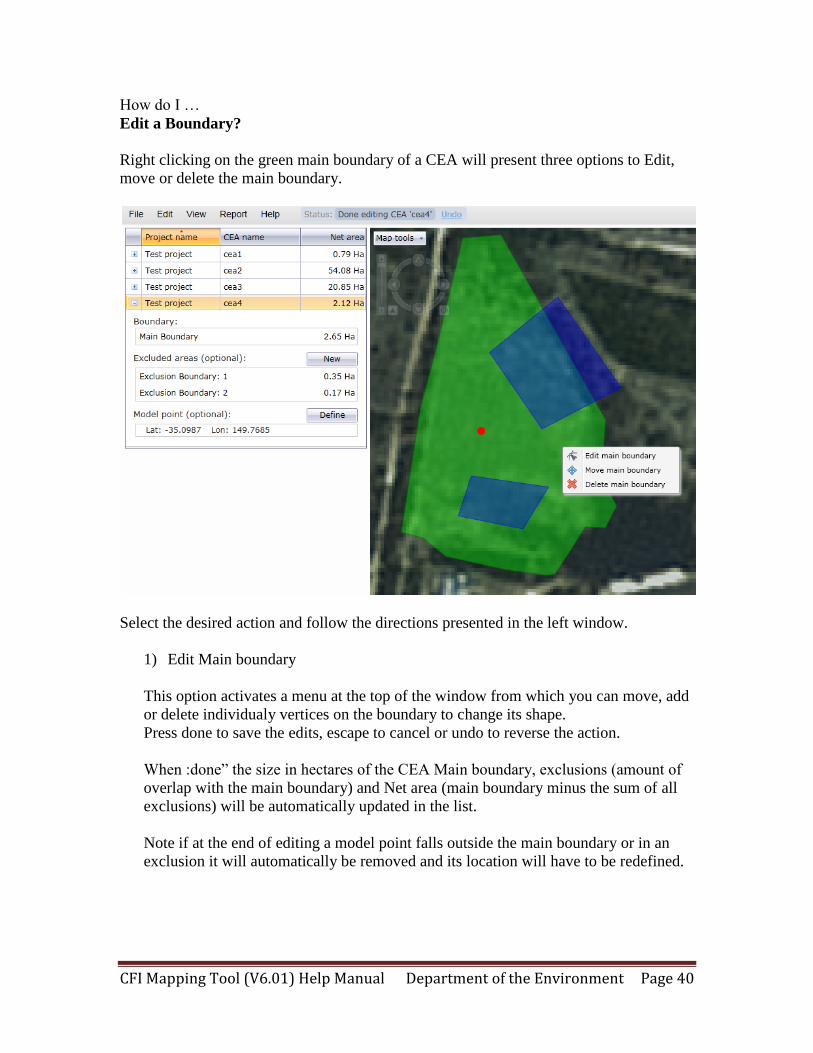
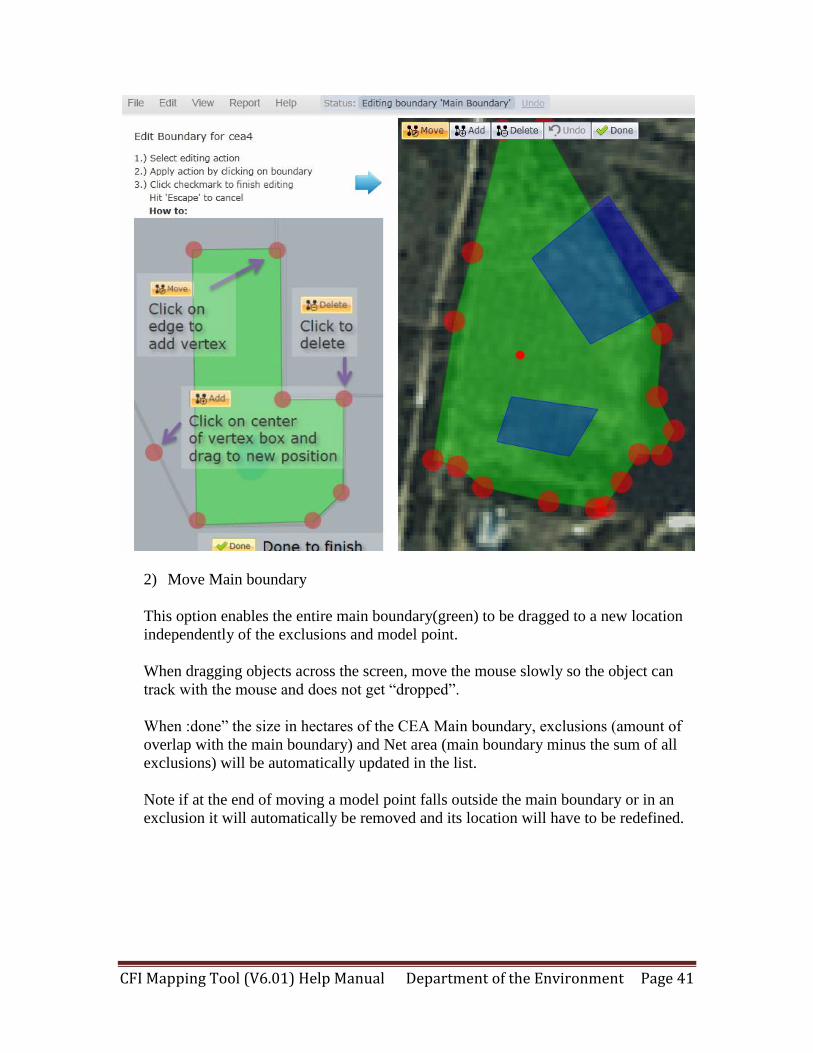
Edit a Boundary?
Edit an Exclusion?
Change a Model Point?
Delete a Boundary?
Delete an Exclusion?
Delete a Model Point?
Move a Boundary ?
Move an Exclusion?
Move a Model Point?
CFI Mapping Tool (V6.01) Help Manual Department of the Environment Page 4
D. Managing one or more Carbon Estimation Areass:
How do I …
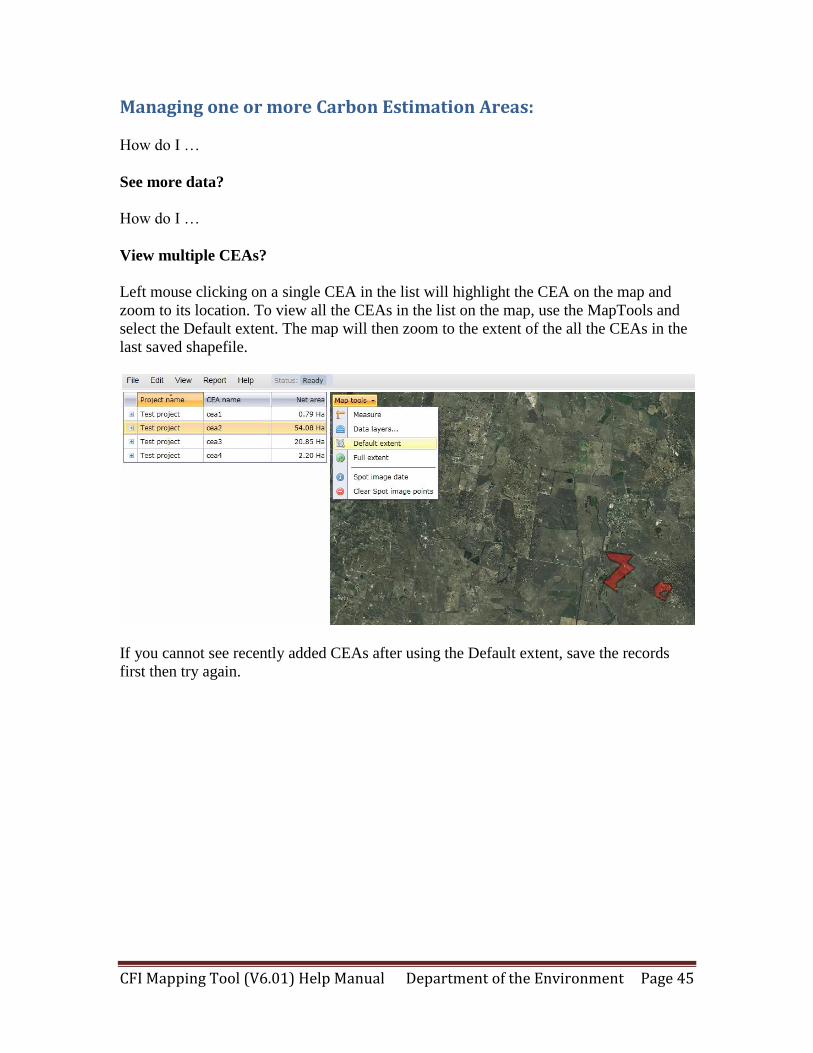
See more data?
Edit project names?
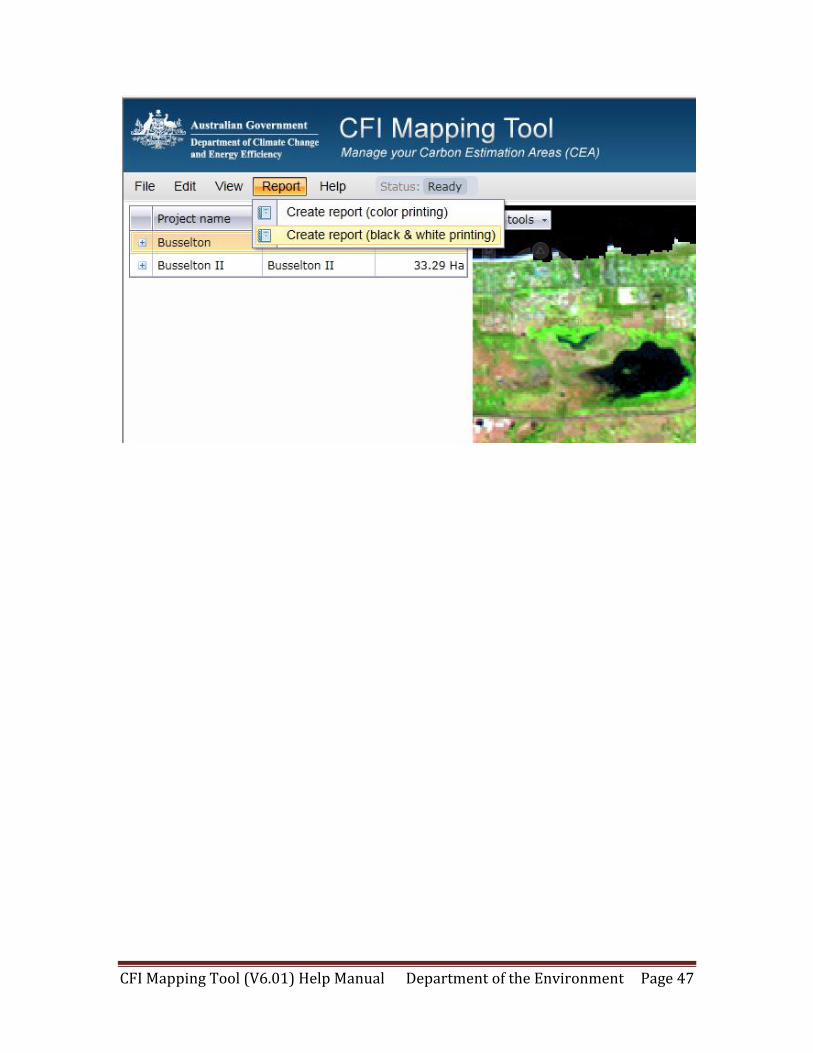
Create a Report?
Want to save/print my report?
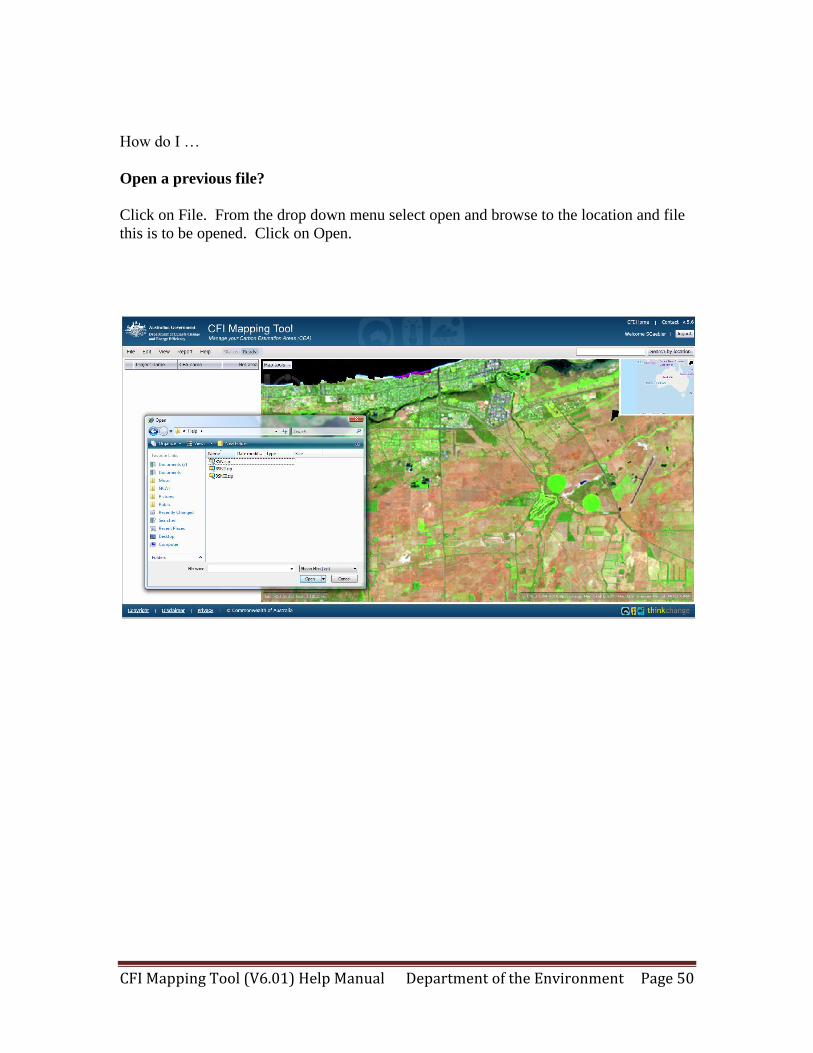
Save my current file?
Open a previous file?
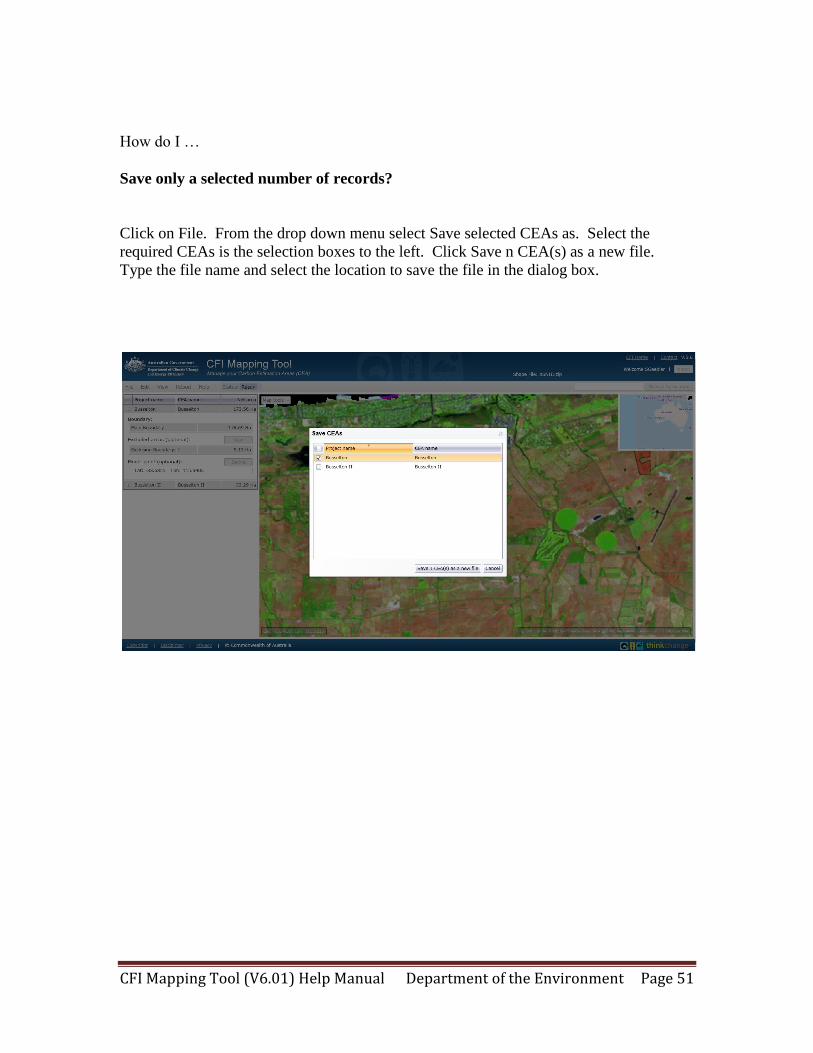
Save only a selected number of records?
Export my data to CSV?
CFI Mapping Tool (V6.01) Help Manual Department of the Environment Page 5
E. General actions:
How do I …
Locate a specific Carbon Estimation Area on the map?
Undo a change?
Add a new Forest Cover or Landsat layer?
Compare Datasets?
Import a shapefile?
Extract Forest Cover Data?
CFI Mapping Tool (V6.01) Help Manual Department of the Environment Page 6
F. Data management:
What is isolated storage?
What happens to my data if I lose my internet connection?
Where is the data kept? (How is the data stored)?
CFI Mapping Tool (V6.01) Help Manual Department of the Environment Page 7
Introduction
The Carbon Farming Initiative is a carbon offsets scheme established by the Australian
Government to provide new economic opportunities for farmers, forest growers and
landholders and help the environment by reducing carbon pollution.
The Carbon Farming Initiative includes:
Legislation to establish a carbon crediting mechanism;
Fast-tracked development of methodologies for offset projects; and
Information and tools to help farmers and landholders benefit from carbon
markets.
Many activities under the Carbon Farming Initiative will involve the specific and
accurate definition of Project Areas, for the purposes of:
meeting compliance obligations,
provision of information to the Administrator and
for the purpose of estimating abatement.
Most of these activities will be sequestration offsets projects.
The geospatial requirements for the CFI will be regulated by:
CFI Bill
CFI Regulations
CFI methodology determinations, and
CFI Geospatial Standards
CMT: The Carbon Farming Initiative (CFI) Mapping Tool is a Silverlight based
application designed to allow a user to meet these requirements.
This User Manual will assist proponents to use the CFI Mapping Tool (CMT) by
providing clear step by step instructions to use of the tool.
CFI Mapping Tool (V6.01) Help Manual Department of the Environment Page 8
Definitions
Project:
A project is the set of activities being undertaken across one or more Project Areas
Project Area:
An area of land on which the set of activities has been, is being, or is to be, carried out
and that may or may not include areas that are adjacent to the activities being undertaken
but not subject to the activities themselves – these areas must be subsequently excluded
from the Carbon Estimation Areas (see Figures on page 11)
Carbon Estimation Areas:
A subset of the Project Area that is defined through stratification or other means and is
used to determine the area for calculations for baseline or project abatement estimations,
A CEA will exclude certain areas from calculations, ie areas registered as part of the
Project Area where activities are not taking place.
A CEA may also be used to refer to other subsets of a Project Area that may be defined
under a methodology determination.
Model Point:
A point that is located within a CEA for the purpose of computer based modelling.
[Where this is not applicable the model point in the CMT may be used to identify certain
features.].
The primary mapping unit used in the CMT is the Carbon Estimation Area.
CFI Mapping Tool (V6.01) Help Manual Department of the Environment Page 9
What is the CFI Mapping Tool (CMT)?
The CFI Mapping Tool (CMT) is a web application enabling proponents to define
geographic areas as required under the methodology for the purpose of estimating
abatement.
The CMT enables users to:
• map Carbon Estimation Area(s) using remotely sensed imagery, including:
– 25m Landsat data for the period from 1990 to 2013;
– 2.5m SpotMap data acquired in the period 2006-2008;
– forest extent data for the period from 1990 to 2013;
– Map Data Sciences Foundation Map
– 2.5m black & white PRISM data from the ALOS Mission
– Additional online mapping services
• define CEA Exclusion areas
• determine the gross and net (of exclusion areas) area of CEAs in hectares
• identify a CFI Model Point (latitude and longitude) for entry into the Reforestation
Modelling Tool
• import geographic information from other sources; and
• produce summary reports of projects
• save Carbon Estimation Area(s) to their local computer and view and edit saved
projects;
A CMT map file may contain multiple CEAs across multiple Project Areas.
To use the application you will need to read the terms and conditions then agree by
clicking on the “I ACCEPT THE LICENSE AGREEMENT” button. This will close the
dialog and make the application available. If you do not agree to the terms and conditions
click the I DO NOT ACCEPT THE LICENSE AGREEMENT button and the application
will be closed.
CFI Mapping Tool (V6.01) Help Manual Department of the Environment Page 10
Terms and Conditions Dialog
CFI Mapping Tool (V6.01) Help Manual Department of the Environment Page 11
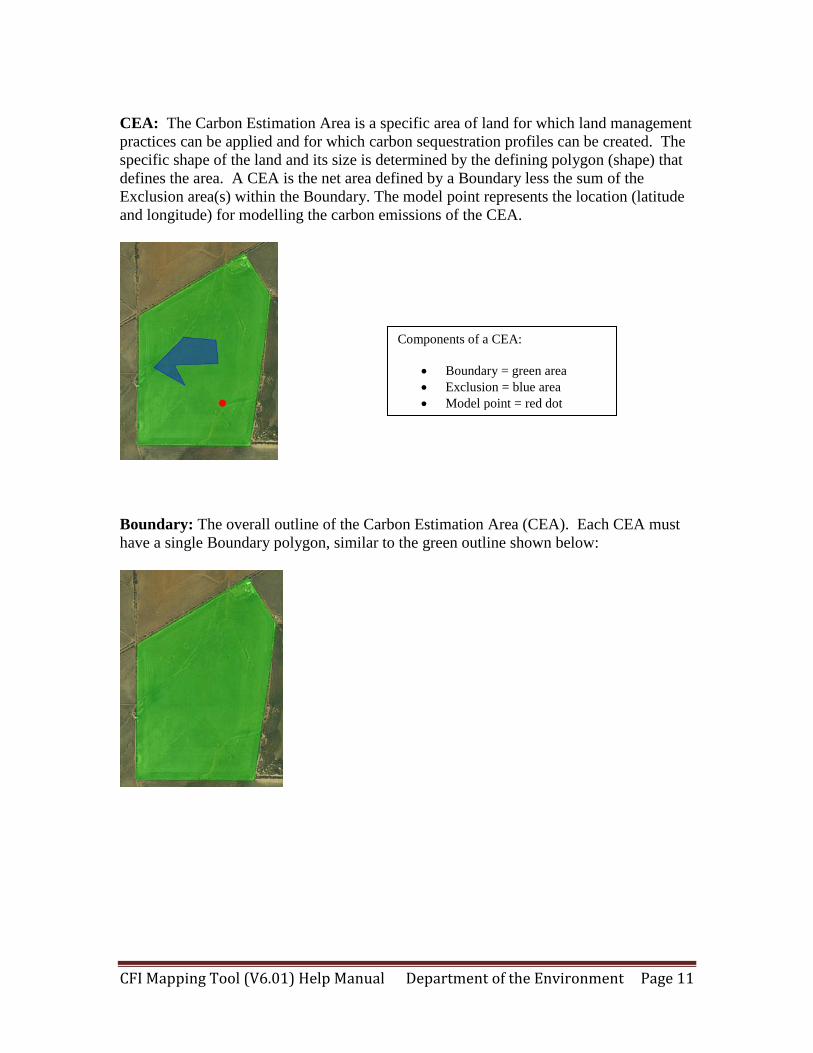
CEA: The Carbon Estimation Area is a specific area of land for which land management
practices can be applied and for which carbon sequestration profiles can be created. The
specific shape of the land and its size is determined by the defining polygon (shape) that
defines the area. A CEA is the net area defined by a Boundary less the sum of the
Exclusion area(s) within the Boundary. The model point represents the location (latitude
and longitude) for modelling the carbon emissions of the CEA.
Boundary: The overall outline of the Carbon Estimation Area (CEA). Each CEA must
have a single Boundary polygon, similar to the green outline shown below:
Components of a CEA:
Boundary = green area
Exclusion = blue area
Model point = red dot
CFI Mapping Tool (V6.01) Help Manual Department of the Environment Page 12
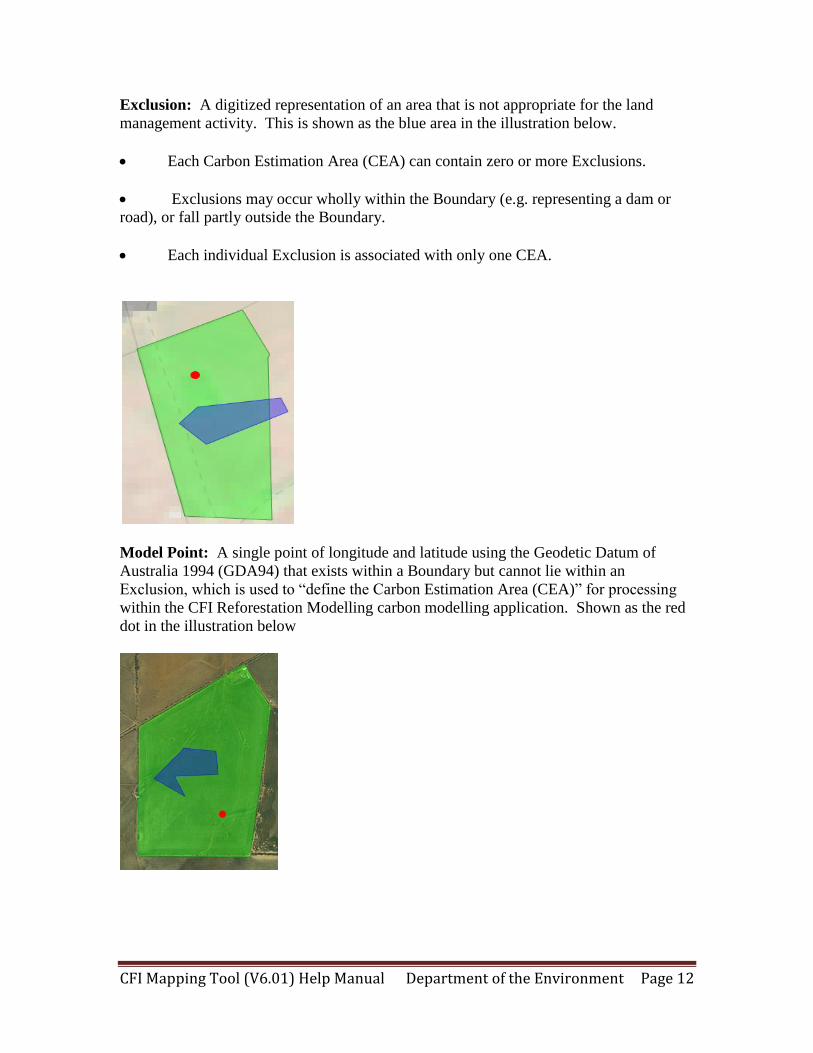
Exclusion: A digitized representation of an area that is not appropriate for the land
management activity. This is shown as the blue area in the illustration below.
Each Carbon Estimation Area (CEA) can contain zero or more Exclusions.
Exclusions may occur wholly within the Boundary (e.g. representing a dam or
road), or fall partly outside the Boundary.
Each individual Exclusion is associated with only one CEA.
Model Point: A single point of longitude and latitude using the Geodetic Datum of
Australia 1994 (GDA94) that exists within a Boundary but cannot lie within an
Exclusion, which is used to “define the Carbon Estimation Area (CEA)” for processing
within the CFI Reforestation Modelling carbon modelling application. Shown as the red
dot in the illustration below
CFI Mapping Tool (V6.01) Help Manual Department of the Environment Page 13
Report: A summary of one or more Carbon Estimation Areas presented in both map and
tabular format. Reports are created by a user, and can be viewed online, printed and
saved in Adobe Portable Document Format (pdf). An example is shown below:
CFI Mapping Tool (V6.01) Help Manual Department of the Environment Page 14
Data Layer: A data layer is a spatial view of information. Data layers within the
application include high and medium resolution satellite imagery, street maps, coastline,
and forest extents. The example below shows two data layers on the same map: medium
resolution Landsat satellite imagery and the coastline (blue outline). Each layer can be
turned on and off or be displayed with different levels of transparency using the map
services controls available through the maptools/data layers menu.
CFI Mapping Tool (V6.01) Help Manual Department of the Environment Page 15
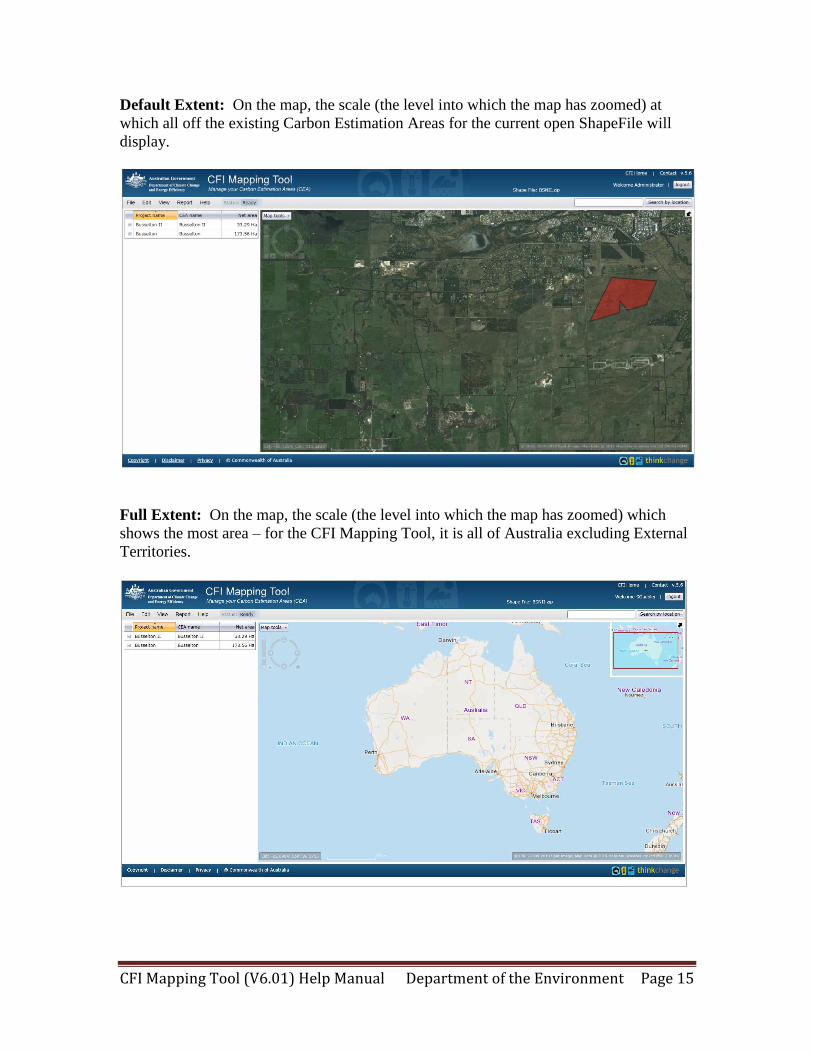
Default Extent: On the map, the scale (the level into which the map has zoomed) at
which all off the existing Carbon Estimation Areas for the current open ShapeFile will
display.
Full Extent: On the map, the scale (the level into which the map has zoomed) which
shows the most area – for the CFI Mapping Tool, it is all of Australia excluding External
Territories.
CFI Mapping Tool (V6.01) Help Manual Department of the Environment Page 16
Using the Map
How do I …
Navigate the map?
Navigating the map involves three basic functions: zooming in, zooming out, and
panning (going sideways). There are two ways to achieve these actions – through the use
of the Map Navigation Wheel and via your mouse.
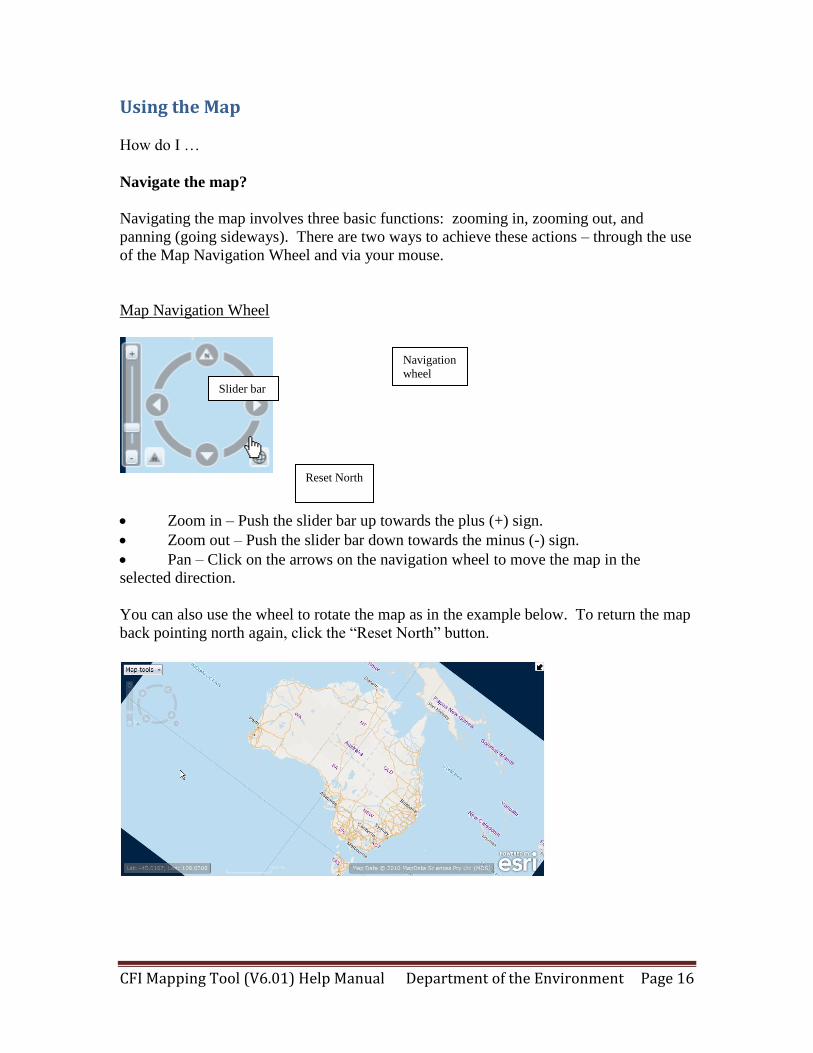
Map Navigation Wheel
Zoom in – Push the slider bar up towards the plus (+) sign.
Zoom out – Push the slider bar down towards the minus (-) sign.
Pan – Click on the arrows on the navigation wheel to move the map in the
selected direction.
You can also use the wheel to rotate the map as in the example below. To return the map
back pointing north again, click the “Reset North” button.
Slider bar
Navigation
wheel
Reset North
CFI Mapping Tool (V6.01) Help Manual Department of the Environment Page 17
Using your mouse
Begin by placing your cursor on the map.
Zoom in – Push the scroll button forward (away from you).
Zoom out – Push the scroll button backwards (towards you).
Pan – Left click on the map and hold the button down. Then you’re your mouse
in the direction you wish to move.
There are two additional navigation capabilities only a click away. Under the Map Tools
menu:
Full Extent – click this option to return the map to it furthest zoom level – all of
Australia.
Default Extent – click this option to return the map to the zoom level that displays all of
the available polygons.
CFI Mapping Tool (V6.01) Help Manual Department of the Environment Page 18
How do I …
Search for a specific location on the map?
To locate a specific place on the map, use the “Search by location” button and associated
text box, located in the upper right hand side of the map.
Follow these steps:
1. Enter the text you wish to search with.
2. Press the “Search by location button”. A results box will display.
3. If one or more results are returned, click on the one you wish.
4. The system will zoom to the selected location, placing a bull’s-eye marker at its
centre.
5. If no results are found, clear your search string and try another string. Incorrect
spellings may result in no results being returned
6. Note: the search results are categorized to make finding the correct selection
easier.
Search string and results list.
Search string
Search results
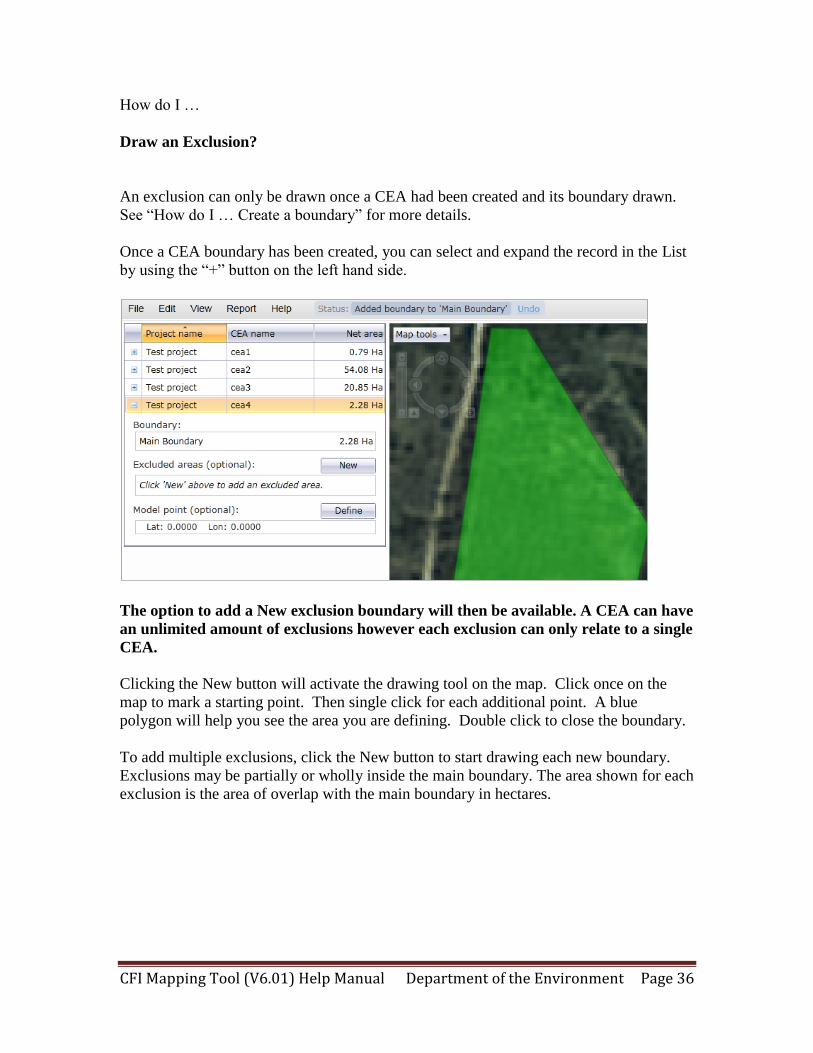
Selection (example)
CFI Mapping Tool (V6.01) Help Manual Department of the Environment Page 19
Mapped zoomed to selected option.
Bull’s-eye marker
CFI Mapping Tool (V6.01) Help Manual Department of the Environment Page 20
How do I …
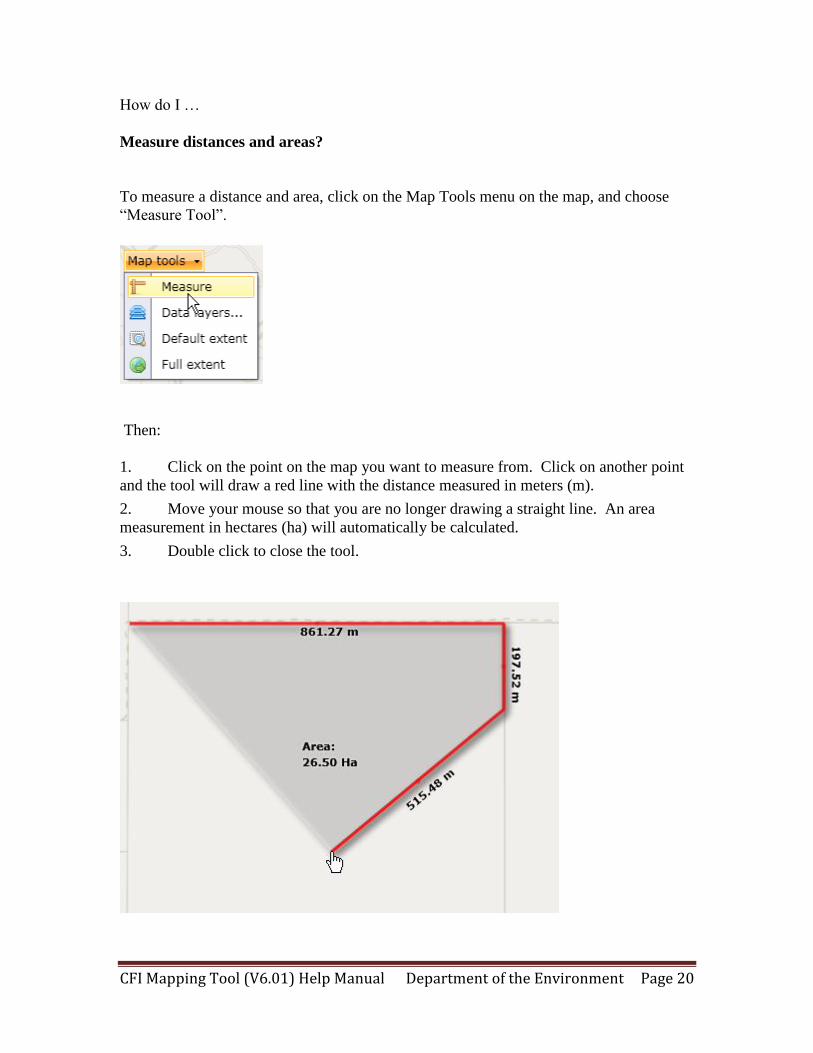
Measure distances and areas?
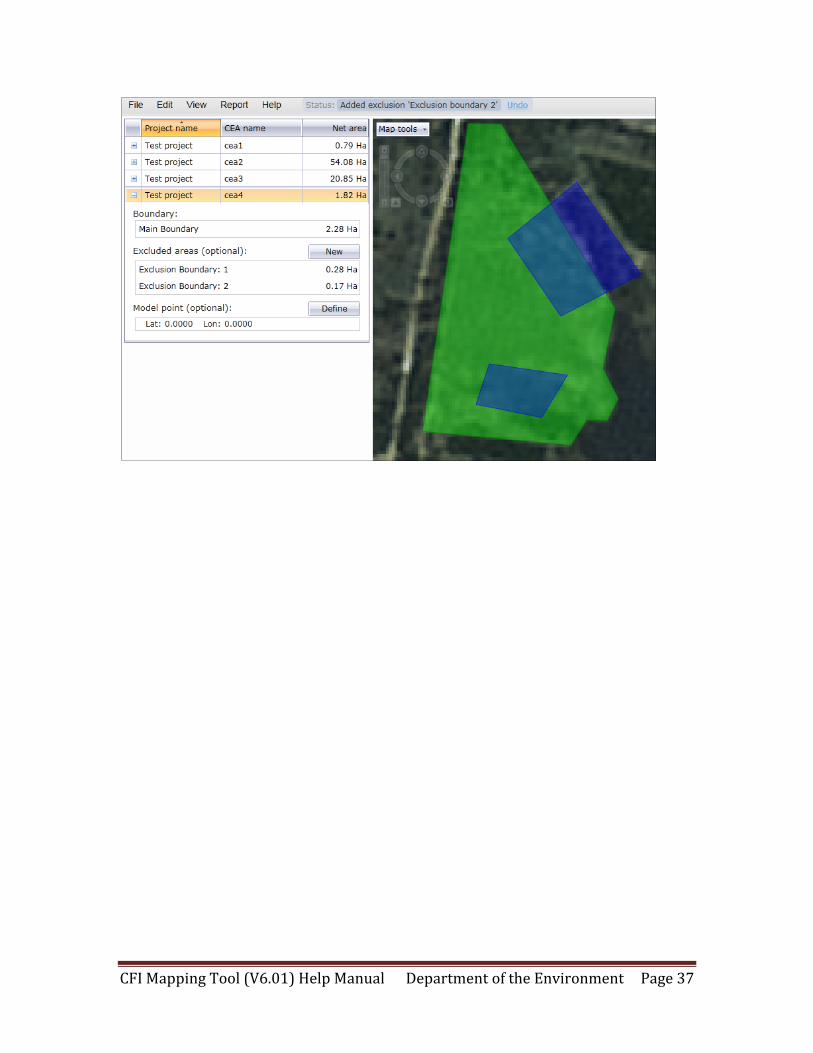
To measure a distance and area, click on the Map Tools menu on the map, and choose
“Measure Tool”.
Then:
1. Click on the point on the map you want to measure from. Click on another point
and the tool will draw a red line with the distance measured in meters (m).
2. Move your mouse so that you are no longer drawing a straight line. An area
measurement in hectares (ha) will automatically be calculated.
3. Double click to close the tool.
CFI Mapping Tool (V6.01) Help Manual Department of the Environment Page 21
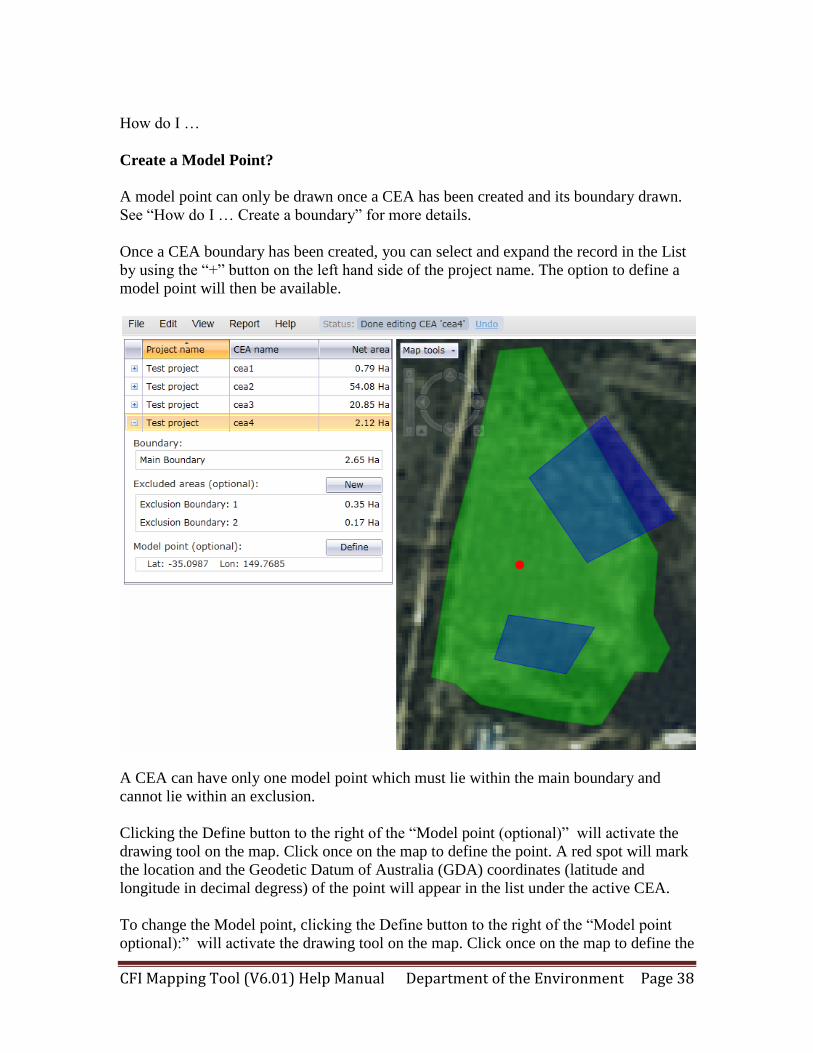
How do I …
Add new data layers?
To add a data layer, click on the Map Tools menu on the map, and choose “Data Layers
…”.
A “Map Services” dialogue box will appear. Map services are web based entities that
provide access to particular map data. A number have been made available to the
application without you having to ask for them. You simply turn them off or on.
Each map service has a name and corresponding check box. To add the data layer to
your map, click the check box on (black “”). To remove the data layer from your map,
click the check box off (blank).
To adjust the transparency of a data layer:
For each data layer, a slider bar exists. When set to the far right, the data layer is 100%
opaque. If the slider bar is all the way to the left, the data layer is 0% opaque (100%
transparent). You can adjust the transparency level of any layer. Doing so allows you to
see more than one layer on the map at a time, overlain on top of each other. Note that
setting transparency levels and overlaying data layers will change the original colours of
the data and may make some information hard to see. You need to experiment a little to
see what works best for you.
CMT Version 6.01 supports 30 additional data layers which can be turned on and off as
explained on Page 59.
CFI Mapping Tool (V6.01) Help Manual Department of the Environment Page 22
You can also add your own data layer by accessing any available map service. To do so,
you need to you know the name of the service URL you wish to access. Type the
Service url into the first box, provide a more user friendly name in the second (what will
display in the dialogue box) and then press the Add button.
Pressing the Cancel button will prevent the URL from being added to your list. Pressing
the “Reset” button will restore your list of Map Services to those provided by the system
by default (as they were the first time you accessed the system). Pressing the OK button
will save your changes, close the dialogue box, and return you to the map.
In the example below, the following Terrain map service was added:


![cMT-G01 Startup Guide - · PDF file[cMT Series] » [Maintenance] » [cMT-G01 OS Upgrade]. ... cMT Gateway Viewer can read from or write to PLC. ... cMT-G01 Startup Guide](https://static.documents.pub/doc/80x56/5ab85bac7f8b9ad13d8c70d9/cmt-g01-startup-guide-cmt-series-maintenance-cmt-g01-os-upgrade-cmt.jpg)

