19
Carbon Footprint Report - Fiscal Year 2011- Report by

Carbon Footprint Report
- Fiscal Year 2011-
Report by

Table of content
INTRODUCTION.......................................................................................... 1
1. CONTEXT ................................................................................................ 2
1.2. WHAT IS ONE TONNE OF CO2 ................................................................................................................. 2
2. CARBON FOOTPRINT .............................................................................. 3
2.1. QUICK PRESENTATION OF THE EIB AND EIF .......................................................................................... 3 2.2. METHODOLOGY ..................................................................................................................................... 3 2.3. CARBON BALANCE ................................................................................................................................ 5 2.3.1. Global footprint for EIB and EIF ...................................................................................................... 5 2.3.2. In-company emissions........................................................................................................................ 7 2.3.3. Mobility emissions ............................................................................................................................. 8 2.3.4. Paper consumption .......................................................................................................................... 10 2.3.5. Waste ............................................................................................................................................... 10
4. CONCLUSION ........................................................................................ 12
5. ENVIRONMENTAL INDICATORS 2011 ................................................... 13
ANNEX 1 ................................................................................................... 14
REFERENCES ............................................................................................ 15
KEY TERMS ............................................................................................... 16
Disclaimer
CO2logic cannot be held responsible for the consequences of the utilisation of these results,
data, recommendations or any other figures provided by CO2logic related to any project or con-
sultancy task they have carried out.

EIB 2011 Carbon Footprint Report
- 1 -
Introduction
Climate change is one of the greatest challenges facing nations, governments, business and
citizens over the coming decades. The release of CO2 and other greenhouse gases due to hu-
man activities, e.g. through the burning of fossil fuels, will have an effect on future climate. The
impacts will range from affecting agriculture, endangering food security, rising sea levels, the
acceleration of coastal zones erosion, increasing intensity of natural disasters, species extinction
and the spread of vector-borne diseases. These impacts will be global but also local (IPCC 2007).
Europe has set the ball rolling and real action to help reach the 20-20-20 targets for 2020 are now
being implemented. Thousands of companies and organisations are now calculating their Green-
house Gas emissions related to their direct and indirect activities. Some companies are
measuring their emissions due to pan European regulation (e.g. ETS). Others companies are
calculating these emissions due to National regulation (e.g. Bilan Carbon® in France or the CRC
in the UK). However many companies are calculating their emissions voluntarily to show their
corporate social responsibility and so as to gauge their impact on climate change. Carbon foot-
printing has helped many International and European Institutions quantify the CO2 reduction
efforts they have made. This has also allowed various actors to make carbon reduction commit-
ments over time through renewable energy initiatives, energy efficiency transport and logistics
optimization and many other innovative solutions. The EIB has been calculating their CO2 foot-
print since 2007 giving them a good baseline from which to evolve in the future. This report
summarises the results of the 2011 carbon footprint of the EIB.
Single Point of Contact:
Tanguy du Monceau
EIB 2011 Carbon Footprint Report
- 2 -
1. Context
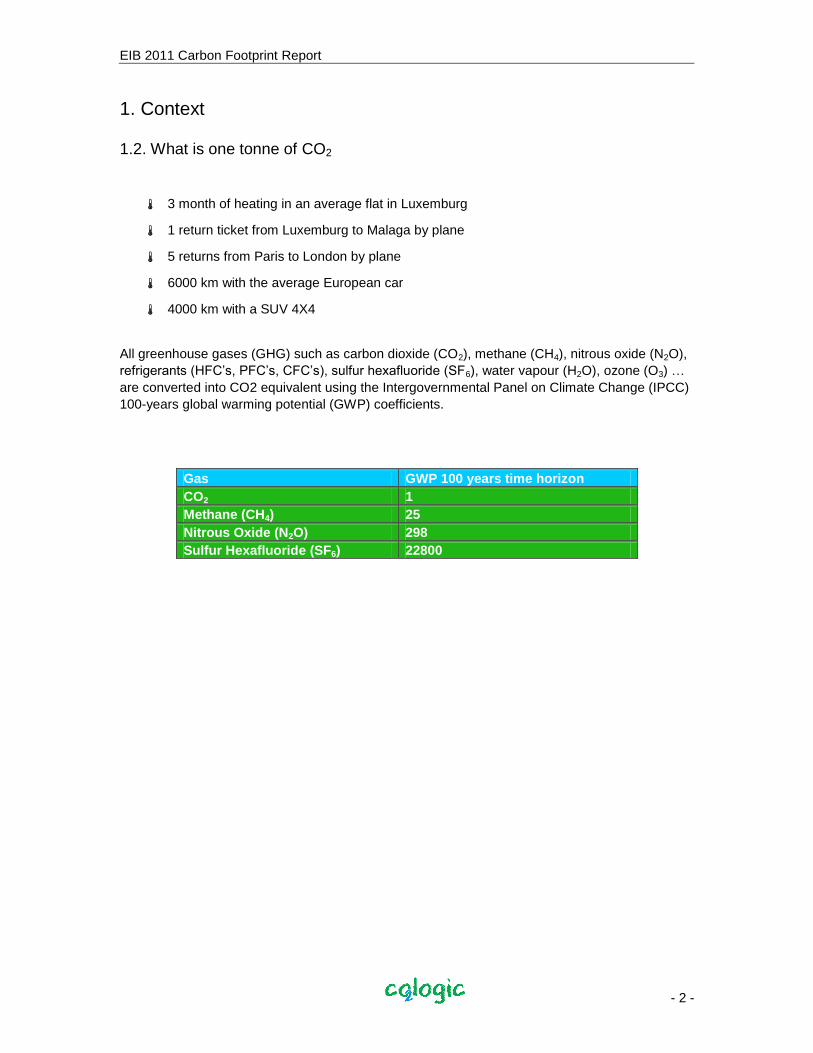
1.2. What is one tonne of CO2
3 month of heating in an average flat in Luxemburg
1 return ticket from Luxemburg to Malaga by plane
5 returns from Paris to London by plane
6000 km with the average European car
4000 km with a SUV 4X4
All greenhouse gases (GHG) such as carbon dioxide (CO2), methane (CH4), nitrous oxide (N2O),
refrigerants (HFC’s, PFC’s, CFC’s), sulfur hexafluoride (SF6), water vapour (H2O), ozone (O3) …
are converted into CO2 equivalent using the Intergovernmental Panel on Climate Change (IPCC)
100-years global warming potential (GWP) coefficients.
Gas GWP 100 years time horizon
CO2 1
Methane (CH4) 25
Nitrous Oxide (N2O) 298
Sulfur Hexafluoride (SF6) 22800
EIB 2011 Carbon Footprint Report
- 3 -
2. Carbon Footprint
2.1. Quick presentation of the EIB and EIF
The European Investment Bank was established in 1958 under the Treaty of Rome. The Euro-
pean Investment Bank is the European Union’s financing institution, whose remit is to contribute
towards the integration, balanced development and economic and social cohesion of the Member
States. In particular financing is provided for regional development, Trans-European Networks of
transport, telecommunications and energy, research, development and innovation, environmental
improvement and protection, health and education. To that end, it raises substantial funds on the
capital markets, which it channels, on the keenest terms, into the financing of projects that meet
EU objectives. Outside the Union, the EIB implements the financial components of agreements
concluded under the European development aid and cooperation policies.
The EIB and EIF have their head office buildings in Luxemburg (East & West Kirchberg, Hamm)
next to each other on the Kirchberg Plateau in Luxemburg. The EIB has been based in Luxem-
burg since 1968 and moved onto the Kirchberg Plateau in 1980. The EIB and EIF employ 2175
people The EIB also has small international subsidiary offices around the world which report to
the head office.
2.2. Methodology
To carry out this carbon footprint report we used the emission conversion factors from the recog-
nised Bilan Carbone® ADEME tool or from the WRI GHG Protocol, when no figures were
available for emission factors we used data from the CO2logic database and research. The con-
sultants at CO2logic are certified to use the Bilan Carbone® tool but other figures were used
when considered more adapted to the specific situation. The Bilan Carbone emission factors are
updated over time and the consultants follow these updates. For this new report the emission
factors from Bilan Carbone V.6, launched mid 2009 were used.
What is the Bilan Carbone® method?
Bilan Carbone® is a methodology developed by the ADEME (French government Agency for
Environment and Energy Management) allowing a consistent approach to measure and quantify
CO2 emissions. The Bilan Carbone® methodology is compliant with the ISO 14064 quality stan-
dard, the World Resources Institute and the World Business Council for Sustainable
Development, GHG Protocol Initiative Standard as well as the EU ETS Directive n° 2003/87/CE.
The results given in this report are designed to give the EIB and EIF an accurate view of their
carbon footprint. The results can be used to facilitate carbon reduction decision making. The time
period which this carbon footprint report covers is 01/01/2011 to 31/12/2011.

EIB 2011 Carbon Footprint Report
- 4 -
The items quantified in this study are:
Internal consumption, heating and electricity production. (all scope 1 emissions GHG
protocol, direct emissions)
Sourced electricity and heating (all scope 2 emissions GHG protocol, indirect emissions)
Employee commuting to and from work, employee business travel, paper consumption and
disposal of waste generated. (certain scope 3 emissions, GHG protocol and radiative forcing,
indirect emissions)
The EIB management has decided that the carbon footprint scope would be set as defined
above. At this stage the emissions from the EIB headquarters East & West Kirchberg, Hamm,
will be taken into account. The smaller international EIB offices are not taken into account in the
scope of this report.
This report has taken into account the GHG Protocol Initiative Standards as well as the latest
principles and indicators (G3) developed by the Global Reporting Initiative (GRI) to report on sus-
tainability. Using the Global Reporting Initiative definition of Materiality it is considered that
reporting on the EIB and EIF carbon footprint is of significant importance. This report has been
written in a way so as to facilitate sustainability reporting in accordance with the latest principles
and indicators (G3) developed by the Global Reporting Initiative. This includes the principles for
ensuring report quality and guidance for boundary setting. Calculations were all based on figures
provided by the EIB and the EIF who obtained them from their invoices. These figures were then
sent to CO2logic. The accuracy of the results of the report relies on the exactitude of the figures
provided by the EIB and EIF.

EIB 2011 Carbon Footprint Report
- 5 -
2.3. Carbon Balance
2.3.1. Global footprint for EIB and EIF
Within the emission boundary set, as explained above the results obtained show that the total
carbon footprint of the EIB group comes to 19,682 tonnes of Carbon Dioxide equivalent (tCO2 eq)
per year thus an overall increase of 3.6% on 2010 emissions (18,997 tonnes of CO2 in 2010,
16,576 tonnes in 2009 and 19,653 tonnes of CO2 in 2008). However, as the number of staff also
increased from 2010 to 2011 this implicates an overall decrease in CO2 emission per staff mem-
ber within the scope of the exercise (9.05
tonnes of CO2 in 2011, 9.13 tonnes in 2010).
The CO2 emissions coming from in-company
emissions, which relate to heating, electricity
and co-generation, account for 824 tonnes
of CO2 thus representing 4% of the total
emissions (this is less than 1% increase
compared to the 831 tonnes of CO2 in 2010).
The emissions coming from mobility i.e. the
travel of employees due to transport, com-
muting and air travel account for 18,744
tonnes of CO2 thus 94% of emissions ( this
makes 719 tonnes of CO2 or 4% more than
2010 where 18,025 tonnes were emitted). It
should be noted that a radiative forcing fac-
tor of x2 was used for air travel as according
to the Bilan Carbone® methodology. This
however differs from the GHG Protocol
which does not take
into account radiative
forcing which would
mean the airflight re-
sults would be halved.
The emissions related
to paper consumption
account for 115 tonnes
of CO2 thus 0.6 % of
total emissions (de-
crease of 21%
compared to 146 ton-
nes in 2010).
The emissions from
waste disposal ac-
count for -1.6 tonnes
of CO2 (compared to -
824
18744
115
-1.6
-5000
0
5000
10000
15000
20000
Global footprint (t CO2 eq)
In-company emissions
4%
Mobility ; 94%
Paper consumpt
ion emissions
1%
Wastes emissions
0%

EIB 2011 Carbon Footprint Report
- 6 -
4.2 tonnes of CO2 in 2010). Some waste is used as an energy source to produce electricity and
thus replaces the use of fossil fuels.

EIB 2011 Carbon Footprint Report
- 7 -
2.3.2. In-company emissions
The emissions related to this category are those related to internal production of heat and elec-
tricity as well as emissions from externally sourced electricity and heating. As green electricity
was used no direct emissions are counted for the electricity production as according to the Bilan
Carbone methodology.
In-company emissions account for 824 tonnes of CO2 thus 4.2% of the total emissions (compared
to 831 tonnes of CO2 in 2010 thus a reduction of 0.7%).
This means 0.38 tonnes of CO2 per employee for this emission category.
The following data was collected by the facilities management:
Steam heating West Kirchberg, 257.5 tonnes of CO2 ( (Steam 5,984,556 Kwh purchased)
(Increase of 18% CO2 on 2010)
Steam heating East Kirchberg, 132.78 tonnes of CO2 (Steam 3,087,950 Kwh purchased)
(30% CO2 reduction on 2010)
Boiler Hamm, 302 tonnes of CO2 (Gas 1,508,500 Kwh purchased) (54% CO2 increase on
2010)
Co-generation Hamm, 131.5 tonnes of CO2 (Gas 655,793 Kwh purchased) (0 % CO2
change on 2010)
All EIB purchased electricity is green electricity and the EIB is proprietor of the related green
guarantees of origins. The electricity produced by the cogeneration system in the Hamm building
is not used internally by the EIB as it is sold to the network and green electricity is bought instead.
However the EIB profits directly from the sale of this electricity thus the gas consumption and
therefore the CO2 emissions created by this cogeneration system are fully allocated to the EIB
Hamm building CO2 emissions. Gas consumption was converted from PCS to PCI figures to en-
132.8
302.6 131.5
257.6
EIB and EIF in company emissions (t CO2 eq)
East Kirchberg 16%
Boiler Hamm 37%
Cogeneration Hamm 16%
S.D.H. West Kirchberg 31%

EIB 2011 Carbon Footprint Report
- 8 -
sure further accuracy of calculations. The EIB air-conditioning systems use ammonium so there is
no global warming impact from leakage only the electricity usage which is already accounted for.
The Kirchberg plateau has a positive particularity that all the buildings being heated can use the
steam from the Kirchberg power plant. For steam heating purchased we were provided by the
supplier with an emissions factor of 43g CO2 per Kwh1. This was used for all steam purchased.
Co-generation systems are very positive and minimise energy loss.
2.3.3. Mobility emissions
Mobility related CO2 emissions included emissions from commuting, company fleet cars, a shuttle
service between the various buildings and CO2 emissions from travel by plane and train.
Mobility emissions represent 18,744 tonnes of CO2 thus 94% of the total emissions (compared to
18,025 tonnes of CO2 in 2010 thus an increase of 4% accumulated to the previous year increase
of 16% this justifies a large increase in emissions). This means 8.62 tonnes per employee for this
emission category. Clearly this is an important element for which further reduction efforts need to
be made considering the planet can support 1.8 tonnes per person per year2.
In relation to transport by cars commuting represents 6369 tonnes of CO2 and the fleet of cars
used by the management represent 103.4 tonnes of CO2
For the EIB and EIF the following information was provided by the facilities management:
Owned management cars EIB & EIF 103.1 tonnes of CO2. (-8% CO2 on 2010)3
Building minibus service, 140.8 tonnes of CO2 (8% CO2 increase on 2010)
Commuting EIB & EIF, 6,369 tonnes of CO2 (19,699,050 km) International Travel EIB &
EIF,
1 2007 figure provided by e-mail from Kirchberg plant management
2 www.manicore.com
3 Bassed of fuel consumption date provided and total of 505,646 km
103.148
6369
Fleet and commuters EIB & EIF (t CO2 eq)
Fleet for management 2%
Commuting 98%
EIB 2011 Carbon Footprint Report
- 9 -
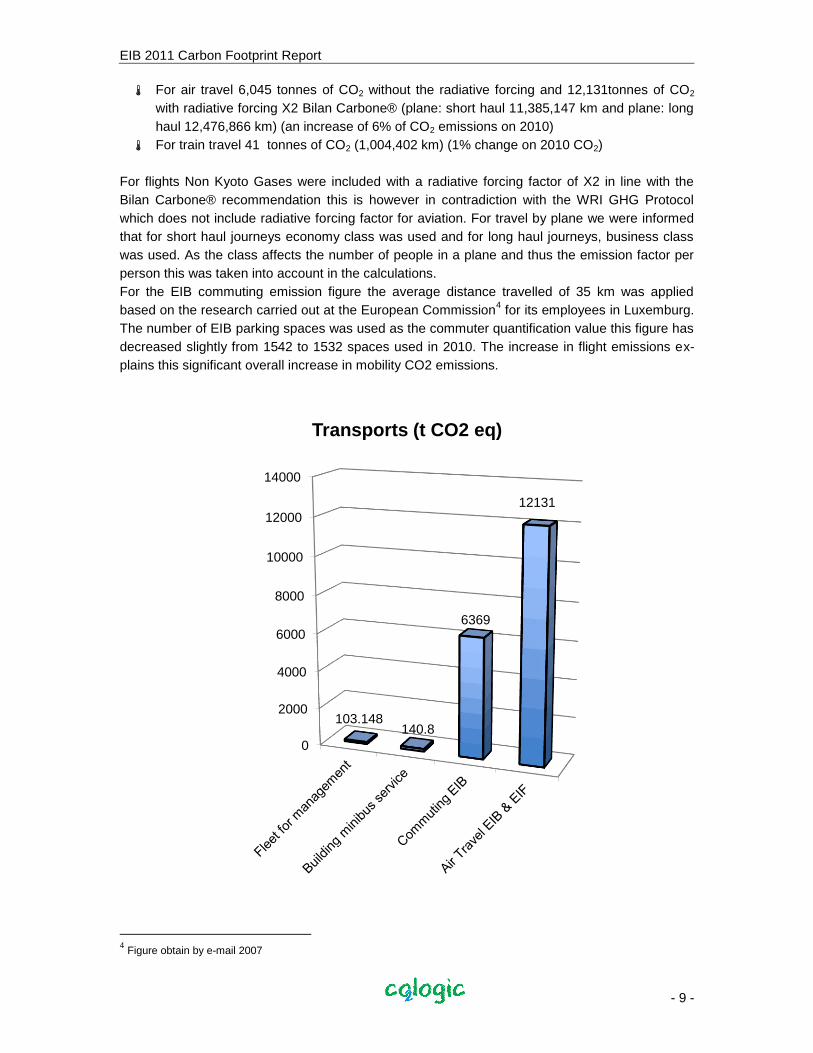
For air travel 6,045 tonnes of CO2 without the radiative forcing and 12,131tonnes of CO2
with radiative forcing X2 Bilan Carbone® (plane: short haul 11,385,147 km and plane: long
haul 12,476,866 km) (an increase of 6% of CO2 emissions on 2010)
For train travel 41 tonnes of CO2 (1,004,402 km) (1% change on 2010 CO2)
For flights Non Kyoto Gases were included with a radiative forcing factor of X2 in line with the
Bilan Carbone® recommendation this is however in contradiction with the WRI GHG Protocol
which does not include radiative forcing factor for aviation. For travel by plane we were informed
that for short haul journeys economy class was used and for long haul journeys, business class
was used. As the class affects the number of people in a plane and thus the emission factor per
person this was taken into account in the calculations.
For the EIB commuting emission figure the average distance travelled of 35 km was applied
based on the research carried out at the European Commission4 for its employees in Luxemburg.
The number of EIB parking spaces was used as the commuter quantification value this figure has
decreased slightly from 1542 to 1532 spaces used in 2010. The increase in flight emissions ex-
plains this significant overall increase in mobility CO2 emissions.
4 Figure obtain by e-mail 2007
0
2000
4000
6000
8000
10000
12000
14000
103.148 140.8
6369
12131
Transports (t CO2 eq)
EIB 2011 Carbon Footprint Report
- 10 -
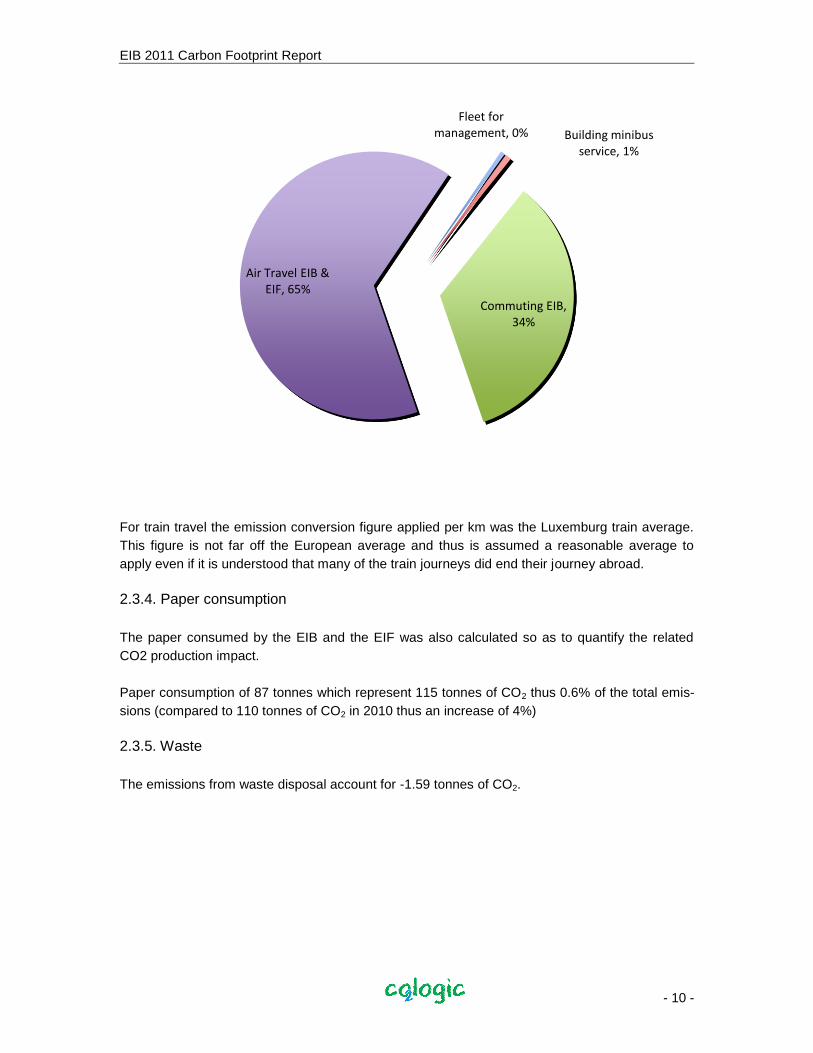
For train travel the emission conversion figure applied per km was the Luxemburg train average.
This figure is not far off the European average and thus is assumed a reasonable average to
apply even if it is understood that many of the train journeys did end their journey abroad.
2.3.4. Paper consumption
The paper consumed by the EIB and the EIF was also calculated so as to quantify the related
CO2 production impact.
Paper consumption of 87 tonnes which represent 115 tonnes of CO2 thus 0.6% of the total emis-
sions (compared to 110 tonnes of CO2 in 2010 thus an increase of 4%)
2.3.5. Waste
The emissions from waste disposal account for -1.59 tonnes of CO2.
Fleet for management, 0% Building minibus
service, 1%
Commuting EIB, 34%
Air Travel EIB & EIF, 65%

EIB 2011 Carbon Footprint Report
- 11 -
The following data was collected by the facilities management:
Domestic waste with valorisation spared 7.2 tonnes of CO2 ( a reduction of 36% com-pared to the 11.3 tonnes of CO2 spared in 2010)
Domestic waste without valorisation caused 2.2 tonnes of CO2 (a reduction of 49% com-pared to the 4.5 tonnes of CO2 in 2010)
Recycled Paper waste caused 2.52 tonnes of CO2 (an increase of 435% compared to 0.578 tonnes of CO2 in 2010)
Recycled Glass waste caused 0.723 tonnes of CO2 (0% change compared to 0.723 in 2010)
Recycled other waste caused 0.008 tonnes of CO2 (nearly a 100% reduction compared to 1.167 in 2010)
Recycled PMC caused 0.139 tonnes of CO2 ( a 43% increase compared to 0.097 tonnes of CO2 in 2010)
Metal waste caused 0.017 tonnes of CO2 (compared to 0 tonnes of CO2 in 2010)
Domestic waste with valorisation causes a positive emissions contribution as 75% of this waste is
measured to be valorised energetically in accordance with data provided by the local authorities
thus replacing energy which would normally have been produced from a non renewable fossil fuel
source. See annex 1 for details of waste data.
-8
-7
-6
-5
-4
-3
-2
-1
0
1
2
3
-7.2
2.2 2.52
0 0.723 0.008 0.139 0.017
t C
O2 e
q
EIB & EIF Waste emissions (t CO2 eq)
EIB 2011 Carbon Footprint Report
- 12 -
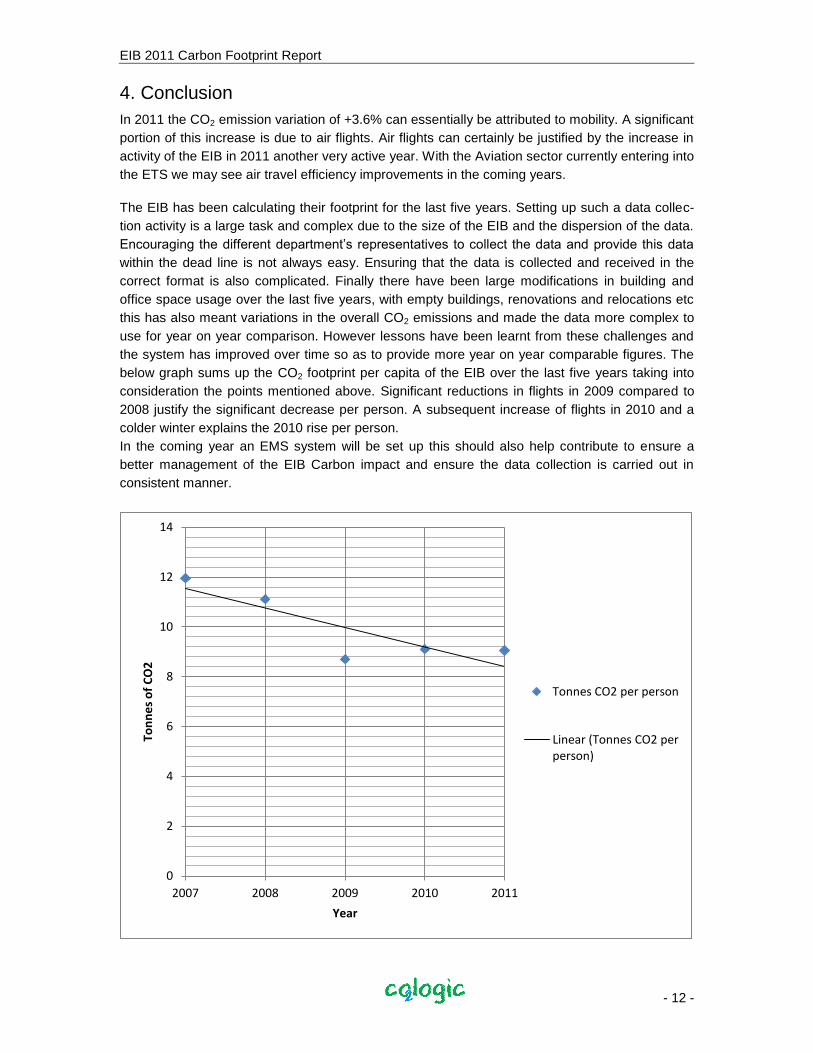
4. Conclusion
In 2011 the CO2 emission variation of +3.6% can essentially be attributed to mobility. A significant
portion of this increase is due to air flights. Air flights can certainly be justified by the increase in
activity of the EIB in 2011 another very active year. With the Aviation sector currently entering into
the ETS we may see air travel efficiency improvements in the coming years.
The EIB has been calculating their footprint for the last five years. Setting up such a data collec-
tion activity is a large task and complex due to the size of the EIB and the dispersion of the data.
Encouraging the different department’s representatives to collect the data and provide this data
within the dead line is not always easy. Ensuring that the data is collected and received in the
correct format is also complicated. Finally there have been large modifications in building and
office space usage over the last five years, with empty buildings, renovations and relocations etc
this has also meant variations in the overall CO2 emissions and made the data more complex to
use for year on year comparison. However lessons have been learnt from these challenges and
the system has improved over time so as to provide more year on year comparable figures. The
below graph sums up the CO2 footprint per capita of the EIB over the last five years taking into
consideration the points mentioned above. Significant reductions in flights in 2009 compared to
2008 justify the significant decrease per person. A subsequent increase of flights in 2010 and a
colder winter explains the 2010 rise per person.
In the coming year an EMS system will be set up this should also help contribute to ensure a
better management of the EIB Carbon impact and ensure the data collection is carried out in
consistent manner.
0
2
4
6
8
10
12
14
2007 2008 2009 2010 2011
Ton
ne
s o
f C
O2
Year
Tonnes CO2 per person
Linear (Tonnes CO2 per person)
EIB 2011 Carbon Footprint Report
- 13 -
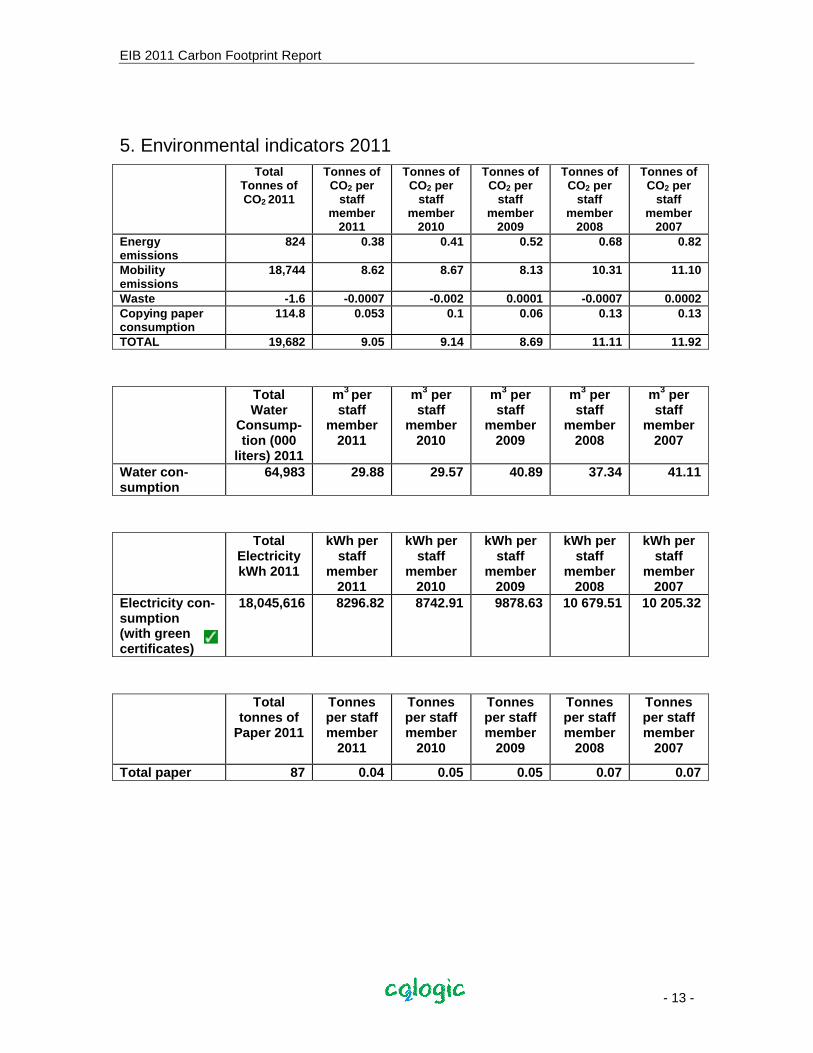
5. Environmental indicators 2011
Total Tonnes of CO2 2011
Tonnes of CO2 per
staff member
2011
Tonnes of CO2 per
staff member
2010
Tonnes of CO2 per
staff member
2009
Tonnes of CO2 per
staff member
2008
Tonnes of CO2 per
staff member
2007
Energy emissions
824 0.38 0.41 0.52 0.68 0.82
Mobility emissions
18,744 8.62 8.67 8.13 10.31 11.10
Waste -1.6 -0.0007 -0.002 0.0001 -0.0007 0.0002
Copying paper consumption
114.8 0.053 0.1 0.06 0.13 0.13
TOTAL 19,682 9.05 9.14 8.69 11.11 11.92
Total Water
Consump-tion (000
liters) 2011
m3 per
staff member
2011
m3 per
staff member
2010
m3 per
staff member
2009
m3 per
staff member
2008
m3 per
staff member
2007
Water con-sumption
64,983 29.88 29.57 40.89 37.34 41.11
Total Electricity kWh 2011
kWh per staff
member 2011
kWh per staff
member 2010
kWh per staff
member 2009
kWh per staff
member 2008
kWh per staff
member 2007
Electricity con-sumption (with green certificates)
18,045,616 8296.82 8742.91 9878.63 10 679.51 10 205.32
Total tonnes of
Paper 2011
Tonnes per staff member
2011
Tonnes per staff member
2010
Tonnes per staff member
2009
Tonnes per staff member
2008
Tonnes per staff member
2007
Total paper 87 0.04 0.05 0.05 0.07 0.07
EIB 2011 Carbon Footprint Report
- 14 -
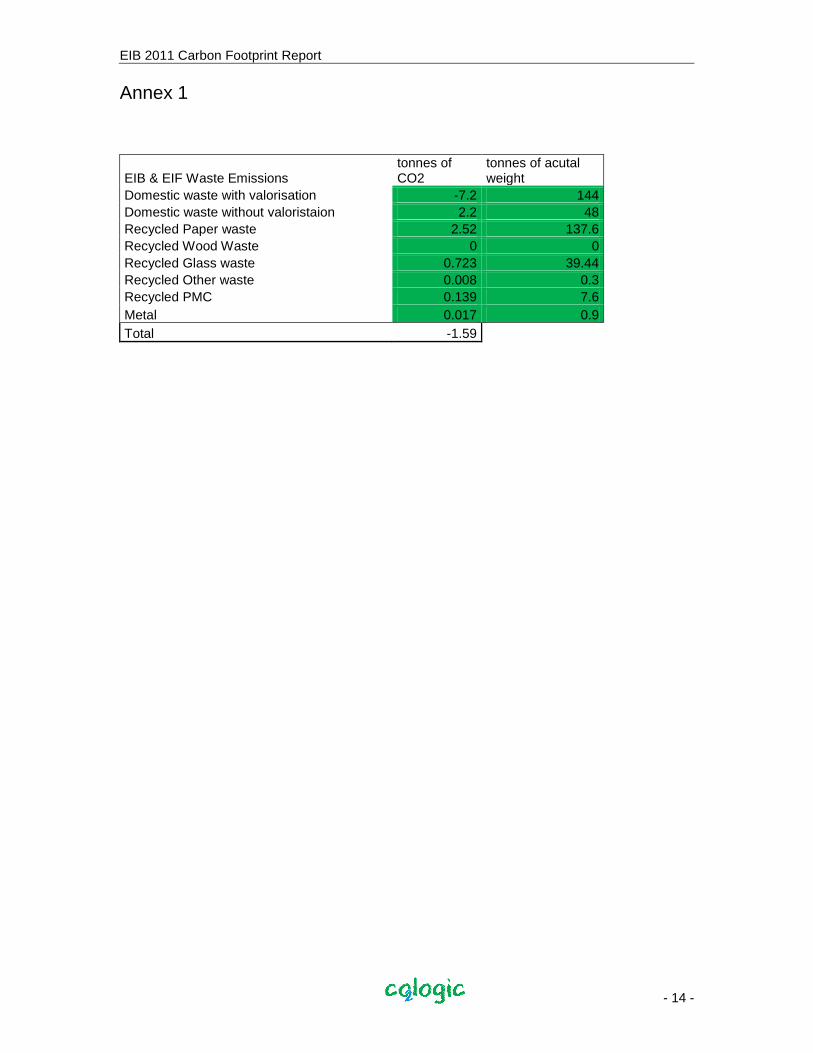
Annex 1
EIB & EIF Waste Emissions tonnes of CO2
tonnes of acutal weight
Domestic waste with valorisation -7.2 144
Domestic waste without valoristaion 2.2 48
Recycled Paper waste 2.52 137.6
Recycled Wood Waste 0 0
Recycled Glass waste 0.723 39.44
Recycled Other waste 0.008 0.3
Recycled PMC 0.139 7.6
Metal 0.017 0.9
Total -1.59

EIB 2011 Carbon Footprint Report
- 15 -
References
Agence de l’Environnement et de la Maitrise d’Energie (ADEME), Méthodologie Bilan Carbone®,
2006
Intergovernmental Panel on Climate Change, Fourth Assessment Report: The Physical Science Basis [vol.I], 2007. Intergovernmental Panel on Climate Change, Fourth Assessment Report: Impacts, Adaptation and Vulnerability, [vol.II], 2007.
Intergovernmental Panel on Climate Change, Fourth Assessment Report: Mitigation of Climate Change [vol.III], 2007.
Jancovici J-M. (August 2007) Que pouvons nous émettre comme CO2 si nous voulons lutter effi-cacement contre le réchauffement climatique ?. http://www.manicore.com/documentation/serre/quota_GES.html
Lehman Brothers, The Business of Climate Change I: Risks and opportunities, February 2007.
McKinsey, A cost curve for greenhouse gas reductions, January 2007.
Stern, N. et al. (October 2006), Stern Review: The Economics of Climate Change. The Carbon Trust. (December 2006) The Carbon Trust three stage approach to developing a robust offsetting strategy.

EIB 2011 Carbon Footprint Report
- 16 -
Key terms
Carbon Dioxide equivalent (CO2). An internationally accepted measure that, by means of
agreed conversion factors, expresses the global warming capacity of different greenhouse gases
in terms of the amount of carbon dioxide that would have the same global warming potential
(GWP).
Certified Emissions Reduction (CER). A carbon reduction credit for one tonne of CO2 as certi-
fied by the UNFCCC under the United Nations’ Clean Development Mechanism (CDM).
DEFRA (Department for Environment, Food and Rural affairs).
European Union Emissions Trading Scheme (EU ETS). The world’s largest multi-country,
multi-sector, greenhouse gas emission trading scheme. The scheme, in which all 25 member
states of the European Union participate, started operations on 1 January 2005.
Gold Standard (GS) Voluntary offset verification standard
Greenhouse gas (GHG). Any gas, such as carbon dioxide (CO2), methane (CH4) or water va-
pour (H2O) that gives rise to a greenhouse global warming impact.
Intergenerational equity. The issue of the fairness of the distribution of the costs and benefits
that are borne by different generations. In the case of climate change policy, for example, action
or inaction today has impacts not only on the present, but also on future, generations.
Intergovernmental Panel on Climate Change (IPCC). The IPCC was established in 1988 by
the World Meteorological Organization (WMO) and the United Nations Environment Programme
(UNEP). The role of the IPCC is to “… assess on a comprehensive, objective, open and trans-
parent basis the scientific, technical and socio-economic information relevant to understanding
the scientific basis of risk of human-induced climate change, its potential impacts and options for
adaptation and mitigation.”
Kyoto Protocol. An international agreement adopted in December 1997 in Kyoto (Japan). The
Protocol sets binding emission targets for developed countries that would reduce their emissions
on average by 5.2% below 1990 levels.
Radiative forcing. In climate science, defined as the difference between the incoming radiation
energy and the outgoing radiation energy in a given climate system. A positive forcing (more in-
coming energy) tends to warm the system, while a negative forcing (more outgoing energy) tends
to cool it. Possible sources of radiative forcing are changes in insulation (incident solar radiation),
or the effects of variations in the amount of radiatively active GHG gases present.
Social cost of carbon. The damage value of an additional tonne of carbon emissions.
United Nations Framework Convention on Climate Change (UNFCCC). A treaty, signed at
the 1992 Earth Summit in Rio de Janeiro, which calls for the “stabilization of greenhouse gas

EIB 2011 Carbon Footprint Report
- 17 -
concentrations in the atmosphere at a level that would prevent dangerous anthropogenic interfer-
ence
Vertified Emissions Reductions (VER) Offsets that are used in the voluntary market and which
are verified by a third party.


