Carbon Pricing in Practice: A Review of the Evidence CLIMATE POLICY LAB THE FLETCHER SCHOOL TUFTS UNIVERSITY THE CENTER FOR INTERNATIONAL ENVIRONMENT & RESOURCE POLICY REPORT 2017 Easwaran Narassimhan, Kelly S. Gallagher, Stefan Koester, and Julio Rivera Alejo
Transcript
Carbon Pricing in Practice: A Review of the Evidence
C L I M AT E P O L I C Y L A B
T H E F L E T C H E R S C H O O L
T U F T S U N I V E R S I T Y
T H E C E N T E R F O R
I N T E R N A T I O N A L
E N V I R O N M E N T &
R E S O U R C E P O L I C Y
R E P O RT 2 0 1 7
Easwaran Narassimhan, Kelly S. Gallagher, Stefan Koester, and Julio Rivera Alejo
This booklet is printed on 100% post-consumer paper
Carbon Pricing in Practice: A Review of the Evidence
Center for International Environment and Resource Policy, The Fletcher School, Tufts University 1
A B S T R ACTThis paper analyzes carbon pricing policies in fifteen regions (EU, Switzerland, Ireland, Norway, Regional Greenhouse Gas Initiative (RGGI) and California in the U.S., British Columbia and Québec in Canada, Mexico, Chile, New Zealand, India, Japan, Republic of Korea, and pilot schemes in China) that have implemented an emissions trading scheme (ETS), a carbon tax or a hybrid of both. The paper synthesizes key findings and knowledge gaps on what is working, what isn’t and why when it comes to implementing carbon pricing policies. Institutional learning, administrative prudence, appropriate carbon revenue management, and stakeholder engagement are identified as key ingredients for a successful pricing regime. Recent implementation of ETS in regions including California, Québec and South Korea indicates significant institutional learning from prior systems, such as the EU ETS, with these regions implementing robust administrative and regulatory structures suitable for handling unique national/sub national opportunities and constraints. Cases show that carbon tax, in addition to being a standalone policy, may also serve as a good first step towards building an emissions inventory and administrative capacity necessary for countries interested in adopting an ETS in the future. Cases also show that there is potential for a “double dividend” for emissions reductions even with a modest carbon price, provided the policy increases in stringency over time and a portion of the revenue is reinvested in other emission-reduction activities. Knowledge gaps exist in understanding the interaction of pricing instruments with other climate policy instruments and how governments manage these policies to achieve optimum emissions reductions.
K E Y P O L I C Y I N S I G H T S• Countries are learning from each other on carbon pricing implementations
• Administrative and regulatory structures for carbon pricing strategies appear to evolve and become more robust in every carbon pricing system analyzed.
• So far, the price signals to the market from existing carbon pricing policies are modest and less ambitious than they could be.
• A “double dividend” for emissions reductions may also exist in cases where mitigation occurs as a result of the carbon pricing policy and when auction revenues are reinvested in other emissions-reduction activities
AC K N OW L E D G M E N T SAlthough responsibility for the final product rests with us authors, we wish to thank Patrick Verkooijen of the World Bank and Neydi Cruz Garcia from Mexico’s SEMARNAT for encouraging us to review the evidence on carbon pricing in practice. Neydi Cruz Garcia was also supportive in helping us to research the Mexican experience. We are grateful to Nat Keohane from the Environmental Defense Fund and Dirk Forrister of IETA for their suggestions on scoping. Finally, we would like to thank Joseph Aldy, Ottmar Edenhofer, Christian Flachsland, Ulrike Kornek, and Gilbert Metcalf for their valuable suggestions and comments. We also gratefully acknowledge financial support from BP, Energy Foundation China, and the William and Flora Hewlett Foundation.
C I TAT I O N :Narassimhan, E., Gallagher, K. S., Koester, S. and Rivera Alejo, J. (2017). Carbon Pricing in Practice: A Review of the Evidence. Medford, MA. Climate Policy Lab.
Carbon Pricing in Practice: A Review of the Evidence
2 Center for International Environment and Resource Policy, The Fletcher School, Tufts University
1.1 Basics of Cap-and-Trade ..................................................................................................................................................4
1.2 Basics of Carbon Tax .........................................................................................................................................................5
2. National and Sub-National Policies: Cap-and-Trade Systems .......................................................................................6
2.1 EU ETS ..................................................................................................................................................................................6
2.2 Switzerland ETS and Carbon Tax Hybrid..................................................................................................................6
2.3 Regional Greenhouse Gas Initiative (RGGI) ............................................................................................................7
2.4 California Cap-and-Trade ...............................................................................................................................................7
2.6 New Zealand ETS ...............................................................................................................................................................8
2.7 Republic of Korea ETS .....................................................................................................................................................9
2.8 China — Provincial ETS Pilots ......................................................................................................................................9
3. Comparative Analysis of Cap-and-Trade Systems ...........................................................................................................17
3.1 Emissions Cap ...................................................................................................................................................................17
3.2 Allowance Allocation and Distribution ....................................................................................................................18
3.3 Liquidity and Price Control Mechanisms ................................................................................................................19
3.4 Leakage and Gaming of Emissions Allowance Markets .................................................................................... 20
3.5 International Linkage .....................................................................................................................................................21
6.2 Carbon Tax and Hybrid Systems ................................................................................................................................ 36
Table 1: Design Details of Cap-and-Trade Systems ..............................................................................................................10
Table 2: Turnover Ratio of Cap-and-Trade Systems ............................................................................................................19
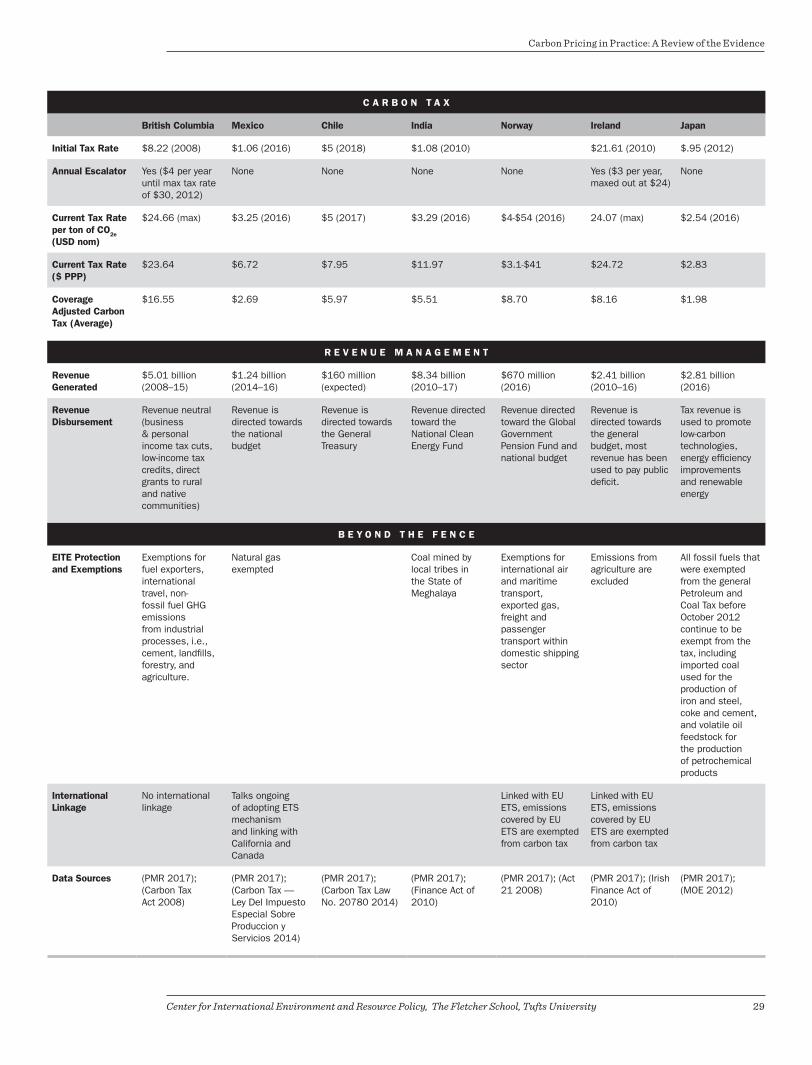
Table 3: Design Details of Carbon Tax and Hybrid Systems ............................................................................................. 28
Table 5: Carbon Tax by Fuel and Sector in Norway ..............................................................................................................31
Table 6: Sample of Investments from the Special GW Tax Fund in 2017 ..................................................................... 34
Table 7: Tax Collected and Disbursed out of the NCEF Fund .......................................................................................... 34
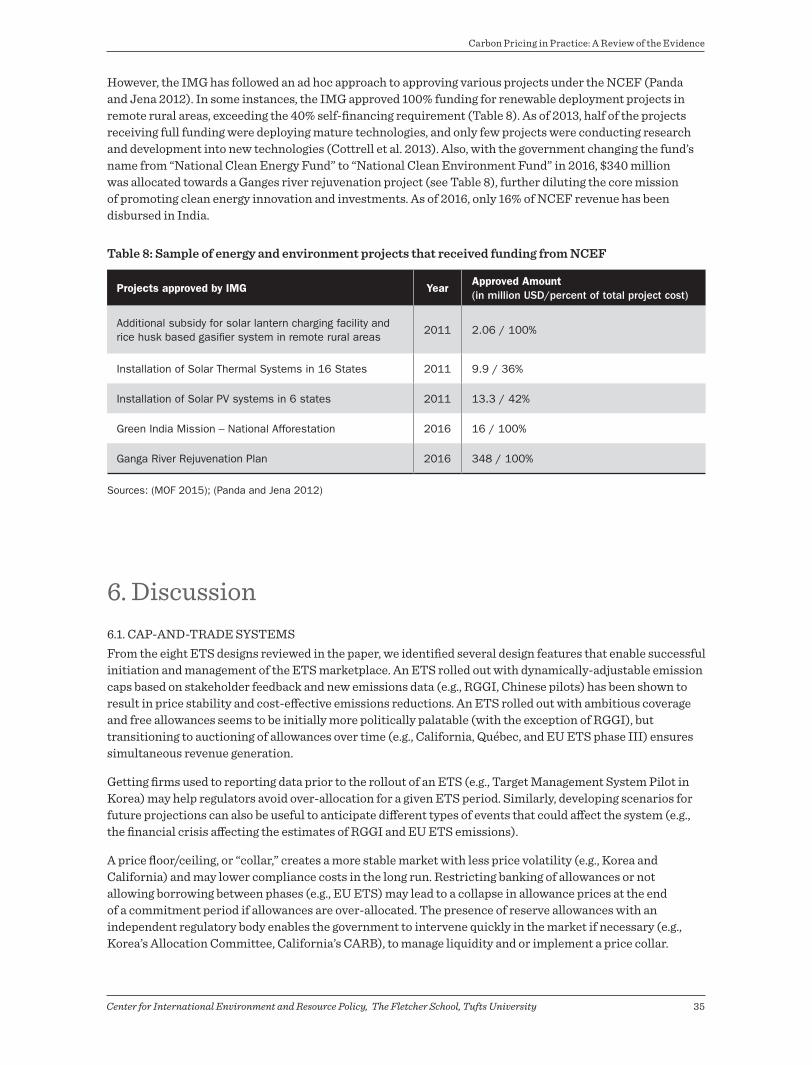
Table 8: Sample of Energy and Environment Projects that Received Funding from NCEF .................................. 35
Figure 1: Carbon Price Per Ton of GHG Emissions in 2016: Cap-and-Trade and Carbon Tax ................................ 23
Carbon Pricing in Practice: A Review of the Evidence
4 Center for International Environment and Resource Policy, The Fletcher School, Tufts University
1. IntroductionThe scope and urgency of dealing with climate change is abundantly clear. After the Paris Agreement was finalized in December 2015, nations realized that to meet their ambitious national emissions reduction targets, they must quickly ramp up policies to achieve decarbonization. In September 2014, more than 1,000 companies, including large oil and gas companies, signed the World Bank’s Put a Price on Carbon Statement (World Bank 2014). Many firms, including ExxonMobil, Royal Dutch Shell, Total, and BP, have expressed a preference for carbon pricing policies in lieu of regulatory approaches (Carroll 2017; BP 2015). Accompanying the December 2015 Paris Agreement was the launch of the Carbon Pricing Leadership Coalition (CPLC) under the leadership of the World Bank (Jungcurt 2015). The Coalition brings together 21 nations and numerous states and provinces from the United States and Canada (Carbon Pricing Leadership Coalition 2016). Currently, there are approximately 40 national carbon pricing mechanisms, along with more than 20 in cities, states, provinces, and other sub-national jurisdictions, covering approximately 7 gigatons of carbon dioxide equivalent (GTCO2e), roughly 13% of global emissions (World Bank, Ecofys, and Vivid Economics 2016).
Experts believe that the most economically-efficient way to reduce greenhouse gas (GHG) emissions is through the use of carbon pricing policy instruments (Aldy 2015; Edenhofer et al. 2015; Metcalf and Weisbach 2009; Schmalensee and Stavins 2015). Direct carbon pricing mechanisms fall into three main categories: cap-and-trade, carbon tax, or a hybrid mechanism that combines elements of both. The key difference between a cap-and-trade and a carbon tax mechanism is that the former sets a quantity cap on allowable emissions, and a carbon price is indirectly derived from the interaction of supply and demand of emission allowance units in secondary markets, while the latter sets a direct price on emissions or on the carbon content of a fuel. Some countries follow a hybrid approach by implementing a carbon tax alongside a cap-and-trade policy with or without an emissions overlap, impose a price collar in the trading market, or link one jurisdiction with a carbon tax to another jurisdiction with a cap-and-trade policy.
Each carbon pricing mechanism has strengths and weaknesses; each works well in some respects and falters in others. This paper focuses on how cap-and-trade, carbon tax, and hybrid systems around the world work in practice. First, the paper provides an overview of select national and sub-national cap-and-trade systems with a comparative analysis of those systems across different design and implementation issues. Second, the paper provides a similar overview of select carbon tax and hybrid systems with a comparative analysis of its design and implementation. Third, the paper summarizes the common features and issues that exist across the reviewed country cases, separately for cap-and-trade and for carbon tax and hybrid systems. Finally, the paper provides key policy findings, identifies knowledge gaps in the existing literature and recommends key focus areas for future research.
1 . 1 . B A S I C S O F CA P- A N D -T R A D EA cap-and-trade system, also known as an emissions trading system (ETS), may establish a cap either on total emissions or on emissions intensity, as measured by emissions per unit of GDP. An ETS may include emissions from all greenhouse gases or just one, such as carbon dioxide. Governments then provide allowances, either freely or through an auction, equal to the level of the cap (Aldy and Stavins 2012). A hybrid approach of auctioning and freely allocating emission allowances is common in ETS markets. Firms then trade allowances during a specified compliance period, after which they are surrendered to the government. Firms with lower abatement costs will sell their allowances in secondary markets to firms with higher abatement costs, and overall, emissions reductions are achieved at least cost.
Key design considerations for an ETS include determining which emissions and sectors will be regulated under the cap, at what point emissions will be regulated (upstream or downstream), the stringency of the cap (or the total allowable emissions), allowance allocation and distribution, carbon revenue management, monitoring, measurement, and verification of emissions and allowances, and impacts on international competitiveness. Additional considerations include policies for banking and borrowing credits from future compliance periods, creation of an allowance reserve to stabilize prices and ensure liquidity, creation of
Carbon Pricing in Practice: A Review of the Evidence
Center for International Environment and Resource Policy, The Fletcher School, Tufts University 5
new trading registries to monitor and track carbon allowance markets, accounting for carbon offsets,1 international linkage,2 and stakeholder engagement.
1 . 2 . B A S I C S O F CA R B O N TAXA carbon tax represents a quintessential Pigouvian tax (Mankiw 2009) that internalizes the unaccounted public costs of increased pollution, ambient and global warming pollution, health and environmental effects, and a myriad of other impacts of climate change resulting from greenhouse gas (GHG) emissions (Metcalf and Weisbach 2009). A carbon tax may be imposed on just carbon dioxide emissions (which make up roughly 76% of global emissions), or could be expanded to include all greenhouse gases, including methane (IPCC 2015). A carbon tax may be imposed on the total emissions, the carbon content of a fuel source, or on the amount of fuel produced/supplied. The latter two are a form of excise tax as different fuels emit different amounts of carbon dioxide (CO2) in relation to the energy they produce, leading to a higher effective price for carbon-intensive fuels such as coal and lower price for less carbon-intensive fuels like natural gas (Metcalf and Weisbach 2009). Tax may also be applied to specific sectors and fuel products (World Bank, Ecofys, and Vivid Economics 2016).
Key design considerations for a carbon tax system includes choosing the appropriate price, emissions coverage, the point of taxation (upstream or downstream), stringency (i.e., planned escalation of price over time), the flexibility of the price to change in light of new information on marginal cost of abatement, allocation of revenue generated from the tax towards general public spending or specific emissions-reducing activities, and harmonization across boundaries beyond the jurisdiction of the tax.
1 . 3. H Y B R I D A P P R OAC H E SThere is increasing evidence that countries find advantage in employing both carbon taxes and cap-and-trade schemes, or devising policy instruments that employ elements of both approaches. Some governments may prefer a carbon tax for political purposes in order to publicly demonstrate their commitment to reducing emissions. Conversely, some governments may consider new taxes a political liability and therefore adopt a cap-and-trade system for certain sectors. Finally, some countries or states/provinces that participate in emissions-trading regimes at higher governance levels (e.g., supranational regime) also apply carbon taxes domestically.
Four different hybrid approaches have been observed in existing carbon pricing regimes. First, countries that impose a carbon tax in some sectors and cap-and-trade in other sectors without significant overlap. Norway and Ireland are two examples discussed in this paper where a carbon tax is imposed on sectors not fully covered under the EU ETS. Second, countries with cap-and-trade and a price collar. A cap-and-trade approach that imposes a price “collar” (with minimum and maximum permit prices) is a hybrid because it creates an effective carbon tax at the minimum and maximum price (Schmalensee and Stavins 2015). The United Kingdom is a good example of an ETS with price collars. Third, countries that impose both cap-and-trade and a carbon tax without coordination among the instruments. In such scenarios, the simultaneous signaling from both policies may lead to cost inefficiencies. Fourth, programs where a jurisdiction with a carbon tax scheme is linked with a jurisdiction with a cap-and-trade scheme. There are currently no instances of hybrid international linking between a carbon tax and cap-and-trade program (Metcalf and Weisbach 2011).
1 A carbon offset is a tradeable certificate on the avoided emissions that result from environmentally focused investment decisions such as landfill methane capture, reforestation, renewable energy development, energy efficiency upgrades, and destruction of dangerous and harmful pollutants such as HFCs and PFCs. Offsets are generally required to meet certain requirements such as additionality of the carbon emissions reduction in the absence of the investment project.
2 In a linked market, total allowable emissions would be the aggregate between the linked regions. Allowances would be tradable between covered entities in the linked regions, and allowance prices would likely be very similar across the regions.
Carbon Pricing in Practice: A Review of the Evidence
6 Center for International Environment and Resource Policy, The Fletcher School, Tufts University
2. National and Sub-National Policies: Cap-and-Trade SystemsSection 2 briefly describes the ETS systems of the European Union (EU), Switzerland, Regional Greenhouse Gas Initiative (RGGI), California, Québec, New Zealand, Republic of Korea, and China’s seven provinces – Beijing, Shanghai, Tianjin, Chongqing, Shenzhen, Guangdong, and Hubei. Section 3 compares and contrasts the design and implementation issues across these systems. Cases were selected to cover ETS implementation at the supranational, national, and subnational levels. In addition, these cases represent diverse geographies and span across time, allowing us to identify best practices, linkage opportunities, and learning and knowledge spillovers, if any, from older to newer implementations. Table 1 provides a side-by-side comparison of the ETS designs.
2 . 1 . E U E T SBegun in 2005, the EU ETS was one of the main policy tools used by the EU to implement the 1997 Kyoto Protocol to the UN Framework Convention on Climate Change (UNFCCC). The program now operates in 28 EU member states, plus Iceland, Liechtenstein, and Norway. The ETS covers about 11,000 entities accounting for 45% of EU-wide GHG emissions (1,988 MMT CO2e) from multiple sectors. The EU ETS has proceeded through three distinct trading periods, with phase three (2013–2020) employing an allowance cap reduction of 1.74% per year, a market stability reserve (MSR) to begin in 2019, banking and borrowing restricted to a year, offsets capped at 50% of total emissions reductions, a noncompliance penalty of €100 per ton of regulated emissions, and 50% of auction revenue directed towards climate and energy-related investments (European Commission 2016; European Commission 2017; Frunza 2013; Meadows 2017).
Noteworthy Features: Declining allowance cap rates every year and a market stability reserve (MSR) to manage liquidity are two good features that emerged out of EU ETS’s experiences with over-allocations during phases 1 and 2. EU ETS is also notable for its decision to progressively increase the auctioning of allowances, with auctioning generating about €14 billion between 2012 and 2016. More than 50% of the revenue has been distributed for climate and energy related purposes (European Commission 2017).
Constraints: The persistent low price of allowances in spite of market intervention measures is a major concern for the EU ETS system. Over-allocation is reflected in the amount of total emissions reductions achieved since its inception. According to the European Commission, emissions have decreased by about 4.5% between 2011 and 2015 (European Commission 2017). Many studies estimate a 2.5 to 5% total emissions reduction (about 150–300 MMTCO2e) during phase one and a 6.3% (i.e., 260 MMTCO2e) from 2008–2009 in phase two (Brown, Hanafi, and Petsonk 2012; Hu et al. 2015). The biggest share of abatement, however, is attributable to the 2008 economic crisis rather than the EU ETS (Bel and Joseph 2015). With new measures to reduce the allowance surplus in phase three, the ETS is anticipated to induce greater emission reductions after 2025 (Hu et al. 2015).
2 . 2 . S W I T Z E R L A N D E T S A N D CA R B O N TAX H Y B R I DSwitzerland follows a hybrid approach to reducing its GHG emissions with a carbon tax (i.e., the CO2 levy covering 51% CO2 emissions) and ETS (covering 33% CO2 emissions) operating simultaneously. The first phase of the ETS, from 2008–2012, was voluntary for firms wanting to be exempt from the CO2 levy. Energy-intensive industries could voluntarily participate and receive free allowances based on a company’s potential to reduce emissions (CDC, EDF and IETA 2015b). Non-complying firms simply faced a price cap imposed by the CO2 levy. In the latest phase, 2013–2020, the Swiss ETS imposes an economy-wide emissions cap, mandatory enrollment for large entities, a combination of free and auctioned allowances with auctioning set to increase to 70% by 2020, creation of an allowance reserve for new entrants, non-compliance penalties equal to the EU ETS, an offset mechanism aligned with the EU ETS rules, and inclusion of the aviation sector under a linked system with the EU ETS (FOEN 2016a; Hawkins and Jegou 2014; Rutherford 2014).
Carbon Pricing in Practice: A Review of the Evidence
Center for International Environment and Resource Policy, The Fletcher School, Tufts University 7
Noteworthy Features: Switzerland’s strategy to exempt enterprises from its carbon tax (i.e., CO2 levy) in exchange for participation in the voluntary ETS market is a notable feature in terms of garnering political acceptance towards a transition to a full ETS market. Switzerland’s decision to align its ETS rules with EU ETS rules for its second compliance period and include aviation under an emissions cap is another good step in its plan to link with the EU ETS. In January 2016, the Swiss government agreed to link its ETS with the EU ETS market (The Federal Council 2016).
Constraints: It is estimated that the aggregate marginal abatement costs are relatively high in Switzerland and meeting the 2020 target of 20% GHG emissions reduction below the 1990 level will necessitate cost-effective policies (Wölfl and Sicari 2012). Swiss ETS have not been shown to be more cost effective than its carbon tax (i.e., CO2 levy). Trading activity has been minimal in the first three years of the second commitment period of 2013–2020 (FOEN 2016b). A recent Swiss Federal Audit Office (SFAO) report found that allocating 80% of allowances for free in the second compliance period and the low allowance prices in the market created few incentives for participants to reduce emissions. Currently, there is no literature analyzing the impact of Swiss ETS on the country’s overall emissions mitigation trajectory (FOEN 2016b).
2 . 3. R E G I O N A L G R E E N H O U S E G A S I N I T I AT I V E ( R G G I )The RGGI covers 23% of GHG emissions in nine northeastern states in the United States (i.e., 2% of U.S. emissions) by capping CO2 emissions from 165 regulated electricity-generating units in total (EIA 2016; Ramseur 2017). RGGI is a transparent system with full auctioning of allowances, an allowance cap that reduces at 2.5% per year until 2020 and at 3% thereafter, an allowance reserve to manage permit prices, a price floor of $2.15, unlimited banking without borrowing from future compliance periods, offsets up to 3.3% of emissions obligation, and periodic adjustments of the program through consultative review meetings (EIA 2016; ICAP 2017e).
Noteworthy Features: RGGI is notable for its transparency and commitment to periodic program reviews to make adjustments to its ETS market (Rahim 2017). RGGI is also known for full auctioning of its allowances, significant revenue generation ($2.7 billion so far), and investment of revenue towards other emissions-reducing activities (Ramseur 2017; RGGI Inc. 2005). RGGI has led to a 57% decline in regional CO2 emissions between 2005 and 2016. While all of these emissions reductions cannot be solely attributed to RGGI due to the presence of other policies, one estimate found that emissions would have been 24% higher in the absence of the program (Murray and Maniloff 2015).
Constraints: The primary constraint of RGGI is its scope and coverage. It addresses only CO2 emissions emitted from electricity generating units over 25 megawatts of capacity. Excluding other GHGs and other sectors limits the scope and potential impact of the program on the region’s emissions reduction.
2 .4 . CA L I FO R N I A CA P- A N D -T R A D EThe California cap-and-trade program (California CAT) began in 2013 after it was granted legal authority through the Global Warming Solutions Act of 2006 (AB 32), requiring the state to reduce emissions to 1990 levels by 2020. During the first compliance phase (2013–2014), the program covered 35% of the state’s emissions and all six major GHGs. In the second compliance period (2015–2017), the program regulates 85% of California’s emissions with free allowances for electric utilities and industrial facilities and 10% auctioned or fixed-price allowances for sectors such as transport, with auctioned allowance revenues allocated for projects related to climate change (C2ES 2011). In addition, the program contains a $10 price floor with 5% escalator per year and allows offsets up to 8% of a firm’s emissions.
Noteworthy Features: California CAT program is known for its well-designed ETS containing an allowance price-containment reserve, which gives regulators the power to remove or add allowances into the market, international linkage to the Québec cap-and-trade program, free allowances to energy-intensive and trade-exposed (EITE) industries to reduce leakage, and rigorous monitoring of allowances, offsets, and emissions reductions (C2ES 2011). The results of the California cap-and-trade experience indicate that covered entities steadily reduced emissions, with total emissions attributable to the cap-and-trade program being 9% below
Carbon Pricing in Practice: A Review of the Evidence
8 Center for International Environment and Resource Policy, The Fletcher School, Tufts University
the 2014 cap of 160 MMTCO2e. CARB also estimates that California is on track to reach 1990 emission levels by 2020 (Camuzeaux 2015).
Constraints: The CAT program has faced legal challenges and issues with carbon leakage due to resource reshuffling3 by electric utilities, which has threatened the integrity of the program (Cullenward 2014). California’s complimentary emissions reduction policies such as vehicle emissions standards, renewable portfolio standards, energy efficiency programs, and non-carbon GHG emissions reduction programs are also seen as undermining the proper functioning of the CAT program. This creates potential market uncertainty as regulated entities may not know if the state will meet it complimentary policy goals and obligations in the future, and what effect that will have on allowance prices (Diamant 2013).
2 . 5. Q U É B E C CA P- A N D -T R A D EIn 2009, Québec adopted a GHG emissions reduction goal of 20% below 1990 levels by 2020. In 2011, Québec initiated its emissions trading scheme with its first compliance period beginning in 2013. Subsequently in 2014, the program formally linked with the California cap-and-trade system, creating the largest carbon market in North America and the first sub-national program to link internationally (CDC, EDF, and IETA 2015a). Currently, the program caps emissions at 65 MMTCO2e with a 4% yearly cap reduction, covers about 132 entities emitting 85% of the province’s GHG emissions, allocates allowances freely but decreases free allowances by 1 to 2% per year, directs auctioned revenues to the Québec Green Fund, sets a price floor averaging the highest minimum price between California and Québec markets, maintains an allowance price containment reserve, and utilizes stringent and transparent monitoring, reporting, and verification (MRV) processes (Government of Québec 2015; ICAP 2017a).
Noteworthy Features: Québec’s stringent MRV process ensures the integrity of the cap-and-trade program. Severe monetary and criminal consequences are possible for non-compliance, fraud, under-reporting, or failure to surrender credits (Environmental Quality Act 2017). The program is also notable for its dedicated “Green Fund” to invest auctioned revenues in other emissions-reducing activities. While it is too early to know definitively how much the program has reduced provincial emissions, 2013 estimates showed a 7.5% decrease from 2005 levels (Government of Canada 2016).
Constraints: Québec cap-and-trade is constrained by few attractive opportunities to reduce emissions, in part, due to its low emissions base. Linking with the California CAT is estimated to alleviate the lack of trading and reduce the marginal costs of abatement (CARB 2012).
2 .6. N E W Z E A L A N D E T SIn 2008, the New Zealand ETS (i.e., NZ ETS) was introduced by legislation in order to meet the country’s international obligations under the Kyoto Protocol, with the objective of delivering emissions reduction in a cost-effective manner while increasing the long-term resilience of New Zealand’s economy (Richter and Chambers 2014). Until 2015, the ETS covered all sectors under a Kyoto-based target without a nationwide emissions cap. From 2016, the ETS imposes a nationwide emissions-intensity-based cap, upstream regulation in the energy sectors, voluntary opt-in for downstream users, output-based grandparenting of allowances to eligible EITE sectors such as agriculture with a linear phase-out of free allowances by 2030, unlimited Kyoto offsets until 2015, and a strict MRV process with audits of self-assessment and penalties for non-compliance (ICAP 2017b; Leining and Kerr 2016).
Noteworthy Features: NZ ETS is known for its unique “no cap” approach to reducing emissions in order to achieve its Kyoto obligations. The scheme allowed for unlimited purchase of international offsets and issued free domestic New Zealand allowance units (NZU) to its participants in order to garner political support for the program. The program indicates that it is learning from its prior policy failings, as the ETS starting in 2016 imposes a domestic emissions cap, phases out free allowances by 2030, and restricts the trading of international offsets.
3 CARB, in 2012, defined resource shuffling as “any plan, scheme, or artifice to receive credit based on emissions reductions that have not occurred, involving the delivery of electricity to the California grid.”
Carbon Pricing in Practice: A Review of the Evidence
Center for International Environment and Resource Policy, The Fletcher School, Tufts University 9
Constraints: Although NZ ETS met its Kyoto obligations during the first the commitment period and is expected to do so during the second one as well (Ministry for the Environment 2016a), the experiment of running an ETS market with full international linkage without a domestic emissions cap has not resulted in significant domestic emissions reductions. Bertram and Terry (2010) conclude that domestic emissions were reduced only by 23 MMTCO2e in 2008 and only by 19 MMTCO2e in 2009. Bullock (2012) argued that the integrity of the ETS has been undermined by interest groups, particularly from the agriculture sector, thereby delaying significant technological upgrades and emissions reduction in the country. Free allowances to EITE firms, the absence of a nationwide emissions cap, and an international offset cap until 2015 allowed many ETS participants to meet their obligations without significantly reducing firm level emissions.
2 .7. R E P U B L I C O F KO R E A E T SIn 2012, the Act on ‘Allocation and Trading of Greenhouse Gas Emissions’ established an ETS, beginning in January 2015. The Korean ETS (KETS) allocates allowances freely based on historical GHG emissions, both upstream at the point of electricity generation and downstream at consumption, and it benchmarked allowances for other sectors (EDF, CRIK, and IETA 2016; PMR and ICAP 2016). In addition, KETS has an allowance price containment reserve, a reserve auction price of €12, credits for emissions reductions achieved prior to joining KETS, unlimited banking with borrowing up to 20% within phases, offsets up to 10% of a firm’s obligation, and a non-compliance penalty up to $70 per ton of regulated emissions (Oh, Hyon, and Kim 2016; PMR and ICAP 2016).
Noteworthy Features: The Korean ETS followed a careful approach of defining timelines, establishing strategic governance architecture and an independent allowance committee, creating market stabilizing measures, and providing support for losses incurred by entities participating in the ETS (Oh, Hyon, and Kim 2016). The program is notable for setting up a GHG and Energy Target Management System (TMS) to ease firms into the process of monitoring and verifying emissions data prior to implementing the KETS (Oh, Hyon, and Kim 2016). The program also indicates significant learnings from prior ETS implementations such as the EU ETS.
Constraints: It is too early to tell whether KETS has helped Korea achieve its NDC commitment of 37% emissions reductions below BAU by 2030. However, emissions leakage from noncompliance in the downstream electricity consumption, a lack of liquidity in the market, and the political nature of allowance allocations has reduced confidence in the system (Kim 2015; PMR and ICAP 2016).
2 . 8 . C H I N A : P R OV I N C I A L E T S P I L OT SIn 2011, the Chinese government initiated seven pilot ETS programs for CO2 emissions (Beijing, Tianjin, Shanghai, Chongqing, Shenzhen, Guangdong, and Hubei) requiring the regions to launch by 2013 and fully initiate by 2015 (D. Zhang et al. 2014). Chinese ETS pilots covered indirect electricity emissions within the pilot regions and emissions from imported electricity outside of the pilot regions (Z. Zhang 2015). Nearly all of them allocated allowances for free, except for a small percentage of auctioning in Guangdong, Shenzhen, and Hubei, but the systems differed in their method of allocation (Dong, Ma, and Sun 2016; Duan, Pang, and Zhang 2014). All of them accepted offsets through CERs generated outside the pilot regions and established market stabilizing mechanisms using auctions triggered by price ceilings, allowance reserves, buy-back of surplus allowances in the market, or a combination of these features (Pang and Duan 2016).
Noteworthy Features: Chinese ETS pilots are notable for their innovative allowance allocation and distribution methodologies that suit the local structural and economic conditions of the respective jurisdictions (Xiong et al. 2017).
Constraints: Incomplete reporting practices, a lack of a legal framework to enforce compliance, and weak penalties are identified as some of the key challenges that emerged in the seven pilots (Yu and Lo 2015). A survey of Chinese firms conducted in 2015 revealed that the carbon price failed to “stimulate companies to upgrade mitigation technologies” and that the majority of firms considered participation in the ETS pilots only a means of improving ties with governments and earning a good social reputation (Yang, Li, and Zhang 2016).
Carbon Pricing in Practice: A Review of the Evidence
10 Center for International Environment and Resource Policy, The Fletcher School, Tufts University
Table 1: Design Details of Cap-and-Trade Systems
D E S I G N F E A T U R E S
EU ETS Switzerland Regional Greenhouse Gas Initiative
California Québec New Zealand Republic of Korea
China
Jurisdiction 28 EU-member states, plus Iceland, Liechtenstein, and Norway
Switzerland Connecticut, Delaware, Maine, Maryland, Massachusetts, New Hampshire, New York, Rhode Island, and Vermont
California Québec New Zealand South Korea Beijing, Tianjin, Shanghai, Chongqing, Shenzhen, Guangdong, Hubei
Start Date 2005 2013 2009 2012 2013 2011 2015 2013
Regulating Authority
The European Commission Directorate General for Climate Action
Federal Office of the Environment
RGGI, Inc. California Air Resources Board
Minister of Sustainable Development, the Environment and the Fight Against Climate Change
Ministry of the Environment, Environmental Protection Authority, Ministry of Primary Industries
Ministry of Strategy and Finance
Development and Reform Commissions of each region
Compliance Period Duration
1st period (2005-07), 2nd period (2008-12), 3rd period (2013-20), 4th period (2021-30)
1st period (2013-20)
1st period (2009-11), 2nd period (2012-14), 3rd period (2015-17), 4th period (2018-20)
1st period (2013-14), 2nd period (2015-17), 3rd (2018-20)
1st period (2013-14), 2nd period (2015-17), 3rd (2018-20)
Yearly Compliance periods since 2011
1st period (2015-17), 2nd period (2018-20), 3rd period (2021-25)
Pilot phase (2013-15)
2016 Allowance Cap, metric tons of CO2-equivalent (MTCO2e)
1,969,509,118 5,340,000 78,477,716 346,907,444 63,190,000 13.1 million. Cap equals the amount of free allocations.
562,183,138 Beijing: 58,000,000
Tianjin and Shanghai:160,000,000 each
Chongqing: 100,400,000
Shenzhen: 32,000,000
Guangdong: 388,000,000
Hubei: 324,000,000
Allowance Allocation Method
Although in phase 3 auctioning is the default method for allocating emission allowances to companies participating in the EU ETS, some allowances continue to be allocated for free until 2020 and beyond. 41% of the total quantity of allowances will be allocated for free over phase 3.
Free allocation based on industry benchmarks, similar to EU ETS. Free allocation to non-exposed sectors to be reduced from 80% allocation in 2013 to 30% in 2020. Allowance not allocated for free is auctioned. 5% set aside for new entrants.
Full auction Allowance Alloca-tion method is mixed between auction and free allocation. Electric utilities, industrial facili-ties, and natural gas distributors, allowances allo-cated freely, with a declining total over time. Other covered sectors, such as trans-portation, natural gas extraction, and other fuel sources, allow-ances must be purchased at auction or through the allowance trading platform
Mixed, electricity and fuel distributors must buy 100% of allowance requirements; sectors exposed to international competition receive a portion of free allowances. Free allocation diminishes by 1–2% annually. 39% of allowances were auctioned in 2016
Mixed, 90% free allocation for high EITE entities, 60% free allocation for moderately EITE.
In 2016, Industries – 4.6 million allowances.
Forestry carbon sequestration – 8.5 million allowances, Surrendered – 20.4 million allowances.
For Phase I, 100% of allowances have been freely allocated. In Phase II, 97% of allowances will be freely allocated; and in Phase III 90% or less allowances will be freely allocated.
Beijing: Free allocation
Tianjin: Mixed, free allocation (major) auction and fixed price distribution
Shanghai: Mixed, free allocation and auction
Chongqing: Free allocation
Shenzhen: Mixed, free allocation, with no more than 10% auction
Guangdong: Mixed, 97% free allocation with 3% auction
Hubei: Mixed, free allocation with 2.4% auction
Carbon Pricing in Practice: A Review of the Evidence
Center for International Environment and Resource Policy, The Fletcher School, Tufts University 11
D E S I G N F E A T U R E S ( c o n t i n u e d )
EU ETS Switzerland Regional Greenhouse Gas Initiative
California Québec New Zealand Republic of Korea
China
Banking and Borrowing
Banking is allowed since phase 2, borrowing is restricted to within one-year.
Inter and intra- phase banking of allowances is allowed. Borrowing is not allowed in the current period.
Compliance entities may bank CO2 allowances, without limitation, until the allowances are used to satisfy compliance or transferred to another account. RGGI prohibits regulated entities from using future allowances to satisfy compliance in advance of the year associated with the allowance.
Banking is allowed but the emitter is subject to a general holding limit. Borrowing of future vintage allowances is not allowed.
Banking is allowed but the emitter is subject to a general holding limit. Borrowing of future vintage allowances is not allowed.
Banking allowed of allowance credits, except for those purchased under the fixed price option. Borrowing is not allowed.
Banking of allowances between years and compliance periods is allowed. Borrowing between compliance periods is not allowed, whereas entities may borrow up to 10% of allowances from within the compliance period.
No borrowing, Banking is allowed during pilot phase
Price Collar (Floor/Ceiling)
Market Stability Reserve will begin operation in 2019, aims to stabilize market and price of allowances. Allowances added to reserve is total circulation higher than 833 million allowances.
No price containment provisions currently exist.
Cost Containment Reserve (CCR) is a fixed additional supply of CO2 allowances that are only available for sale if CO2 allowance prices exceed $4 in 2014, $6 in 2015, $8 in 2016, and $10 in 2017, rising by 2.5 percent each year thereafter.
Auction Reserve Price: $13.57. The auction reserve price increases
annually by 5% plus inflation, as measured by the Consumer Price Index. Price ceiling for allowances tiered at $50.69, $57.04, and $63.37. Tier prices increase by 5% per year, plus inflation.
Auction Reserve Price: $13.57. The auction reserve price increases
annually by 5% plus inflation, as measured by the Consumer Price Index. Price ceiling for allowances tiered at $50.69, $57.04, and $63.37. Tier prices increase by 5% per year, plus inflation.
Fixed price ceiling of $18. 67% allowance surrender obligation from 2017, increases to 83 in 2018, and full surrender obligation in 2019
According to the Phase I National Allowances Allocation Plan, an allowance reserve of approximately 88 million tCO2e of allowances, has been created for market stabilization measures and distribution to new entrants.
Regulating authority can auction extra allowances if average weighted price exceeds $22.75 and buy back allowances if price falls to $3
Guangdong: Price floor set at roughly $1.5
Offsets The overall use of credits is limited to 50% of the EU wide reductions over the period 2008–2020. Covered entities are allowed to use up to either the amount allowed to them in Phase II or to 11% of the allowances they were allocated in Phase II, whichever is higher
Up to 4.5% of actual emissions between 2013–2020
Up to 3.3% of regulated entities allowance commitment
Up to 8% of each entity's compliance obligation
Up to 8% of each entity's compliance obligation
Unlimited, international offsets are not eligible
Up to 10% of their allowance submission obligations
Beijing: Tianjin: 10%
Shanghai: 5%
Chongqing: 8%
Shenzhen: 10%
Guangdong: 10%, of which 70% of offsets must be located in Guangdong province
Hubei: 10% for new entrants, 15 for pilot ETS participants
Carbon Pricing in Practice: A Review of the Evidence
12 Center for International Environment and Resource Policy, The Fletcher School, Tufts University
E M I S S I O N S C O V E R A G E
EU ETS Switzerland Regional Greenhouse Gas Initiative
California Québec New Zealand Republic of Korea
China
GHGs covered
CO2, N2O, PFCs (individual states may add more GHG emissions)
Switzerland has a carbon levy that covers some entities if they are not covered under the Swiss ETS. Entities can voluntarily participate in the ETS.
No carbon taxes exist in RGGI states
No carbon taxes exist in California
No carbon taxes exist in Québec
No carbon taxes exist in New Zealand
No carbon taxes exist in South Korea
No carbon taxes exist in China
Carbon Pricing in Practice: A Review of the Evidence
Center for International Environment and Resource Policy, The Fletcher School, Tufts University 13
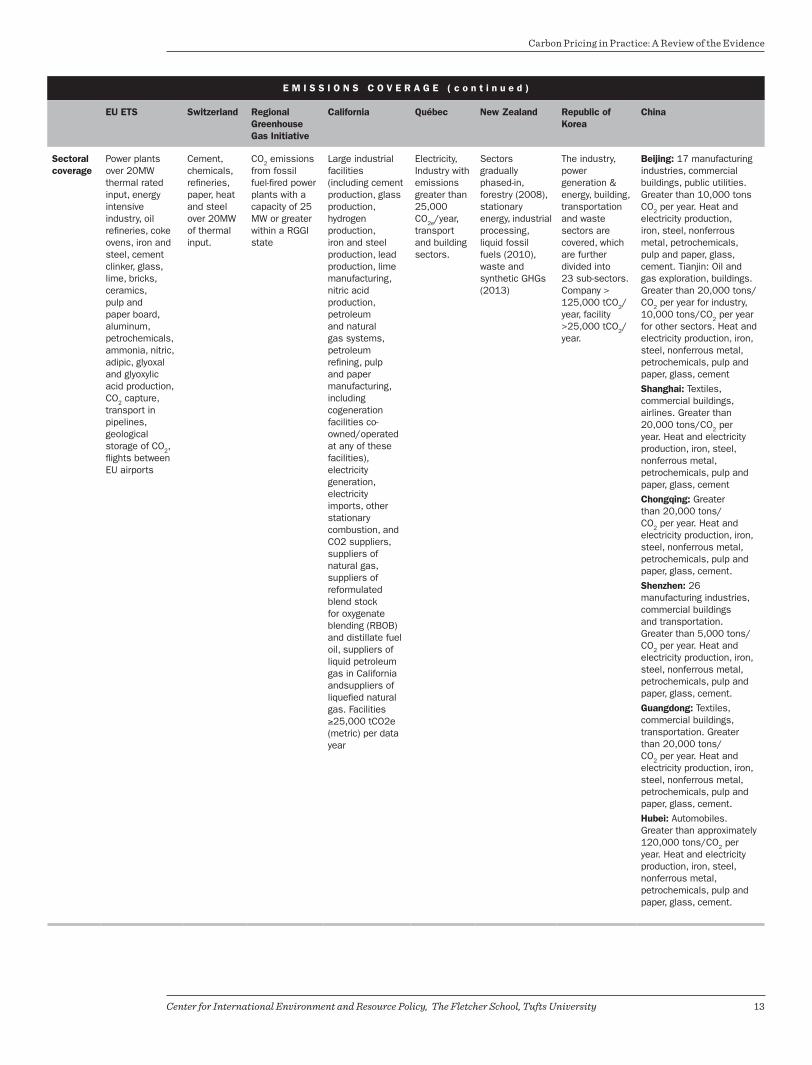
E M I S S I O N S C O V E R A G E ( c o n t i n u e d )
EU ETS Switzerland Regional Greenhouse Gas Initiative
California Québec New Zealand Republic of Korea
China
Sectoral coverage
Power plants over 20MW thermal rated input, energy intensive industry, oil refineries, coke ovens, iron and steel, cement clinker, glass, lime, bricks, ceramics, pulp and paper board, aluminum, petrochemicals, ammonia, nitric, adipic, glyoxal and glyoxylic acid production, CO2 capture, transport in pipelines, geological storage of CO2, flights between EU airports
Cement, chemicals, refineries, paper, heat and steel over 20MW of thermal input.
CO2 emissions from fossil fuel-fired power plants with a capacity of 25 MW or greater within a RGGI state
Large industrial facilities (including cement production, glass production, hydrogen production, iron and steel production, lead production, lime manufacturing, nitric acid production, petroleum and natural gas systems, petroleum refining, pulp and paper manufacturing, including cogeneration facilities co-owned/operated at any of these facilities), electricity generation, electricity imports, other stationary combustion, and CO2 suppliers, suppliers of natural gas, suppliers of reformulated blend stock for oxygenate blending (RBOB) and distillate fuel oil, suppliers of liquid petroleum gas in California andsuppliers of liquefied natural gas. Facilities ≥25,000 tCO2e (metric) per data year
Electricity, Industry with emissions greater than 25,000 CO2e/year, transport and building sectors.
The industry, power generation & energy, building, transportation and waste sectors are covered, which are further divided into 23 sub-sectors. Company > 125,000 tCO2/year, facility >25,000 tCO2/year.
Beijing: 17 manufacturing industries, commercial buildings, public utilities. Greater than 10,000 tons CO2 per year. Heat and electricity production, iron, steel, nonferrous metal, petrochemicals, pulp and paper, glass, cement. Tianjin: Oil and gas exploration, buildings. Greater than 20,000 tons/CO2 per year for industry, 10,000 tons/CO2 per year for other sectors. Heat and electricity production, iron, steel, nonferrous metal, petrochemicals, pulp and paper, glass, cement
Shanghai: Textiles, commercial buildings, airlines. Greater than 20,000 tons/CO2 per year. Heat and electricity production, iron, steel, nonferrous metal, petrochemicals, pulp and paper, glass, cement
Chongqing: Greater than 20,000 tons/CO2 per year. Heat and electricity production, iron, steel, nonferrous metal, petrochemicals, pulp and paper, glass, cement.
Shenzhen: 26 manufacturing industries, commercial buildings and transportation. Greater than 5,000 tons/CO2 per year. Heat and electricity production, iron, steel, nonferrous metal, petrochemicals, pulp and paper, glass, cement.
Guangdong: Textiles, commercial buildings, transportation. Greater than 20,000 tons/CO2 per year. Heat and electricity production, iron, steel, nonferrous metal, petrochemicals, pulp and paper, glass, cement.
Hubei: Automobiles. Greater than approximately 120,000 tons/CO2 per year. Heat and electricity production, iron, steel, nonferrous metal, petrochemicals, pulp and paper, glass, cement.
Carbon Pricing in Practice: A Review of the Evidence
14 Center for International Environment and Resource Policy, The Fletcher School, Tufts University
R E V E N U E
EU ETS Switzerland Regional Greenhouse Gas Initiative
California Québec New Zealand Republic of Korea
China
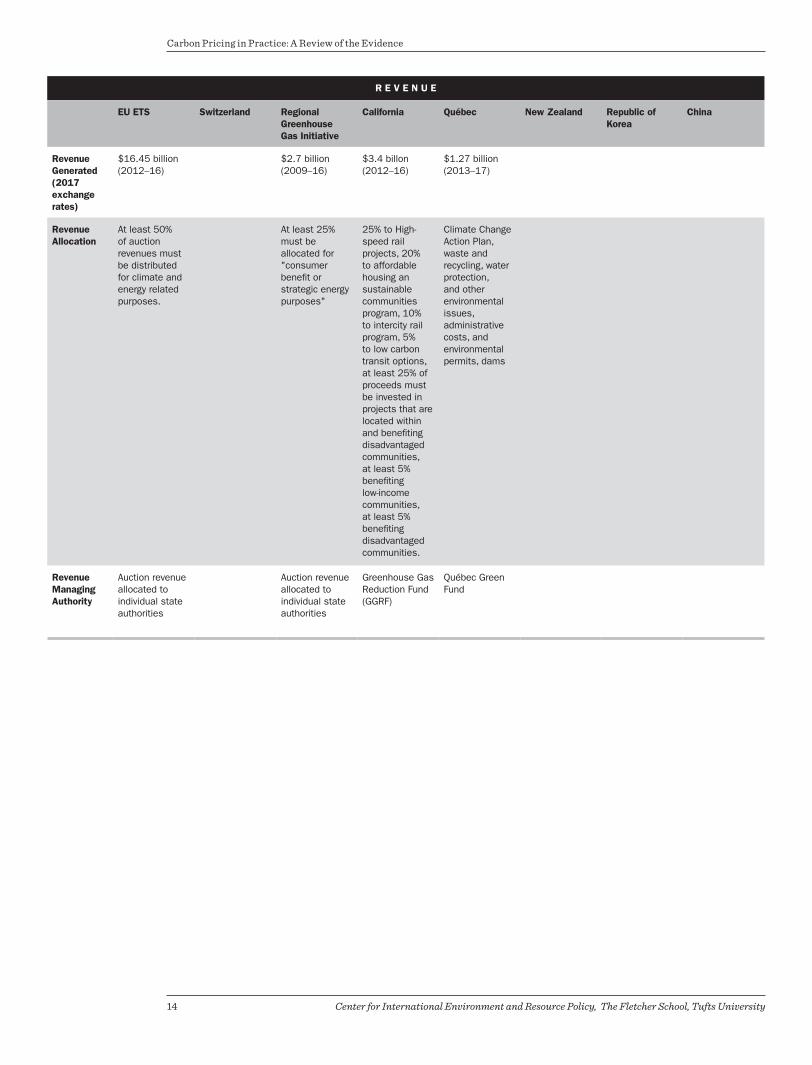
Revenue Generated (2017 exchange rates)
$16.45 billion (2012–16)
$2.7 billion (2009–16)
$3.4 billon (2012–16)
$1.27 billion (2013–17)
Revenue Allocation
At least 50% of auction revenues must be distributed for climate and energy related purposes.
At least 25% must be allocated for "consumer benefit or strategic energy purposes"
25% to High-speed rail projects, 20% to affordable housing an sustainable communities program, 10% to intercity rail program, 5% to low carbon transit options, at least 25% of proceeds must be invested in projects that are located within and benefiting disadvantaged communities, at least 5% benefiting low-income communities, at least 5% benefiting disadvantaged communities.
Climate Change Action Plan, waste and recycling, water protection, and other environmental issues, administrative costs, and environmental permits, dams
Revenue Managing Authority
Auction revenue allocated to individual state authorities
Auction revenue allocated to individual state authorities
Greenhouse Gas Reduction Fund (GGRF)
Québec Green Fund
Carbon Pricing in Practice: A Review of the Evidence
Center for International Environment and Resource Policy, The Fletcher School, Tufts University 15
C A R B O N P R I C E S
EU ETS Switzerland Regional Greenhouse Gas Initiative
California Québec New Zealand Republic of Korea
China
Current allowance price per ton of CO2e (Nominal $, 2017 Exchange Rates)
Carbon Pricing in Practice: A Review of the Evidence
16 Center for International Environment and Resource Policy, The Fletcher School, Tufts University
B E Y O N D T H E F E N C E
EU ETS Switzerland Regional Greenhouse Gas Initiative
California Québec New Zealand Republic of Korea
China
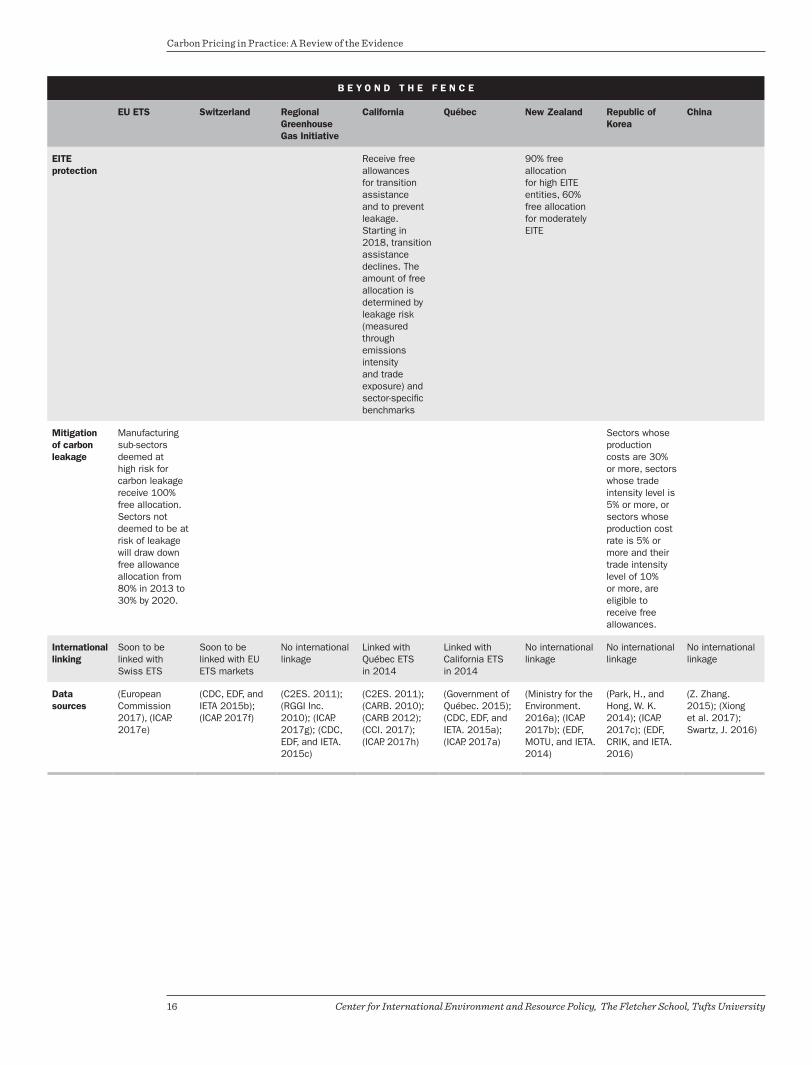
EITE protection
Receive free allowances for transition assistance and to prevent leakage. Starting in 2018, transition assistance declines. The amount of free allocation is determined by leakage risk (measured through emissions intensity and trade exposure) and sector-specific benchmarks
90% free allocation for high EITE entities, 60% free allocation for moderately EITE
Mitigation of carbon leakage
Manufacturing sub-sectors deemed at high risk for carbon leakage receive 100% free allocation. Sectors not deemed to be at risk of leakage will draw down free allowance allocation from 80% in 2013 to 30% by 2020.
Sectors whose production costs are 30% or more, sectors whose trade intensity level is 5% or more, or sectors whose production cost rate is 5% or more and their trade intensity level of 10% or more, are eligible to receive free allowances.
International linking
Soon to be linked with Swiss ETS
Soon to be linked with EU ETS markets
No international linkage
Linked with Québec ETS in 2014
Linked with California ETS in 2014
No international linkage
No international linkage
No international linkage
Data sources
(European Commission 2017), (ICAP. 2017e)
(CDC, EDF, and IETA 2015b); (ICAP. 2017f)
(C2ES. 2011); (RGGI Inc. 2010); (ICAP. 2017g); (CDC, EDF, and IETA. 2015c)
(Government of Québec. 2015); (CDC, EDF, and IETA. 2015a); (ICAP. 2017a)
(Ministry for the Environment. 2016a); (ICAP. 2017b); (EDF, MOTU, and IETA. 2014)
(Park, H., and Hong, W. K. 2014); (ICAP. 2017c); (EDF, CRIK, and IETA. 2016)
(Z. Zhang. 2015); (Xiong et al. 2017); Swartz, J. 2016)
Carbon Pricing in Practice: A Review of the Evidence
Center for International Environment and Resource Policy, The Fletcher School, Tufts University 17
3. Comparative Analysis of Cap-and-Trade Systems in Practice3. 1 . E M I S S I O N S CA PEmissions caps can be allocated as an absolute cap in tons of GHGs or as a cap on GHG intensity, denoted in terms of GHG per unit of GDP. The level of the cap can be decided using a ‘top-down’ approach of imposing certain calculated emission reductions for an entire economy or through a ‘bottom-up’ approach of participating entities or regions reporting the emissions they may be able to abate in a compliance period. In order to establish an appropriate top-down emissions cap, it is important for regulators to have complete and accurate information on current and likely future emissions (Munnings et al. 2016). Similarly, for a bottom-up cap to be reliable and effective, regulators must have full information regarding the emissions-reduction potential of the participating entities or regions. Either way, an information asymmetry exists because firms hold the information needed by regulators. Both the EU ETS and Swiss ETS initially employed a bottom-up approach to deciding emission targets in their first compliance periods, with the EU allowing its member states to determine their respective national emission caps based on historical emissions benchmarks. Switzerland calculated the emissions-abatement potential of each participating firm individually before allocating allowances (CDC, EDF and IETA 2015b). However, after facing a substantial over-allocation of 220 million allowances and a resulting complete price collapse, the EU ETS decided to aggregate all member state emissions caps into a single EU-wide emissions cap that decreases at 1.74% a year (Meadows 2017; Schmalensee and Stavins 2015). In addition, the EU ETS implemented an EU Transaction Log (EUTL) to track the trading of allowances within each member country (Frunza 2013). To align with the EU ETS, Switzerland also made its emissions cap mandatory for all of its participants in the second compliance period with a 1.74% decrease per year.
RGGI, California, Québec, and KETS set top-down emissions caps based on projected emission levels calculated using estimates of future economic growth. RGGI and California also factored in the effect of complementary policies on total emissions. In spite of careful projections, the emissions cap of 188 million tons that RGGI set in 2005 ended up being too high as actual emissions were 124 million tons when the program launched in 2009. Lower electricity demand resulting from energy-efficiency improvements, economic downturn, fuel switching away from coal to natural gas, and changes in the capacity mix to nuclear, wind, and solar generation were found to be the reasons for the over-allocation of allowances (Jones, Atten, and Bangston 2017; RGGI Inc. 2010). This prompted RGGI authorities to correct course and set a 44% lower cap in the next compliance period with an annual reduction of 2.5% until 2020 (Ramseur 2017). While the EU ETS and RGGI caps suffered from miscalculated emission caps, the credibility of Korea’s ETS cap has been questioned, as it relied heavily on the country’s manufacturing businesses to derive an abatement target while discounting the concerns of environmental organizations and civil society (Kim 2015).
In NZ ETS, the intensity-based nationwide cap from 2016 may lead to varying abatement costs each year as its economy is primarily driven by weather-dependent primary production (47% of GDP from agriculture). Even if the NZ ETS were to utilize an absolute emissions cap in the future, it would still have to make ex-ante projections of its agriculture-driven GDP growth to arrive at an appropriate cap level.
Finally, the Chinese ETS pilots vary significantly in the way they set their emissions targets with Guangdong choosing an absolute cap, Shanghai allocating allowances without announcing an emissions cap, and Shenzhen issuing both intensity and absolute caps for the 2013–2015 period. It is unclear whether Guangdong, Shanghai, and Shenzhen did economic assessments to estimate their current and future CO2 emissions (Munnings et al. 2016). Reflecting the variation in economic conditions between the Chinese cities, between 2013 and 2015, Guangdong increased its emissions cap to allow for increased industrial production, Hubei decreased its cap to reflect new economic growth patterns, Chongqing reduced its cap by 4.13% a year, and Beijing, Shanghai, Tianjin, and Shenzhen kept their caps unchanged (Xiong et al. 2017).
Carbon Pricing in Practice: A Review of the Evidence
18 Center for International Environment and Resource Policy, The Fletcher School, Tufts University
3. 2 . A L L OWA N C E A L L O CAT I O N A N D D I S T R I B U T I O NOnce the emissions cap is decided, policymakers must choose whether to auction or freely allocate allowances. Grandfathering (i.e., based on historical emissions), fixed sector benchmarking (i.e., based on a product or sector’s historical or current emissions) and output-based allocation (i.e., based on a firm’s current output) are the most common approaches for free allocation (PMR and ICAP 2016). The bases for allowance calculations include the use of historical emissions, historical emissions intensity, industrial benchmarks that differentiate allocations based on the nature of a product or the production process, early-action incentives that reward new entrants with credits for emissions-reducing activities prior to enrollment, and rolling baseline years that allow firms to be benchmarked on their latest emissions data if their emissions increased significantly from the original benchmark (European Commission 2011; Pang and Duan 2016; PMR and ICAP 2016; Xiong et al. 2017; Ye et al. 2015). Each ETS scheme uses a combination of these features when calculating their free allowance allocations to individual firms.
The EU ETS was initiated with a politically-palatable, free, grandfathered allowance-allocation method, based on a bottom-up reporting of historical emissions by firms in each member state in its first compliance period. Over time the EU ETS has transitioned to a benchmarking system that calculates allowances based on a product’s benchmarked emissions and historical production. The cap takes into account potential carbon leakage and adjusts accordingly (European Commission 2011). Similarly, California initially allocated allowances for free and calculated its allocations based on a benchmarked, three-year moving-average output for each industry. It likewise takes into account industrial carbon leakage and reduces the cap over time (CARB 2010). In the second trading period (2013–2020), California uses a mix of free allocations, auctioning, and fixed price allowance sales for different sectors (see Table 1) (C2ES 2011). Québec allocated free allowances based on an entity’s historical emissions intensity from 2007–2010. However, during the second trading period, Québec harmonized its ETS with California, in preparation for linkage with the Californian system. The Swiss ETS has gone one step further in protecting its EITE sectors, by not only allocating most allowances for free, but also offering early-action credits and redistribution benefits from its CO2 levy revenue for ETS-participating firms that are exempt from the CO2 levy (FOEN 2016b).
Along similar lines, the NZ ETS gave preferential treatment to its EITE sectors (i.e., agriculture and land use sectors) by assigning free allowances based on grandfathered historical emissions, fixed until 2018, with a linear phase-out of free allowances starting in 2019 and moving to full auctioning by 2030 (Bullock 2012). With a change in government, New Zealand also introduced a “transition period” where non-forestry sector participants were required to meet only half of their emission obligations (i.e., by surrendering one allowance for two units of emissions) with the price capped at 25 NZ dollars and capping the convertibility of allowances to international offset units limited (Bertram and Terry 2008; Bullock 2012; ICAP 2017b). This essentially protected emitters from carrying the full cost of compliance. Eventually, the New Zealand government decided to phase out its one-for-two transitional measure by 2019 in order to meet its climate change targets and incentivize firm level emissions reductions (Ministry for the Environment 2016b).
Korea’s ETS established its emissions target primarily by consulting with its EITE sectors. In addition, in 2015, at the beginning of the KETS program, it allocated allowances freely and provided early action credits for new entrants (Song, Lim, and Yoo 2015). KETS allocated allowances at the firm level and calculated those allowances based on historical emissions at the sector/product level (Park and Hong 2014). In the electricity sector, KETS created a mandatory upstream and downstream allowance obligation for electricity-producing power plants and electricity-consuming customers such as large commercial buildings (PMR and ICAP 2016). Downstream obligations effectively create a price signal for indirect emitters because regulated electric utilities have limited ability to pass compliance costs to consumers. KETS accounts for indirect downstream emissions by reflecting those allowances in a higher emissions cap (above the assigned cap of 1687 MMTCO2e in phase one), thereby preventing entities from being regulated twice for the same emissions (ICAP 2016).
Finally, the Chinese ETS pilots seem to have experimented the most when it comes to allowance allocation and distribution methods. The pilots chose to allocate based on the method that best suited the region’s economic structure. Beijing and Tianjin pilots used a combination of historical emissions, historical carbon
Carbon Pricing in Practice: A Review of the Evidence
Center for International Environment and Resource Policy, The Fletcher School, Tufts University 19
intensity, and industrial benchmarks to allocate based on the region’s historical average carbon intensity multiplied by an intensity decline coefficient (Xiong et al. 2017). Similar to KETS, Shanghai uses early action incentives to encourage early movers and employs a rolling baseline year so that enterprises can use the latest year’s emissions data as a benchmark to receive allowances if their emissions increased over 50% from 2009 to 2011 (Xiong et al. 2017). Guangdong and Hubei pilots follow the Shanghai formula without issuing early-action incentives, while Chongqing relies on self-declaration of emission reductions by entities. Shenzhen allocates 90% of allowances for free based on industrial benchmarks. For the manufacturing sector, Shenzhen follows a novel approach of post-allocation adjustment based on the difference between expected and actual firm-level emissions. Manufacturing firms are required to follow a strict MRV process and report their emissions output every year for adjustment (Ye et al. 2015). Out of the seven pilots, Beijing, Shenzhen, and Hubei follow California’s hybrid approach of distributing allowances freely, through auction, and by fixed price sale. Shanghai, Tianjin, and Chongqing pilots distribute entirely for free, while Guangdong uses a combination of free distribution and auction (Xiong et al. 2017).
3. 3. L I Q U I D I T Y A N D P R I C E C O N T R O L M E C H A N I S M SLiquidity in the secondary markets is important to ensure that the allowance price reflects the true marginal cost of abatement. The turnover ratio, calculated as the ratio of total allowances traded in the secondary market and total allocations issued in the period, gives a good insight into the liquidity of an ETS market (see Table 2). The average turnover ratios of EU, RGGI, and California after 2014 are above 15%, indicating active trading in the market. However, the turnover ratios of Guangdong, Shanghai, and Shenzhen were only 0.54%, 1.48%, and 2.12% respectively (Munnings et al. 2016). Similarly, KETS has suffered from a lack of liquidity with a turnover ratio of 0.05% in the first year of the first compliance period (2015–2017). The Korean government intervened by relaxing its carefully crafted rules and increasing borrowing from 10% to 20%, relaxing rules for entities to earn early action credits and auctioning 0.9 MMCO2e from its allowance reserve in June 2016 (World Bank, Ecofys, and Vivid Economics 2016). Yet there has been little to no activity in the marketplace since 2016 (ICAP 2017c). A lack of liquidity may be occurring because of over-allocation, imperfect information for emitters, or complementary policies resulting in simultaneous emission reductions (Munnings et al. 2016; B. Zhang et al. 2013).
Table 2: Turnover Ratio of Cap-and-Trade Systems
ETS System Turnover Ratio = Allowances traded/Allowances issued
New Zealand N/A. No evidence of activing trading of domestic NZ allowance units.
Republic of Korea 0.05% (2015–2017)
China — PilotsGuangdong — 0.54%, Shanghai — 1.48% and Shenzhen — 2.12% (2013–2014). Hubei, Chongqing, Beijing, Tianjin — N/A
Sources: (European Energy Exchange 2017); (Climate Policy Initiative 2017); (RGGI 2017); (Intercontinental Exchange 2017), (Munnings et al. 2016)
The EU ETS in phases 1 & 2, RGGI, California in phase 1, and New Zealand witnessed excess allowances in the secondary markets resulting from over-allocation. The EU experienced over-allocation of up to 900 million allowances and a complete price collapse in its first compliance period due to grandfathered permits based on member state reported emissions. Subsequent over-allocation in the second compliance period was due to the economic downturn, even in spite of a 6.5% reduction in allowances and auctioning of 10% of allowances (European Commission 2016). In the third compliance period, EU ETS created a Market Stability
Carbon Pricing in Practice: A Review of the Evidence
20 Center for International Environment and Resource Policy, The Fletcher School, Tufts University
Reserve (MSR) to begin operating in 2019, with the aim of aligning the demand and supply of allowances by placing surpluses into the MSR and releasing them in the event of an allowance shortage (European Commission 2017; Hu et al. 2015). The EU also intends to double the MSR’s capacity to absorb excess allowances in the market (Meadows 2017). RGGI and California witnessed excess market liquidity and price volatility in their initial compliance periods primarily due to miscalculation of future growth projections and thereby set the emissions cap too high. Both established a price floor and created an allowance price containment reserve similar to the EU, which regulators can use to increase or decrease allowance liquidity in the market (see Table 1).
New Zealand witnessed excess liquidity resulting from the glut of Kyoto offset credits in the trading market. Since NZ ETS came under an overall Kyoto emissions cap in its first compliance period, the glut of Kyoto offsets led to a collapse in the allowance price from $20 in May 2011 to $2 in May 2013 (Richter and Chambers 2014). Unlike the California system, until 2015, the NZ ETS did not have a cap- or a price-based circuit breaker on the number of international offset credits that could be purchased by participants. In its second compliance period, NZ ETS responded by bringing the program under a nationwide emissions cap and closing access to international Kyoto offset credits (Diaz-Rainey and Tulloch 2015).
Finally, the Québec and Swiss ETS programs suffered from a lack of liquidity, primarily due to the small size of their markets. Thanks to a relatively emissions free electricity sector dominated by renewables, both programs saw fewer attractive opportunities to reduce emissions, leading to a high marginal cost of compliance. Prior to linking the Québec system to California, allowance prices were between $37–$43 per ton in 2013, three times the current price under a linked market (Purdon, Houle, and Lachapelle 2014). In a linked market, Québec currently maintains an allowance price containment reserve that aligns with California (Government of Québec 2015).
3.4 . L E A KAG E A N D G A M I N G O F E M I S S I O N S A L L OWA N C E M A R K E T SCarbon leakage and gaming of emissions allowance markets appeared in several forms across ETS systems. Carbon leakage, in the form of non-compliance, is apparent in the KETS. Since KETS requires downstream fleets in the transport sector to report fuel use, there is a risk of increased leakage from fleets shifting towards unregulated vehicles (PMR and ICAP 2016). In the case of New Zealand, carbon leakage appeared in the form of Kyoto offsets and HFC-23-related credits from other markets that were easily brought into the NZ ETS market, thereby undermining the creditability and environmental effectiveness of the program (Diaz-Rainey and Tulloch 2015). Although the new intensity-based allocation in NZ ETS may stem domestic carbon leakage, it could encourage increased international leakage, with emitters from other countries with stricter emission requirements relocating to New Zealand (Bertram and Terry 2010).
Between 2008 and 2011, some firms gamed the EU ETS, resulting in the loss of €5 billion in national tax revenues. Companies bought EU allowance units (EUA) in member countries without a value added tax (VAT) and sold them in countries with a VAT (and therefore for a higher price), without returning the VAT to the relevant tax authority (Bierbower 2011). Later, the EU adopted a directive allowing member states to implement a VAT reverse mechanism whereby the entity responsible for paying the VAT is the entity purchasing the allowances (European Court of Auditors 2015). Similarly, in California, leakage has occurred as regulated entities, primarily utilities, shuffle their resources through out of state electricity purchases. California imports large amounts of electricity, roughly 33.5% in 2015 (much of it either coal or natural gas based), from other western states that do not have carbon pricing mechanisms (CEC 2017). This practice allows regulated California utilities to switch from dirtier to cleaner electricity resources by rearranging ownership or contracts with out-of-state generators, and then claim the difference in emissions as reductions in firm-level emissions. While initial CARB policies banned the practice, after significant industry pressure, CARB allowed for special exemptions that allow for resource shuffling (Cullenward and Weiskopf 2013). Estimates of the potential leakage range from 120 to 360 MMTCO2e in total measured emission reduction under the cap-and-trade program, a significant amount in light California’s goal to reach 1990 emission levels (approx. 431 MMTCO2e) by 2020 (Borenstein et al. 2014; CARB 2017). Due to Québec’s linkage with the California system, it also suffers indirectly from resource shuffling. There has not been evidence of significant carbon leakage or gaming documented in RGGI, Swiss ETS, or the Chinese pilots.
Carbon Pricing in Practice: A Review of the Evidence
Center for International Environment and Resource Policy, The Fletcher School, Tufts University 21
3. 5. I N T E R N AT I O N A L L I N KAG ELinkage between ETS systems can be of three types: 1) a unilateral link where one ETS accepts the compliance instruments of another but not vice versa; 2) a bilateral link where each ETS accepts the compliance instruments of the other or have common compliance rules; 2) an indirect link where an ETS has a link to another ETS through a third market (Haites 2016). Linked ETS systems may benefit from improved cost effectiveness, better liquidity and price stability, lower emissions leakage, and lower transaction costs (Haites 2016; Metcalf and Weisbach 2011). Linkages are likely when jurisdictions have similar environmental goals, economic conditions, a history of productive engagement on other issues and familiarity with each other’s regulatory and political systems (Ranson and Stavins 2016).
California is notable for its international linkage with the Québec cap-and-trade program beginning in 2014. The two systems were fairly easy to link due to extensive and transparent communications between the two governments going as far back as 2008 (Benoit and Côté 2015). California and Québec created a common electronic allowance registry to avoid gaming and potential double-counting. Strong verification and data accuracy safeguards were put in place to ensure the integrity of allowance credits, in addition to that of the offsets. To maintain price stability, the price floor was set at the highest minimum price of either region, in USD. Linking with the California system allowed Québec’s cap-and-trade market to increase its liquidity through increased access to allowances, with analysis indicating that Québec could potentially purchase between 14.4 and 18.3 million allowances from California, based on projected demand for allowances (CARB 2012). Ontario, which recently inaugurated its cap-and-trade program, announced plans to link up with Québec and California in 2018, which will further increase the total number of tradable allowances and offsets (ICAP 2017d).
The Swiss ETS aligned its compliance instruments during its second trading period with the EU ETS. As a small ETS market with only 5.3 MMTCO2e emissions cap, the Swiss ETS could potentially gain from linking with the EU ETS. Through linkage, the existing lack of market liquidity will ease carbon leakage outside of Switzerland and competitiveness concerns for Swiss companies would decrease, as 60% of its exports and 78% of imports occur within the EU region (Hawkins and Jegou 2014). The KETS could potentially link to its regional neighbor, Tokyo-Saitama ETS, or with the EU ETS. However, there is little indication of learning on the part of KETS from the Québec-California linkage when it comes to solving its liquidity issues.
On the delinking side, Diaz-Rainey and Tulloch (2015) argue that NZ ETS shows both the power and dangers of tacit linking to international carbon markets. As discussed in the previous section on carbon leakage, due to excess liquidity from international offsets, the NZ ETS had to delink itself from CDM and offset markets in 2015 and move towards a domestic market (Bullock 2012). The EU ETS also delinked from the international CDM market in 2012.
3.6. CA R B O N R E V E N U E M A N AG E M E N TIn 2015 alone, carbon pricing policies generated $26 billion in revenues worldwide (World Bank 2016). Revenues generated from auctioning allowances could be used in climate change mitigation, reducing distortionary taxes, reducing budget deficits, addressing competitiveness concerns, augmenting government expenditure on public goods, or to increase the flow of climate finance from developed to developing countries (Bowen 2015; World Bank 2016).
The EU ETS generated about €14 billion in auctions between 2012 and 2016, with at least 50% of the revenue distributed for climate and energy-related purposes and retrofitting existing infrastructure (European Commission 2017). The EU plans to establish two new funds: an Innovation fund to extend existing support for demonstration of innovative technologies, and a Modernization fund to facilitate investments in modernizing the power sector and fostering energy efficiency (Meadows 2017). Similarly, RGGI has generated about $2.7 billion in revenue, of which close to 50% is used for “consumer benefit or strategic energy purpose” by participating states (RGGI Inc. 2010). RGGI allocated 42% for energy efficiency programs, 11% for bill assistance to low-income residents, 9% for GHG abatement, 8% for renewable energy development, 8% for state budget reductions, 4% for program administration, and 1% for RGGI management between 2009 and 2014 (Ramseur 2017). Allowance revenue has generated employment in the RGGI region,
Carbon Pricing in Practice: A Review of the Evidence
22 Center for International Environment and Resource Policy, The Fletcher School, Tufts University
with estimates showing a net effect of 30,200 job-years between 2009 and 2015 (Hibbard et al. 2015). Similar to the EU and RGGI, California raised $3.385 billion in revenue through 2017 and has invested revenue into high speed rail, low carbon transit, low-income weatherization, and environmental conservation efforts (CCI 2017). Québec expects to raise $3.3 billion by 2020 towards the Québec Green Fund, a dedicated fund used to enhance the region’s emissions reductions (CDC, EDF, and IETA 2015a). Overall, ETS systems with a revenue generation instrument seem to be doubling down on environmental effectiveness rather than directing revenues towards non-environmental purposes.
3.7. S TA K E H O L D E R E N G AG E M E N TEngaging stakeholders on a regular basis is critical to the success of any ETS regime. ETS programs like RGGI, California, and Québec are known for their transparency and commitment to periodic program reviews where issues such as cap level reduction and revenue allocation are revisited. The linked California-Québec system ensures data transparency, careful monitoring, and evaluation. In addition, the California system has received wide public support, with 54% of the state’s residents favoring the program even if it raised consumer prices (Baldassare et al. 2016).
The KETS is a good example of learning from the successes and failures of prior implementations when it comes to planning and engaging stakeholders early. Prior to introducing KETS, the Korean government launched a GHG and Energy Target Management System (TMS), a mandatory negotiated agreement aimed at curtailing energy use and GHG emissions, thereby easing firms into the process of monitoring and verifying emissions data (Oh, Hyon, and Kim 2016). KETS also follows a detailed set of conditions under which the Allocation Committee can intervene in the market without requiring permission from the legislature. Along the lines of KETS, the Chinese ETS pilots represent experimentation in the marketplace, engaging and familiarizing stakeholders to new forms of regulations, and testing compliance enforcement prior to the launch of its nationwide ETS system.
3. 8 A M B I T I O NOf all the design features discussed in this paper, ambition captures the extent to which an ETS system contributes to global climate mitigation efforts. Ambition can be defined as the amount of emissions covered by an ETS (i.e., coverage) and the price per ton of GHG emissions imposed/reflected in the market (i.e., stringency). The product of coverage and stringency, defined as the “coverage adjusted carbon price,” indicates the level of ambition of an ETS system. In Figure 1, we see that the coverage-adjusted carbon price for all of the ETS systems discussed in this paper fall short of $15 per ton of GHG emissions, less than the politically-acceptable lower bound estimate of $20 per ton recommended by the Interagency Working Group and the recent $31 estimate proffered by Nordhaus (Nordhaus 2017; Pindyck 2013). This indicates that there is significant room for improving the ambition of these ETS programs.
A well-functioning ETS helps maintain a stable price signal but it does not serve the core purpose of a carbon pricing policy unless it is accompanied by sufficient ambition. RGGI, for example, stands out as one of the most well-planned and well-executed ETS markets with full auctioning of allowances and efficient use of carbon revenues, but could be considered the least ambitious ETS program with a coverage adjusted price of $0.53 per ton of GHG emissions even though its emissions fell 57% between 2005 and 2016, perhaps induced by other complementary policies. Similarly, increasing ambition with wider emissions coverage combined with a progressively tightening cap and stable prices, as observed in California and Québec, is critical for achieving a reasonable social cost of carbon over time.
Carbon Pricing in Practice: A Review of the Evidence
Center for International Environment and Resource Policy, The Fletcher School, Tufts University 23
Figure 1: Carbon price per ton of GHG emissions in 2016: Cap-and-Trade and Carbon Tax
Sources: (World Bank, Ecofys, and Vivid Economics 2016); (PMR, and ICAP 2016); (PMR 2017)
Carbon Pricing in Practice: A Review of the Evidence
24 Center for International Environment and Resource Policy, The Fletcher School, Tufts University
4. National & Sub-National Policies: Carbon Tax and Hybrid SystemsSection 4 briefly describes the carbon tax systems of British Columbia, Mexico, Chile, Japan, India, Norway, and Ireland. Section 5 compares and contrasts the design and implementation features, constraints, and other issues faced by these systems. Cases were selected to cover carbon tax policies that varied in their sectoral coverage (e.g., economy wide in British Columbia to partial coverage in Chile), taxation on carbon content of the fuel instead of direct carbon emissions (e.g., Mexico, Norway), taxation on one particular source of fuel (e.g., India), revenue redistribution (e.g., revenue neutral in British Columbia versus earmarking of revenue to clean energy investments in Japan and India), and the presence of a hybrid with cap-and-trade systems (e.g., Norway and Ireland). Similar to the cap-and-trade case studies, the carbon tax case studies represent diverse geographies and span across time allowing us to identify learning and spillover of knowledge, if any, from older to newer implementations. Table 3 provides a comparison of the design details of the carbon tax and hybrid systems reviewed in this paper.
4 . 1 . N O RWAY ’ S CA R B O N TAX W I T H E U E T S - H Y B R I DFollowing the publication of the Brundtland report, Our Common Future, in 1987, the Norwegian government introduced an upstream carbon tax on oil and gas extractors, HFC/PFC importers and a downstream tax on oil and gas suppliers. The tax system allows some sectors such as pulp and paper, fishmeal, domestic aviation, and shipping to pay reduced rates and other sectors covered by the EU ETS and external aviation to be exempt from the carbon tax (see Table 3). Although EU ETS sectors are exempt from the carbon tax, there seems to be significant overlap between the carbon tax and EU ETS covering the same base emissions in sectors such as electricity (58%), industry sector (54%), and off-road transport sector (30%) (OECD 2015).
Noteworthy Features: Norway’s carbon tax is notable for its ambitious tax rate between $3 and $64 per ton of CO2e in different sectors since its introduction in 1991. Norway also taxes non-CO2GHG emissions from NOx, SO2, and HFC/PFC. The government has maintained policy stability and clear price signals for private sector companies willing to invest in clean energy technologies. Since 2013, about 30% of carbon tax revenue is being earmarked in to a special fund for climate, renewable energy and energy efficiency measures.
Constraints: In order for Norway to meet the EU target of 30% emissions reduction in non-EU ETS sectors by 2030, the tax rate needs to be significantly higher on motor fuels (Bye and Bruvoll 2015). The Green Tax Commission has recommended a single tax rate of $49 per ton CO2e for all non-EU ETS sectors (World Bank, Ecofys, and Vivid Economics 2016). Stiff political resistance to higher carbon tax rates has made policy changes unlikely in the foreseeable future (PMR 2017). In terms of emissions reduction since 1991, the Ministry of Climate and Environment estimated in 2014 that the country’s total emissions would have been 6–7 million tons of CO2e higher than they were without the tax in place (PMR 2017). Between 1991 and 2008, total CO2 emissions in Norway only increased by 15% while the GDP grew 70% during the same period (Sumner et al. 2011). However, during that period, CO2 emissions from petroleum and natural gas extraction increased 86%, while general emission growth was only 6%. With inelastic European demand for oil and gas extraction, which is taxed, exemptions for shipping exported oil and gas sold through pipelines, and a domestic energy mix already dominated by hydropower and renewables, the carbon tax does not seem to have created any significant domestic reduction of total emissions (Lin and Li 2011).
4 . 2 . I R E L A N D ’ S CA R B O N TAX W I T H E U E T S - H Y B R I DIn 2010, Ireland introduced a carbon tax on CO2emissions from most sectors not covered under the existing EU ETS (Irish Finance Act 2010); including transport, heat for residential sectors, commercial buildings, and small industry. Currently, the tax rate is €20 per ton of CO2e covering 38% of the country’s CO2 emissions.
Noteworthy Features: Ireland’s carbon tax is notable for its ambitious price per ton of CO2 covering almost all sectors not covered by the EU ETS. Although the Irish carbon tax was mildly regressive based on income and household characteristics for home heating expenditures, it was progressively distributed
Carbon Pricing in Practice: A Review of the Evidence
Center for International Environment and Resource Policy, The Fletcher School, Tufts University 25
across the income spectrum for electricity and petrol use (Farrell 2017). The tax system is also known for its implementation during the global recession and a time of peak austerity in Ireland. The carbon tax revenue represented about 12.4% of the cumulative tax increases required by the IMF between 2010 and 2012 (Convery, Dunne, and Joyce 2013) and has generated over €2 billion in revenue so far. In addition, non–EU ETS covered emissions have decreased by 15% from 2008 to 2012. While not all of these reductions can be attributed to the carbon tax, the Irish carbon tax has clearly decreased emissions further than the EU ETS would have alone (Convery, Dunne, and Joyce 2013).
Constraints: In spite of significant emissions reductions, a government report warns that Ireland is not on track to meet its decarbonization goals and may face added pressure when new emissions reduction obligations are imposed post-2020. There are concerns that non-ETS sectors (i.e., sectors covered by the carbon tax) will miss their 2020 target of twenty percent emissions reduction by 14 to 16% (Ireland EPA 2017) due to the difficulty of decarbonizing the agriculture and transport sectors. Additional policy incentives and a higher carbon price are necessary to achieve decarbonization in these sectors.
4 . 3. B R I T I S H C O LU M B I A’ S CA R B O N TAXBritish Columbia (BC) has the longest running carbon tax policy in Canada. The economy-wide tax rate is $30/ton of CO2e, covering more than 70% of the region’s GHG emissions with sectoral exemptions for the remaining 30% of GHG emitting sources (see Table 3) (Government of British Columbia 2016).
Noteworthy features: A defining feature of the BC carbon tax is its revenue neutrality. This design decision won support from the business community as BC redistributed the revenues to reduce industrial property taxes and other corporate taxes for industries affected by the tax (see section 5.5.1). Overall, data indicate that BC’s carbon tax has reduced emissions with few negative effects on the economy (Murray and Rivers 2015; Metcalf 2015). An analysis of several different models shows that the carbon tax reduced emissions between 5%–15%, absent any additional policy, when compared to a business-as-usual scenario (Murray and Rivers 2015). The province decreased per capita emissions by 12.9% by 2013 when compared to pre-carbon tax levels, more than three-and-a-half times the 3.7% per capita decline nationwide (Metcalf 2015). As of 2015, BC has reduced 2.8 million metric tons of GHG when compared to the pre-tax period, with a GDP growth of 1.55% (higher than the national average of 1.44%) between 2008 and 2013 (Komanoff and Gordon 2015).
Constraints: The defining feature of revenue neutrality is by itself a constraint for BC’s carbon tax system. The system does not have any plans to transition from revenue neutrality to earmarking of funds for reinvesting in emissions-reducing activities. In addition, sectoral exemptions and carbon tax politics (see section 5.5.1) can undermine popular support for the policy.
4 .4 . M E X I C O ’ S CA R B O N TAXIn 2013, as part of a broader fiscal reform effort, Mexico became the first Latin American country to establish a carbon tax with widespread support of the domestic think tanks and NGOs (Muñoz 2015). Mexico’s carbon tax builds on the national climate change law approved by the Mexican Congress in 2012, with the goal of reducing greenhouse gas emissions by 30% by 2020 and 50% by 2050 (CDC, EDF, and IETA 2015d). An effective average tax of $3.21 per ton of CO2e is levied upstream at the production stage on the carbon content of the fuels (see Table 3) (OECD 2014), with exemptions for natural gas production and import, and an offset mechanism allowing the use of certified emissions reduction (CER) credits by eligible Mexican projects (CDC, EDF, and IETA 2015d; IEPS Law 2013). The Mexican carbon tax operates in parallel to a voluntary carbon exchange market called MexiCO2 that allows for the exchange of CER offsets with taxes.
Noteworthy features: Taxing upstream at variable rates based on the carbon content of the fuel, the operation of a carbon tax market alongside a voluntary carbon exchange market (MexiCO2), and the creation of a national emissions inventory registry are three notable features of the Mexican carbon tax design. The emissions-inventory registry is paving the way for a future carbon trading market. The Mexican government plans to establish a voluntary ETS market by 2018 with the expected participation of 60 national and international companies from the power, industry, and transport sectors (Mexican Government 2016). The government is
Carbon Pricing in Practice: A Review of the Evidence
26 Center for International Environment and Resource Policy, The Fletcher School, Tufts University
exploring cooperation options within Latin America through the Pacific Alliance (World Bank, Ecofys, and Vivid Economics 2016) and has expressed interest in forming a North American carbon market linking the voluntary Mexican ETS with California and Québec cap-and-trade programs. Finally, Mexico plans to liberalize domestic fuel prices by 2018, which would increase the effectiveness of the carbon tax and potentially result in 10% of total tax revenues coming from the carbon tax and retail price reforms (Metcalf 2015).
Constraints: Mexico’s tax rate is the lowest among OECD countries (IMF 2015) and one of the lowest in the world (World Bank, Ecofys, and Vivid Economics 2016). Since natural gas accounts for about 30% of Mexico’s energy-related CO2 emissions and is exempted, the tax only covers about two-thirds of Mexico’s fossil fuel-related emissions (Metcalf 2015). Low prices combined with exemptions for natural gas act as major constraints in achieving higher ambition (i.e., coverage adjusted carbon price). The annual revenues expected at this rate are about $1.1 billion, representing less than 1% of the total federal tax collections (Metcalf 2015). Despite low prices and revenue, there is currently no plan to increase the tax rate over time, with the exception of adjusting fuel rates annually for general inflation. The low tax rate is estimated to reduce CO2e emissions by 1.6 million tons of CO2e, representing just 0.33% of Mexico’s total emissions per year (Metcalf 2015).
4 . 5. C H I L E ’ S CA R B O N TAXIn 2014, Chile approved a carbon tax to enter into force in 2018, to meet its climate mitigation goal of 20% reduction in carbon emissions by 2020 as compared to 2007 levels. The Chilean carbon tax applies to the electricity sector, which more than doubled its emissions from 1990 to 2010. The main goal of the tax is to reduce energy demand and transition the grid towards less carbon intensive fuels (Benavides et al. 2015). The tax is expected to impose an additional cost of energy of about 3%, which would translate into approximately 2% of the current cost of the residential tariff (Borregaard 2014). The tax is applied upstream on GHG emissions from the utilities and the revenue will be reinvested in public education and clean investments (Villarreal 2016).
Noteworthy features: The creation of an emissions inventory registry is a notable feature of the Chilean carbon tax policy. This sets up an easy transition for a future ETS market. In 2015, the Minister of Environment stated that as the country builds its emissions monitoring, verifying, and reporting infrastructure as part of the carbon tax implementation process, a scale up of the carbon tax or the establishment of an ETS could be an option (Szabo 2015).
Constraints: The prevailing low tax rate of $5 per ton of CO2e is a constraint on Chile’s goal to encourage utilities to shift towards cleaner energy generation. It is believed that energy companies will simply pass the higher cost on to households and smaller companies (CEPAL 2016). López, Accorsi, and Sturla (2016) argue that a $26 per ton of CO2 tax would be optimal, and that it should be accompanied by a target to achieve a 50% carbon-free energy mix, which could be supported by investments using the tax revenues.
4 .6. JA PA N ’ S G L O B A L WA R M I N G TAXIn 2010, the Japanese government passed the Basic Act on Global Warming Countermeasures (GW Basic Act), which established climate policy as a pillar of Japan’s policymaking on par with energy and environmental policy. The major proposed policies were a carbon tax, a nationwide cap-and-trade system, and a feed-in tariff scheme. Subsequently, in October 2012, the Japanese government introduced the Global Warming Countermeasures Tax (GW Tax), an upstream carbon tax on fossil fuels that added a surtax to existing taxes on petroleum, gas and coal products (Kuramochi 2015). The tax covers 70% of Japan’s GHG emissions with a low price of $3 a ton of CO2e.
Noteworthy features: Japan’s GW tax is notable for its efficient use of revenue towards low carbon technologies and energy efficiency. In 2016, the special account received JPY 596 billion ($5.37 billion) and disbursed $1.39 billion to the MOE and $3.3 billion to METI (MOE 2017). The tax revenue was used efficiently towards reducing the burden of small businesses from the tax and feed-in-tariff and increasing the end-use energy efficiency in the country (see section 5.5.2 and Table 6).
Carbon Pricing in Practice: A Review of the Evidence
Center for International Environment and Resource Policy, The Fletcher School, Tufts University 27
Constraints: The GW tax plan does not mention whether the tax of $3 per ton of CO2 will be increased in the future. In spite of the efficient use of carbon tax revenue towards emissions-reducing activities, the modest tax rate do not seem to help Japan achieve its emissions reduction goal of 26% below 2013 levels by 2020. Japan’s GW tax seems to neither maximize the price effect with high tax rates nor accelerate significant emissions reduction through the use of higher tax revenues towards emissions-reducing activities. In addition, after the Fukushima nuclear disaster, Japan’s closure of nuclear power plants has increased the amount of imported coal use in electricity generation, making the GW tax even less effective in reducing the inelastic demand for imported coal. Pollitt et al. (2014) estimate that achieving 25% emissions reduction from 1990 levels with zero nuclear energy in the mix would require a very high carbon tax of $506 per ton of CO2e, much higher than the current $3 per ton of CO2e (Pollitt et al. 2014).
4 .7. I N D I A’ S C OA L TAXIn 2010, the government of India introduced a “Clean Energy Cess”, an upstream tax on coal, with an initial tax of $1 per ton of coal. Subsequently, the tax has risen to $6 per ton of coal (i.e., $3.29 per ton of CO2e) today.
Noteworthy Features: The tax system is notable for its strict MRV process where excise officers are empowered to inspect the premises of registered coal producers during audits. The tax system imposes a non-compliance penalty that is three times the existing price (i.e., $18 per ton of coal). In addition, the system earmarks all of its revenue generated towards a National Clean Environment Fund (NCEF) meant to encourage energy innovation and investments.
Constraints: It is unlikely that the current tax alone is high enough to support India’s ambitious NDC goal of 40% non-fossil fuel energy mix by 2030. Although it is not practical to expect to reach the target only with a coal tax, higher coal tax levels ($18 per ton) and recycling of revenues to deployment of solar, wind, and climate-smart agriculture could increase the share of renewables to at least 16% with a positive impact on GDP (Ghosh 2016). Second, there are concerns about the effectiveness of the current usage of tax revenue by the NCEF as there are inconsistencies between the NCEF’s stated objectives, operational guidelines, and actual implementation (Pahuja et al. 2014). The lack of capacity to develop proposals, unclear eligibility criteria, and under provision for public-private partnerships seem to plague the NCEF mission.
Carbon Pricing in Practice: A Review of the Evidence
28 Center for International Environment and Resource Policy, The Fletcher School, Tufts University
Table 3: Design Details of Carbon Tax and Hybrid Systems
D E S I G N F E A T U R E S
British Columbia Mexico Chile India Norway Ireland Japan
Jurisdiction Provincial National National National National National National
Start Date 2008 2014 2014 2010 1991 2010 2012
Regulating Authority
Ministry of Finance
Ministry of Environment and Natural Resources and Ministry of Finance
Fuels Covered 23 fossil fuels All fossil fuels, except natural gas
All fossil fuels All domestic and imported coal, lignite, peat
Heating oil, diesel, natural gas, gasoline, LPG
Oil, gas, and coal, peat, LPG not covered by EU ETS
Oil, gas, and coal
Offset Allows for use of CER offsets
Tax Compliance The Ministry of Finance has been given significant inspection and audit powers, with the ability to assess interest and penalties (ranging from 10–100% of the tax amount owed). (World Bank)
The Federal Attorney General’s Office for the Protection of the Environment can impose a fine of 3,000 days of minimum wage for a violation
Excise officers are allowed to inspect the premises of registered producers and audit records to determine compliance
Failure to comply with the law is subject to fines and up to three months imprisonment
The Revenue Commissioners can revoke the license of any license holders who do not comply with regulations. Furthermore, any person who tries to contravene or fails to pay the tax is subject to a penalty of €5,000.
Taxpayers are required to pay a penalty and interest for late payment. Tax officials are allowed to conduct audits of individuals suspected of tax evasion and file criminal charges and seize assets for nonpayment
E M I S S I O N S C O V E R A G E
GHGs Covered CO2, CH4, NO2, SO2, HFC, PFC
CO2 CO2, SO2, NO2, PM
CO2, CH4, HFC, PFC
CO2, CH4, NO2, SO2, HFC, PFC
CO2
Sectoral Coverage Fuel producers and importers
Electric Sector Coal importers and producers
Petroleum extraction, HFC/PFC importers, oil, natural gas and LPG suppliers
Fuel suppliers Fuel producers and suppliers
Overall Emissions Coverage
70% 40% 75% 46% 60% 33% 70%
Carbon Pricing in Practice: A Review of the Evidence
Center for International Environment and Resource Policy, The Fletcher School, Tufts University 29
C A R B O N T A X
British Columbia Mexico Chile India Norway Ireland Japan
Revenue neutral (business & personal income tax cuts, low-income tax credits, direct grants to rural and native communities)
Revenue is directed towards the national budget
Revenue is directed towards the General Treasury
Revenue directed toward the National Clean Energy Fund
Revenue directed toward the Global Government Pension Fund and national budget
Revenue is directed towards the general budget, most revenue has been used to pay public deficit.
Tax revenue is used to promote low-carbon technologies, energy efficiency improvements and renewable energy
B E Y O N D T H E F E N C E
EITE Protection and Exemptions
Exemptions for fuel exporters, international travel, non-fossil fuel GHG emissions from industrial processes, i.e., cement, landfills, forestry, and agriculture.
Natural gas exempted
Coal mined by local tribes in the State of Meghalaya
Exemptions for international air and maritime transport, exported gas, freight and passenger transport within domestic shipping sector
Emissions from agriculture are excluded
All fossil fuels that were exempted from the general Petroleum and Coal Tax before October 2012 continue to be exempt from the tax, including imported coal used for the production of iron and steel, coke and cement, and volatile oil feedstock for the production of petrochemical products
International Linkage
No international linkage
Talks ongoing of adopting ETS mechanism and linking with California and Canada
Linked with EU ETS, emissions covered by EU ETS are exempted from carbon tax
Linked with EU ETS, emissions covered by EU ETS are exempted from carbon tax
Data Sources (PMR 2017); (Carbon Tax Act 2008)
(PMR 2017); (Carbon Tax — Ley Del Impuesto Especial Sobre Produccion y Servicios 2014)
(PMR 2017); (Carbon Tax Law No. 20780 2014)
(PMR 2017); (Finance Act of 2010)
(PMR 2017); (Act 21 2008)
(PMR 2017); (Irish Finance Act of 2010)
(PMR 2017); (MOE 2012)
Carbon Pricing in Practice: A Review of the Evidence
30 Center for International Environment and Resource Policy, The Fletcher School, Tufts University
5. Comparative Analysis of Carbon Tax and Hybrid Systems in Practice5. 1 . P R I C E S E T T I N GDetermining the appropriate price of a carbon tax based on the principal of maximizing total social welfare is nearly impossible to do with certainty due to a lack of consensus on the socially-optimal level of emissions (Mankiw 2009). This lack of consensus arises due to uncertainty over the potential economic damages of climate change, the cost of mitigation, and normative judgments over discounting future damages and time-inconsistent preferences. In recent years, many efforts have been made to determine the social cost of carbon, both globally and at the country level. In terms of specific carbon tax recommendations, William Nordhaus (2007) suggested a tax of $30 per ton of CO2e while the 2006 Stern Report recommended a much higher tax of over $300 per ton (Stern 2007) globally. Aldy (2016) recommended a tax starting at $25 per ton for the United States with a 5% annual escalator to reach the desired social cost of carbon by 2030. In 2017, a carbon pricing effort led by former U.S. conservative politicians advocated for a carbon dividend approach with a tax starting at $40 per ton and escalating annually from there (Climate Leadership Council 2017).
Table 4: Mexico’s Carbon Tax
Fossil Fuel Rate Carbon Price
Type Units Initial Enacted MEX$/ton CO2 US$/ton CO2
British Columbia’s carbon tax started with a flat economy-wide $10 price per ton of CO2e and a $5 increase per year until reaching $30 per ton in 2012 (Government of British Columbia 2016). Similarly, Ireland’s carbon tax began at an average effective rate of €15 per ton of CO2, and increasing annually for different fuels until it reached a rate of €20 per ton. Unlike British Columbia and Ireland, other carbon tax systems do not have a codified annual escalator to reach a desired carbon price. In an ad hoc fashion, India increased its upstream tax on from Rs.50 (~$1 per ton of coal) to $2 per ton in 2014, $4 per ton in 2015, and to $6 per ton in the union budget of 2016–2017 (MOF 2015). Similarly, Japan has increased its carbon tax three times since October 2012, starting with an initial price of $0.95 to $3 today (MOE 2012), with no proposals to increase the tax rate any higher. Chile imposes a flat tax rate of $5 per ton of CO2e on emissions from fixed sources (boilers and turbines) with a thermal input greater than or equal to 50 MWT (thermal megawatts) (Gobierno de Chile 2014), while Mexico taxes fuels differentially ranging from $0.43 to $3.44 per ton of CO2e emissions (Table 4) (Metcalf 2015). Similar to Mexico, Norway imposes a variable tax rate ranging from $3.5 to $64 per ton of CO2e on fossil fuels and greenhouse gases across different sectors, with the exception of a high rate of $432 per ton of CO2e for “natural gas emitted to air” (Table 5).
Carbon Pricing in Practice: A Review of the Evidence
Center for International Environment and Resource Policy, The Fletcher School, Tufts University 31
Table 5: Carbon tax by fuel and sector in Norway
Carbon Tax Sectors (Upstream and Midstream)Tax on Fuel source
(in NOK)Tax per ton of CO2
(NOK / USD)
Petroleum activities in the continental shelf — oil, gas, condensate (used in extraction)
1.04 per liter or cubic meters
Gas – 554 / $64 Oil – 392 / $46
Petroleum activities in the continental shelf — natural gas emitted to air (used in extraction)
7.16 per liter or cubic meters
3710 / $432
Petrol (at consumption) 0.97 per liter 414 / $48
Natural gas (at consumption) 0.87 per cubic meters 463 / $54
LPG (at consumption) 1.26 per kg 479 / $56
Oil (at consumption) 1.2 per liter 452 / $53
Oil for Domestic Aviation (at consumption) 1.1 per liter 497 / $58
Oil for Pulp and paper industry, Herring meal, fish meal industries (at consumption)
0.32 per liter 120 / $14
Oil for fishing and catching in inshore waters (at consumption) 0.29 per liter 109 / $13
Reduced rate for natural gas 0.057 per cubic meters 30 / $3.5
Exempted sectors – Foreign shipping of oil and gas exports, fishing in Norway and in distant waters, external aviation, EU ETS sectors (except electricity, industry, and transport, all of which face both tax and EU ETS prices).
N/A N/A
Source: (Statistics Norway 2017); calculated with CO2 conversion factors from www.eia.gov.
5. 2 . E M I S S I O N S C OV E R AG E Carbon taxes vary widely in terms of sectoral coverage. Carbon taxes can apply economy-wide or to specific sectors and products such as liquid fuels (like Finland’s liquid fuels tax) or specific industries such as the oil and gas sectors (World Bank, Ecofys, and Vivid Economics 2016). For true economic efficiency, a carbon tax would ideally be economy-wide, covering all emitting sources at either the production (upstream) or consumption (downstream) stage. Taxing upstream, with the exception of natural gas, is generally considered to lower the transaction costs of implementing and collecting the tax, as well as ensuring wide sectoral coverage (Metcalf and Weisbach 2009). A downstream tax requires applying and collecting the tax at the broader retail level, rather than on a smaller subset of fuel extractors, producers, and users (Metcalf 2017).
British Columbia’s downstream economy-wide carbon tax covers 70%–75% of all provincial GHG emissions from facilities that emit more than 10,000 tons of CO2e per year, including emissions from liquid fossil fuels, natural gas, coal, and other greenhouse gases such as methane, nitrous oxide, and land-use change emissions (Murray and Rivers 2015). Similar to British Columbia, Chile imposes a tax on GHG emissions; however, it is applied midstream on electricity produced from fixed sources. Emitting sources using biomass energy are exempted (Gobierno de Chile 2014). The Chilean carbon tax covers about 27% of the country’s total CO2e emissions, primarily affecting big energy companies such as Endesa or AES Gener (CEPAL 2016).
Carbon Pricing in Practice: A Review of the Evidence
32 Center for International Environment and Resource Policy, The Fletcher School, Tufts University
Other countries impose a tax on the fuel or the estimated carbon content of fossil fuels instead of GHG emissions. India imposes an upstream fuel tax per ton of coal imported or produced covering about 46% of the country’s GHG emissions. Japan adds an upstream surtax to existing taxes on petroleum, gas, and coal products based on the carbon content of the fuel (Kuramochi 2015). Mexico levies an upstream tax on the sale and import of fossil fuels depending on the relative carbon content of a fuel with respect to natural gas as the baseline (i.e., zero tax for natural gas) (IEPS Law 2013). The Mexican carbon tax covers about 40% of the country’s total GHG emissions. Norway imposes an upstream carbon tax on fuel sources such as oil and gas used for petroleum extraction activities in the continental shelf, HFC/PFC importers, and a midstream tax on oil, natural gas, and LPG fuel suppliers (Table 5). The Norwegian carbon tax covers about 60% of its GHG emissions and 80% of the country’s emissions along with EU ETS (Bragadóttir et al. 2015). Similar to Norway and Mexico, Ireland’s carbon tax, levied midstream on fuel suppliers, covers about 38% of the country’s CO2 emissions with a tax on petrol, heavy oil, auto-diesel, kerosene, liquid petroleum gas (LPG), fuel oil, natural gas, coal, and peat (Convery, Dunne, and Joyce 2013).
5. 3. E I T E S E CTO R E X E M P T I O N SA carbon tax that is not harmonized across jurisdictions raises the marginal cost of production in the region with the carbon tax and thus creates a competitive disadvantage for that country. A number of carbon pricing experts have proposed border carbon adjustments that would serve to equilibrate prices of carbon-intensive goods across regions that do and do not have carbon pricing schemes (Flannery 2016). Most carbon tax systems, however, instead exempt their EITE sectors from the tax rather than implementing border carbon adjustments.
With the exception of Ireland and India, all current carbon tax systems exempt energy-intensive and trade-exposed enterprises from paying the tax. Mexico exempts the entire natural gas production and supply from the carbon tax. Both Norway and British Columbia exempt the fuels exporting process out of the region and emissions from shipping and air travel. In addition, British Columbia exempts emissions from agricultural production and other non-fossil fuel GHG emissions such as methane leakage from landfills, forestry, agriculture, and natural gas production. EITE sectors such as the cement sector in British Columbia were even able to secure a one-time transition incentive of $22 million to buy in to the carbon tax system, essentially establishing precedent for targeted incentives to improve political acceptability (PRNewswire 2015; Murray and Rivers 2015). Japan exempts imported coal used for the production of iron and steel, coke and cement, etc., agriculture, forestry, and all transport sectors except road transport. Both Japan and Chile allows energy companies to pass on the cost to consumers, allowing utilities to recover the additional expenses incurred from the carbon tax (CEPAL 2016; Kuramochi 2015). Chile, in addition, exempts copper smelting, utilities using biomass, and other associated industrial plants from its carbon tax.
5.4 . A M B I T I O NAs seen Figure 1, the effective economy-wide carbon price, when adjusted for sectoral coverage and exemptions, is significantly lower than it would be without such exemptions in most of the carbon tax systems. With the exception of British Columbia, all of the carbon tax systems have a coverage adjusted carbon price less than $10 (2016 ppp dollars). All these tax systems either exempt fuel sources (India and Mexico) or fossil fuel intensive sectors (Chile and Japan). Ireland and Norway exempt certain EITE activities but cover most of their respective economies with either a carbon tax or the EU ETS. In spite of the EU ETS including sectors not covered under the carbon tax system in both these countries, the effective carbon price is less than $10, as the prevailing allowance price of the EU ETS system is only $6 per ton of CO2e (EEX 2017). Only British Columbia, with an economy-wide carbon price, is closer to the $20 per ton of CO2e recommended by the U.S. Interagency Working Group and William Nordhaus’s recommended $31 per ton carbon price.
Carbon Pricing in Practice: A Review of the Evidence
Center for International Environment and Resource Policy, The Fletcher School, Tufts University 33
5. 5. CA R B O N R E V E N U E M A N AG E M E N T A crucial design consideration for carbon taxation is the allocation of revenue generated from the tax. A carbon tax has the potential to be regressive, with large tax burdens falling onto lower income populations due to consumption patterns (Metcalf and Hassett 2007). Revenue can be allocated in ways that compensate lower-income populations. A revenue-neutral carbon tax or “swap” is one that returns all carbon tax revenues to citizens and/or corporations through reduced income or corporate taxes. A cash-dividend distribution scheme recycles the revenue back to each citizen in the form of equal portioned direct cash transfer. Finally, governments can use revenue to invest in infrastructure, clean energy projects, R&D, climate change adaptation, or any other fiscal priority through earmarking of revenues (Metcalf and Weisbach 2009).
British Columbia, Norway, Ireland, Chile, and Mexico direct their carbon tax revenue to the general budget or earmark it to reduce other income taxes for low-income communities, impacted industries, etc. India, Japan, and a part of Norway’s carbon tax revenues are earmarked towards emissions-reducing activities. Although the carbon tax systems examined in this paper lack the ambition required to achieve a desirable social cost of carbon and consequent emissions reduction, careful directing of revenue from carbon taxes towards other emissions-reducing activities may provide a double dividend by increasing the emissions reductions achieved through the imposition of these taxes.
5. 5. 1 . R E V E N U E N E U T R A L I T YBritish Columbia, with the highest coverage adjusted carbon price of $17 per ton of CO2e (2016 ppp), redirects almost all of its revenue towards the general budget. The BC carbon tax generated about $7.3 billion in revenue between 2008 and 2015, with revenue allocated towards low-income tax credits, reducing the bottom two personal income tax brackets by 5%, issuing direct cash transfers to Northern and rural residents of the region, reducing corporate and small business tax rates, and industrial property tax credits (Komanoff and Gordon 2015). Similar to BC, Ireland and Norway’s carbon tax revenues are directed towards the general budget. Ireland has used its carbon tax revenues primarily to pay off public debt. Norway uses the revenue to reduce income and capital taxes, labor taxes, and provide pension plans for low-income citizens. With carbon tax revenue and revenue from offshore drilling licenses, Norway has financed a special pension fund that contained $373 billion or nearly $80,000 for every Norwegian, at the end of 2007 (Turner 2008; Sumner et al. 2011). Traditionally, revenues from regional EU ETS sectors in Norway went towards green subsidies while the carbon tax revenue went towards the country’s general budget. However, 2013 annual revenue data showed 30% of carbon tax revenue earmarked for green spending and the remaining 70% allocated to the general budget. The government earmarked 30% of the carbon tax revenue primarily to expand the capital base of its “Green Fund for Climate, Renewable Energy and Energy Efficiency Measures.” Currently, the financial returns on this expanded capital base are used to subsidize green projects (Carl and Fedor 2016).
Mexico and Chile also reinvest their carbon tax revenues towards public spending in different ways. Both these countries, however, have not mentioned specific earmarking towards renewable energy investments. In Mexico, the revenue collection agency (SAT, by its Spanish acronym) collects the revenue and directs it to the general funds and does not use it either for green spending or revenue recycling (Muñoz Piña 2015; Carl and Fedor 2016). Additionally, eligible Mexican projects can offset their carbon tax with CER credits through the MexiCO2 carbon exchange market. In Chile, revenues are expected to be reinvested in education and modernizing the nation’s electric grid to bring more renewable energy online (Villarreal 2016).
5. 5. 2 . E A R M A R K I N G R E V E N U E FO R E M I S S I O N R E D U C T I O N SSome countries earmark the carbon tax revenue to achieve a double dividend in emissions reductions. Political acceptance for earmarking revenues instead of alleviating the public burden of the carbon tax appears to be achieved by keeping the tax rate low. Both Japan and India utilize this approach with a lower tax rate and revenues earmarked for low carbon investments. In Japan, the Ministry of Finance (MOF) is tasked with collecting the GW tax towards a dedicated fund for promoting low carbon technologies and energy efficiency. The MOF subsequently disburses money to the Ministry of Environment (MOE) and Ministry of Economy, Trade and Investment (METI) for use in relevant projects (PMR 2017), as illustrated in Table 6.
Carbon Pricing in Practice: A Review of the Evidence
34 Center for International Environment and Resource Policy, The Fletcher School, Tufts University
Since introducing the GW tax, the Japanese government has efficiently used the earmarked funds to address distributional risks associated with the GW tax by offering subsidies to small and medium enterprises (SMEs) and individuals to reduce the simultaneous burden resulting from a tax and Feed in Tariff (FIT) surcharge. In addition, the government spent the earmarked revenue by funding energy saving and end-use energy efficiency programs, indirectly funneling revenue back to SMEs and individual consumers. Finally, the special tax fund has supported RD&D into low carbon technologies, including for the increased efficiency of solar PV, RD&D for offshore wind technology, and energy saving technologies (see Table 6).
Table 6: Sample of investments from the special GW tax fund in 2017
METI projects 2017 Funding Allocations (in million USD)
Subsidies for reducing FIT surcharge 435 (in 2016)
Subsidies for energy saving projects 102.7
R&D for energy saving technologies 86.5
Energy saving manufacturing 8.1
Subsidies for fuel efficient vehicles 126
RD&D for more efficient solar PV 69.3 (in 2016)
RD&D for offshore wind technology 21.6
Source: (METI 2017)
In India, the coal tax revenue is allocated to the National Clean Environment Fund (NCEF) and is earmarked for investments in both clean energy and environmental conservation. Since 2010, the coal tax has raised about $8.4 billion in revenues towards the NCEF (see Table 7) (MOF 2015). The fund is managed by an Inter-Ministerial Group (IMG) that consists of senior government officials representing the ministries of finance, power, coal, fertilizers, petroleum and natural gas, new and renewable energy, and environment and forests (Cottrell et al. 2013).
Table 7: Tax collected and disbursed out of the NCEF fund
Year @ Tax $ per ton (in million USD) Tax collected Financed by NCEF
2010–2011 @ $1 per ton 164 0
2011–2012 @ $1 per ton 397 3.3
2012–2013 @ $1 per ton 471 3.8
2013–2014 @ $1 per ton 535 187
2014–2015 @ $2 per ton 831 322
2015–2016 @ $4 per ton 1947 808
2016–2017 @ $6 per ton 4030 N/A
Total 8389 1392
Source: (MOF 2015)
Individuals and organizations in the public and private sector are allowed to apply for funding for projects that are related to clean fossil energy, renewable/alternative energy, energy infrastructure, or installation of energy-efficient technology (PMR 2017). As per the fund’s requirements, a project must be sponsored by a government department, be self-funded by the recipient individual/organization by at least 40%, and have not received funding from another government agency, in order to be eligible for funding (PMR 2017).
Carbon Pricing in Practice: A Review of the Evidence
Center for International Environment and Resource Policy, The Fletcher School, Tufts University 35
However, the IMG has followed an ad hoc approach to approving various projects under the NCEF (Panda and Jena 2012). In some instances, the IMG approved 100% funding for renewable deployment projects in remote rural areas, exceeding the 40% self-financing requirement (Table 8). As of 2013, half of the projects receiving full funding were deploying mature technologies, and only few projects were conducting research and development into new technologies (Cottrell et al. 2013). Also, with the government changing the fund’s name from “National Clean Energy Fund” to “National Clean Environment Fund” in 2016, $340 million was allocated towards a Ganges river rejuvenation project (see Table 8), further diluting the core mission of promoting clean energy innovation and investments. As of 2016, only 16% of NCEF revenue has been disbursed in India.
Table 8: Sample of energy and environment projects that received funding from NCEF
Projects approved by IMG YearApproved Amount (in million USD/percent of total project cost)
Additional subsidy for solar lantern charging facility and rice husk based gasifier system in remote rural areas
2011 2.06 / 100%
Installation of Solar Thermal Systems in 16 States 2011 9.9 / 36%
Installation of Solar PV systems in 6 states 2011 13.3 / 42%
Green India Mission – National Afforestation 2016 16 / 100%
Ganga River Rejuvenation Plan 2016 348 / 100%
Sources: (MOF 2015); (Panda and Jena 2012)
6. Discussion6.1. CAP-AND-TRADE SYSTEMSFrom the eight ETS designs reviewed in the paper, we identified several design features that enable successful initiation and management of the ETS marketplace. An ETS rolled out with dynamically-adjustable emission caps based on stakeholder feedback and new emissions data (e.g., RGGI, Chinese pilots) has been shown to result in price stability and cost-effective emissions reductions. An ETS rolled out with ambitious coverage and free allowances seems to be initially more politically palatable (with the exception of RGGI), but transitioning to auctioning of allowances over time (e.g., California, Québec, and EU ETS phase III) ensures simultaneous revenue generation.
Getting firms used to reporting data prior to the rollout of an ETS (e.g., Target Management System Pilot in Korea) may help regulators avoid over-allocation for a given ETS period. Similarly, developing scenarios for future projections can also be useful to anticipate different types of events that could affect the system (e.g., the financial crisis affecting the estimates of RGGI and EU ETS emissions).
A price floor/ceiling, or “collar,” creates a more stable market with less price volatility (e.g., Korea and California) and may lower compliance costs in the long run. Restricting banking of allowances or not allowing borrowing between phases (e.g., EU ETS) may lead to a collapse in allowance prices at the end of a commitment period if allowances are over-allocated. The presence of reserve allowances with an independent regulatory body enables the government to intervene quickly in the market if necessary (e.g., Korea’s Allocation Committee, California’s CARB), to manage liquidity and or implement a price collar.
Carbon Pricing in Practice: A Review of the Evidence
36 Center for International Environment and Resource Policy, The Fletcher School, Tufts University
International linkage benefits smaller markets (e.g., Switzerland and Québec) by reducing abatement costs, increasing liquidity, and achieving cost effectiveness. Soft linkages to offset markets without a cap on such offsets can result in excess supply and price collapse (e.g., NZ ETS).
Overall, managing the level of price caps, the percentage of banking and borrowing between phases, the amount of reserve allowances, and the ability to adjust these levers quickly in the market could ensure a predictable marketplace with stable prices and sufficient liquidity. Finally, most countries that have implemented a carbon price have done so in the presence of complementary policies including renewable portfolio standards, fuel efficiency standards, feed-in-tariffs, and investments in innovation. The presence of complementary policies can achieve significant emission reductions but contribute to an overabundance of supply in the ETS market, which places downward pressure on the permit prices (Schmalensee and Stavins 2015).
6.2. CARBON TAX AND HYBRID SYSTEMSFrom the five carbon tax systems (i.e., British Columbia, Mexico, Chile, Japan and India) and two carbon tax–EU ETS hybrid systems (Norway and Ireland) discussed in this paper, we identify some key design features necessary for the efficient operation of a carbon tax program. Low tax rates per ton of CO2 (e.g., Mexico, Chile, and Japan) with no mechanisms to increase the future tax rate will reduce and eventually nullify the price effect of the tax on emission reductions over time. An ambitious or escalating tax rate per ton of CO2 (e.g., British Columbia, Norway) is necessary for substantial emission reductions outcomes, but may not be sufficient if many exemptions are provided and/or the structure of the economy poses inelastic demand for sectors/fuels taxed (e.g., the oil and gas sectors in Norway). In addition, a clear, stable, and steady tax rate increase is necessary to drive deeper emission reductions, as well as to send transparent market signals to private actors that climate policy is a long-term, economy-wide policy. Exempting emission-intensive trade-competitive sectors (e.g., shipping in Norway, natural gas in Mexico, copper extraction in Chile) from carbon taxation undermines the purpose of a carbon tax. Exempting certain sectors may make the introduction of a carbon tax politically feasible, however. In such cases, combining the price effects of carbon taxes with investments through the earmarking of funds in clean energy technologies could result in more progressive emissions reduction, as seen in Japan. Earmarking funds from carbon taxes towards energy efficiency or renewable energy investments are only effective if a sound complementary policy framework for using the earmarked revenue exists (e.g., energy saving investments in Japan, green spending capital in Norway). Failure to define a consistent policy framework and adhere to it will result in carbon tax revenues not being dedicated to investments in either innovation or emissions reductions, even if they are being put towards other social goods (e.g., India’s coal tax).
For systems that impose both a carbon tax and ETS across sectors, it is important to identify whether there is overlap of carbon tax and ETS on the same emissions base (e.g., the electricity and industrial sectors in Norway) and ensure that the overlap does not have distributional consequences or lead to increased, economically-inefficient abatement costs. Finally, taxing upstream at the point of fuel extraction (e.g., India, Norway) or downstream at major emitting entities (e.g., Chile, British Columbia) reduces the complexity of a carbon tax design and enforcement, making it more feasible for LDCs with less well-developed administrative states.
Carbon Pricing in Practice: A Review of the Evidence
Center for International Environment and Resource Policy, The Fletcher School, Tufts University 37
7. Key Policy FindingsCountries are learning from each other — Each new carbon pricing policy implemented somewhere in the world shows evidence of learning from the prior experience of other countries. Korea, for example, made numerous design decisions based on the performance of the EU ETS.
Each national context creates unique opportunities and constraints — No two carbon pricing policies will be exactly the same, but certain design features lend themselves better to particular national circumstances.
Carbon pricing regimes lead to emissions reductions — While emissions reductions achieved from carbon pricing policies have thus far been modest in most cases, there is no instance where emissions increased as a result of carbon pricing.
Administrative and regulatory structures for carbon pricing regimes appear to be robust in every carbon pricing system — Whenever administrative imperfections were identified, they appear to have been eventually rectified.
So far, the price signals to the market from existing carbon pricing policies are modest — (see Figure 1) Because effective carbon prices (either direct through taxes on fuels or indirect through cap-and-trade) are relatively low, they do not appear to be inducing major changes in behavior from firms or consumers. Also, the signal to the market varies substantially because of the differing carbon intensity of the fuels (i.e., a modest carbon tax makes coal much more expensive than natural gas due to the higher carbon intensity of coal compared with gas). Because price ceilings are not being hit in any of the ETS regimes, it appears that either there is a surplus of supply of permits (over-allocation) or compliance costs are lower than anticipated by regulators. Longer-term signals could be sent to the marketplace if policies are put in place that will cause a gradual escalation of the carbon price
Revenue generation from carbon taxes is often being used to meet (non-climate) societal needs — Most of countries employing tax policies use the revenues generated for non-climate purposes, such as general revenue to the treasury (e.g., Mexico, Ireland, Chile), or provision of pension funding to the population (e.g., Norway).
A “double dividend” exclusive to emissions reductions may exist — This could arise in cases where mitigation occurs as a result of the carbon pricing policy, and then revenue from ETS auctions or carbon taxes is, in turn, invested in other emissions-reduction activities. This added emission-reduction benefit occurs even in the case of low prevailing carbon prices (e.g., India’s revenue directed to energy-innovation investments or Japan’s revenue directed to energy efficiency deployments).
Heterogeneity of carbon pricing mechanisms across fuels, industries, or sectors — This may undermine cost effectiveness and make governments susceptible to intense lobbying by special interests (e.g., Mexico and Norway).
The administrative burden for carbon taxes appears to be lower than for ETS — For those countries that ultimately are interested in adopting an ETS, establishing a carbon tax could be a good first step. At a minimum, both cap-and-trade and carbon tax policies would require establishing emissions inventories, reporting, monitoring, and verification procedures and oversight. Chile, Japan, Mexico, and Australia have all expressed a desire to evolve from a carbon tax towards an ETS.
Carbon Pricing in Practice: A Review of the Evidence
38 Center for International Environment and Resource Policy, The Fletcher School, Tufts University
8. ConclusionMore than 100 INDCs submitted before Paris in 2015 included some form of carbon pricing, accounting for roughly 58% of global emissions. Currently, there are approximately 40 national carbon pricing mechanisms, supplemented with more than 20 carbon pricing schemes implemented in cities, states, provinces, and other sub-national jurisdictions, covering approximately 7 gigatons of carbon dioxide equivalent (GTCO2e), roughly 13% of global emissions (World Bank, Ecofys, and Vivid Economics 2016). In addition, China is rolling out a national ETS policy for some sectors in 2017. In October 2016, Canada finalized efforts for a comprehensive plan to implement some kind of carbon pricing in all provinces and regions by 2018. Mexico will launch a new national carbon pricing mechanism in 2018, with a goal of linking emissions reductions with other North American carbon markets (World Bank, Ecofys, and Vivid Economics 2016). All of this activity points to growing international political momentum to achieve global emissions targets through cost-effective pricing mechanisms in the near future.
A large body of empirical evidence already exists about the design and performance of existing carbon pricing policies around the world. In this paper, we have attempted to derive key insights from the practice of existing carbon pricing regimes in order for future carbon pricing programs to learn from prior experience. Key knowledge gaps still exist, however, regarding our understanding of existing cap-and-trade and carbon tax systems.
Two knowledge gaps need to be addressed to better understand the functioning of an ETS market. First, what is the level and nature of management necessary for a well-functioning ETS market? From the five cases discussed in this paper, Korea may serve as a good case study to examine the level of management necessary for a successful ETS market. In spite of Korea’s careful rollout of its ETS with features necessary to avoid price volatility, over-allocation and the ability to intervene in the market, the Korean ETS market suffers from a lack of liquidity and has experienced almost no transactions since its rollout in January 2015. Second, what is the interactive effect of carbon pricing and other complementary non-pricing policies aimed at emissions reductions? The California cap-and-trade system and the EU ETS may serve as good case studies to understand the interactive effect of multiple environmental policies implemented in concert with ETS on overall emissions reductions and cost. In particular, California could serve as a case study to understand the interaction between regulation and market-based mechanisms, and the efforts to stem carbon leakage from neighboring subnational entities that do not have an explicit carbon price. Finally, studying the effect of the recently linked California and Québec ETS and the future linkage of Swiss ETS with the EU ETS would shed light on the pros and cons of linking across national jurisdictions.
A key knowledge gap in carbon tax and carbon tax-ETS hybrid systems is in understanding the emission outcomes and distributional consequences of sectorally differentiated carbon prices (e.g., Norway) versus economy-wide prices (e.g., British Columbia). In this regard, comparing the tax systems of Norway and British Columbia may be useful. Another major knowledge gap is the relationship between the tax rate, allocation of revenue towards green investments or the general budget, and the overall structure of the economy. Improved understanding of this relationship would help determine which percentage of earmarking would lead to efficient emission-reduction outcomes, and this may be done by comparing the carbon tax policies of Japan, India, and Norway.
Carbon Pricing in Practice: A Review of the Evidence
Center for International Environment and Resource Policy, The Fletcher School, Tufts University 39
ReferencesAct 21 Relating to Tax on Discharge of CO2 in the Petroleum Activities on the Continental Shelf, Public Law 72, Act 21 (2008)
Aldy, Joseph E. Long-Term Climate Policy: The Great Carbon Swap. PPI, 2016. Retrieved from http://www.progressivepolicy.org/wp-content/uploads/2016/11/The-Great-Swap-1.pdf
Aldy, Joseph E. “Pricing climate risk mitigation.” Nature Climate Change 5, no. 5 (2015) 396-398. Retrieved from doi:10.1038/nclimate2540.
Aldy, Joseph E. and Robert N. Stavins. “The Promise and Problems of Pricing Carbon: Theory and Experience.” The Journal of Environment & Development 21, no. 2 (2012): 152-180.
Baldassare, Mark, Dean Bonner, David Kordus, and Lunna Lopes. PPIC Statewide Survey: Californians & the Environment. California: Public Policy Institute of California, 2016. Retrieved from http://www.ppic.org/content/pubs/survey/S_716MBS.pdf.
Bel, Germà, and Stephan Joseph. “Emission abatement: Untangling the impacts of the EU ETS and the economic crisis.” Energy Economics 49 (2015): 531-539.
Benavides, Carlos, Luis Gonzales, Manuel Diaz, Rodrigo Fuentes, Gonzalo García, Rodrigo Palma-Behnke, and Catalina Ravizza. “Correction: The Impact of a Carbon Tax on the Chilean Electricity Generation Sector.” Energies 8, no. 6 (2015): 6247-6248.
Benoit, Jean-Yves, and Claude Côté. “Essay by The Québec Government on Its Cap-and-Trade System and the Western Climate Initiative Regional Carbon Market: Origins, Strengths and Advantages.” UCLA J. Envtl. L. & Pol’y 33 (2015): 42.
Bertram, Geoff and Simon Terry. THE CARBON CHALLENGE: Response, Responsibility, and the Emissions Trading Scheme. Wellington, NZ: Sustainability Council of New Zealand, 2008.
Bertram, Geoff and Simon Terry. “The Carbon Challenge.” Bridget Williams Books, 2010.
Bierbower, William. “A Brief History of Fraudulent Activity on the EU-ETS.” 2011. Retrieved from http://blogs.worldwatch.org/revolt/a-brief-history-of-fraudulent-activity-on-the-eu-ets-2/
Borenstein, Severin, James Bushnell, Frank A. Wolak, and Matthew Zaragoza-Watkins. Report of the Market Simulation Group on Competitive supply/demand Balance in the California Allowance Market and the Potential for Market Manipulation. Energy Institute at Haas, 2014.
Borregaard, Nicola. Carbon Tax Developments in Chile. Cologne, Germany: Sustainable Development Division Ministry of Energy, 2014. Retrieved from https://www.thepmr.org/system/files/documents/Carbon%20Tax%20Developments%20in%20Chile.pdf.
Bowen, Alex. Carbon Pricing: How Best to use the Revenue?. Grantham Research Institute and Global Green Growth Institute, 2015.
BP Global. “Oil and gas majors call for carbon pricing.” (2015) Retrieved from: http://www.bp.com/en/global/corporate/press/press-releases/oil-and-gas-majors-call-for-carbon-pricing.html
Bragadóttir, Hrafnhildur, Roland Magnusson, S. Seppänen, David Sundén, and Emilie Yliheljo. Sectoral Expansion of the EU ETS—A Nordic perspective on barriers and solutions to include new sectors in the EU ETS with special focus on road transport. Nordic Council of Ministers Report TemaNord, 2015.
Brown, Lucas Merrill, Alex Hanafi, and Annie Petsonk. The EU Emissions Trading System: Results and Lessons Learned. Environmental Defense Fund, 2012.
Bullock, David. “Emissions Trading in New Zealand: Development, Challenges and Design.” Environmental Politics 21, no. 4 (2012): 657-675.
Carbon Pricing in Practice: A Review of the Evidence
40 Center for International Environment and Resource Policy, The Fletcher School, Tufts University
Bye, Torstein., and Bruvoll, Annegrete. Taxing energy – why and how? The present policies across western countries. Oslo: Statistics Norway, Official Norwegian Report NOU, 2015. Retrieved from https://www.ssb.no/a/english/publikasjoner/pdf/rapp_200828_en/rapp_200828_en.pdf.
C2ES. Climate Change 101: Cap and Trade. Washington DC: Center for Climate and Energy Solutions (C2ES), Pew Center on Global Climate Change, and the Pew Center on the States, 2011.
Camuzeaux, Jonathan. “Cap and Trade under AB 32 - Now it’s an Official Success.” Retrieved from http://blogs.edf.org/climatetalks/2015/11/05/cap-and-trade-under-ab-32-now-its-an-official-success/.
CARB. Proposed Regulation to Implement the California Cap-and-Trade Program. Sacramento, CA: California Air Resources Board (CARB), 2010.
CARB. Proposed Amendments to the California Cap on Greenhouse Gas Emissions and Market-Based Compliance Mechanisms to Allow for the use of Compliance Instruments Issued by Linked Jurisdictions. Sacramento, CA: California Air Resources Board (CARB), 2012.
CARB. “California 1990 greenhouse gas emissions level and 2020 limit.” June, 2017. Available at https://www.arb.ca.gov/cc/inventory/1990level/1990level.htm.
Carbon Pricing Leadership Coalition. (2016). Retrieved from https://www.carbonpricingleadership.org/leadership-coalition
Carbon Tax Act, Public Law 40, Sbc (2008). Retrieved from http://www.bclaws.ca/civix/document/id/consol22/consol22/00_08040_01.
Carl, Jeremy, and David Fedor. “Tracking global carbon revenues: A survey of carbon taxes versus cap-and-trade in the real world.” Energy Policy 96 (2016): 50-77. Retrieved from http://doi.org/10.1016/j.enpol.2016.05.023
Carroll, John. “Exxon’s New Chief Endorses Carbon Tax to Combat Climate Change” Bloomberg, (February 23, 2017). Retrieved from https://www.bloomberg.com/news/articles/2017-02-23/exxon-s-new-chief-endorses-carbon-tax-to-combat-climate-change
CCI. Annual Report to the Legislature on California Climate Investments using Cap-and-Trade Auction Proceeds. California: California Climate Investments (CCI), 2017.
CDC, EDF, and IETA. Québec: An Emissions Trading Case Study. CDC Climat Research, Environmental Defense Fund (EDF), and IETA, 2015a.
CDC, EDF, and IETA. Switzerland: An Emissions Trading Case Study. CDC Climat Research, Environmental Defense Fund (EDF) and IETA, 2015b.
CDC, EDF, and IETA. Regional Greenhouse Gas Initiative (RGGI): An Emissions Trading Case Study. CDC Climat Research, Environmental Defense Fund (EDF) and IETA, 2015c.
CDC, EDF, and IETA. Mexico: An Emissions Trading Case Study. CDC Climat Research, Environmental Defense Fund (EDF) and IETA, 2015d.
CEC. “California Energy Commission (CEC): Total System Electric Generation.” California Energy Commission, 2017. Available at http://www.energy.ca.gov/almanac/electricity_data/total_system_power.html.
Climate Leadership Council. The Conservative Case for Carbon dividends. CLC working paper, 2017. Retrieved from https://www.clcouncil.org/wp-content/uploads/2017/02/TheConservativeCaseforCarbonDividends.pdf.
Climate Policy Initiative. “California Carbon Dashboard.” Climate Policy Initiative, 2017. Available at http://calcarbondash.org.
Comisión Económica para América Latina y el Caribe (CEPAL). Evaluaciones del desempeño ambiental: Chile. Santiago, Chile: OECD-UN, 2016. Retrieved from http://repositorio.cepal.org/handle/11362/40308.
Carbon Pricing in Practice: A Review of the Evidence
Center for International Environment and Resource Policy, The Fletcher School, Tufts University 41
Convery, Frank J., Louise Dunne and Deirdre Joyce. “Ireland’s Carbon Tax and the Fiscal Crisis: Issues in Fiscal Adjustment, Environmental Effectiveness, Competitiveness, Leakage and Equity Implications.” OECD Environment Working Papers, No. 59, (2013), OECD Publishing, Paris. http://dx.doi.org/10.1787/5k3z11j3w0bw-en
Cottrell, Jacqueline, Richard Bridle, Zhao Yongqiang, Shi Jingli, Xie Xuxuan, Christopher Beaton, Aaron Leopold, Eike Meyer, Shruti Sharma, and Han Cheng. “Green Revenues for Green Energy: Environmental fiscal reform for renewable.” International Institute for Sustainable Development. (2013). Retrieved from http://www.iisd.org/library/green-revenues-green-energy-environmental-fiscal-reform-renewable-energy-technology
Cullenward, Danny and David Weiskopf. “Resource Shuffling and the California Carbon Market.” Environmental & Natural Resources Law & Policy Program, Stanford Law School, 2013.
Cullenward, Danny. “How California’s Carbon Market Actually Works.” Bulletin of the Atomic Scientists 70, no. 5 (2014): 35-44.
Diamant, A. Exploring the Interaction Between California’s Greenhouse Gas Emissions Cap-and-Trade Program and Complementary Emissions Reduction Policies. Electric Power Research Institute, 2013. Retrieved from https://ieta.wildapricot.org/resources/EU/Overlapping_Policies_Drafting_Group/epri_complementary_mech_report_highlighted.pdf
Diaz-Rainey, Ivan and D. Tulloch. New Zealand’s Emission Trading Scheme: A Financial Perspective. Accountancy and Finance Departmental Seminar Series, 2015.
Dong, Jun, Yu Ma, and Hongxing Sun. “From Pilot to the National Emissions Trading Scheme in China: International Practice and Domestic Experiences.” Sustainability 8, no. 6 (2016): 522.
Duan, Maosheng, Tao Pang, and Xiliang Zhang. “Review of Carbon Emissions Trading Pilots in China.” Energy & Environment 25, no. 3-4 (2014): 527-549.
Edenhofer, Ottmar, Michael Jakob, Felix Creutzig, Christian Flachsland, Sabine Fuss, Martin Kowarsch, Kai Lessmann, Linus Mattauch, Jan Siegmeier, and Jan Christoph Steckel. “Closing the Emission Price Gap.” Global Environmental Change 31, (2015): 132-143.
EDF, CRIK, and IETA. South Korea: An Emissions Trading Case Study. Environmental Defense Fund (EDF), Climate Change Research Institute of Korea (CRIK), and IETA, 2016.
EDF, MOTU, and IETA. New Zealand: An Emissions Trading Case Study. Environmental Defense Fund (EDF), MOTU Economic and Public Policy Research, and IETA, 2014.
EIA. “Energy Information Administration (EIA): State Carbon Dioxide Emissions.” November 2016. Available at https://www.eia.gov/environment/emissions/state/.
Environmental Quality Act, Public Law chapter Q-2, (2017)
Ireland EPA. Ireland’s Greenhouse Gas Emission Projections, 2016-2035. Environmental Protection Agency (EPA) of Ireland, 2017.
European Commission. Guidance on Allocation Methodologies. Brussels: European Commission, 2011.
European Commission. The EU Emissions Trading System (EU ETS). Luxembourg: The Publications Office of the European Union, 2016. Retrieved from https://ec.europa.eu/clima/sites/clima/files/factsheet_ets_en.pdf
European Commission. Report from the Commission to the European Parliament and the Council: Report on the Functioning of the European Carbon Market. Luxembourg: The Publications Office of the European Union, 2017.
European Court of Auditors. The Integrity and Implementation of the EU ETS. Luxembourg: Publications Office of the European Union, 2015.
Carbon Pricing in Practice: A Review of the Evidence
42 Center for International Environment and Resource Policy, The Fletcher School, Tufts University
European Energy Exchange. “Emissions Secondary Market.” Retrieved from https://www.eex.com/en/products/environmental-markets/emissions-secondary-market.
Farrell, Niall. “What factors drive inequalities in carbon tax incidence? Decomposing socioeconomic inequalities in carbon tax incidence in Ireland.” Ecological Economics 142 (2017): 31-45.
Finance Act of 2010, Clean Energy Cess Rules, (2010): 83.
Flannery, Brian. Carbon Taxes, Trade, and Border Tax Adjustments. Resources for the Future Policy Brief, 2016. Retrieved from http://www.rff.org/research/publications/carbon-taxes-trade-and-border-tax-adjustments.
FOEN. “Federal Office for the Environment FOEN: Linking the Swiss and EU Emissions Trading Schemes.” Retrieved from https://www.bafu.admin.ch/bafu/en/home/topics/climate/info-specialists/climate-policy/emissions-trading/linking-the-swiss-and-eu-emissions-trading-schemes.html.
FOEN. Evaluation of Incentive Effect of Emissions Trading Scheme. Bern, Switzerland: Federal Office for the Environment FOEN, 2016b.
Frunza, Marius-Christian. Fraud and Carbon Markets: The Carbon Connection. Vol. 5. Abingdon, U.K.: Routledge, 2013.
Ghosh, Joydeep. Analysis of India’s Coal Cess using an Economy-Wide Framework. Jeju International Convention Center, Republic of Korea: Green Growth Knowledge Platform (GGKP), 2016.
Gobierno de Chile. “Ley 20899. Articulo 8.” Biblioteca del Congreso Nacional de Chile. (2014). Retrieved from https://www.leychile.cl/Navegar?idNorma=1087342&idParte=9674359&idVersion=2016-02-08
Government of British Columbia. “British Columbia’s Revenue-Neutral Carbon Tax.” Government of British Columbia, 2016. Retrieved from http://www2.gov.bc.ca/gov/content/environment/climate-change/planning-and-action/carbon-tax.
Government of Canada. Canada’s Second Biennial Report on Climate Change. Gatineau QC: Environment and Climate Change Canada, 2016.
Government of Québec. Québec’s Cap-and-Trade System for Greenhouse Gas Emission Allowance. Gatineau QC: Gouvernement du Québec, 2015.
Gyana Ranjan Panda, Narendra Jena. “Evaluating the Performance of the National Clean Energy Fund” Economic & Political Weekly. (September 15, 2012) vol xlviI no 37. Retrieved from http://www.cbgaindia.org/wp-content/uploads/2016/04/Evaluating-the-Performance-of-the-National-Clean-Energy-Fund.pdf.
Haites, Erik. “Experience with linking greenhouse gas emissions trading systems.” Wiley Interdisciplinary Reviews: Energy and Environment 5, no. 3 (2016): 246-260.
Hawkins, Sonja, and Ingrid Jegou. “Linking Emissions Trading Schemes. Considerations and Recommendations for a Joint EU-Korean Carbon Market.” ICTSD Global Platform on Climate Change, Trade and Sustainable Energy (2014).
Hibbard, Paul J., Andrea M. Okie, Susan F. Tierney, and Pavel G. Darling. The Economic Impacts of the Regional Greenhouse Gas Initiative on Nine Northeast and Mid-Atlantic States. Boston, MA: Analysis Group, 2015.
Hu, Jing, Wina Crijns-Graus, Long Lam, and Alyssa Gilbert. “Ex-ante evaluation of EU ETS during 2013–2030: EU-internal abatement.” Energy Policy 77 (2015): 152-163.
IEPS Law. “Ley del Impuesto Especial sobre Producción y Servicios, Artículo 2: Tasas del Impuesto. Efectivas a partir del 1° de enero, 2015.” (2015) Retrieved from http://www.aduanas-mexico.com.mx/claa/ctar/leyes/lieps.html#art2
Intercontinental Exchange. “EUA UK Auctions.” 2017. Retrieved from https://www.theice.com/marketdata/reports/148%20(UK);%20https://www.eex.com/en/products/environmental-markets/emissions-secondary-market%20(EU).
International Monetary Fund (IMF). Mexico-Selected Issues. International Monetary Fund Country Report No. 15/314, 2015. Retrieved from http://www.imf.org/external/pubs/ft/scr/2015/cr15314.pdf
IPCC. “Climate Change Synthesis Report. Contribution of Working Groups I, II and III to the Fifth Assessment Report of the Intergovernmental Panel on Climate Change.” [Core Writing Team, R.K. Pachauri and L.A. Meyer (eds.)]. IPCC, Geneva, Switzerland, 151 pp. (2015).
Irish Finance Act of 2010, Public Law 5, (2010)
Jones, Brian M., Christopher V. Atten, and Kaley Bangston. A Pioneering Approach to Carbon Markets: How the Northeast States Redefined Cap and Trade for the Benefit of Consumers. Concord, MA: MJ Bradley & Associates, 2017.
Kim, Myung-Soo. “A Study on the Impact Analysis of Introducing Emission Trading System on CBP Market and Policy Implications.” The Transactions of the Korean Institute of Electrical Engineers 64, no. 5 (2015): 667-679.
Komanoff, Charles, and Matthew Gordon. “British Columbia’s Carbon Tax: By the Numbers.” Carbon Tax Center. (2015). Retrieved from http://www.carbontax.org/wp-content/uploads/CTC_British_Columbia’s_Carbon_Tax_By_The_Numbers.pdf%5Cnpapers3://publication/uuid/100DABE2-03B1-47F6-8F80-FD7619B1C4F9.
Kuramochi, Takeshi. “Review of energy and climate policy developments in Japan before and after Fukushima.” Renewable and Sustainable Energy Reviews 43 (2015): 1320-1332. Retrieved from http://doi.org/10.1016/j.rser.2014.12.001.
Leining, Catherine, and Suzi Kerr. Lessons Learned from the New Zealand Emissions Trading Scheme. Wellington, NZ: Motu Economic and Public Policy Research, 2016.
Lin, Boqiang, and Xuehui Li. “The effect of carbon tax on per capita CO2 emissions.” Energy Policy 39, no. 9 (2011): 5137-5146. Retrieved from http://doi.org/10.1016/j.enpol.2011.05.050.
López, Ramon, Accorsi, Simon. and Sturla, Gino. Análisis sectorial de la huella de carbono para la economía chilena: un enfoque basado en la matriz insumo-producto. Santiago: Universidad de Chile, 2016. Retrieved from http://repositorio.uchile.cl/handle/2250/141357
Carbon Pricing in Practice: A Review of the Evidence
44 Center for International Environment and Resource Policy, The Fletcher School, Tufts University
Mankiw, N. Gregory. “Smart taxes: An open invitation to join the pigou club.” Eastern Economic Journal 35, no. 1 (2009): 14-23.
Meadows, Damien. Update on the EU ETS and EU Climate Policy. European Commission, 2017.
Metcalf, Gillbert E., and David Weisbach. “The design of a carbon tax.” Harv. Envtl. L. Rev. 33 (2009): 499.
Metcalf, Gilbert E., and David Weisbach. “Linking policies when tastes differ: Global climate policy in a heterogeneous world.” Review of Environmental Economics and Policy 6, no. 1 (2011): 110-129.
Metcalf, Gilbert and Kevin Hassett. “The Incidence of a U.S. Carbon Tax: A Lifetime and Regional Analysis.” National Bureau of Economic Research Working Paper 13554. (October 2007). Retrieved from http://www.nber.org/papers/w13554.pdf.
Metcalf, Gilbert. A conceptual framework for measuring the effectiveness of green fiscal reforms. Presentation prepared for the Green Growth Knowledge Platform Third Annual Conference on Fiscal Policies and the Green Economy Transition: Generating Knowledge – Creating Impact, 2015. Retrieved from http://www.greengrowthknowledge.org/sites/default/files/Metcalf_A_Conceptual_Framework_for_Measuring_the_Effectiveness_of_Green_Fiscal.pdf
METI. GW Tax Special Fund (in Japanese). Ministry of Economy, Trade and Industry (METI), 2017.
Mexican Government. “Qué es y por qué beneficia a México el Mercado de Carbono?” (2016). Retrieved from https://www.gob.mx/gobmx/articulos/que-es-y-porque-beneficia-a-mexico-el-mercado-de-carbono.
Ministry for the Environment. The New Zealand Emissions Trading Scheme Evaluation 2016. Wellington, NZ: Ministry for the Environment, 2016a.
Ministry for the Environment. Phase Out of the One-for-Two Transitional Measure from the New Zealand Emissions Trading Scheme. Wellington, NZ: Ministry for the Environment, 2016b.
Ministry of Finance (MOF). National Clean Energy Fund (NCEF). Ministry of Finance, India, 2015. Retrieved from http://www.finmin.nic.in/the_ministry/dept_expenditure/plan_finance2/Latest_NCEF_Brief.pdf.
Ministry of the Environment (MOE). Details on the carbon tax (Tax for measures to cope with global warming. Environment and Economy Division, Ministry of the Environment, Japan, 2012. Retrieved from http://www.env.go.jp/en/policy/tax/env-tax/20121001a_dct.pdf.
Ministry of the Environment (MOE). Greening of Whole Tax System and Carbon Tax in Japan. Environment and Economy Division, Ministry of the Environment, Japan, 2017. Retrieved from https://www.env.go.jp/en/policy/tax/20170130_greening.pdf.
Munnings, Clayton, Richard D. Morgenstern, Zhongmin Wang, and Xu Liu. “Assessing the design of three carbon trading pilot programs in China.” Energy Policy 96 (2016): 688-699.
Muñoz, Piña. Fossil Fuel Subsidy Reform in Mexico. Mexico Finance Ministry Presentation, 2015. Retrieved from http://www.ewg.apec.org/documents/Session_2_Munoz.pdf
Murray, Brian C., and Peter T. Maniloff. “Why have greenhouse emissions in RGGI states declined? An econometric attribution to economic, energy market, and policy factors.” Energy Economics 51 (2015): 581 589.
Murray, Brian, and Nicholas Rivers. “British Columbia’s Revenue-Neutral Carbon Tax: A Review of the Latest ‘Grand Experiment’ in Environmental Policy.” Energy Policy 86 (2015): 674–683. Retrieved from doi:10.1016/j.enpol.2015.08.011.
Nordhaus, William D. “Revisiting the social cost of carbon.” Proceedings of the National Academy of Sciences (2017): 201609244.
Nordhaus, William. “Critical assumptions in the stern review on climate change.” Science, 317(5835), (2007). 201-202. Retrieved from http://science.sciencemag.org/content/317/5835/201
Carbon Pricing in Practice: A Review of the Evidence
Center for International Environment and Resource Policy, The Fletcher School, Tufts University 45
OECD. Environmentally related taxes – Norway. Paris: OECD Publishing, 2015. Retrieved from http://www.oecd.org/env/tools-evaluation/environmental-taxes.htm.
OECD. Mexican fiscal reform environmental taxes; Carbon tax and the Tax on Pesticides. OECD Presentation, 2014. Retrieved from https://www.oecd.org/tax/tax-global/Session%203%20-%20LUNA.pdf
Oh, Hyungna, Junwon Hyon, and Jin-Oh Kim. “Korea’s approach to overcoming difficulties in adopting the emission trading scheme.” Climate Policy (2016): 1-11.
Pahuja, Neha., Nimisha Pandey, Koyel Mandal, and Chayan Bandyopadhyay. “GHG Mitigation in India: An overview of the current policy landscape.” World Resource Institute (WRI) Working Paper. (March 2015). Retrieved from http://www.wri.org/sites/default/files/wri_workingpaper_india_final.
Pang, Tao, and Maosheng Duan. “Cap setting and allowance allocation in China’s emissions trading pilot programmes: special issues and innovative solutions.” Climate Policy 16, no. 7 (2016): 815-835.
Park, Hojeong, and Won Kyung Hong. “Korea’s emission trading scheme and policy design issues to achieve market-efficiency and abatement targets.” Energy Policy 75 (2014): 73-83.
Partnership for Market Readiness (PMR). Carbon Tax Guide: A Handbook for Policy Makers. Washington, DC: World Bank, 2017.
Pindyck, Robert S. “Pricing carbon when we don’t know the right price.” Regulation 36, no. 2 (2013): 43.
PMR and ICAP. Emissions Trading in Practice: A Handbook on Design and Implementation. Washington, DC: Partnership on Market Readiness (PMR), International Carbon Action Partnership (ICAP), and World Bank, 2016.
Pollitt, Hector, Seung-Joon Park, Soocheol Lee, and Kazuhiro Ueta. “An economic and environmental assessment of future electricity generation mixes in Japan–an assessment using the E3MG macro-econometric model.” Energy Policy 67 (2014): 243-254. Retrieved from http://doi.org/10.1016/j.enpol.2013.12.018
PRNewswire. “Cement Industry Welcomes B.C. Government Action on Carbon Tax.” Cement Association of Canada. (Feb. 17, 2015). Retrieved from http://www.prnewswire.com/news-releases/cement-industry-welcomes-bc-government-action-on-carbon-tax-292298261.html.
Purdon, Mark, David Houle, and Erick Lachapelle. “The Political Economy of California and Quebec’s Cap-and-Trade Systems.” Sustainable Prosperity, Ottawa, (2014).
Rahim, Saqib. “Time for a RGGI Makeover?” E&E News, June 28, 2017, Climatewire. Retrieved from https://www.eenews.net/climatewire/stories/1060056710/search?keyword=RGGI.
Ramseur, Jonathan L. The Regional Greenhouse Gas Initiative: Lessons Learned and Issues for Congress. Washington DC: Congressional Research Service, 2017.
Ranson, Matthew, and Robert N. Stavins. “Linkage of greenhouse gas emissions trading systems: Learning from experience.” Climate Policy 16, no. 3 (2016): 284-300.
RGGI Inc. Relative Effects of various Factors on RGGI Electricity Sector CO2 Emissions: 2009 Compared to 2005. New York: New York Energy Research and Development Authority, 2010.
RGGI. “Transaction Price Report.” 2017. Retrieved from https://rggi-coats.org/eats/rggi/index.cfm?fuseaction=reportsv2.price_rpt&clearfuseattribs=true.
Rutherford, Angelica P. “Linking Emissions Trading Schemes: Lessons from the EU-Swiss ETSs.” Cclr (2014): 282.
Schmalensee, Richard, and Robert Stavins. “Lessons learned from three decades of experience with cap-and-trade.” No. w21742. National Bureau of Economic Research, 2015.
Carbon Pricing in Practice: A Review of the Evidence
46 Center for International Environment and Resource Policy, The Fletcher School, Tufts University
Song, Tae-Ho, Kyoung-Min Lim, and Seung-Hoon Yoo. “Estimating the public’s value of implementing the CO2 emissions trading scheme in Korea.” Energy Policy 83 (2015): 82-86.
Statistics Norway. “Nature and the Environment.” Statistics Norway. Retrieved from http://www.ssb.no/en/natur-og-miljo.
Stern, Nicolas. “The Economics of Climate Change: The Stern Review.” Cambridge, UK: Cambridge University Press. (2007). Retrieved from http://catdir.loc.gov/catdir/toc/fy0713/2007275608.html
Sumner, Jenny, Lori Bird, and Hillary Dobos. “Carbon taxes: a review of experience and policy design considerations.” Climate Policy 11, no. 2. (2011) 922-943.
Swartz, Jeff. China’s National Emissions Trading System: Implications for Carbon Markets and Trade. Geneva: International Center for Trade and Sustainable Development, 2016.
Szabo, Mike. “Chile considering eventual shift to ETS as it readies carbon tax.” Carbon Pulse. (May 27, 2015). Retrieved from http://carbon-pulse.com/4463/
The Federal Council. “Negotiations on Linking of EU and Swiss Emissions Trading Schemes Concluded.” 2016. Retrieved from https://www.admin.ch/gov/en/start/documentation/media-releases.msg-id-60425.html.
Turner, Chris. “The carbon cleansers.” Canadian Geographic. (2008). Retrieved from http://www.canadiangeographic.ca/magazine/oct08/feature_norway_carbon_tax.asp
Villareal, Jorge. “To Stop Climate Change, Don’t Just Cut Carbon. Redistribute Wealth.” Foreign Policy in Focus. (August 9, 2016). Retrieved from http://fpif.org/stop-climate-change-dont-just-cut-carbon-redistribute-wealth/.
Wölfl, Anita and Patrizio Sicari. “Reducing Greenhouse Gas Emissions in a Cost-Effective Way in Switzerland.” OECD Economic Department Working Papers no. 1002 (2012).
World Bank. What are the Options for using Carbon Pricing Revenues?. Washington DC: World Bank, 2016.
World Bank. “73 Countries and More Than 1,000 Companies and Investors Support a Price on Carbon.” (2014, September 22). Retrieved from http://www.worldbank.org/en/news/press-release/2014/09/22/73-countries-1000-companies-investors-support-price-carbon
World Bank, Ecofys, and Vivid Economics. State and Trends of Carbon Pricing 2016. Washington, DC: World Bank, 2016.
Xiong, Ling, Bo Shen, Shaozhou Qi, Lynn Price, and Bin Ye. “The allowance mechanism of China’s carbon trading pilots: A comparative analysis with schemes in EU and California.” Applied Energy 185 (2017): 1849-1859.
Yang, Lin, Fengyu Li, and Xian Zhang. “Chinese companies’ awareness and perceptions of the Emissions Trading Scheme (ETS): Evidence from a national survey in China.” Energy Policy 98 (2016): 254-265.
Ye, Bin, Jingjing Jiang, Lixin Miao, Ji Li, and Yang Peng. “Innovative carbon allowance allocation policy for the Shenzhen emission trading scheme in China.” Sustainability 8, no. 1 (2015): 3.
Yu, Xiang, and Alex Y. Lo. “Carbon finance and the carbon market in China.” Nature Climate Change 5, no. 1 (2015): 15-16.
Zhang, Bing, Hui Zhang, Beibei Liu, and Jun Bi. “Policy interactions and underperforming emission trading markets in China.” Environmental Science & Technology 47, no. 13 (2013): 7077-7084.
Zhang, Da, Valerie J. Karplus, Cyril Cassisa, and Xiliang Zhang. “Emissions trading in China: Progress and prospects.” Energy Policy 75 (2014): 9-16.
Zhang, ZhongXiang. “Carbon emissions trading in China: the evolution from pilots to a nationwide scheme.” Climate Policy 15, no. sup1 (2015): S104-S126.
Carbon Pricing in Practice: A Review of the Evidence
Center for International Environment and Resource Policy, The Fletcher School, Tufts University 47
Carbon Pricing in Practice: A Review of the Evidence
48 Center for International Environment and Resource Policy, The Fletcher School, Tufts University
The Climate Policy Lab (CPL)
Center for International Environment and Resource Policy (CIERP)
The Fletcher School Tufts University Cabot Intercultural Center, Suite 509 160 Packard Avenue Medford, MA 02155
sites.tufts.edu/cierp/
The Fletcher School at Tufts University was established in 1933 as the first graduate school of international affairs in the United States. The primary aim of The Fletcher School is to offer a broad program of professional education in international relations to a select group of graduate students committed to maintaining the stability and prosperity of a complex, challenging, and increasingly global society.
The Center for International Environment and Resource Policy (CIERP) was established in 1992 to support the growing demand for international environmental leaders. The Center provides an interdisciplinary approach to educate graduate students at The Fletcher School. The program integrates emerging science, engineering, and business concepts with more traditional subjects such as economics, international law and policy, negotiation, diplomacy, resource management, and governance systems.
The Climate Policy Lab (CPL) convenes teams of scholars and practitioners to evaluate existing climate policies empirically and works with governments contemplating new climate policies. The main questions the Lab seeks to answer are: Which climate policies work in practice? Which don’t work? Why? Under what conditions would they work elsewhere? The scope of the Lab is global while remaining highly attuned to state, national, and bi-lateral policy processes. It has a particular emphasis on international comparative policy analysis.