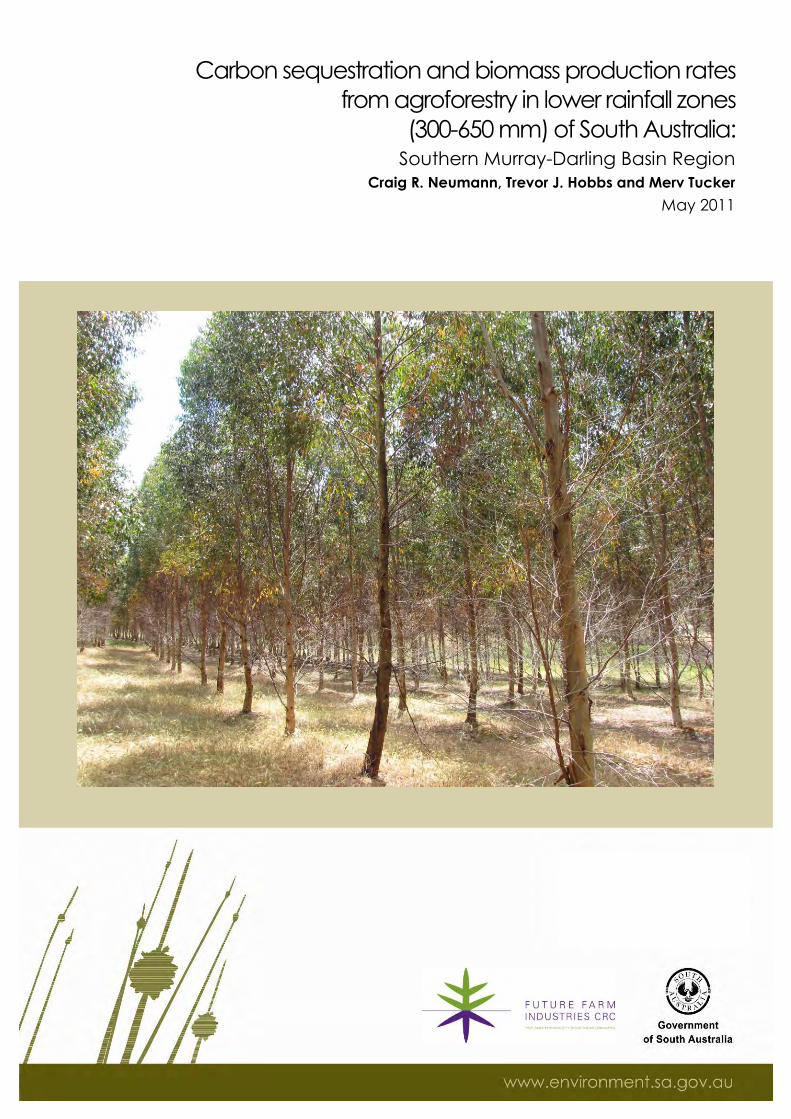
Carbon sequestration and biomass production rates from agroforestry in lower rainfall zones (300-650 mm) of South Australia: Southern Murray-Darling Basin Region Craig R. Neumann, Trevor J. Hobbs and Merv Tucker May 2011
Transcript
Carbon sequestration and biomass production rates
from agroforestry in lower rainfall zones
(300-650 mm) of South Australia: Southern Murray-Darling Basin Region
Craig R. Neumann, Trevor J. Hobbs and Merv Tucker
May 2011
For further information please contact:
Department of Environment and Natural Resources
Phone Information Line (08) 8204 1910, or
see SA White Pages for your local
Department of Environment and Natural Resources office.
Online information available at: http://www.environment.sa.gov.au
Productivity and Carbon Sequestration 14 Assessment of Plantation Productivity 14 Observed Carbon Sequestration Rates 14
Discussion 21 Carbon Markets, Drivers and Policies 21 Carbon Accounting, Models and Assessments 21 Conclusions and Recommendations 22
Glossary 24 References 25
Carbon sequestration and biomass production rates from agroforestry - Southern Murray-Darling Basin Region
Page iv
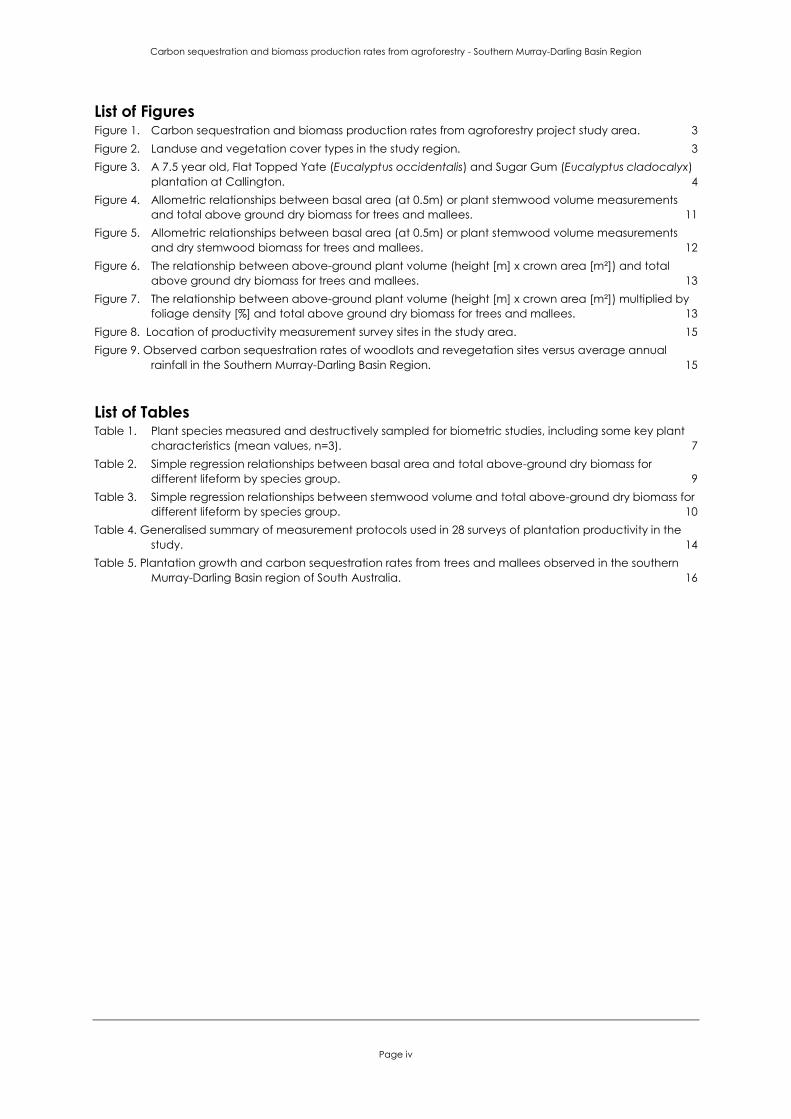
List of Figures Figure 1. Carbon sequestration and biomass production rates from agroforestry project study area. 3 Figure 2. Landuse and vegetation cover types in the study region. 3 Figure 3. A 7.5 year old, Flat Topped Yate (Eucalyptus occidentalis) and Sugar Gum (Eucalyptus cladocalyx)
plantation at Callington. 4 Figure 4. Allometric relationships between basal area (at 0.5m) or plant stemwood volume measurements
and total above ground dry biomass for trees and mallees. 11 Figure 5. Allometric relationships between basal area (at 0.5m) or plant stemwood volume measurements
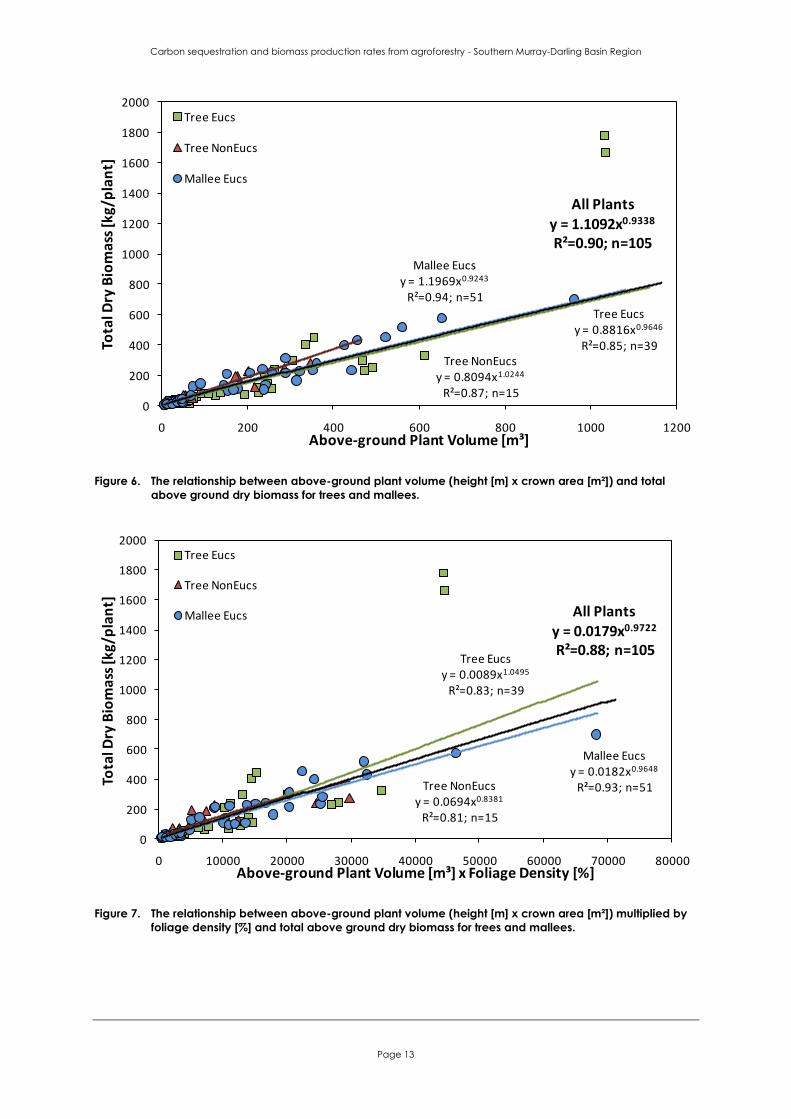
and dry stemwood biomass for trees and mallees. 12 Figure 6. The relationship between above-ground plant volume (height [m] x crown area [m²]) and total
above ground dry biomass for trees and mallees. 13 Figure 7. The relationship between above-ground plant volume (height [m] x crown area [m²]) multiplied by
foliage density [%] and total above ground dry biomass for trees and mallees. 13 Figure 8. Location of productivity measurement survey sites in the study area. 15 Figure 9. Observed carbon sequestration rates of woodlots and revegetation sites versus average annual
rainfall in the Southern Murray-Darling Basin Region. 15
List of Tables Table 1. Plant species measured and destructively sampled for biometric studies, including some key plant
characteristics (mean values, n=3). 7 Table 2. Simple regression relationships between basal area and total above-ground dry biomass for
different lifeform by species group. 9 Table 3. Simple regression relationships between stemwood volume and total above-ground dry biomass for
different lifeform by species group. 10 Table 4. Generalised summary of measurement protocols used in 28 surveys of plantation productivity in the
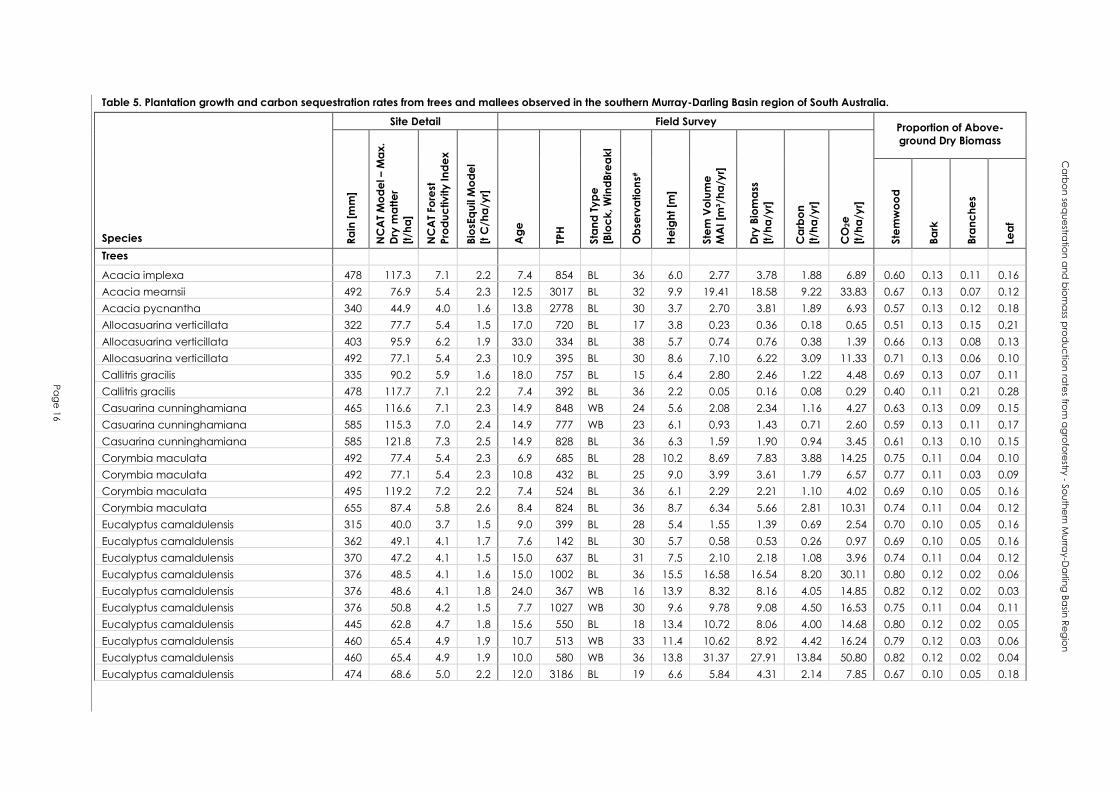
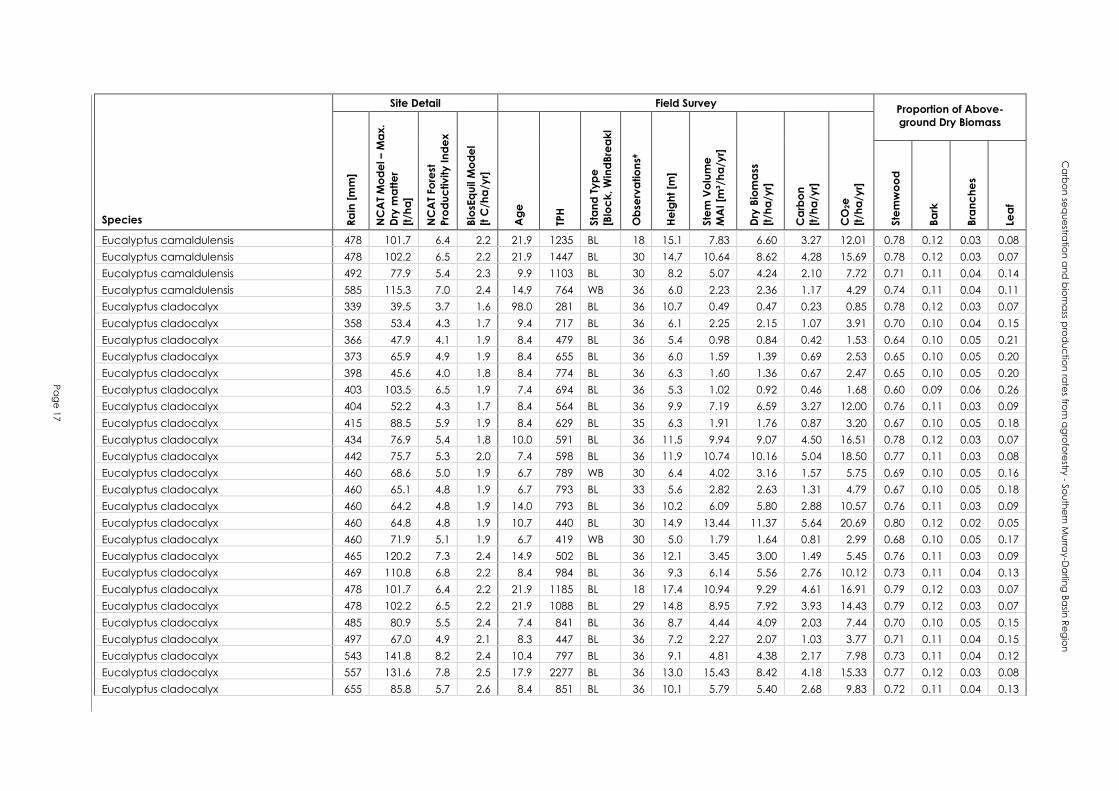
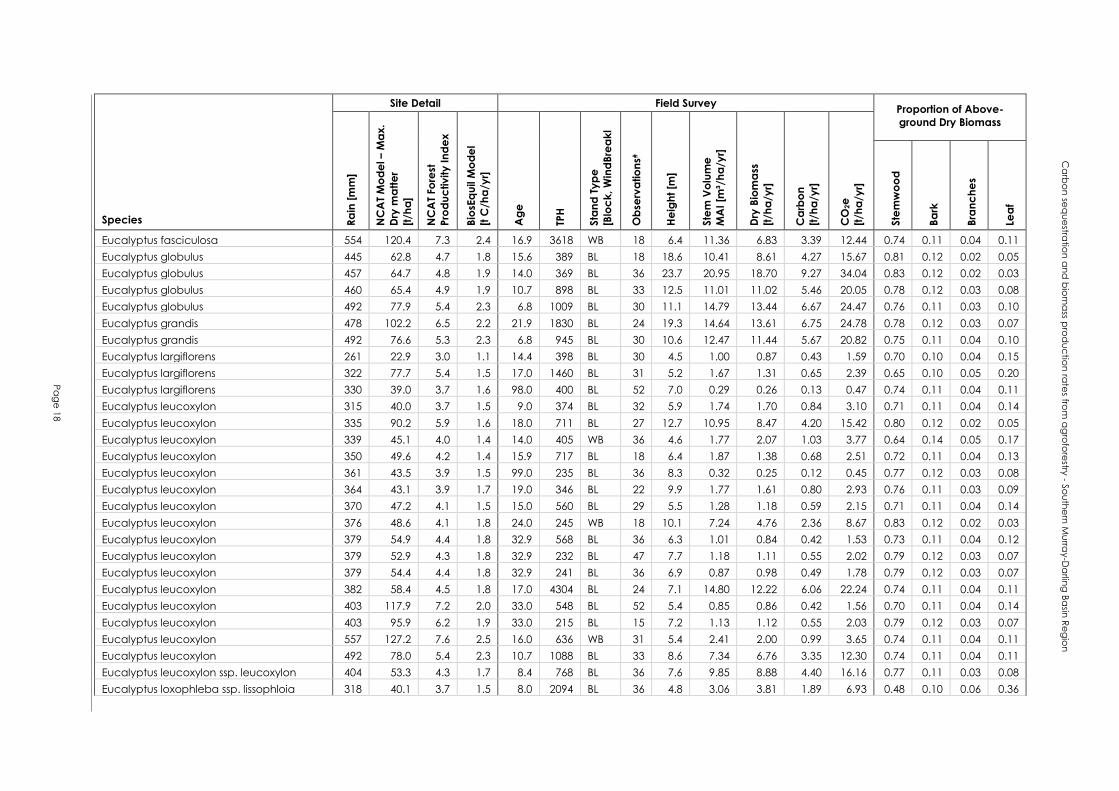
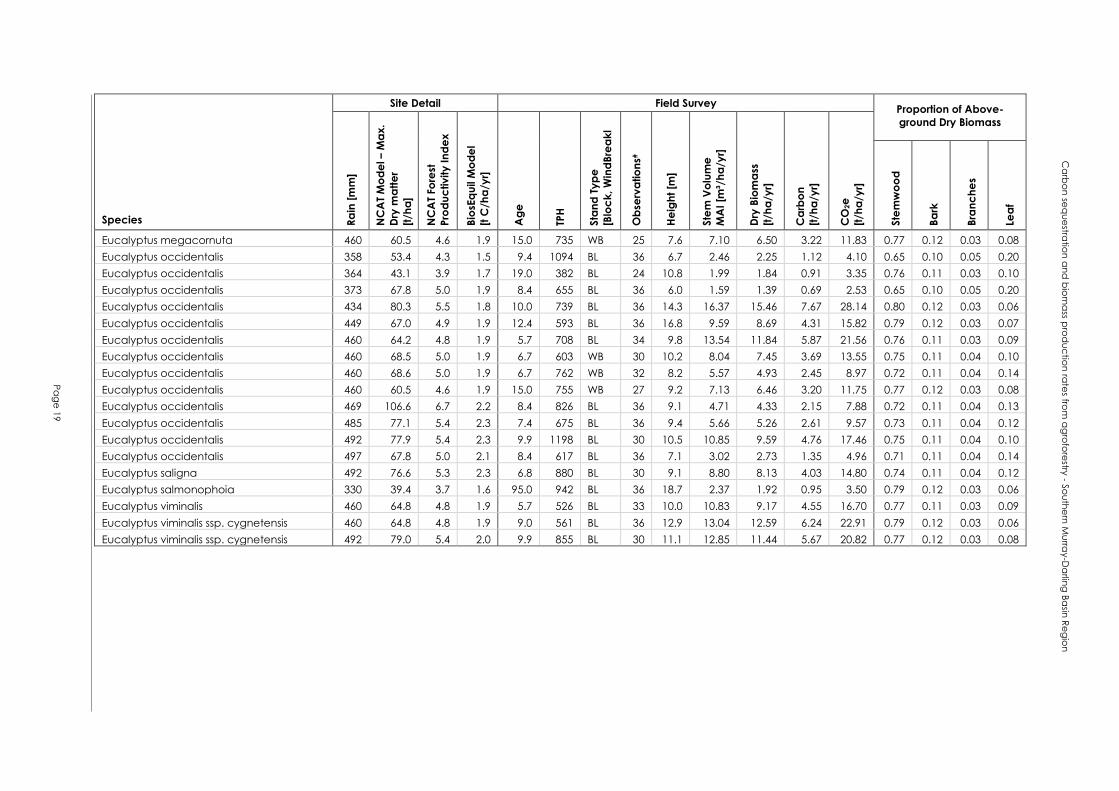
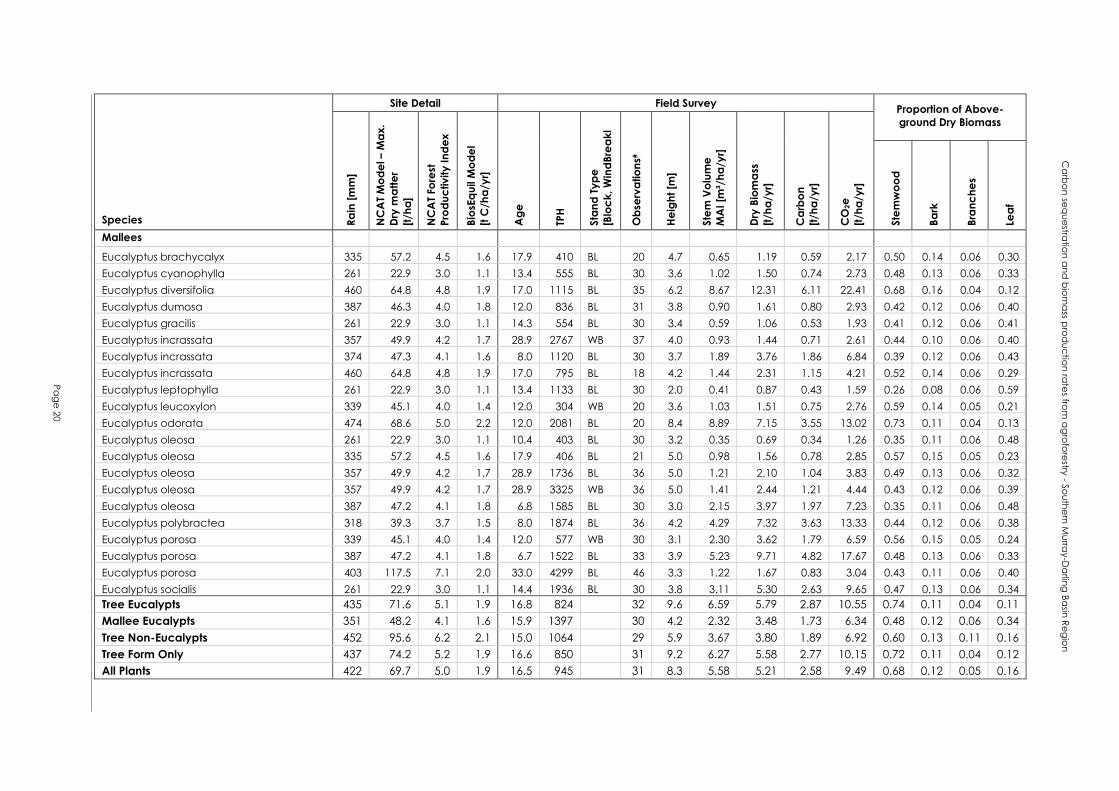
study. 14 Table 5. Plantation growth and carbon sequestration rates from trees and mallees observed in the southern
Murray-Darling Basin region of South Australia. 16
Carbon sequestration and biomass production rates from agroforestry - Southern Murray-Darling Basin Region
Page 1
Introduction
Background and Rationale
To assist industry to better understand the implications of climate change, build industry capacity to adapt to
predicted scenarios and capitalise on emerging mitigation opportunities the Commonwealth Department of
Agriculture, Fisheries and Forestry (DAFF) established the Forest Industries Climate Change Research Fund (FICCRF).
Projects funded under the scheme are focussed on generating information for industry to address specific
knowledge gaps that could hamper adaptation and mitigation efforts by industry to climate change.
The South Australian Department of Environment and Natural Resources (DENR) through its Ecological Analysis and
Monitoring Unit (EAMU) and Future Farm Industries Cooperative Research Centre (FFICRC) recognised the need to fill
gaps in data on carbon sequestration and biomass production rates in the lower rainfall zones (300-650mm) of South
Australia. In partnership with the FICCRF, DENR/FFICRC has sought the reliable agroforestry productivity data essential
to improve the accuracy of models used to predict carbon sequestration rates. Confidence in the accuracy of
carbon figures is essential if future investment is to be encouraged into this sector of the agroforestry industry and
allow it to adjust to changing climatic conditions.
The Government of South Australia places a high priority on helping industry adapt to a changing climate for the
future wellbeing of all South Australians. This is notably reflected in the State Strategic Plan‘s objectives of ―growing
prosperity, improving wellbeing, attaining sustainability, fostering creativity, building communities and expanding
opportunity‖ (SA Government 2004a). These stated objectives are strongly connected to our ability to adapt and
take advantage of the opportunities presented by a changing climate. The South Australian Natural Resources
Management Act 2004 (SA Government 2004b) provides an underlying structure to sustainably manage the natural
resources on which the states industries depend. To facilitate the implementation of that Act, the State Natural
Resources Management Plan (SA DWLBC 2006) was developed setting out a 50 year vision for, policies, milestones
and strategies to achieve the Act‘s objectives. The goals within the NRM plans vision statement clearly indicate that
landscape scale management needs to be adaptive to climate change to maintain healthy natural systems,
prosperous communities and industries. The research presented here is also consistent with the State NRM plan‘s
fundamental requirement that natural resource information should be readily available and consistent with national
and international standards and protocols.
The South Australian Government also places an important emphasis on the reduction of greenhouse gas emissions
and the encouragement of carbon storage methodologies as outlined in the States Greenhouse Strategy (SA DPC
2007). An objective of the strategy is to strengthen the resilience of industries reliant on natural resources in the face
of a changing climate. It also aims to target commercial opportunities and develop products and services that both
mitigate the release of greenhouse gasses and provide commercial opportunities for rural communities and the
State.
Increasing the area of land under agroforestry has many environmental and economic benefits (Australian
Greenhouse Office & Murray Darling Basin Commission 2001). New plantations can not only be used for carbon
sequestration but provide other benefits such as improved biodiversity outcomes; reductions in groundwater
recharge, dryland salinity, saline river discharges, wind erosion and drought risk; and increases in landscape
sustainability, livestock production, economic diversification and the stability of financial returns.
The prospect of new industries based on the provision and trading of sequestered carbon to offset emissions has
increased interest in agroforestry outside those areas traditionally associated with forestry and the potential of tree
species not commonly used in forestry. It is also possible that some of these plantings could even provide renewable
energy sources in their own right (Stucley et al. 2004, Zorzetto & Chudleigh 1999, Hague et al. 2002, Harper et al.
2007). Stucley et al. (2004) however, warns that, “There is a general lack of information available on the growth of
tree plantations in many parts of Australia.” This lack of information is particularly acute in lower rainfall areas where
there has been little economic impetus toward acquiring such information in the past.
Carbon Sequestration and Biomass Production Rates
This project gathered information and tested methodologies designed to evaluate and predict woody biomass
production and carbon sequestration rates in farm forestry plantings in the lower rainfall (300-650 mm) of the SA
Murray Darling Basin (Figure 1). Large parts of the study area have been significantly modified since settlement and
may provide opportunities to undertake economically viable revegetation in response to climate change issues
(Figure 2). For this to occur, rapid and accurate estimates of biomass productivity and carbon sequestration rates are
required to enable landholders to make informed decisions about the financial viability of any proposed plantings
compared with traditional land usages.
The project built on the knowledge and understanding developed by DENR/FFICRC during prior research in the
Murray-Darling Basin, Mid North and Upper South East regions of South Australia (Neumann et al. 2010, Hobbs et al.
2010, Hobbs et al. 2009) and assimilated information gathered from new surveys to increase representation,
accuracy and reliability of biomass productivity data for the calibration of carbon accounting models. To assist in the
improvement of carbon sequestration and biomass production estimates destructive sampling was carried out to
Carbon sequestration and biomass production rates from agroforestry - Southern Murray-Darling Basin Region
Page 2
test and further refine the allometric relationships used in the modelling. From a combination of these activities data
sets on a range of native species have been compiled providing enhanced parameter information that is available
for other predictive models.
Unlike most crops where the product yield is readily measured at harvest times, carbon sequestered in agroforestry
and other carbon crops is more difficult to assess. There are two approaches that can be used to assess the amount
of carbon stored in these situations: 1/ physical measurements supported by destructive subsamples or reliable
estimation techniques (i.e. allometrics); or 2/ process or simulation models of predicted carbon yields. However the
second method relies on the quality of the data upon which the models have been constructed and, as previously
stated, in lower rainfall areas there is a general lack of information available.
In classical forestry simple estimates of stemwood volumes are used to determine the amount of timber that can be
extracted from a plantation, however, this fails to take into account a significant amount other above-ground plant
biomass (e.g. branches, twig and leaves). Carbon sequestration assessments need to fully account for the whole of
plant biomass and not just stem components. By harvesting a small number of individuals of a species and exploring
how their morphological parameters, individual dry biomass and the dry biomass of component fractions (leaves,
bark, branches and stemwood) relate to each other, it is possible to develop useful formulas that can be applied to
other similar individuals. These reliable relationships between plant measurements and biomass (allometrics) can then
be used to develop a set of simple measurements (biometrics) that are able to be applied without the need for
further destructive sampling, providing a rapid method of estimating site productivity. This study aimed to provide a
range of these allometric equations for differing life forms and situations.
A focus of this project was to sample vegetation to test and refine the allometric equations developed within the
Southern Murray-Darling Basin region during this and previous studies (Neumann et al. 2010, Hobbs et al. 2010, Hobbs
et al. 2009, Hobbs and Bennell 2005). Assessments of productivity using these equations were applied to 28 new sites
and 93 sites previously measured within the region, to provide accurate estimates of the carbon sequestered by
each site and species.
A stemwood volume model was chosen because it was most comparable with the process-based stemwood
models used in the FullCAM program, however, many of the other models developed in this study are equally as
valid and reliable. It was intended that many of the data sets produced from this study would be used to improve
the parameter sets currently available for modelling carbon sequestration and biomass production. Physical and
time constraints have limited these assessments to the above ground components of plant biomass.
Predictive models of carbon sequestration and biomass production will be used to provide estimates within any
proposed national carbon accounting and emission trading schemes. Species in higher rainfall regions (>650mm) are
now well established within these carbon accounting schemes and models. However, this information is currently
underdeveloped for species suited to planting within the medium and lower rainfall regions (<650mm).
Consequently, a call for additional information collections and sampling studies has been made by a number of
organisations (DCCEE, CSIRO, DENR, SA Water, Greening Australia and Canopy) to produce a more comprehensive
dataset for use in carbon accounting models. Previous DENR studies have illustrated that currently available national
models can misrepresent carbon sequestration rates in lower rainfall regions by 50 - 400% (Hobbs et al. 2009a, Hobbs
et al. 2010).
DENR Ecological Analysis and Monitoring Unit has previously invested resources and developed collaborations with
the Future Farm Industries CRC and the Rural Industry Research and Development Corporation (RIRDC) to undertake
studies on carbon sequestration rates and evaluation techniques from areas within SA (Mid-North [Neumann et al.
2010], Southern Murray-Darling Basin [Hobbs et al. 2010], Upper South East [Hobbs et al. 2006, 2009a] & River Murray
Dryland Corridor [Hobbs & Bennell 2005]). The EAMU team has collaborated extensively with CSIRO in recent years
on other national studies of native plant growth rates and carbon sequestration modelling (Polglase et al. 2008).
From these investments and collaborations DENR has developed a unique capacity to undertake scientifically
rigorous evaluations of carbon sequestration rates of native plant species in lower rainfall regions.
The development of sustainability markets for carbon sequestration based on forestry activities in South Australia
requires a scientifically rigorous evaluation process and an understanding of the productivity and carbon
sequestration rates associated with those activities. While the ultimate objective of the State Government is to
develop a comprehensive understanding of carbon sequestration rates from all plantings in South Australia, the most
cost-effective approach is to develop sound methodologies and information for regions with the highest priority for
investment. Landscapes currently utilised for dryland agriculture in the lower rainfall regions (300-650mm) contain
areas of land that produce negative returns from cropping and are unsuitable for grazing. However, many of these
unviable cropping/grazing areas have potential for investments in sustainable woody crop production with
associated beneficial carbon sequestration and environmental outcomes (Figure 3).
Carbon sequestration and biomass production rates from agroforestry - Southern Murray-Darling Basin Region
Page 3
Figure 1. Carbon sequestration and biomass production rates from agroforestry project study area.
Source: BRS 2004
Figure 2. Landuse and vegetation cover types in the study region.
Carbon sequestration and biomass production rates from agroforestry - Southern Murray-Darling Basin Region
Page 4
Photo: R. Murphy
Figure 3. A 7.5 year old, Flat Topped Yate (Eucalyptus occidentalis) and Sugar Gum (Eucalyptus cladocalyx)
plantation at Callington.
Development of Carbon Assessment Methods
Assessing Above-ground Plant Biomass
The potential of agroforestry to sequester carbon in lower rainfall areas has been difficult to evaluate due to a lack of
productivity data for many of the species suited to those areas. Measurements and destructive samples were taken
from some of the older plantations in the study area to determine relationships (allometric models) between simple
plant height by stem area measurements and above-ground plant biomass (and carbon content). Additional
information was also collected from the destructive samples to determine biomass ratios (or fractions) between
Stemwood : Bark : Branches : Leaves for a range of species commonly planted in the region. This data has been used
to enhance the precision and reliability of non-destructive assessment methods and predictive models.
Allometric Assessment Techniques
Sampling
Individual plant measurements included height, crown width, distance to neighbouring plants, stem count and
circumference at two lower section heights (basal and intermediate: 0.5m and 1.3m for trees and mallees; and 0.2m
and 0.8m for shrubs), and visual ranking of leaf density using reference photographs (8 classes). The stemwood
volume (outer bark) of each plant was calculated from stem height and circumferences using standard forestry
formulas for tree volumes of each stemwood section (1. lower section – cylinder volume; 2. mid section - Smalian's
frustum of a paraboloid volume, and 3. upper section - paraboloid volume).
The whole of each plant was destructively sampled and sorted into two biomass fractions: 1. stemwood and bark
(>8mm diameter); 2. leaf, fine twig and bark (<8mm diameter) and each fraction weighed immediately.
A sub-sample of leaf material (>300g) was separated from it‘s associated the fine twig and bark, which was also
retained to provide a ratio between the two. These two green subsamples were weighed immediately, oven dried to
a steady dry-weight and reweighed to determine their moisture content.
Samples of wood and bark were taken at the basal and intermediate height of each plant with an additional
sample taken half way between the intermediate height and the top of the plant. The diameter of the wood (minus
Carbon sequestration and biomass production rates from agroforestry - Southern Murray-Darling Basin Region
Page 5
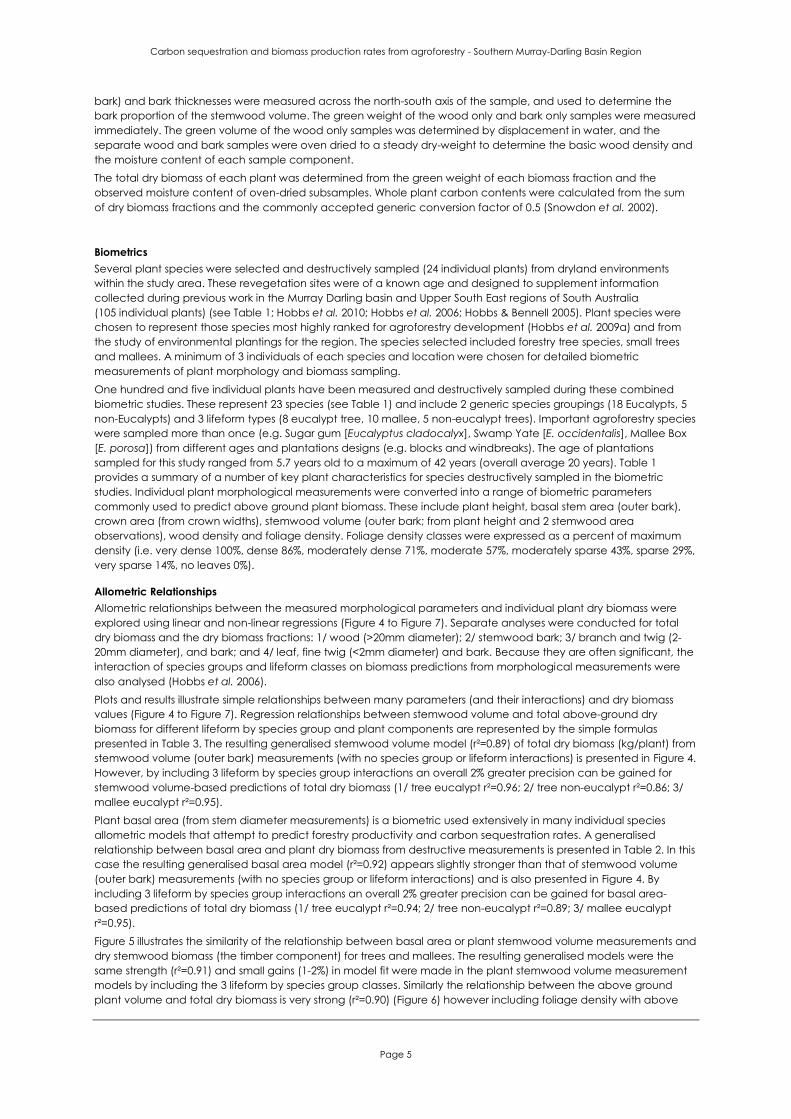
bark) and bark thicknesses were measured across the north-south axis of the sample, and used to determine the
bark proportion of the stemwood volume. The green weight of the wood only and bark only samples were measured
immediately. The green volume of the wood only samples was determined by displacement in water, and the
separate wood and bark samples were oven dried to a steady dry-weight to determine the basic wood density and
the moisture content of each sample component.
The total dry biomass of each plant was determined from the green weight of each biomass fraction and the
observed moisture content of oven-dried subsamples. Whole plant carbon contents were calculated from the sum
of dry biomass fractions and the commonly accepted generic conversion factor of 0.5 (Snowdon et al. 2002).
Biometrics
Several plant species were selected and destructively sampled (24 individual plants) from dryland environments
within the study area. These revegetation sites were of a known age and designed to supplement information
collected during previous work in the Murray Darling basin and Upper South East regions of South Australia
(105 individual plants) (see Table 1; Hobbs et al. 2010; Hobbs et al. 2006; Hobbs & Bennell 2005). Plant species were
chosen to represent those species most highly ranked for agroforestry development (Hobbs et al. 2009a) and from
the study of environmental plantings for the region. The species selected included forestry tree species, small trees
and mallees. A minimum of 3 individuals of each species and location were chosen for detailed biometric
measurements of plant morphology and biomass sampling.
One hundred and five individual plants have been measured and destructively sampled during these combined
biometric studies. These represent 23 species (see Table 1) and include 2 generic species groupings (18 Eucalypts, 5
non-Eucalypts) and 3 lifeform types (8 eucalypt tree, 10 mallee, 5 non-eucalypt trees). Important agroforestry species
were sampled more than once (e.g. Sugar gum [Eucalyptus cladocalyx], Swamp Yate [E. occidentalis], Mallee Box
[E. porosa]) from different ages and plantations designs (e.g. blocks and windbreaks). The age of plantations
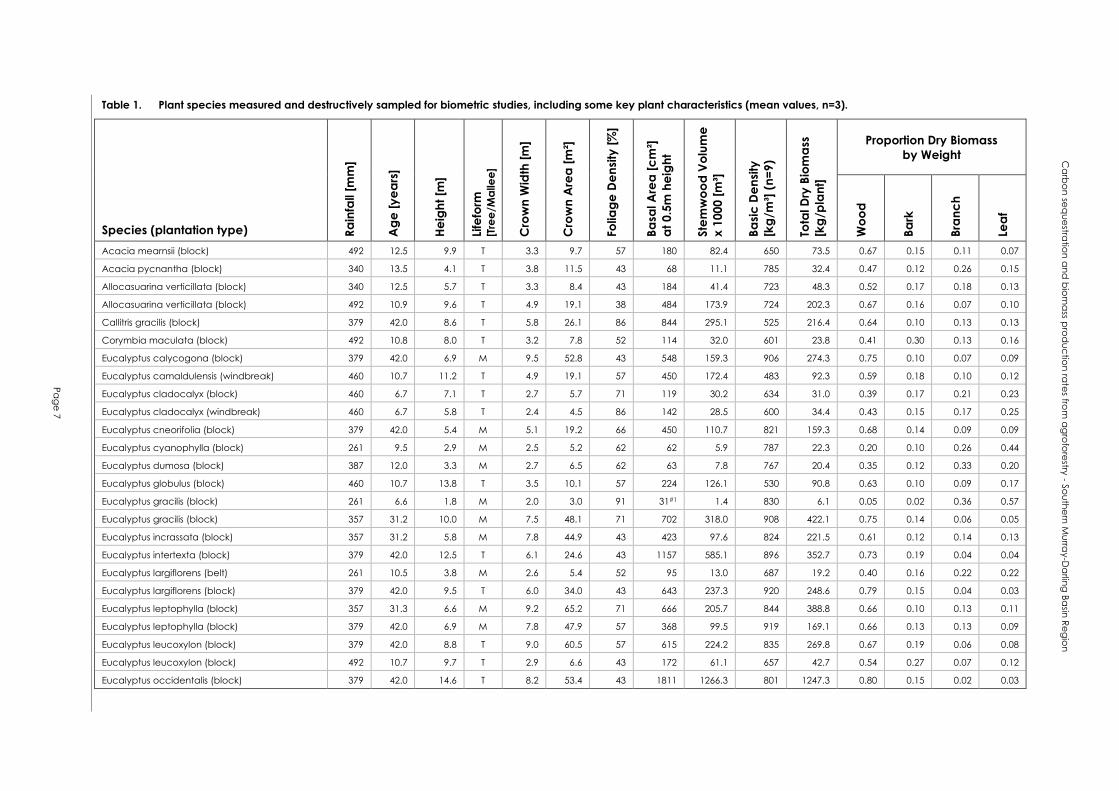
sampled for this study ranged from 5.7 years old to a maximum of 42 years (overall average 20 years). Table 1
provides a summary of a number of key plant characteristics for species destructively sampled in the biometric
studies. Individual plant morphological measurements were converted into a range of biometric parameters
commonly used to predict above ground plant biomass. These include plant height, basal stem area (outer bark),
crown area (from crown widths), stemwood volume (outer bark; from plant height and 2 stemwood area
observations), wood density and foliage density. Foliage density classes were expressed as a percent of maximum
density (i.e. very dense 100%, dense 86%, moderately dense 71%, moderate 57%, moderately sparse 43%, sparse 29%,
very sparse 14%, no leaves 0%).
Allometric Relationships
Allometric relationships between the measured morphological parameters and individual plant dry biomass were
explored using linear and non-linear regressions (Figure 4 to Figure 7). Separate analyses were conducted for total
dry biomass and the dry biomass fractions: 1/ wood (>20mm diameter); 2/ stemwood bark; 3/ branch and twig (2-
20mm diameter), and bark; and 4/ leaf, fine twig (<2mm diameter) and bark. Because they are often significant, the
interaction of species groups and lifeform classes on biomass predictions from morphological measurements were
also analysed (Hobbs et al. 2006).
Plots and results illustrate simple relationships between many parameters (and their interactions) and dry biomass
values (Figure 4 to Figure 7). Regression relationships between stemwood volume and total above-ground dry
biomass for different lifeform by species group and plant components are represented by the simple formulas
presented in Table 3. The resulting generalised stemwood volume model (r²=0.89) of total dry biomass (kg/plant) from
stemwood volume (outer bark) measurements (with no species group or lifeform interactions) is presented in Figure 4.
However, by including 3 lifeform by species group interactions an overall 2% greater precision can be gained for
stemwood volume-based predictions of total dry biomass (1/ tree eucalypt r²=0.96; 2/ tree non-eucalypt r²=0.86; 3/
mallee eucalypt r²=0.95).
Plant basal area (from stem diameter measurements) is a biometric used extensively in many individual species
allometric models that attempt to predict forestry productivity and carbon sequestration rates. A generalised
relationship between basal area and plant dry biomass from destructive measurements is presented in Table 2. In this
case the resulting generalised basal area model (r²=0.92) appears slightly stronger than that of stemwood volume
(outer bark) measurements (with no species group or lifeform interactions) and is also presented in Figure 4. By
including 3 lifeform by species group interactions an overall 2% greater precision can be gained for basal area-
based predictions of total dry biomass (1/ tree eucalypt r²=0.94; 2/ tree non-eucalypt r²=0.89; 3/ mallee eucalypt
r²=0.95).
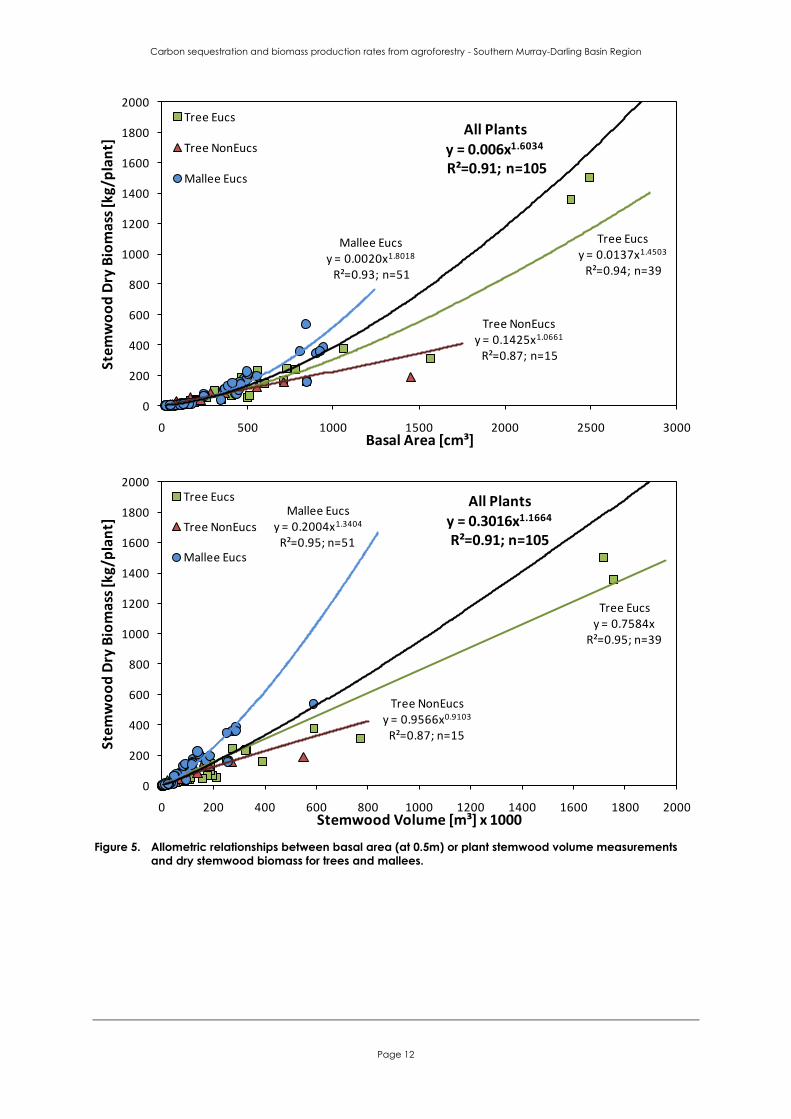
Figure 5 illustrates the similarity of the relationship between basal area or plant stemwood volume measurements and
dry stemwood biomass (the timber component) for trees and mallees. The resulting generalised models were the
same strength (r²=0.91) and small gains (1-2%) in model fit were made in the plant stemwood volume measurement
models by including the 3 lifeform by species group classes. Similarly the relationship between the above ground
plant volume and total dry biomass is very strong (r²=0.90) (Figure 6) however including foliage density with above
Carbon sequestration and biomass production rates from agroforestry - Southern Murray-Darling Basin Region
Page 6
ground plant volume weakens the resulting generalised model (r²=0.88) (Figure 7). In this instance each of the
species group class models are detrimentally affected by the addition of foliage density to above ground plant
volume and its relationship with total dry biomass.
Implications of Allometric Relationships
Assessments of plantation productivity and carbon sequestrations can be achieved by one of two related methods:
1/ physical measurements supported by destructive subsamples or reliable estimation techniques (i.e. allometrics); or
2/ process or simulation models of predicted carbon yields built from observational data and refined comprehension
of underlying processes. Any estimation technique or predictive model relies on the accuracy of prior data collection
and as such will always have some element of inaccuracy.
This current allometric study supports the improvement of on-site physical evaluation techniques and illustrates
relatively small differences in precision using fewer measurements. The question therefore is how much inaccuracy is
acceptable, and when does the collection of extra measurements cease to add value?
After examining the allometric relationships presented in Figure 4 to Figure 7 and the scatter of data within these
observations it can be argued that assessments of stocking rates (trees per hectare) combined with either basal area
or stemwood volume (i.e. basal area, height) provide reliable estimates of biomass and carbon sequestration. Life
form and species group differences significantly influence these relationships. While in some instances additional
measurements such as height to calculate volume adds some level of accuracy, the extra effort required to obtain
the additional data does not significantly improve estimates based on fewer measurements and effort. In some
cases, such as the addition of foliage density to above ground volume in Figure 7, the added complexity can
actually reduce the strength of the model fit. Unless it is required for other purpose there is little need to take extra
time consuming measurements.
Pa
ge
7
Ca
rbo
n se
qu
estra
tion
an
d b
iom
ass p
rod
uc
tion
rate
s from
ag
rofo
restry
- So
uth
ern
Mu
rray-D
arlin
g B
asin
Re
gio
n
Table 1. Plant species measured and destructively sampled for biometric studies, including some key plant characteristics (mean values, n=3).
Carbon sequestration and biomass production rates from agroforestry - Southern Murray-Darling Basin Region
Page 9
Table 2. Simple regression relationships between basal area and total above-ground dry biomass for
different lifeform by species group.
Species and Lifeform Group
Obs. [n]
Model Fit [r
2]
Dry Biomass [kg/plant]
Total Above-ground Plant Biomass
All Species (Unsorted) 105 0.92 = 0.1203 x Basal Area [cm²]1.1844
Tree (Eucalypt) 39 0.94 = 0.0744 x Basal Area [cm²]1.2432
Tree (Non-Eucalypt) 15 0.89 = 0.5521 x Basal Area [cm²]0.9150
Mallee (Eucalypt) 51 0.95 = 0.0910 x Basal Area [cm²]1.2560
Stemwood Biomass (excluding bark)
All Species (Unsorted) 105 0.91 = 0.0060 x Basal Area [cm²]1.6034
Tree (Eucalypt) 39 0.94 = 0.0137 x Basal Area [cm²]1.4503
Tree (Non-Eucalypt) 15 0.87 = 0.1425 x Basal Area [cm²]1.0661
Mallee (Eucalypt) 51 0.93 = 0.0020 x Basal Area [cm²]1.8018
Bark Biomass
All Species (Unsorted) 105 0.89 = 0.0051 x Basal Area [cm²]1.3545
Tree (Eucalypt) 39 0.91 = 0.0136 x Basal Area [cm²]1.1908
Tree (Non-Eucalypt) 15 0.83 = 0.0522 x Basal Area [cm²]0.9564
Mallee (Eucalypt) 51 0.85 = 0.0011 x Basal Area [cm²]1.6773
Branch and Twig Biomass
All Species (Unsorted) 105 0.57 = 0.3020 x Basal Area [cm²]0.6312
Tree (Eucalypt) 39 0.72 = 0.1876 x Basal Area [cm²]0.6393
Tree (Non-Eucalypt) 15 0.69 = 0.5532 x Basal Area [cm²]0.5486
Mallee (Eucalypt) 51 0.66 = 0.0935 x Basal Area [cm²]0.9481
Leaf and Fine Twig Biomass
All Species (Unsorted) 105 0.57 = 0.4012 x Basal Area [cm²]0.6076
Tree (Eucalypt) 39 0.53 = 0.4703 x Basal Area [cm²]0.5419
Tree (Non-Eucalypt) 15 0.82 = 0.1289 x Basal Area [cm²]0.7872
Mallee (Eucalypt) 51 0.57 = 0.1760 x Basal Area [cm²]0.8408
Carbon sequestration and biomass production rates from agroforestry - Southern Murray-Darling Basin Region
Page 10
Table 3. Simple regression relationships between stemwood volume and total above-ground dry biomass for
different lifeform by species group.
Species and Lifeform Group
Obs. [n]
Model Fit [r
2]
Dry Biomass [kg/plant]
Total Above-ground Plant Biomass
All Species (Unsorted) 105 0.89 = 0.9761 x (Stemwood Volume x 1000 [m³])
Tree (Eucalypt) 39 0.96 = 0.9268 x (Stemwood Volume x 1000 [m³])
Tree (Non-Eucalypt) 15 0.86 = 3.0043 x (Stemwood Volume x 1000 [m³])0.7673
Mallee (Eucalypt) 51 0.95 = 2.2859 x (Stemwood Volume x 1000 [m³])0.9263
Stemwood Biomass (excluding bark)
All Species (Unsorted) 105 0.91 = 0.3016 x (Stemwood Volume x 1000 [m³])1.1664
Tree (Eucalypt) 39 0.95 = 0.7584 x (Stemwood Volume x 1000 [m³])
Tree (Non-Eucalypt) 15 0.87 = 0.9566 x (Stemwood Volume x 1000 [m³])0.9103
Mallee (Eucalypt) 51 0.95 = 0.2004 x (Stemwood Volume x 1000 [m³])1.3404
Bark Biomass
All Species (Unsorted) 105 0.90 = 0.1161 x (Stemwood Volume x 1000 [m³])
Tree (Eucalypt) 39 0.95 = 0.1130 x (Stemwood Volume x 1000 [m³])
Tree (Non-Eucalypt) 15 0.85 = 0.2785 x (Stemwood Volume x 1000 [m³])0.8246
Mallee (Eucalypt) 51 0.86 = 0.0780 x (Stemwood Volume x 1000 [m³])1.2418
Branch and Twig Biomass
All Species (Unsorted) 105 0.45 = 1.7487 x (Stemwood Volume x 1000 [m³])0.4072
Tree (Eucalypt) 39 0.67 = 0.7428 x (Stemwood Volume x 1000 [m³])0.4826
Tree (Non-Eucalypt) 15 0.56 = 1.7900 x (Stemwood Volume x 1000 [m³])0.4231
Mallee (Eucalypt) 51 0.62 = 1.1486 x (Stemwood Volume x 1000 [m³])0.6783
Leaf and Fine Twig Biomass
All Species (Unsorted) 105 0.48 = 2.0683 x (Stemwood Volume x 1000 [m³])0.4042
Tree (Eucalypt) 39 0.57 = 1.2986 x (Stemwood Volume x 1000 [m³])0.4410
Tree (Non-Eucalypt) 15 0.66 = 0.7059 x (Stemwood Volume x 1000 [m³])0.6033
Mallee (Eucalypt) 51 0.53 = 1.6379 x (Stemwood Volume x 1000 [m³])0.5999
Carbon sequestration and biomass production rates from agroforestry - Southern Murray-Darling Basin Region
Page 11
Tree Eucs y = 0.0744x1.2432
R²=0.94; n=39
Tree NonEucs y = 0.5521x0.9150
R²=0.89; n=15
Mallee Eucs y = 0.0910x1.2560
R²=0.95; n=51
All Plants y = 0.1203x1.1844
R²=0.92; n=105
0
200
400
600
800
1000
1200
1400
1600
1800
2000
0 500 1000 1500 2000 2500 3000
Tota
l Dry
Bio
mas
s [k
g/p
lan
t]
Basal Area [cm³]
Tree Eucs
Tree NonEucs
Mallee Eucs
Tree Eucs y = 0.9268x
R²=0.96; n=39
Tree NonEucs y = 3.0043x0.7673
R²=0.86; n=15
Mallee Eucs y = 2.2859x0.9263
R²=0.95; n=51
All Plants
y = 0.9761xR²=0.89; n=105
0
200
400
600
800
1000
1200
1400
1600
1800
2000
0 200 400 600 800 1000 1200 1400 1600 1800 2000
Tota
l Dry
Bio
mas
s [k
g/p
lan
t]
Stemwood Volume [m³] x 1000
Tree Eucs
Tree NonEucs
Mallee Eucs
Figure 4. Allometric relationships between basal area (at 0.5m) or plant stemwood volume measurements
and total above ground dry biomass for trees and mallees.
Carbon sequestration and biomass production rates from agroforestry - Southern Murray-Darling Basin Region
Page 12
Tree Eucs y = 0.0137x1.4503
R²=0.94; n=39
Tree NonEucs y = 0.1425x1.0661
R²=0.87; n=15
Mallee Eucs y = 0.0020x1.8018
R²=0.93; n=51
All Plants y = 0.006x1.6034
R²=0.91; n=105
0
200
400
600
800
1000
1200
1400
1600
1800
2000
0 500 1000 1500 2000 2500 3000
Ste
mw
oo
d D
ry B
iom
ass
[kg/
pla
nt]
Basal Area [cm³]
Tree Eucs
Tree NonEucs
Mallee Eucs
Tree Eucs y = 0.7584x
R²=0.95; n=39
Tree NonEucs y = 0.9566x0.9103
R²=0.87; n=15
Mallee Eucs y = 0.2004x1.3404
R²=0.95; n=51
All Plants y = 0.3016x1.1664
R²=0.91; n=105
0
200
400
600
800
1000
1200
1400
1600
1800
2000
0 200 400 600 800 1000 1200 1400 1600 1800 2000
Ste
mw
oo
d D
ry B
iom
ass
[kg/
pla
nt]
Stemwood Volume [m³] x 1000
Tree Eucs
Tree NonEucs
Mallee Eucs
Figure 5. Allometric relationships between basal area (at 0.5m) or plant stemwood volume measurements
and dry stemwood biomass for trees and mallees.
Carbon sequestration and biomass production rates from agroforestry - Southern Murray-Darling Basin Region
Page 13
Tree Eucs y = 0.8816x0.9646
R²=0.85; n=39 Tree NonEucs
y = 0.8094x1.0244
R²=0.87; n=15
Mallee Eucs y = 1.1969x0.9243
R²=0.94; n=51
All Plants y = 1.1092x0.9338
R²=0.90; n=105
0
200
400
600
800
1000
1200
1400
1600
1800
2000
0 200 400 600 800 1000 1200
Tota
l Dry
Bio
mas
s [k
g/p
lan
t]
Above-ground Plant Volume [m³]
Tree Eucs
Tree NonEucs
Mallee Eucs
Figure 6. The relationship between above-ground plant volume (height [m] x crown area [m²]) and total
above ground dry biomass for trees and mallees.
Tree Eucs y = 0.0089x1.0495
R²=0.83; n=39
Tree NonEucs y = 0.0694x0.8381
R²=0.81; n=15
Mallee Eucs y = 0.0182x0.9648
R²=0.93; n=51
All Plants y = 0.0179x0.9722
R²=0.88; n=105
0
200
400
600
800
1000
1200
1400
1600
1800
2000
0 10000 20000 30000 40000 50000 60000 70000 80000
Tota
l Dry
Bio
mas
s [k
g/p
lan
t]
Above-ground Plant Volume [m³] x Foliage Density [%]
Tree Eucs
Tree NonEucs
Mallee Eucs
Figure 7. The relationship between above-ground plant volume (height [m] x crown area [m²]) multiplied by
foliage density [%] and total above ground dry biomass for trees and mallees.
Carbon sequestration and biomass production rates from agroforestry - Southern Murray-Darling Basin Region
Page 14
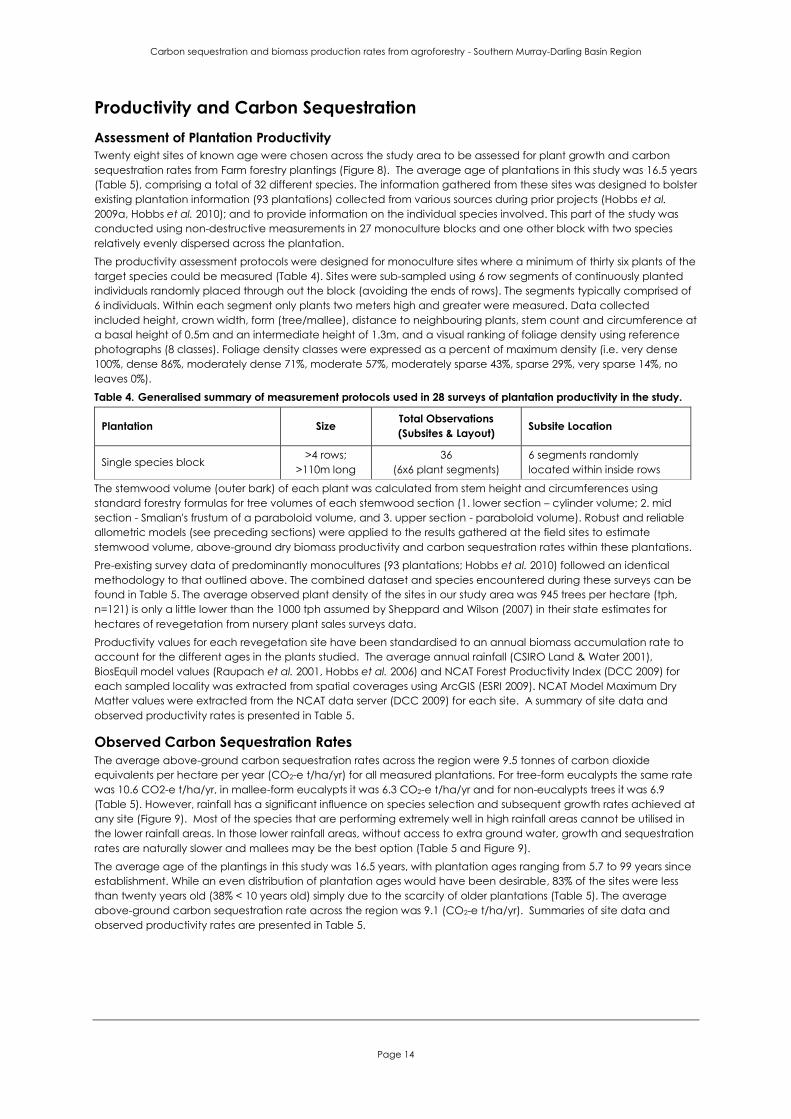
Productivity and Carbon Sequestration
Assessment of Plantation Productivity
Twenty eight sites of known age were chosen across the study area to be assessed for plant growth and carbon
sequestration rates from Farm forestry plantings (Figure 8). The average age of plantations in this study was 16.5 years
(Table 5), comprising a total of 32 different species. The information gathered from these sites was designed to bolster
existing plantation information (93 plantations) collected from various sources during prior projects (Hobbs et al.
2009a, Hobbs et al. 2010); and to provide information on the individual species involved. This part of the study was
conducted using non-destructive measurements in 27 monoculture blocks and one other block with two species
relatively evenly dispersed across the plantation.
The productivity assessment protocols were designed for monoculture sites where a minimum of thirty six plants of the
target species could be measured (Table 4). Sites were sub-sampled using 6 row segments of continuously planted
individuals randomly placed through out the block (avoiding the ends of rows). The segments typically comprised of
6 individuals. Within each segment only plants two meters high and greater were measured. Data collected
included height, crown width, form (tree/mallee), distance to neighbouring plants, stem count and circumference at
a basal height of 0.5m and an intermediate height of 1.3m, and a visual ranking of foliage density using reference
photographs (8 classes). Foliage density classes were expressed as a percent of maximum density (i.e. very dense
100%, dense 86%, moderately dense 71%, moderate 57%, moderately sparse 43%, sparse 29%, very sparse 14%, no
leaves 0%).
Table 4. Generalised summary of measurement protocols used in 28 surveys of plantation productivity in the study.
Plantation Size Total Observations
(Subsites & Layout) Subsite Location
Single species block >4 rows;
>110m long
36
(6x6 plant segments)
6 segments randomly
located within inside rows
The stemwood volume (outer bark) of each plant was calculated from stem height and circumferences using
standard forestry formulas for tree volumes of each stemwood section (1. lower section – cylinder volume; 2. mid
section - Smalian's frustum of a paraboloid volume, and 3. upper section - paraboloid volume). Robust and reliable
allometric models (see preceding sections) were applied to the results gathered at the field sites to estimate
stemwood volume, above-ground dry biomass productivity and carbon sequestration rates within these plantations.
Pre-existing survey data of predominantly monocultures (93 plantations; Hobbs et al. 2010) followed an identical
methodology to that outlined above. The combined dataset and species encountered during these surveys can be
found in Table 5. The average observed plant density of the sites in our study area was 945 trees per hectare (tph,
n=121) is only a little lower than the 1000 tph assumed by Sheppard and Wilson (2007) in their state estimates for
hectares of revegetation from nursery plant sales surveys data.
Productivity values for each revegetation site have been standardised to an annual biomass accumulation rate to
account for the different ages in the plants studied. The average annual rainfall (CSIRO Land & Water 2001),
BiosEquil model values (Raupach et al. 2001, Hobbs et al. 2006) and NCAT Forest Productivity Index (DCC 2009) for
each sampled locality was extracted from spatial coverages using ArcGIS (ESRI 2009). NCAT Model Maximum Dry
Matter values were extracted from the NCAT data server (DCC 2009) for each site. A summary of site data and
observed productivity rates is presented in Table 5.
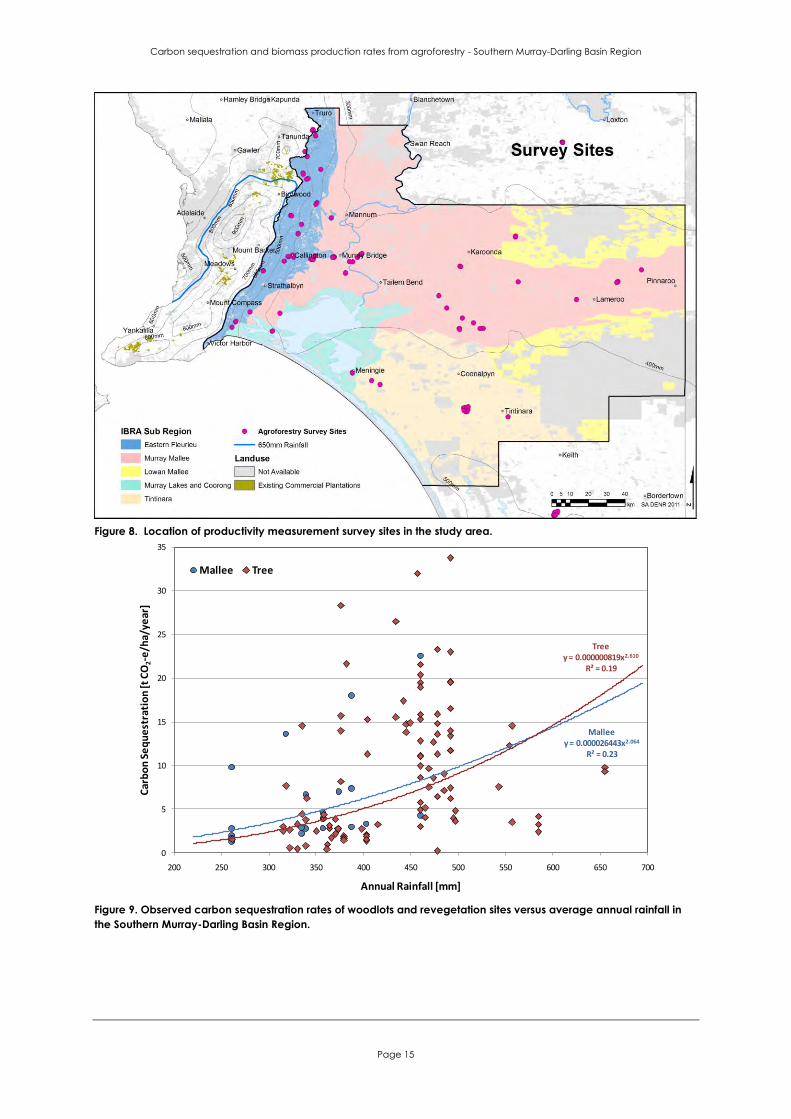
Observed Carbon Sequestration Rates
The average above-ground carbon sequestration rates across the region were 9.5 tonnes of carbon dioxide
equivalents per hectare per year (CO2-e t/ha/yr) for all measured plantations. For tree-form eucalypts the same rate
was 10.6 CO2-e t/ha/yr, in mallee-form eucalypts it was 6.3 CO2-e t/ha/yr and for non-eucalypts trees it was 6.9
(Table 5). However, rainfall has a significant influence on species selection and subsequent growth rates achieved at
any site (Figure 9). Most of the species that are performing extremely well in high rainfall areas cannot be utilised in
the lower rainfall areas. In those lower rainfall areas, without access to extra ground water, growth and sequestration
rates are naturally slower and mallees may be the best option (Table 5 and Figure 9).
The average age of the plantings in this study was 16.5 years, with plantation ages ranging from 5.7 to 99 years since
establishment. While an even distribution of plantation ages would have been desirable, 83% of the sites were less
than twenty years old (38% < 10 years old) simply due to the scarcity of older plantations (Table 5). The average
above-ground carbon sequestration rate across the region was 9.1 (CO2-e t/ha/yr). Summaries of site data and
observed productivity rates are presented in Table 5.
Carbon sequestration and biomass production rates from agroforestry - Southern Murray-Darling Basin Region
Page 15
Figure 8. Location of productivity measurement survey sites in the study area.
Malleey = 0.000026443x2.064
R² = 0.23
Treey = 0.000000819x2.610
R² = 0.19
0
5
10
15
20
25
30
35
200 250 300 350 400 450 500 550 600 650 700
Car
bo
n S
eq
ue
stra
tio
n [t
CO
2-e
/ha/
year
]
Annual Rainfall [mm]
Mallee Tree
Figure 9. Observed carbon sequestration rates of woodlots and revegetation sites versus average annual rainfall in
the Southern Murray-Darling Basin Region.
Pa
ge
16
Ca
rbo
n se
qu
estra
tion
an
d b
iom
ass p
rod
uc
tion
rate
s from
ag
rofo
restry
- So
uth
ern
Mu
rray-D
arlin
g B
asin
Re
gio
n
Table 5. Plantation growth and carbon sequestration rates from trees and mallees observed in the southern Murray-Darling Basin region of South Australia.