Page 1
Carbon Trading an overview of financial instruments
designed to combat climate change
Mark van Soestbergen
International Carbon Bank & Exchange
www.ICBE.com
UF Bioenergy and Sustainability School
Soil and Water Science Department
Gainesville, FL
July 26, 2012
Page 3
Carbon Dioxide
Intercepts infrared waves going into space
Page 4
Gasoline is 85.5% carbon
1 gallon of conventional gasoline becomes
172 cubic feet / 4.87 cubic meters of CO2
Page 5
Humans add about 25 billion tonne
carbon dioxide
to the atmosphere each year
Page 6
Greenland is
melting
NY Times June 8, 2004
Page 7
The oceans have absorbed about 30 times more
heat than the atmosphere since 1955
Page 9
Man came out of his cave at the time earth entered the ‘present
interglacial’ (Holocene) and flourished only after the 120,000 year
winter was over.
Page 10
We are here
Globally,
temperatures
are projected
to rise an
additional
2 – 5°C in the
21st Century
Page 11
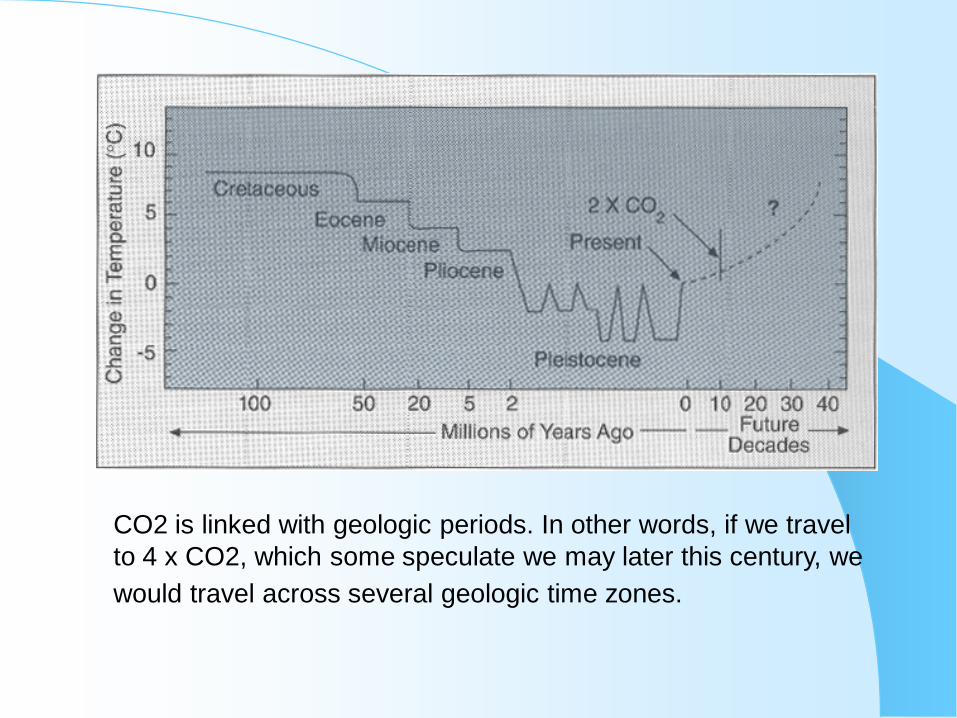
CO2 is linked with geologic periods. In other words, if we travel
to 4 x CO2, which some speculate we may later this century, we
would travel across several geologic time zones.
Page 12
Yikes, Climate Change!
What to do?
- Nothing
- Adapt
- Engage
Page 13
Man invents the Kyoto Protocol!
The Kyoto Protocol (KP) sets legally binding emissions targets for a
basket of six greenhouse gases (GHG) for Annex I countries2.
Together, they must reduce their emissions by 5.2% below 1990
levels over the commitment period 2008-2012.
The Protocol will became effective when it was ratified by 55 parties
whose CO2 emissions represent 55% of the total from Annex I
Parties in the year 1990.
Page 15
Result: Glide Trajectory
2008 2012
BAU
~ 29%
Page 17
What is a Cap-and-Trade Program?
A “cap” is placed on emissions from “covered sources”
Covered sources must surrender “credits” equal to
emissions in the compliance period
– A “credit” can either be an “allowance” or an “offset”
Allowances – allocated to covered sources
Offsets – come from projects in uncovered sectors (i.e. outside the “cap”)
Covered sources can design their own compliance strategy:
– Reduce emissions to the cap
– Reduce below cap and sell unused allowances to others
– Purchase allowances and/or offsets and emit above the cap
Emitters and other project developers can create offset
credits to be used, banked or traded on an exchange
Page 18
Cost Minimization With Trading
Source: US EPA
Cost: $500 Cost: $560 minus
$160 - $240 = $320 -
$400
(vs. $400 fixed)
Cost: $360 plus
$160 - $240 = $520
- $600
(vs. $600 fixed)
BOTH
PARTI
ES
BENEF
IT
Page 19
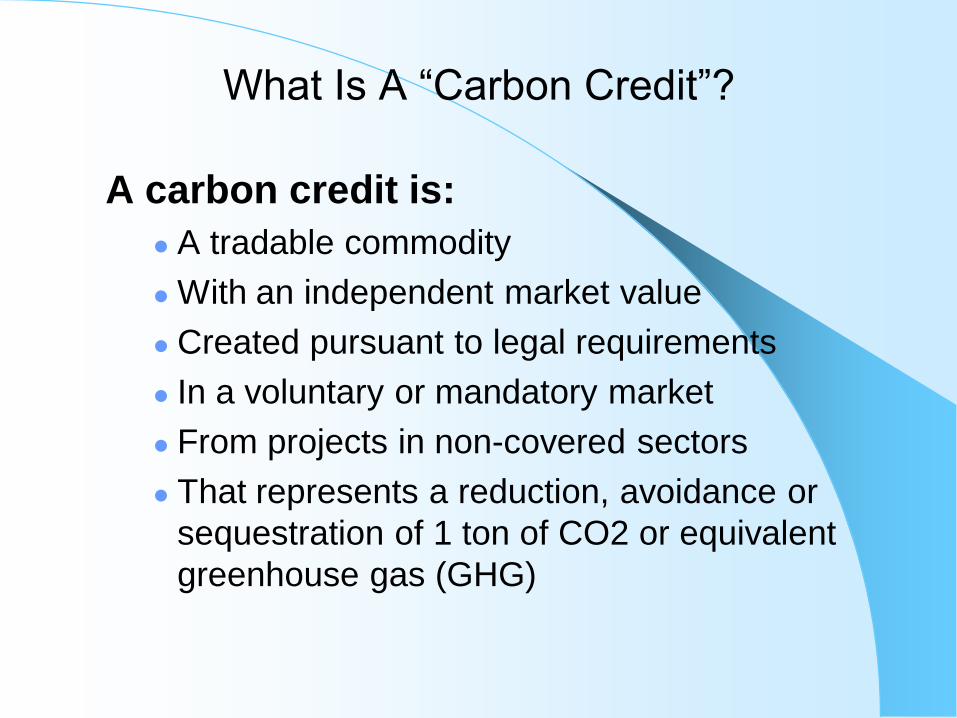
What Is A “Carbon Credit”?
A carbon credit is:
A tradable commodity
With an independent market value
Created pursuant to legal requirements
In a voluntary or mandatory market
From projects in non-covered sectors
That represents a reduction, avoidance or
sequestration of 1 ton of CO2 or equivalent
greenhouse gas (GHG)
Page 20
Legal Components Real (represents actual emissions reductions)
Measurable (capable of accurate measuring & monitoring)
Additional (based on a realistic baseline)
Permanent (account for reversals during commitment period)
Verified (by independent, registry-approved verifier)
Enforceable (clear, unambiguous ownership)
Unique (no double counting)
Transparent & Address Leakage (does not lead to an increase in emissions outside of the project’s boundary)
Page 21
Carbon Offset Projects: Typical Project Cycle
Page 22
Carbon Offset Standards/Registries
Climate Action Reserve (CAR) – http://www.climateactionreserve.org
Clean Development Mechanism (CDM) – http://cdm.unfccc.int/index.html
Voluntary Carbon Standard (VCS) – http://www.v-c-s.org/
American Carbon Registry (ACR) – http://www.americancarbonregistry.org/
Chicago Climate Exchange (CCX) – http://www.chicagoclimatex.com/
Page 23
Trading and Sourcing Basics
Credits can be purchased/sold through an exchange such as the Chicago Climate Exchange, or “over-the-counter”.
– Over-the-Counter Transactions (2009) – 63% of Volume
– Exchange Transactions (2009) – 37% of Volume
– CAR Credits (aka Climate Reserve Tonnes, or CRTs)
37% of volume in 2009
65% of market value in 2009
Trading vs. Retirement
– Credits can be traded without being “retired”. Only the retirement of credits allows the holder to claim the carbon reduction.
Page 24
Mandatory, Voluntary & Pre-Compliance Markets
Voluntary Markets – 35% in 2009
– Companies purchase carbon offsets to reduce or neutralize their greenhouse gas emissions for various reasons.
Pre-Compliance Markets – 65% in 2009
– Buyers purchase credits with the hopes that they can be used for compliance purposes in a future cap-and-trade program.
Mandatory Markets – 0% in 2009
– Regulated entities purchase offsets credits to meet their compliance obligations.
Distinction between “offsets” and “allowances”
Page 25
Size and Value of US Offset Market in 2009
Volumes
(Mt CO2e)
Value ($M)
Price/Credit
Exchange
Based
Transactions
CCX CFIs 6.4 $5.8 $.90
CAR 0.8 $4.0 $5
Subtotal 7.2 $9.8 $1.36
OTC
Transactions
CAR 7.2 $48.2 $6.70
VCS 2.1 $9.7 $4.60
ACR 1.8 $3.5 $1.95
Other 1.1 $2.4 $2.20
Subtotal 12.2 $63.8 $5.20
Total 19.4 $73.6 $3.80
Source: Point Carbon Research – US Offset
Markets in 2010: The Road Not Yet Taken. March
1, 2010
Page 26
Carbon Finance
Added
Project
Economic
Viability
40 – 60%
Debt
30 – 50%
Equity
10%
Carbon
Finance
Page 27
Where Does Bioenergy Fit In?
Methane Reductions – 49% of supply in 2009
– Livestock (manure management)
– Landfills (landfill gas collection)
– Organic waste digestion
Energy Production
– Biomass/biogas combustion
Transportation
– Fuel switching (biofuels)
Page 28
Hedging: Carbon Credits vs. RECs A carbon credit represents the reduction, avoidance, or
sequestration of 1 ton of CO2e of GHG
A Renewable Energy Credit (REC) represents proof that 1 MWh of electricity was generated from an eligible renewable energy resource.
Both are tradable commodities
A REC may be considered convertible…
– Represents the amount of GHG displaced from using 1 MWh of energy
– Greater GHG reductions when grid is supplied by high-carbon fossil fuels
– Elements like additionality must still be met
Page 29
Current Regulatory Environment
International
– Kyoto / EU ETS
Federal
– EPA Reporting Rule
– SEC Guidance
– House/Senate Bills
State
– Assembly Bill 32 (California)
Regional
– Regional Greenhouse Gas Initiative
– Western Climate Initiative
Page 30
Int. Mechanisms for Reducing GHGs
Kyoto Mechanisms –Emissions Trading Scheme (ETS)
–Clean Development Mechanism (CDM) Allows industrialized countries with reduction commitments to invest
in projects that reduce emissions in developing countries.
–Joint Implementation (JI) Allows annex I countries with reduction commitments to invest in
projects that reduce emissions in other annex I countries.
–Current Prices
Allowances (EAUs) - $15.24
Offsets (CERs) - $ 13.03
Page 31
Environmental Protection Agency (EPA)
– Facilities emitting > 25,000 tons CO2e must submit
annual reports to the EPA
– Covers 85% of U.S. GHG emissions
– Emissions data will inform future policy decisions
– Utilities to be regulated in 2011 if comprehensive legislation is not passed by congress
Federal Legislation & Regulations
Page 32
Securities and Exchange Commission (SEC)
– All publicly traded companies must disclose “material” risks resulting from climate change, including:
Impact of legislation and regulation
Impact of international accords
Indirect consequences of regulation or business trends
Physical impacts of climate change
Federal Legislation & Regulations
Page 33
Federal Legislation & Regulations
House Bill: Waxman-Markey – Passed 06/26/2009
Overlays EPA’s jurisdiction under Clean Air Act
Covered Sources - > 25,000 tons CO2e/year
Caps gradually escalate: 2012: 3% below 2005 level
2020: 17% below 2005 level
2030: 42% below 2005 level in 2020
2050: 83% below 2005 level in 2050
Offsets 2 billion offsets useable per year
Domestic and International Project Types
Methodologies to be developed by EPA & USDA
Page 34
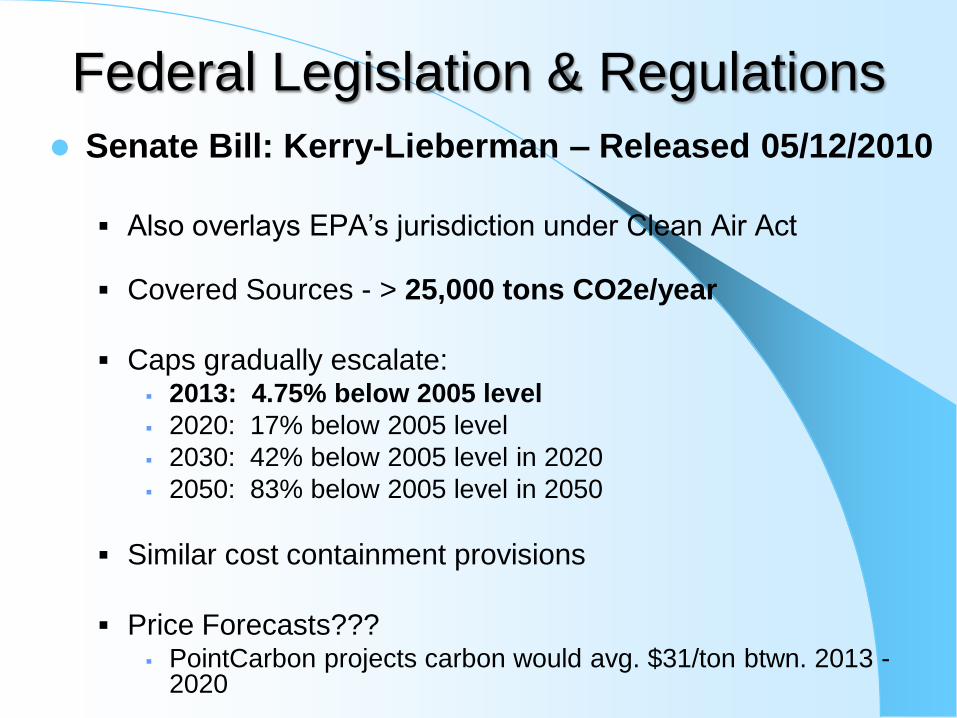
Federal Legislation & Regulations
Senate Bill: Kerry-Lieberman – Released 05/12/2010
Also overlays EPA’s jurisdiction under Clean Air Act
Covered Sources - > 25,000 tons CO2e/year
Caps gradually escalate: 2013: 4.75% below 2005 level
2020: 17% below 2005 level
2030: 42% below 2005 level in 2020
2050: 83% below 2005 level in 2050
Similar cost containment provisions
Price Forecasts??? PointCarbon projects carbon would avg. $31/ton btwn. 2013 -
2020
Page 35
State Legislation
Assembly Bill 32 (California)
Broad-based cap-and-trade program
Electricity, Industry, Transportation Fuels, Natural Gas
Rulemaking currently in progress
Caps gradually escalate: 2020: Reduce to 1990 levels (28% below BAU)
2050: Reduce 80% below 1990 levels
Offsets are being considered on a sector-by-sector basis Climate Action Reserve is a state-sanctioned offset program
Page 36
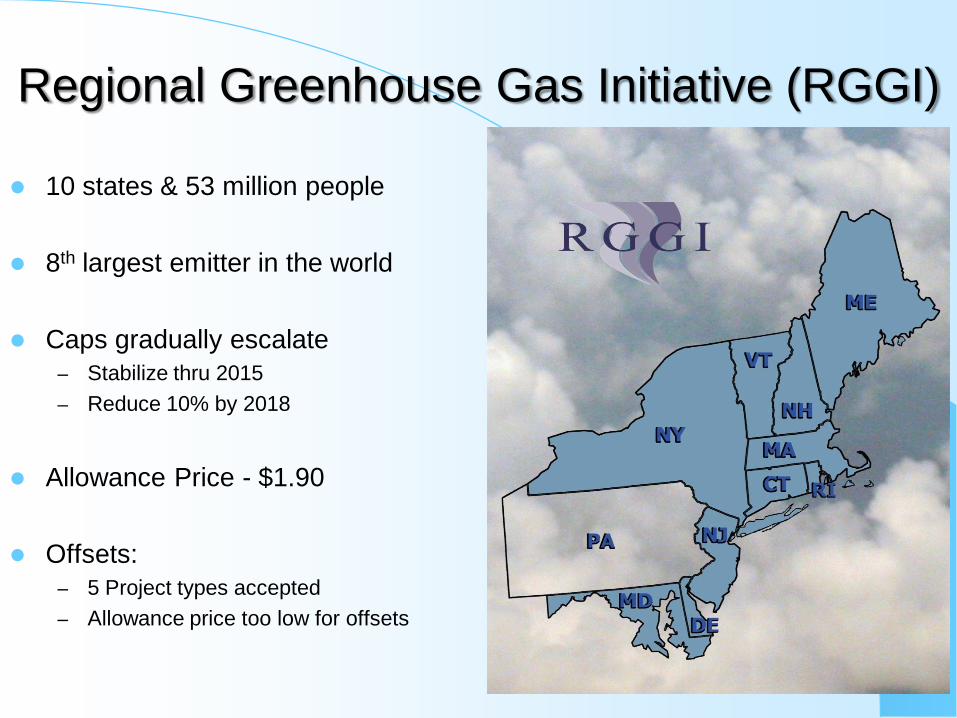
Regional Greenhouse Gas Initiative (RGGI)
10 states & 53 million people
8th largest emitter in the world
Caps gradually escalate
– Stabilize thru 2015
– Reduce 10% by 2018
Allowance Price - $1.90
Offsets:
– 5 Project types accepted
– Allowance price too low for offsets
Page 37
Western Climate Initiative (WCI)
11 participants plus 13 “observers”
– Participants – 7 states and 4
Canadian provinces
– Observers – 6 states, 1 province and
6 Mexican states
Multi-dimensional approach, including
– Cap and Trade
– Low carbon fuel standards
– Renewable Portfolio Standard (RPS)
Expects mandatory programs to start
2012
Page 38
-Nice meeting all of you!
Mark van Soestbergen [email protected]
352 367 1144 tel
352 284 8221 mobile
Toward Climate Stability™