27
CARBONATE RESERVOIR EVALUATION USING ROCK PHYSICS Presented by - Pranshu Ratre 1

1
CARBONATE RESERVOIR EVALUATION USING
ROCK PHYSICS
Presented by - Pranshu Ratre

2
Contents• Introduction • Method• Case Study- Upper San Andreas Reservoir, Permian
Basin, west TexasGeologyData Analysis and InterpretationAVO and Impedance Inversion Modelling
• Conclusions• Reference

3
Introduction
• Carbonate Reservoir heterogeneity is due to: Complicated mineral compositionPore structure and rock texture variations (due to diagenesis)
• For a given mineral composition and fluid type, the complexity of pore type such as moldic, vuggy, interparticle, cracks and others, affects reservoir permeability heterogeneity and seismic velocity variation more strongly than porosity.
4
Introduction• A robust and practical rock physics model considering the
pore type variations was developed to understand the complicated relationship between acoustic properties and reservoir parameters
• This can also help in linking the rock properties with AVO responses
5
Method• To evaluate the reservoir, a rock physics model (Sun
model) based on the extended Biot’s theory of poroelasticity was used.
• In this model, a frame flexibility factor is introduced to characterize carbonate reservoir pore structure.
• The frame flexibility factor quantifies the effect of pore structure changes on seismic wave velocity and permeability heterogeneity in carbonate reservoirs.

6
Method• Vp, Vs and ρ are the compressional velocity, shear
velocity and bulk density respectively• K and μ are the bulk and shear modulus• Then frame flexibility factor γ is given by:
where,
γ, f, Fk : Frame flexibility
Factors (Sun model)
Ks, Kf : matrix and fluid bulk
Moduli respectively
Φ: porosity
7
Method• Carbonate reservoirs often have composite minerals such
as calcite and dolomite as well as anhydrite or quartz dependent on depositional environment
• Bulk modulus and bulk density calculations should consider the mineral components before computing the bulk frame flexibility factor.
• Mud filtrate invasion around the well bore is usually more
pervasive in carbonates than clastic rocks and the zones measured by sonic and bulk density well log are almost invasion zones with 100% water saturation

8
Method• Now in order to calculate the bulk γ, volume fraction of
mineral components and porosity must be determined.• This is done by solving :
where,
ρ : Bulk density from logs
Pe: photoelectric factor from logs
ρf, ρd, ρd : Bulk density of fluid, dolomite
and andhydrite respectively
Pef, Ped, Pea: Photoelctric factor of fluid
dolomite and anhydrite
9
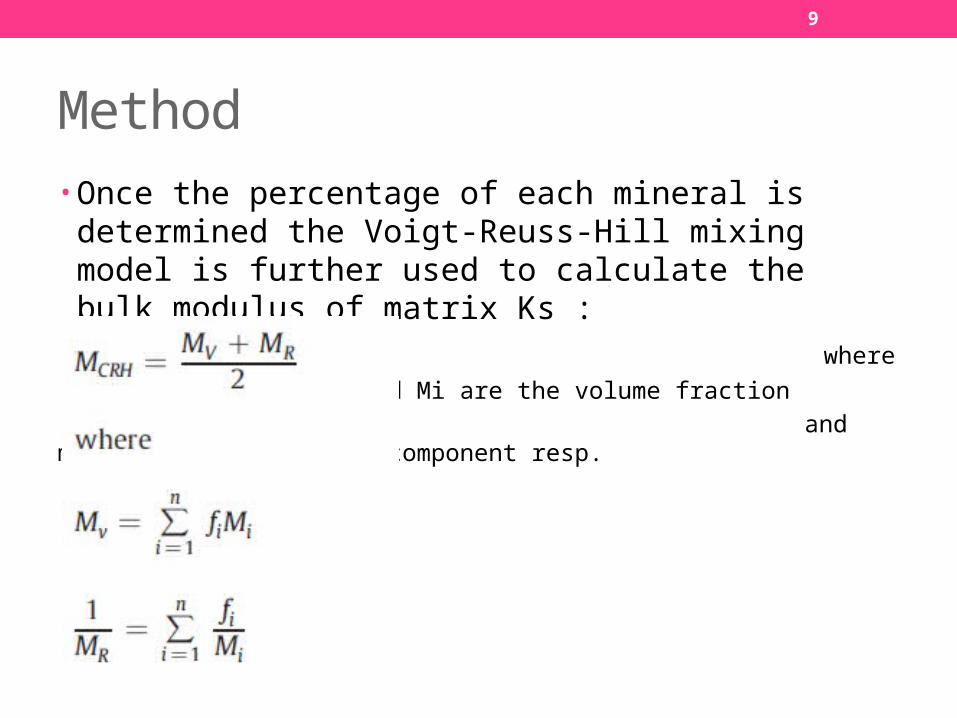
Method• Once the percentage of each mineral is determined the
Voigt-Reuss-Hill mixing model is further used to calculate the bulk modulus of matrix Ks :
where
fi and Mi are the volume fraction
and modulus of the mineral component resp.

10
Method• 2-layer forward AVO modelling is also performed to
evaluate the feasibility of applying pre-stack seismic data to estimate amplitude changes with an offset caused by pore type variation so that seismic inversion using both prestack and poststack data could be later carried out to obtain reservoir porosity and pore stricture parameter, gamma, in the inter well regions

11
Method• From angle stack and poststack data the elastic
impedance, AI and lambda can be calculated:
where,
EI: Elastic Impedance
AI: Acoustic Impedance
Lambda: Lame’s constant
K and μ : Bulk and Shear moduli
12
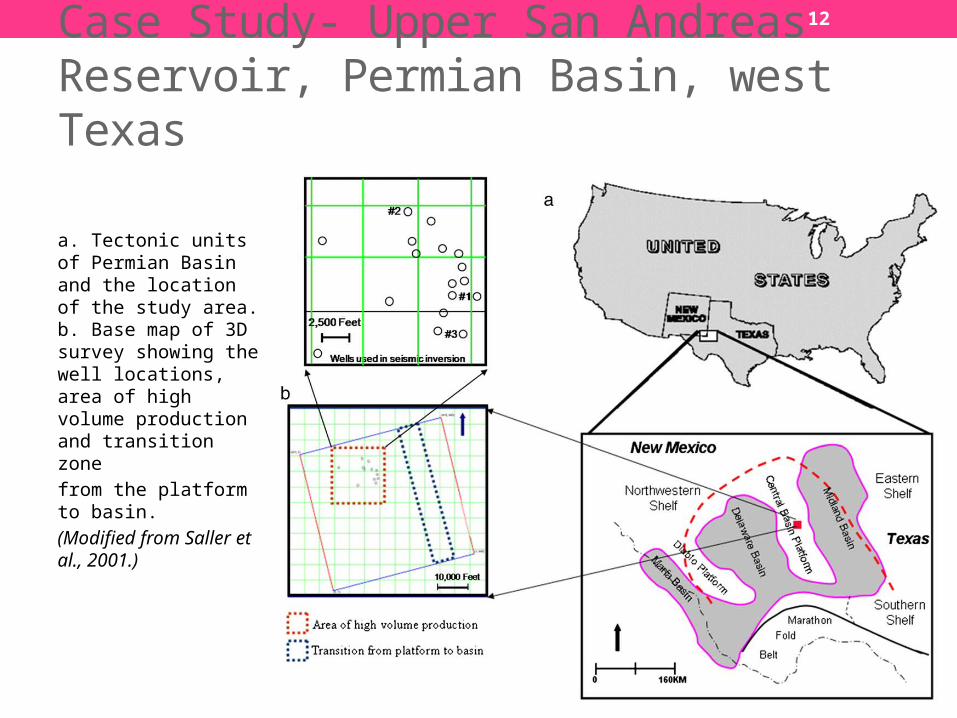
Case Study- Upper San Andreas Reservoir, Permian Basin, west Texas
a. Tectonic units of Permian Basin and the location of the study area. b. Base map of 3D survey showing the well locations, area of high volume production and transition zone
from the platform to basin.
(Modified from Saller et al., 2001.)

13
Geology• Core studies and analogy outcrop analyses show that the
San Andreas formation is an overall upward shallowing and basinal prograding unit, deposited on carbonate ramp.
• Homogeneous dolomudstone or the uniform mud-dominant dolowackstone, dolograinstone are the main rock types present
• Dolograinstone is oil stained and primary pore types are good visible biomoldic, vuggy and intraparticle
14
Data Analysis and Interpretation• Data set includes:
60 full diameter core porosity and permeability measurements
Core images
Conventional well log curves ( sonic, density, photoelectric, gamma, caliper, deep and shallow resistivities, neutron porosity)
• The frame flexibility factor is estimated from the density, porosity and the sonic log data.

15
Data Analysis and Interpretation
Fig: Cross-plot of P-wave against density porosity and color indicator is frame flexibility factor (γ), Well #1, which represents big scattering at the given porosity. The velocity variation at a given porosity can be represented by frame flexibility factor γ.

16
Data Analysis and Interpretation
Fig: Cross-plot of P-wave against density porosity and color indicator is frame flexibility factor (γ) as well, cored interval of Well #2. The core photos show rock texture and pore type variation for each specific sample, which are used to interpret the complex of porosity and P-wave velocity relationship.

17
Data Analysis and Interpretation• Higher percentage of micropore space in a carbonate
reservoir rock results in a weaker rock frame and lower velocity than in rocks with more macropore spaces.
• Such results indicate that the frame flexibility factor can be used to quantify the geological effects on porosity-velocity relations.
• Frame flexibility factor is also helpful in classifying trend lines for porosity-impedance relations, which is valuable in improving accuracy of porosity predictin from seismic inversion.

18
Data Analysis and Interpretation• Carbonate permeability heterogeneity could also be better
addressed by using both porosity and the fram flexibility factor
Fig:Cross-plot of core-porosity against core-permeability
and color indicator is frame flexibility factor (γ), cored interval of Well #2. In terms of frame flexibility factor γ, two trend lines can be generated so as to improve permeability prediction accuracy from porosity.
19
AVO and Impedance Inversion Modelling
• To evaluate the feasibility of inverting the frame flexibility factor and porosity simultaneously from prestack and poststack seismic data, we study the AVO response to pore type changes using a simple two-layer model by solving the full Zoeppritz equation.
• The two layer model consists of a shale layer overlying a dolomite reservoir with a porosity of ~10% are constructed for each pore type.
20
AVO and Impedance Inversion Modelling
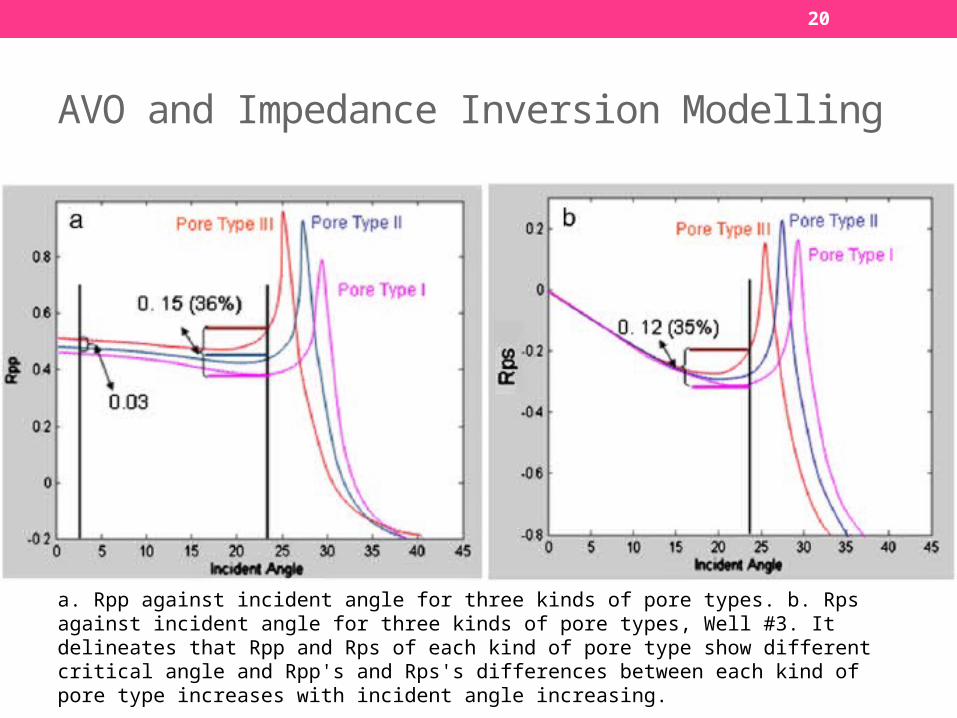
a. Rpp against incident angle for three kinds of pore types. b. Rps against incident angle for three kinds of pore types, Well #3. It delineates that Rpp and Rps of each kind of pore type show different critical angle and Rpp's and Rps's differences between each kind of pore type increases with incident angle increasing.

21
AVO and Impedance Inversion Modelling
• Different incident angles for both P-waves and reflected converted S-waves.
• Critical angle of each Rpp curves increases from PTIII to PTI.
• Similarly for Rps the difference between the pore type increases as the reflectino angle increases
• This analysis implies that the far offset seismic data is better to discriminate the pore type variations in carbonate reservoirs than the near offset seismic data.

22
AVO and Impedance Inversion Modelling
Fig: “γ” calculation by using rock physics model against “γ” prediction from EI, AI and Lambda, representing a good agreement between the calculation in two different methods.

23
AVO and Impedance Inversion Modelling
• Conventional Acoustic impedance inversion gives porosity and not the spatial and vertical variations of pore structure and pore types.
• In highly heterogeneous carbonate reservoirs, SI inversion cannot estimate porosity accurately without taking into account the pore type variations.
• AVO modelling reveals that pore type have a large influence on AVO response especially for large offset.
24
Conclusions• Variations in pore type, rock texture and mineral
composition are the major causes for poor porosity-velocity and porosity-permeability relationships.
• The case study on San Andreas Carbonate reservoir validates the importance of frame flexibility factor (γ) in understanding the porosity-velocity complexity
• It also helps in improving the porosity and permeability prediction accuracy in carbonate reservoirs

25
Conclusions• The frame flexibility factor can be used to characterize
carbonate rock pore types and high permeability zones. In the case study frame flexibility factor and sonic velocities have inverse relationship.
• Forward modelling of AVO response to pore type variation and impedance inversion tests at well locations reveal that 3-D seismic pre-stack or angle stack inversion holds potential for the evaluation of carbonate pore type complexity and permeability heterogeneity in the inter-well regions

26
Reference
Qifeng Dou, Yuefeng Sun, Charlotte Sullivan, Rock-Physics-based carbonate pore type characterization and reservoir permeability heterogeneity evaluation, Upper San Andreas, Permian Basin, west Texas (2011); Journal of Geophysics

27
THANK YOU! QUESTION?


