16
C arbon brainprint case study Ceramic coatings for jet engine turbine blades

Carbon brainprint case study
Ceramic coatings for jetengine turbine blades

w
footprinting.
Centre for Environmental Risks and FuturesBuilding 42Cranfield UniversityCranfieldBedfordMK43 9PB
Copyright © 2011 Cranfield Universitywww.carbcarbonbrainp
ww.cranfield.ac.ukonbrainprint.org.uk
The Carbon Brainprint project was supported by HEFCE under its Leading SustainableDevelopment in Higher Education programme, with support for case studies fromSantander Universities. Research Councils UK and the Carbon Trust were members ofthe steering group, and the Carbon Trust advised on best practice in carbon
Carbon Brainprint Ceramic coatings for jet engine turbine blades
Page 1 of 14
Carbon Brainprint Case Study
Ceramic coatings for jet engine turbine blades
Analysis: David Parsons and Julia ChattertonSchool of Applied Sciences, Cranfield University
Case study expert: Professor John Nicholls,School of Applied Sciences, Cranfield University
July 2011
ContentsContents........................................................................................................................................... 1
Summary.......................................................................................................................................... 2
General description ......................................................................................................................... 3
System boundaries.......................................................................................................................... 5
Data.................................................................................................................................................. 6
Fuel consumption........................................................................................................................ 6
Combustion and life cycle emissions from jet fuel..................................................................... 7
Combustion ............................................................................................................................. 7
Extraction and refining ............................................................................................................ 8
Transport ................................................................................................................................. 9
Aircraft movements...................................................................................................................... 9
Aircraft numbers ........................................................................................................................10
Brainprint........................................................................................................................................10
Baseline emissions....................................................................................................................10
Retrospective brainprint ............................................................................................................11
Prospective brainprint................................................................................................................11
Uncertainties..............................................................................................................................12
References.....................................................................................................................................14
Carbon Brainprint Ceramic coatings for jet engine turbine blades
Page 2 of 14
SummaryCeramic thermal barrier coatings (TBCs) are applied to jet turbine blades to protect them fromthe high temperature gases leaving the combustion chamber and to increase the efficiency ofthe engine. Professor John Nicholls of the Surface Science and Engineering Group, CranfieldUniversity has been working with Rolls-Royce plc for about 17 years to improve the insulatingperformance of TBCs. As a result, the TBCs used in the current generation of aircraft turbofanjet engines achieve a temperature drop about 80 ºC greater than at the start of the work, withan estimated fuel saving of about 1%.
This case study considered two engine types: Trent 700, used on about half the Airbus A330aircraft currently in service, and Trent 500, used on all Airbus A340-500 and A360-600 aircraft.The greenhouse gas emissions considered were, in order of magnitude, carbon dioxide fromcombustion of the fuel, emissions during extraction and refining of the fuel, and emissions ofother greenhouse gases during combustion. Emissions associated with transport of the fuelwere found to be negligible compared with these, and all emissions not related to fuelconsumption, for example manufacture of the coating, were also assumed to be insignificant orexcluded from the assessment because they were unaffected by the change in the TBC.
The baseline fuel consumption during each flight phase (landing and take-off cycle and cruise)was estimated from publicly available data. Airline activity data for A330 and A340 models fromEuropean operators was taken to represent typical patterns of use, enabling annual emissionsper aircraft to be calculated. Data on current operating aircraft and orders were then used toestimate the total current and projected future emissions. From these, the higher emissionsthat would have occurred in the past if the improved TBCs had not been used, and thecorresponding future emissions, were estimated.
The best estimates of the current emissions (the retrospective brainprint) for individual aircraftwere 1016, 1574 and 1646 t CO2e/year for A330, A340-500 and A340-600 respectively, giving568 kt CO2e/year for the total fleet. Including all the aircraft on order, the prospective emissionsreduction was 833 kt CO2e/year. Assuming a service life of 20 years, the total brainprint wasapproximately 17 Mt CO2e.
An uncertainty analysis was performed with assumed uncertainties for aircraft activity, fuelconsumption and the efficiency change. The 95% confidence interval for the current annualemissions reduction was 429–721 kt CO2e/year excluding the efficiency change uncertainty,and 258–1105 if it was included. The relative changes in the other output measures weresimilar. Assuming that older engines do not and will not benefit from the improvement, reducedthe total brainprint to 14 Mt CO2e. The assessment did not include an adjustment for the effectof emissions at high altitude, which would increase all the outputs by a factor of 1.9.
Carbon Brainprint Ceramic coatings for jet engine turbine blades
Page 3 of 14
General descriptionThis study concerned the high pressure turbine blades located immediately behind thecombustion chamber of a jet engine (Figure 1), where the temperature exceeds the meltingpoint of the alloy used in the blades. The temperature in the combustion chamber is about2000 C and, after mixing with cooling air, the temperature of the gases reaching the turbine is1400–1500 C, whereas the nickel super alloy used in the blades melts at 1300 C (Rolls-Royce,2007). Although we will consider only aircraft jet engines, the same technology is used in othergas turbines, such as static engines in power stations.
Figure 1. Cutaway view of Rolls-Royce Trent XWB jet turbineThis photograph is reproduced with the permission of Rolls-Royce plc, copyright © Rolls-Royce plc 2010
Two methods are used to protect the blades: internal passages through which air from thecompressor is forced from the blade root allowing it to form a layer over the blade surface, andceramic thermal barrier coatings (TBCs) to insulate and protect them (Figure 2). The benefits ofTBCs can be realised in different ways. Less cooling air is required to operate at the sameblade temperature, so less power is used by cooling, increasing the efficiency to deliver thesame power from less fuel, or deliver more power from the same fuel. Alternatively, the samevolume of air can be used, reducing the temperature and increasing the life of the blades.
High pressureturbine
Combustionchamber
Carbon Brainprint Ceramic coatings for jet engine turbine blades
Page 4 of 14
Figure 2. Rolls-Royce jet turbine blade with (a) ceramic coating (white) and (b) outlets forcooling air.Figure 2a is reproduced with the permission of Rolls-Royce plc, copyright © Rolls-Royce plc2010
The involvement of Cranfield began about 17 years with an approach to Professor Nichollsfrom Rolls Royce, who held the patents on the coatings then in use. They have since beendeveloped through a series of contracts, with the first paper published in 1998. Othermanufacturers and universities have also been developing TBCs. Before Cranfield startedworking with Rolls Royce, the temperature drop achieved by the TBC was about 70 C; now it isover 150 C from a 200 μm coating. Coatings of this type are used in all Rolls-Royce Trent series large aircraft engines, found in several Airbus and Boeing models. It has been estimatedthat these could save a carrier the size of British Airways £25M/year in fuel costs (Rolls-Royceplc, personal communication via J. Nicholls). Professor Nicholls’ aim is to increase thetemperature drop to 200 C, equivalent to a further £35M/year saving, by improving theinsulation and near infra-red reflectance.
Because all modern Trent engines have adopted the new coatings, it was necessary to adoptan inverted baseline approach for this study. The baseline was current engines and aircraft withthe current generation of TBCs. Emissions estimates were made for these aircraft using dataon fuel consumption and annual use. This was compared with a counterfactual in which theengines delivered the same power without the improved TBCs and therefore had higher fuelconsumption. This enabled assessment of the past change in emissions, which were projectedforward to estimate the continued change in emissions from this generation of aircraft engines.
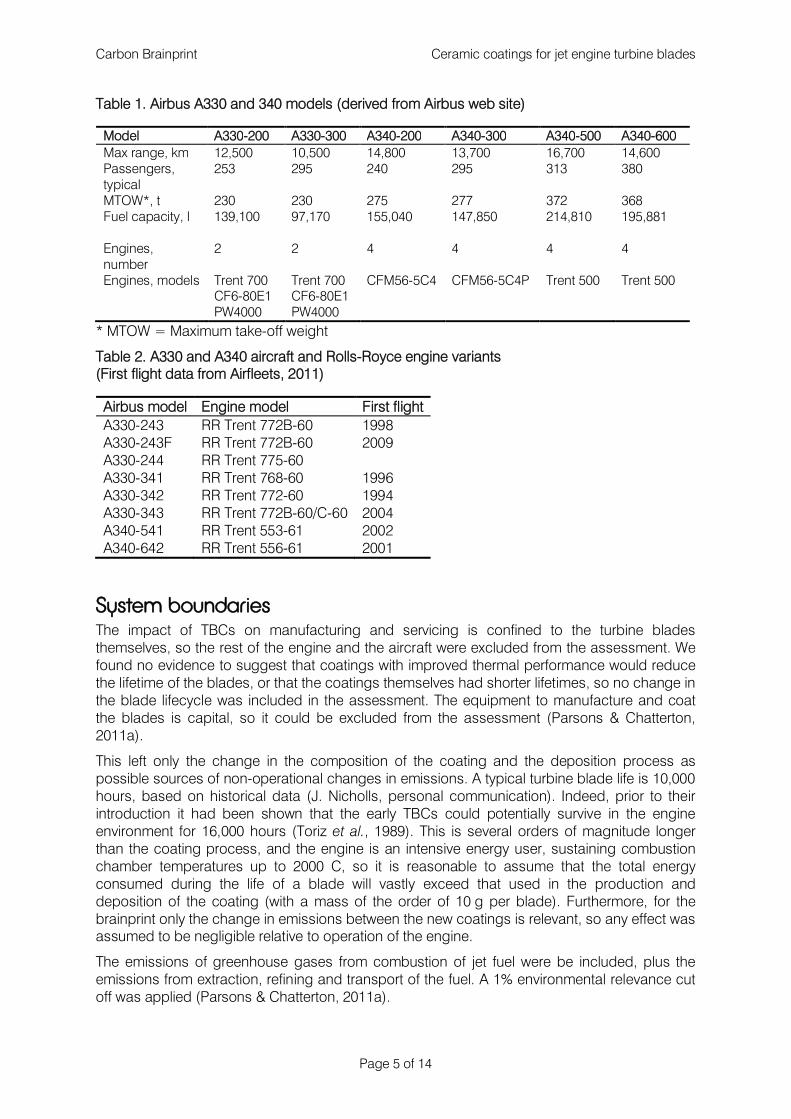
This study considered two models of engine: the Trent 700, first introduced in 1995 and used inall models of the Airbus A330, and the Trent 500, introduced in 2002 and used on the A340-500and A340-600 (Table 1, Table 2).
Carbon Brainprint Ceramic coatings for jet engine turbine blades
Page 5 of 14
Table 1. Airbus A330 and 340 models (derived from Airbus web site)
Model A330-200 A330-300 A340-200 A340-300 A340-500 A340-600
Max range, km 12,500 10,500 14,800 13,700 16,700 14,600Passengers,typical
253 295 240 295 313 380
MTOW*, t 230 230 275 277 372 368Fuel capacity, l 139,100 97,170 155,040 147,850 214,810 195,881
Engines,number
2 2 4 4 4 4
Engines, models Trent 700CF6-80E1PW4000
Trent 700CF6-80E1PW4000
CFM56-5C4 CFM56-5C4P Trent 500 Trent 500
* MTOW = Maximum take-off weight
Table 2. A330 and A340 aircraft and Rolls-Royce engine variants(First flight data from Airfleets, 2011)
Airbus model Engine model First flight
A330-243 RR Trent 772B-60 1998A330-243F RR Trent 772B-60 2009A330-244 RR Trent 775-60A330-341 RR Trent 768-60 1996A330-342 RR Trent 772-60 1994A330-343 RR Trent 772B-60/C-60 2004A340-541 RR Trent 553-61 2002A340-642 RR Trent 556-61 2001
System boundariesThe impact of TBCs on manufacturing and servicing is confined to the turbine bladesthemselves, so the rest of the engine and the aircraft were excluded from the assessment. Wefound no evidence to suggest that coatings with improved thermal performance would reducethe lifetime of the blades, or that the coatings themselves had shorter lifetimes, so no change inthe blade lifecycle was included in the assessment. The equipment to manufacture and coatthe blades is capital, so it could be excluded from the assessment (Parsons & Chatterton,2011a).
This left only the change in the composition of the coating and the deposition process aspossible sources of non-operational changes in emissions. A typical turbine blade life is 10,000hours, based on historical data (J. Nicholls, personal communication). Indeed, prior to theirintroduction it had been shown that the early TBCs could potentially survive in the engineenvironment for 16,000 hours (Toriz et al., 1989). This is several orders of magnitude longerthan the coating process, and the engine is an intensive energy user, sustaining combustionchamber temperatures up to 2000 C, so it is reasonable to assume that the total energyconsumed during the life of a blade will vastly exceed that used in the production anddeposition of the coating (with a mass of the order of 10 g per blade). Furthermore, for thebrainprint only the change in emissions between the new coatings is relevant, so any effect wasassumed to be negligible relative to operation of the engine.
The emissions of greenhouse gases from combustion of jet fuel were be included, plus theemissions from extraction, refining and transport of the fuel. A 1% environmental relevance cutoff was applied (Parsons & Chatterton, 2011a).
Carbon Brainprint Ceramic coatings for jet engine turbine blades
Page 6 of 14
Data
Fuel consumption
Three methods are used to calculate the emissions from aircraft for national inventories(EMEP/EEA, 2009). Tier 1 and Tier 2 are fuel based. Tier 1 uses total fuel sales divided intodomestic and international flights, with total numbers of landings and take-offs (LTO) assumingan average fleet mix and average emission factors for LTO and cruise. Tier 2 refines the databy aircraft types. Tier 3 uses aircraft type and distance data for each flight with specific aircrafttype emission data provided by EMEP/EEA. As this study related to specific engine, and henceaircraft, models, and fuel use data are not publicly available at this level of detail, a simplifiedversion of the Tier 3 method was used. A more detailed method has been produced for Defra(Watterson et al., 2010), but this is based on movement data for specific airports by aircrafttype, which would have been to detailed for this study.
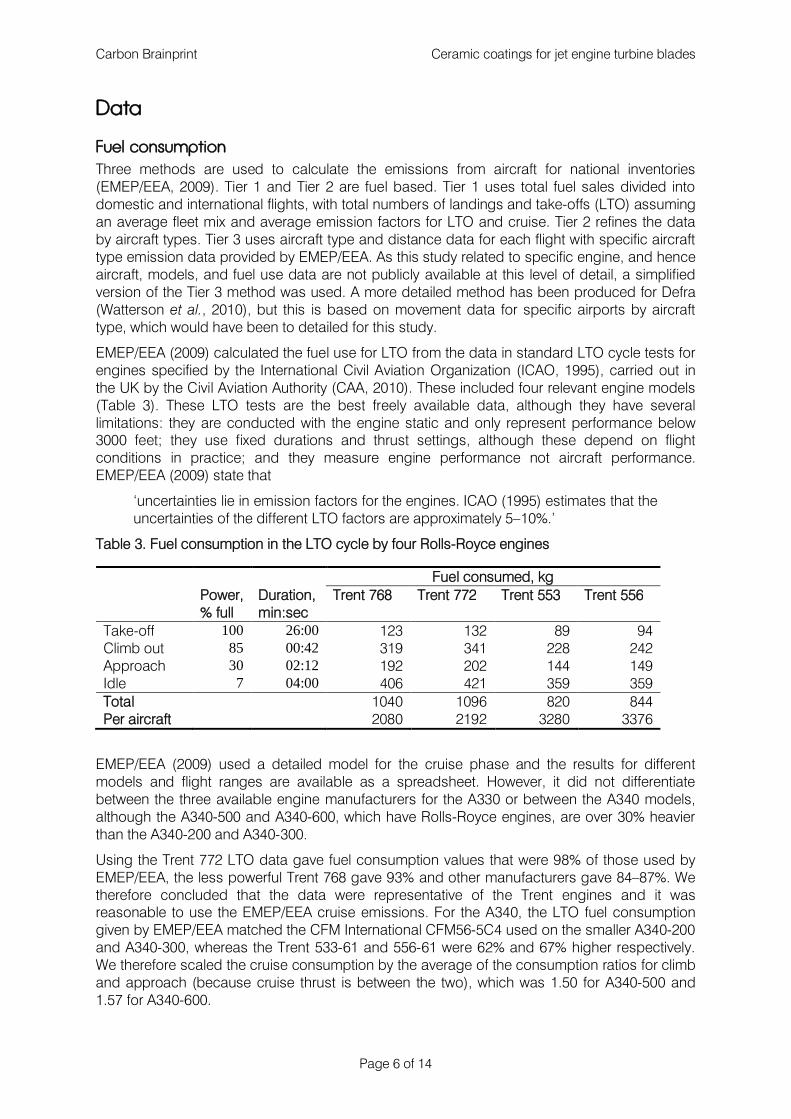
EMEP/EEA (2009) calculated the fuel use for LTO from the data in standard LTO cycle tests forengines specified by the International Civil Aviation Organization (ICAO, 1995), carried out inthe UK by the Civil Aviation Authority (CAA, 2010). These included four relevant engine models(Table 3). These LTO tests are the best freely available data, although they have severallimitations: they are conducted with the engine static and only represent performance below3000 feet; they use fixed durations and thrust settings, although these depend on flightconditions in practice; and they measure engine performance not aircraft performance.EMEP/EEA (2009) state that
‘uncertainties lie in emission factors for the engines. ICAO (1995) estimates that theuncertainties of the different LTO factors are approximately 5–10%.’
Table 3. Fuel consumption in the LTO cycle by four Rolls-Royce engines
Fuel consumed, kgPower,% full
Duration,min:sec
Trent 768 Trent 772 Trent 553 Trent 556
Take-off 100 26:00 123 132 89 94Climb out 85 00:42 319 341 228 242Approach 30 02:12 192 202 144 149Idle 7 04:00 406 421 359 359Total 1040 1096 820 844Per aircraft 2080 2192 3280 3376
EMEP/EEA (2009) used a detailed model for the cruise phase and the results for differentmodels and flight ranges are available as a spreadsheet. However, it did not differentiatebetween the three available engine manufacturers for the A330 or between the A340 models,although the A340-500 and A340-600, which have Rolls-Royce engines, are over 30% heavierthan the A340-200 and A340-300.
Using the Trent 772 LTO data gave fuel consumption values that were 98% of those used byEMEP/EEA, the less powerful Trent 768 gave 93% and other manufacturers gave 84–87%. Wetherefore concluded that the data were representative of the Trent engines and it wasreasonable to use the EMEP/EEA cruise emissions. For the A340, the LTO fuel consumptiongiven by EMEP/EEA matched the CFM International CFM56-5C4 used on the smaller A340-200and A340-300, whereas the Trent 533-61 and 556-61 were 62% and 67% higher respectively.We therefore scaled the cruise consumption by the average of the consumption ratios for climband approach (because cruise thrust is between the two), which was 1.50 for A340-500 and1.57 for A340-600.

Carbon Brainprint Ceramic coatings for jet engine turbine blades
Page 7 of 14
To permit the use of cruise distances between those tabulated by EMEP/EEA, linearregressions for consumption against distance were fitted to the data for flights over 1000 km.This range was used because the relationship was nonlinear for short ranges, and these arelong-haul aircraft. These gave for the A330
fc = 6.57 (x - 75.28), 1
for the A340
fc = 6.99 (x - 107.45), 2
adjusted by the factors above for A340-500 and A340-600. EPEM/EEA state ‘For cruise, theuncertainties are assumed to be 15–40%.’ The errors in the regression were less than 5%.
Combustion and life cycle emissions from jet fuel
Combustion
The standard emission factor for combustion of jet fuel is 3.155 kg CO2/kg fuel (UNFCC, 1996).There are two main areas of debate over emissions from aircraft engines: emissions other thancarbon-dioxide and the effect of altitude:
The emission factors refer to aviation’s direct carbon dioxide (CO2), methane (CH4)and nitrous oxide (N2O) emissions only. There is currently uncertainty over the othernon-CO2 climate change effects of aviation (including water vapour, contrails, NOxetc) which may indicatively be accounted for by applying a multiplier. Theappropriate factor to apply is subject to uncertainty but was estimated by the IPCCin 1999 to be in the range 2-4, with current best scientific evidence suggesting afactor of 1.9. (AEA, 2010)
PAS2050 (BSI, 2008) says:
No multiplier or other correction shall be applied to the GWP of emissions arisingfrom aircraft transport. Note The application of a multiplier for aircraft emissions willbe given further consideration in future revisions of this PAS, once there is scientificconsensus regarding the approach to be taken.
This study followed this approach, so probably underestimated the impact of improvedefficiency.
The LTO cycle tests record total hydrocarbons (HC), oxides of nitrogen (NOx) and carbonmonoxide (CO) emissions. Methane is usually assumed to be 10% of total hydrocarbonsduring LTO and nitrous oxide is 0.5–1.25% of total NOx during LTO (EMEP/EEA, 2009); for thisstudy it was assumed to be 1%. Using these factors, the non-carbon dioxide greenhouse gasemissions were derived from the LTO data (Table 4), converted to global warming potentialusing standard global warming factors (IPCC, 2007), then combined with carbon-dioxideemissions to give a net emission factor of 3.22 kg CO2e/kg fuel for all four engine models.

Carbon Brainprint Ceramic coatings for jet engine turbine blades
Page 8 of 14
Table 4. Greenhouse gas emissions during LTO
Engine 768 772 553 556
Fuel consumed, kg 1040 1096 820 844HC emitted, g 752 735 60 57NOx emitted, g 18672 21462 14444 16167CO emitted, g 4496 4175 3979 3762CH4 emitted, g 75 74 6 6N2O emitted, g 187 215 144 162Total non-CO2, as kg CO2e 66 74 51 55CO2 emitted, kg 3281 3458 2587 2663Total emission factor, kg CO2e/kgfuel
3.22 3.22 3.22 3.22
It is usually assumed that there are no methane emissions during cruise, and a constantemission factor of 0.1 g/kg fuel is used for nitrous oxide (EMEP/EEA, 2009), giving29.8 g CO2e/kg fuel, which is less than 1% of the carbon dioxide emissions, so it was omittedfrom the assessment.
For flights over 1000 km the emission factors from EMEP/EAA for carbon monoxide duringclimb, cruise and descent are 1.32–1.71 g/kg for A330 and 0.91–2.82 g/kg for A340. As theEMEP/EAA data appear to be based on the smaller A340 models with CFM engines, and theLTO data show that Trent 500 engines have approximately half the carbon monoxide emissionsof these climb and descent, it is likely that the emissions during cruise are similarly reduced.The GWP100 of carbon monoxide is 1.9, so these emissions are well below 1% of carbondioxide were also omitted from the assessment.
The standard emission factor of 3.155 kg CO2/kg fuel was therefore used for cruise.
Extraction and refining
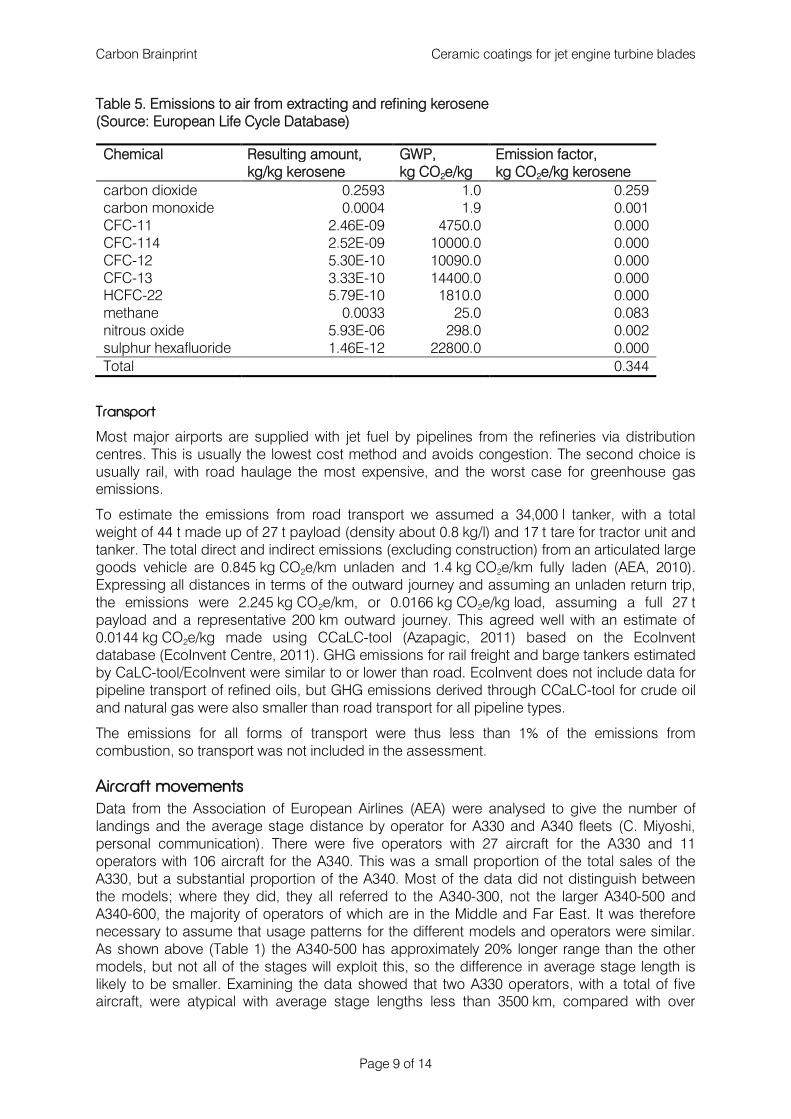
In addition to the direct emissions, there are indirect emissions from extracting and refiningfuel. These are not included in the standard emission factor, because they appear elsewhere inthe national inventory. We calculated the greenhouse gas emissions to air from the data forextraction and refining of kerosene in the European Life Cycle Database (ELCD, 2010) usingIPCC global warming potentials (IPCC, 2007), giving a total of 0.344 kg CO2e/kg (Table 5).Using CCaLC-tool (Azapagic, 2011) with the built-in ELCD database gave a similar value (0.343kg CO2e/kg). However, with the EcoInvent database (EcoInvent Centre, 2011) it gave 0.482kg CO2e/kg for the ‘European average, at refinery’ case. The Defra/DECC guidelines (AEA,2010) give a value of 0.563 kg CO2e/kg for Scope 3 emissions from kerosene, which includeproduction and transport. We were unable to determine the reason for the differences betweenthese sources, so the most conservative estimate based on the ELCD was used in theassessment.
Carbon Brainprint Ceramic coatings for jet engine turbine blades
Page 9 of 14
Table 5. Emissions to air from extracting and refining kerosene(Source: European Life Cycle Database)
Chemical Resulting amount,kg/kg kerosene
GWP,kg CO2e/kg
Emission factor,kg CO2e/kg kerosene
carbon dioxide 0.2593 1.0 0.259carbon monoxide 0.0004 1.9 0.001CFC-11 2.46E-09 4750.0 0.000CFC-114 2.52E-09 10000.0 0.000CFC-12 5.30E-10 10090.0 0.000CFC-13 3.33E-10 14400.0 0.000HCFC-22 5.79E-10 1810.0 0.000methane 0.0033 25.0 0.083nitrous oxide 5.93E-06 298.0 0.002sulphur hexafluoride 1.46E-12 22800.0 0.000Total 0.344
Transport
Most major airports are supplied with jet fuel by pipelines from the refineries via distributioncentres. This is usually the lowest cost method and avoids congestion. The second choice isusually rail, with road haulage the most expensive, and the worst case for greenhouse gasemissions.
To estimate the emissions from road transport we assumed a 34,000 l tanker, with a totalweight of 44 t made up of 27 t payload (density about 0.8 kg/l) and 17 t tare for tractor unit andtanker. The total direct and indirect emissions (excluding construction) from an articulated largegoods vehicle are 0.845 kg CO2e/km unladen and 1.4 kg CO2e/km fully laden (AEA, 2010).Expressing all distances in terms of the outward journey and assuming an unladen return trip,the emissions were 2.245 kg CO2e/km, or 0.0166 kg CO2e/kg load, assuming a full 27 tpayload and a representative 200 km outward journey. This agreed well with an estimate of0.0144 kg CO2e/kg made using CCaLC-tool (Azapagic, 2011) based on the EcoInventdatabase (EcoInvent Centre, 2011). GHG emissions for rail freight and barge tankers estimatedby CaLC-tool/EcoInvent were similar to or lower than road. EcoInvent does not include data forpipeline transport of refined oils, but GHG emissions derived through CCaLC-tool for crude oiland natural gas were also smaller than road transport for all pipeline types.
The emissions for all forms of transport were thus less than 1% of the emissions fromcombustion, so transport was not included in the assessment.
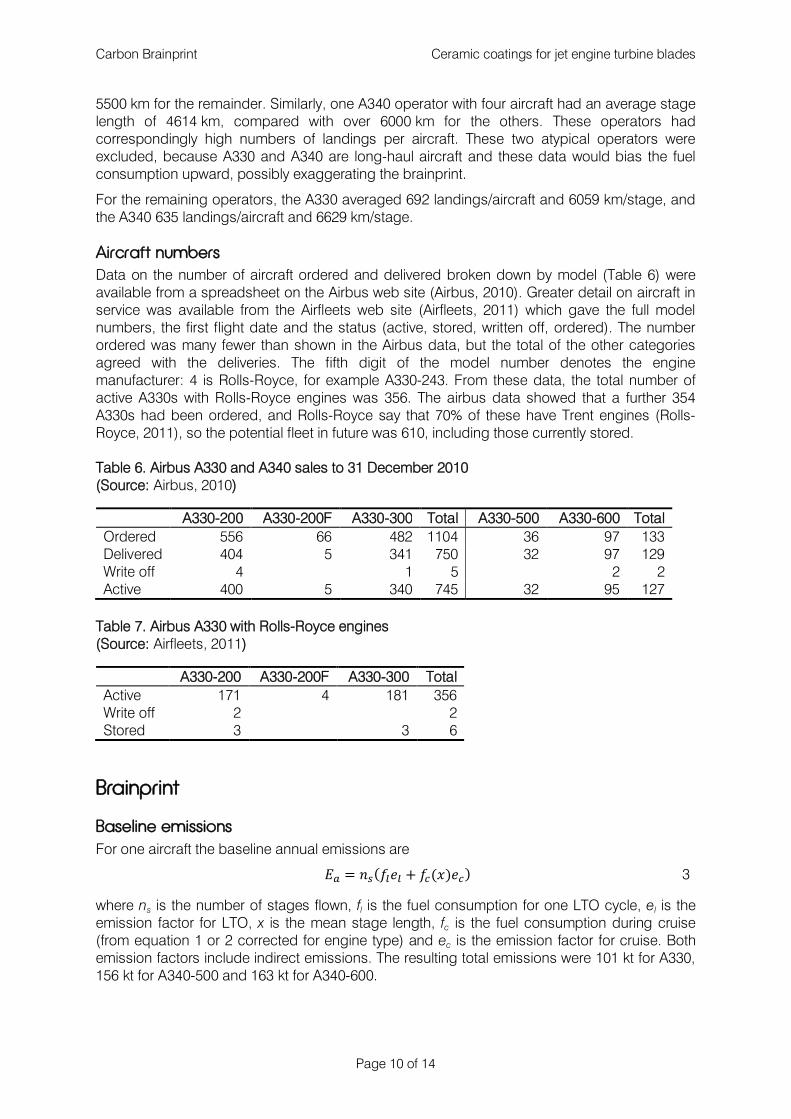
Aircraft movements
Data from the Association of European Airlines (AEA) were analysed to give the number oflandings and the average stage distance by operator for A330 and A340 fleets (C. Miyoshi,personal communication). There were five operators with 27 aircraft for the A330 and 11operators with 106 aircraft for the A340. This was a small proportion of the total sales of theA330, but a substantial proportion of the A340. Most of the data did not distinguish betweenthe models; where they did, they all referred to the A340-300, not the larger A340-500 andA340-600, the majority of operators of which are in the Middle and Far East. It was thereforenecessary to assume that usage patterns for the different models and operators were similar.As shown above (Table 1) the A340-500 has approximately 20% longer range than the othermodels, but not all of the stages will exploit this, so the difference in average stage length islikely to be smaller. Examining the data showed that two A330 operators, with a total of fiveaircraft, were atypical with average stage lengths less than 3500 km, compared with over
Carbon Brainprint Ceramic coatings for jet engine turbine blades
Page 10 of 14
5500 km for the remainder. Similarly, one A340 operator with four aircraft had an average stagelength of 4614 km, compared with over 6000 km for the others. These operators hadcorrespondingly high numbers of landings per aircraft. These two atypical operators wereexcluded, because A330 and A340 are long-haul aircraft and these data would bias the fuelconsumption upward, possibly exaggerating the brainprint.
For the remaining operators, the A330 averaged 692 landings/aircraft and 6059 km/stage, andthe A340 635 landings/aircraft and 6629 km/stage.
Aircraft numbers
Data on the number of aircraft ordered and delivered broken down by model (Table 6) wereavailable from a spreadsheet on the Airbus web site (Airbus, 2010). Greater detail on aircraft inservice was available from the Airfleets web site (Airfleets, 2011) which gave the full modelnumbers, the first flight date and the status (active, stored, written off, ordered). The numberordered was many fewer than shown in the Airbus data, but the total of the other categoriesagreed with the deliveries. The fifth digit of the model number denotes the enginemanufacturer: 4 is Rolls-Royce, for example A330-243. From these data, the total number ofactive A330s with Rolls-Royce engines was 356. The airbus data showed that a further 354A330s had been ordered, and Rolls-Royce say that 70% of these have Trent engines (Rolls-Royce, 2011), so the potential fleet in future was 610, including those currently stored.
Table 6. Airbus A330 and A340 sales to 31 December 2010(Source: Airbus, 2010)
A330-200 A330-200F A330-300 Total A330-500 A330-600 Total
Ordered 556 66 482 1104 36 97 133Delivered 404 5 341 750 32 97 129Write off 4 1 5 2 2Active 400 5 340 745 32 95 127
Table 7. Airbus A330 with Rolls-Royce engines(Source: Airfleets, 2011)
A330-200 A330-200F A330-300 Total
Active 171 4 181 356Write off 2 2Stored 3 3 6
Brainprint
Baseline emissions
For one aircraft the baseline annual emissions are
ܧ ൌ ௦݊( ݂݁ ݂ሺݔሻ݁ ) 3
where ns is the number of stages flown, fl is the fuel consumption for one LTO cycle, el is theemission factor for LTO, x is the mean stage length, fc is the fuel consumption during cruise(from equation 1 or 2 corrected for engine type) and ec is the emission factor for cruise. Bothemission factors include indirect emissions. The resulting total emissions were 101 kt for A330,156 kt for A340-500 and 163 kt for A340-600.
Carbon Brainprint Ceramic coatings for jet engine turbine blades
Page 11 of 14
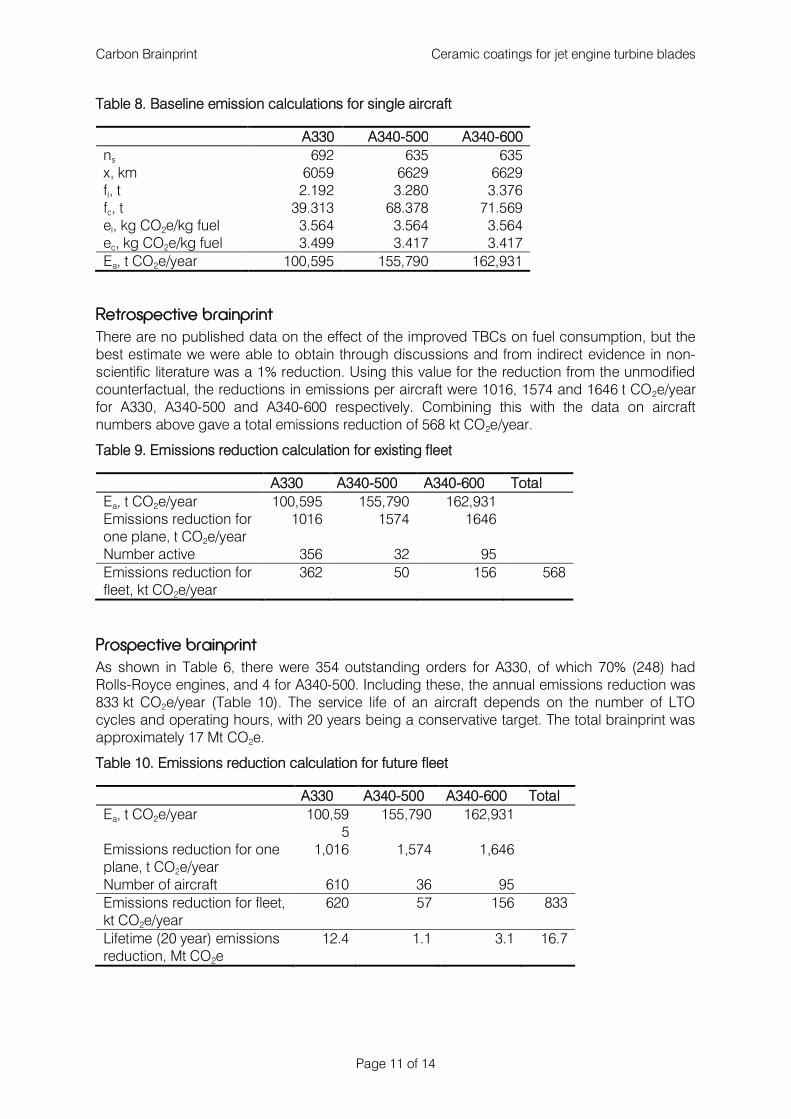
Table 8. Baseline emission calculations for single aircraft
A330 A340-500 A340-600
ns 692 635 635x, km 6059 6629 6629fl, t 2.192 3.280 3.376fc, t 39.313 68.378 71.569el, kg CO2e/kg fuel 3.564 3.564 3.564ec, kg CO2e/kg fuel 3.499 3.417 3.417Ea, t CO2e/year 100,595 155,790 162,931
Retrospective brainprint
There are no published data on the effect of the improved TBCs on fuel consumption, but thebest estimate we were able to obtain through discussions and from indirect evidence in non-scientific literature was a 1% reduction. Using this value for the reduction from the unmodifiedcounterfactual, the reductions in emissions per aircraft were 1016, 1574 and 1646 t CO2e/yearfor A330, A340-500 and A340-600 respectively. Combining this with the data on aircraftnumbers above gave a total emissions reduction of 568 kt CO2e/year.
Table 9. Emissions reduction calculation for existing fleet
A330 A340-500 A340-600 Total
Ea, t CO2e/year 100,595 155,790 162,931Emissions reduction forone plane, t CO2e/year
1016 1574 1646
Number active 356 32 95Emissions reduction forfleet, kt CO2e/year
362 50 156 568
Prospective brainprint
As shown in Table 6, there were 354 outstanding orders for A330, of which 70% (248) hadRolls-Royce engines, and 4 for A340-500. Including these, the annual emissions reduction was833 kt CO2e/year (Table 10). The service life of an aircraft depends on the number of LTOcycles and operating hours, with 20 years being a conservative target. The total brainprint wasapproximately 17 Mt CO2e.
Table 10. Emissions reduction calculation for future fleet
A330 A340-500 A340-600 Total
Ea, t CO2e/year 100,595
155,790 162,931
Emissions reduction for oneplane, t CO2e/year
1,016 1,574 1,646
Number of aircraft 610 36 95Emissions reduction for fleet,kt CO2e/year
620 57 156 833
Lifetime (20 year) emissionsreduction, Mt CO2e
12.4 1.1 3.1 16.7
Carbon Brainprint Ceramic coatings for jet engine turbine blades
Page 12 of 14
Uncertainties
There is some uncertainty about the number of engines using the improved coatings, giventhat the first Trent 700s were manufactured around the time that the research began. The Trent500 is comparatively recent, so it is reasonable to assume that all those in service in A340aircraft use the new coatings. Turbine blades have a typical service life of about 10,000 hours,or less than 3 years given the operating hours for these aircraft. It is therefore possible that thenew blades have been fitted to existing Trent 700 engines, but this would not in itself save fuel,unless the operation of the engine was adjusted to take advantage of it. However, there is aclear financial incentive to do so. The total number active is thus the best estimate, but aconservative lower bound would be those A330-x4x aircraft that entered service from 2005onwards. The Airfleets data show that there are 229 active and 3 stored, making a potentialfuture fleet of 480 using the same estimate of future deliveries as above. Using these estimatesreduced the total emissions reductions to 439 and 701 kt CO2e/year for the current andpotential fleets respectively and the total prospective brainprint to 14 Mt CO2e.
If the emissions factor discussed above for emissions at high altitude were included, all theresults would be increased by a factor of 1.9, or slightly less if it were applied to cruise only.
The main remaining sources of uncertainty – fuel consumption, aircraft use and performanceeffects of the TBCs – were included in an uncertainty analysis by Monte-Carlo simulation.
According to EMEP/EEA (2009)
Uncertainties lie in emission factors for the engines. ICAO (1995) estimates that theuncertainties of the different LTO factors are approximately 5–10%. For cruise, theuncertainties are assumed to be 15–40%.
We were unable to find the first statement in ICAO (1995), to find a justification for the second,or to find an explanation of how to interpret a range of uncertainties. The limitations of using theLTO test data for predicting performance in service noted in the Fuel Consumption section addan additional uncertainty to the LTO consumption. The uncertainty analysis used 20% for LTO,to allow for other sources of uncertainty, and 30% for cruise. In the absence of otherinformation, a normal distribution was assumed and the range was interpreted as representingtwo standard deviations, following the IPCC good practice guide (IPCC, 2000), which says thatthere should be a 95% confidence that the value of a variable is within the limits given.
The limitations of the aircraft movement data were noted earlier. There were no data for thefreight variant (A330-200F), so the same pattern was assumed; with only 5 in service this wouldhave little effect on the retrospective results, but could have more influence on the prospectivebrainprint. The number of landings and the mean stage distance are negatively correlated, so itwas not appropriate to vary these independently. The number of landings and mean stagelength for each operator in the data set were used to calculate their emissions, giving adistribution of emissions from which the coefficient of variation was calculated to be 7.4% forthe A330 and 7.9% for the A340. These excluded the within-operator variability, so 10% wasused for A330 and 20% for A340, because the activity data were not for the models underinvestigation. Again, a normal distribution was assumed.
Given the absence of published data on the effect of the improved TBCs, a large uncertaintywas assumed: a factor of 2 in each direction, that is from 0.5% to 2.0%. As the uncertainty wasdefined multiplicatively, a lognormal distribution was used, with mean 1.0 and standarddeviation 0.35, to give 95% confidence that its value was between the bounds chosen.
The analysis was performed using the @RISK (Palisade Corporation, 2007) package forMicrosoft Excel™. The target variable was the reduction in emissions for the whole of thepresent fleet, which was found above to be 568 kt CO2e/year before the uncertainty analysis,and the distributions were generated using 10,000 samples. As the effect of the uncertainty in

Carbon Brainprint Ceramic coatings for jet engine turbine blades
Page 13 of 14
the emissions reduction from the improved TBC was very large, the analysis was performedwith and without it. The resulting distribution without this factor was approximately normal, withmean 568 and 95% confidence interval 429–721 (Figure 3). When the uncertainty in emissionsreduction was included the distribution had positive skew, with mean 570, mode 531 and 95%confidence interval 258–1105 (Figure 4).
The relationships in the model were generally linear, so the same relative results were obtainedfor the other results reported above. Thus the lowest estimates of the emissions reduction,assuming only a proportion of the fleet has the improved coatings, were approximately 219 and350 kt CO2e/year for the current and potential fleets respectively. The corresponding lowerestimate of the total prospective brainprint was 7 Mt CO2e. The maximum total prospectivebrainprint including the adjustment for altitude was approximately 61 Mt CO2e.
Figure 3. Distribution of total present fleet emissions reductions from uncertainty analysis,excluding uncertainty in the emissions reduction
Figure 4. Distribution of total present fleet emissions reductions from uncertainty analysis,including uncertainty in the emissions reduction
300
400
500
600
700
800
900
0
500
1000
1500
2000
2500
Carbon Brainprint Ceramic coatings for jet engine turbine blades
Page 14 of 14
ReferencesAEA (2010). 2010 Guidelines to Defra / DECC's GHG Conversion Factors for Company Reporting.
Produced by AEA for the Department of Energy and Climate Change (DECC), Version 1.2.1 FINAL,Updated: 06/10/2010
Airbus (2010). Orders and Deliveries (Accessed 20 Jan 2011).http://www.airbus.com/company/market/orders-deliveries/
Airfleets (2011). Production list (Accessed 2 Feb 2011). http://www.airfleets.net/
Azapagic, A. (2011). CCaLC carbon footprinting tool. http://www.ccalc.org.uk/
BSI (2008). PAS 2050:2008 Specification for the assessment of the life cycle greenhouse gas emissionsof goods and services. British Standards Institution, London, 36 pp.
CAA (2010). Civil Aviation Organisation web site.http://www.caa.co.uk/default.aspx?catid=702&pagetype=68
ELCD (2010). European Life Cycle Database (Accessed 30 Jan 2011).http://lca.jrc.ec.europa.eu/lcainfohub/datasetArea.vm
EMEP/EEA (2009). EMEP/EEA air pollutant emission inventory guidebook — 2009. Technical guidanceto prepare national emission inventories. EEA Technical report No 9, European Environment Agency
EcoInvent Centre (2011). EcoInvent database (accessed 08/04/2011). http://www.ecoinvent.ch/
ICAO (1995). Engine exhaust emissions databank. First edition. Doc 9646-AN/943, International CivilAviation Organization
IPCC (2000). Good Practice Guidance and Uncertainty Management in National Greenhouse GasInventories. IPCC National Greenhouse Gas Inventories Programme,
IPCC (2007). Working Group I Fourth Assessment Report "The Physical Science Basis". Solomon, Susan;Qin, Dahe; Manning, Martin; Marquis, Melinda; Averyt, Kristen; Tignor, Melinda M. B.; Miller Jr., HenryLeRoy; Chen, Zhenlin (eds). Cambridge University Press, 996 pp.
Palisade Corporation (2007). @RISK 5.0 risk analysis software. http://www.palisade.com/risk/
Parsons, D. J.; Chatterton, J. (2011a). Guidance for the calculation of carbon brainprints of highereducation institution activities. Cranfield University, Report for HEFCE project LDSHE43
Rolls-Royce (2007). Gas turbine technology. Introduction to a jet engine. Rolls-Royce plc, 20 pp.
Rolls-Royce (2011). Market Information (Accessed 3 Feb 2011). http://www.rolls-royce.com/civil/products/largeaircraft/trent_700/market_information.jsp
Toriz, F. C.; Thakker, A. B.; Gupta, S.K. (1989). Flight service evaluation of thermal barrier coatings byphysical vapor deposition at 5200 h. Surface and Coatings Technology, 39/40, 161--172.
UNFCC (1996). Detailed information on electricity trade and international bunker fuels. United NationsFramework Convention on Climate Change. Subsidiary Body for Scientific and Technological Advice,Fourth session, Geneva, 16-18 December 1996, Addendum 2. (UNFCCC/SBSTA/1996/9/Add.2).
Watterson, J.; Walke, C.; Eggleston, S. (2010). Revision to the Method of Estimating Emissions fromAircraft in the UK Greenhouse Gas Inventory. Netcen, Report to Global Atmosphere Division, Defra


