48
Trusted commercial intelligencewww.woodmac.com
Carbon’s impact on crude oil -stormy seas for petrochemicals?
November 2016
Trusted commercial intelligencewww.woodmac.com
3
Agenda
1. Energy, oil and carbon - Is the crude oil juggernaut turning?
2. Petrochemicals – Addressing the uncertainties
Trusted commercial intelligencewww.woodmac.com
4
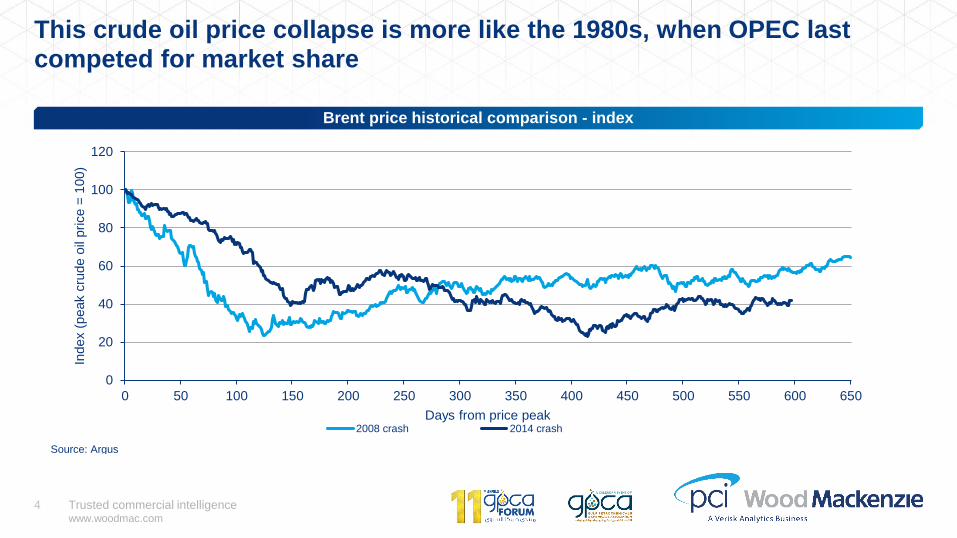
This crude oil price collapse is more like the 1980s, when OPEC last competed for market share
Brent price historical comparison - index
0
20
40
60
80
100
120
0 50 100 150 200 250 300 350 400 450 500 550 600 650
Index (
peak c
rude o
il price =
100)
Days from price peak2008 crash 2014 crash
Source: Argus
Trusted commercial intelligencewww.woodmac.com
5
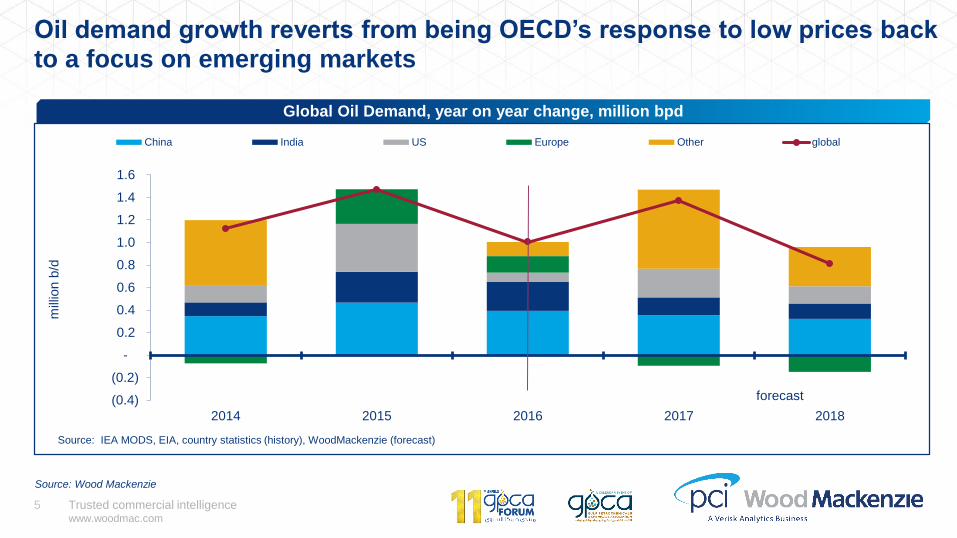
Oil demand growth reverts from being OECD’s response to low prices back to a focus on emerging markets
Global Oil Demand, year on year change, million bpd
Source: Wood Mackenzie
(0.4)
(0.2)
-
0.2
0.4
0.6
0.8
1.0
1.2
1.4
1.6
2014 2015 2016 2017 2018
mill
ion b
/d
China India US Europe Other global
forecast
Source: IEA MODS, EIA, country statistics (history), WoodMackenzie (forecast)
Trusted commercial intelligencewww.woodmac.com
6
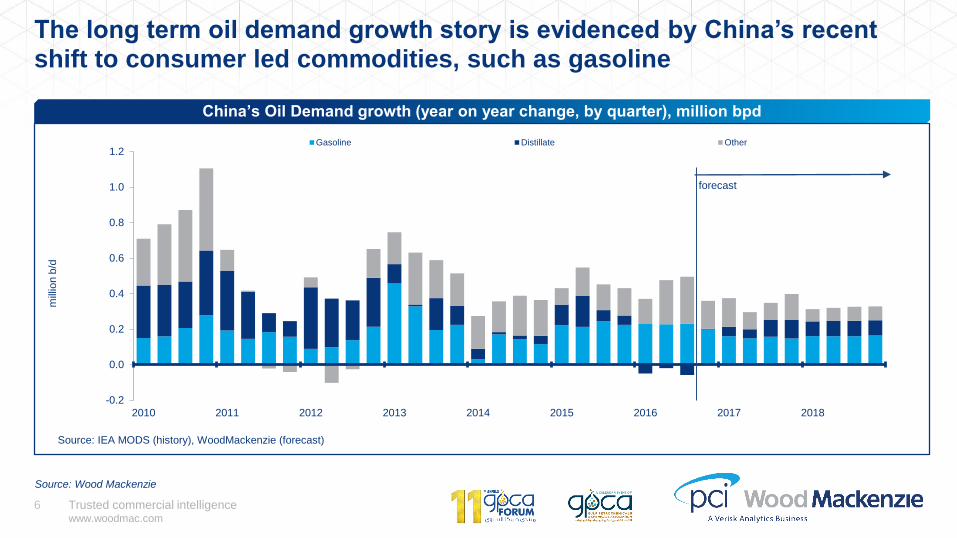
The long term oil demand growth story is evidenced by China’s recent shift to consumer led commodities, such as gasoline
China’s Oil Demand growth (year on year change, by quarter), million bpd
Source: Wood Mackenzie
-0.2
0.0
0.2
0.4
0.6
0.8
1.0
1.2
2010 2011 2012 2013 2014 2015 2016 2017 2018
mill
ion b
/d
Gasoline Distillate Other
forecast
Source: IEA MODS (history), WoodMackenzie (forecast)
Trusted commercial intelligencewww.woodmac.com
7
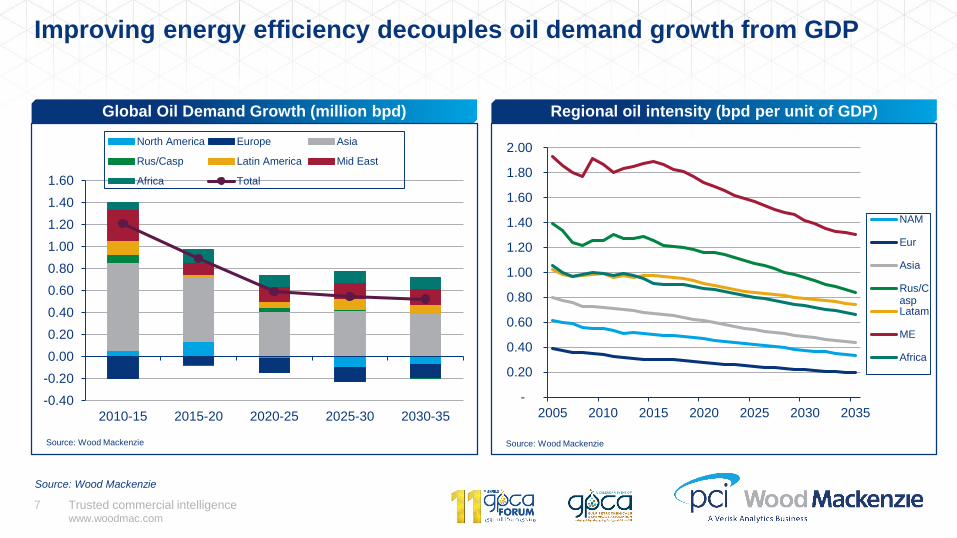
Improving energy efficiency decouples oil demand growth from GDP
Source: Wood Mackenzie
Global Oil Demand Growth (million bpd) Regional oil intensity (bpd per unit of GDP)
-0.40
-0.20
0.00
0.20
0.40
0.60
0.80
1.00
1.20
1.40
1.60
2010-15 2015-20 2020-25 2025-30 2030-35
North America Europe Asia
Rus/Casp Latin America Mid East
Africa Total
Source: Wood Mackenzie
-
0.20
0.40
0.60
0.80
1.00
1.20
1.40
1.60
1.80
2.00
2005 2010 2015 2020 2025 2030 2035
NAM
Eur
Asia
Rus/CaspLatam
ME
Africa
Source: Wood Mackenzie
Trusted commercial intelligencewww.woodmac.com
8
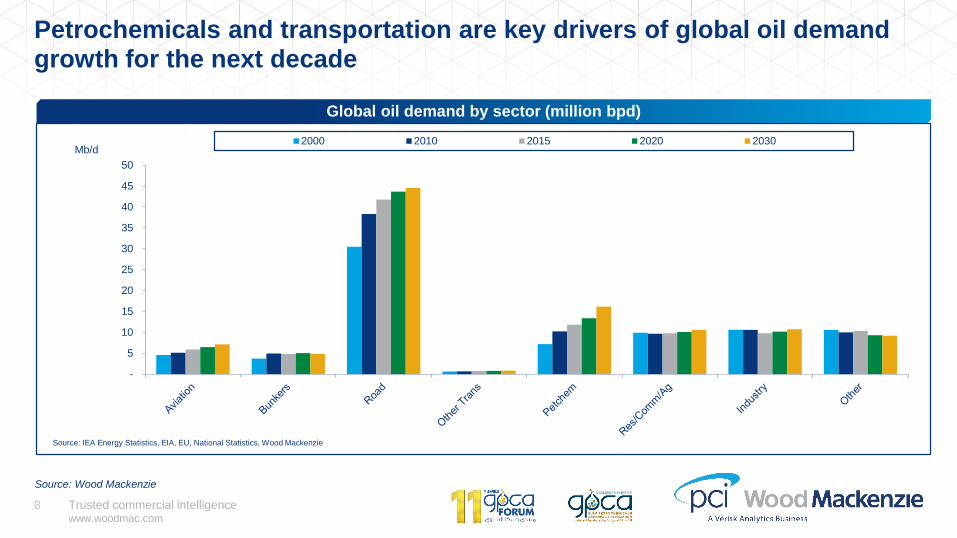
Petrochemicals and transportation are key drivers of global oil demand growth for the next decade
Global oil demand by sector (million bpd)
Source: Wood Mackenzie
-
5
10
15
20
25
30
35
40
45
50
Mb/d2000 2010 2015 2020 2030
Source: IEA Energy Statistics, EIA, EU, National Statistics, Wood Mackenzie

Trusted commercial intelligencewww.woodmac.com
9
Upstream capex has fallen significantly since mid 2014, which is leading to a re-balancing of the oil market
Global Upstream Capex Outlook Global change in supply/demand (million bpd)
Source: Wood Mackenzie
0.0 1.0 2.0 3.0 4.0
Supply
Demand
2015
2016
2017
2018
0
100
200
300
400
500
600
700
800
2014 2015 2016 2017 2018 2019 2020
Cap
ex
in
ve
stm
en
t (U
S$ b
illi
on
s)
E&A Spend
US L48
Technical
Probable development
Under development
Onstream
Pre-oil price collapse outlook
Source: Wood Mackenzie
Trusted commercial intelligencewww.woodmac.com
11
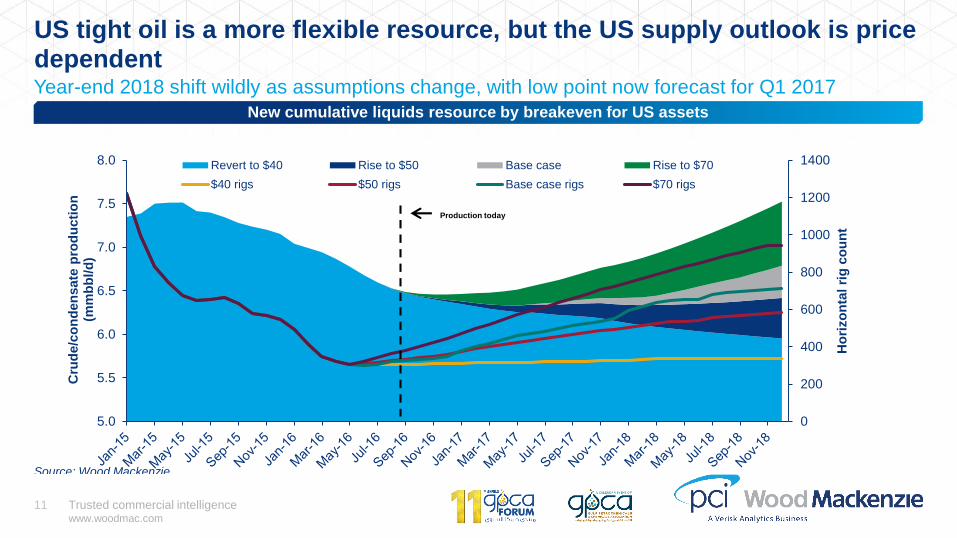
US tight oil is a more flexible resource, but the US supply outlook is price dependentYear-end 2018 shift wildly as assumptions change, with low point now forecast for Q1 2017
0
200
400
600
800
1000
1200
1400
5.0
5.5
6.0
6.5
7.0
7.5
8.0
Ho
rizo
nta
l ri
g c
ou
nt
Cru
de/c
on
den
sate
pro
du
cti
on
(m
mb
bl/
d)
Revert to $40 Rise to $50 Base case Rise to $70
$40 rigs $50 rigs Base case rigs $70 rigs
Source: Wood Mackenzie
New cumulative liquids resource by breakeven for US assets
Production today
Trusted commercial intelligencewww.woodmac.com
12
0
5
10
15
20
25
Supplygap
<$40 $40<$60 $60<$80 >$80 Non-OPECReservesGrowth +
OtherDisc. +
YTF
Call onotherOPEC
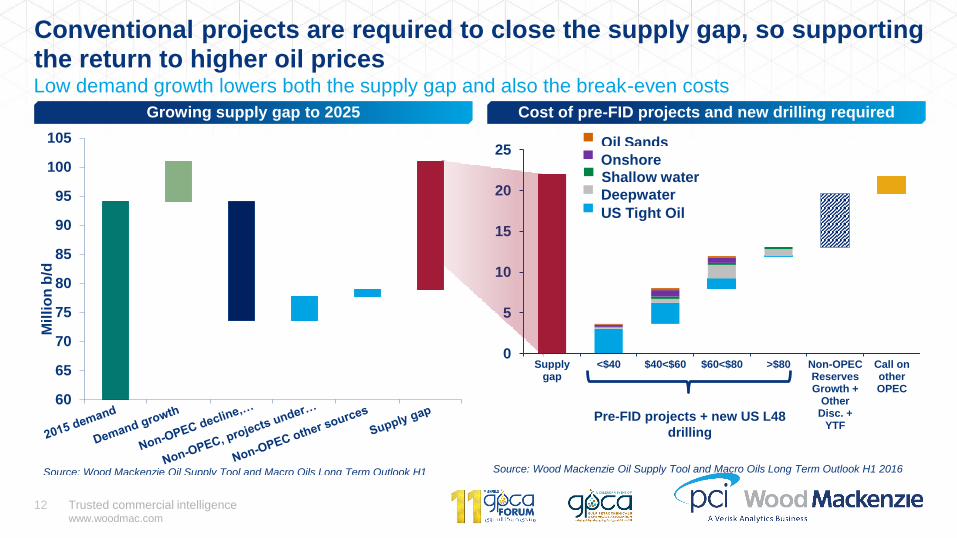
Oil Sands
Onshore
Shallow water
Deepwater
US Tight Oil
Source: Wood Mackenzie Oil Supply Tool and Macro Oils Long Term Outlook H1 2016
Pre-FID projects + new US L48
drilling
Growing supply gap to 2025 Cost of pre-FID projects and new drilling required
Conventional projects are required to close the supply gap, so supporting the return to higher oil prices
60
65
70
75
80
85
90
95
100
105
Mil
lio
n b
/d
Source: Wood Mackenzie Oil Supply Tool and Macro Oils Long Term Outlook H1
2016
Low demand growth lowers both the supply gap and also the break-even costs
Trusted commercial intelligencewww.woodmac.com
13
0
50
100
150
200
250
300
350
400
200
5
200
7
200
9
201
1
201
3
201
5
201
7
201
9
202
1
202
3
202
5
mm
tpa
H1 2016 H1 2015
0
50
100
150
200
250
300
350
400
201
4
201
5
201
6
201
7
201
8
201
9
202
0
202
1
202
2
202
3
202
4
202
5
mm
tpa
Operational New Other
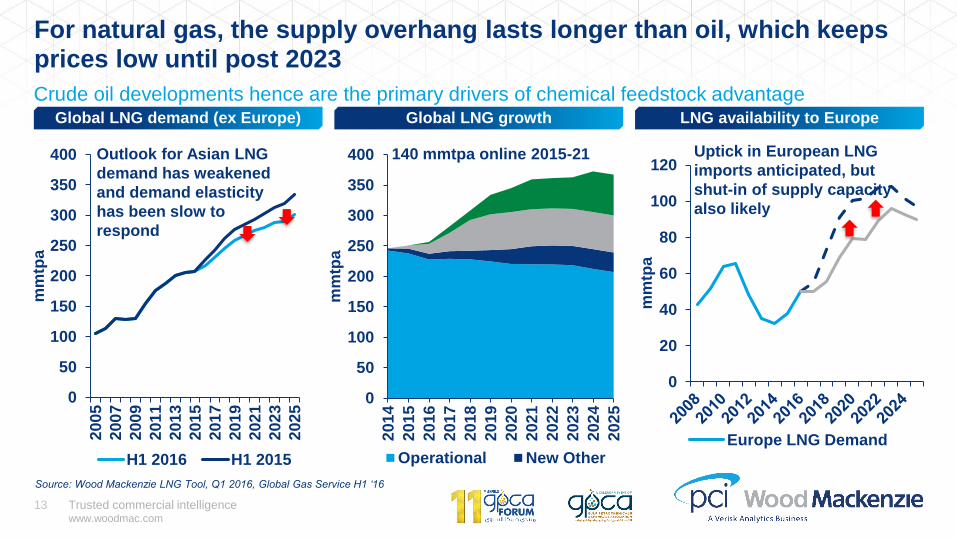
For natural gas, the supply overhang lasts longer than oil, which keeps prices low until post 2023
Source: Wood Mackenzie LNG Tool, Q1 2016, Global Gas Service H1 ‘16
0
20
40
60
80
100
120
mm
tpa
Europe LNG Demand
Outlook for Asian LNG
demand has weakened
and demand elasticity
has been slow to
respond
140 mmtpa online 2015-21 Uptick in European LNG
imports anticipated, but
shut-in of supply capacity
also likely
Global LNG growthGlobal LNG demand (ex Europe) LNG availability to Europe
Crude oil developments hence are the primary drivers of chemical feedstock advantage
Trusted commercial intelligencewww.woodmac.com
14
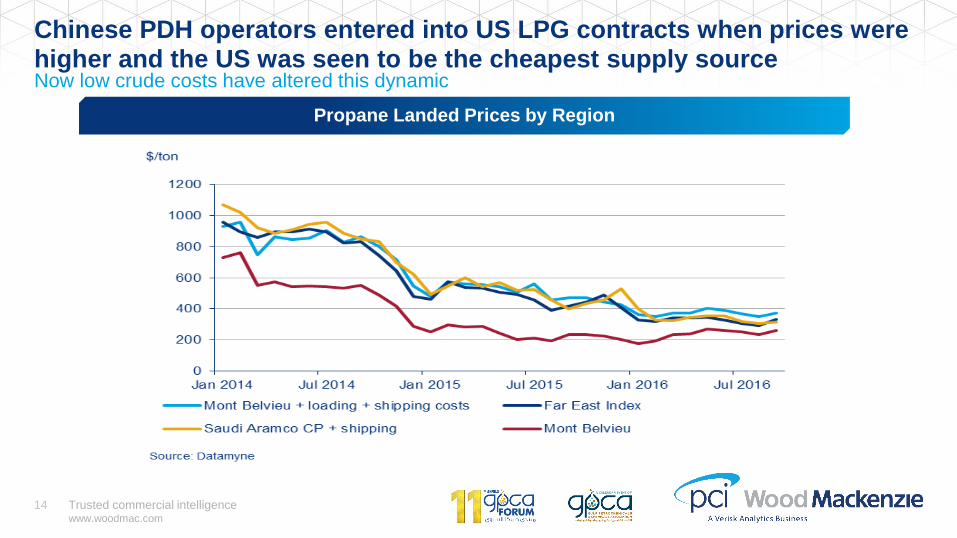
Chinese PDH operators entered into US LPG contracts when prices were higher and the US was seen to be the cheapest supply sourceNow low crude costs have altered this dynamic
Propane Landed Prices by Region
Trusted commercial intelligencewww.woodmac.com
15
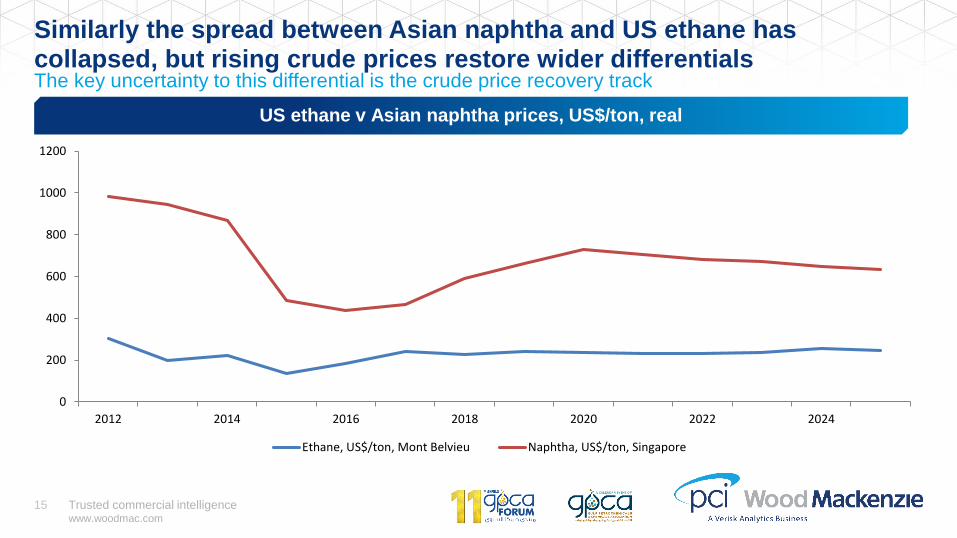
Similarly the spread between Asian naphtha and US ethane has collapsed, but rising crude prices restore wider differentialsThe key uncertainty to this differential is the crude price recovery track
US ethane v Asian naphtha prices, US$/ton, real
0
200
400
600
800
1000
1200
2012 2014 2016 2018 2020 2022 2024
Ethane, US$/ton, Mont Belvieu Naphtha, US$/ton, Singapore
Trusted commercial intelligencewww.woodmac.com
16
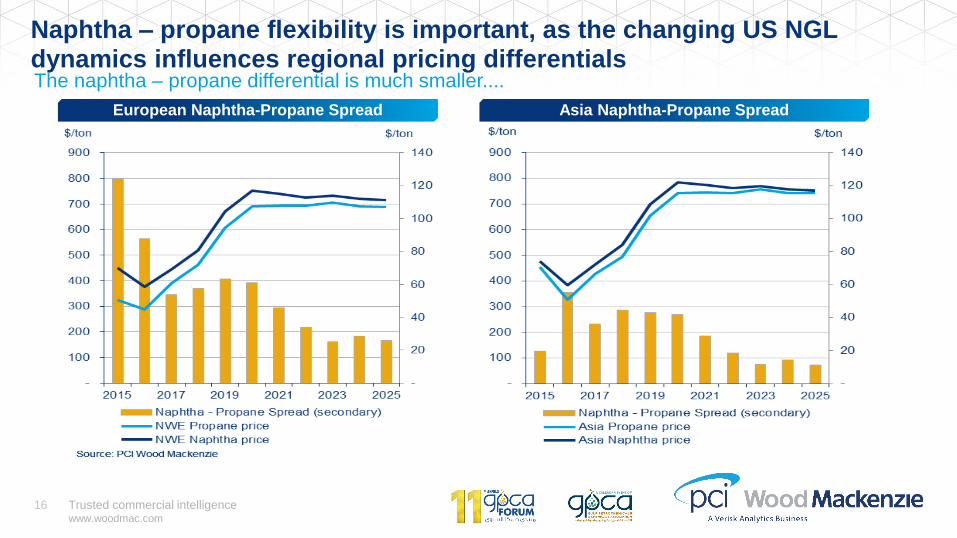
Naphtha – propane flexibility is important, as the changing US NGL dynamics influences regional pricing differentials
European Naphtha-Propane Spread Asia Naphtha-Propane Spread
The naphtha – propane differential is much smaller....
Trusted commercial intelligencewww.woodmac.com
17
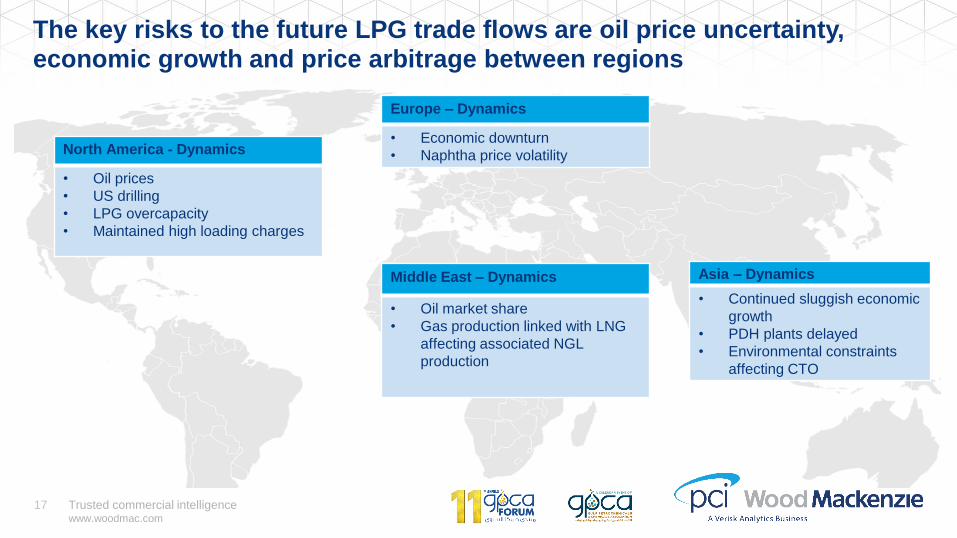
The key risks to the future LPG trade flows are oil price uncertainty, economic growth and price arbitrage between regions
North America - Dynamics
• Oil prices
• US drilling
• LPG overcapacity
• Maintained high loading charges
Europe – Dynamics
• Economic downturn
• Naphtha price volatility
Middle East – Dynamics
• Oil market share
• Gas production linked with LNG
affecting associated NGL
production
Asia – Dynamics
• Continued sluggish economic
growth
• PDH plants delayed
• Environmental constraints
affecting CTO
Trusted commercial intelligencewww.woodmac.com
18
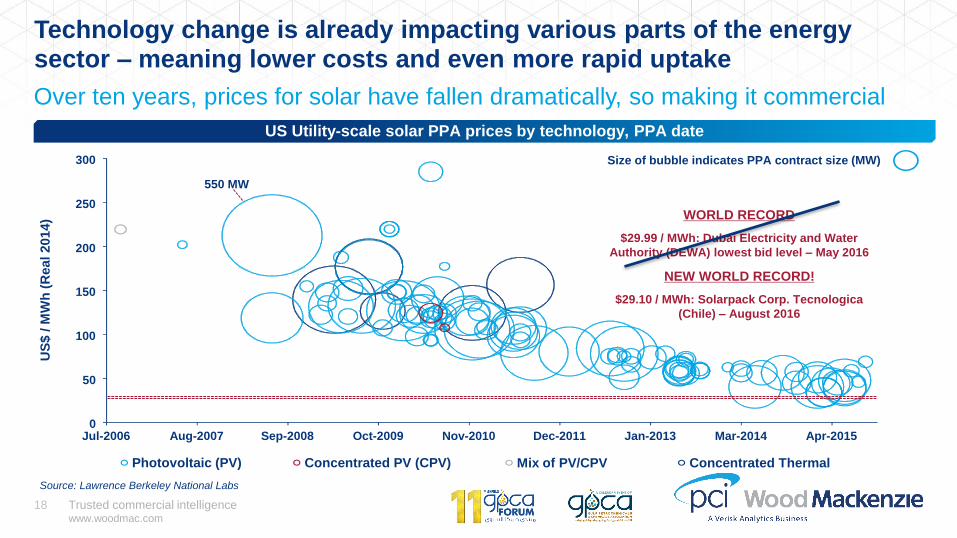
Technology change is already impacting various parts of the energy sector – meaning lower costs and even more rapid uptake
Over ten years, prices for solar have fallen dramatically, so making it commercial
US Utility-scale solar PPA prices by technology, PPA date
Source: Lawrence Berkeley National Labs
Size of bubble indicates PPA contract size (MW)
US
$ / M
Wh
(R
eal 2014)
Photovoltaic (PV) Concentrated PV (CPV) Mix of PV/CPV Concentrated Thermal
550 MW
0
50
100
150
200
250
300
Jul-2006 Aug-2007 Sep-2008 Oct-2009 Nov-2010 Dec-2011 Jan-2013 Mar-2014 Apr-2015
WORLD RECORD
$29.99 / MWh: Dubai Electricity and Water
Authority (DEWA) lowest bid level – May 2016
NEW WORLD RECORD!
$29.10 / MWh: Solarpack Corp. Tecnologica
(Chile) – August 2016
Trusted commercial intelligencewww.woodmac.com
19
0
5
10
15
20
2010 2015 2020 2025 2030 2035 2040 2045 2050
mb
/d
Africa China IndiaOther Asia Pacific Europe Middle EastNorth America Russia & Caspian South America
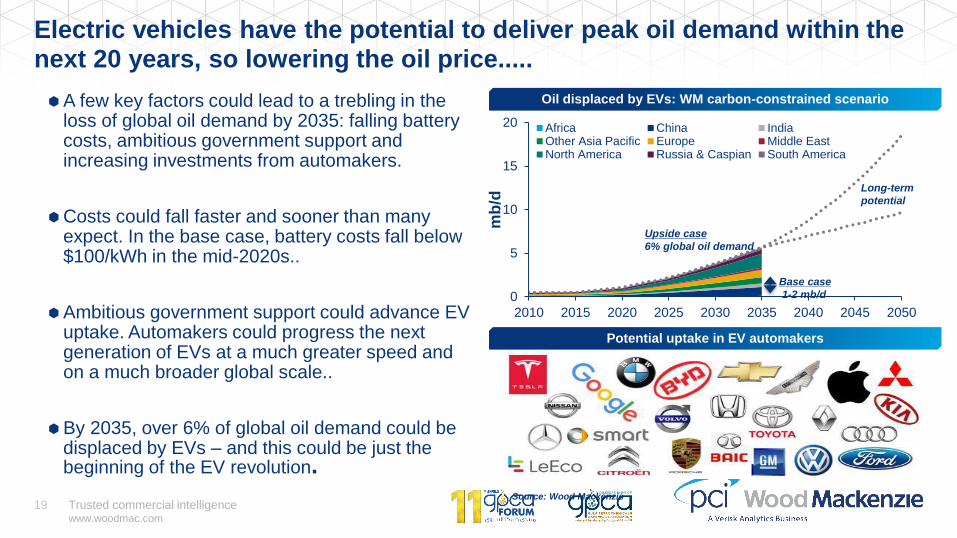
Electric vehicles have the potential to deliver peak oil demand within the next 20 years, so lowering the oil price.....
Oil displaced by EVs: WM carbon-constrained scenario
Source: Wood Mackenzie
Potential uptake in EV automakers
A few key factors could lead to a trebling in the loss of global oil demand by 2035: falling battery costs, ambitious government support and increasing investments from automakers.
Costs could fall faster and sooner than many expect. In the base case, battery costs fall below $100/kWh in the mid-2020s..
Ambitious government support could advance EV uptake. Automakers could progress the next generation of EVs at a much greater speed and on a much broader global scale..
By 2035, over 6% of global oil demand could be displaced by EVs – and this could be just the beginning of the EV revolution.
Base case
1-2 mb/d
Upside case
6% global oil demand
Long-term
potential
Trusted commercial intelligencewww.woodmac.com
20
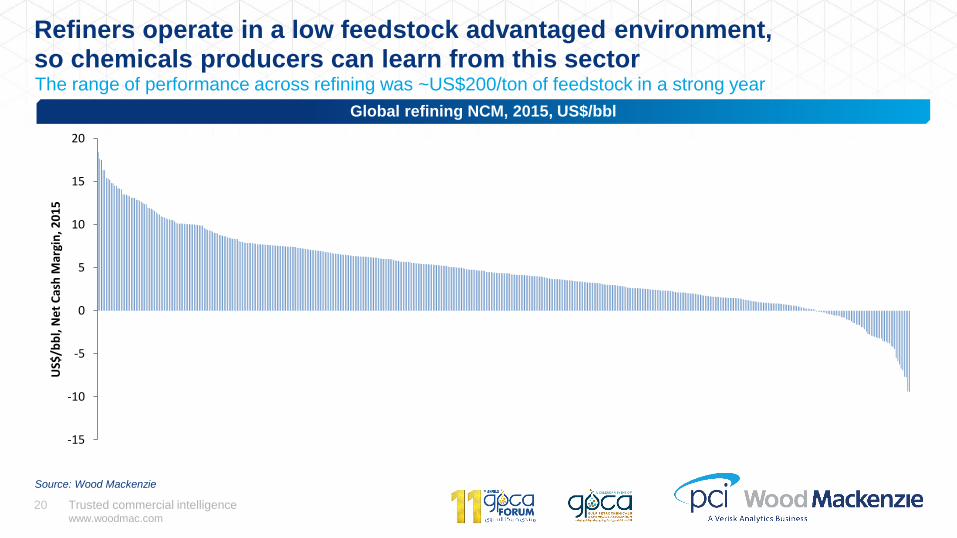
Refiners operate in a low feedstock advantaged environment, so chemicals producers can learn from this sector
Global refining NCM, 2015, US$/bbl
Source: Wood Mackenzie
-15
-10
-5
0
5
10
15
20
US$
/bb
l, N
et
Cas
h M
argi
n, 2
01
5
The range of performance across refining was ~US$200/ton of feedstock in a strong year
Trusted commercial intelligencewww.woodmac.com
21 Trusted commercial intelligencewww.woodmac.com
21
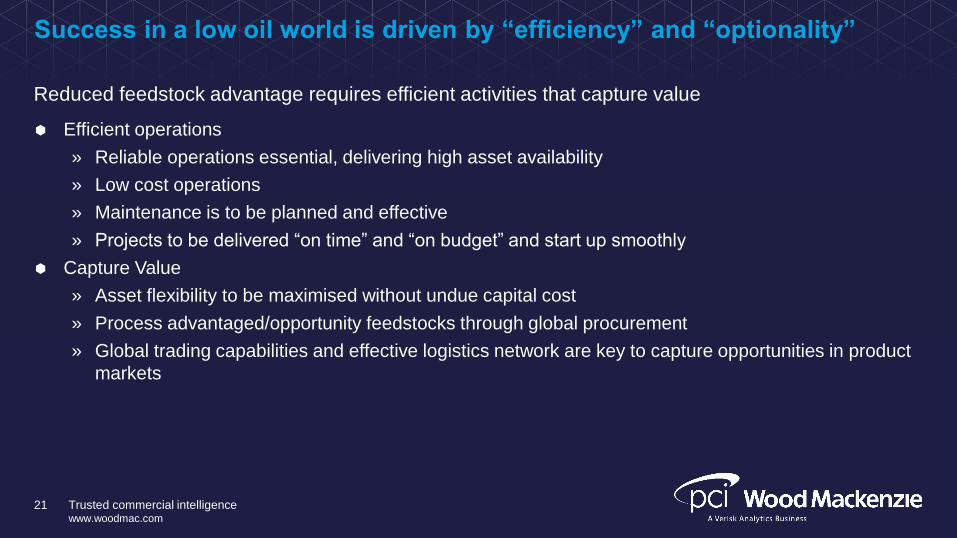
Success in a low oil world is driven by “efficiency” and “optionality”
Efficient operations
» Reliable operations essential, delivering high asset availability
» Low cost operations
» Maintenance is to be planned and effective
» Projects to be delivered “on time” and “on budget” and start up smoothly
Capture Value
» Asset flexibility to be maximised without undue capital cost
» Process advantaged/opportunity feedstocks through global procurement
» Global trading capabilities and effective logistics network are key to capture opportunities in product
markets
Reduced feedstock advantage requires efficient activities that capture value
Trusted commercial intelligencewww.woodmac.com
22
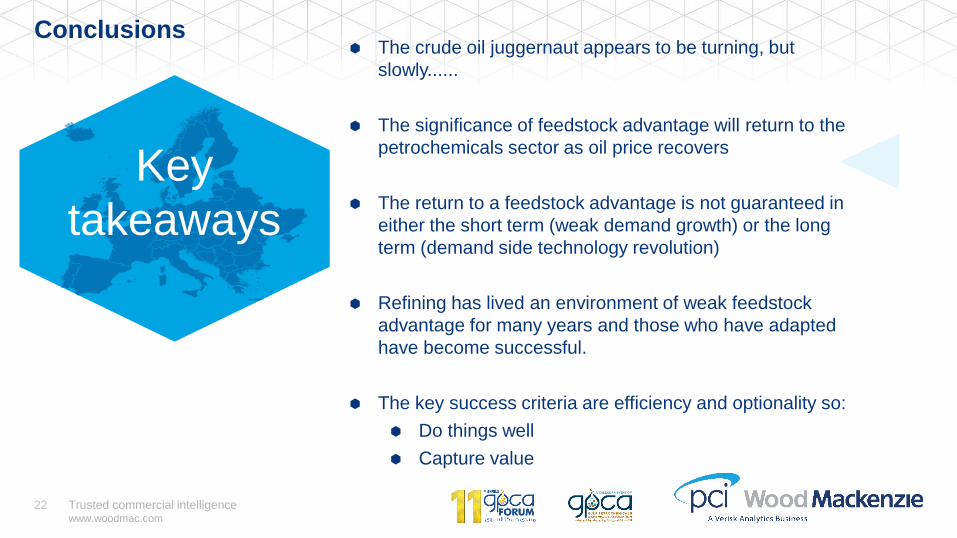
The crude oil juggernaut appears to be turning, but
slowly......
The significance of feedstock advantage will return to the
petrochemicals sector as oil price recovers
The return to a feedstock advantage is not guaranteed in
either the short term (weak demand growth) or the long
term (demand side technology revolution)
Refining has lived an environment of weak feedstock
advantage for many years and those who have adapted
have become successful.
The key success criteria are efficiency and optionality so:
Do things well
Capture value
Key
takeaways
Conclusions
Trusted commercial intelligencewww.woodmac.com
23
Agenda
1. Energy, oil and carbon - Is the crude oil juggernaut turning?
2. Petrochemicals – Addressing the uncertainties

Trusted commercial intelligencewww.woodmac.com
24
Agenda
The current competitive arena for olefins and aromatics
» Who are the winners and losers in an evolutionary world?
Amid economic fragility can chemical growth continue?
Impact on trade flows as new capacity is commissioned
» Focus on China imports
» Impact on key exporting regions
Conclusions
Trusted commercial intelligencewww.woodmac.com
25
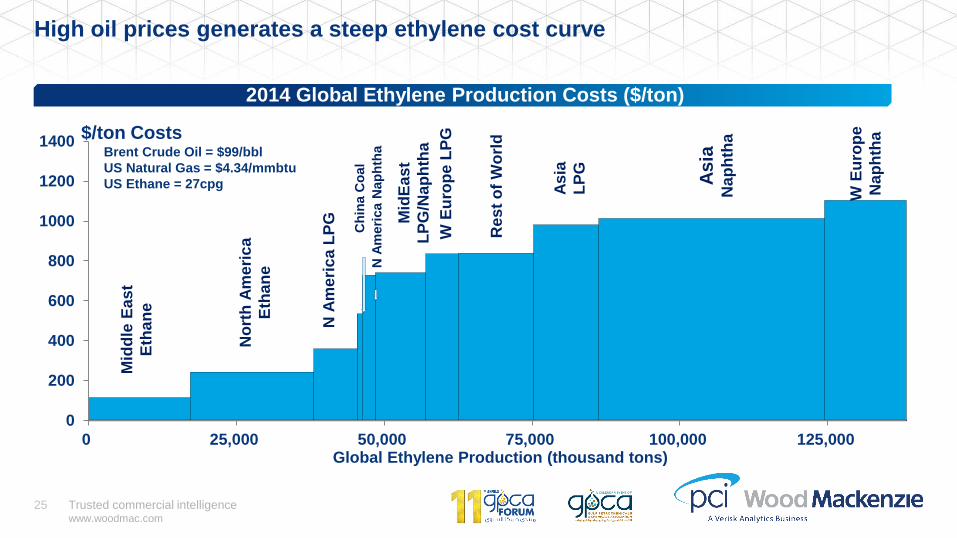
High oil prices generates a steep ethylene cost curve
2014 Global Ethylene Production Costs ($/ton)
0
200
400
600
800
1000
1200
1400
0 25,000 50,000 75,000 100,000 125,000Global Ethylene Production (thousand tons)
$/ton CostsBrent Crude Oil = $99/bbl
US Natural Gas = $4.34/mmbtu
US Ethane = 27cpg
Mid
dle
Ea
st
Eth
an
e
No
rth
Am
eri
ca
Eth
an
e
Mid
Ea
st
LP
G/N
ap
hth
a
Res
t o
fW
orl
d
As
ia
Nap
hth
a
WE
uro
pe
Nap
hth
a
N A
me
ric
a L
PG
Ch
ina C
oal
WE
uro
pe L
PG
As
ia
LP
G
N A
me
rica N
ap
hth
a
Trusted commercial intelligencewww.woodmac.com
26
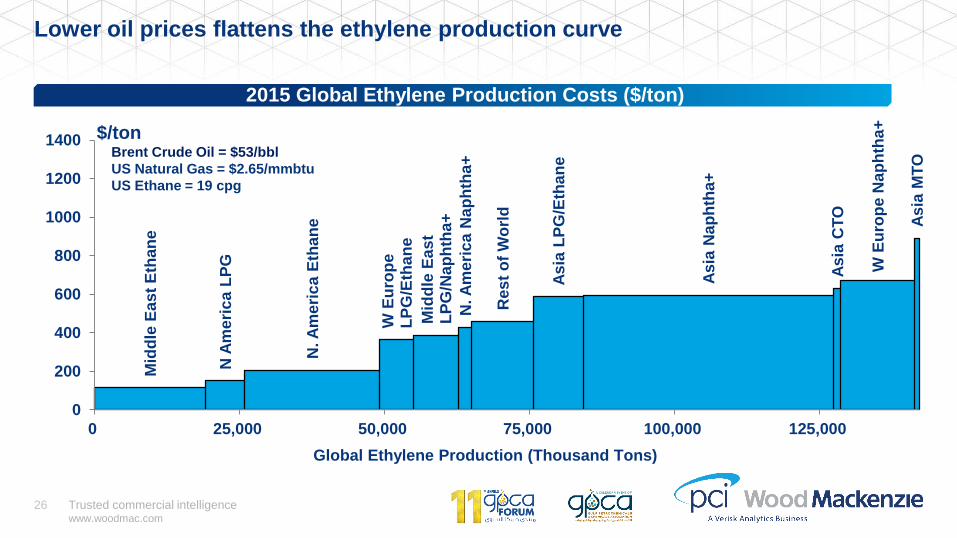
Lower oil prices flattens the ethylene production curve
2015 Global Ethylene Production Costs ($/ton)
Mid
dle
Ea
st
Eth
an
e
N A
me
ric
a L
PG
N. A
me
ric
a E
tha
ne
W E
uro
pe
L
PG
/Eth
an
e
Mid
dle
Ea
st
LP
G/N
ap
hth
a+
N. A
me
ric
a N
ap
hth
a+
Res
t o
f W
orl
d
As
ia L
PG
/Eth
an
e
As
ia N
ap
hth
a+
As
ia C
TO
W E
uro
pe N
ap
hth
a+
As
ia M
TO
0
200
400
600
800
1000
1200
1400
0 25,000 50,000 75,000 100,000 125,000
$/tonBrent Crude Oil = $53/bbl
US Natural Gas = $2.65/mmbtu
US Ethane = 19 cpg
Global Ethylene Production (Thousand Tons)
Trusted commercial intelligencewww.woodmac.com
27
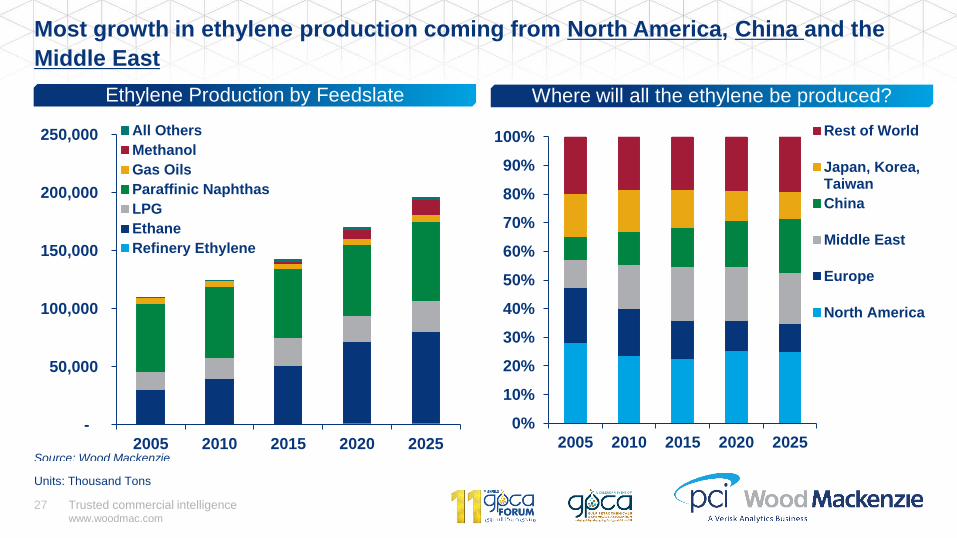
Most growth in ethylene production coming from North America, China and the
Middle East
Ethylene Production by Feedslate
-
50,000
100,000
150,000
200,000
250,000
2005 2010 2015 2020 2025
All Others
Methanol
Gas Oils
Paraffinic Naphthas
LPG
Ethane
Refinery Ethylene
Source: Wood Mackenzie
Where will all the ethylene be produced?
Units: Thousand Tons
0%
10%
20%
30%
40%
50%
60%
70%
80%
90%
100%
2005 2010 2015 2020 2025
Rest of World
Japan, Korea,Taiwan
China
Middle East
Europe
North America
Trusted commercial intelligencewww.woodmac.com
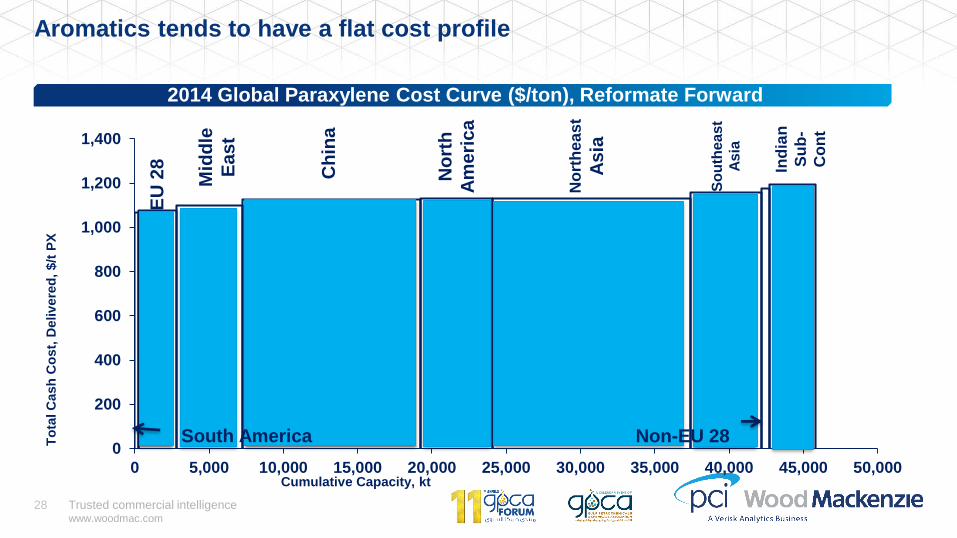
28
Aromatics tends to have a flat cost profile
2014 Global Paraxylene Cost Curve ($/ton), Reformate Forward
0
200
400
600
800
1,000
1,200
1,400
0 5,000 10,000 15,000 20,000 25,000 30,000 35,000 40,000 45,000 50,000
To
tal C
ash
Co
st,
Deliv
ere
d,
$/t
PX
Cumulative Capacity, kt
Mid
dle
East
No
rth
ea
st
As
ia
Ch
ina
Ind
ian
Su
b-
Co
nt
So
uth
ea
st
As
ia
No
rth
Am
eri
ca
EU
28
South America Non-EU 28
Trusted commercial intelligencewww.woodmac.com
29
0
200
400
600
800
1,000
1,200
1,400
0 5,000 10,000 15,000 20,000 25,000 30,000 35,000 40,000 45,000 50,000
To
tal C
ash
Co
st,
De
live
red
, $
/t P
X
Cumulative Capacity, kt
Mid
dle
Ea
st
No
rth
ea
st
As
ia
Ch
ina
Ind
ian
Su
b-C
on
t
No
n-E
U 2
8
So
uth
ea
st
As
ia
No
rth
Am
eri
ca
South America
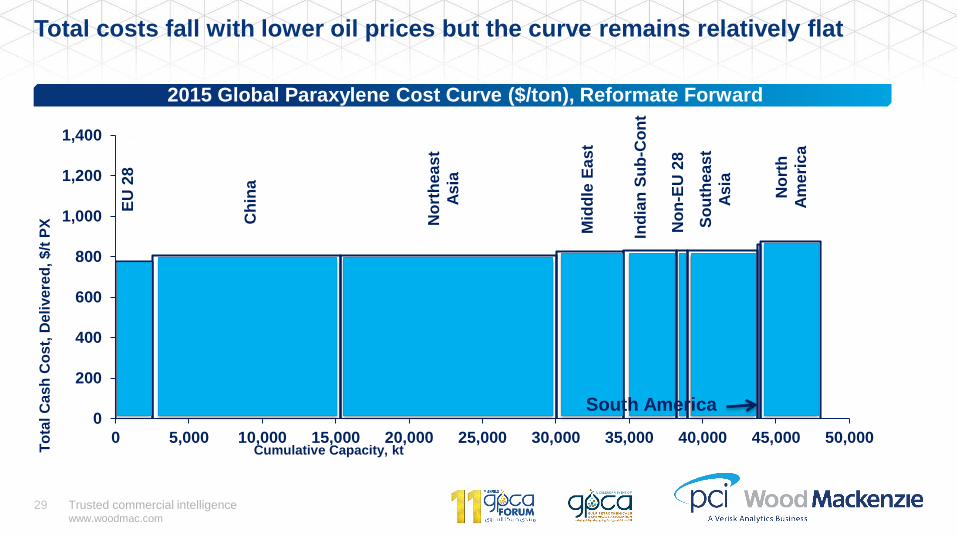
Total costs fall with lower oil prices but the curve remains relatively flat
2015 Global Paraxylene Cost Curve ($/ton), Reformate Forward
EU
28
Trusted commercial intelligencewww.woodmac.com
30
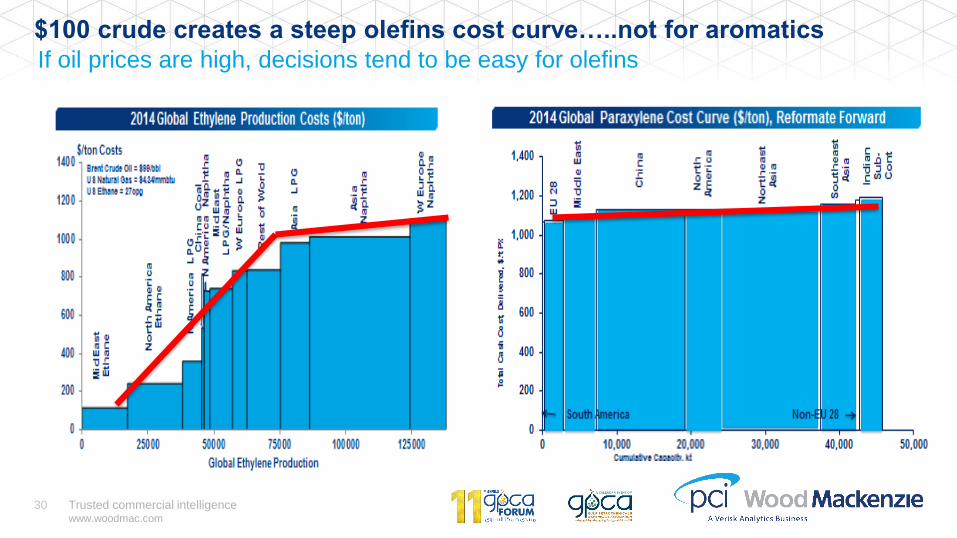
$100 crude creates a steep olefins cost curve…..not for aromatics
If oil prices are high, decisions tend to be easy for olefins
Trusted commercial intelligencewww.woodmac.com
31
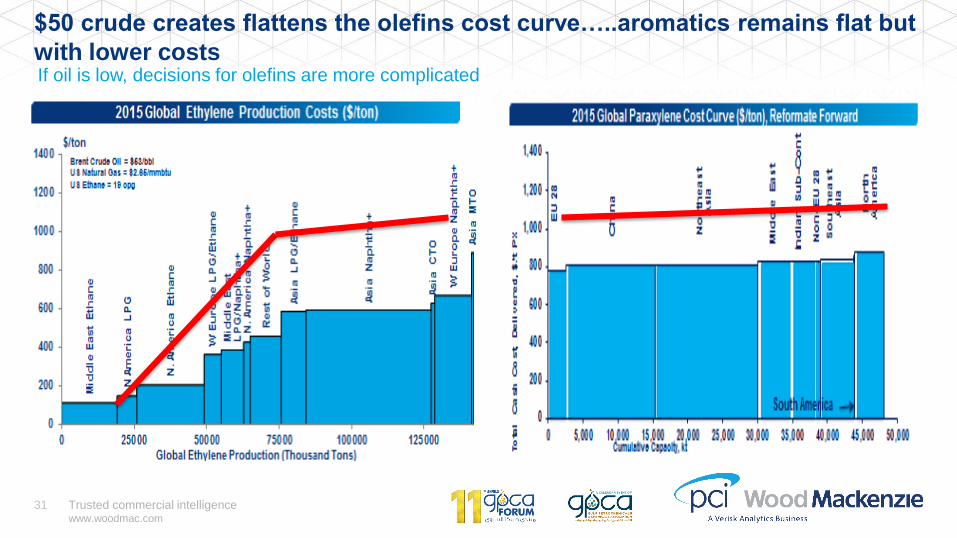
$50 crude creates flattens the olefins cost curve…..aromatics remains flat but
with lower costsIf oil is low, decisions for olefins are more complicated
Trusted commercial intelligencewww.woodmac.com
32
Agenda
The current competitive arena for olefins and aromatics
» Who are the winners and losers in an evolutionary world?
Amid economic fragility can chemical growth continue?
Impact on trade flows as new capacity is commissioned
» Focus on China imports
» Impact on key exporting regions
Conclusions
Trusted commercial intelligencewww.woodmac.com
33
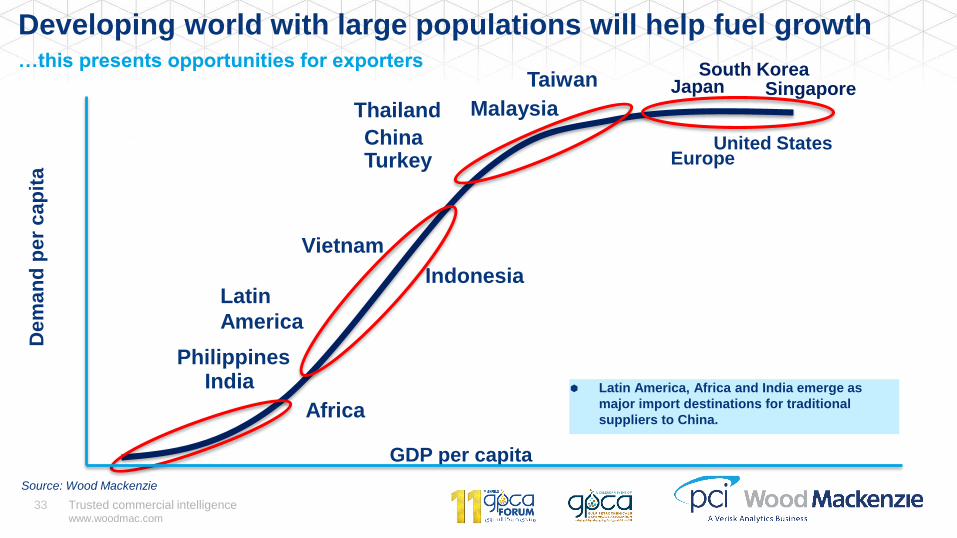
Developing world with large populations will help fuel growth…this presents opportunities for exporters
Dem
an
d p
er
ca
pit
a
Thailand
PhilippinesIndia
Vietnam
United StatesChinaEurope
SingaporeJapan
Indonesia
Malaysia
South KoreaTaiwan
Turkey
Africa
Latin
America
Latin America, Africa and India emerge as
major import destinations for traditional
suppliers to China.
Source: Wood Mackenzie
GDP per capita
Trusted commercial intelligencewww.woodmac.com
34
0
100
200
300
400
500
600
1990 1995 2000 2005 2010 2015 2020 2025 2030 2035
Mil
lio
n
Households w/ disposable income>$10k (2010 USD)
Passenger vehicle fleet size
0
10
20
30
40
50
60
70
80
90
100
$1k $10k $20k $30k $40k $50k
Mil
lio
n h
ou
se
ho
lds
Annual USD, 2010 prices (at $2k intervals)
2005
2015
2025
2035
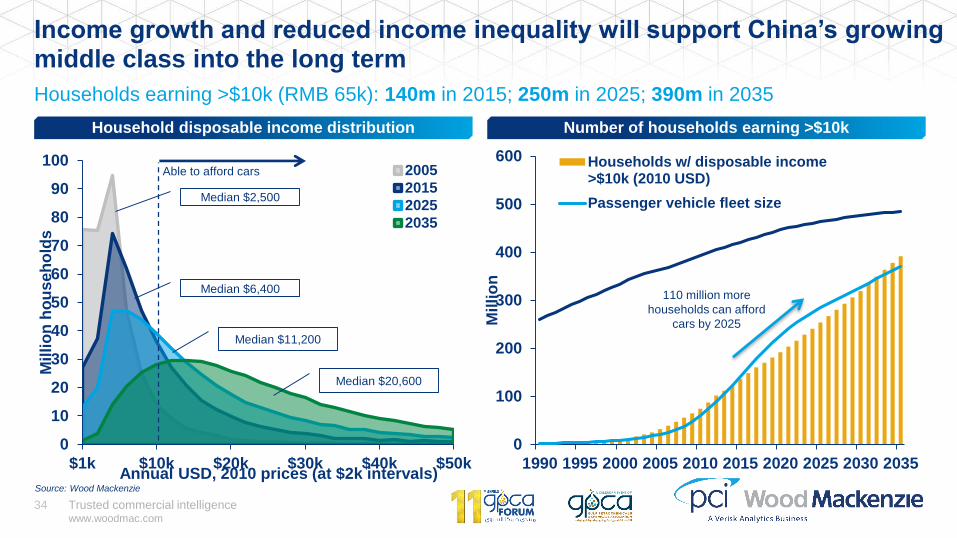
Income growth and reduced income inequality will support China’s growing middle class into the long term
Households earning >$10k (RMB 65k): 140m in 2015; 250m in 2025; 390m in 2035
Number of households earning >$10kHousehold disposable income distribution
Able to afford cars
110 million more
households can afford
cars by 2025
Median $2,500
Median $6,400
Median $11,200
Median $20,600
Source: Wood Mackenzie
Trusted commercial intelligencewww.woodmac.com
35
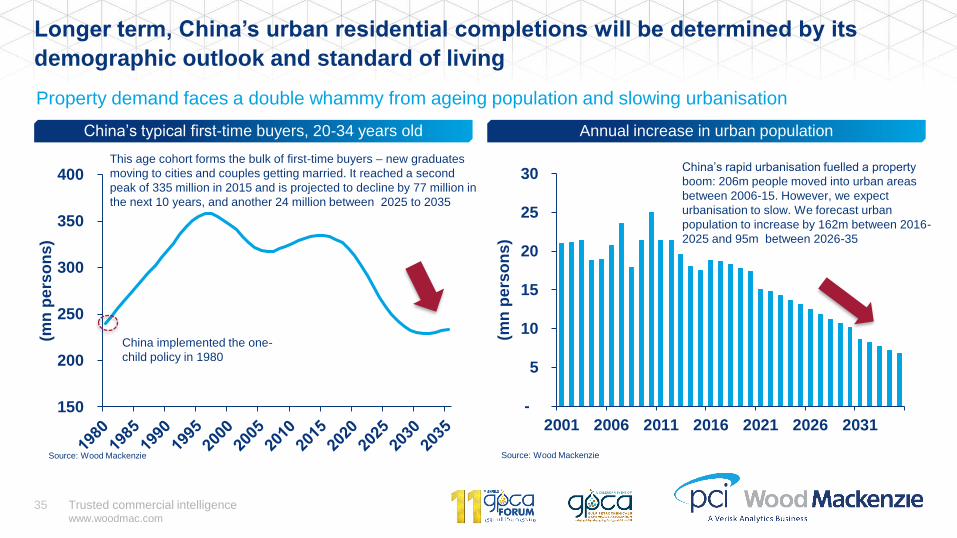
Longer term, China’s urban residential completions will be determined by its
demographic outlook and standard of living
China’s typical first-time buyers, 20-34 years old Annual increase in urban population
150
200
250
300
350
400
(mn
pe
rso
ns)
Source: Wood Mackenzie
-
5
10
15
20
25
30
2001 2006 2011 2016 2021 2026 2031
(mn
pe
rso
ns)
Source: Wood Mackenzie
This age cohort forms the bulk of first-time buyers – new graduates
moving to cities and couples getting married. It reached a second
peak of 335 million in 2015 and is projected to decline by 77 million in
the next 10 years, and another 24 million between 2025 to 2035
China’s rapid urbanisation fuelled a property
boom: 206m people moved into urban areas
between 2006-15. However, we expect
urbanisation to slow. We forecast urban
population to increase by 162m between 2016-
2025 and 95m between 2026-35
China implemented the one-
child policy in 1980
Property demand faces a double whammy from ageing population and slowing urbanisation
Trusted commercial intelligencewww.woodmac.com
36
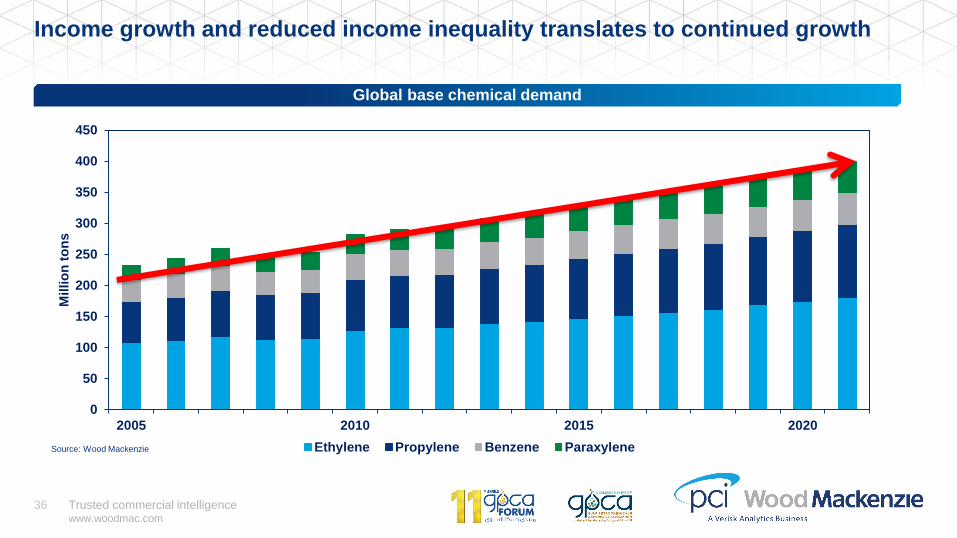
Income growth and reduced income inequality translates to continued growth
Global base chemical demand
0
50
100
150
200
250
300
350
400
450
2005 2010 2015 2020
Millio
n t
on
s
Ethylene Propylene Benzene ParaxyleneSource: Wood Mackenzie
Trusted commercial intelligencewww.woodmac.com
37
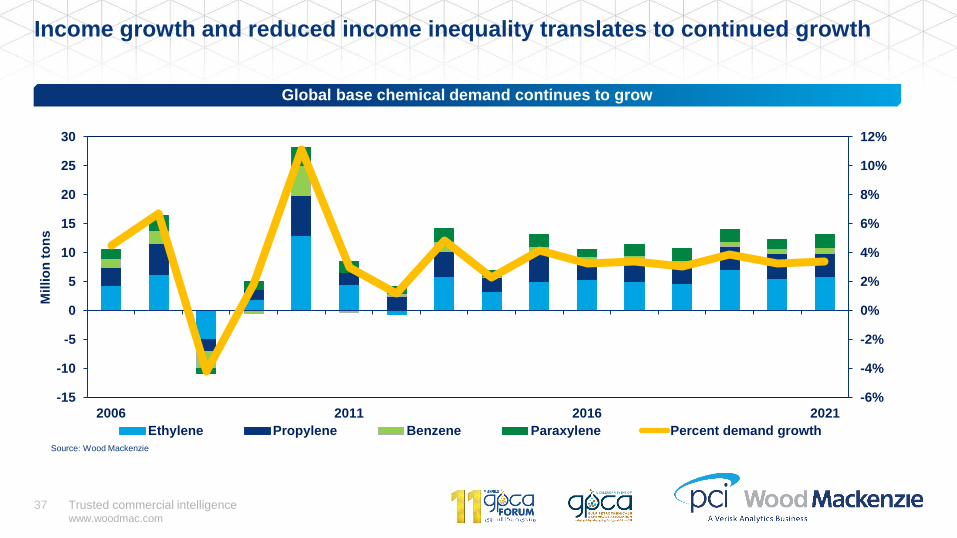
Income growth and reduced income inequality translates to continued growth
Global base chemical demand continues to grow
-6%
-4%
-2%
0%
2%
4%
6%
8%
10%
12%
-15
-10
-5
0
5
10
15
20
25
30
2006 2011 2016 2021
Millio
n t
on
s
Ethylene Propylene Benzene Paraxylene Percent demand growth
Source: Wood Mackenzie
Trusted commercial intelligencewww.woodmac.com
39
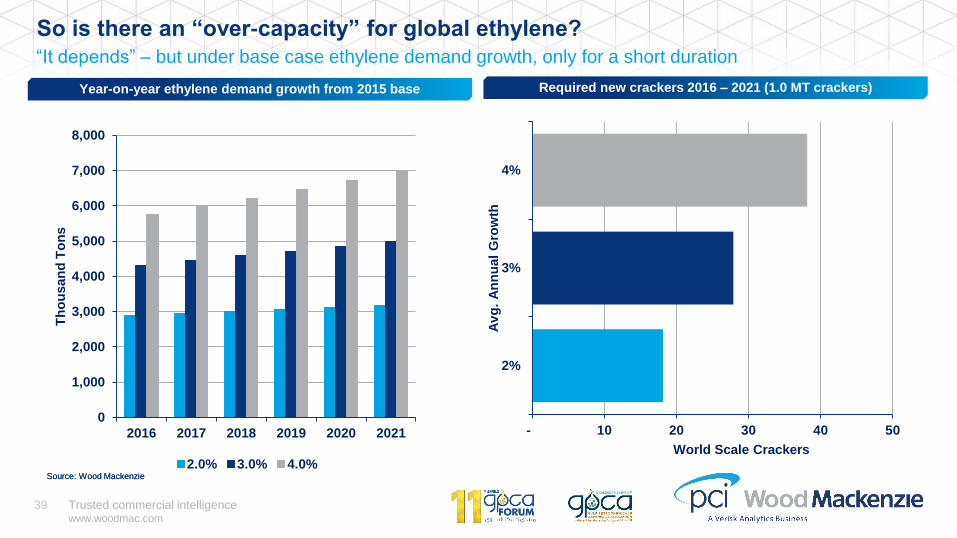
Year-on-year ethylene demand growth from 2015 base
“It depends” – but under base case ethylene demand growth, only for a short duration
So is there an “over-capacity” for global ethylene?
Required new crackers 2016 – 2021 (1.0 MT crackers)
- 10 20 30 40 50
2%
3%
4%
World Scale Crackers
Av
g.
An
nu
al
Gro
wth
0
1,000
2,000
3,000
4,000
5,000
6,000
7,000
8,000
2016 2017 2018 2019 2020 2021
Th
ou
san
d T
on
s
2.0% 3.0% 4.0%Source: Wood MackenzieSource: Wood Mackenzie
Trusted commercial intelligencewww.woodmac.com
40
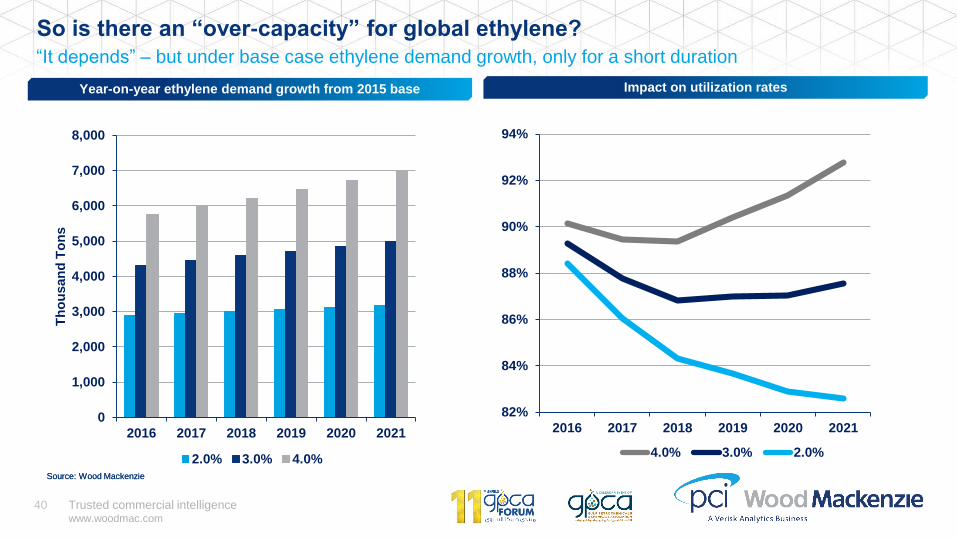
Year-on-year ethylene demand growth from 2015 base
“It depends” – but under base case ethylene demand growth, only for a short duration
So is there an “over-capacity” for global ethylene?
Impact on utilization rates
0
1,000
2,000
3,000
4,000
5,000
6,000
7,000
8,000
2016 2017 2018 2019 2020 2021
Th
ou
san
d T
on
s
2.0% 3.0% 4.0%
Source: Wood MackenzieSource: Wood Mackenzie
82%
84%
86%
88%
90%
92%
94%
2016 2017 2018 2019 2020 2021
4.0% 3.0% 2.0%
Trusted commercial intelligencewww.woodmac.com
41
Agenda
The current competitive arena for olefins and aromatics
» Who are the winners and losers in an evolutionary world?
Amid economic fragility can chemical growth continue?
Impact on trade flows as new capacity is commissioned
» Focus on China imports
» Impact on key exporting regions
Conclusions
Trusted commercial intelligencewww.woodmac.com
42
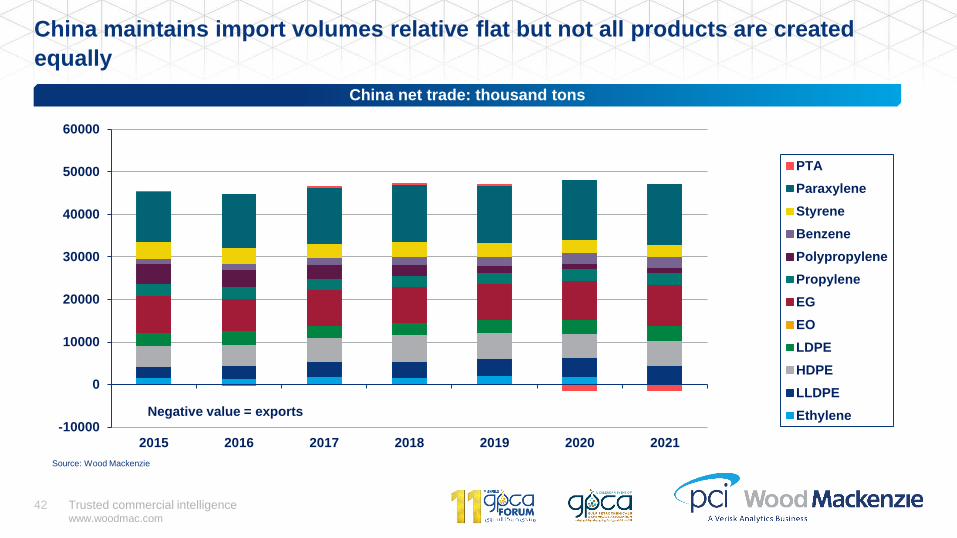
China maintains import volumes relative flat but not all products are created
equally
China net trade: thousand tons
-10000
0
10000
20000
30000
40000
50000
60000
2015 2016 2017 2018 2019 2020 2021
PTA
Paraxylene
Styrene
Benzene
Polypropylene
Propylene
EG
EO
LDPE
HDPE
LLDPE
Ethylene
Source: Wood Mackenzie
Negative value = exports
Trusted commercial intelligencewww.woodmac.com
43
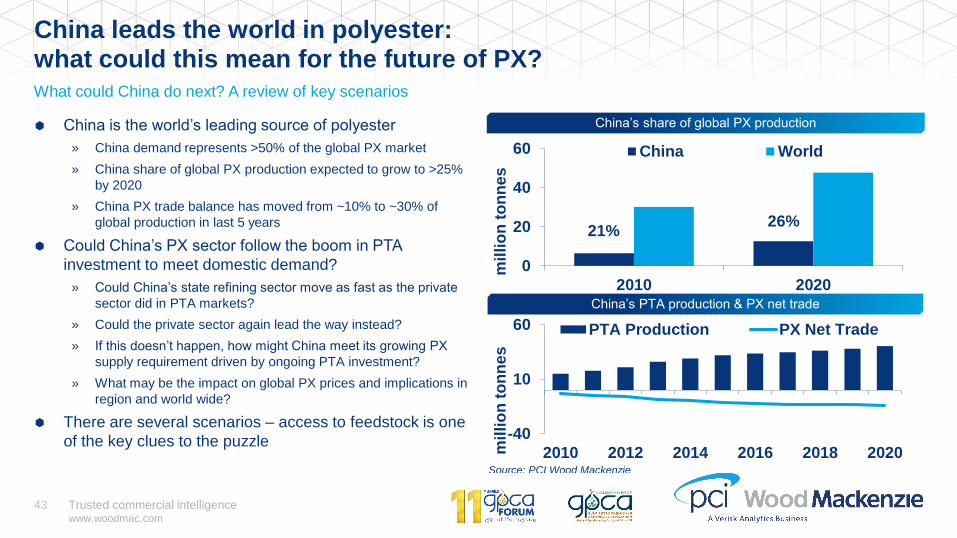
China leads the world in polyester: what could this mean for the future of PX?
China is the world’s leading source of polyester
» China demand represents >50% of the global PX market
» China share of global PX production expected to grow to >25%
by 2020
» China PX trade balance has moved from ~10% to ~30% of
global production in last 5 years
Could China’s PX sector follow the boom in PTA
investment to meet domestic demand?
» Could China’s state refining sector move as fast as the private
sector did in PTA markets?
» Could the private sector again lead the way instead?
» If this doesn’t happen, how might China meet its growing PX
supply requirement driven by ongoing PTA investment?
» What may be the impact on global PX prices and implications in
region and world wide?
There are several scenarios – access to feedstock is one
of the key clues to the puzzle
What could China do next? A review of key scenarios
0
20
40
60
2010 2020
mil
lio
n t
on
nes
China World
21%26%
China’s share of global PX production
-40
10
60
2010 2012 2014 2016 2018 2020mil
lio
n t
on
nes
PTA Production PX Net Trade
Source: PCI Wood Mackenzie
China’s PTA production & PX net trade
Trusted commercial intelligencewww.woodmac.com
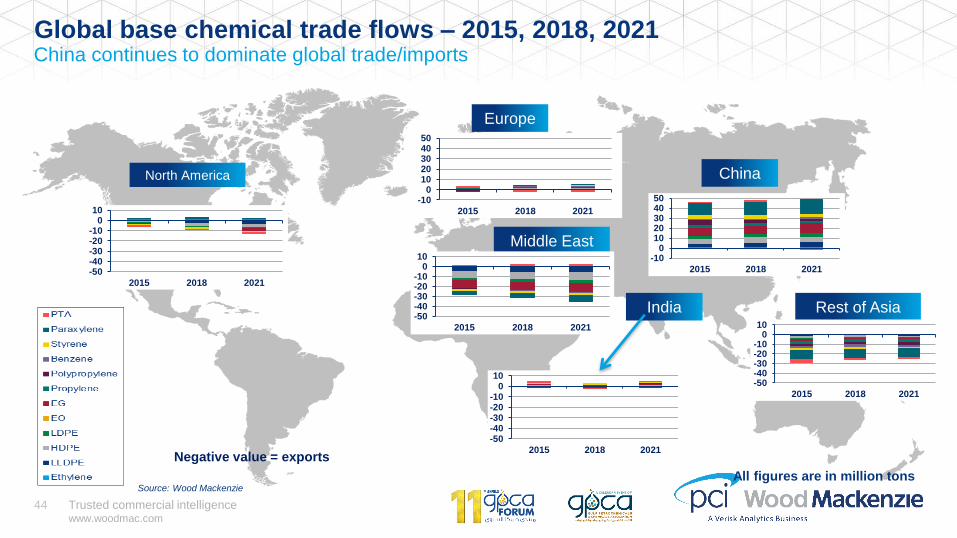
44
Global base chemical trade flows – 2015, 2018, 2021China continues to dominate global trade/imports
Source: Wood MackenzieAll figures are in million tons
North America
Europe
Middle East
China
Rest of Asia
-50-40-30-20-10
010
2015 2018 2021
-50-40-30-20-10
010
2015 2018 2021
India-50-40-30-20-10
010
2015 2018 2021
-100
1020304050
2015 2018 2021
-100
1020304050
2015 2018 2021
-50-40-30-20-10
010
2015 2018 2021
Negative value = exports
Trusted commercial intelligencewww.woodmac.com
45
Agenda
The current competitive arena for olefins and aromatics
» Who are the winners and losers in an evolutionary world?
Amid economic fragility can chemical growth continue?
Impact on trade flows as new capacity is commissioned
» Focus on China imports
» Impact on key exporting regions
Conclusions
Trusted commercial intelligencewww.woodmac.com
46
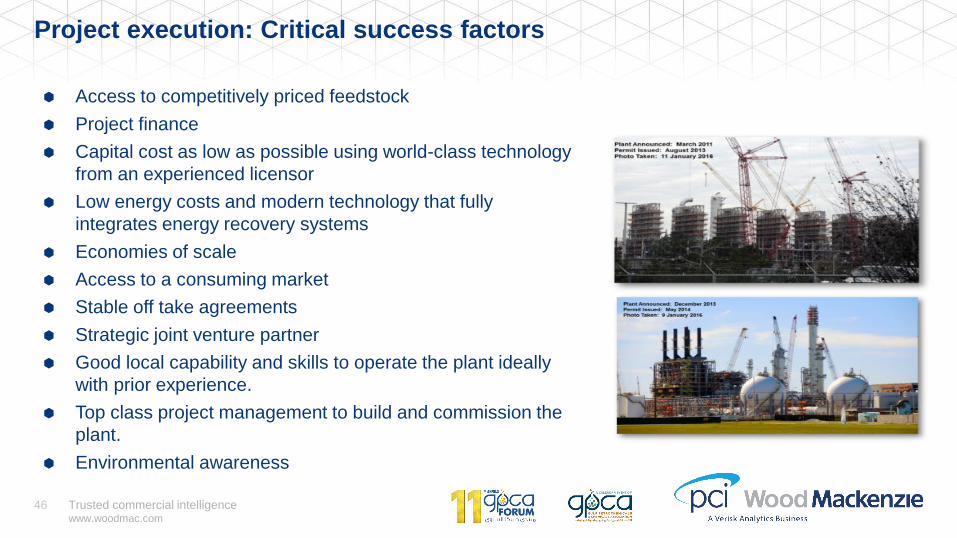
Project execution: Critical success factors
Access to competitively priced feedstock
Project finance
Capital cost as low as possible using world-class technology
from an experienced licensor
Low energy costs and modern technology that fully
integrates energy recovery systems
Economies of scale
Access to a consuming market
Stable off take agreements
Strategic joint venture partner
Good local capability and skills to operate the plant ideally
with prior experience.
Top class project management to build and commission the
plant.
Environmental awareness
Trusted commercial intelligencewww.woodmac.com
47
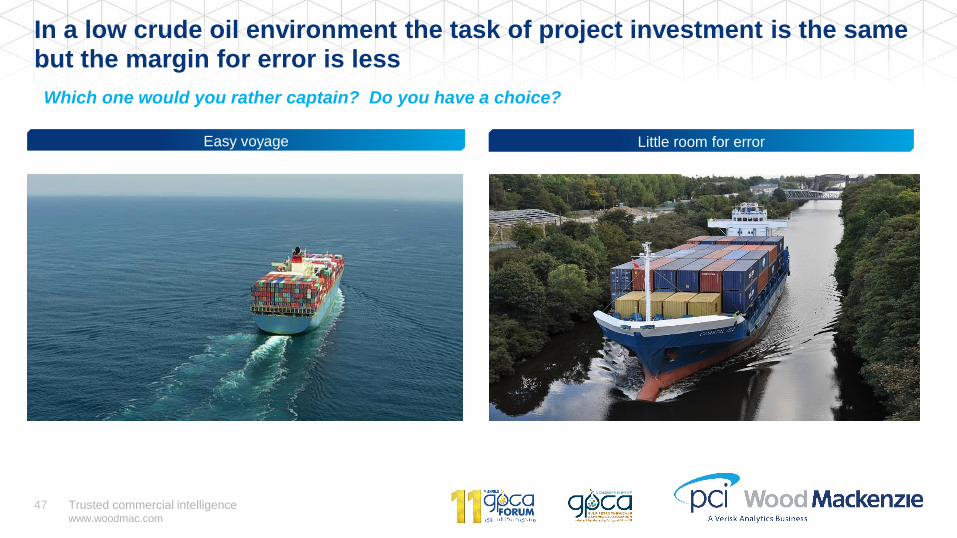
In a low crude oil environment the task of project investment is the same but the margin for error is less
Easy voyage Little room for error
Which one would you rather captain? Do you have a choice?
Trusted commercial intelligencewww.woodmac.com
48
Lower oil prices flatten the olefins supply curve
complicating where to invest and which feedstock to utilize.
With forecast rising crude prices light olefins feedstocks
should enjoy advantaged costs.
Global chemical demand is expected to continue to grow
requiring extensive investments for years to come.
Global trade for most products will only rise to meet
growing demand.
Overall profitability of olefins-polyolefins chain is expected
to soften but with base case growth it will be a relatively
quick rebound.
China PX trade deficit is now 30% of global production
driving demand and trade. Extensive new capacity has yet
to be fully absorbed.
Key
takeaways
Conclusions

Trusted commercial intelligencewww.woodmac.com
49
Disclaimer
This presentation has been prepared by Wood Mackenzie Limited. The presentation is intended
solely for the benefit of attendees and its contents and conclusions are confidential and may not
be disclosed to any other persons or companies without Wood Mackenzie’s prior written
permission.
The information upon which this presentation comes from our own experience, knowledge and
databases. The opinions expressed in this report are those of Wood Mackenzie. They have been
arrived at following careful consideration and enquiry but we do not guarantee their fairness,
completeness or accuracy. The opinions, as of this date, are subject to change. We do not
accept any liability for your reliance upon them.
Strictly Private & Confidential

Wood Mackenzie™, a Verisk Analytics business, is a trusted source of commercial intelligence for the world's
natural resources sector. We empower clients to make better strategic decisions, providing objective analysis
and advice on assets, companies and markets. For more information visit: www.woodmac.com
WOOD MACKENZIE is a trade mark of Wood Mackenzie Limited and is the subject of trade mark registrations and/or applications in
the European Community, the USA and other countries around the world.
Europe +44 131 243 4400
Americas +1 713 470 1600
Asia Pacific +65 6518 0800
Email [email protected]
Website www.woodmac.com


