83
INVESTOR PRESENTATION

INVESTOR PRESENTATION

DISCLAIMER
The communication may contain statements relating to futurebusiness developments, company’s performance and economicperformance that may constitute ‘forward looking statements’.p y gWhile these forward looking statements represent the company’sjudgments and future expectations, a number of factors could causeactual developments and results to differ materially fromexpectations. The company undertakes no obligation to publiclyrevise any forward-looking statements to reflect future events orcircumstances.
CUMI @ 2013 2

Murugappa GroupAn Overview
CUMI @ 2013 3

MURUGAPPA GROUP MURUGAPPA GROUP INR 225 BillionConglomerate
O f th l t f il t d
Conglomerate
One of the largest family promoted, professionally managed, diversified business groups
CUMI @ 2013 4

Th Phil h h i hThe Philosophy we cherish
The fundamental principle of economic activity is that No man you transact with will lose; then you shall not.
CUMI @ 2013 5

Murugappa Group Today
~ INR 225 Billion ConglomerateOne of the largest family promoted, professionally managed, diversified g y p , p y g ,business Groups…
CUMI @ 2013 6

The Spirit of the Murugappa Group
CUMI @ 2013 7

Corporate Social Responsibility
AMM Foundation
1% of PAT from Group companies to AMM1% of PAT from Group companies to AMMFoundation
4 Schools, a polytechnic; approximately 11,000 students
4 Hospitals - over 8,00,000 patients treated last yeartreated last year
Scholarships for needy meritorious Students
Research centre for technology for therural & urban poor
CUMI @ 2013 8

Carborundum Universal
CUMI @ 2013 9

Birth Of CUMI
19541954
CARBORUNDUM UNIVERSALUK
• Incorporated as a joint venturebetween Carborundum CompanyUSA, Universal Grinding WheelCompany, UK and the Murugappa,India USA UKIndia
• Acquired a coated abrasives facilityfrom Ajax products Pvt Ltd
• B d d b i f ilit t i• Bonded abrasives facility set up inChennai India
CUMI @ 2013 10

Business PortfolioCUMI – FY 13Sales Share PBIT ShareCUMI – FY 13
Revenue :Rs. 19.4 bn EBIT :Rs. 1.8 bn Capital Employed :Rs. 15.8 bn
Abrasives Revenue : Rs 8.1 bn
Ceramics Revenue : Rs 5.0 bn
Electro-minerals Revenue : Rs 6.7 bn
EBIT : Rs 0.8 bn Capital Employed : Rs 5.4 bn
EBIT : Rs 0.8 bn Capital Employed : Rs 3.7 bn
EBIT : Rs 0.2 bn Capital Employed : Rs 5.3 bn
Industrial Ceramics Super Refractories
Heat ResistanceWear Resistance
CUMI @ 2013 11
AbrasionHeat ResistanceWear Resistance
Electro Resistivity Electro Minerals

25 F t i 7 C t i
CUMI Consolidated
25 Factories 7 CountriesOver 4750 plus Employees. 2100 plus employees outside India Consolidated Gross Sales Rs 2042 cr (FY 12‐13 )Market Cap ~ Rs 2250 cr.Products being sold in 43 countries
CUMI @ 2013 12

RUSSIA Abrasives
CUMI World Wide- By Business Verticals
CANADA
CHINA
Ceramics
Electro mineralsAbrasives
Ceramics
USA
CHINA
Abrasives
Ceramics
THAILAND
Abrasives
Abrasives
INDIA AUSTRALIAUAEEUROPES. AFRICAFoskor ZirconiaTRI
Electro Minerals Abrasives
Ceramics
Ceramics
Electro minerals
AbrasivesAbrasives
Electro minerals
Electro Minerals
Ceramics
Abrasives l Ceramics l Electro Minerals CUMI @ 2013
Electro minerals
Manufacturing Base Marketing & Distribution Base13

OUR VISION/MISSION
ISIO
NIS
ION We will be an Admired Company in
Abrasives & Technical Ceramics, drivenby Innovation to create StakeholderVIVI by Innovation, to create StakeholderWealth.
SSIO
NSS
ION Become one of the largest Abrasives
(including Super Abrasives) / TechnicalCeramics in the Company in the World by
MIS
MIS Ceramics in the Company in the World by
2020.
CUMI @ 2013 14

ABRASIVESABRASIVES
CUMI @ 2013 15

ABRASIVES – Product Range
Coated AbrasivesThin wheels
A Strong Regional Player with the
A Strong Regional Player with thePlayer with the
complete Range of products.
Player with the complete Range
of products.
Bonded
Super AbrasivesConstruction
Products
CUMI @ 2013
Power toolsMetal Working Fluids
16

• Abrasives are made of hard tough and wear resistant materials used to shape or
ABRASIVES• Abrasives are made of hard, tough and wear resistant materials used to shape or
finish a work-piece. Abrasives are used for diverse applications ranging from material removal, polishing and finishing in multiple industries like automobile, auto-ancillaries, fabrication, construction and wood-working. There are 3 types of Abrasives
– Bonded: Bonded abrasives are mostly in the form of grinding wheels and used in diverse applications like fabrication & grinding
– Coated: A coated abrasive comprises an abrasive fixed to a backing material such as paper, cloth and fibre. Sandpaper is a very common coated abrasive. They are used in polishing.
– Super Abrasives: Involve high quality grains such as diamond or cubic boron nitride.
• CUMI manufactures all the 3 types of Abrasives (Super Abrasives through the JV Wendt India)
CUMI @ 2013 17

ABRASIVES - Application
Bonded Products and other applications ….
For Rough Grinding and Cutting applications:-
General EngineeringFabricationFoundryRolling MillsProjects
and other applications ….
and other applications ….
Thin Wheels
Coated Products
CUMI @ 2013 18

ABRASIVES - Application
Wood working Metal working Construction
and other applications ….
Power Tools
Rotary Tools Cutting Tool industries
Creep Feed grindingNotch and Slot grinding
Power Tools
Super Abrasives Products
gPrinting and Paper Roll grinding
Ceramic and Tile grindingWood Working Tools
Notch and Slot grindingTungsten Carbide Roll grindingCeramic and Refractory grindingGlass Industry
and other applications ….
CUMI @ 2013 19
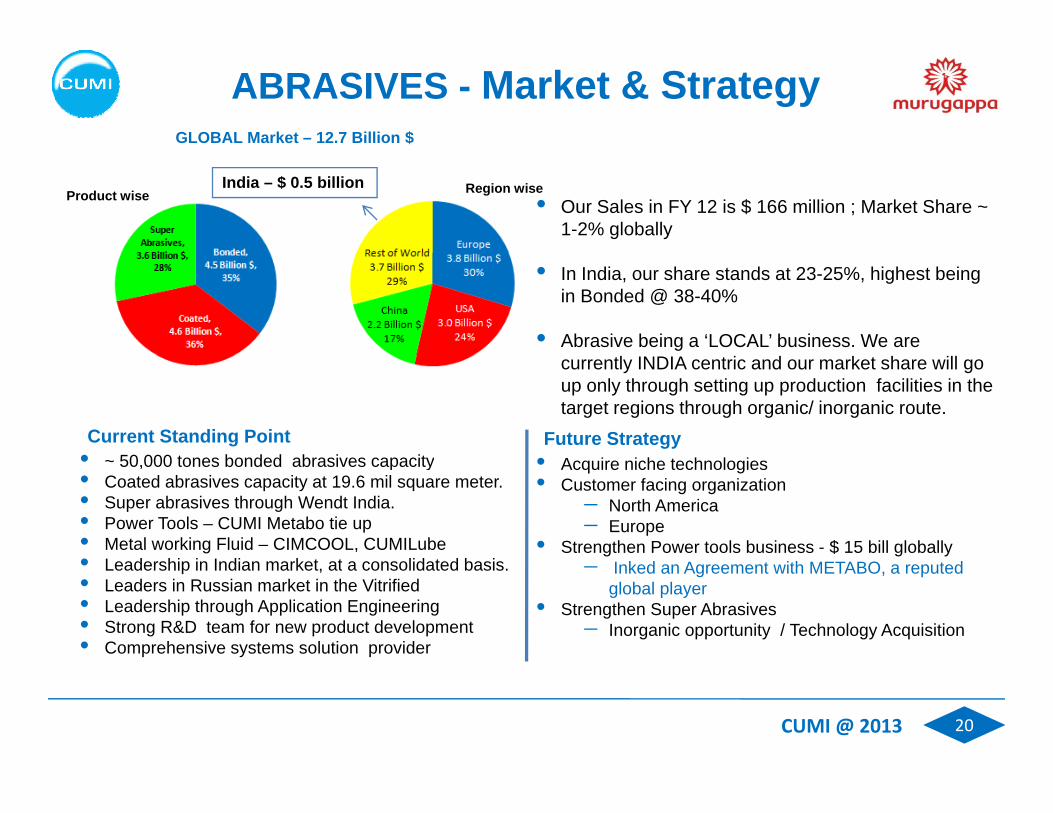
ABRASIVES - Market & StrategyGLOBAL Market – 12.7 Billion $
• Our Sales in FY 12 is $ 166 million ; Market Share ~ 1-2% globally
Product wise Region wiseIndia – $ 0.5 billion
• In India, our share stands at 23-25%, highest being in Bonded @ 38-40%
• Abrasive being a ‘LOCAL’ business. We are currently INDIA centric and our market share will go up only through setting up production facilities in the target regions through organic/ inorganic route.
• 50 000 tones bonded abrasives capacity • A i i h t h l iCurrent Standing Point Future Strategy
• ~ 50,000 tones bonded abrasives capacity• Coated abrasives capacity at 19.6 mil square meter.• Super abrasives through Wendt India.• Power Tools – CUMI Metabo tie up• Metal working Fluid – CIMCOOL, CUMILube• L d hi i I di k t t lid t d b i
• Acquire niche technologies• Customer facing organization
North America Europe
• Strengthen Power tools business - $ 15 bill globally • Leadership in Indian market, at a consolidated basis.• Leaders in Russian market in the Vitrified• Leadership through Application Engineering• Strong R&D team for new product development• Comprehensive systems solution provider
Inked an Agreement with METABO, a reputed global player
• Strengthen Super Abrasives Inorganic opportunity / Technology Acquisition
CUMI @ 2013 20

Abrasives Marketing Network
Plants Plants
Warehouses Institutions
Dealers We have ~ 500 dealersWe have ~ 1000 sub dealersSales Mix is 40% institutions, 60%
through channels to retail customers
Sub Dealerthrough channels to retail customers
Retail Customer Small Institutions
CUMI @ 2013 21

ABRASIVES – FacilitiesMarketing & Manufacturing
Sriperumbudur, Chennai CUMI Middle EastThiruvottriyur, Chennai Hosur, Tamil Nadu UttarkhandDistribution
dia
CACCL, ChinaVAW, Russia
CUMI Canada
Ind
Venlo Netherlands
Ove
rsea
s
Wendt, India Wendt, Thailand/CME Sterling Abrasives, Gujarat
CUMI USA
Sub
s / J
V’s
CUMI @ 2013 22

ABRASIVES INDUSTRY VALUE CHAIN
Input Materials Manufacturing Marketing Sales and ServiceInput Materials
Internal access to key
Manufacturing
Process
Marketing
Application
Sales and Service
Brand and access to key inputs.
New input t i l
Capability
Low cost
ppEngineering
New Product
Distribution
Customer f i material
development
S l
Low cost locations
R
New Product Development facing
Organization
Scale Range
CUMI @ 2013 23
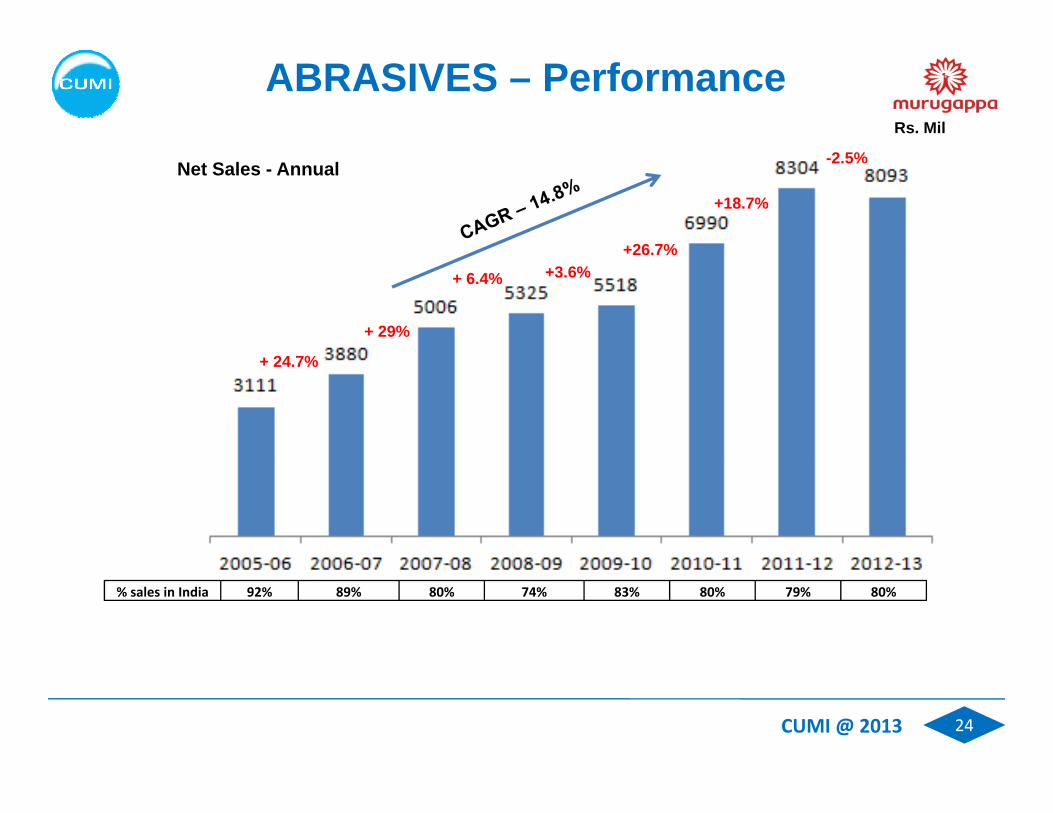
ABRASIVES – PerformanceRs. Mil
Net Sales - Annual
+26.7%
+18.7%
-2.5%
24 %
+ 29%
+ 6.4% +3.6% +26.7%
+ 24.7%
% sales in India 92% 89% 80% 74% 83% 80% 79% 80%
CUMI @ 2013 24

INDUSTRIALINDUSTRIAL CERAMICS
CUMI @ 2013 25

INDUSTRIAL CERAMICS Product Range
Wear Protection
ICMetallized Ceramics
Engineered Ceramics
CUMI @ 2013 26

INDUSTRIAL CERAMICS • A ceramic is an inorganic, non metallic solid prepared by the action of heat and subsequent
cooling CUMI is into Alumina based Industrial ceramics There are broadly three productcooling. CUMI is into Alumina based Industrial ceramics. There are broadly three product categories, which CUMI is into
– Wear Resistant products (Tiles): These are weldable and pastable alumina ceramic tiles that can be bonded onto the surface to be protected from wear. They are used in p yindustries where bulk material movement causes heavy wear of the equipment and thus these products are used to protect equipment from heavy abrasion and wear.
– Lined Equipments - these are fabricated steel lined with ceramics as per customers' requirement. They are also used in industries for Wear and corrosion resistance application
– Engineered Ceramics: These come in different types: - Ceramic Seals, Customized Ceramics, Insulators & Ignitors, Textile components and Zirconia components.
– Metz Cylinders and Devices: They are used in industries for Electrical resistivity application. The products come in three different types:-
– Metallized Ceramics for vacuum interruptersM t lli d C i f l t i l d l t i d i
CUMI @ 2013
– Metallized Ceramics for electrical and electronic devices– Metallized ceramic brazed components
27

INDUSTRIAL CERAMICS ApplicationsP G ti Power Generation
Coal Mill (Inner Cone, Multiport Outlet Valve, Mill Discharge Valve, Mill Inner Dia Lining, Orifices, Ventury Vanes)
Bends (Tranisitions & Y- Pieces) Ash Handling (Bends & Slurry Pipes)
Wear Resistant Productsg ( y p )
Cement Industry – Coal and Raw Mill
Coal washeries and Material Handling
Lined Equipment
Pulverized Fuel Bends Cement Industry
Boiler industry Textile industry Boiler industry Pump Shaft Sleeves Pump plungers Pump Cylinder Liners
Textile industry Electronics
Engineering Ceramics
Electrical transmission and distribution Electronics industry Textile machinery Defense
Medical Electronics Solid Oxide Fuel Cells
CUMI @ 2013
DefenseMetalized Products
28

INDUSTRIAL CERAMICS – Market & Our Standing
• Over 6800 tons tiles and 0.8 million cylinderscapacity in India
GLOBAL Market for Advanced CERAMICS• Out of the total $ 13 billion market, Alumina based Ceramics
material is around ~ 5 billion.
Alumina based C i M k Million $ Our Market
Sh
Current Standing Point
• Leadership in Indian and Australian market.Active player in North American and SouthAfrican market
• This being a GLOBAL business, 65% of the
Ceramics Market Million $ ShareEnergy and Aerospace 250 6%Wear Resistant 1000 3%Bio Ceramics 3500 ‐Defense 75 ‐
produce is exported.
• Leadership established, through
Developing manufacturing technology and
• In Energy and Aerospace category, market for Metallizedproducts would be around 80 million $. Our Share in theMetallized Ceramics market is around 18% and in the overall
Cutting Tools 175 ‐Total 5000
achieving process efficiency and scale Designing and providing end to end solution
in India and Installation/ Servicing incustomer country
Energy and Aerospace is 6%
• In Wear Resistant application, global market for our range ofWear resistant products would be around 200 million $. OurShare in the market would be 14% and in the overall WearResistance is 3% • The division uses Lean and Six Sigma to drive
efficiencyResistance is 3%
• Our strategic intent is to (a) increase market share byaddressing newer geographies (b) introduce new productofferings to increase our addressable market size which iscurrently limited to 280 million $
CUMI @ 2013
currently limited to 280 million $
29

INDUSTRIAL CERAMICS – Future Strategy
• Currently we are in the business of Alumina based Ceramics. We constantly look at extending offerings in that range and target
Products Competing Criteriag g g g
newer industries.
• Move up the Value Chain constantly by offering high value products We have been
Metz Cylinders
chai
n
Technology, Process Capability
offering high value products. We have been actively pursuing the same as depicted in the picture alongside.
Armored & Engineered ceramics
the
valu
e c
Technology, Process Capability
• Build customer facing entities as we have in Australia to provide end to end solutions in other geographies – South Africa / North America.
Wear & Corrosion resistant product
Mov
ing
up t
Cost, Installation Service Capability
• Grow in Ceramic medical businessGrinding Media M
Cost
CUMI @ 2013 30

INDUSTRIAL CERAMICS Facility
We have World Class facility based out of HOSUR, Tamil Nadu
We have one of the few six sigma ceramic operations in the World
CUMI @ 2013 31

INDUSTRIAL CERAMICS INDUSTRY VALUE CHAIN
Input Materials Design and Manufacturing Sales and Input Materials
Internal access
Engineering
Application
Manufacturing
Process
Installation
Customer facing to key inputs.
New input t i l
ppKnowledge
EPC Contractors /
Capability
S l
facing Organization
Installation / S i material
developmentContractors /
Consultant Approvals
Scale
Plant
Service capability
Scale Plant Engineering
CUMI @ 2013 32

SUPERSUPER REFRACTORIES
CUMI @ 2013 33

SUPER REFRACTORIES– Product RangeCUMI Refractory Products
Fired products
Silicon Carbide (CUMIFRAC)
Monolithics
Conventional Dense
C t bl
Precast Shapes
(CUMIFRAC)
Nitride bonded Silicon Carbide
Castables (CUMICRETE)
Insulation Castables
(CUMICRETE Li ht W i ht)
Mulite (CUMILITE)
Light Weight)
Low cement castables
(CUMIHICAST & CUMIPLASCAST)
High Alumina (CUMILOX)
Zirconia Mulliteand Zircon (
Self Flow Castables (CUMIFLOW
&CUMICAST EF)
(CUMIZITE & CUMIZON)
Insulation Firebricks (CUMILAG)
Ramming Mass (CUMIRAM)
Laying Mortars (CUMILAG)(CUMI Bond)
CUMI @ 2013 34

SUPER REFRACTORIES
R f t i t i l th t ith t d hi h t t CUMI i• Refractory is any material that can withstand high temperature. CUMI is into High Alumina, Silicon Carbide, Zirconia based refractories which are capable to withstand very high temperature:-
Fired Refractories: Is a block of refractory ceramic material used in lining furnaces, kilns & fireplaces. A refractory brick is built primarily to withstand high temperature.
Monolithics: These are refractory material in powder form. These are materials which are installed as some form of suspension that ultimately harden to form a solid mass.
• The division also manufactures and sells Anti-corrosive products: Corrosion is a degradation of materials’ properties caused by chemical reaction with their environments. Anti-corrosive products are used in plants/ products which undergo such corrosion.
CUMI @ 2013 35

SUPER REFRACTORIES - Application
Ceramic Industries Chemical Process Industries Non – FerrousCeramic IndustriesInsulatorsSanitaryware & TablewareAbrasives
Chemical Process IndustriesCarbon BlackFertilizerPetro-Chem. / Refinery
Non FerrousAluminumCopperZinc
Wall TilesRefractoriesElectro Ceramics
Cement Iron & Steel
GlassContainer
Soda lime
Power Generation Boiler
Sponge Iron (DRI)Gas-Based Coal - Based
Soda-limeBoro-silicate
DecorativeFibreglass
Foundries
g
CUMI @ 2013 36

REFRACTORY MARKET
World Refractory Demand ($30 billion) by Regions
World Refractory Demand ($30 billion) by Industry
Global Refractory market - $30 BillionGlobal demand for refractories is projected to rise 4-5 percent per year
CUMI @ 2013 37

SUPER REFRACTORIES – Market & Strategy• The Global size of Refractory business could be estimated to
th t t f $ 30 billi • Over 9 500 tons Fired capacity in India andCurrent Standing Point
the extent of ~ $ 30 billion• Refractory is a ‘LOCAL’ business. 90% of our sales are in
domestic market.India Market
P d t i Industry CUMI’s Addressable CUMI’s
Rs. Cr
• Over 9,500 tons Fired capacity in India and Russia. Around 32,000 tons monolithic capacity in India; NbSiC capacity in Russia
• Leadership in Indian market in select productsActive player in the Russian marketProduct wise y
Market Size Market Size Market Share
Basic 1200Dolomite 400High Alumina 1100 200 38%
Active player in the Russian market.
• Leadership in Fiber Refractories in Indian market through MMTCL JV
• Niche product offerings in Glass and Carbon High Alumina 1100 200 38%
Silica 200Flow Control 500Monolithics 1100 400 12%
p gBlack industry in India and Aluminium industry in Russia.
• Ability to manufacture complex shapes
Future StrategyTOTAL 4500
• We operate only in Fired High Alumina and Monolithicsbusiness, that too for not entire temperature range, but only forspecific high end range . Hence our addressable market size is~ Rs 600 cr
• Green field project for capacity expansion• Inorganic opportunity – with success
100% stake in RHI Isithebe, South Africagiving us 1500 tons Fired capacity and 6000tons Mono
Future Strategy
~ Rs. 600 cr
• We have entered with Technology agreement with SheffieldRefractories, UK and Anderman Ceramics, UK . We have alsoacquired 100% stake in TRI, South Africa. With these we wouldbe entering Flow Control market and also increasing our
tons Mono Techno-commercial agreement with Sheffield
Refractories, UK and with AndermanCeramics, UK to manufacture, supply andinstall a range of high end refractory solutionsfor the Steel industry, Glass industryIn 2011 we had formed JV with Israel based
CUMI @ 2013
be entering Flow Control market and also increasing ouraddressable market size in High Alumina and Monolithics.
In 2011, we had formed JV with Israel basedcompany, for a new Refractory material.
38

SUPER REFRACTORIES
Ability to manufacture complex shapes and meet all surge requirements
CUMI @ 2013 39

REFRACTORY INDUSTRY VALUE CHAIN
Input Materials
Design and Engineering Manufacturing Sales and
Installation
Low cost input / access
Application Knowledge
Process Capability
Customer facing
Organization
Energy / Power
OE Approvals Scale
Installation / Service
capability
Plant Engineering
Low cost
CUMI @ 2013 40

CERAMICS (Industrial Ceramics and Refractories)-Performance
Net Sales - Annual Rs. Mil
+9 3%
+ 21%
+ 31%
+9.3%
+ 26.8%
+ 17.4% + 11.1%
+ 21%
+20.4%
% l i I di 54% 54% 64% 64% 62% 67% 60% 53%
CUMI @ 2013
% sales in India 54% 54% 64% 64% 62% 67% 60% 53%
41
ELECTRO MINERALSELECTRO MINERALS
CUMI @ 2013 42

ELECTROMINERALS – Product Range
Brown Fused Alumina White Fused Alumina Silicon carbide Zirconia Specialty minerals
Bonded Abrasives
Refractory Silicon wafer slicing
Diesel Particulate Filter
Coated Abrasives
Metallurgical Investment casting
Floor Laminates
Surface Engineering Refractories Energy & Environment
CUMI @ 2013
Surface Engineering Refractories Energy & Environment
43

ELECTROMINERALS - Application
Refractory Bonded Abrasives Coated Abrasives Dermabrasion
Semi Conductor Lapping Laminates Pressure Blasting
CUMI @ 2013
Photovoltaic Plasma Spray Particulate Filters Metalurgical
44

ELECTROMINERALS – Facility
11
2
1 Bauxite mines & calcination 3
2 Sili bid 5400 t
4
3 Fine powders, 11,400 tpa
2 Silicon carbide, 5400 tpa
4 Fused alumina ~22000 tpa
5 12 MW Hydel power, Maniyar
5
CUMI @ 2013
5 yde po e , a ya
45

ELECTROMINERALS – Overseas Facility
VAW -Russia
VAW Russia – Silicon Carbide, 70000 tpa
Foskor Zirconia Fused Foskor Zirconia Foskor Zirconia – Fused Zirconia, 10000 tpa
TRI – 22k tpa fusion facility
Thukela Refractory
CUMI @ 2013 46

ELECTRO MINERALS –Global Capacity & Our Standing
• Fused Zirconia Global capacity of Fused Zirconia ~ 75k tons per
annum
• Established leadership in Russian and Indian market
Global Capacity and Our Share Current Standing Point
annum. With 10k tons per annum, we are the third largest in
the world after Saint Gobain and Imerys. Around 40% capacity is in China
• Sili C bid
• Locational advantage in Russia by way of low power and pet coke cost providing significant cost competitiveness in SiCbusiness• Silicon Carbide
Global capacity is ~ 2 million tonnes. Price and Cost movements, macro factors, keeps these facilities either running or closed.
With 70k tons per annum in VAW we are the second
business
• In Speciality products, CUMI has achieved leadership in this business by way of improving process capability andlargest after Saint Gobain
Around 50% of the capacity is in China, with no single identifiable big player
• Fused Aluminas
improving process capability and Micronisation
Global capacity is ~ 1.7 million tonnes CUMI share is 1% Around 50% of the capacity is in China
CUMI @ 2013 47

ELECTRO MINERALS – Future Strategy
Innovation Value PyramidInnovation Value Pyramid
CUMI @ 2013 48

ELECTRO MINERALS – Future Strategy
I ti V l P id
C11Nano
synthesisLevel 4 – Nano Powders
Innovation Value Pyramid
• Alternative application in SiC apart from Ph t lt i
C10Ultrafine powder
processing
C9Chemical processing
Level 3 – Sol gel Ceramics Sub micron powder
Powders Photovoltaic
• Synthetic Brown Alumina in the market
• Build scale and size at lowest cost locationM i t ‘Bi F ’
C8Heat
treatment
C6Powder
processing
processing
C7Sintering
Level 2 – Controlled Crystallization and Micronization
Moving to ‘Big Furnace’ FZL – doubling of capacity by Sep 2012 Acquisition of RHI giving 30k tonnes of fused
capacity
• Organic expansion of Sintered Alumina
C3Fusion
C4Grain
processing
C5Surface coating
C1Mining
C2Calcination Level 1 ‐
Fusion
• Organic expansion of Sintered Alumina
• Continued focus on establishing technology base/ process capability through internal development – produce specialty version of ZirconiaZirconia
• Gradually increase share of level 3 in the EMD consolidated basket (refer Fig alongside)
CUMI @ 2013 49

ELECTRO MINERALS INDUSTRY VALUE CHAIN
Input Materials Technology Manufacturing Product Input Materials
Access to minerals, pet
Technology
Process
Manufacturing
Capacity /
Development
Customer , pcoke, cell
grade Alumina
L t P
Capability
Development t Alt t
p y /Scale
Low cost
Partnership
R&DLow cost Power
i
to use Alternate Inputs
Low cost Location R&D
Location
CUMI @ 2013 50

ELECTRO MINERALS - Performance
N t S l A l Rs MilNet Sales - Annual Rs. Mil
+22% -8%
9 %
+13%
+25%
+21.7% +15.9%
+97%
CUMI @ 2013 51

CUMI Growth Paradigm
n ked
ally
driv
en
y ne
twor
k
-Inte
rna
Ext
erna
lly
New Materials-E
CUMI @ 2013 52

Competency based on having a very wide Technology canvas
Products and TechnologiesApplications
• Abrasives/Grains – Material cutting and removal
Key Properties
• Hardness
Products
• Grinding Wheels
• C t d P d t
Products and Technologies
and removal
• Refractories
• Insulators
• Engineered Ceramic components
• Material removal
• Thermal resistance
• Wear resistance
• Coated Products
• Fused Grains
• High purity Ceramics
• R f t i g p(Seals)
• Nuclear imaging
• Wear resistance equipments
• High density and purity
• Corrosion resistanceProcesses
• Fusion
• Refractories
• Dimensional stability
• Electrical resistivity
• Compaction
• Sintering
• Finishing
• Surface Coating
• Electro Plating
• Powder preparation
CUMI @ 2013
• Size reduction
53

Technology Platforms
40 Technology Platforms
CUMI @ 2013 54

FINANCIALS
CUMI @ 2013 55

Revenue Growth
19685 19424
909311930 12823
1600719685 19424
+7.5% +25%
+23% -1.3%
62109093
. In
Milli
on
+46%
+31%
06‐07 07‐08 08‐09 09‐10 10‐11 11‐12 12‐13
Rs
CUMI @ 2013 56

International Revenue share (%)
5160
ge 31
45 44 44 48 51
405060
Per
cent
ag
13102030
010
06‐07 07‐08 08‐09 09‐10 10‐11 11‐12 12‐13
CUMI @ 2013 57

Income Statement Rs Million
Income StatementIncome Statement Rs. Million
2006‐07 2007‐08 2008‐09 2009‐10 2010‐11 2011‐12 2012‐13Net Sales 6210 9093 11930 12823 16007 19685 19424
Growth % 46% 32% 7.5% 25% 33% -1%EBITDA 1390 1553 1988 2435 3130 4016 2502
R Milli
EBITDA % 22.4% 17.1% 16.7% 19.0% 19.6% 20.4% 12.9%Depreciation 195 300 351 413 504 569 711PBIT 1195 1253 1637 2022 2626 3447 1791
PBIT % 19.2% 13.8% 13.7% 15.8% 16.4% 17.5% 9.2%Excep Items 0 676 288 0 235 24 0 Rs. MillionExcep. Items 0 676 288 0 235 24 0
PBT 1119 1740 1601 1714 2580 3227 1519PBT % 18.0% 19.1% 13.4% 13.4% 16.1% 16.4% 7.8%
PAT 751 1189 1037 1017 1708 2193 898PAT % 12.1% 13.1% 8.7% 7.9% 10.7% 11.1% 4.6%
Net SalesNet Sales
CUMI @ 2013 58

Segmental Performance
Net Sales (Rs. Mil) 2006-07 2007-08 2008-09 2009-10 2010-11 2011-12 2012-13
Abrasives 3880 5006 5325 5518 6990 8304 8093
Ceramics 1734 2199 2582 2871 3476 4565 4991
Electro minerals 830 2153 4245 4789 5979 7272 6688
Inter segment 351 382 370 596 704 773 737Inter segment -351 -382 -370 -596 -704 -773 -737
Others 116 116 148 241 266 316 389
Net sales 6210 9093 11930 12823 16007 19685 19424
PBIT Margin (%) 2006-07 2007-08 2008-09 2009-10 2010-11 2011-12 2012-13
Abrasives 16.0 13.4 9.8 9.4 13.7 15.0 10.3
Ceramics 22.5 20.0 20.3 19.4 17.6 19.7 15.8
Electro minerals 18.4 12.1 17.9 21.5 18.4 19.2 3.5
Total 19.2 14.5 13.7 15.8 16.4 17.5 9.2
CUMI @ 2013 59
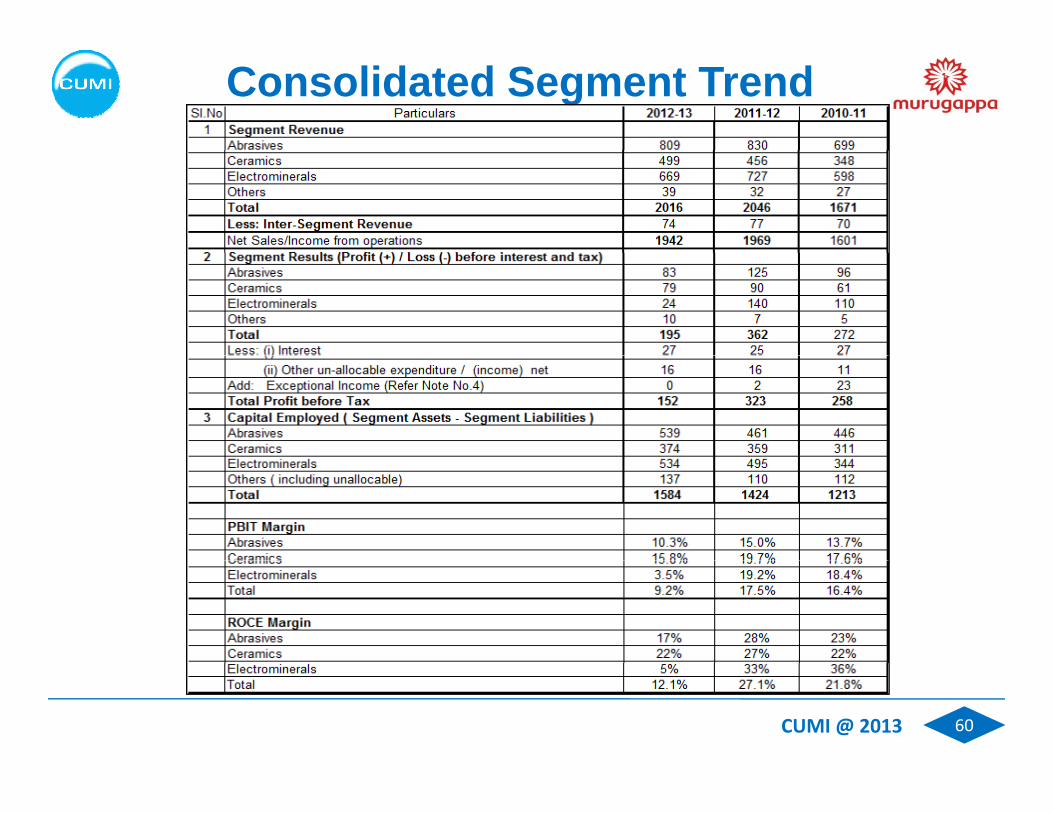
Consolidated Segment Trend
CUMI @ 2013 60

PBIT MarginSales- Rs. Mil
Segmental PerformanceAbrasives Abrasives
18 7%
-2.5%
+ 24.7% + 29% + 6.4%
+3.6% +26.7%
+18.7%
Ceramics Ceramics+ 9.3%
+20.4% + 26.8%
+ 17.4% + 11.1%
+ 21% + 31%
Electo Minerals
Electro minerals
+25%
+22% -8%
+21.7% +15.9%
+97% +13%
+25%
CUMI @ 2013 61

Performance Ratios
22.4 17.116.7
19.0 19.6 20.4
12.1
EBITDA %
06‐07 07‐08 08‐09 09‐10 10‐11 11‐12 12‐13
19.2 16 4 17.5
PBIT %
13.8 13.715.8
16.4
9.2
06‐07 07‐08 08‐09 09‐10 10‐11 11‐12 12‐13
CUMI @ 2013 62
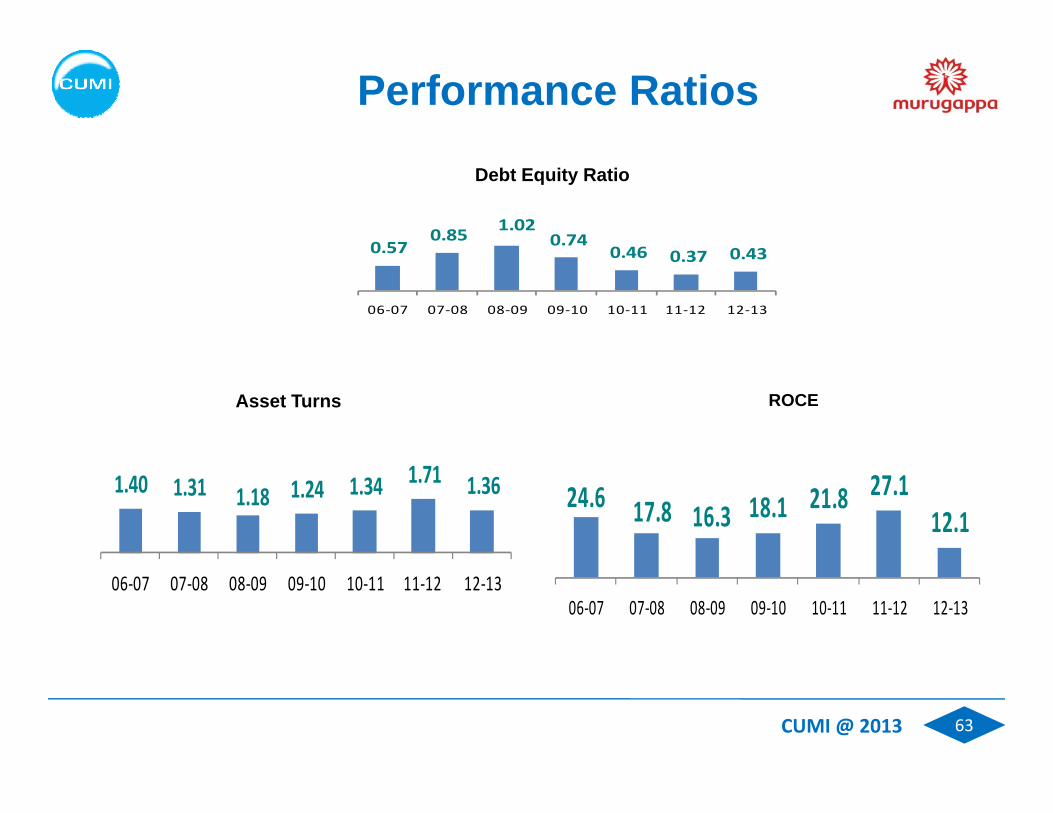
Performance Ratios
0.570.85 1.02
0.740 46 0 37 0 43
Debt Equity Ratio
0.57 0.46 0.37 0.43
06‐07 07‐08 08‐09 09‐10 10‐11 11‐12 12‐13
Asset Turns ROCE
1.40 1.31 1.18 1.24 1.34 1.71 1.36 24.6 17.8 16.3 18.1 21.8 27.112.1
06‐07 07‐08 08‐09 09‐10 10‐11 11‐12 12‐1306‐07 07‐08 08‐09 09‐10 10‐11 11‐12 12‐13
CUMI @ 2013 63

Capex for 12-13 – Key Investments
AbrasivesUltra Thin Wheels Plant in UTKVAW Debottlenecking in Abrasives
~Rs.40 Crs.
Electro-minerals CUMI blue capacity expansion FZL capacity increase VAW Maintenance and Debottlenecking
~Rs.110 Crs.
Ceramics & Refractory ~Rs.45 Crs.
Expansion of NbSiC capacity Technology Acquisition in refractory
Power ~Rs. 25 Crs. SEDCO
Capex planned in 2013-14 ~ Rs. 100 crCapex executed in 2012-13 ~ Rs. 220 cr
CUMI @ 2013
p p
64

Bubble ZirconiaNew Projects – Foskor Tilt Project
Bubble Zirconia

Production Process

Applications & Markets
Refractory (80%) Refractory (80%) Specialty chemicals (5%) Fused Cast material for Glass Industry (10%) Titanium Investment Casting (5%)
Applications addressed with existing product Titanium Investment Casting (5%)
Magnesia & Calcia Double Fused products for Refractories
existing product range
g p f f Friction – Brake Linings Pigments Technical Ceramics – Calcia Stabilised, Yttria Stabilised, New applications , ,
Magnesia Stabilised, Ceria Stabilised Thermal Spray Powders Alumina Zirconia Abrasive Grains
require high purity and fine powders – Addressed with
Bubbles
Nuclear Power Generation

Applications & Markets- Bubble Zr
Glass and CeramicsPigments
Abrasives
CUMI @ 2013 68

New Projects – Alumina Zirconia Project
Only Alumina Zirconia plant in India
Fi t f Al i Zi iFirst pour of Alumina Zirconia
CUMI @ 2013 69

New Projects – Lite ceramics Bubble
C R I L bubble project : Only bubbleC R I L bubble project : Only bubble refractory plant in the world
CUMI @ 2013 70

Barmag commissioned to address the Refractory Market
CUMI @ 2013 71

Thukhela Refractories
W ki lif b d RHIWorking on life beyond RHI
New range of BFA,WFA at Thukhela (TRI )
CUMI @ 2013 72

Then
Volzhsky Abrasives
Then..
Cleaner, Greener Volzhsky AbrasivesNow ..
CUMI @ 2013 73
Technology Transfer Signing AgreementSigning Agreement
Technology Transfer Agreement Signing with Sheffield's
CUMI @ 2013 74

Investor Friendly Company
• 42.2% held by the Murugappa Group. 33% held by FII’s, MF, PE, Insurance Cos
• 59 years of unbroken track record of Profit and Dividendy
• Six Bonus Issues since inception – 89% of the current Equity is by way of capitalization of Reserves
• Growth in the last 5 years entirely funded by Debt Internal accruals and by• Growth in the last 5 years entirely funded by Debt, Internal accruals and by unlocking value
• Investor / Analyst Interaction
Quarterly Earnings Call and Transcripts upload
Minimum 2 investors Presentation in Mumbai and Abroad
Bi A l C i ti f t t ll i t Bi Annual Communication on company performance sent to all investors
100 plus investor visits / tele conference in a year
CUMI @ 2013 75

Market Performance RatiosDi id d P t R tiDividend Payout Ratios
CUMI @ 2013 76

Exhibition / Conference
Refractory Exhibition in Russia - Mirstekla Glasstech Asia – Bangkok
CUMI @ 2013 77

Exhibition / Conference
NMD Conference, Jamshedpur, November 2012
78CUMI @ 2013

CUMI Skill Development Center
In order to develop alternative to contract /flexi system andto contract /flexi system and ensure ready availability of Skilled Workmen, CUMI launched Skill development C t i HCenter in Hosur
CUMI @ 2013 79

Accolades
CUMI i i h S h CUMI i i h I i lCUMI team winning the Southern Region Kaizen Competitions by CII.
CUMI team winning the International Competitions of Quality Circle Forum.
CUMI has won the Safety Award of Department of Factories, Government of K l f th 2012 13
CUMI team winning the M.K.K. Nair Memorial Productivity Awards from
CUMI @ 2013
Kerala for the year 2012-13. Memorial Productivity Awards from Kerala State Productivity Council
80

Corporate Social Responsibility
Tie up with ANBALAYA SCHOOL (A school forSCHOOL (A school forphysically challenged children located at Thiruvottiyur) -C d ti F M di lConducting Free Medical Camp and Participation in World Disabled Day
CUMI @ 2013 81

Sustainability Index
Threshold of Vulnerability
We are significantly above the threshold of vulnerability on all.
High level of sustainability.
CUMI @ 2013 82

CUMI @ 2013 83


