62
RESEARCH REPORT Care homes for older Europeans: Public, for-profit and non-profit providers

RESEARCH REPORT
Care homes for older Europeans:Public, for-profit and non-profit providers


Care homes for older Europeans: Public, for-profit and non-profit providers
European Foundationfor the Improvement ofLiving and WorkingConditions
Europe Direct is a service to help you find answers to your questions about the European Union.
Freephone number*: 00 800 6 7 8 9 10 11*Certain mobile telephone operators do not allow access to 00 800 numbers or these calls may be billed.
Printed in Luxembourg
Cover image: © Eurofound, Juha Roininen/EUP Images 2017
When citing this report, please use the following wording:
Eurofound (2017), Care homes for older Europeans: Public, for-profit and non-profit providers, Publications Office ofthe European Union, Luxembourg.
Authors: Daniel Molinuevo and Robert Anderson
Research manager: Daniel Molinuevo
Eurofound project: Delivering public services – continuation
Acknowledgements: The report draws on data and studies gathered by Eurofound’s Network of EuropeanCorrespondents (and Florien Kruse for the Netherlands). Eurofound is also grateful to participants at meetingsheld in Dublin on 30 March and 6 April 2017 in Brussels and to the Age Europe Platform secretariat(especially Anne Sophie Parent and Borja Arrue) and their members for their input and feedback to the report.
Luxembourg: Publications Office of the European Union
Print: ISBN: 978-92-897-1606-2 doi:10.2806/719312 TJ-01-17-950-EN-CPDF: ISBN: 978-92-897-1607-9 doi:10.2806/737365 TJ-01-17-950-EN-N
© European Foundation for the Improvement of Living and Working Conditions, 2017
For rights of translation or reproduction, applications should be made to the Director, European Foundationfor the Improvement of Living and Working Conditions, Wyattville Road, Loughlinstown, D18 KP65, Ireland.
The European Foundation for the Improvement of Living and Working Conditions (Eurofound) is a tripartiteEuropean Union Agency, whose role is to provide knowledge in the area of social, employment and work-relatedpolicies. Eurofound was established in 1975 by Council Regulation (EEC) No. 1365/75 to contribute to the planningand design of better living and working conditions in Europe.
European Foundation for the Improvement of Living and Working Conditions
Telephone: (+353 1) 204 31 00 Email: [email protected] Web: www.eurofound.europa.eu

Contents
Executive summary 1
Introduction and methodology 3
1 Trends in care provision over time 9
Service delivery data from previous studies 9
Service delivery data from the Network of European Correspondents 11
2 Private care provision and service delivery: Accessibility, quality and efficiency 25
Accessibility 25
Quality 32
Efficiency 39
3 Conclusions 41
Trends in service provision 41
Bibliography 45
Annex 51
Table A1: Number of care homes by ownership type 51
Table A2: Number of places in care homes by ownership type 53
Table A3: Number of service users by ownership type (most recent year) 54
iii

iv
Country codes: EU Member States
Country codes: Non-EU countries
Abbreviations used in the reportCSR Country Specific Recommendation
EQLS European Quality of Life Survey
EPC Economic Policy Committee
LTC Long term care
NEC Network of European Correspondents
OMC Open Method of Coordination
SPC Social Protection Committee
AT Austria FI Finland NL Netherlands
BE Belgium FR France PL Poland
BG Bulgaria HR Croatia PT Portugal
CY Cyprus HU Hungary RO Romania
CZ Czech Republic IE Ireland SE Sweden
DE Germany IT Italy SI Slovenia
DK Denmark LU Luxembourg SK Slovakia
EE Estonia LT Lithuania UK United Kingdom
EL Greece LV Latvia
ES Spain MT Malta
IS Iceland NO Norway

1
IntroductionThis report provides an overview of how public andprivate (both for-profit and non-profit) provision of carehomes for older people has changed over the lastdecade. Even though there has been considerablechange in the size and ownership of care homes, thereare no EU-wide harmonised data disaggregated by typeof ownership and/or the economic purpose of serviceproviders. The report draws together the available dataand also provides information from studies, evaluationsand surveys about the differences between theaccessibility, quality and efficiency of services providedin public and private care homes for older people. Theinformation was gathered mainly through a literaturereview and by Eurofound’s Network of EuropeanCorrespondents, which provided data from nationalstatistical offices and studies.
Policy contextMost of the debate and policy initiatives at the EU levelon long-term care do not make specific reference topublic or private provision. In the 2017 Annual GrowthSurvey, which kick-starts the European Semesterprocess, the European Commission called for furtherinvestment in long-term care in order to decrease theburden on informal carers. It also highlighted the needto increase the efficiency and accessibility of long-termcare, given the expected rise in expenditure due to theageing of the population and technologicaladvancements. The Social Protection Committee hasargued that long-term care systems must also boostpreventive healthcare, rehabilitation and independentliving. Country Specific Recommendations tend to focuson improving the cost effectiveness and cost efficiencyof expenditure on long-term care, while ensuring theaccessibility of services and improving service qualityand provision. The European Social Pillar includes theright to affordable long-term care services of goodquality, in particular home care and community-basedservices.
Key findings
Trends in provision
Over the last 10 years, there has been an increase in thenumber of care homes in nearly all the countries forwhich there are data available. In Romania, Slovakiaand Slovenia, the number of private care homes hasdoubled (albeit from a very low starting point). At thesame time, the number of public care homes is either
decreasing (Croatia, the Czech Republic, France,Germany, Norway, Slovenia and the UK (Scotland)), orgrowing at a slower pace than private care homes(Cyprus, Lithuania, Romania and Slovakia). Malta andSpain are an exception to this trend, with the number ofpublic care homes increasing faster than private ones inboth countries.
Over the last decade the number and share of placeshave increased in private care homes to a greater extentthan in public care homes in all countries for whichthere are data, with the exception of Spain. Places innon-profit care homes increased more than in homesrun by for-profit providers in Belgium and Norway,whereas the opposite was the case in the UK (Scotland).The latest data show that private provision constitutesmore than two-thirds of the total number of places inGreece, the Netherlands (where it is almost entirely non-profit), the UK (Scotland), Ireland, Spain, and Belgium.The public and private share of places is more or lessthe same in France, Austria, Malta, Lithuania andRomania. Public provision constitutes approximately70% of the total number of places in the Czech Republic,Lithuania, Poland, Slovakia and Slovenia, and nearly90% in Norway. In some countries there are markeddifferences between the size of public and private carehomes. In Slovenia and Malta public care homes havetwice the average number of places as private ones.Over the last decade the average size of private carehomes in the Czech Republic, Malta, Lithuania andSpain has increased considerably, whereas the size ofpublic care homes has decreased or remained stable.
Implications for service delivery
Financial pressures on care home providers are a majorissue (e.g. in the UK), one that is increasing with therising number of people needing care, the costs ofproviding services and recruiting staff, and thepromotion of quality for users. In some countries,private care homes provide fewer specialist medicalservices than public care homes. As private provisionincreases, costs to users are likely to become a moresignificant issue unless there is an increase in publicbenefits to subsidise funding. There are also differencesin the location of different types of care homes, withprivate care homes more likely to be found in affluenturban areas. The types of residents prevalent in eachtype of care home are influenced by the profitability ofthe services they require – residents who require lessprofitable care services are more likely to be in publiccare homes. In most countries where information aboutstaff-to-resident ratios was available, there were morestaff per resident in public care homes.
Executive summary
2
There is a lack of agreed quality indicators, particularlyon quality of life for service users in long-term care. Therange and quality of services in public and private carehomes differ from country to country, with studiestending to focus on the aspects of quality that are easierto measure. Differences have been reported in terms ofhaving a single room, level of hygiene, the residents’choice of food and activities, attitude of staff, nutrition,continuity of care, preventive healthcare and carepractice.
Comparison of cost efficiency of public and private carehomes seem to be greatly influenced by staff costs anddifferences in the types of resident, with public carehomes often having a higher share of residents withhealth complications or who are less profitable.
Policy pointersImportance of analysing possible trade-offs between
efficiency, quality and accessibility of services: Severalstudies highlight how private providers are facing adilemma between cutting costs by decreasing thequality of service or increasing prices and thus losingcompetitiveness. Studies that document differencesbetween different types of providers need to documentwhether improvements in one area come at the expenseof others.
Clear common definitions essential: In order to bettermonitor the extent of public and private provision, it isessential to have clear common definitions that allowgathering data about the different types of long-termcare services and providers. Definitions and data aboutpublic, for-profit and non-profit provision should takeinto account the legal status, ownership and economicactivity of providers.
Need to aggregate and review studies systematically
at national and European level: The studies gathered inthis report provide an indication of the differences inthe accessibility, quality and efficiency of services. Withresults differing between studies and betweencountries, to gain more definitive conclusions aboutdifferences in service delivery it is important toaggregate and review studies systematically, at nationaland European level. Findings and data can be used atEuropean level (in particular, in the European Semester)to better understand the extent of different types ofservice provision.
Care homes for older Europeans: Public, for-profit and non-profit providers
3
This report presents the findings of Eurofound’sresearch on the provision of services in care homes forolder people; it is part of the Agency’s ongoing researchinto the private provision of social services. Theresearch started with exploratory case studies lookingat the private provision of health and social services,and continued with research into the private provisionof hospital services (Eurofound, 2015; Eurofound, 2017).
The main objective of this research is to determine towhat extent and in which areas private providers areexpanding and/or replacing the public sector in thedelivery of services. This report shows that over the last10 years, public provision of care homes has decreased(or increased to a lesser extent) than the privatefor-profit sector. Furthermore, the report aims todiscover the implications of increased private provisionin relation to service delivery, looking at the differencesin accessibility, quality and efficiency of public andprivate (for-profit and non-profit) provision of services.The report starts with a description of the policy contextand then sets out the data emerging from studies onpublic and private provision, concluding with asummary and key messages for policymakers abouthow reform can best meet service user needs.
Scope and definitionsThe area of study in this research is care homes for olderpeople, with a focus on the differences between publicservices and private services (both for-profit andnon-profit). This report uses the definition of carehomes by Huber et al (2009):
institutions and living arrangements where care andaccommodation are provided jointly to a group ofpeople residing in the same premises, or sharingcommon living areas, even if they have separaterooms. This does not include, however, temporary orshort-term stays, such as respite care
(Huber et al, 2009, p. 21)
This definition covers nursing and residential carehomes for older people and corresponds approximatelywith NACE codes 87.1 and 87.3.1 The definitions ofresidential care and nursing homes used in this researchare adapted from those established by WHO and theOECD. Residential care is defined as ‘accommodationand support for people who cannot or who do not wishto live in their own home’. The services in residential
care may include social care, group activities, personalcare, help with performing daily tasks (such as generalmobility, dressing, personal hygiene and eating) andmedical care (various levels of nursing care and therapyservices) (WHO, 2004).
Nursing homes are defined by WHO as ‘highdependency care facilities primarily engaged inproviding inpatient nursing and rehabilitative servicesto individuals requiring nursing care’. Staff can alsoprovide acute healthcare, assistance with day-to-dayliving tasks and assistance towards independent living(WHO, 2004). The types of nursing homes included inthis research correspond, to a great extent, to thoseincluded in the definition of long-term nursing carefacilities in the OECD, Eurostat and WHO System ofHealth Accounts, which encompasses homes for olderpeople with nursing care, care homes, nursing homesand rest homes with nursing care (OECD, Eurostat andWHO, 2011).
This study does not include sheltered housing,independent and assisted living facilities, hospices orother establishments focusing on palliative care, theterminally ill and convalescence. Furthermore, thestudy does not include semi-residential care servicessuch as respite or day care, or temporary stays in carecentres for social services, or establishments referred toas hospitals or health centre wards primarily engaged inproviding inpatient long-term nursing and rehabilitativeservices to persons requiring convalescence. Serviceprovision for children and working-age adults withphysical and mental disabilities is also outside thescope of this study as these services are of a differentnature and it would be difficult to compare the findingsof studies linking ownership with service delivery.
The division and definition of public and private servicescan be made according to criteria such as legal status,ownership and economic activity. With regard to privateservice providers, it is important to highlight whethertheir services have been contracted out by the publicsector or are part of public policy in some other way, asthe conditions in which services are provided is similarto public provision. However, data on the number ofsubsidised places in private care homes are very limited.Therefore, the data and studies compiled in this reportfocus on public and private provision defined anddifferentiated by type of ownership, legal status, and/oreconomic activity. The definitions of public and private
Introduction and methodology
1 Statistical Classification of Economic Activities in the European Community (‘NACE’ in French).
4
used in this research are those used by the EuropeanCommission’s study on social services of generalinterest (SSGI) (European Commission, 2011) and thereport Facts and figures on healthy ageing and long-termcare (Rodrigues, Huber and Lamura, 2012). ‘Publicproviders’ means ‘organisations in which publicauthorities (e.g. Ministry, municipalities) directlymanage or have power to appoint management’(Rodrigues, Huber and Lamura, 2012, p. 95).
Private service providers are defined as ‘providers whichare not public authorities or other bodies governed bypublic law’ (European Commission, 2011, p. 311).2 Theycan be either for-profit or non-profit and includeservices commissioned by a public authority to privateproviders. Non-profit providers are defined in theCommission’s SSGI study as
institutions or organisations created for the purposeof producing goods and services whose status doesnot permit them to be a source of income, profit orother financial gains for the units that establish,control or finance them.
(European Commission, 2011, p. 312)
This can include organisations whose board of directorsis composed of volunteers, as well as organisationsmanaged or owned by religious or civil society bodies(e.g. unions, political parties, cooperatives) (Rodrigues,Huber and Lamura, 2012, p. 95). Private for-profitproviders include organisations controlled byshareholders or that are privately owned (Rodrigues,Huber and Lamura 2012, p. 95). Whenever the studiesand the data available make it possible, a distinction ismade between for-profit and non-profit provision.However, many countries do not provide data makingthis disaggregation, which is fraught withmethodological difficulties.
As in previous research carried out by Eurofound in thefields of health and long-term care services, thedefinitions of accessibility, quality and efficiency usedhere are very broad in order to identify as manydifferences between public and private provision aspossible. In the case of accessibility, this wouldcomprise aspects covered in the third European Qualityof Life Survey: availability (such as waiting lists and lackof services); access (for example, due to distance oropening-hours) and affordability. No information wasfound about other differences in other aspects ofaccessibility explored in previous Eurofound research,such as population coverage, waiting times and lists,and information (Eurofound, 2013a; Eurofound, 2014b).
Quality is analysed in this report in terms of structure,process and outcomes. Some of the aspects analysed inthis report and in the fourth European Quality of LifeSurvey are: quality of the facilities (buildings, rooms andequipment); expertise and professionalism of staff;personal attention given to residents; and beinginformed about care. It also includes elements of qualitythat are part of the European Quality Framework forlong-term care services, such as respect for humanrights and dignity.3 With regard to efficiency, the studiesincluded in this report analyse both technical and costefficiency.
MethodologyResearch started in 2016 with an literature reviewfocusing on care homes in Europe and the extent andimpact of private provision. This helped to identifyissues and knowledge gaps to be explored further byEurofound’s Network of European Correspondents. Thisnetwork is based in all EU Member States and Norwayand provides information about the situation in therespective country on such matters as the labourmarket, employment policies and companyrestructuring, as well as related social policy topics.
In April 2016, correspondents received a questionnaire;they provided their input largely over the summer. Thequestionnaire asked for information on the followingtopics:
£ the definitions of residential care, nursing homesand public and private services used at the nationallevel
£ data about the volume of public and private (for-profit and non-profit) care home provision in thelast 25 years (from 1990 to 2016), includingexplanations for the changes in the proportion ofservices provided by the private sector
£ a description of the responsibilities for regulation,organisation, financing and delivery of services
£ a description of relevant political and legalinitiatives directly affecting care homes
£ a description of the differences between public andprivate care homes in relation to their staff and theservices provided (including their quality,accessibility and efficiency)
£ an assessment of the future of public and privateprovision of care homes.
Care homes for older Europeans: Public, for-profit and non-profit providers
2 Bodies governed by public law are defined as being established for the specific purpose of meeting needs in the general interest (such as not having anindustrial or commercial character); having legal personality and financed, for the most part, by the State, regional or local authorities or subject tomanagement supervision by those bodies; or having an administrative, managerial or supervisory board, more than half of whose members are appointedby the State, regional or local authorities, or by other bodies governed by public law (European Commission, 2011, p. 311).
3 The European Quality Framework for long-term care was developed in 2012 as part of a European research project. It includes principles and guidelinesfor the wellbeing and dignity of older people in need of care and assistance (WeDO, 2012).

5
In addition, a questionnaire was distributed inDecember 2016 to all member organisations of AGEPlatform Europe, the European network of non-profitorganisations of and for citizens over the age of 50. Thiswas to obtain feedback from the point of view ofservices users about the perceived differences betweenpublic and private provision (with regard toaccessibility, availability and quality of services). Thisinformation was complemented by a webinar in April2017 with AGE Platform Europe members from Belgium,the Czech Republic, Denmark, Finland, Germany,Greece, Ireland, Italy, Malta, the Netherlands and Spain.
Review and synthesis of findings The information gathered through in-house research,from the Network of European Correspondents and inconsultation with members of AGE Platform Europeincluded different types of evidence, such as inspectionreports, academic studies, policy statements and theopinions of experts. This report synthesises theinformation by clustering thematically the documenteddifferences between public and private care homes. Thefindings of this research and the policy pointers thatcould be derived from them were discussed at meetingsin March and April 2017 between social partners,academic experts and associations of service users andproviders.
EU policy context
Long-term care policy monitoring andgovernance
Since 2006, long-term care has been a key element ofthe Open Method of Coordination on Social Protectionand Social Inclusion (known as the Social OMC). Thereform of the Social OMC in 2005 included theincorporation of health and long-term care to thisprocess. In addition to the main principles of the SocialOMC, an objective was set for long-term care (‘ensuringaccessible, high-quality and sustainable long-termcare’). The Communication from the EuropeanCommission setting out this new Social OMC makesreference to the need for coordination between publicand private institutions by ensuring a rational use ofresources in order to achieve this objective (EuropeanCommission, 2005).
Since 2010, the coordination of national economicpolicies aiming to reach the objectives of the Europe2020 strategy takes place in the framework of theannual European Semester. The objectives of thisprocess include: ensuring sound public finances;avoiding excessive government public debt, andfostering structural reforms that create jobs and growth.The scope and direction of the national programmesdrafted by Member States as part of this process aredirected by a set of integrated guidelines for economic
and employment policies. The 2015 employmentguidelines for Member States and the Union makereference to the promotion of work–life balancethrough access to affordable, good quality earlychildhood education, care services and long-term care(Council of the European Union, 2015).
The European Semester process starts with theEuropean Commission’s Annual Growth Survey, whichprovides guidance by setting general economic goalsand recommendations for the euro zone. The AnnualGrowth Survey in 2017 calls for further investment todevelop long-term care in order to decrease careobligations, highlighting the negative impact that theyhave on the labour market participation of women. Thesurvey also makes reference to the need to increase theaccessibility and efficiency of long-term care in order toaddress increases in public expenditure driven byageing and technological developments (EuropeanCommission, 2016c).
In addition, a ‘reinvigorated’ Social OMC processcontinues. From 2011 onwards, Member States prepareNational Social Reports that are used as the basis forthe Social Protection Committee (SPC) annual report,which includes an assessment of progress madetowards meeting the Europe 2020 target on reducingpoverty and social exclusion. This is then fed into theEuropean Semester process (Social ProtectionCommittee, 2011; Social Protection Committee, 2012).The work of the SPC also includes a thematic reportabout the challenges faced in long-term care provisionand the policy responses they require (Social ProtectionCommittee and European Commission, 2014). Thereport makes reference to the public–private divide infunding, but not in relation to service provision.
Each year, the European Commission analyses eachnational government’s actions as stated in theirNational Reform Programmes and, together with theCouncil of the European Union, issues Country SpecificRecommendations (CSRs) to each Member State. In2014, six countries received recommendations in thefield of long-term care. Curbing expenditure by makingactions more cost effective was the most frequentrecommendation made that year, with some countriesbeing asked to ensure the accessibility and quality ofservices (the Netherlands) and the development ofhome care (Slovenia) (European Commission, 2014). In2015, Austria was urged to improve long-term careprovision in order to improve the labour marketparticipation of women and older workers, and Finlandand Slovenia were encouraged to adopt and implementreforms in their healthcare and long-term care systems.In 2016, the European Commission and the Council ofthe European Union gave Estonia, Slovenia and SpainCSRs, making explicit reference to the accessibility andcost efficiency of long-term care. In 2017 Slovenia wasrecommended to adopt the planned reform oflong-term care, increasing the cost effectiveness,accessibility and quality of care.
Introduction and methodology

6
In parallel to this governance process, the EuropeanCommission monitors developments in long-term careusing a horizontal assessment framework (HAF) similarto the one used for pensions and healthcare. Thesethematic assessment frameworks, carried out by DGECFIN for the Economic Policy Committee (EPC),4 aim toidentify medium- and long-term risks for fiscalsustainability that require structural and fiscal reforms.Generally speaking, those countries where there is aCSR on long-term care have also been identified asexperiencing structural fiscal challenges (EuropeanCommission, 2014). In 2016, the assessment concludedthat the Czech Republic, Estonia, Latvia, theNetherlands and Poland can increase efficiency inspending by transferring care from institutions to homecare. The ratio of unit costs per dependant ininstitutional care was deemed to be ‘very high’ in Malta,the Netherlands, Poland and Sweden (EuropeanCommission, 2016a).
In December 2016, the European Commission presenteda proposal to review EU legislation on social securitycoordination. The proposal includes coordination rulesthat are (for the first time) specific to long-term care.The new rules will provide a common definition of long-term care benefits, criteria to identify them and a list ofbenefits in each Member State (European Commission,2016b). Long-term care benefits will continue to becoordinated as sickness benefits, where the MemberState in which citizens are insured will provide long-term care benefits in cash and reimburse the cost ofbenefits in kind provided by the Member State ofresidence.
In order to strengthen the social dimension of theEconomic and Monetary Union (EMU), in March 2016 theEuropean Commission published a first outline of aEuropean Pillar of Social Rights. This outline, which wasmade available for public consultation, makes referenceto long-term care as one of the policy domains underthe category ‘Adequate and sustainable socialprotection’. It includes the need to ensure ‘access toadequate long-term care services, while guaranteeingthe financial sustainability of long-term care systems’,which requires ‘increased efforts in improving theprovision and financing of long-term care’ (EuropeanCommission, 2016e). The European Commissionrecommendation establishing the Pillar sets out anumber of key principles and rights, which include theright to affordable long-term care services of goodquality – in particular, home care and community-basedservices (European Commission, 2017).
EU policy initiatives regarding long-termcare
In 2010, a voluntary European Quality Framework forSocial Services was developed, which includes‘supporting coordination among service providers so asto achieve a comprehensive and integrated delivery ofsocial services’ as a quality criterion (Social ProtectionCommittee, 2010). At the end of 2012, which was theEuropean Year for Active Ageing and Solidarity betweenGenerations, the Council of the European Unionadopted the Guiding Principles for Active Ageing andSolidarity between Generations. These principles aimedto provide orientation to national governments as tohow to continue to promote active ageing. One of theseprinciples is maximising autonomy in long-term care byensuring the autonomy and participation of people inneed of help and care (Council of the European Union,2012).
Also in 2012, the European Commission launched theEmployment Package, which consisted of a set of policydocuments that identified areas with a potential tocreate jobs, as well as identifying ways Member Statescould create them. Health and social care wereidentified as sectors with potential for job creation, butacompanied by many challenges such as the ageing andshrinking workforce, poor pay, demanding workingconditions, the need for new skills associated withtechnological change and a growing proportion of thepopulation with chronic conditions (EuropeanCommission, 2012a).
The Social Investment Package published by theEuropean Commission in 2013 to address the socialconsequences of the economic crisis included the staffworking document Long-term care in ageing societies –Challenges and policy options (European Commission,2013). This document describes briefly the public–private mix in the funding and delivery of long-term carein Europe, and the advantages and drawbacks of publicand private provision. It also highlights the challengesthat future demand for the provision of long-term carewill pose for public budgets. The document alsoproposes using the SPC as a focal point for long-termcare-related activities across European Commissionservices.
In addition to the SPC, the EPC also providesinformation about long-term care and other age-relatedexpenditure. The economic and budgetary projectionsup until 2060 are done on the basis of differentscenarios, which include variations in public spendingon formal home care in homes and in institutions, andvariations in cash benefits. In these projections, private
Care homes for older Europeans: Public, for-profit and non-profit providers
4 The EPC advises and contributes to the work of the European Commission and the Economic and Financial Affairs Council and in the areas of economicpolicy and public finances.

7
expenditure on long-term care is put together withinformal care provision. Therefore, the scenariosforesee increases in public provision influenced by ashift from informal care, without taking intoconsideration changes in privately funded services.Some scenarios include not only the provision ofpublicly funded institutional and home care, but alsopublic benefits in cash, which can be used to fundprivate care homes (European Commission, 2015).
The European Commission and the EPC have alsopublished a joint report on healthcare and long-termcare systems and fiscal sustainability. The report givesan overview of the challenges for long-term caresystems and gives a list of policy options that countriescould follow in order to resolve them. The options toensure the fiscal sustainability of healthcare spendinginclude the improvement of reimbursementmechanisms and enhancing service provider
competition (European Commission, 2016f). Bothoptions are perceived as important tools for ensuringthe fiscal sustainability of long-term care spending,used by a majority of the countries surveyed as part ofthe report.
The European Commission’s Directorate General forCommunications Networks, Content and Technology(DG CONNECT) also carries out activities that are linkedto residential care in the framework of the EuropeanInnovation Partnership on Active and Healthy Ageing,which was initiated in 2011. These partnerships aim tobe transversal initiatives that bring together all relevantstakeholders in order to speed up innovations to tacklesocietal challenges. One of the three objectives of thispartnership is to support the long-term sustainabilityand efficiency of health and social care systems, withone of the action groups that form the partnershipfocusing on integrated care.
Introduction and methodology


9
This chapter presents the data available from differentsources about public, non-profit and for-profit carehome service provision, and how it has changed overthe last 10 years. Care home provision takes place in acontext of longstanding diversification of long-term careservices. Long stays in hospitals have been replaced inall countries with care home and home care services(Wittenberg, Sandhu and Knapp, 2002). In particular,since the mid-1990s, there has been a shift towardsmore investment in home care (OECD, 2005). Thisreflects the preference of most European service usersto receive care in their own home. In a Eurobarometersurvey, around 80% of those surveyed expected and/orpreferred to receive care in their home, whereas lessthan 10% preferred and/or expected care in a nursinghome (Eurobarometer, 2007).
In this context, policymakers need to decide how to bestprovide long-term care services. The new publicmanagement (NPM) discourse has advocated forincreased private provision on the grounds thatcompetition between service providers will increase thequality and efficiency of services at a reduced cost tothe public sector (Hermann and Verhoest, 2012). Thereforms in the public sector inspired by NPM put theemphasis on performance, contractualisation and theadoption of management practices from the privatesector. Market mechanisms and quasi-markets havebeen introduced so that different types of providerscompete with one another. These reforms and marketmechanisms include tendering, commissioning, userchoice, user fees, and vouchers (Rodrigues,Leichsenring and Winkelmann, 2014). In its 2010 reporton long-term care in Europe, the World Bank stated that
The main public policy question vis-à-vis provision iswhether to ‘make or buy’, that is how much formallong-term care services should be provided by thepublic sector and how much should be contracted outto private facilities.
(World Bank, 2010, p. 12)
The report made a recommendation ‘to thinkproactively’ about how to leverage reforms in thelong-term delivery of care services and encourage
private sector provision: ‘This depends a great deal onlong-term care financing policies and the overallregulatory environment’ (World Bank, 2010, p. 9).
Service delivery data fromprevious studiesThe data available about care home provisiondisaggregated by ownership come from estimates fromexperts, national studies and national statistics. Forexample, the European Commission study on socialservices of general interest (SSGI) (EuropeanCommission, 2011) provides estimates of the relativevolume of private provision of long-term care services.The study also underlines difficulties in collecting datadisaggregated by ownership, such as the mixedeconomy in the funding and provision of services, thefragmentation of services, the lack of data in manycountries about service providers outside of the publicsector and the fact that long-term care includes bothhealth and social care. This affects the reporting of theservices available since data about health and socialcare are gathered separately. The authors of the studyalso call for standardised definitions of for-profit andnon-profit provision.
The data in Table 1 show the share of privateexpenditure (both for-profit and non-profit) as reflectedin the SSGI study. Care homes are almost exclusivelyprivately provided in the Netherlands, Germany and theUK (England and Scotland). In the Netherlands, carehome services are by law provided entirely by thenon-profit sector. In Germany, non-profit provision isalso predominant, although there are significantregional variations. On the other hand, in the UK(England and Scotland) private provision is mainlyfor-profit. Private provision constitutes 20% or less ofthe total in the Nordic countries, some easternEuropean countries (Estonia, the Czech Republic,Romania and Slovenia) and Greece, where formalprovision of long-term care is very limited. The SSGI alsohighlights the lack of cross-sectional data and that thedata available show a shift towards private provision,driven by the increase in vouchers and cash benefits.
1 Trends in care provision over time

10
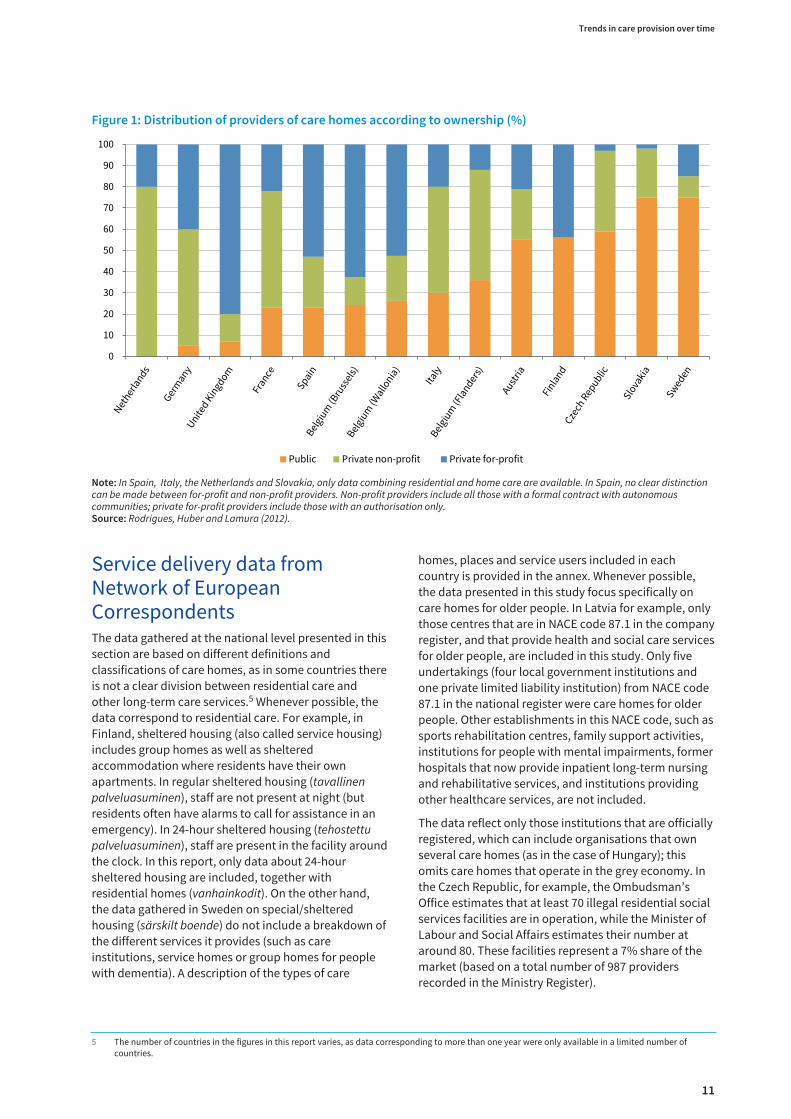
Another source of data is the study Facts and figures onhealthy ageing and long-term care: Europe and NorthAmerica (Rodrigues, Huber and Lamura, 2012). Part ofthe information available in the study comes from datacollated in the FP7 research project INTERLINKS (Allenet al, 2011). The data in this study (shown in Figure 1)illustrate again that private provision is particularly highin the Netherlands (where it is almost entirely
non-profit), Germany and the UK (where it is mainlyfor-profit). The data also confirm that most services inthe Nordic countries and in eastern Europe are providedby the public sector. The authors point out that thepublic–private mix seems to be determined, to a greatextent, by path dependency – for example, who themain provider was when services started to bedeveloped.
Care homes for older Europeans: Public, for-profit and non-profit providers
Table 1: Share of care homes provision in Europe
Country Private for-profit Private non-profit Year Unit
Austria 22% 29% (no information) Residential care beds
Belgium (Wallonia) 32% 29% (no information) Residential nursing home beds
Belgium (Flanders) 12% 49% 2007 Residential care beds
Czech Republic 16% (no information) Residential care places
Estonia 80% (no information) Residential care places
France 17% 28% 2008 Residential care beds
Germany 34% 59% 2007 Residential care home places
Greece Approximately 1% (no information)
Hungary 37% 2006 Residential care beds
Ireland 65% 9% (no information) Residential care places
Italy 22% 43% 2005 Residential care beds
Netherlands 100% (no information)
Norway 4% 6% 2008 Long-term care institutions
Romania 17% (no information) Residential care places
Spain 27% 27% (no information) Residential care services
Slovenia 14% 2007 Residential care beds
Sweden 17% 2009 Individuals living in all types of residentialand sheltered housing
UK (England) 76% 16% 2009 Residential care homes
UK (Scotland) 75% 11% 2007 Residential care home places
Source: European Commission, 2011.
11
Service delivery data fromNetwork of EuropeanCorrespondentsThe data gathered at the national level presented in thissection are based on different definitions andclassifications of care homes, as in some countries thereis not a clear division between residential care andother long-term care services.5 Whenever possible, thedata correspond to residential care. For example, inFinland, sheltered housing (also called service housing)includes group homes as well as shelteredaccommodation where residents have their ownapartments. In regular sheltered housing (tavallinenpalveluasuminen), staff are not present at night (butresidents often have alarms to call for assistance in anemergency). In 24-hour sheltered housing (tehostettupalveluasuminen), staff are present in the facility aroundthe clock. In this report, only data about 24-hoursheltered housing are included, together withresidential homes (vanhainkodit). On the other hand,the data gathered in Sweden on special/shelteredhousing (särskilt boende) do not include a breakdown ofthe different services it provides (such as careinstitutions, service homes or group homes for peoplewith dementia). A description of the types of care
homes, places and service users included in eachcountry is provided in the annex. Whenever possible,the data presented in this study focus specifically oncare homes for older people. In Latvia for example, onlythose centres that are in NACE code 87.1 in the companyregister, and that provide health and social care servicesfor older people, are included in this study. Only fiveundertakings (four local government institutions andone private limited liability institution) from NACE code87.1 in the national register were care homes for olderpeople. Other establishments in this NACE code, such assports rehabilitation centres, family support activities,institutions for people with mental impairments, formerhospitals that now provide inpatient long-term nursingand rehabilitative services, and institutions providingother healthcare services, are not included.
The data reflect only those institutions that are officiallyregistered, which can include organisations that ownseveral care homes (as in the case of Hungary); thisomits care homes that operate in the grey economy. Inthe Czech Republic, for example, the Ombudsman’sOffice estimates that at least 70 illegal residential socialservices facilities are in operation, while the Minister ofLabour and Social Affairs estimates their number ataround 80. These facilities represent a 7% share of themarket (based on a total number of 987 providersrecorded in the Ministry Register).
Trends in care provision over time
Figure 1: Distribution of providers of care homes according to ownership (%)
0
10
20
30
40
50
60
70
80
90
100
Public Private non-profit Private for-profit
Note: In Spain, Italy, the Netherlands and Slovakia, only data combining residential and home care are available. In Spain, no clear distinctioncan be made between for-profit and non-profit providers. Non-profit providers include all those with a formal contract with autonomouscommunities; private for-profit providers include those with an authorisation only.Source: Rodrigues, Huber and Lamura (2012).
5 The number of countries in the figures in this report varies, as data corresponding to more than one year were only available in a limited number ofcountries.
12
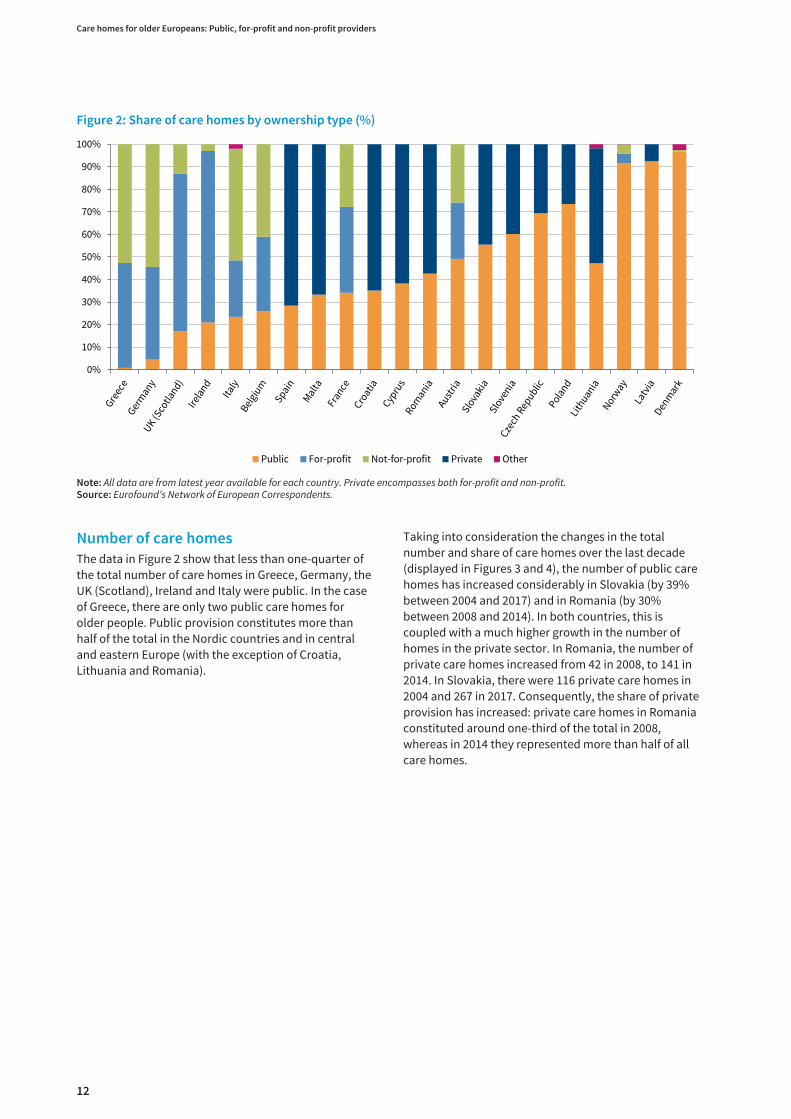
Number of care homes
The data in Figure 2 show that less than one-quarter ofthe total number of care homes in Greece, Germany, theUK (Scotland), Ireland and Italy were public. In the caseof Greece, there are only two public care homes forolder people. Public provision constitutes more thanhalf of the total in the Nordic countries and in centraland eastern Europe (with the exception of Croatia,Lithuania and Romania).
Taking into consideration the changes in the totalnumber and share of care homes over the last decade(displayed in Figures 3 and 4), the number of public carehomes has increased considerably in Slovakia (by 39%between 2004 and 2017) and in Romania (by 30%between 2008 and 2014). In both countries, this iscoupled with a much higher growth in the number ofhomes in the private sector. In Romania, the number ofprivate care homes increased from 42 in 2008, to 141 in2014. In Slovakia, there were 116 private care homes in2004 and 267 in 2017. Consequently, the share of privateprovision has increased: private care homes in Romaniaconstituted around one-third of the total in 2008,whereas in 2014 they represented more than half of allcare homes.
Care homes for older Europeans: Public, for-profit and non-profit providers
Figure 2: Share of care homes by ownership type (%)
0%
10%
20%
30%
40%
50%
60%
70%
80%
90%
100%
Public For-profit Not-for-profit Private Other
Note: All data are from latest year available for each country. Private encompasses both for-profit and non-profit. Source: Eurofound’s Network of European Correspondents.

13
Trends in care provision over time
Figure 3: Changes in the number of care homes in the last 10 years (%)
Note: Private encompasses both for-profit and non-profit.Source: Network of European Correspondents.
-200 5004003002001000-100
Croatia2004–2014
Czech Republic2007–2014
France2007–2011
Germany2005–2015
Lithuania2004–2014
Malta2009–2016
Norway2009–2015
Poland2004–2014
and 2010–2014
Romania2008–2014
Slovenia2007–2015
Cyprus2004–2014
Slovakia2006–2013
Spain2007–2015
UK (Scotland)2005–2015
Public Private For-profit Non-profit Other

14
The increase in Romania represented a growth of 236%;this can be partly explained by the reform of its healthsystem in 2009, when health insurance wasdiscontinued for 66 public hospitals due to highoperating costs and the low numbers of patients(Eurofound, 2014b). These hospitals were closed downin April 2011, although some later reopened as nursingand residential care homes for older people. Of these,19 were operational in 2015, with a total of 966 beds and896 enrolled beneficiaries. European structural andinvestment funds also played a role in the developmentof private care home services. From 2007 onward,several funding opportunities were available to NGOs to‘rehabilitate, modernise, develop and equip socialservice infrastructure’; the eligibility of such NGOprivate projects was restricted to the north-east andBucharest-Ilfov regions (Ministry of RegionalDevelopment and Public Administration, 2011).
The increase in the number and share of private carehomes in Slovakia took place in a context where privateproviders were eligible for public grants only in caseswhere services could not be publicly provided. This rulewas declared as infringing the right to freedom of trade
and hence unconstitutional by the Constitutional Courtin 2010 (Allen et al, 2011).
The number of public and private care homes also grew(albeit to a lesser extent) in Lithuania, Malta and Spain.In Lithuania, at the beginning of the 1990s, themanagement of public care homes was transferred fromthe state to local authorities. By 1994, care institutionsowned by the state already accounted for less than 20%of the total number of public care homes, with the restbeing managed by local authorities. On the other hand,in Malta, while the number of non-profit care homesowned by the church has decreased slightly since 2009,the number of private and government homes for olderpeople is on the increase. In 2016 there was an equalnumber (15) of church, private and government homes.The rate of growth in Spain was very similar to that ofMalta, with public care homes increasing by around25%, with a smaller increase in private care homes. Theproportion of public care homes in Spain hasprogressively increased since 2007. Before 2011, theresidential care centre sector had increases of around6% per annum. However, public budget cuts anddecreasing purchasing power resulting from the
Care homes for older Europeans: Public, for-profit and non-profit providers
Figure 4: Changes in private care homes as a share of the total (%)
Cyprus
Czech Republic
Germany
Spain
France
Croatia
Lithuania
Malta
Norway
Poland
Romania
Slovenia
Slovakia
UK (Scotland)
0
10
20
30
40
50
60
70
80
90
100
2003 2004 2005 2006 2007 2008 2009 2010 2011 2012 2013 2014 2015 2016 2017
Source: Network of European Correspondents.

15
economic crisis limited increases to just 0.2% between2010 and 2011, with subsequent decreases. The crisisparticularly hit those private centres with ‘arranged’places (that is, with private places subsidised by thepublic system). Public administrations reduced thenumber of arranged places and public contracts’ prices.Some media sources were critical of the reductions,saying that public administrations were paying for‘arranged’ places at a lower price than their marketvalue (Aquoras, 2014).
Cyprus is the only country (for which data are available)where there has been an increase in public care homesand a decrease in private ones. While public provision hasincreased by around 10% over the last decade, aroundone-third of private care homes closed, partly due to areduction in state funding to non-profit providers.
Another group of countries is that in which there was adecrease in public care homes at the same time as thenumber of private care homes grew: the Czech Republic,Croatia, Germany and Slovenia. The Social Services Actcame into force in 2007 in the Czech Republic. Serviceusers can avail of a care allowance to pay for part of thecosts of residential care provision. The conditions thatall types of providers need to meet to be registered andobtain public funding were unified. In January 2014 theact was amended to transfer competencies from thestate to the regions in terms of the allocation ofsubsidies and the registration of providers.
In Croatia, the number of public social welfare homes(mostly established by local and regional authorities)for older and infirm persons decreased from 46 in 2003to 45 in 2014. All new care homes established between2003 and 2013 were private (mainly for-profit), with themarket share of private homes increasing significantlyfrom 15% in 2003 to 27% in 2013. The main driverbehind this increase is the lack of capacity in state andother public homes to meet the increased demand foraccommodation.
In Germany, the introduction of long-term careinsurance in 1994 was followed by reforms inspired bynew public management, such as opening the market toprivate providers to increase competition, introducingcontract management between the state and theproviders, and the allocation of public funding by careinsurers who also negotiate contracts with providers.This has led to an increase in for-profit providers withinthe care infrastructure and the restructuring oforganisational forms of care provision – especially in thecase of non-profit providers (Theobald, 2012). Thenumber of public care homes in Germany decreased by14%, from 649 in 2003 to 555 in 2013. During this period,the number of non-profit providers increased by 29%
and for-profit providers by 49%. As a result, the share ofcare homes that are private (both for-profit andnon-profit) grew to 95% of the total.
In Slovenia, private sector providers started to provideresidential care in 1999 in order to meet the demandthat could not be met by the public sector and to offer awider range of services. Between 2007 and 2015, thenumber of public care homes decreased from 74 to 59,while the number of private care homes increased from14 to 39.
The last group of countries where both public and privateprovision declined include France, the UK (Scotland) andNorway (except in the case of non-profit care homes,which grew from 33 to 40 between 2009 and 2015).6 In theUK (Scotland), the biggest decreases were in thenon-profit sector and public care homes, with nearlyone-quarter and one-fifth respectively of care homesclosing between 2004 and 2015. In Norway, non-profitnursing homes (which are mostly linked to religiousinstitutions) have generally been part of the municipalhealthcare system and the services provided differedlittle from those in municipally run homes. Up until 2006,private non-profit providers struggled when competingwith private for-profit providers: because they mustensure the same level of benefit pensions as publicproviders, they face higher costs. To address thedifficulties faced by non-profit providers, the then primeminister of Norway, Kjell Magne Bondevik, passed aprocurement provision included in the new procurementregulation from 2006, stating that the full procedure ofthe EU Procurement Directive does not apply in theawarding of contracts for health and social care servicesprovided by non-profit organisations. Thus,municipalities were free to make agreements with non-profit care providers without publishing theirrequirements in the national public procurementdatabase or having to use competitive procurementprocedures.
In France, over the past 15 years, financial incentiveshave been given to for-profit nursing homes and homecare agencies to enable them to enter the long-termcare market (Allen et al, 2011). Between 2007 and 2011,the share of public and private care homes remainedstable and even (48% and 52% respectively).
In some countries it was not possible to obtain preciseor formal data showing the evolution of care homeprovision over the last decade, but it was possible toobtain estimates. These are detailed here.
Estonia: Althought there are no statistics by ownershiptype, by the end of 2016 there were 152 facilitiesproviding general care services for adults. Around 75%
Trends in care provision over time
6 Poland could also be included in this group as between 2004 and 2014 there was a slight decrease in public provision of social assistance houses, whereasthe number of private houses remained the same. The number of private establishments providing 24-hour care for disabled persons, chronic patients,and older persons grew between 2010 and 2014.

16
of them were managed and owned by localgovernments, by private companies or otherassociations established by local governments.
Latvia: It would seem that private sector provision hasshrunk, with several companies having ceasedeconomic activity or having closed.
Hungary: There has been no major change in the shareof private provision. Even though there was an attemptto strengthen the role of civil society organisations(such as associations and foundations), lack of fundingand regulation of outsourcing did not make thispossible. Since 2011, only organisations that have non-profit status are allowed to take over tasks such asresidential care from central or local government.
Sweden: The past two decades have seen a steadyincrease in the share of private care homes (NationalBoard of Health and Welfare, 2012). The share of privatehomes increased from around 14% in 2007 to around21% in 2014. In 2015, the number decreased to around19%. It is mainly large international corporations orcompanies owned by them that provide privateservices. Around half of the privately run residential carehomes were owned by just two companies – Attendoand Vardaga (Szebehely, 2014).
Netherlands: Care has historically been provided byreligious groups. Currently providers of care homeservices are not permitted to make a profit. The agencyWTZi licences the non-profit private providers that arefinanced by the regional care offices (zorgkantoren).There are also privately funded nursing and residentialcare homes (particuliere verpleeghuizen) that arefinanced completely privately and therefore do notneed approval from the WTZi. Because privatelyfinanced nursing homes operate outside of the formallong-term care system, it is more difficult to get theofficial statistics of these providers. The HealthInspectorate (IGZ) identified 72 privately financednursing homes in 2013 in its Care Registry (Zorgregister)out of a total of 141 care homes (data from the CareRegistry as of December 2016).
Number of places
The only information available at European level is thenumber of beds in residential long-term care facilities(OECD, 2017a).7 The source of this information is thejoint survey carried out by Eurostat, OECD and WHO onnon-monetary healthcare. Unlike the informationavailable about the number of hospitals and hospitalbeds, this information is not collected by the type ofownership. The number of long-term care beds inresidential long-term care facilities is shown in Figure 5.
Care homes for older Europeans: Public, for-profit and non-profit providers
7 The terminology used differs from country to country, with the data in some countries referring to the number of beds; in others, to the number of places.
Figure 5: Beds in residential long-term care facilities for service users 65 years+
0
10
20
30
40
50
60
70
80
Note: Data are per 1,000 people aged 65+ in 2014 with the following exceptions: data for Denmark correspond to 2011; data for Italy, Belgiumand the Netherlands correspond to 2012; data for Spain correspond to 2013; data for Luxembourg, Ireland and the UK correspond to 2015.Source: OECD.

17
The share of places in care homes by type of ownershipis shown in Figure 6. Data on the number of places aredisaggregated by ownership in fewer countries than thenumber of care homes. The share of places is similar tothe share of care homes in most countries, with theexception of Malta, Romania, Slovakia and Slovenia,where the share of places in public care homes isconsiderably higher than the share of care homes (bymore than 10 percentage points). This indicates thatthey are bigger in size than their private counterparts(see following section on size). These are all countries inwhich public and private provision of places hasincreased over the last decade, with the greaterincrease being in the number of beds in private carehomes.
The change in the number of places over the last 10years is shown in Figure 7 and Figure 8. In most of thecountries for which data are available, there has beenan increase in the number of both public and privateplaces. This is the case in Belgium, Spain, Malta,Romania, and Slovenia. As with care homes, the biggestrelative increase in the number of places in private carehomes took place in Romania (from 1,538 in 2008 to5,601 in 2014, an increase of 264%). This high increasemeant that the share of places in private care homesincreased from 20% to 44%. The number of places inpublic care homes has increased faster in Malta
(65% between 2009 and 2016). Despite a decrease in thenumber of homes owned by the church, since 1992 theoverall number of beds available in Malta has increasedin all categories of care home ownership.
Between 1996 and 2016, the total number of beds inBelgium in the residential nursing homes sectorexpanded by 35%. The biggest increase was found inFlanders, where private beds grew by over 20% between2003 and 2013. In contrast, the total number of beds inthe Brussels region has decreased since 2001 due to anovercapacity of beds (particularly in private carehomes). The only type of beds that has increasedslightly (by 2%) between 2003 and 2013 are those innon-profit care homes. In the Wallonia region, thenumber of non-profit beds has also increased (by 17%),with the rest remaining more or less stable.
In Spain, the reports from the National Institute forOlder Persons and Social Services (IMSERSO)distinguish between public places, private beds with apublic subsidy (concertadas) and private places. Datafor 2010 show that – among the total number of bedsavailable (368,805) – 25% were offered in public centres,27% were publicly subsidised places in private centresand 48% were purely private places. The percentage ofsubsidised places in private centres compared with thetotal available has increased from 15% in 2002 to 27% in2010.
Trends in care provision over time
Figure 6: Share of places in care homes by ownership type (%)
0
10
20
30
40
50
60
70
80
90
100
Public For-profit Non-profitPrivate Other
Note: All data are from latest year available for each country. Private encompasses both for-profit and non-profit.Source: Network of European Correspondents.

18
Care homes for older Europeans: Public, for-profit and non-profit providers
Figure 7: Changes in the number of places 2004–2016 (%)
Note: Private encompasses both for-profit and non-profit.Source: Network of European Correspondents.
-150 300250200150500-100
Austria2004–2010
Czech Republic2007–2014
France2007–2011
Germany2005–2015
Lithuania2006–2016
Malta2003–2016
Norway2009–2015
Poland2004–2014
and 2010–2014
Romania2008–2014
Slovenia2010–2015
Belgium2007–2016
Slovakia2005–2013
Spain2007–2015
UK (Scotland)2005–2015
Public Private For-profit Non-profit Other
100-50

19
Another group of countries are those in which theprovision of private beds has increased and provision ofpublic beds has decreased; this is the case in Austria,France, Ireland, Lithuania, Slovakia and to some extentNorway, where there has been a decrease in the numberof for-profit beds. In Austria, with the introduction of along-term care allowance (Pflegegeld) in 1993, theoverall number of beds increased considerably, whilethe number of beds in public and non-profit institutionshas stagnated since 1998 and the share of privatefor-profit beds and residential homes has continued toincrease – so much so that in 2010 they accounted forabout one-fifth of all beds.
Between 2003 and 2014, the use of private providers fornursing home care of older people increasedsignificantly in Ireland, with a 49% increase in privatebeds and a decrease in public beds from around 9,000to 6,656. This was aided by tax concessions for buildingprivate nursing homes, which were in place from 1997to 2009. The aim had been to increase overall nursinghome bed supply in order to relieve pressure on publichospital beds, which were being used for care of olderpeople in areas with relatively few nursing home beds.While there was no explicit policy of replacing public
beds with private beds, the existence of tax breaks forthe latter and the lack of investment in the former haveeffectively led to this trend. The increase in the totalnumber of beds is mainly due to the expansion of theprivate sector. In 1988 there were nearly 15,000long-stay beds, with nearly half of them provided by thepublic sector (health board geriatric hospitals andhomes) (BDO, 2014). By 2015, the total number of placeswas almost 30,000 but with only 23% in public carehomes.
In Norway, the number of privately operated beds inresidential care and nursing homes has remainedrelatively stable during the last decade, although it roseslightly between 2012 and 2015 as a consequence of anincreased number of beds provided by for-profitproviders. However, this stability masks a significantshift from non-profit providers to commercial providers.The number of beds in non-profit care homes haschanged little since the 1980s but has declined in recentyears. According to employer organisation Virke,30 nursing homes run by non-profit providers wereclosed between 2000 and 2011 (Gautun, Bogen andGrødem, 2013, p. 45). Municipalities also have theopportunity to enter into long-term contracts with
Trends in care provision over time
Figure 8: Changes in the share of private beds 2002–2016 (%)
Austria
Belgium
Czech Republic
Lithuania
Spain
Malta
Norway
Poland
Romania
Slovenia
Slovakia
UK (Scotland)
France
Germany
0
10
20
30
40
50
60
70
80
90
100
2003 2004 2005 2006 2007 2008 2009 2010 2011 2012 2013 2014 2015 2016
Source: Network of European Correspondents.

20
non-profit providers without needing to implementcompetitive tendering procedures. Since a cooperativeagreement was reached between the government,NGOs and employers’ organisations in 2012, the numberof beds provided by non-profit organisations seems tohave stabilised. The growth in commercially run nursinghomes and residential care has been a lot slower thananticipated; this is largely due to the fact that the use ofpublic tenders in this field is limited to a small numberof municipalities (Hermansen, 2011).
From the early 1990s onwards, more and more beds inUK residential care have been provided by the privatesector, with the private for-profit sector now providingthe bulk of places. The increase in independent(for-profit) sector provision was driven by a governmentpolicy that called for a ‘mixed provision of care’ and theadoption of the ‘best value’ principle, that effectivelyled to more outsourcing of local authority purchasedcare to the private sector as this offered greater cost-savings compared with local authority in-houseprovision. As a result of these reforms, in 2014 in the UKas a whole there were 187,800 places (86% of all places)in for-profit care homes, 17,600 in non-profit carehomes and 12,300 long-stay National Health Service(NHS) beds. Overall, the 25 largest organisationsprovide 30% of the care home beds (with a total of 15%being provided by the four largest organisations alone:Four Seasons, Bupa Care Homes, HC-One Ltd andBarchester Healthcare) with the remainingorganisations each supplying 0.4% or less of totalcapacity (LaingBuisson, 2013, cited in Jarrett, 2016). InScotland during the last decade, there has been adecrease of around 20% of public and non-profit beds,while the for-profit sector has increased by slightlyunder 10%. Given these changes and the fact that theprivate for-profit sector may operate larger homes, theshare of for-profit beds in 2015 accounted for 79% of thetotal, whereas in 2004 it was 73%.
Size (average number of beds)
The data regarding the number of care homes and bedsgives an idea of the differences in size between publicand private care homes. Figure 9 shows the averagenumber of beds in each type of care home. In Sloveniaand Malta, public care homes have more than doublethe average number of places as private ones. InNorway, private care homes are approximately 50%bigger than public ones; and in Sweden, private carehomes also have a bigger capacity (National Board forHealth and Welfare, 2012). On average, all types of carehomes were smaller in the UK (Scotland) and in theCzech Republic. The average number of registeredplaces in the UK (Scotland) per care home stood at 42 inMarch 2014. Care homes were also small in England: in2010, local authorities ran on average larger residential
Care homes for older Europeans: Public, for-profit and non-profit providers
Figure 9: Average number of beds by ownership type
Public Private For-profit Non-profit
Note: All data are from latest year available for each country;average size in Belgium was calculated in Pacolet and De Coninck(2015).Private encompasses both for-profit and non-profit.
Austria (2010)
83.8 66.8 112.1
104.0 71.0 98.0
Belgium (2013)
Greece (2015)
Ireland (2014)
Malta (2016)
52.0 48.8
50.4 51.1
179.9 84.6
116.0 72.0
Czech Republic (2014)
France (2011)
Lithuania (2015)
92.5 71.3 70.3
53.0 36.7

21
care homes (24 beds) and nursing care homes (54 beds)than the private for-profit sector (19 beds and 48 bedsrespectively) or the voluntary sector (15 beds and 36beds respectively) (CQC, 2010, cited in Lievesley, Crosbyand Bowman, 2011). In Germany, most care homes runby public or non-profit providers have between 60 and150 places, whereas 50% of private for-profit homeshave between 10 and 50 places (Destatis, 2013).
With regard to changes over time in the average size ofcare homes, in most countries for which data areavailable (Lithuania, Spain, Malta and Romania) therehas been a decrease in the average number of places inpublic care homes and an increase in the size of privateones. This has also been the case in the UK (Scotland),where there has been an increase in the averagenumber of places per care home (38 in 2004) as olderhomes may have given way to larger purpose-builtfacilities (ISD/NHS, 2015). Similarly in Ireland, thenumber of private nursing home beds increasedsignificantly over the period between 2003 and 2014,from 14,946 beds to 22,343 (an increase of 49%),although the number of homes only increased slightly,from 408 to 437 (by 7%). This shows that most beds areadded through putting additional capacity in place inexisting homes. Around 42% of participants in the 2014Nursing Homes Ireland survey intended to increasecapacity the following year by an average of 19 beds. InFrance, care homes have increased their capacity by 5%since 2007. At the end of 2011, the average capacity was68 (or 719,810 places for 10,481 facilities). In Denmark,there is also a trend towards building bigger homes withmore residents (AGE Platform Europe consultation).However, the opposite trend can be seen in Lithuaniawhere there has been a decrease from 202 beds in 1990,to 48 beds in 2015.
Number of staff
The size and number of care homes also explains, to agreat extent, the differences in the number of staffemployed. In the UK (Scotland), where most beds andcare homes are private, 87% of care home staff wereemployed there in 2014 (67% for-profit and 17%non-profit), compared to 13% working in care homesrun by local authorities or the NHS (ISD/NHS, 2015;Scottish Social Services Council, 2015).
This percentage is even smaller in England. Overall,there were around 555,000 jobs in adult care homes in2015, representing 42% of adult social care jobs, or 38%when focusing on care homes only (Skills for Care,2015). Only 4% of jobs in residential care (26,500) werein local authorities, and their number had fallen byaround 30% between 2011 and 2015. This is mainly dueto organisational restructuring, outsourcing and closureof facilities (Health and Social Care Information Centre,2015; Health and Social Care Information Centre, 2016).
Trends in care provision over time
Source: Authors’ calculations based on data in previous sections.
109.8 66.2
Poland (2014)
Slovenia (2015)
UK (Scotland) (2015)
260.6 124.3
29.8 48.0 31.4
Norway (2015)
40.3 65.3 52.6
66.8 39.7
Romania (2014)
Slovakia (2013)
53.3 30.6

22
Personal care worker in residential care activities is oneof the jobs for which demand increased the most inEurope between 2011 and 2015 – by 16.2% (Eurofound,2016). Changes over time in employment figures reflectthe changes in the number of care homes and beds.
Germany: The number of staff in public care homesdeclined by 11%, whereas the number of staff increasedby 26% in non-profit homes and by 67% in for-profithomes between 2003 and 2013.8
Finland: The number of staff in privately run shelteredhousing facilities increased from 8,353 in 2012 to 11,054in 2013. This presumably was partly related to theintroduction of the Elder Services Act in 2012, togetherwith a recommendation of a minimum staff-to-residentratio of 0.5:1. There was also a notable rise in thenumber of staff in privately run residential homes from2009 to 2010 and an even more significant drop from2012 to 2013, the explanation for which is unclear.
Croatia: The average number of employees in publicsocial welfare homes for older and infirm persons was64 in 2003 and 79 in 2014, while the average number ofemployees in private homes was 17 in 2003 and 22 in2014.
Slovakia: Between 2005 and 2013, the number ofemployees in care homes increased by 39%, while therewas an increase in the share of employees in non-publicproviders from 10% to 18% of the labour forceemployed in nursing homes.
Latvia: Care homes employed 217 workers in 2014. Ofthese, 29 (or 13%) were employed in private institutions.
Romania: The number of staff in private care homesincreased from 99 in 2008 to 406 in 2013. The impact ofthe economic crisis led to a moratorium on recruitmentin public institutions. Even though the average size ofpublic care homes is greater than private homes, it isonly in large cities (such as Arad, Brasov, Bacău and Iaşi)that public care homes have more than 50 employees.
Number of service users
The differences in size and market share influence theshare of residents in each type of care home, as shown inFigure 10. (Changes over time in the number and shareof service users are shown in Figure 11 and Figure 12.)
Figures 11 and 12 show that the highest increases in thenumber and share of residents in private care homeswere seen in Romania, reflecting the increase in privateprovision. In Romania, the share of residents in privatecare homes increased from 21% of the total in 2008, to44% in 2014. The number of users increased both inpublic and private care homes also in Finland, Croatia
Care homes for older Europeans: Public, for-profit and non-profit providers
Figure 10: Share of service users by ownership type (%)
0
10
20
30
40
50
60
70
80
90
100
Public For-profit Non-profitPrivate Other
Note: Private encompasses both for-profit and non-profit.Source: Network of European Correspondents.
8 Data refer to all workers in residential care including palliative care, and care of those with mental health problems.

23
and Poland. In all these countries the increase in serviceusers was higher in the case of private care homes thanin public ones. Between 2004 and 2014, Croatiaregistered the highest increase of residents in publiccare homes of all the countries for which data wereavailable (35%), as well as a considerable growth in thenumber of private residents (119%). In Germany,Hungary, Lithuania, Sweden and Slovakia, the numberof residents in public care homes decreased whilst therewas an increase in the number of residents in privatecare homes (Figure 11). Regarding the number of
residents in care homes in Lithuania, this number morethan doubled between 1990 and 2015. At the end of2015 there were around 5% of bed vacancies in all typesof care homes for older people in Lithuania. Thedecrease in the number of residents in Swedish carehomes can be explained by an increase in the number ofpeople receiving care at home. However, home care hasonly partly compensated for the down-scaling of carehomes (Meagher and Szebehely, 2013). Decliningcoverage can partially be explained by improved healthamong older people, but, overall, it has become
Trends in care provision over time
Figure 11: Relative change in the number of service users over time (%)
Note: Private encompasses both for-profit and non-profit.Source: Network of European Correspondents.
-100 250200150100500-50
Croatia2009–2014
Finland2004–2014
France2007–2011
Germany2003–2013
Lithuania2005–2015
Hungary2005–2013
Poland
Romania2008–2014
Sweden2007–2015
Cyprus2009–2014
Slovakia2005–2013
UK (Scotland)2005–2015
Public Private For-profit Non-profit Other

24
increasingly difficult for older people in need ofassistance to get a place in residential care (somethingoften brought up in policy debate). The increase in thenumber of residents in private care homes could be dueto the 2009 Law on System of Choice in the PublicSector (the LOV Act), which allows long-term care usersto choose a service provider. As of June 2016, some 158of 290 Swedish municipalities had introduced a LOVsystem in some form; 15 of these had introduced it inthe area of special housing for older people.
The number of service users decreased in Cyprus,Greece and the UK. While no data are available forGreece prior to 2014, the President of the Greek CareHomes Association noted that a wave of departuresfrom homes for older people has been recorded sincethe beginning of the economic crisis, particularly amongservice users who are not dependent. Before the crisis,these care homes were at full capacity with waiting lists.If unemployment increases in Greece, the trend fornursing homes to empty is expected to intensify.
Previous research carried out by Eurofound showedthat older people in Latvia, Hungary and Portugalmoved out of nursing homes as a consequence of thecrisis and moved into their offspring’s home in order tosupport the household financially with their pensions(Eurofound, 2014b). The number of care home residentsfunded by local authorities in the UK (England) fell toapproximately 213,000 in 2014, representing a 22%decrease between 2004 and 2014. The percentage oflocal-authority funded places provided by the for-profitsector steadily increased from 88% in 2004 to 96% in2014. Overall, 50% of residents in care homes receivefunding from local authorities (LaingBuisson, 2013,cited in Grant Thornton, 2014). In Scotland the numberof long-stay residents in public and non-profit carehomes decreased between 2005 and 2015, with thenumber of long-stay residents in for-profit care homesincreasing slightly (3%) during that period.
Care homes for older Europeans: Public, for-profit and non-profit providers
Figure 12: Change in the share of users of private services over time (%)
Cyprus
Germany
Finland
France
Croatia
Hungary
Lithuania
Poland*
Romania
Sweden
Slovakia
UK (Scotland)
0
10
20
30
40
50
60
70
80
90
100
2003 2004 2005 2006 2007 2008 2009 2010 2011 2012 2013 2014 2015
Source: Network of European Correspondents.

25
This chapter describes the differences between theservices delivered in public and private care homesaccording to the evidence gathered through deskresearch and from Eurofound’s Network of EuropeanCorrespondents. It also uses data gathered through aconsultation among members of AGE Platform Europeregarding the views of service users and their familiesabout the differences between public and privateservices. The focus is on the three aspects of servicedelivery (accessibility, quality and efficiency) that havebeen already analysed by Eurofound in relation tohospitals (Eurofound, 2017).
Accessibility
Availability of services
Figure 13 shows the percentage of Europeans over theage of 80 availing of home and residential care.Belgium, the Netherlands and Luxembourg have thehighest share of residents in care homes, while Poland,Portugal and Spain have the lowest share, with ratesbelow 5%. Overall, the percentage of older peopleresiding in care homes is lower (below 10%) in centraland eastern Europe. With the exception of Belgium andPortugal, there is a higher percentage of people availingof home care than residential care homes, with somecountries, such as the Czech Republic, having a ratio ofmore than 4:1, and Spain, with a ratio of more than 3:1.
2 Private care provision andservice delivery: Accessibility,quality and efficiency
Figure 13: Long-term care recipients at home and in healthcare facilities (other than hospitals)
0
5
10
15
20
25
30
35
40
Institutions (other than hospitals)Home care
Note: Data shown as a percentage of the population aged 80 years and over in 2014 or latest year available. Data about institutional care in theCzech Republic, Belgium, Denmark, Luxembourg and Sweden are estimated values; data about home care in the Czech Republic, Hungary andLuxembourg, Slovenia and Sweden are estimated values; data for Slovenia correspond to 2013; data for the Czech Republic correspond to 2009;data for home care in Denmark correspond to 2012, and data for home care in Belgium correspond to 2007. Source: OECD Health data (2016).

26
The extent to which Europeans avail of care homes isinfluenced by a number of factors, includingdependency rates, and the availability of home care andinformal care. Data from the third European Quality ofLife Survey give an overview of which barriers make itdifficult to access long-term care services (includingpublic and private home and residential care services).The data in Figure 14 show that availability barriers areless problematic (that is, less than 50% of service usersexperiencing difficulties) in Belgium, Cyprus, Denmark,Luxembourg and the Netherlands. Difficulties in accessbecause of distance or opening hours were lesswidespread (that is, for less than one-third) in Denmark,the Netherlands, Luxembourg and Finland. In contrast,more than 80% of service users in Slovakia, Greece andSlovenia experienced difficulties in availability, while
over 70% of service users in Greece, Bulgaria andRomania had difficulties related to access.
As for the services provided, private care homes inseveral countries are less likely than public ones toprovide specialised medical services. In Malta, mostprivate care homes provide basic nursing services andresidents are often expected to contract their ownmedical specialist for certain conditions. In contrast,public nursing homes provide such additional servicesas physiotherapy, occupational therapy, speech therapyand geriatric services. In Ireland, public homes are morelikely to have specialised services because of the highernursing numbers available. A national survey ofdementia in residential care found, on the whole, thatthe for-profit sector is the main provider of specialistcare to persons with dementia (63% of the total),
Care homes for older Europeans: Public, for-profit and non-profit providers
Figure 14: Difficulties in accessing long-term care because of barriers to access and availability (%)
Denmark
Netherlands
Belgium
Cyprus
Luxembourg
Austria
Sweden
Germany
UK
France
Spain
Finland
EU27
Latvia
Portugal
Ireland
Malta
Poland
Hungary
Czech Republic
Romania
Lithuania
Estonia
Italy
Bulgaria
Slovenia
Slovakia
Greece
0102030405060708090100 0 10 20 30 40 50 60 70 80 90 100
Note: Q56: To what extent did each of the following factors make it difficult for you or not, or someone close to you, to use long-term careservices? a) Cost; b) Availability (e.g. waiting lists, lack of services); c) Access (e.g. because of distance or opening hours); d) Quality of care; 1)Very difficult; 2) A little difficult; 3) Not difficult at all.Source: European Quality of Life Survey (2011).
Availability(e.g. waiting lists, lack of services)
Access(e.g. because of distance or opening hours)

27
followed by the public (30%) and the non-profit sectors(7%). The public sector is more likely to be the mainprovider of residential respite care (Dementia ServicesInformation and Development Centre, 2015). InSlovakia, the private sector provides residential caremostly orientated in terms of social care (EuropeanCommission, 2011). In Greece, some for-profit providershave concentrated more on dementia care orrehabilitation, as opposed to non-profit providers whoprovide only basic nursing care (AGE Platform Europeconsultation). In Romania, private for-profit care homesprovide more specialised services and can admitexclusively one type of resident (such as older peoplewith Alzheimer’s disease) (AGE Platform Europeconsultation).
These differences in the services provided by each typeof institution can be caused by differences in legislationand/or funding. For instance, in Latvia the scope ofservices provided by public nursing homes is partlydetermined by legislation on social services and socialassistance, whereas private care homes are free tochoose which services they provide. In Belgium(Flanders), only providers whose legal status isnon-profit (public or private non-profit) are entitled toreceive subsidies from an agency within the Flemishgovernment to organise activities for residents.
Costs and affordability
Perhaps the more obvious area of difference betweenpublic and private services is their affordability. Costs inthe form of private insurance and out-of-pocketpayments (such as user fees, income-related costsharing or differences between benefits packages andthe price of services) constitute a barrier to accessingprivate long-term care (European Commission, 2008).Overall, it is difficult to make a direct comparison of thecosts associated with public and private provision, asthere is a lot of variation among care homes with thesame type of ownership, according to the servicesprovided and their quality. Furthermore, services inprivate care homes may be subsidised or contracted outby the public sector, which can also affect the feecharged to users making out-of-pocket payments.A study of 12 county councils in the UK found thatservice users who funded their own stay paid over 40%more than those funded by local authorities for thesame services (County Councils Network andLaingBuisson, 2015). According to the study’s authors,this cross-subsidising of fees is a market response to thefee levels set by local authorities.
Figure 15 shows data about the minimum andmaximum fees for publicly subsidised facilities andprivate residential care in relation to a reference incomein several EU Member States, Norway and Iceland
Private care provision and service delivery: Accessibility, quality and efficiency
Figure 15: Ratio of fees for residential care to reference income of service users
0
0.5
1
1.5
2
2.5
3
3.5
4
4.5
5
Minimum public Maximum public Minimum private Maximum private
Note: Reference income is for service users aged 65 years and over. The reference income is the median net income for a single, elderly person(65+) living on their own.Source: European Commission (2012b) p. 89.
28
(European Commission, 2012b). Although there islimited information on fees for non-subsidisedresidential care, the data available confirm that privateresidential services are much more expensive. InBulgaria, minimum fees for private institutions arealmost four times higher than the reference income. InCyprus, Estonia and Lithuania, monthly expenses for thecheapest private residential services are at least 10%higher than the country’s reference income.
The data in the European Commission study correspondto the years 2003–2009 (most of the data correspondingto 2009). More recent information gathered by theNetwork of European Correspondents shows that priceshave increased since the economic crisis, as detailedbelow.
Italy: With the beginning of the economic crisis and theprogressive implementation of an accreditation system,there has been a general increase in the fees of nursinghomes. A survey looking at the period 2007–2012 (thusalso considering the pre-crisis period) showed that theaverage cost for private residential facilities increasedby 18.5% for the lowest fee and 13% for the highest fee(Montemurro, 2012).
Germany: Rothgang (2015) found that the prices inprivate for-profit care homes were lower than those ofnon-profit and public providers, and that prices did notincrease to the same extent as the prices in the othertwo types of care homes. Private nursing homes chargeon average 10% less than non-profit homes, resulting inlower quality (Geraedts et al, 2016).
Belgium: In Flanders, the average price per day foraccommodation in a single room in 2012 was €46.50 in apublic care home, €49.60 in a private non-profit homeand €48.90 in private for-profit care home (Pacolet andDe Coninck, 2015). It would appear that prices in thecommercial sector are increasing. In 2016, the price in afor-profit care home was €61 per day, as against €55 in aprivate non-profit care home and €53 in a public home.In Wallonia, in 2014 a public facility cost on average€1,237 per month – €1,381 in the private non-profitsector and €1,388 in for-profit care homes.
France: In 2013, private non-profit nursing homes(EHPAD PNL) that are not eligible for social assistancecost on average €2,460 per month in the regionÎle-de-France and €1,833 outside this region. In publicnursing homes, in contrast, the average prices were€2,418 and €1,804 respectively (KPMG, 2015). In 2011,the daily rate for non-care related costs for placeswithout financial support from the regions(départments) was €75.10 in for-profit nursing homes,€59.60 in non-profit nursing homes and €51.40 in publicnursing homes (DREES, 2014).
Ireland: Weekly rates in public nursing homes havestayed at €1,245 since 2011. In private nursing homes,the rates payable under the ‘Fair Deal’ Nursing HomeSupport Scheme, under which 79% of residents arefunded, averaged €896 in the 2014 Nursing HomesIreland survey – up 5% since 2009. The average feepayable to public nursing homes under the NursingHome Support Scheme was €1,407 in 2016. Bycomparison the average fee payable to private andvoluntary nursing homes in October 2016 was €923(a 53% national average fee differential).
Slovenia: The average prices for residential care homesdiffer according to the type of ownership and the levelof dependency of service users. The daily prices ofservices in 2014 were on average approximately 16%higher in private care homes than in public ones.
Netherlands: The costs are higher in for-profit carehomes than in non-profit homes. In the for-profit carehomes, monthly costs range from €3,000 to €6,000. Innon-profit care homes, monthly co-payments rangebetween €159.90 and €2,301.40, depending on thefinancial situation of the residents. On average,privately financed nursing homes generate 23% moreincome per resident than regular non-profit nursinghomes.
Spain: The public price of a place in a residential centrefor service users who are not dependent was €18,645.83per year in 2011, while the publicly subsidised price for aplace in a private residential centre was €17,526.99 peryear. Subsidised prices of a place for a dependentperson or for a person with psychogeriatric needs werehigher (€19,897.51 and €24,299.84 respectively)(IMSERSO, 2011).
There are several reasons for these differences in prices.In Germany, private companies have the lowest pricesbecause they have easier access to investment capital.They rarely apply collective agreements and thereforethe average wages in private care homes are lower thanin non-profit and public care homes (Auth, 2014).Consequently, they are able to offer lower prices andthus get most of the contracts and service users. In thiscontext, non-profit providers need to achieve highoccupancy rates, with many resorting to cost-cutting inorder to survive economically. In addition, local socialwelfare departments are legally obliged to take overco-payments from lower income users (who currentlymake up 40% of all care home residents) (Bode, 2014).In Belgium, service users do not pay for their care butcontribute towards the costs of other services (such asroom, food and maintenance). Therefore an importantdeterminant of the fees is the area where the care homeis located and the condition of the premises.
Care homes for older Europeans: Public, for-profit and non-profit providers

29
There is a wide range of measures that are put in placeby Member States to ensure the affordability of long-term care by reducing the individual direct costs of care(European Commission, 2008). These include:
£ exemptions from co-payment and co-paymentsbased on income
£ financial aid and benefits for service users
£ state coverage of social long-term care forlow-income households within a social assistanceframework
£ nationwide standardisation of co-payments andstate subsidies to use private services.
Table 2 shows how some of these measures are applieddifferently in public and private care homes.
Private care provision and service delivery: Accessibility, quality and efficiency
Table 2: Measures reducing the individual costs of public and private care homes
Cyprus In the case of public assistance recipients, the Social Welfare Services cover the total amount needed for their care.This includes both older people and disabled persons of all ages.
Denmark For nursing and residential care homes, the public sector subsidises the cost, taking the residents’ personal financesinto account (there is a maximum cost for a place in a public care facility). In private (for-profit and non-profit)residential care homes (Friplejeboliger) the residents also receive public subsidies, but there is no maximum cost forthe residents.
Estonia There is no state-provided financial support for older people in nursing homes. Responsibility for payment falls on theindividual or their immediate family. When there are no family members, the local government provides financialassistance.
Finland The fees for permanent institutional care are based on the Act on Client Fees in Social Welfare and Healthcare, andcovers all treatment, care and living expenses. People in long-term institutional care are charged with a monthly feebased on each patient’s ability to pay. The act does not apply to privately operated homes for older people, whichusually have different price ranges based on their needs. Costs of private services are generally subsidised by thepublic sector, provided that the individual would be entitled to similar publicly provided services. Municipalities maygrant service vouchers or make an outsourced service agreement.
France Costs may be covered by the housing allowance (aide personnalisée au lodgement, APL) and social assistance paid bythe départment. Care homes need to have an agreement in place in order to avail of this aid, with around one-quarterof for-profit – and two-thirds of public and private non-profit nursing homes – having this type of agreement. If thenursing home does not have an agreement to admit recipients of this benefit, service users can request other benefitssuch as social housing allowance (allocation de logement sociale, ALS) or social assistance for accommodation (l’aidesociale à l’hébergement, ASH) that can fully cover non-care related costs (DREES, 2014).
Hungary The state covers part of the cost of a person’s accommodation in state and public institutions depending on theirfinancial position. The state does not (co)finance accommodation in private institutions.
Ireland In 2009, the Nursing Home Support Scheme (NHSS) was set up. This scheme involves a care assessment and afinancial assessment. One of the benefits of this scheme is that it gives users access to the full range of nursing homesfor the same cost, reducing the need for hospital beds for care of older people. The price charged by private nursinghomes is agreed in advance with the National Treatment Purchase Fund, with an amount of up to 80% of the user’sincome used to pay towards the cost of care, with the Health Service Executive paying the rest. Assets (including thefamily home) to the value of 7.5% of the assets per year of care can also be included in the user’s contribution. But ifthey include land and/or property, that element of the contribution can be deferred and paid to the tax collectionagency after the service user’s death. The maximum extent to which a principal private residence can be used in thisway is up to 22.5% of the property’s value (three years of care, regardless of how long the period of care is).
Lithuania Long-term care insurance can be used to pay for care in public and private care homes. Health insurance covers theexpenses related to illness, such as medical treatment, nursing and drugs. Payments are made directly to the carehome and the level of payment is determined as hours of care needed per week multiplied by the monetary value ofone hour of care. Generally, individuals who live in a care home must cover the costs of accommodation. Those whocannot afford to pay the full cost of long-term residential care may be eligible for public social assistance.
Norway The public sector subsidises costs for residents in nursing homes, paying 75% of pensions and 85% of capital income.All citizens with a documented need for care (assessed on an individual basis) are eligible; there are no differences ineligibility or cost for residents between private and public sector providers. A few municipalities let service userschoose the provider and/or home.
Poland Care services provided by public nursing homes/residential care homes require a co-payment by the patient. Patientsin residential facilities of the healthcare sector pay only for the costs of accommodation and board; medicaltreatment and nursing are financed by the health insurance. The monthly payment of care recipients is set at the levelof 250% of the lowest pension, but the fee cannot be higher than an amount equivalent to 70% of the monthlyindividual income of the patient. In a residential facility of the social assistance system, the costs are financed bydifferent payers: care receivers (70% of individual income); the family of the care receiver (depending on familyincome); and local self-government (gmina). Private establishments financed from public funds operate in the sameway as public ones: they perform public tasks on the basis of a contract. Private establishments without subsidiesoffer care services at market prices and the patient has to pay the whole fee.
30
Services that are provided, subsidised or commissionedby the public sector may have set prices to ensure thatthey are affordable, whereas private nursing homes candecide on their fees. This is the case in Belgium,Denmark, France, Greece and Malta. In Germany, dailyrates charged by care homes are negotiated betweenhealth insurance funds and providers, taking intoaccount the type of services provided by the care home.If other providers in the area can provide services at alower cost, this can be a negotiating factor. Theinformation provided by public inspections andadvertisements can be used by service users to guidetheir choices (Bode, 2014). One of the objectives ofpromoting competition between different types of carehome providers is to bring down prices. Marczak andWistow (2016) point out that there is little evidence toindicate that this actually results as foreseen, with someevidence showing that in the UK (England) increasedcompetition did indeed push prices down but also ledto a decrease in the quality of care.
Physical location
Private providers are particularly concentrated inprosperous regions (as in the Netherlands, Norway,Sweden and the UK), in cities and bigger towns(Estonia, Finland, Germany, Italy, Poland and Romania),or in parts of the city in which the housing costs arelower (in the case of Italy). Deloitte (2011) found that inNorway, densely populated (metropolitan)municipalities were more likely to contract out carehome services. A review of 47 public tenders from 1997to 2012 (Herning, 2012) shows that a large majority areconducted in cities – almost half in Oslo.
Finland: A similar pattern emerges, with only relativelylarge urban areas contracting out services. In 2010,there were 106 local authorities (out of a total of 334)who did not contract out services. These municipalitiesconstituted only 10% of the country’s population.
Germany: There is a higher share of public care homesin rural areas than in other settings – albeit low(about 5%). Towns of a more intermediate density(verdichtet) have a higher proportion of privatefor-profit care homes. Non-profit care homes constituteover half of the total care homes in all settings, beingmore prevalent in urban areas – 58% of the total in 2012(Rothgang, 2015). It must be noted that there are alsostrong regional differences: for-profit providers aremore prevalent in the north west of Germany; non-profitorganisations in eastern Germany and North-RhineWestphalia, and public care homes are morewidespread in south-west Germany (Rothgang, 2015).
Ireland: Public nursing homes tend to be closer tourban amenities, while many private nursing homestend to be away from transport options and on the edgeof towns or cities, especially in rural areas (AGE PlatformEurope consultation). Regional disparities are alsopresent in the availability of specialised services. Forexample, there are many dementia care units insouthern and eastern counties in Ireland and countiesnear the border with Northern Ireland, but relatively fewin Dublin and other parts of the country.
Poland: A few NGOs operate in the less developedregions of the country (Lubuskie, Zachodniopomorskieand Świętokrzyskie).
Care homes for older Europeans: Public, for-profit and non-profit providers
Portugal With regard to prices, a reference value for residential accommodation for older people is established and regularlyrevised by the government in dialogue with collective representatives of third-sector organisations (€970 in 2015).Providers can charge at most 15% above this reference value and payment can be shared by the resident and his/herrelatives and direct transfers from public funds to the provider. Public funds cover a part of the cost as long as acooperation agreement exists between the service provider and social security; the part of the cost to be covereddepends on the beneficiary’s household income and degree of dependence. This applies only to residential carewithin the framework of the cooperation agreement; all other arrangements are exclusively private and can havedifferent conditions.
Romania The monthly contribution of older people for nursing and assistance services in public residential care homes shouldbe less than 60% of the monthly personal retirement income. Their contribution shall not exceed the average monthlycost approved for each public care home. If service users or their legal representatives have no income, care andsocial assistance are given by the local and (since 2016) central budget.
Slovenia Most of the costs (60%) are covered by the service users; the rest is covered by their insurance. Since 2012, people inresidential homes are no longer eligible for financial social assistance. If service users or their relatives cannot affordresidential care, the municipalities can pay the difference based upon the decision of the Social Work Centre. In 2014,on average the municipalities provided only 16% of the total costs of care provided by public and private care homes.
United Kingdom As of 2020 (delayed from 2016), the cost of care will be for the first time capped at £72,000 for those over the age of 65and eligible for local authority funding, with estimates suggesting that this may benefit one in eight service users. Alsoin 2020, more people in care homes will become eligible for local authority support, as the threshold of assets hasbeen raised. People who now become eligible for local authority funding may ask local authorities to arrange theircare at the local authorities’ lower rate (Laing, 2014).
Source: Network of European Correspondents (unless stated otherwise).
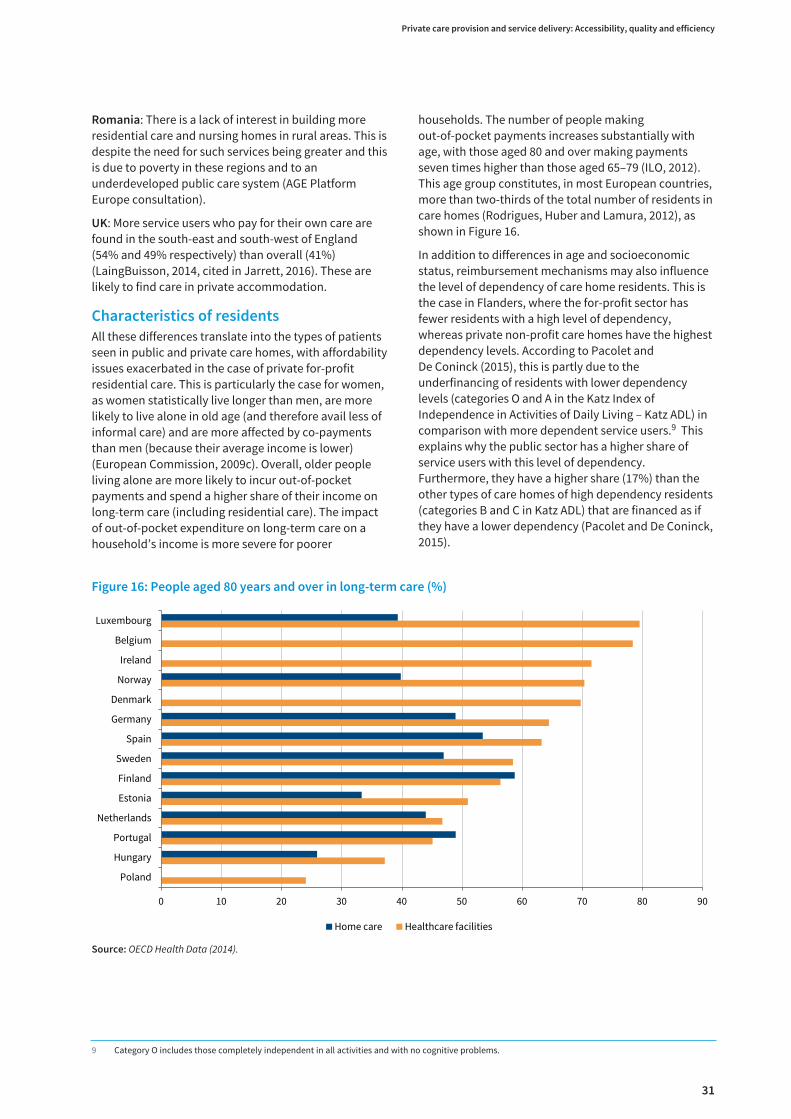
31
Romania: There is a lack of interest in building moreresidential care and nursing homes in rural areas. This isdespite the need for such services being greater and thisis due to poverty in these regions and to anunderdeveloped public care system (AGE PlatformEurope consultation).
UK: More service users who pay for their own care arefound in the south-east and south-west of England(54% and 49% respectively) than overall (41%)(LaingBuisson, 2014, cited in Jarrett, 2016). These arelikely to find care in private accommodation.
Characteristics of residents
All these differences translate into the types of patientsseen in public and private care homes, with affordabilityissues exacerbated in the case of private for-profitresidential care. This is particularly the case for women,as women statistically live longer than men, are morelikely to live alone in old age (and therefore avail less ofinformal care) and are more affected by co-paymentsthan men (because their average income is lower)(European Commission, 2009c). Overall, older peopleliving alone are more likely to incur out-of-pocketpayments and spend a higher share of their income onlong-term care (including residential care). The impactof out-of-pocket expenditure on long-term care on ahousehold’s income is more severe for poorer
households. The number of people makingout-of-pocket payments increases substantially withage, with those aged 80 and over making paymentsseven times higher than those aged 65–79 (ILO, 2012).This age group constitutes, in most European countries,more than two-thirds of the total number of residents incare homes (Rodrigues, Huber and Lamura, 2012), asshown in Figure 16.
In addition to differences in age and socioeconomicstatus, reimbursement mechanisms may also influencethe level of dependency of care home residents. This isthe case in Flanders, where the for-profit sector hasfewer residents with a high level of dependency,whereas private non-profit care homes have the highestdependency levels. According to Pacolet andDe Coninck (2015), this is partly due to theunderfinancing of residents with lower dependencylevels (categories O and A in the Katz Index ofIndependence in Activities of Daily Living – Katz ADL) incomparison with more dependent service users.9 Thisexplains why the public sector has a higher share ofservice users with this level of dependency.Furthermore, they have a higher share (17%) than theother types of care homes of high dependency residents(categories B and C in Katz ADL) that are financed as ifthey have a lower dependency (Pacolet and De Coninck,2015).
Private care provision and service delivery: Accessibility, quality and efficiency
Figure 16: People aged 80 years and over in long-term care (%)
0 10 20 30 40 50 60 70 80 90
Poland
Hungary
Portugal
Netherlands
Estonia
Finland
Sweden
Spain
Germany
Denmark
Norway
Ireland
Belgium
Luxembourg
Home care Healthcare facilities
Source: OECD Health Data (2014).
9 Category O includes those completely independent in all activities and with no cognitive problems.
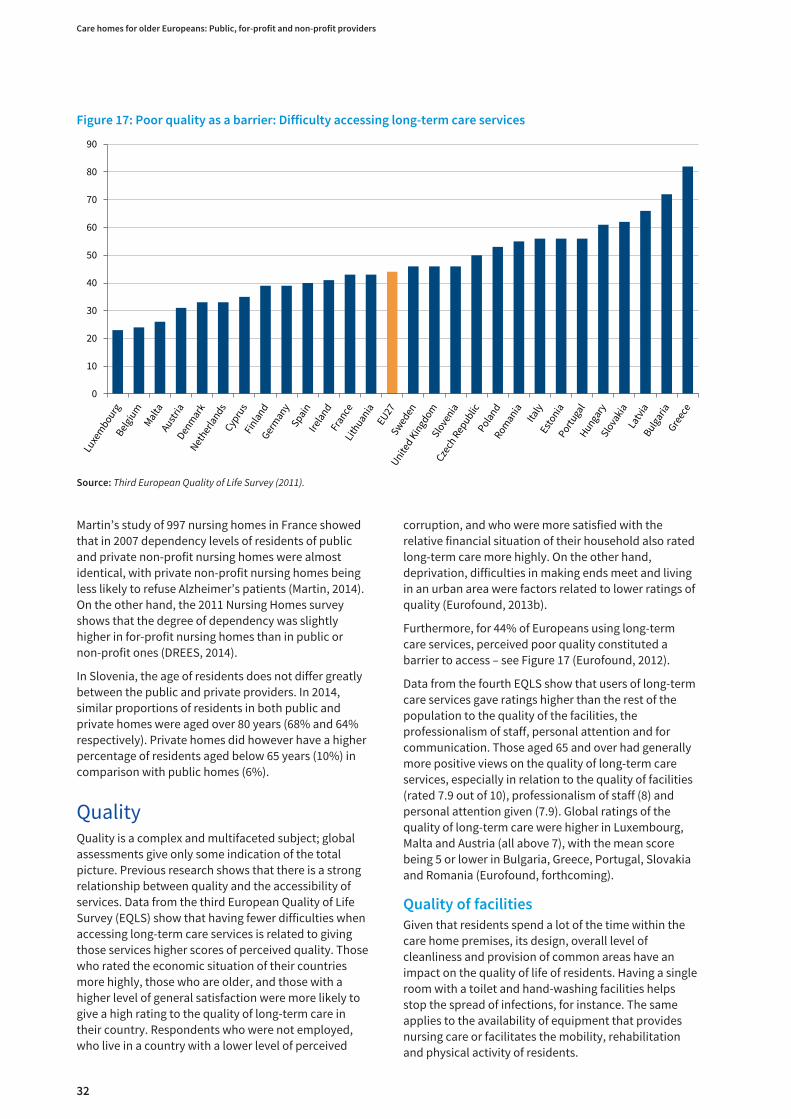
32
Martin’s study of 997 nursing homes in France showedthat in 2007 dependency levels of residents of publicand private non-profit nursing homes were almostidentical, with private non-profit nursing homes beingless likely to refuse Alzheimer’s patients (Martin, 2014).On the other hand, the 2011 Nursing Homes surveyshows that the degree of dependency was slightlyhigher in for-profit nursing homes than in public ornon-profit ones (DREES, 2014).
In Slovenia, the age of residents does not differ greatlybetween the public and private providers. In 2014,similar proportions of residents in both public andprivate homes were aged over 80 years (68% and 64%respectively). Private homes did however have a higherpercentage of residents aged below 65 years (10%) incomparison with public homes (6%).
QualityQuality is a complex and multifaceted subject; globalassessments give only some indication of the totalpicture. Previous research shows that there is a strongrelationship between quality and the accessibility ofservices. Data from the third European Quality of LifeSurvey (EQLS) show that having fewer difficulties whenaccessing long-term care services is related to givingthose services higher scores of perceived quality. Thosewho rated the economic situation of their countriesmore highly, those who are older, and those with ahigher level of general satisfaction were more likely togive a high rating to the quality of long-term care intheir country. Respondents who were not employed,who live in a country with a lower level of perceived
corruption, and who were more satisfied with therelative financial situation of their household also ratedlong-term care more highly. On the other hand,deprivation, difficulties in making ends meet and livingin an urban area were factors related to lower ratings ofquality (Eurofound, 2013b).
Furthermore, for 44% of Europeans using long-termcare services, perceived poor quality constituted abarrier to access – see Figure 17 (Eurofound, 2012).
Data from the fourth EQLS show that users of long-termcare services gave ratings higher than the rest of thepopulation to the quality of the facilities, theprofessionalism of staff, personal attention and forcommunication. Those aged 65 and over had generallymore positive views on the quality of long-term careservices, especially in relation to the quality of facilities(rated 7.9 out of 10), professionalism of staff (8) andpersonal attention given (7.9). Global ratings of thequality of long-term care were higher in Luxembourg,Malta and Austria (all above 7), with the mean scorebeing 5 or lower in Bulgaria, Greece, Portugal, Slovakiaand Romania (Eurofound, forthcoming).
Quality of facilities
Given that residents spend a lot of the time within thecare home premises, its design, overall level ofcleanliness and provision of common areas have animpact on the quality of life of residents. Having a singleroom with a toilet and hand-washing facilities helpsstop the spread of infections, for instance. The sameapplies to the availability of equipment that providesnursing care or facilitates the mobility, rehabilitationand physical activity of residents.
Care homes for older Europeans: Public, for-profit and non-profit providers
Figure 17: Poor quality as a barrier: Difficulty accessing long-term care services
0
10
20
30
40
50
60
70
80
90
Source: Third European Quality of Life Survey (2011).

33
A recent study involving care homes for older people insix countries (Belgium, Croatia, Germany, Hungary,Lithuania and Romania) found that in general, thephysical environment was better in private care homesthan in public facilities, although in some countries(such as Lithuania), public settings had a relativelyhigh-quality physical environment thanks to theprovision of European structural and investment funds.Private for-profit care homes tended to have a smallnumber of service users residing in a modern building,giving a more homely feel, with a higher proportion ofprivate (single) rooms. In contrast, overcrowding waswitnessed in some public homes in Croatia, Hungaryand Romania (ENNHRI, 2017). Larger private for-profitcare homes in Germany (with more than 60 places) havefewer single rooms (50% of their rooms being single)than do comparable homes managed by non-profitorganisations (63% of the rooms being single) (Augurzkyand Mennicken, 2011, cited in ENNHRI, 2017).
The information gathered by the Network of EuropeanCorrespondents about differences between public andprivate care homes in terms of quality of facilitiesfocused mainly on the number of residents with theirown room and the type of common areas available. Forexample, data from Sweden show that a larger share ofolder people in public care homes than in private carehomes had their own room and rooms with cookingfacilities (National Board of Health and Welfare, 2012).For-profit nursing and residential care facilities inRomania are more developed than public care homes interms of building safety and accessibility, and also interms of leisure and access facilities (such as well-equipped rooms with a TV, storage, tables, relaxationrooms, a library, workshops and therapy rooms).Similarly in Malta, private for-profit care home facilitiesoffer a higher standard in terms of the overall conditionof the building, access to a private room, equipmentand leisure facilities such as a library, a TV room, sportsfacilities and room for visitors (AGE Platform Europeconsultation).
Statistical data in LaingBuisson (2014) show that therehave been improvements in England in the quality offacilities in for-profit residential homes. This is in termsof the percentage of single rooms as a percentage ofbeds and the number of beds with en-suite facilities, asa result of new purpose-built facilities or the upgradingof older care homes. This process has been also beendriven by government policies, which in 2001 setminimum standards for care homes for older people.Information about the number of beds in each care
home is also relevant to quality, as there is evidencethat residents in smaller care homes are more satisfiedwith the facilities (National Board of Health and Welfare,2012). A study of long-term care facilities in Irelandshowed that the physical environment (for example,separate sitting, leisure and dining rooms) was oftenpoorer in public facilities than in private facilities.A private room was the norm in private nursing homes,while this was rare in public nursing homes (Murphy,Shea and Cooney, 2007). Data from the Belgian region ofFlanders show that between 2009 and 2010, there wereno major differences between the different types ofproviders regarding compliance with hygienestandards: 84% of the public facilities complied withhygiene standards as against 85% of private for-profithomes and 91% of private non-profit providers(Zorginspectie, 2012). However, there were differencesin relation to buildings and equipment, which are oflower quality in private for-profit care homes (forexample, smaller common areas for the residents, less‘sustainable’ building techniques and less ‘smart’building controls) (Pacolet et al, 2012).
The relation between structural quality and the qualityof care was analysed by Weiss, Süderkamp andRothgang (2014). Through descriptive analysis and amultivariate regression analysis, their study looked atwhether structural quality can explain the processquality results. The dependent variables used in theregression were: care (including medical care); dealingwith residents with dementia; social care and generalattention given to residents; and living standards (suchas catering, housekeeping and hygiene). Theindependent variables used in the analysis are: size ofthe care home, the population density of the region(Bundesland) and the care home ownership type. Thestudy covered for the first time almost all care homesand long-term care providers in Germany. The datawere gathered from the inspection care quality reports(Pflege-Qualitätsberichten) carried out by the HealthInsurance Medical Service (MDK). The study found aslightly positive relationship between size and overallscore, with care homes having fewer than 36 residentsobtaining scores lower than the regional average. Thereis also a negative correlation between for-profitownership and the dependent variables describedabove, whereas the relationship is positive in the case ofnon-profit care homes. In the case of public care homes,there is a positive relation except with the variable ‘care’(including medical care). However, even though theeffects were significant, they are too small to beregarded as relevant.10
Private care provision and service delivery: Accessibility, quality and efficiency
10 The population density of the area where the care home resided had no influence on quality. A relevant impact of size, ownership or regional indicatorson process quality results cannot therefore be verified.

34
A UK study focusing on 38 public and private carehomes in and around Sheffield, England (Parker et al,2004) found that higher scores for the domainsafety/health were associated with lower scores forenjoyment of activities and for environmental control.This suggests that creating risk-averse environmentscould have a negative impact on the quality of life oflow-dependency residents. Staff morale was notassociated with better staff facilities, but with a morepersonalised and less institutional environment for theresidents.
Given the importance of the built environment, severalquality frameworks include requirements andstandards. For example, in Ireland, standards set for allnursing homes by the inspectorate in 2009 require thatat least 80% of residents should have single en-suiterooms, with shared rooms occupied by no more thantwo residents, and rooms to be reserved for up to sixresidents who are either highly dependent ortransitioning from hospital care. Implementing qualitystandards in relation to structural quality componentscan be a very costly process, which may affect publicand private care homes differently. In Italy, theimplementation of rules on the accreditation of privateresidential facilities at regional level (for which therewas a deadline in early 2011) led to an increase in costs.During the same period, there was a reduction in publicexpenditure and household purchasing power, whichcontributed to the lowering of standards of servicequality. This created a difficult situation for privatenursing homes, which has led – in some care homes – toa lowering of the quality of the services provided. Therehave also been cases of the relaxation of monitoringactivities by public authorities (NNA, 2015).
In Ireland, new standards for all types of nursing homeswere applied to all new nursing homes from 2009, withpre-2009 nursing homes given until July 2015 to comply.Many public nursing homes were in older facilities thatwere not compliant with these standards; there hadbeen little investment in them during the six-yearperiod. At the end of 2015, a decision was made to givenon-compliant care homes a further six years to comply,with a €300 million investment programme budgetedfor in the government’s Capital Investment Plan. Bythen, most private nursing homes had engaged in thenecessary capital investment, with some having closeddown due to inability to invest (because of a lack offunds or expansion space). Some smaller privatenursing homes closed down as it was not economicallyviable to meet the standards, given their small size. TheHealth Information and Quality Authority (HIQA) iscurrently seeking that the costing and scheduling plansare in place to ensure that the required standards bemet by 2021.
Consequently, differences in financing and fundingtranslate into differences between public and privatecare homes in the built environment. In Estonia, theconditions in public sector care home facilities havebeen improved with the European RegionalDevelopment Fund. According to the President of theAssociation of Social Care Providers in the CzechRepublic, private providers do not have enoughresources for investment due to the current system offinancing social services. Therefore, facilities tend to besignificantly smaller than in the public sector (anestimated average capacity of 60 to 80 beds), themajority of which are more poorly equipped than theirpublic counterparts. In Belgium (Flanders), subsidies forinfrastructure are only available for public and privatenon-profit care homes that are not part of a for-profitholding company. A green paper from the Flemishgovernment in 2016 sought to establish that all types ofproviders can request an infrastructure subsidy.
It should be noted that there can be trade-offs betweenthe quality of the premises and other aspects ofresidential care. Martin (2014) argues that the for-profitprivate sector focuses its offer on the quality ofaccommodation (for example catering and laundry), onleisure services and on the degree of comfort provided.On the other hand, other aspects of quality have beengiven less attention (the number of staff per resident islower in private facilities).
Quality of staff
Having a manageable staff-to-service user ratioincreases the potential personal attention given toservice users; it also avoids having a high turnover ofstaff due to excessive workload. This has been the casein France, where excessive workload is the main reasonwhy nurses and assistant nurses leave their job.Establishments facing labour shortages are also likely toface higher turnover rates (Martin, 2014). A qualitativestudy (with 51 interviews and participatory observation)conducted by the Upper Austrian branch of theChamber of Labour in 2016 shows that low staff-to-resident ratios worsened the working conditions of carepersonnel in nursing and residential homes (Staflinger,2016). This is the case in several other provinces inwhich the Chamber of Labour conducted similar studies(Vienna, Lower Austria, Styria and Tyrol).
Staff-to-resident ratios
One of the criticisms of the private sector is thatbecause care services are labour intensive, profit onpublicly financed care services can only be achieved byreducing wages and staff (Ervik, Helgøy and Lindén,2013). The evidence gathered by Eurofound’s Networkof European Correspondents shows that the number ofemployees per resident is lower in the private sector inseveral of the countries analysed.
Care homes for older Europeans: Public, for-profit and non-profit providers

35
Germany: In 2013, the ratio of staff (full-timeequivalent) to service user was very similar in all threetypes of providers: 0.57 (slightly more than one memberof staff per two service users) in for-profit providers,0.58 in non-profit providers and 0.61 in public providers.These differences are accentuated if the ratio iscalculated in relation to the number of beds. In thiscase, the ratio is much higher in public care homes (0.79– more than 1.5 staff per bed) than in for-profit (0.64)and non-profit (0.63) (Rothgang, 2015). Some expertssuggest that having more workers at a lower cost is aresult of salary dumping. Owners of private care homesrefute this assumption, which implies that they financetheir extra personnel through other means – forexample, by taking residents with severe mental andphysical disabilities whose care is subsidised by thestate (ENNHRI, 2017).
Belgium (Flanders): In order to get public funding, it isnecessary to have a minimum ratio of staff to resident.In 2012, public providers had a ratio of 0.4 staff (full timeequivalent) to residents (equating to less than oneworker per two service users). In private care homes,the ratio was 0.37 in non-profit and 0.3 (less than onemember of staff per three residents) in for-profit carehomes. These differences are explained, to some extent,by the level of dependency of residents, with moredependent residents requiring more staff. Thenon-profit sector has a level of staffing 16.7% above thelevel financed by the Flemish government, while thefor-profit sector has 14% more staff than financed. Thepublic sector has a considerably higher percentage ofstaff (40.4% in 2012) that is not financed. This could betaken as indicative of a lack of efficiency and raisesquestions about the sustainability and cost efficiency ofcare in public care homes (Pacolet and De Coninck,2015). With regard to the compliance with staffingstandards, an inspection in 2012 found that only 40% ofthe for-profit care home providers complied withrequired standards. This is significantly lower than inthe case of non-profit (61%) and public (66%) carehomes.
Sweden: The number of employees per resident issignificantly lower in the private sector (Stolt, Blomqvistand Winblad, 2011), with the ratio of care worker toresident being slightly higher in public care homes (0.9)than in private care homes (0.8) (National Board ofHealth and Welfare, 2012).
France: The staff (in full-time employment) to residentratio increased from 0.5 in 2007 to 0.54 in 2011 (DREES,2014). The highest ratio is in public nursing homes(EHPADs) (0.66), followed by private non-profit (0.56)and for-profit nursing homes (0.53).
Slovenia: In 2014, the average number of beds permember of staff was 1.97 for public providers and 1.86for private providers.
Estonia: In 2012, public care homes had approximately4.3 service users per member of staff. By way ofcomparison, private sector care homes had around5.7 service users per member of staff and 5.3 in specialneeds homes (National Audit Office of Estonia, 2014).
Hungary: In 2013, the average ratio of residents pernurse was 3.8. There are some slight differencesregarding the type of organisation registered to operateas a care home, with all ratios between 3.0 and 4.0except in the case of non-profit enterprises (4.1),associations (4.4) and foundations (7.4).
Finland: In 2013, the recommended staff-to-residentratio of 0.5 had not been reached in 20% of shelteredhousing facilities and residential homes. By 2014, only10% of the facilities did not fulfil the recommendedratio. The averages of staff per resident are very similarin all types of care homes (slightly above 0.6 in 2014).
Level of education of care staff
These ratios include different types of workers, withdifferences regarding their working conditionsaccording to the care home ownership type. Accordingto Eurofound’s 2016 European Jobs Monitor (EJM), careworkers in residential care have a higher average levelof education (reaching ISCED level 3) than theircounterparts in home care (ISCED level 2) (Eurofound,2016). The data from the 2010 European WorkingConditions Survey (EWCS) show that the majority ofresidential care workers (in NACE code 87) feel theirpresent skills correspond well with their duties. Thepercentage of workers in residential care who reportthey have received employer-paid training is muchhigher than in other sectors (Eurofound, 2014a).
The information gathered by the Network of EuropeanCorrespondents shows similar levels of qualification inall types of care homes.
Austria: The lack of certified nurses in care institutionsmeans that employers have little choice when selectingstaff. At the same time, certain operators of care homestend to fill positions with assistant personnel instead ofcertified nurses, finding loopholes in regulations(Krajic and Schmidt, 2010, p. 37). It can be assumed thatthis practice happens in non-public institutions due tohigher levels of pay in the public care sector.
Ireland: The Health Act 2007 stipulates that providersshall ensure that the number and skill mix of staff areappropriate and that includes at all times, at least oneregistered nurse. Public nursing homes tend to setthemselves a target of nurses constitting 60% of carestaff, a proportion that is lower in private nursinghomes. Because public homes are more likely toprovide specialised services like dementia care, theyhave a higher share of nursing staff. A reliance onnon-qualified care staff in private facilities wasperceived as a concern in a study carried out in the last
Private care provision and service delivery: Accessibility, quality and efficiency

36
decade (Murphy, Shea and Cooney, 2007). More recentdata show that private nursing homes have taken inprovision of specialist dementia care while the publicsector specialises in respite care (Dementia ServicesInformation and Development Centre 2015).
Slovenia: In 2014, some 48.3% of staff in public carehomes were social care workers and 48.4% werehealthcare workers. In private care homes, 50.5% weresocial care workers and 47.2% were healthcare workers.
Czech Republic: Care assistants working in ‘quasi socialcare services’ are not required to have any training incaring or nursing and are not formally employed. Theirrole, as originally intended, was to provide care inclients’ own homes, not in residential facilities.
Germany: All types of providers employ more workers inhelper/assistant roles (about 65% of the workforce)than in skilled roles, the latter having a slightly highershare in public care homes (Rothgang, 2015). There arealso small differences regarding the qualifications levelbetween different types of providers. Overall, it wasfound that 10–13% of the workers have noqualifications, while 23–26% have qualifications notrelated to care and social services (Pflegestatistik,2013).
Norway: There are no documented differences in staffalthough there are some examples of lower levels ofqualifications among staff in private for-profit nursinghomes – for example, the extensive use of staff withpoor Norwegian-language skills.
UK: Data from the National Minimum Data Set in SocialCare (NMDS-SC) for care homes in England indicate thatdirect care staff in local authorities are better qualifiedthan those in the private or voluntary sector: 75% oflocal authority staff have at least a Level 2 qualification,as against 46% of those in the private sector and 52% ofthose in the voluntary sector.
Finland: In 2014, public care homes had a slightly higherpercentage of nurse managers and team leaders, similarpercentages of qualified nurses and a higher share ofpractical nurses than their private counterparts. Staffwithout any social/healthcare qualification constituteda higher share of staff in private 24-hour shelteredhousing (7%; in public facilities it is 3%) but lower inresidential homes (1%; in public facilities it is 2%)(National Institute for Health and Welfare, 2015).
Malta: In 2016, the private sector (excluding the Church)employed the most carers (420) while the governmentemploys more nurses (116).
Romania: The level of qualifications of staff in private(non-profit) care homes was higher than in publichomes (ENNHRI, 2017).
Wages in public and private environments
There are also differences in the wages paid by publicand private providers. The EJM provides a ranking ofwages in different jobs.11 In 2016, the wages of personalcarers working in residential care activities were rankedin the second-lowest quintile (medium to low paid). Incomparison, the wages of personal carers working inhome care were ranked in the lowest quintile.
France: Salaries are slightly higher in the private sector,but limited by the regulation of prices in contractedfacilities. The elasticity of salaries to environmentalvariables is higher in non-contracted facilities (Martin,2014).
Germany: On average, wages in private care homes arelower than in non-profit and public care homes (Auth,2014). Due to the high number of low-wage helpers inthe care sector, in 2009 the Minister of Labour extendeda collective minimum wage agreement on careassistants (Pflegehilfskräfte) concluded by the UnitedServices Union ver.di and the non-profit organisationArbeiterwohlfahrt (AWO). Covering the careassistants/helpers in all residential care homes, in 2016the agreement provided an hourly wage of €9.75 inwestern Germany and €9 in eastern Germany; thestatutory minimum wage is €8.50.
Austria: On average, wages are higher in public-lawemployment relationships and public institutions thanin the private sector. Regulations in the different privatesector collective agreements, such as SWÖ, Caritas andDiakonie are similar. Pay is lower in the care sector thanin the healthcare sector (with the exception of Vienna)for equally qualified personnel (Krajic and Schmidt,2010); this can lead to recruitment problems in the caresector.
Norway: In the event of a change of providers (frompublic to private) new employers cannot offer a lowersalary, but may change the organisation of the work andhave the possibility of rejecting the existing collectiveagreement) – which in practice may lead to somewhatlower salaries. Non-profit organisations are largelybound by collective agreements that ensure the samewages (and pension) as in the public sector. However,some have changed their type of employer organisationin order to avoid these regulations.
Ireland: Pay in public health and social care servicestends to be similar to that in private nursing homes(though sometimes lower for nurses), but other benefitssuch as pension and maternity top-up tend to be higherin the public sector.
Care homes for older Europeans: Public, for-profit and non-profit providers
11 This ranking of wages is done on the basis of combining data (mainly on the mean hourly wage) from EU Labour Force Survey and aggregated data fromthe Structure of Earnings Survey (Eurofound, 2016).

37
Sweden: The Municipal Workers’ Union (Kommunal)found that assistant nurses had lower wages whenworking for a private eldercare provider, a differenceamounting to around SEK 900 (around €95 as at8 August 2017) in 2012.
UK: The National Minimum Data Set for Social Care inEngland shows that care home staff employed in localauthorities are better paid (£8.42 per hour – €9.30) thanthose in the independent sector (£7.29 in the privatefor-profit sector and £7.74 in the voluntary sector –€8.05 and €8.55 respectively).
Quality of services
The underlying rationale for allowing competitionbetween different types of providers is that it canincrease quality and lower costs. Leichsenring, Nies andvan der Veen (2013) assert that there is contradictoryevidence regarding whether competition inquasi-markets has actually led to an improvement ofthe quality of services, given the lack of universallyacknowledged indicators and given that commissioningis often based on price rather than quality.12 They referto evidence of private care homes being more serviceoriented, while in contrast monopolies can have adetrimental effect on service quality. Evidence fromAustria seems to indicate that competition betweenpublic and private providers improves the quality of thelatter. Public and non-profit care homes constitute thegreat majority of care home provision (approximately80% of the total number of beds available). Their higherquality has a ‘radiation effect’ on for-profit care homes,which are forced to reach the same standards in orderto remain competitive (Neumayr and Meichenitsch,2011).
According to Marczak and Wistow (2016), evidenceshows that private for-profit care homes provideservices of poorer quality than public or non-profithomes. The authors make reference to the mixed resultsin Nordic countries. The review carried out by Gautun etal (2013) on Norway, Sweden and Denmark (as well asthe case studies and interviews they conducted),concluded that current research
does not provide grounds to conclude that there aredifferences in quality between private commercialproviders and municipal services. Some studies showa better quality of care in private care, while othersindicate worse quality.
(Gautun et al, 2013, p. 106)
The studies gathered by the Network of EuropeanCorrespondents also show very different outcomes.
Norway: A study of the consequences of competitivetendering in Oslo (in terms of costs and quality)measured quality with five indicators: proportion ofresidents with pressure ulcers; new or worsenedcontractures; severe weight loss; falls; and urinaryincontinence (Oslo Economics, 2013). The study foundthat nursing homes subject to competitive tender by2010 (privately run) had a somewhat higher averagequality than other nursing homes, and improved themost from 2007 to 2010.
Malta: The Government of Malta (2013) released theannual report by the Office of the Commissioner forMental Health and Older Persons on residential homesfor older people. It found that the overall quality of theaudited homes was quite high, even though the qualityof the private and church homes was a little lower thanthat provided by the government homes – with respectto health services, friendliness of staff and generalenvironment; usually, when there is a medical problem,residents are sent to public hospitals (AGE PlatformEurope consultation). In 2015, the government, whichhad also purchased beds from private homes through apublic–private partnership, cancelled this agreementwith a private home due to the low-quality standards(Times of Malta, 2015).
UK: Gage et al (2009) gathered data from inspectionreports in one English county and found that carehomes owned by corporate for-profit organisations(which had specialist registrations and higher maximumfees) were more likely to provide better care (in thatthey failed fewer national standards). On the otherhand, small for-profit homes (those registered before2000, those that provided services to local authorityfunded residents and those that had registered fornursing care) were more likely to provide poorer care.The study also found evidence that better managementwas associated with better quality of care. Nursinghomes run by non-profit organisations had the highestaverage quality. In a study of care of people withdementia in the UK, all the NHS continuing care unitsassessed needed radical changes because of the poorquality of care, while only half of the private facilitieswere assessed as needing radical improvements(Ballard et al, 2001).
Ireland: A study on the quality of life in nursing homescovering non-medical aspects of care showed that lackof choice for residents was more prevalent in publicfacilities (Murphy, Shea and Cooney, 2007).
Private care provision and service delivery: Accessibility, quality and efficiency
12 Also known as planned markets, these are public sector reforms that aim to promote competition, with providers not necessarily seeking to maximiseprofit; where choice may be exercised on behalf of the users and where their ‘spending power’ is determined by the value of a voucher or budget (Institutefor Government, 2012).

38
Belgium (Flanders): In 2012, an inspection carried outby the Flemish government gave for-profit care homeslower scores in the areas of nutrition, staffing,continuity of care and preventive health (such as handhygiene, and recording of falls and of infections). On theother hand, private for-profit care homes were morecompliant with care practices (such as medication,wound care, care plans, safety and help with bathing).While the for-profit sector had a market share of 17% ofthe market in 2012, some 43% of the total complaintsreceived were in relation to for-profit care homes.
Portugal: According to a report by the HealthRegulation Authority, there were more formalcomplaints by service users between 2009 and 2015about private establishments regarding safety and thequality of the care provided than for about public carehomes (ERS, 2015).
Italy: According to a report by the NNA in 2015, privateproviders struggle to meet quality standards. Limitedregional public expenditure that covers part of thecosts, as well as reduced household purchasing power,are lowering service quality standards. However, thedefinition of quality standards by law, introduced aspart of an accreditation process, has led to an increasein costs. The dilemma recently faced by themanagement of private residential facilities is,therefore, whether to lower the standards to remaincompetitive in economic terms, or to maintain the samequality standards with higher fees. The report describesregional cases where there is evidence of lower qualityservices being provided, and of the relaxation ofmonitoring by public authorities. In many northernregions, for instance, the search for higher profits ismanaged through the introduction of additionalservices or by selecting wealthier service users (NNA,2015).
Sweden: Private facilities seem to do better with regardto service aspects, such as participating in theformation of their care plan, reasonable durationbetween meals, or offering different food alternatives(Stolt, Blomqvist and Winblad, 2011).
Reported abuse and neglect
The information gathered by the Network of EuropeanCorrespondents in several countries comes from auditsand inspections. These and other quality monitoringtools have been put in place and/or extended to privatecare homes partly due to the alarm generated by casesof neglect and abuse of residents. For example, inIreland, a scandal reported in the national media in2005 about substandard living conditions in Leas Cross,a private nursing home, influenced the establishment ofHIQA and the independent regulation of nursing homes.
Very little evidence of reported differences betweenpublic and private provision in terms of neglect andabuse was found by the Network of EuropeanCorrespondents.
Sweden: Reported cases of neglect were equallydistributed between private and public units(proportional to the number of residents) (NationalBoard of Health and Welfare, 2012).
Estonia: There have been considerably morecomplaints of neglect or mistreatment to therepresentative bodies from the public sector than theprivate sector, yet no case has ever reached the courts.
Romania: According the President of the RomanianAssociation of the Managers of Elderly Care Institutions(ADIV), most of the cases of neglect or mistreatment ofresidents in private care homes concern materialdeprivation and theft of property. Cases of neglect orabuse were reported in the AGE Platform Europeconsultation to be higher in public residential care dueto the low staff quality.
Czech Republic: In recent years, the Ombudsman hasorganised systematic visits to homes for older people.The inspection of ‘quasi social care services’ exposed arange of problems, including: inadequate materials andtechnical equipment; poor hygiene standards; poorquality of care (staff lacking adequate skills); poor dietand risk of malnutrition; inadequate safeguards;restrictions on the movements of clients; invasion ofprivacy or insufficient privacy; and financial dependencyon the operator (operators do not leave service users aminimum 15% of the balance of income and do not limitthe maximum charge for services provided, as do socialservices providers).
Poland: Private facilities were associated with a risk ofabuse and mistreatment. Public institutions were seenas stable both financially (not vulnerable to bankruptcy)and institutionally (Jurek, 2012).
Findings from surveys on quality
Some of the information was gathered through user andrelative surveys, which have been criticised for lowresponse rates, selective bias and the fact that manyresidents suffer from dementia, or may not expressnegative views for fear of the consequences.
Norway: A 2011 user survey shows that 87% of residentsin non-profit care homes were (overall) satisfied withthe nursing home to a high degree or a very high degree(Oslo Municipality, Helseetaten 2011). In commerciallyrun homes and municipal homes, the score was 85%and 83% respectively. These differences were notpresent in 2012 when the satisfaction rate was higher(91%). In a next-of-kin-survey, the non-profit providersscored best and commercially run homes scored equalto the municipal homes (Oslo Municipality, Helseetaten2012).
Care homes for older Europeans: Public, for-profit and non-profit providers

39
Denmark: A survey in Aarhus, Denmark’s second-largestcity, shows that a greater proportion of relatives ofresidents in private (for-profit and non-profit)residential care homes (80% of 141 respondents) werein general satisfied than their public counterparts (74%of 980 respondents). The results of the survey have beencriticised by trade unions on the basis that relatives canbe biased because they selected the private residentialhomes themselves and, therefore, have a more positiveattitude towards private provision.
Sweden: A 2015 user survey showed similar results forall types of care homes regarding overall satisfaction,the possibilities to spend time outside, and trust in staff(National Board of Health and Welfare, 2015).
Netherlands: The website Zorgkaartnederland.nlgathers users’ views about care institutions. There are183 private for-profit institutions and 294 non-profitinstitutions registered on the site, with the formerreceiving higher rankings.
EfficiencyThe regulation of long-term care quasi-markets entailstransaction costs that are difficult to measure(Rodrigues, Leichsenring and Winkelmann, 2014).13
Several studies comparing the efficiency of public andprivate care homes come from Norway. One of thereasons for promoting a more diversified provision ofservices in Norway (and other countries) since the 1990sis the belief that competition has a positive impact oncost efficiency (Vabø et al, 2013). This is an issuediscussed at the political level in Norway, where a studyby Oslo Economics showed that private nursing homeshad significantly lower costs and slightly better qualitythan municipal homes, and thus were significantly morecost effective (Oslo Economics, 2013). The study hasreceived criticism for not taking into account risks (suchas breach of contract and bankruptcy) or transactioncosts, which according to another study are usuallyequivalent to between 5% and 10% of the cost ofcontracts (Asplan Analyse, 2005).
In a study of the accounts of 21 nursing homes, theselower costs in private nursing homes were attributed tothe lower staffing numbers and lower percentage ofcertified nurses, adjusting working time and loweringpension costs (Havig, cited in Gautun et al, 2013, p. 110and Vabø et al, 2013). Another study by theConfederation of Norwegian Enterprise (NHO) estimatesthat a patient in a municipally run nursing home has anaverage annual cost of NOK 945,000 (approximately
€100,000), as opposed to NOK 775,000 (€83,000) peryear for a patient in a nursing home run by its members(privately for-profit). Another study was carried out bythe Oslo Municipality, which currently has 15 privatelyrun nursing homes. The current total cost of thesehomes is NOK 1,013 million (€108 million), with the localauthorities estimating that offering these servicesthrough public provision would cost an additional NOK49.5 million per year (€5.3 million) – mainly due tobetter pension plans in the public sector. Non-profitproviders often have higher costs compared to privatefor-profit providers and often lose to private for-profitcompanies if the services are tendered out. TheCampaign for the Welfare State (For Velferdsstaten) onlyfound one competition won by a non-profit actor afterexamining 47 cases (Herning, 2012). Non-profitorganisations tend to struggle in direct competitionwith for-profit providers as they adhere to the higherpension benefits of the municipally run institutions andusually have higher costs than private for-profitcompanies. A minimum standard of pay and workingconditions is secured by the public procurementlegislation regardless of provider, but pension benefitsare exempt.
Studies on the situation in Sweden (SwedishAssociation of Local Authorities and Regions, 2011) andBelgium (Pacolet and De Coninck, 2015) point out thelosses incurred by public nursing homes, with publicnursing homes in Belgium losing €12.90 per day perresident. In comparison, non-profit nursing homesmake a profit of €4.60 per day per resident and privatefor-profit care homes a profit of €0.90 per day perresident. An important factor in the losses in the publicsector are the high staffing numbers (over the level thatis reimbursed) and the low reimbursement tariff for thetype of service users that tend to avail of public carehomes (see section on accessibility for moreinformation).
In addition to staffing numbers, other reasons behindthe losses in the public sector identified in the Swedishstudy include private facilities controversially buyinginfrastructure at a very low price and private nursinghomes being in a more advantageous position when itcomes to tax, insurance, negotiating wages or decidingwhich services they provide – and how. Where privatecare homes can focus on those areas that are moreprofitable, public care homes are bound by legislationin their care provision strategies and have a universalresponsibility (they must take difficult and/or expensivecases).
Private care provision and service delivery: Accessibility, quality and efficiency
13 Transaction costs are those costs incurred in the exchange of good and services.

40
A microeconometric analysis of cross-sectional data on997 French nursing homes and a panel of 797 nursinghomes observed in 2003 and 2007 shows that economicand cost ineffectiveness raise costs between 5% and10% in public and in non-profit nursing homes that arenot associated with hospitals, with no significantdifferences between care homes of different ownershiptype (Martin, 2014).
In addition to cost efficiency, another indicator ofefficiency is the occupancy rate.14 According to a UKstudy, in 2012 this was higher in private care homesthan in public care homes (LaingBuisson, 2014, cited inGrant Thornton, 2014).15 The lower occupancy rates incare homes run by local authorities are explained bycuts in their budgets, which lead to referrals to theprivate sector and the reduction in public provision.According to Grant Thornton, overcapacity in privatecare homes ‘should see reduction following the forecastclosure of local authority beds and continued closure ofolder “not fit for purpose” care homes’ (Grant Thornton,2014, p.4). Other factors stimulating demand andoccupancy found in the report include the ageing of thepopulation, the transfer of residents in local authoritycare homes to the for-profit sector and the credit crisisrestricting new builds. On the other hand, the increased
use and promotion of home care by the government, aswell as its lower costs, may pose a challenge for theprivate sector.
A study focusing on 40 nursing homes in Lombardy inItaly assessed their efficiency using a data envelopmentanalysis model over a three-year period (Garavaglia etal, 2011). The model employed two input variables(costs for health and nursing services and costs forresidential services) and three output variables (casemix, extra nursing hours and residential charges).Ownership was identified as one of the two factors thataffect efficiency, with private nursing homesoutperforming public nursing homes. The capacity toimplement strategies for labour cost and containmentnursing costs greatly affects efficiency scores. Publicnursing homes have reduced labour costs to a lesserextent than private nursing homes; this is partly due totrade union negotiations and organisational inertia. Thestudy concludes that the efficiency of public nursinghomes is moving towards that of their privatecounterparts, which confirms the findings of otherstudies showing that the introduction of competitionmechanisms and the creation of a quasi-market fornursing homes do increase efficiency.
Care homes for older Europeans: Public, for-profit and non-profit providers
14 The number of occupied places divided by the total number of places.
15 Occupancy rates were around 90% in the private for-profit sector, 94% in the non-profit sector , 64% in local authority nursing homes and 86% in NHSlong-stay beds.

41
Trends in service provisionPavolini and Ranci conclude that the result of reforms oflong-term care (which include the establishment of anew social care market based on competition) is aconvergence in Europe towards a mixed model ofprovision with an intermediate level of public provisionof long-term care (Pavolini and Ranci, 2008). The dataprovided by Eurofound’s Network of EuropeanCorrespondents show that in nearly all countries forwhich data are available, the share of private carehomes has increased over the last decade (Cyprus,France and the UK (Scotland) are the exceptions to this,the total number of care homes having decreased). Thisincrease has been particularly rapid in Romania,Slovakia and Slovenia and takes place in a context ofslower growth (except in the case of Malta and Spain) ornegative growth of public care homes. Consequently,this trend in growth is also reflected in the increase ofplaces in private care homes. These increases seem toindicate that the mechanisms introduced to promotecompetition have indeed increased private provision,and that the reduction in public provision has left roomfor the expansion of the private sector.
Is care home provision increasingly commercial? Giventhat data about private care homes are often notdisaggregated into for-profit and non-profit categories,it is difficult to get an overall picture of the trends.However, over the last decade the number of for-profitcare homes has increased more than non-profit carehomes in Germany. In the UK (Scotland) for-profit carehomes have decreased to a lesser extent than non-profitones. In Norway on the other hand the number offor-profit care homes have decreased and it has beenthe opposite in non-profit care homes. In France, bothtypes of private care homes have grown at the samepace. Looking at the total number of beds, this hasincreased more in for-profit care homes in Austria and innon-profit care homes in Belgium and Norway. Today,there is a high share of private for-profit provision in theUK, Germany and Ireland, and a very high level ofnon-profit provision in the Netherlands. Publicprovision is predominant in Nordic countries and incentral and eastern Europe. The projections in the 2015Ageing Report (European Commission, 2015) foresee anincrease in public expenditure in long-term care thatcould range from 2.7% to 4.1% of GDP by 2060,depending on different scenarios. The projectionsperformed in some individual Member States reflect thisneed to broaden the coverage of formal care for olderEuropeans.
Malta: Recent forecasts estimate that on average 200additional beds are needed per year up to 2025 in publicretirement homes (Government of Malta, 2015).
Luxembourg: A report by the Consultative Commissionof Human Rights (2013) states that in 2050, the numberof persons living in residential care and nursing homeswill increase to between 15,000 and 20,000 individuals(three to four times more than at present).
Belgium (Flanders): Another forecast focusing on theregion calculated that the sector will have to grow by46% over 15 years (2014–2029) in order to deal with theageing population (Pacolet, Vanormelingen and DeConinck, 2014). In 2060, the sector will have to be 2.65times bigger than in 2014.
UK: Grant Thornton (2014) forecast that the share oflocal authority/NHS beds for residential care willdecrease further (falling from 39,000 beds in 2012 to18,000 in 2020, with private for-profit sector bedsincreasing from 381,000 in 2012 to 400,000 in 2020).Budget cuts in local authority spending may contributeto the trend in increasing private sector provision. Ananalysis of the UK long-term care market also expectsfurther increases in private residential care as less carewill be delivered by the public sector due to the relativeincrease of service users who pay for their own care(Technology Strategy Board, 2013). Another studyestimated that an extra 71,000 places in care homes willbe needed in the next eight years to meet rising demand(Financial Times, 2015)
The need to increase formal supply poses challenges tothe sustainability of long-term care funding andspending, and it may lead to higher co-payments fromservice users. In Ireland, the percentage of a serviceuser’s assets that can be used in the Fair Deal schemeincreased from 5% in 2009 to 7.5% in 2013. In Italy,some experts have postulated the introduction of newsources of funding, such as private long-term careinsurance (NNA, 2011). The introduction of long-termcare insurance at the regional level was also discussedin the sixth State Reform in Belgium (Pacolet and DeWispelaere, 2016). In the UK, proposals for service userpayment in social care were a major issue in the 2017general election. The main private for-profit providers ofcare homes have warned that cuts to public funding forresidents will lead towards further closures of carehomes (Financial Times, 2017).
Attitudes of the public and of policymakers towardsprivate provision will influence to what extent itdevelops further:
£ A report from Finland by the Ministry of EconomicAffairs and Employment (2015) indicates thatprivate provision is well regarded by consumers: itcan contribute with innovations and effectivenessand spur the public sector.
3 Conclusions
42
£ In Romania, changes in waiting lists indicate anincrease in demand for private services: in 2008,there were fewer pending requests for private carehomes (1,096) than for public care homes (1,630); in2014, there were 1,472 pending requests for privateunits and 907 for public units.
£ In Sweden, the role that private actors have beenallowed to fill in providing public services has, to alarge extent, been ideologically driven. In SocialDemocratic municipalities, private actors inresidential care are still not very widespread, whilethey are quite common in conservative and liberalareas. This indicates that the future role of privateproviders will be closely connected todevelopments in Swedish party politics. Furtherproof of this is that following an intense electioncampaign in which the role of private actors in thewelfare sector was the focus of debate, the currentgovernment launched an enquiry about if and howprivate providers should be allowed to make aprofit from public funding. However, the ability tochoose service providers is widely appreciated andit appears unlikely that the government willpropose to revert to a single-provider system.
£ In Norway, the ongoing municipal reform will leadto fewer and larger municipalities, which could beconducive to privatisation as bigger municipalitieshave more capacity to commission services.However, with 55% of the population preferringmunicipal service provision if given the choice, andonly 20% preferring commercial providers (Gautunet al, 2013), it seems unlikely that large-scaleprivatisation reforms will take place.
Another factor influencing the expansion of private carehomes for older people are developments in thebroader long-term care sector. Most European countrieshave seen a bigger increase in the number of older usersof home care than in residential care over the last twodecades. This trend is likely to continue since costs ofhome care are generally lower, most Europeans preferto be cared for in their own home, and technologicaldevelopments widen the types of services that can beprovided (Eurofound, 2013c). For example, theRomanian government estimates that home care is 11times less expensive than a care home. However, it mustbe noted that home care is, in many countries, moreexpensive than residential care in the case of severeneeds and therefore there are limits to the number ofhours of home care that are covered by socialprotection systems (OECD, 2017b).
Improving the monitoring of serviceprovision
Clear common definitions are essential. In order tobetter monitor the extent of public and privateprovision, it is essential to have clear commondefinitions that allow the gathering of data about the
different types of long-term care services and providers.Definitions and data about public, for-profit and non-profit provision should take into account the legalstatus, ownership and economic activity of providers.
The source of Eurostat data on beds in residential longterm care facilities is the joint questionnaire on non-monetary health care, the data collection that is carriedout jointly by Eurostat, OECD and WHO. Unlike the dataabout beds in hospitals, this information does notinclude the type of ownership and the inclusion of thisvariable in the joint questionnaire is not foreseen in thenear future. The lack of data disaggregated byownership does not enable the European institutions tomonitor developments in private provision. The factthat many private providers receive public funding todeliver services can make it difficult to draw a cleardistinction between public and private providers.Furthermore, care homes can be managed by providersof a different ownership type. In 2013, some 88% of carehomes in Italy were managed by their owners but therewere also 12% of care homes managed by anorganisation from another sector. According to theNational Institute for Statistics, around one-fifth ofpublic care homes in Italy have managers from thenon-profit sector, and around 4% have for-profitmanagers, the rest being managed by public servants(ISTAT, 2015). Private companies can be owned by thepublic sector, as is the case in Estonia (EuropeanCommission, 2011).
In many countries the information about the privatesector does not specify whether care homes are for-profit or non-profit. This reflects the difficulties inestablishing the economic purpose of private providers.It can be the case that care homes that are registered asa non-profit institution actually seek to make a profitthrough links to a for-profit company. A for-profitcompany can, for example, own or rent the buildingfrom a non-profit provider (or vice versa), with thesubsequent finances flowing between both entities.These financial flows can be used to transfer profits tothe for-profit provider. A for-profit company can also bea member of the board of directors in a non-profitinstitution, charge for consulting services or a fee formanaging their services. In Austria and Belgium, thefederal government tries to capture the ownership andeconomic purpose rather than the legal status of theinstitutions (which is the criterion used by the Flemishgovernment). Another study included in this report(Pacolet and De Coninck, 2015), instead of using legalcriteria, uses economic criteria and other information(such as the composition of the governing boards).
An additional challenge is the different definitions andclassifications of long-term care services used in policydocuments at the European level. For example, theEuropean Commission makes reference to institutionalcare and residential settings as different terms, statingthe preference of Europeans for the latter (European
Care homes for older Europeans: Public, for-profit and non-profit providers

43
Commission, 2009a), while other EU documents usedthese terms as synonyms. The guidelines ondeinstitutionalisation define institutional care andcommunity care in a way that the classification of carehomes as institutions seems to apply only to those carehomes that do not respect the autonomy of serviceusers. Community based services or community basedcare ‘refers to “the spectrum of services that enableindividuals to live in the community”’ (European ExpertGroup on the Transition from Institutional toCommunity-based Care, 2012, p. 27).
A report on home care from WHO found that
‘home care’ is understood very differently acrosscountries and sectors. The services included varyconsiderably among countries and even ‘home’ turnsout to be an elastic term. Many studies on home carelack precision in defining the activities, goals andeven the target groups of home care … . Home carecan be conceived of as any care provided behindsomeone’s front door or, more generally, referring toservices enabling people to stay living in their homeenvironment. In some countries, ‘someone’s frontdoor’ can include a home for the elderly.
(Genet et al, 2012, p. 9)
Improving the planning and managementof services
It is important to analyse possible trade-offs betweenefficiency, quality and accessibility of services. Severalstudies highlight how private providers are facing adilemma between cutting costs by decreasing thequality of service or increasing prices and thus losingcompetitiveness. Studies that analyse differencesbetween different types of providers need to documentwhether improvements in one area are done at theexpense of others. The studies included in this reportgive some indication of the implications of an increasedrole for the private sector in relation to the accessibility,quality and efficiency of services. It seems that privatecare homes in some countries are less likely to providespecialist services such as dementia care, which is amajor issue when a high proportion of residents areaged over 80. The differences in prices of public andprivate providers show that if the share of private bedscontinues to grow, this may deepen health inequalities.It also highlights the need for financial support to begiven to providers (if they permit lower charges forservice users) and to service users themselves.
Two studies focusing on care homes in Flanders andFrance provided information about the differences inthe level of disability of patients in public and privatecare homes. In the case of Flanders, the differenceswere caused partly by the costs and reimbursements foreach type of patient. Since the level of dependency hasan impact on the staff and services needed, it isimportant to have similar information available in othercountries to understand if the needs of service usersthat are more dependent are being met in all types ofcare homes. This information can also help todetermine the staff-to-resident ratio that is more costefficient and provide the necessary incentives andrequirements to achieve it. There are indications inseveral Member States of differences regarding thelocation of care homes according to ownership, withprivate care homes being more likely to be found inaffluent urban areas. This needs to be taken intoaccount when it comes to the planning of services.
There are no unequivocal findings about differences inthe quality of services, with results differing fromcountry to country. The results are nevertheless usefulin terms of providing an indication as to what aspects ofquality may be affected by changes in the market shareof each type of provider. Some of the aspects in whichthere were differences between each type of provider asdocumented in studies are: having a single room;hygiene; the residents’ choice of food and activities;attitude of staff; nutrition; continuity of care; andpreventive health services.
Given the diversity of results from the studies, thedifferent types of evidence and the influence of thecontext and the funding mechanisms in each country,the assessment of implications of private provision atthe national level should seek to aggregate andappraise the findings of studies in a systematic way. Anexample of how this could be done is the systematicreview and meta-analysis carried out in North Americaby Comondore et al (2009). Their work showed that non-profit care homes have better quality care thanfor-profit care homes in two respects – staffing and theprevalence of pressure ulcers (bed sores); no differenceswere found in the use of physical restraint ordeficiencies recorded in governmental regulatoryassessments. The studies included here could be usedas a starting point for further research.
Conclusions


45
Allen, K., Bednárik, R., Campbell, L., Dieterich, A., DurrettHirsch, E., Emilsson, T. et al (2011), Governance andfinance of long-term care across Europe, Interlinks,Birmingham and Vienna.
Asplan Analyse (2005), Reorganisation processes: Whatdo they cost? What do they require? Project report,available at www.fagforbundet.no/file.php?id=1187.
Aquoras (2014), La facturación de las residencias paramayores cae por segundo año consecutivo, web page.
Auth, D. (2014), ‘Ökonomisierung der Pflege –Formalisierung und Prekarisierung von Pflegearbeit’,WSI-Mitteilungen, Vol. 3, pp. 412–422.
Ballard, C., Fossey, J., Chithramohan, R., Howard, R.,Burns, A., Thompson, P. et al (2001), ‘Quality of care inprivate sector and NHS facilities for people withdementia: Cross sectional survey’, BMJ, Vol. 323,No. 7310, pp. 426–427.
Bode, I. (2014), ‘Governance and performance in a‘marketized’ nonprofit sector: The case of German carehomes’, Administration & Society, Vol. 49, No. 2.
BDO (2014), Health’s ageing crisis: Time for action. Afuture strategy for Ireland’s long-term residential caresector, Dublin.
Comondore, V.R., Devereaux, P.J., Zhou, Q., Stone, S.B.,Busse, J.W. et al (2009), ‘Quality of care in for-profit andnot-for-profit nursing homes: Systematic review andmeta-analysis’, BMJ, Vol. 339, No. 2732.
Consultative Commission of Human Rights (2013),Rapport sur les droits des personnes âgées fragiles eninstitutions de long séjour, Commission Consultative desDroits de l’Homme du Grand-Duché de Luxembourg.
Council of the European Union (2012), CouncilDeclaration on the European Year for Active Ageing andSolidarity between Generations (2012): The way forward,Brussels.
Council of the European Union (2015), ‘Council decision(EU) 2015/1848 of 5 October 2015 on guidelines for theemployment policies of the Member States for 2015’,Official Journal of the European Union, L 268/28,15 October.
County Councils Network and LaingBuisson (2015),County care markets: Market sustainability & the CareAct, London.
Dementia Services Information and DevelopmentCentre (2015), An Irish national survey of dementia inlong-term residential care, Dublin.
Destatis (2013), Pflegestatistik – Pflege im Rahmen derPflegeversicherung Deutschlandergebnisse, StatistischesBundesamt, Wiesbaden.
DREES (2014), ‘L’offre en établissements d’hébergementpour personnes âgées en 2011’, Études et résultats,No. 877.
European Commission (2015), The 2015 ageing report:Economic and budgetary projections for the 28 EUMember States (2013–2060), Publications Office of theEuropean Union, Luxembourg.
ENNHRI (2017), ‘We have the same rights’: The humanrights of older persons in long-term care in Europe,European Network of National Human RightsInstitutions, Brussels.
ERS (2015), Acesso, qualidade e concorrência noscuidados continuados e paliativos, Entidade Reguladorada Saúde, Porto, Spain.
Ervik, R., Helgøy, I. and Lindén, T. (2013), ‘Strategies tomeet long-term care needs in Norway, the UK andGermany: A changing mix of institutional responsibility’,Ervik, R. and Lindén, T. (eds), The making of ageingpolicy: Theory and practice in Europe, Edward ElgarPublishing Limited, Cheltenham, p. 304.
Eurobarometer (2007), Health and long-term care in theEuropean Union, Special Eurobarometer 283, Wave 67.3,Brussels.
Eurofound (2012), Third European Quality of Life Survey –Quality of life in Europe: Impacts of the crisis,Publications Office of the European Union, Luxembourg.
Eurofound (2013a), Impacts of the crisis on access tohealthcare services in the EU, Publications Office of theEuropean Union, Luxembourg.
Eurofound (2013b), Third European Quality of Life Survey– Quality of life in Europe: Quality of society and publicservices, Publications Office of the European Union,Luxembourg.
Eurofound (2013c), More and better jobs in home-careservices, Publications Office of the European Union,Luxembourg.
Eurofound (2014a), Residential care sector: Workingconditions and job quality, Dublin.
Eurofound (2014b), Access to healthcare in times of crisis,Publications Office of the European Union, Luxembourg.
Eurofound (2015), Delivering public services: A greaterrole for the private sector? An exploratory study in fourcountries, Publications Office of the European Union,Luxembourg.
Bibliography
All Eurofound publications are available at www.eurofound.europa.eu. All links were accessed on 11 August 2017.

46
Eurofound (2016), What do Europeans do at work? Atask-based analysis: European Jobs Monitor 2016,Publications Office of the European Union, Luxembourg.
Eurofound (2017), Delivering hospital services: A greaterrole for the private sector?, Publications Office of theEuropean Union, Luxembourg.
Eurofound (forthcoming), Fourth European Quality ofLife Survey – Overview report, Publications Office of theEuropean Union, Luxembourg.
European Commission (2005), Working together,working better: A new framework for the opencoordination of social protection and inclusion policies inthe European Union, COM(2005) 706 final, Brussels.
European Commission (2008), Joint report on socialprotection and social inclusion 2008: Social inclusion,pensions, healthcare and long-term care, Brussels.
European Commission (2009a), Joint report on socialprotection and social inclusion 2009, Brussels.
European Commission (2009b), Report of the ad hocexpert group on the transition from institutional tocommunity-based care, Brussels.
European Commission (2009c), Access to healthcare andlong-term care: Equal for women and men?, Brussels.
European Commission (2011), Study on social services ofgeneral interest, Final report, Brussels.
European Commission (2012a), Towards a job-richrecovery, COM(2012) 173 final, Strasbourg.
European Commission (2012b), Long-term care for theelderly: Provisions and providers in 33 Europeancountries, Publications Office of the European Union,Luxembourg.
European Commission (2013), Long-term care in ageingsocieties: Challenges and policy options, SWD (2013)41 final, Brussels.
European Commission (2014), Identifying fiscalsustainability challenges in the areas of pension, healthcare and long-term care policies, European EconomyOccasional Papers 201, Brussels.
European Commission (2016a), Age-related fiscalsustainability challenges: A horizontal assessmentframework for pension, health care, long-term carepolicies for the 2016 European Semester, Note to theEconomic Policy Committee, ECFIN/C2, Brussels.
European Commission (2016b), Questions and answerson the revision of social security coordination rules, pressrelease, 13 December.
European Commission (2016c), Annual Growth Survey2017, COM(2016) 725 final, Brussels.
European Commission (2016d), Adequate andsustainable social protection, web page.
European Commission (2016f), Joint report on healthcare and long-term care systems and fiscal sustainability,Institutional paper 037, Publications Office of theEuropean Union, Luxembourg.
European Commission (2017), CommissionRecommendation of 26.4.2017 on the European Pillar ofSocial Rights, C(2017) 2600 final, Brussels.
European Expert Group on the Transition fromInstitutional to Community-based Care (2012), CommonEuropean guidelines on the transition from institutionalto community-based care, Brussels.
Financial Times (2015), Care home owners warn onspending cuts, 15 March.
Financial Times (2017), UK facing shortfall of 71,000 carehome places, 15 August.
Firgo, M. and Famira-Mühlberger, U. (2014), Ausbau derstationären Pflege in den Bundesländern. Quantitativeund qualitative Effekte des einsatzes öffentlicher Mittel imVergleich zur mobilen Pflege, Austrian Institute ofEconomic Research, Vienna.
Gage, H., Knibb, W., Evans, J., Williams, P., Rickman, N.,and Bryan, K. (2009), ‘Why are some care homes betterthan others? An empirical study of the factorsassociated with quality of care for older people inresidential homes in Surrey, England’, Health and SocialCare in the Community, Vol. 17, No. 6, pp. 599–609.
Garavaglia, G., Lettieri, E., Agasisti, T. and Lopez, S.(2011), ‘Efficiency and quality of care in nursing homes:An Italian case study’, Health Care Management Science,Vol. 14, No. 1, pp. 22–35.
Gautun, H., Bogen, H. and Grødem, A.S. (2013),Konsekvenser av konkurranseutsetting – Kvalitet,effektivitet og arbeidsvilkår i sykehjem oghjemmetjenester, Fafo, Oslo.
Genet, N., Boerma, W., Kroneman, M., Hutchinson, A.,and Saltman, R.B. (eds.) (2012), Home care acrossEurope: Current structure and future challenges,Observatory Studies No. 27, World Health Organization,Copenhagen.
Geraedts, M., Harrington, C., Schumacher, D. andKraska, R. (2016), ‘Trade-off between quality, price, andprofit orientation in Germany’s nursing homes, AgeingInternational, Vol. 41, pp. 89–98.
Government of Malta (2013), Annual report, Office of theCommissioner for Mental Health and Older Persons,Malta.
Government of Malta (2015), Height limitationadjustment policy for retirement homes – Publicconsultation document.
Grant Thornton (2014), Residential elderly care – UKsector review, London.
Care homes for older Europeans: Public, for-profit and non-profit providers

47
Hermann, C. and Verhoest, K. (2012), ‘The process ofliberalisation, privatisation and marketisation’, inHermann, C. and Flecker, J. (eds.), Privatization of publicservices: Impacts for employment, working conditions,and service quality in Europe, Routledge, New York andAbingdon, UK, pp. 6–32.
Hermansen, A. (2011), Organisering og eierformer innenpleie- og omsorgssektoren, Fafo, Oslo.
Herning, L. (2012), Konkurranseutsatte sykehjem i Norge,Notat 1/2012, For Velferdsstaten, Oslo.
Health and Social Care Information Centre (2015),Personal social services: Staff of social servicesdepartments at 30 September - England, 2015: Annex E –Report tables and charts, (Table 2.1a), available athttp://www.hscic.gov.uk/catalogue/PUB19985.
Health and Social Care Information Centre (2016),Personal social services: Staff of social servicesdepartments, England: As at September 2015, Health andSocial Care Information Centre.
Huber, M., Rodrigues, R., Hoffmann, F., Gasior, K. andMarin, B. (2009), Facts and figures on long-term care:Europe and North America, European Centre for SocialWelfare Policy and Research, Vienna, Austria.
ISD Scotland and NHS National Services Scotland(2015), Care Home Census: Scottish statistics on adultresidents in care homes 2006–2015, Information ServicesDivision, Scotland.
ILO (International Labour Organisation) (2012), Can theEuropean elderly afford the financial burden of healthand long-term care?, Assessing impacts and policyimplications – ESS Paper No.31.
IMSERSO (2011), Servicios sociales dirigidos a personasmayores en España, Instituto de Mayores y ServiciosSociales, Madrid.
Institute for Government (2012), The development ofquasi-markets in secondary education, London.
ISTAT (2015), I presidi residenziali socio-assistenziali esocio-sanitari, Rome.
Jarrett, T. (2016), Social care: Recent fundingannouncements and the state of the care home market(England), House of Commons Library briefing paper,number 07463, London.
Jurek, Ł. (2012), ‘Prywatyzacja stacjonarnej pomocyspołecznej jako wyzwanie wobec procesu starzenia sięludności w Polsce’ [Privatization of residential carefacilities as a challenge to the process of populationageing in Poland] , Ekonomia, Vol 1., No. 18,pp. 116–127. [English-language abstract available athttp://yadda.icm.edu.pl/yadda/element/bwmeta1.element.ekon-element-000171213197].
Knight Frank (2014), European healthcare – Care homesreport 2014, London.
KPMG (2015), Ehpad: Vers de nouveaux modèles?, Paris.
Krajic, K. and Schmidt, C. (2010), Gesundheitsförderungals Beitrag zur Entwicklung der österreichischen longterm care? Konzeptuelle Überlegungen undExpertInneneinschätzungen, Ludwig Boltzmann Institutefor Health Promotion Research, Vienna, Austria.
Laing, W. (2014), Strategic commissioning of long termcare for older people. Can we get more for less?, London.
Leichsenring, K., Nies, H. and van der Veen, R. (2013),‘The quest for quality in long-term care’, inLeichsenring, K., Nies, H. and van der Veen, R. (eds.),Long-term care in Europe: Improving policy and practice,Palgrave Macmillan, London, pp. 167–190.
Lievesley, N., Crosby, G. and Bowman, G. (2011), Thechanging role of care homes, Bupa and Centre for Policyon Ageing, London.
Martin, C. (2014), Concurrence, prix et qualité de la priseen charge en EHPAD en France: Analyses micro-économétriques, Université Paris Dauphine, Paris.
Marczak, J. and Wistow, G. (2016), ‘Commissioning longterm care services’, in Gori, C., Fernandez, J-L. andWittenberg, R. (eds.), Long term care reforms in OECDcountries, Policy Press, Bristol, UK.
Meagher, G. and Szebehely, M. (2013), ‘Long-term carein Sweden: Trends, actors and consequences’, in Ranci,C. and Pavolini, E. (eds.), Reforms in long term carepolicies in Europe: Investigating institutional change andsocial impacts, Springer, New York.
Ministry of Economic Affairs and Employment (2015),Hoito-ja hoivapalvelualan tila ja tulevaisuudennäkymät,Department of Business and Innovation, Helsinki.
Ministry of Regional Development and PublicAdministration (2011), Applicant’s guidelines, web page,available at:http://www.mdrap.ro/en/ghidul-solicitantului.
Montemurro, F. (ed.) (2012), Indagine sulle RSA in Italia,Auser Nazionale, Italy.
Murphy, K., Shea, E. and Cooney, A. (2007), ‘Quality oflife for older people living in long-stay settings inIreland’, Journal of Clinical Nursing, Vol. 16, No. 11,pp. 2167–2177.
National Audit Office of Estonia (2014), Organisation ofwelfare of the elderly in general nursing homes ofmunicipalities and cities, Tallinn.
National Board of Health and Welfare (2012), Kommunaleller enskild regi, spelar det någon roll? – En jämförelseav utförare av vård och omsorg om äldre,Socialstyrelsen, Stockholm.
National Institute for Health and Welfare (2015),Sosiaalihuollon laitos- ja asumispalvelut 2015, web page,available at https://www.thl.fi/fi/tilastot/tilastot-aiheittain/ikaantyneiden-sosiaalipalvelut/sosiaalihuollon-laitos-ja-asumispalvelut.
Bibliography

48
Neumayr, M. and Meichenitsch, K. (2011), ‘Sind Non-Profit-Organisationen die guten? Qualitätsunterschiedezwischen gemeinnützigen und gewinnorientiertenAlten- und Pflegeheimen‘, Kurswechsel, Vol. 4,pp. 75–85.
NNA (2015), L’assistenza agli anziani non autosufficientiin Italia, Maggioli Editore, Rome.
OECD (2005), Long-term care for older people, OECDPublishing, Paris.
OECD (2017a), OECD Health Statistics 2017: Beds inresidential long-term care facilities, Definitions, sourcesand methods, OECD Publishing, Paris.
OECD (2017b), Measuring effective social protection inlong term care – OECD Health Working Papers, No. 93,Paris.
OECD, Eurostat and WHO (2011), A system of healthaccounts, OECD Publishing, Paris.
Oslo Economics (2013), Sykehjemsdrift i Oslo – effektenav konkurranse, Report for NHO Service, OsloEconomics, Oslo.
Oslo Municipality, Helseetaten (2011), Brukertilfredshetblant beboere på sykehjem i Oslo kommune 2011, OsloHealth Administration, Oslo.
Oslo Municipality, Helseetaten (2012),Beboerundersøkelse på sykehjem 2012, Oslo HealthAdministration, Oslo.
Pacolet, J., De Troyer, F., Boeykens, S., De Coninck, A.,Vastmans, F. and Buyst, E. (2012), Een vergelijkendestudie naar bouwkost en dagprijs in door VIPAgesubsidieerde en niet- gesubsidieerde woonzorgcentra,De Vlaamse Gemeenschap, Departement Welzijn,Volksgezondheid en Gezin.
Pacolet, J., Vanormelingen, J. and De Coninck, A. (2014),‘Tempus Fugit. Een aggiornamento vantoekomstverkenningen voor de zorgberoepen in deVlaamse Gemeenschap’, SWVG-Rapport, No.17, p. 209.
Pacolet, J. and De Coninck, A. (2015), ‘Financiering vande residentiële ouderenzorg: Het perspectief van devoorzieningen, SWVG-Rapport, No. 31.
Pacolet, J. and De Wispelaere, F. (2016), ‘De staat van deverzorgingsstaat in België omstreeks 2015’, Belgischtijdschrift voor Sociale Zekerheid, 4e Trimester 2015.
Pavolini, E. and Ranci, C. (2008), ‘Restructuring thewelfare state: Reforms in long-term care in westernEuropean countries’, Journal of European Social Policy,Vol. 18, No. 3, pp. 246–259.
Parker, C., Barnes, S., McKee, K., Morgan, K., Torrington,J. and Tregenza, P. (2004), ‘Quality of life and buildingdesign in residential and nursing homes for olderpeople’, Ageing and Society, Vol. 24, No. 6, pp. 941–962.
Rodrigues, R., Huber, M. and Lamura, G. (eds.) (2012),Facts and figures on healthy ageing and long-term care:Europe and North America, European Centre for SocialWelfare Policy and Research, Vienna, Austria.
Rodrigues, R., Leichsenring, K and Winkelmann, J.(2014), The ‘make or buy’ decision in long-term care:Lessons for policy, European Centre for Social WelfarePolicy and Research, Vienna, Austria.
Rothgang, H. (2015), ‘Sicherstellung der pflegerischenVersorgung – ohne private Pflegeeinrichtungenmöglich?’, conference presentation, 10th anniversary ofInteressen-Gemeinschaft der privatenAltenpflegeinrichtungen [the interest organization ofprivate providers of care homes for the elderly], 29October, Kiel, Germany.
Scottish Social Services Council (2015), Scottish SocialService Sector: Report on 2014 workforce data, SSSC,Dundee, UK.
Skills for Care (2015), The size and structure of the adultsocial care sector and workforce in England, 2015, Leeds,UK.
Social Protection Committee (2010), A voluntaryEuropean quality framework for social services,SPC/2010/10/8 final, Brussels.
Social Protection Committee (2011), Opinion of thesocial protection committee on: Reinvigorating the socialOMC in the context of the Europe 2020 strategy, 10405/11,Brussels.
Social Protection Committee (2012), Preparation of the2012 National Social Reports (NSR), SPC/2012.2/4,Brussels.
Social Protection Committee and EuropeanCommission (2014), Adequate social protection for long-term care needs in an ageing society, Publications Officeof the European Union, Luxembourg.
Staflinger, H. (2016), Der oö.Mindestpflegepersonalschlüssel für Alten- undPflegeheime auf dem Prüfstand: Grundlagen –Herausforderungen – Entwicklungsbedarf, Chamber ofLabour, Linz, Austria.
Stolt, R., Blomqvist, P. and Winblad, U. (2011),‘Privatization of social services: Quality differences inSwedish elderly care’, Social Science & Medicine, Vol. 72,No. 4, pp. 560–570.
Szebehely, M. (2014), ‘Vinstsyfte i äldreomsorgen’, inBjörkman, J., Fjæstad, B. and Alexius, S. (eds.), Alladessa marknader: Riksbankens Jubileumsfonds Årsbok2014/2015, Makadam Förlag, Gothenburg, Sweden,pp. 129–141.
Technology Strategy Board (2013), Analysis of UK longterm care market, Swindon, UK.
Care homes for older Europeans: Public, for-profit and non-profit providers

49
Theobald, H. (2012), ‘Combining welfare mix and NewPublic Management: The case of long-term careinsurance in Germany’, International Journal of SocialWelfare, Vol. 21, No. 1, pp. 561–574.
Swedish Association of Local Authorities and Regions(2011), Från fattigvård till valfrihet: Utvecklingen av vårdoch omsorg om äldre, Swedish Association of LocalAuthorities and Regions, Stockholm.
Times of Malta (2015), Home contract ended over its‘poor service’, 25 February.
WeDO (2012), European quality framework for long-termcare services – Principles and guidelines for the wellbeingand dignity of older people in need of care andassistance, AGE Platform Europe, Brussels.
Weiss, C., Süderkamp, S. and Rothgang, H. (2014),‘Strukturelle Einflüsse auf die Pflegenoten: eine Analysenach Anbietergröße, Trägerschaft und regionaler Lage’,Vierteljahreshefte für Wirtschaftsforschung, Vol. 83, No. 4,pp. 87–105.
WHO (2004), A glossary of terms for community healthcare and services for older persons, World HealthOrganization, Geneva, Switzerland.
Vabø, M., Christensen, K., Jacobsen, F. and Trætteberg,H.D. (2013), ‘Marketisation in Norwegian eldercare:preconditions, trends and resistance’, in Meagher, G.and Szebehely, M. (eds.), Marketisation in Nordiceldercare: A research report on legislation, oversight,extent and consequences, Stockholm Studies in SocialWork 30, Stockholm University.
Wittenberg, R., Sandhu, B. and Knapp, M. (2002),‘Funding long term care: the public and private options’,in Mossialos, E., Dixon, A., Figueras, J. and Kutzin, J.(eds.), Funding health care: Options for Europe, OpenUniversity Press, Buckingham, UK, pp. 226–250.
World Bank (2010), Long-term care policies for olderpopulations in new EU Member States and Croatia:Challenges and opportunities, Europe and Central AsiaRegion Human Development Department, Washington,USA.
Zorginspectie (2012), Inspectieverslagenwoonzorgcentra, Departement Welzijn,Volksgezondheid en Gezin.
Bibliography

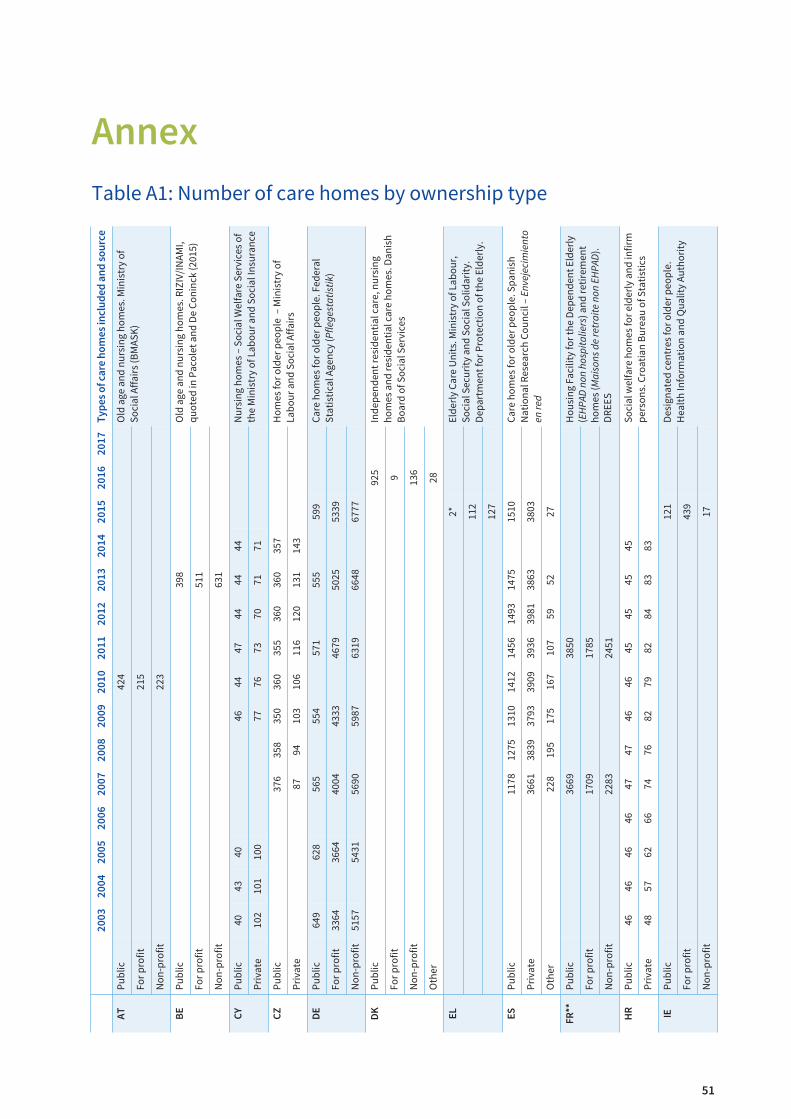
51
Annex
Table A1: Number of care homes by ownership type
20
03
20
04
20
05
20
06
20
07
20
08
20
09
20
10
20
11
20
12
20
13
20
14
20
15
20
16
20
17
Ty
pe
s o
f ca
re h
om
es
incl
ud
ed
an
d s
ou
rce
AT
Pub
lic42
4O
ld a
ge a
nd
nur
sin
g ho
mes
. Min
istr
y of
Soci
al A
ffai
rs (B
MAS
K)
For
pro
fit21
5
Non
-pro
fit22
3
BE
Pub
lic39
8O
ld a
ge a
nd
nur
sin
g ho
mes
. RIZ
IV/I
NAM
I,q
uote
d in
Pac
olet
an
d D
e C
onin
ck (2
015)
For
pro
fit51
1
Non
-pro
fit63
1
CY
Pub
lic40
4340
4644
4744
4444
Nur
sin
g ho
mes
– S
ocia
l Wel
fare
Ser
vice
s of
the
Min
istr
y of
Lab
our
and
Soc
ial I
nsu
ran
ceP
riva
te10
210
110
077
7673
7071
71
CZ
Pub
lic37
635
835
036
035
536
036
035
7H
omes
for
old
er p
eop
le –
Min
istr
y of
Lab
our
and
Soc
ial A
ffai
rsP
riva
te87
9410
310
611
612
013
114
3
DE
Pub
lic64
962
856
555
457
155
559
9C
are
hom
es fo
r ol
der
peo
ple
. Fed
eral
Stat
isti
cal A
gen
cy (P
flege
stat
istik
)Fo
r p
rofit
3364
3664
4004
4333
4679
5025
5339
Non
-pro
fit51
5754
3156
9059
8763
1966
4867
77
DK
Pub
lic92
5In
dep
end
ent r
esid
enti
al c
are,
nur
sin
gho
mes
an
d r
esid
enti
al c
are
hom
es. D
anis
hB
oard
of S
ocia
l Ser
vice
sFo
r p
rofit
9
Non
-pro
fit13
6
Oth
er28
EL
2*El
der
ly C
are
Un
its.
Min
istr
y of
Lab
our,
Soci
al S
ecur
ity
and
Soc
ial S
olid
arit
y.D
epar
tmen
t for
Pro
tect
ion
of t
he E
lder
ly.
112
127
ES
Pub
lic11
7812
7513
1014
1214
5614
9314
7515
10C
are
hom
es fo
r ol
der
peo
ple
. Sp
anis
hN
atio
nal
Res
earc
h C
oun
cil –
Env
ejec
imie
nto
en re
dP
riva
te36
6138
3937
9339
0939
3639
8138
6338
03
Oth
er22
819
517
516
710
759
5227
FR
**P
ublic
3669
3850
Hou
sin
g Fa
cilit
y fo
r th
e D
epen
den
t Eld
erly
(EHP
AD n
on h
ospi
talie
rs) a
nd
ret
irem
ent
hom
es (M
aiso
ns d
e re
trai
te n
on E
HPAD
).D
REE
S
For
pro
fit17
0917
85
Non
-pro
fit22
8324
51
HR
Pub
lic46
4646
4647
4746
4645
4545
45So
cial
wel
fare
hom
es fo
r el
der
ly a
nd
infir
mp
erso
ns.
Cro
atia
n B
urea
u of
Sta
tist
ics
Pri
vate
4857
6266
7476
8279
8284
8383
IEP
ublic
121
Des
ign
ated
cen
tres
for
old
er p
eop
le.
Hea
lth
Info
rmat
ion
an
d Q
ualit
y Au
thor
ity
For
pro
fit43
9
Non
-pro
fit17

52
Care homes for older Europeans: Public, for-profit and non-profit providers
20
03
20
04
20
05
20
06
20
07
20
08
20
09
20
10
20
11
20
12
20
13
20
14
20
15
20
16
20
17
Ty
pe
s o
f ca
re h
om
es
incl
ud
ed
an
d s
ou
rce
LT
Pub
lic61
6263
6363
6462
6058
5752
5352
Res
iden
tial
car
e fo
r th
e el
der
ly. N
atio
nal
Stat
isti
cal O
ffic
eP
riva
te30
3032
3535
3536
4241
4548
5356
Oth
er3
32
23
55
32
22
22
LV
Pub
lic86
NAC
E co
des
87.
1 an
d 8
7.3.
Rev
ised
dat
afr
om th
e C
entr
al S
tati
stic
al B
urea
uP
riva
te7
MT
Pub
lic12
1514
15H
omes
for
old
er p
erso
ns.
Dir
ecto
rate
for
Hea
lth
Info
rmat
ion
an
d R
esea
rch
P
riva
te29
3031
30
NO
Pub
lic91
591
291
291
790
989
589
2N
ursi
ng
hom
es a
nd
res
iden
tial
car
e.St
atis
tics
Nor
way
Fo
r p
rofit
4647
4643
4241
41
Non
-pro
fit33
3431
3337
4140
Oth
er3
33
42
21
PL
***
Pub
lic63
861
760
961
460
760
860
060
158
059
459
359
1So
cial
ass
ista
nce
hou
ses
(DP
S).
Min
istr
y of
Fam
ily, L
abou
r an
d S
ocia
l Pol
icy
Pri
vate
206
213
203
245
206
242
216
208
202
208
213
213
Non
-pro
fit45
5150
6161
For
pro
fit11
314
516
923
029
7
RO
Pub
lic81
9888
9510
810
310
5N
ursi
ng
hom
es, r
esid
enti
al c
are.
Min
istr
y of
Lab
our,
Nat
ion
al S
tati
stic
s In
stit
ute
Pri
vate
4251
6380
9512
614
1
SI
Pub
lic74
6059
5959
59As
soci
atio
n o
f Soc
ial I
nst
itut
ion
s of
Slov
enia
Pri
vate
1434
3939
3939
SK
Pub
lic15
816
018
416
215
816
417
214
316
921
9H
omes
for s
enio
rs (z
aria
deni
a pr
e se
nior
ov).
Cen
tral
Reg
iste
r of S
ocia
l Ser
vice
s P
rovi
ders
and
Nat
iona
l Sta
tist
ical
Off
ice
Pri
vate
5054
3762
6472
7112
813
126
7
UK
(Sco
t-la
nd
)
Pub
ic18
518
618
118
117
717
517
717
416
416
316
115
415
0C
are
hom
es fo
r ol
der
peo
ple
. Sco
ttis
h C
are
Hom
es C
ensu
s an
d C
are
Insp
ecto
rate
Reg
istr
atio
n L
ist
For
pro
fit65
464
864
263
363
162
663
363
763
563
263
363
162
5
Non
-pro
fit15
515
215
214
314
114
313
813
212
112
111
711
711
7
Note: * The two public centres in Chania and Corfu are legal entities of public law created by the two local authorities. These centres are notreflected in official statistics, but they were identified in a telephone interview with the Department for Protection of the Elderly, Ministry ofLabour.**Data on public housing facilities for the dependent elderly include EHPAD hospitals in order to compare with data from 2007*** Data on for-profit (economic activity) and non-profit (statutory activity) provision correspond to establishments ensuring 24-hour care(placówki zapewniające całodobową opiekę). Since 2011 in the legislation and official statistics on chronic medical care homes and nursinghomes no distinction is made between public and private establishments.

53
Annex
Table A2: Number of places in care homes by ownership type
Public For-profit Non-profit Private Other Date Source
AT 35,525 14,352 24,993 2010 Ministry of Social Affairs (BMASK)
BE 42,298 46,926 54,537 2016 RIZIV/INAMI, quoted in Pacolet and DeConinck (2015)
CZ 26,344 10,298 2014 Ministry of Labour and Social Affairs
EL 5,823 6,192 2015 Ministry of Labour, Social Security and SocialSolidarity
ES 97,145 260,566 2014 Spanish National Research Council –Envejecimiento en red
FR 234,760 121,860 191,780 2010 DREES (2014)
IE 6,656 22,342 2014 Nursing Homes Ireland Annual Private NursingHome Survey
LT 2,755 2,060 470 2015 National Statistical Office
MT 2,699 2,538 2016 Directorate for Health Information andResearch
NO 35,921 2,677 2,104 6 2011 Statistics Norway – The unit used in thenational statistic is not beds but plasser,meaning places or slots, i.e. patient capacity.
PL 64,918 9,330 2,093 14,092 2014 Ministry of Family, Labour and Social Policy
RO 7,019 5,601 2015 Ministry of Labour, National Statistics Institute(INSSE)
SI 15,375 4,849 2016 Association of Social Institutions of Slovenia
SK 9,022 4,015 2013 Central Register of Social Services Providers
UK (Scotland) 4,474 30,017 3,673 2015 Number of registered places for older people.Scottish Care Homes Census and CareInspectorate Registration List

54
Care homes for older Europeans: Public, for-profit and non-profit providers
Table A3: Number of service users by ownership type (most recent year)
Public For profit Non-profit Private Other Year Data include
EL 5,115 5,426 2015
DE 44,404 285,781 461,353 2013
CY 510 791 2014
LT 2,593 1,952 467 2015
FR 292,609 108,087 153,618 2011 Residents over 65 in EHPADs
RO 5,892 4,657 2014
FI 29,518 18,771 2014 Residents in 24-hour sheltered housing(tehostettu palveluasuminen) and residentialhomes (vanhainkodit)
HU 43,497 26,938 2013 Residents in long-term residential socialinstitutions (tartós elhelyezést nyújtóintézmények)
HR 13,725 5,066 2014 Residents in social welfare homes for olderand infirm persons
PL 63,976 6,754 1,760 13,765 2014
SE 70,800 17,103 2015 Residents in special/sheltered housing(särskilt boende)
UK (Scotland) 3,373 24,920 3,254 2015 Long-stay residents (older people)

EF1723EN

TJ-0
1-1
7-9
50-E
N-N
ISBN: 978-92-897-1607-9
doi:10.2806/737365
With people living longer, the need for affordable
care of high quality to support Europe’s population
increases. Over the last ten years there has been an
expansion of the private sector in terms of the
number of care homes and the places they provide.
This increase takes place in a context of decrease
or very slow growth in the services provided in
public care homes. This report examines services in
the public and private sectors, how they differ in
the services they provide in terms of the quality,
accessibility and efficiency of services. As private
provision increases, costs to users are likely to
become a more significant barrier issue unless
there is an increase in public benefits to subsidise
use. There are also some differences in the location
of different types of care homes, with private care
homes more likely to be found in affluent urban
areas. Differences in the types of residents are
influenced by the profitability of the services they
require.
The European Foundation for the Improvement of
Living and Working Conditions (Eurofound) is a
tripartite European Union Agency, whose role is
to provide knowledge in the area of social,
employment and work-related policies.
Eurofound was established in 1975 by Council
Regulation (EEC) No. 1365/75, to contribute to the
planning and design of better living and working
conditions in Europe.


