299
www.omega.com e-mail: [email protected] User’s Guide RD-MV100 SERIES Recorder OMEGA CARE SM Extended Warranty Program Shop online at

www.omega.com e-mail: [email protected]
User’s Guide
RD-MV100 SERIESRecorder
OMEGACARE
SM
Extended Warranty Program
Shop online at
Servicing North America:USA: One Omega Drive, P.O. Box 4047ISO 9001 Certified Stamford CT 06907-0047
TEL: (203) 359-1660 FAX: (203) 359-7700e-mail: [email protected]
Canada: 976 BergarLaval (Quebec) H7L 5A1TEL: (514) 856-6928 FAX: (514) 856-6886e-mail: [email protected]
For immediate technical or application assistance:USA and Canada: Sales Service: 1-800-826-6342 / 1-800-TC-OMEGA®
Customer Service: 1-800-622-2378 / 1-800-622-BEST®
Engineering Service: 1-800-872-9436 / 1-800-USA-WHEN®
TELEX: 996404 EASYLINK: 62968934 CABLE: OMEGA
Mexico: En Espanol: (001) 203-359-7803 e-mail: [email protected]: (001) 203-359-7807 [email protected]
Servicing Europe:Benelux: Postbus 8034, 1180 LA Amstelveen, The Netherlands
TEL: +31 (0)20 3472121 FAX: +31 (0)20 6434643Toll Free in Benelux: 0800 0993344e-mail: [email protected]
Czech Republic: Rudé armády 1868, 733 01 Karviná 8TEL: +420 (0)69 6311899 FAX: +420 (0)69 6311114Toll Free: 0800-1-66342 e-mail: [email protected]
France: 9, rue Denis Papin, 78190 TrappesTEL: +33 (0)130 621 400 FAX: +33 (0)130 699 120Toll Free in France: 0800-4-06342e-mail: [email protected]
Germany/Austria: Daimlerstrasse 26, D-75392 Deckenpfronn, GermanyTEL: +49 (0)7056 9398-0 FAX: +49 (0)7056 9398-29Toll Free in Germany: 0800 639 7678e-mail: [email protected]
United Kingdom: One Omega Drive, River Bend Technology CentreISO 9002 Certified Northbank, Irlam, Manchester
M44 5EX United Kingdom TEL: +44 (0)161 777 6611 FAX: +44 (0)161 777 6622Toll Free in United Kingdom: 0800-488-488e-mail: [email protected]
OMEGAnet® Online Service Internet e-mailwww.omega.com [email protected]
It is the policy of OMEGA to comply with all worldwide safety and EMC/EMI regulations thatapply. OMEGA is constantly pursuing certification of its products to the European New ApproachDirectives. OMEGA will add the CE mark to every appropriate device upon certification.The information contained in this document is believed to be correct, but OMEGA Engineering, Inc. accepts no liability for any errors it contains, and reserves the right to alter specifications without notice.WARNING: These products are not designed for use in, and should not be used for, patient-connected applications.
OMEGA
Basic Setting modeMenu
display
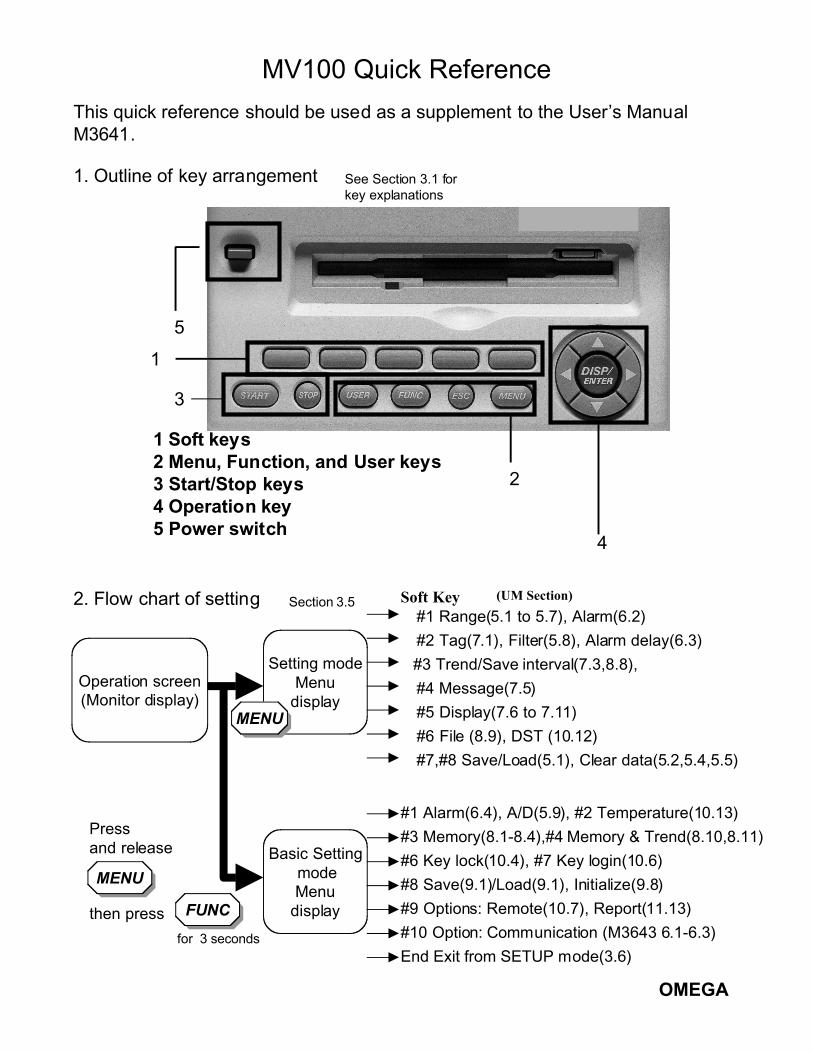
MV100 Quick Reference
This quick reference should be used as a supplement to the User’s ManualM3641.
1. Outline of key arrangement
1
2
3
4
5
1 Soft keys2 Menu, Function, and User keys3 Start/Stop keys4 Operation key5 Power switch
See Section 3.1 forkey explanations
Setting modeMenu
displayOperation screen(Monitor display)
MENU
FUNC
2. Flow chart of setting
for 3 seconds
then press
#1 Range(5.1 to 5.7), Alarm(6.2)
#2 Tag(7.1), Filter(5.8), Alarm delay(6.3)
#3 Trend/Save interval(7.3,8.8),
#4 Message(7.5)
#5 Display(7.6 to 7.11)
#6 File (8.9), DST (10.12)
#7,#8 Save/Load(5.1), Clear data(5.2,5.4,5.5)
#1 Alarm(6.4), A/D(5.9), #2 Temperature(10.13)
#3 Memory(8.1-8.4),#4 Memory & Trend(8.10,8.11)
#6 Key lock(10.4), #7 Key login(10.6)
#8 Save(9.1)/Load(9.1), Initialize(9.8)
#9 Options: Remote(10.7), Report(11.13)
#10 Option: Communication (M3643 6.1-6.3)
End Exit from SETUP mode(3.6)
Section 3.5 Soft Key (UM Section)
MENU
Press and release
OMEGA
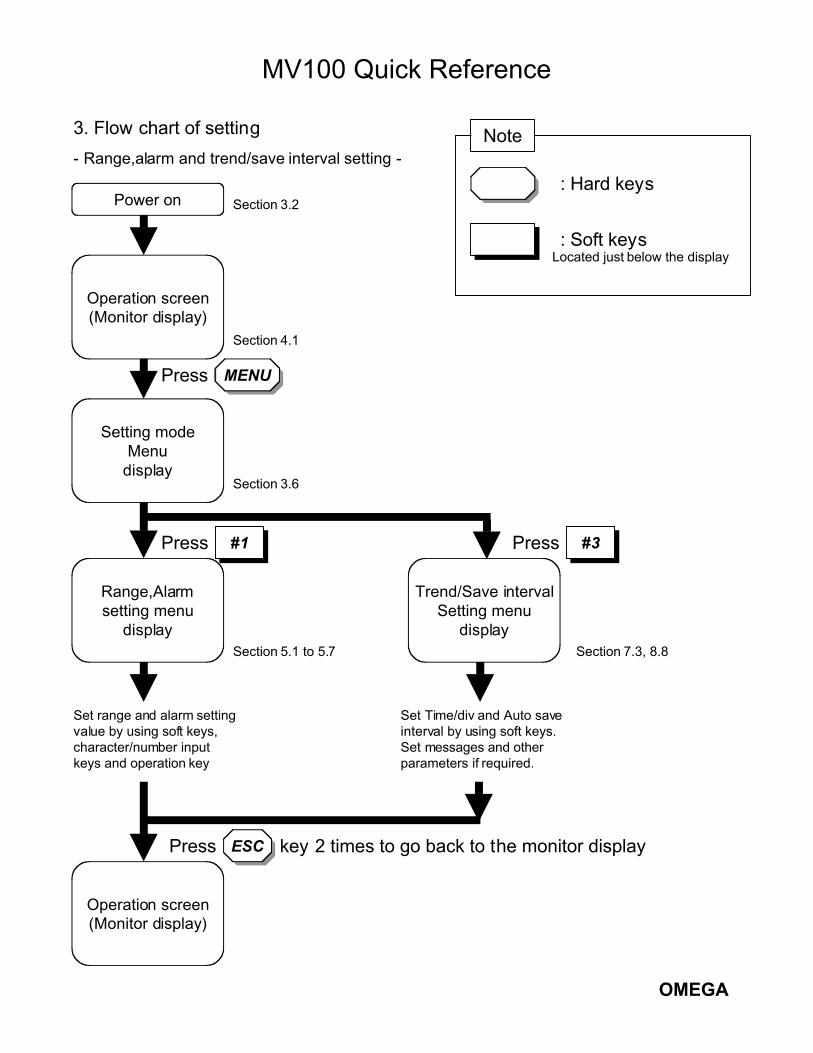
MV100 Quick Reference
3. Flow chart of setting
- Range,alarm and trend/save interval setting -
Power on
Setting modeMenu
display
Press Menu
Press
Range,Alarmsetting menu
display
Set range and alarm settingvalue by using soft keys,character/number inputkeys and operation key
Press ESC key 2 times to go back to the monitor display
Operation screen(Monitor display)
Operation screen(Monitor display)
Press
Trend/Save intervalSetting menu
display
Set Time/div and Auto saveinterval by using soft keys.Set messages and otherparameters if required.
Section 3.2
Section 4.1
Section 3.6
Section 5.1 to 5.7 Section 7.3, 8.8
MENU
ESC
#1 #3
Note
: Hard keys
: Soft keysLocated just below the display

OMEGA
MV100 Quick Reference
4. Flow chart of basic setting
- Memory and communication related function setting -
Power on
Basic Setting modemenu
Press , then press key for 3 seconds
Press
Memory relatedBasic Setting
menu
Set save mode, data type,sample rate and pre-triggerif required by using softkeys and operation key
Press key and select on function menu to go backto the monitor display
Monitor display
Monitor display
Press
Option:CommunicationBasic Setting
menu
Set network related parameter suchas IP address and subnet mask byusing soft keys, operation key andcharacter/number input keys.
Section , 3.2
Section 4.1
Section 3.6
Section 8.11 Manual M3643
MENU FUNC
ESC
#2 #6
End

OMEGA
MV100 Quick Reference
5. Start/stop of data acquisition into internal memory
1)Press to start data storage into the internal memory.
Section 8.5, 8.6
START
2)Press to stop data storage.STOP
6. Switching operation screens
1)Use DISP/ENTER key
Section 4.1 to 4.7 DISP/ENTER
7. Data saving to external medium
7-1. While data acquisition is running1) When AUTO mode is selected in save mode on memory related SETUP menu*
*:See previous page #2
Section 8.4, 8.7
MEDIA
Periodically or when you press key, data saved into external mediumSTOP
2) When MANUAL mode is selected in save mode on memory related SETUPmenu* *:See previous page #2
Press key
Trend Digital Bar
OverviewInfor-
mationTrendHistory
4Panel
7-2. While data acquisition is stopped
Setting modeMenu
display
Press Menu
Press
Operation screen(Monitor display)
MENU
#7
Setting modeMenu
display
Press #3
Every data stored in internalmemory is copied to externalmedium.
Section 8.4, 8.7
Section 9.2

i
Disk No. RE25
1st Edition : March 2000 (YK)
All Rights Reserved, Copyright © OMEGA
ForewordThank you for purchasing the OMEGA MobileCorder RD-MV100.This User’s Manual contains useful information about the functions, installation, wiring,
operating procedures, and troubleshooting of the RD-MV100. To ensure correct use,
please read these manuals thoroughly before operation.
Keep this manual in a safe place for quick reference in the event a question arises.
In addition, a quick reference is provided on the previous page. This reference brieflyexplains operations that are used frequently. Separate this reference from the manual
for use.
The following three manuals, including this one, are provided as manuals for the RD-
MV100.
Manual Name Manual No. Description
RD-MV100 User’s Manual M3641 This manual. Explains all functions andprocedures of the RD-MV100 excluding thecommunication functions.
RD-MV100 Communication M3643 Explains the communication functions ofInterface User’s Manual the Ethernet/serial interface.
RD-MV100 M3645 Describes the functions and operatingDAQstandard Software procedures of RD-MV Software that
comes with the package.
Notes• The contents of this manual are subject to change without prior notice as a result of
continuing improvements to the instrument’s performance and functions.
• Every effort has been made in the preparation of this manual to ensure the accuracyof its contents. However, should you have any questions or find any errors, please
contact Omega.
• Copying or reproducing all or any part of the contents of this manual without Omega’s
permission is strictly prohibited.
Trademarks• Windows is registered trademarks of Microsoft Corporation.
• Ethernet is a registered trademark of Xerox Corporation.
• Zip is a trademark or registered trademark of Iomega Corporation.
• Company and product names that are used in this manual are trademarks orregistered trademarks of their respective holders.
RevisionsFirst edition : March 2000

ii
Safety Precautions
This instrument conforms to IEC safety class I (provided with terminal for protective
grounding), Installation Category II, and EN61326-1 (EMC standard), class A (use in a
commercial, industrial, or business environment).
The following general safety precautions must be observed during all phases ofoperation. If this recorder is used in a manner not specified in this manual, the
protecition provided by this recorder may be impaired. Omega assumes no liability for
the customer’s failure to comply with these requirements.
The following symbols are used on this instrument.
“Handle with care.” To avoid injury, death of personnel or damage to
the instrument, the operator must refer to the explanation in the User’s
Manual or Service Manual.
High temperature : To avoid injury caused by hot surface, do not touch
the heat sink.
Functional ground terminal. Do not use this terminal as a protectiveground terminal.
Protective ground terminal.
AC
ON (power)
OFF (power)

iii
Make sure to comply with the following safety precautions. Failure to comply mayresult in injury or death (electric shock hazard).
WARNINGPower SupplyEnsure that the source voltage matches the voltage of the power supply before
turning ON the power.Power Cord and Plug (Desktop Type)To prevent an electric shock or fire, be sure to use the power cord supplied by
Omega. The main power plug must be plugged into an outlet with a protective
grounding terminal. Do not invalidate protection by using an extension cord
without protective grounding.Protective GroundingMake sure to connect the protective grounding to prevent electric shock before
turning ON the power.
Necessity of Protective GroundingNever cut off the internal or external protective grounding wire or disconnect thewiring of the protective grounding terminal. Doing so poses a potential shock
hazard.
Defect of Protective GroundingDo not operate the instrument when the protective grounding or the fuse might
be defective. Also, make sure to check them before operation.Fuse (for 12 VDC Power Model)To prevent fire, only use a fuse that has a rating (voltage, current, and type) that
is specified by the instrument. When replacing a fuse, turn OFF the power
switch and unplug the power cord. Never short the fuse holder.
Do Not Operate in Explosive AtmosphereDo not operate the instrument in the presence of flammable liquids or vapors.
Operation of any electrical instrument in such an environment constitutes a
safety hazard.
Do Not Remove CoversSome areas inside the instrument have high voltages. Do not remove the coverif the power supply is connected. The cover should be removed by Omega’s
qualified personnel only.
External ConnectionConnect the protective grounding before connecting to the item undermeasurement or control unit.
Damage to the Protective HousingUsing the instrument in a manner not specified in this manual can damage the
instrument’s protective housing.
Safety Precautions

iv
Checking the Contents of the Package
Unpack the box and check the contents before operating the instrument. If some of the
contents are not correct or missing or if there is physical damage, contact the dealerfrom which you purchased them.
RD-MV100 Main UnitThere is a name plate on the back side of the key panel cover. Open the cover and
check that the model name and suffix code given on the name plate match those on theorder.
SUFFIX
MODEL
NOMade in Japan
SUFFIX
MODEL
NO
MODELModel Code Suffix Code
–1–2–3
DescriptionRD-MV100 (2 ch)RD-MV100 (4 ch)RD-MV100 (6 ch)RD-MV100 (12 ch)Floppy diskZip diskATA flash memory card (PCMCIA 20MB)English, deg.F/DST (English standard software included)100 to 120 VAC/200 to 240 VAC12 VDC*1
3-Pin power inlet with UL, CSA cable3-Pin power inlet with VDE cable3-Pin power inlet with SAA cable3-Pin power inlet with BS cableAlarm output relay (2 relays)/remote control*2
Alarm output relay (4 relays)/remote control*2
Alarm output relay (6 relays)*2
RS-232 interfaceRS-422-A/485 interfaceFAIL/memory end output relay*3
Screw terminalComputation function (report function included)Remote control
RD-MV102RD-MV104RD-MV106RD-MV112External storage medium
Language
Power supply
Power inlet, power cord
Options
Optional Code
/A1/A2/A3/C2/C3/F1/H3/M1/R1
–2–1–2
DFRS
*1 With AC adapter*2 /A1, /A2, and /A3 cannot be specified simultaneously*3 If /F1 is specified, /A3 cannot be specified.
NO. (Instrument No.)When contacting the dealer from which you purchased the instrument, please quote the
instrument No.
v
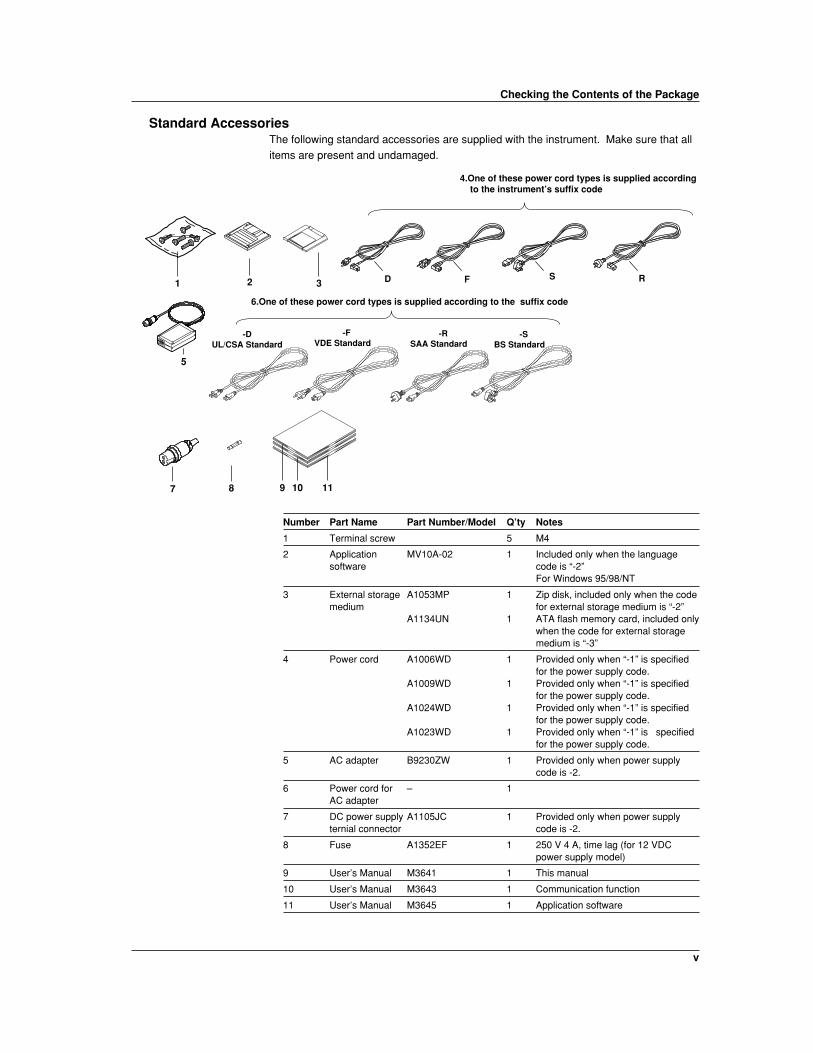
Standard AccessoriesThe following standard accessories are supplied with the instrument. Make sure that all
items are present and undamaged.
1 2 3
5
9 10 117 8
4.One of these power cord types is supplied according to the instrument’s suffix code
FD S R
6.One of these power cord types is supplied according to the suffix code
-DUL/CSA Standard
-FVDE Standard
-SBS Standard
-RSAA Standard
Number Part Name Part Number/Model Q’ty Notes
1 Terminal screw 5 M4
2 Application MV10A-02 1 Included only when the languagesoftware code is “-2”
For Windows 95/98/NT
3 External storage A1053MP 1 Zip disk, included only when the codemedium for external storage medium is “-2”
A1134UN 1 ATA flash memory card, included onlywhen the code for external storagemedium is “-3”
4 Power cord A1006WD 1 Provided only when “-1” is specifiedfor the power supply code.
A1009WD 1 Provided only when “-1” is specifiedfor the power supply code.
A1024WD 1 Provided only when “-1” is specifiedfor the power supply code.
A1023WD 1 Provided only when “-1” is specifiedfor the power supply code.
5 AC adapter B9230ZW 1 Provided only when power supplycode is -2.
6 Power cord for – 1AC adapter
7 DC power supply A1105JC 1 Provided only when power supplyternial connector code is -2.
8 Fuse A1352EF 1 250 V 4 A, time lag (for 12 VDCpower supply model)
9 User’s Manual M3641 1 This manual
10 User’s Manual M3643 1 Communication function
11 User’s Manual M3645 1 Application software
Checking the Contents of the Package

vi
Optional Accessories (Sold Separately)The following optional accessories are available for purchase separately. If you make an
order, make sure that all items are present and undamaged.For information about ordering accessories, contact the dealer from which you
purchased the recorder.
Number Part Name Part Number/Model Q’ty Notes
1 3.5" floppy disk 7059 00 10 2HD
2 Zip disk A1053MP 1 100 MB
3 ATA flash memory card A1134UN 1 20 MB
4 Shunt resistor 4159 20 1 250 Ω ±0.1%(for the screw terminal) 4159 21 1 100 Ω ±0.1%
4159 22 1 10 Ω ±0.1%
5 Shunt resistor 4389 20 1 250 Ω ±0.1%(for the clamp input terminal) 4389 21 1 100 Ω ±0.1%
4389 22 1 10 Ω ±0.1%
6 Fuse A1352EF 4 250 V 4 A, time lag(for 12 VDC powersupply model)
Checking the Contents of the Package
vii
How to Use this Manual
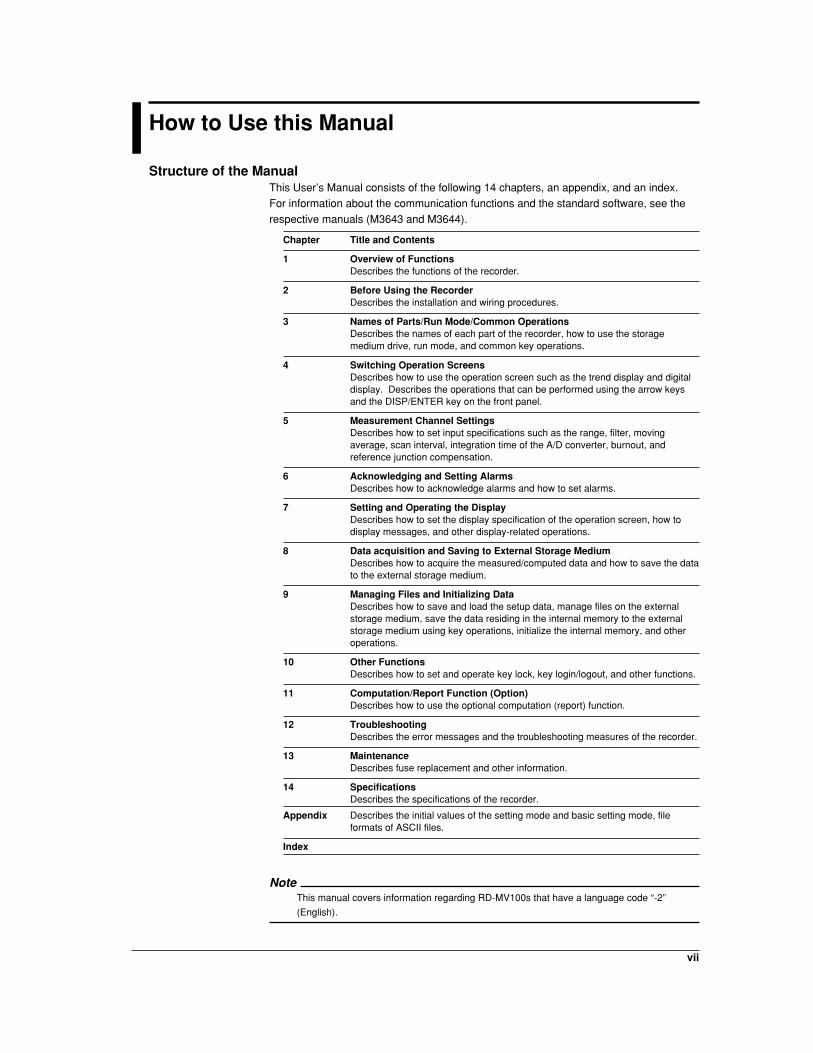
Structure of the ManualThis User’s Manual consists of the following 14 chapters, an appendix, and an index.
For information about the communication functions and the standard software, see the
respective manuals (M3643 and M3644).
Chapter Title and Contents
1 Overview of FunctionsDescribes the functions of the recorder.
2 Before Using the RecorderDescribes the installation and wiring procedures.
3 Names of Parts/Run Mode/Common OperationsDescribes the names of each part of the recorder, how to use the storagemedium drive, run mode, and common key operations.
4 Switching Operation ScreensDescribes how to use the operation screen such as the trend display and digitaldisplay. Describes the operations that can be performed using the arrow keysand the DISP/ENTER key on the front panel.
5 Measurement Channel SettingsDescribes how to set input specifications such as the range, filter, movingaverage, scan interval, integration time of the A/D converter, burnout, andreference junction compensation.
6 Acknowledging and Setting AlarmsDescribes how to acknowledge alarms and how to set alarms.
7 Setting and Operating the DisplayDescribes how to set the display specification of the operation screen, how todisplay messages, and other display-related operations.
8 Data acquisition and Saving to External Storage MediumDescribes how to acquire the measured/computed data and how to save the datato the external storage medium.
9 Managing Files and Initializing DataDescribes how to save and load the setup data, manage files on the externalstorage medium, save the data residing in the internal memory to the externalstorage medium using key operations, initialize the internal memory, and otheroperations.
10 Other FunctionsDescribes how to set and operate key lock, key login/logout, and other functions.
11 Computation/Report Function (Option)Describes how to use the optional computation (report) function.
12 TroubleshootingDescribes the error messages and the troubleshooting measures of the recorder.
13 MaintenanceDescribes fuse replacement and other information.
14 SpecificationsDescribes the specifications of the recorder.
Appendix Describes the initial values of the setting mode and basic setting mode, fileformats of ASCII files.
Index
NoteThis manual covers information regarding RD-MV100s that have a language code “-2”
(English).
viii
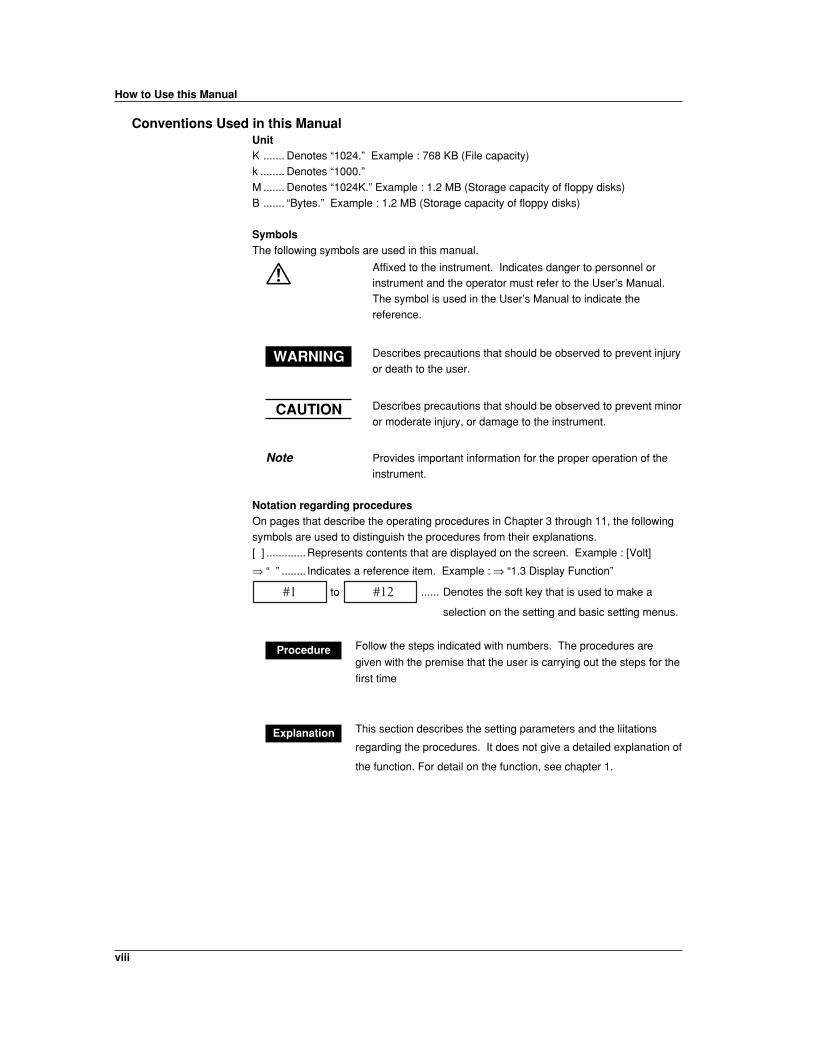
Conventions Used in this ManualUnitK ....... Denotes “1024.” Example : 768 KB (File capacity)
k ........ Denotes “1000.”
M ....... Denotes “1024K.” Example : 1.2 MB (Storage capacity of floppy disks)
B ....... “Bytes.” Example : 1.2 MB (Storage capacity of floppy disks)
SymbolsThe following symbols are used in this manual.
Affixed to the instrument. Indicates danger to personnel orinstrument and the operator must refer to the User’s Manual.
The symbol is used in the User’s Manual to indicate the
reference.
WARNING Describes precautions that should be observed to prevent injury
or death to the user.
CAUTION Describes precautions that should be observed to prevent minor
or moderate injury, or damage to the instrument.
Note Provides important information for the proper operation of the
instrument.
Notation regarding proceduresOn pages that describe the operating procedures in Chapter 3 through 11, the following
symbols are used to distinguish the procedures from their explanations.
[ ] .............Represents contents that are displayed on the screen. Example : [Volt]
⇒ “ ” ........ Indicates a reference item. Example : ⇒ “1.3 Display Function”
#1 to #12 ...... Denotes the soft key that is used to make a
selection on the setting and basic setting menus.
Procedure Follow the steps indicated with numbers. The procedures are
given with the premise that the user is carrying out the steps for the
first time
Explanation This section describes the setting parameters and the liitations
regarding the procedures. It does not give a detailed explanation of
the function. For detail on the function, see chapter 1.
How to Use this Manual
ix
3
2
1
4
5
6
7
8
9
10
11
12
13
14
App
Index
Contents
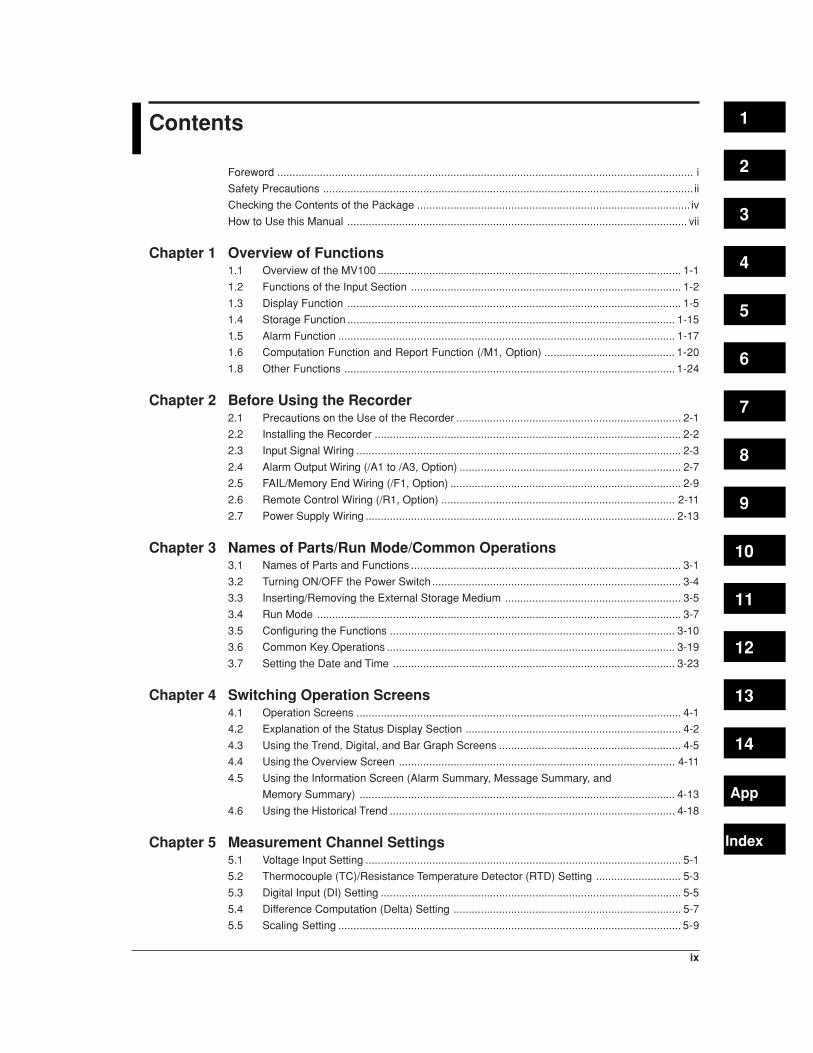
Foreword ......................................................................................................................................... i
Safety Precautions .......................................................................................................................... ii
Checking the Contents of the Package .......................................................................................... iv
How to Use this Manual ................................................................................................................ vii
Chapter 1 Overview of Functions1.1 Overview of the MV100 .................................................................................................... 1-1
1.2 Functions of the Input Section ......................................................................................... 1-2
1.3 Display Function .............................................................................................................. 1-5
1.4 Storage Function ............................................................................................................ 1-15
1.5 Alarm Function ............................................................................................................... 1-17
1.6 Computation Function and Report Function (/M1, Option) ........................................... 1-20
1.8 Other Functions ............................................................................................................. 1-24
Chapter 2 Before Using the Recorder2.1 Precautions on the Use of the Recorder .......................................................................... 2-1
2.2 Installing the Recorder ..................................................................................................... 2-2
2.3 Input Signal Wiring ........................................................................................................... 2-3
2.4 Alarm Output Wiring (/A1 to /A3, Option) ......................................................................... 2-7
2.5 FAIL/Memory End Wiring (/F1, Option) ............................................................................ 2-9
2.6 Remote Control Wiring (/R1, Option) ............................................................................. 2-11
2.7 Power Supply Wiring ...................................................................................................... 2-13
Chapter 3 Names of Parts/Run Mode/Common Operations3.1 Names of Parts and Functions ......................................................................................... 3-1
3.2 Turning ON/OFF the Power Switch .................................................................................. 3-4
3.3 Inserting/Removing the External Storage Medium .......................................................... 3-5
3.4 Run Mode ........................................................................................................................ 3-7
3.5 Configuring the Functions .............................................................................................. 3-10
3.6 Common Key Operations ............................................................................................... 3-19
3.7 Setting the Date and Time ............................................................................................. 3-23
Chapter 4 Switching Operation Screens4.1 Operation Screens ........................................................................................................... 4-1
4.2 Explanation of the Status Display Section ....................................................................... 4-2
4.3 Using the Trend, Digital, and Bar Graph Screens ............................................................ 4-5
4.4 Using the Overview Screen ........................................................................................... 4-11
4.5 Using the Information Screen (Alarm Summary, Message Summary, and
Memory Summary) ........................................................................................................ 4-13
4.6 Using the Historical Trend .............................................................................................. 4-18
Chapter 5 Measurement Channel Settings5.1 Voltage Input Setting ........................................................................................................ 5-1
5.2 Thermocouple (TC)/Resistance Temperature Detector (RTD) Setting ............................ 5-3
5.3 Digital Input (DI) Setting ................................................................................................... 5-5
5.4 Difference Computation (Delta) Setting ........................................................................... 5-7
5.5 Scaling Setting ................................................................................................................. 5-9

x
Contents
5.6 Square Root Computation Setting ................................................................................ 5-11
5.7 Skip Setting ................................................................................................................... 5-13
5.8 Input Filter and Moving Average Setting ....................................................................... 5-14
5.9 Setting the A/D Integration Time, Scan Interval, Burnout, and Reference Junction
Compensation (Basic Setting Mode) ............................................................................. 5-15
Chapter 6 Acknowledging and Setting Alarms6.1 Releasing the Alarm Indication and Output Relay (Option) ............................................. 6-1
6.2 Alarm Setting ................................................................................................................... 6-5
6.3 Setting the Alarm Delay Period ........................................................................................ 6-8
6.4 Setting the Auxiliary Alarm Function (Basic Setting Mode) ............................................ 6-10
Chapter 7 Setting and Operating the Display7.1 Setting Tag Names ........................................................................................................... 7-1
7.2 Selecting Tag Display or Channel Display (Basic Setting Mode) ..................................... 7-2
7.3 Setting the Display Rate (Trend) ...................................................................................... 7-3
7.4 Using Message Strings (Trend) ....................................................................................... 7-4
7.5 Setting the Message String (Trend) ................................................................................. 7-7
7.6 Setting Groups ................................................................................................................. 7-8
7.7 Setting the Trip Line (Trend) .......................................................................................... 7-10
7.8 Setting the Channel Display Colors (Trend, Bar Graph) ................................................ 7-12
7.9 Using Zone Displays (Trend) ......................................................................................... 7-13
7.10 Setting the Scale Division, Bar Graph Base Position (Bar Graph), and Scale Position
(Trend) ........................................................................................................................... 7-15
7.11 Using Partial Expansion Display (Trend) ....................................................................... 7-20
7.12 Setting Whether or Not to Use the Partial Expansion Display (Basic Setting Mode) ..... 7-22
7.13 Setting the Display Direction, Background Color, Waveform Line Width,
Trip Line Width, Grid, and Scroll Time ........................................................................... 7-23
7.14 Setting the Brightness of the Screen and the Backlight Saver Function ........................ 7-25
Chapter 8 Data Acquisition and Saving to External Storage Medium8.1 Data Types to be Acquired and Saved ............................................................................. 8-1
8.2 Function to Acquire Display Data and Event Data ........................................................... 8-3
8.3 Function to Acquire Other Data ........................................................................................ 8-9
8.4 Function that Saves the Data in the Internal Memory to the External Storage Medium 8-10
8.5 Acquiring Display Data ................................................................................................... 8-12
8.6 Acquiring Event Data ..................................................................................................... 8-13
8.7 Saving the Data in the Internal Memory to the External Storage Medium ..................... 8-15
8.8 Setting the Auto Save Interval for the Display Data ....................................................... 8-18
8.9 Setting the File Header, Directory Name, and the Saved Data during Manual Save ..... 8-20
8.10 Setting the Channels to Display the Trend and Acquire the Data (Basic Setting Mode) 8-22
8.11 Setting the Method of the Display/Event Data Acquisition (Basic Setting Mode) ........... 8-23
8.12 Storing Measured/Computed Data at Arbitrary Times (Manual Sampling) .................... 8-26
Chapter 9 Managing Files and Initializing Data9.1 Saving/Loading Setup Data ............................................................................................. 9-1
9.2 Saving Data in the Internal Memory to the External Storage Medium
Using Key Operation ........................................................................................................ 9-5
9.3 Viewing Display Data in the External Storage Medium .................................................... 9-6
9.4 Viewing Event Data in the External Storage Medium ...................................................... 9-7

xi
3
2
1
4
5
6
7
8
9
10
11
12
13
14
App
Index
Contents
9.5 Managing Files/Displaying Free Space on the External Storage Medium....................... 9-8
9.6 Saving the Screen Image ............................................................................................... 9-13
9.7 Clearing Data from the Internal Memory ........................................................................ 9-14
9.8 Initializing Setup Data .................................................................................................... 9-15
Chapter 10 Other Functions10.1 Using Key Lock .............................................................................................................. 10-1
10.2 Setting the Key Lock Function (Basic Setting Mode) ..................................................... 10-2
10.3 Using the Key Login/Logout Function ............................................................................ 10-4
10.4 Setting the Key Login/Logout Functions (Basic Setting Mode) ...................................... 10-6
10.5 Displaying the Log Screen/System Screen .................................................................... 10-8
10.6 Setting the Memory End Relay Output Time (Option, /F1, Basic Setting Mode) ......... 10-10
10.7 Setting the Remote Control Functions (Option, /R1, Basic Setting Mode) ................. 10-11
10.8 Setting the Displayed Language (Basic Setting Mode) ............................................... 10-14
10.12 Using the Daylight Savings Time Adjustment Function ............................................... 10-20
10.13 Setting the Temperature Unit (Basic Setting Mode) ..................................................... 10-22
Chapter 11 Computation/Report Function (Option)11.1 Overview of the Computation Function .......................................................................... 11-1
11.2 Explanation of Computing Equations ............................................................................. 11-4
11.3 Using the Computation Function .................................................................................... 11-8
11.4 Setting Computation Channels .................................................................................... 11-10
11.5 Setting the Alarm .......................................................................................................... 11-12
11.6 Setting Constants ......................................................................................................... 11-14
11.7 TLOG Computation ...................................................................................................... 11-15
11.8 Setting the Timer Number and Sum Unit for TLOG Computation ................................ 11-17
11.9 Setting the Timer (Basic Setting Mode) ....................................................................... 11-18
11.10 Using the Rolling Average ............................................................................................ 11-20
11.11 Overview of the Report Function ................................................................................. 11-22
11.12 Using the Report Function ........................................................................................... 11-25
11.13 Setting the Report Function ......................................................................................... 11-26
Chapter 12 Troubleshooting12.1 A List of Messages ......................................................................................................... 12-1
12.2 Troubleshooting Flow Chart ........................................................................................... 12-8
Chapter 13 Maintenance13.1 Periodic Maintenance .................................................................................................... 13-1
13.2 Replacing the Fuse ........................................................................................................ 13-2
13.3 Calibration ...................................................................................................................... 13-3
13.4 Recommended Replacement Periods for Worn Parts ................................................... 13-5
Chapter 14 Specifications14.1 Input Specifications ....................................................................................................... 14-1
14.2 Display Specifications .................................................................................................... 14-3
14.3 Data Storage Specifications .......................................................................................... 14-5
14.4 Alarm Function Specifications ....................................................................................... 14-8
14.5 Specifications of Communication Functions ................................................................. 14-9
xii
Contents
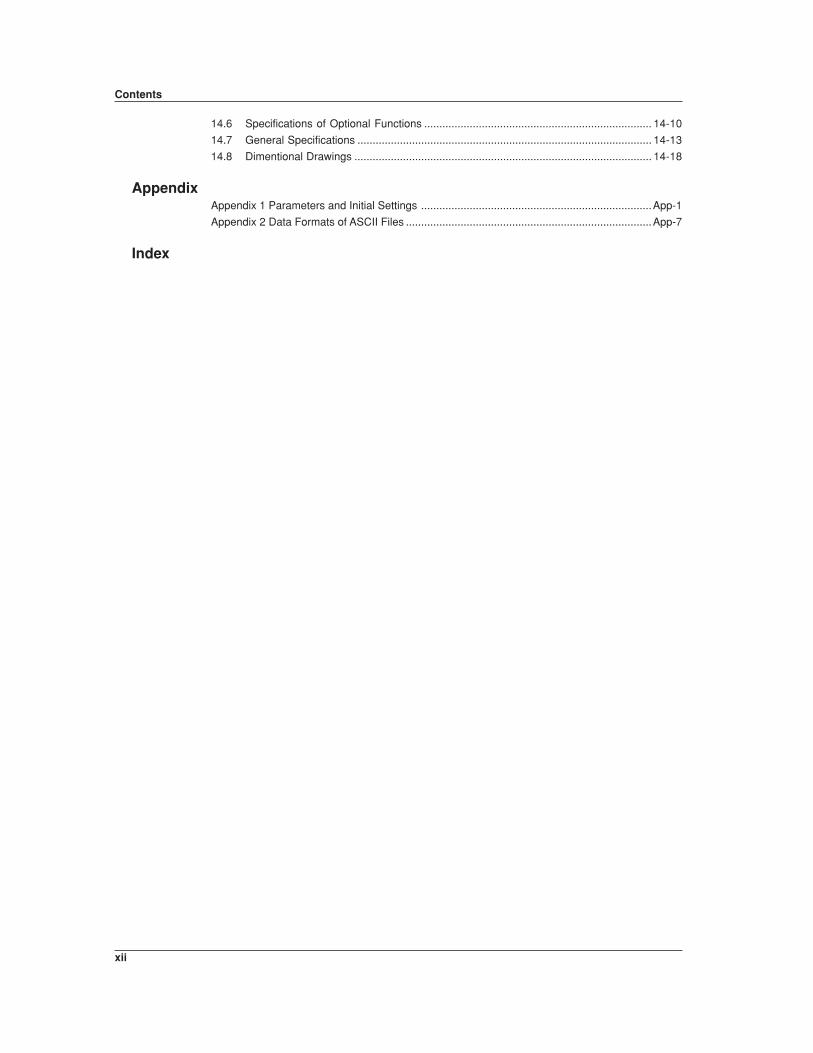
14.6 Specifications of Optional Functions ........................................................................... 14-10
14.7 General Specifications ................................................................................................. 14-13
14.8 Dimentional Drawings .................................................................................................. 14-18
AppendixAppendix 1 Parameters and Initial Settings ............................................................................App-1
Appendix 2 Data Formats of ASCII Files .................................................................................App-7
Index

1-1
Overview
of F
un
ction
s
1
Chapter 1 Overview of Functions
1.1 Overview of the RD-MV100
Unlike conventional recorders that record data on charts, the RD-MV100 displays the
measured data acquired in the internal memory to a LCD in the form of waveforms,
numerical values, and bar graphs. The measured data can also be saved to external
storage media such as floppy disks, Zip disks, and ATA flash memory cards.
RD-MV100 External storage media
Floppy disk
Zip disk
ATA flash memory card
The data that have been saved to an external storage medium can be displayed on a PCusing the standard software that comes with the package. The data can also be loaded
into the RD-MV100 to be displayed.
By using the Ethernet interface that comes standard with the RD-MV100, the data can
be transferred to a server on a network (client function). The data stored on the RD-MV100’s external storage medium can also be read from a PC on the network (server
function).
RD-MV100 RD-MV100
Measured data
Server
Primary Secondary
RD-MV100 RD-MV100
Data on the external storage medium
PC
The communication functions such as the Ethernet interface are not covered in thismanual. See the RD-MV100 Communication Interface User’s Manual (M3643).

1-2
1.2 Functions of the Input Section
Number of Measurement Channels/Scan IntervalThe number of measurement channels and scan intervals for different models are listed
in the table below. For the procedure related to setting the scan interval, see section 5.9.
Model Number of Measurement Channels Scan Interval
RD-MV102 2 channels 125 ms or 250 msRD-MV104 4 channels 125 ms or 250 msRD-MV106 6 channels 1 s or 2 sRD-MV112 12 channels 1 s or 2 s
Input Type and ComputationYou can select the input type of a measurement channel from DC voltage, thermocouple,
resistance temperature detector (RTD), and ON/OFF input (contact signal or voltagesignal). You can also perform computation on the measured data such as the
“difference,” “square root,” and “scaling.”
The input type and computation are configured as an “input mode” on the RD-MV100.
For the procedure related to setting the different modes, see sections 5.1 to 5.7.
Input Mode Notation*1 Description
DC voltage Volt Measures a DC voltage in the range ±20 mV to ±20 V.Thermocouple TC Measures the temperature corresponding to the appropriate
range for R, S, B, K, E, J, T, N, W, L, and U.Resistance RTD Measures the temperature corresponding to the appropriatetemperature range for Pt100, JPt100, Cu10*2, and CU25*2.detectorON/OFF input DI Displays the contact input or voltage input signals by
correlating them to 0% or 100% of the display range.Contact input: Closed contact is ON (1). Open contact isOFF (0).Voltage input: Less than 2.4 V is OFF (0). Greater than orequal to 2.4 V is ON (1)
Difference Delta When the input type*3 is set to “DC voltage,” “thermocouple,”“RTD,” or “ON/OFF input,” the value obtained by subtractingthe measured value of another channel (this channel iscalled a “reference channel”) from the input signal of thechannel set to compute the difference is displayed as themeasured value of that channel.
Square root Sqrt When the input type*3 is set to “DC voltage,” the square rootof the input signal of the channel set to compute the squareroot is displayed as the measured value of that channel.The computed result can be scaled to a value in theappropriate unit and displayed.
Scaling Scale When the input type*3 is set to “DC voltage,” “thermocouple,”“RTD,” or “ON/OFF input,” the input signal can be convertedto a value in the appropriate unit desired and displayed.
Skip Skip Channels that are not measured. They are not displayed.
*1 Notation used by the RD-MV100 to represent the input modes. It is used when setting themeasurement channels.
*2 This is optional.*3 This item defines the type of signals that can be connected to the input terminal when the
input mode is set to “Difference,” “Square root,” or “Scaling.” The description of the inputtypes, “DC voltage,” “Thermocouple,” “Resistive temperature detector,” and “ON/OFF input,”are the same as the descriptions given for the input modes, “DC voltage,” “Thermocouple,”“Resistive temperature detector,” and “ON/OFF input,” respectively.

1-3
Overview
of F
un
ction
s
1If the signal to be measured is a DC current, a shunt resistance is attached to the input
terminal to convert the current signal to a voltage signal. The input mode is set to “DCvoltage” in this case. For the various types of shunt resistors and the procedure related
to setting the current input, see section 5.1.
Input Range and Measurable RangeYou can select the “Input range” that is appropriate for the input signal for “DC voltage,”“Thermocouple,” “RTD,” and “ON/OFF input.” (For example, R, S, B, K, E, J, T, N, W, L,
and U are available input ranges for “Thermocouple.”) For each “Input range,” a
measurable range is defined (for example, the measurable range for /R of
“Thermocouple” is “0.0°C to 1760°C”). For details, see section 14.1.
BurnoutWhen measuring temperature using a thermocouple and the thermocouple burns out,
you can specify the measurement result to be set to positive over range or negative over
range. Burnout can be set on each measurement channel. The initial setting is set so
that burnout is not indicated. For the setting procedure, see section 5.9.*1 Positive over range is a condition in which the input signal is over the upper limit of
the measurable range. The measured value is indicated as “+ .”
*2 Negative over range is a condition in which the input signal is below the lower limit of
the measurable range. The measured value is indicated as “– .”
Reference Junction Compensation (RJC)When measuring the temperature using a thermocouple, the reference junction
compensation can be used. You can select whether to use the reference junctioncompensation provided by the recorder or external reference junction compensation. If
you are using external reference junction compensation, you will also set the reference
voltage. The initial setting is set so that the reference junction compensation provided by
the recorder is used. For the setting procedure, see section 5.9.
Filter and Moving AverageThe filter and moving average are used to suppress the effects of noise that is riding on
the signal. Filtering is provided on the RD-MV102 and RD-MV104. Moving average is
provided on the RD-MV106, and RD-MV112. The filter or moving average can be set on
each channel. For the setting procedure, see section 5.8.Filter function (RD-MV102 and RD-MV104)Suppresses the effects of noise above the frequency determined by the specified time
constant. The time constant can be set to 2 s, 5 s, or 10 s. The filter is initially turned
OFF.
63.2% of the output value
2, 5, 10 s (time constant, the time it takes to reach 63.2% of the output value)
Output response curve (when using the filter)
Input
Effects of using filter (Output response fot a step input)
1.2 Functions of the Input Section

1-4
Moving average (RD-MV106, and RD-MV112)The input signal of the measurement channel is set to the averaged value of the m mostcurrent data points (the number of moving-averaged data points) acquired at the scan
interval. The number of moving-averaged data points can be set in the range 2 to 16.
The moving average is initially turned OFF.
The figure below shows an example indicating the operation of the buffer for the moving
average computation when the number of moving averaged data points is set to “5.”
1
2
3
4
5
10.0 mV
5.0 mV
0.0 mV
–5.0 mV
–10.0 mV
0.0 mV
15.0 mV
10.0 mV
5.0 mV
0.0 mV
–5.0 mV
5.0 mV
10.0 mV
15.0 mV
10.0 mV
5.0 mV
0.0 mV
8.0 mV
Deleted DeletedMoving average value
New data New data
Buffer data at the nth sampling
Buffer data at the n+1th sampling
Buffer data at the n+2th sampling
Integration Time of the A/D ConverterThe recorder uses an A/D converter to convert the sampled analog signal to a digital
signal. By setting the integration time to match the time period corresponding to onecycle of the power supply or an integer multiple of one cycle, the power supply frequency
noise can be effectively eliminated. The integration time of the A/D converter is selected
according to the model from the table below. If “Auto” is selected, the recorder will
automatically detect the power supply frequency and select 16.7 ms or 20 ms. Because
100 ms is an integer multiple of 16.7 ms and 20 ms, this setting can be used to eliminatethe power frequency noise for either frequency, 50 Hz or 60 Hz. 100 ms is available on
the RD-MV106, and RD-MV112. For the setting procedure, see section 5.9.
Model Integration Time of the A/D Converter
RD-MV102/RD-MV104 Select 16.7 ms (60 Hz), 20 ms (50 Hz), or auto (automatically switches16.7 ms/20 ms, fixed to 20 ms for 12 VDC power supply model)
RD-MV106/RD-MV112 Select 16.7 ms (60 Hz), 20 ms (50 Hz), 100 ms, or auto (automaticallyswitches 16.7 ms/20 ms, fixed to 20 ms for 12 VDC power supply model)
1.2 Functions of the Input Section

1-5
Overview
of F
un
ction
s
11.3 Display Function
Common Items Related to the Display5.5" TFT color LCD and the screen configurationThe recorder has a 5.5" TFT color LCD (320-by-240 dot resolution). The screen consists
of the status display section and the data display section.
Status display section
Data display section (example of a digital display)
Status display sectionDisplays the displayed screen name, date and time, internal memory/external storagemedium usage condition, alarm condition, key lock, user name (key login function), and
computation condition (option). For details, see section 4.2.
• Data display section• Displays the operation screen such as the trend display, digital display, and bar
graph display of the measured and computed data as well as alarm, message, and
file information.
• Displays the setup screen for the setting and basic setting modes when the
recorder is being configured. For details related to the setting and basic setting
modes, see section 3.5.
Group displayThe data displayed on the trend, digital, and bar graph displays are the data of
measurement or computation channels that are assigned to the group. Up to 6 channels
can be assigned to a single group. For the procedure used to assign channels togroups, see section 7.6, “Setting Groups.” Up to four groups can be registered. The
groups are common to the trend, digital, and bar graph displays.
On the trend, digital, and bar graph displays, the displayed groups can be automatically
switched at 5 s, 10 s, 20 s, 30 s, or 1 min intervals.
Channel number of tag displayThe channels can be displayed as channel number or tags. The setting applies to all
channels. For the procedure related to the selecting the channel display or tag display,
see section 7.2. For the procedure related to setting the tags, see section 7.1.
1-6
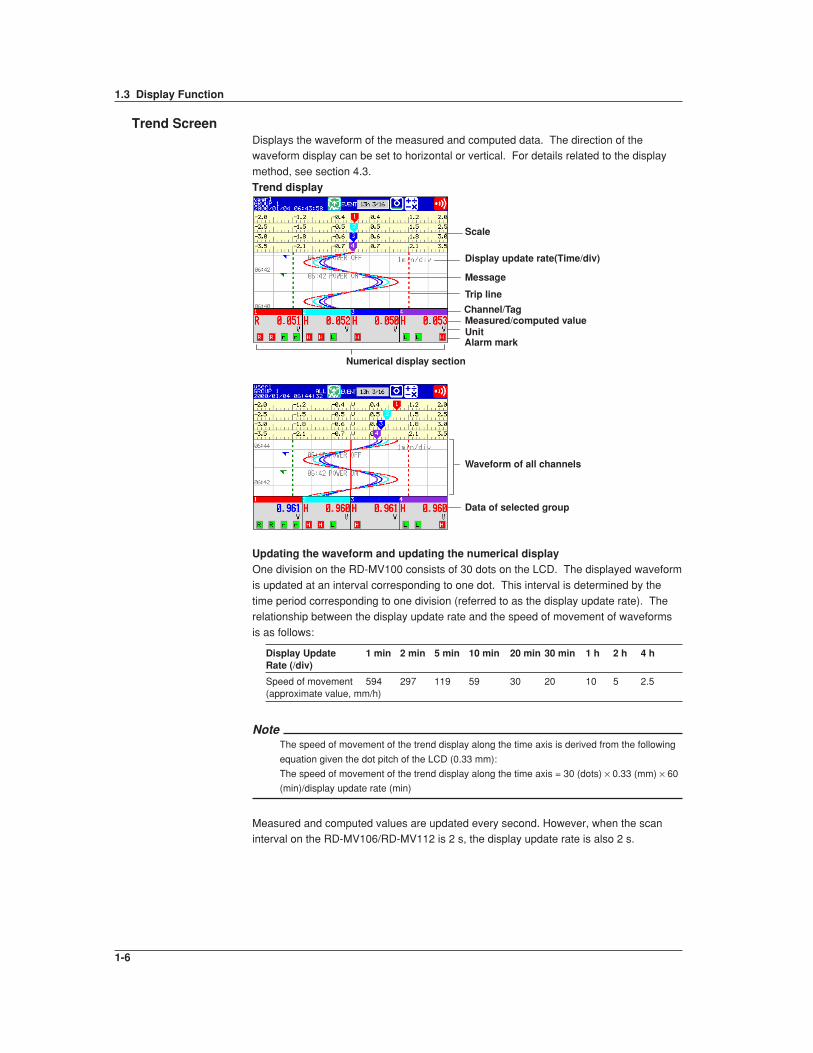
Trend ScreenDisplays the waveform of the measured and computed data. The direction of thewaveform display can be set to horizontal or vertical. For details related to the display
method, see section 4.3.
Trend display
Measured/computed valueChannel/Tag
UnitAlarm mark
Scale
Trip line
Message
Display update rate(Time/div)
Numerical display section
Data of selected group
Waveform of all channels
Updating the waveform and updating the numerical displayOne division on the RD-MV100 consists of 30 dots on the LCD. The displayed waveform
is updated at an interval corresponding to one dot. This interval is determined by the
time period corresponding to one division (referred to as the display update rate). Therelationship between the display update rate and the speed of movement of waveforms
is as follows:
Display Update 1 min 2 min 5 min 10 min 20 min 30 min 1 h 2 h 4 hRate (/div)
Speed of movement 594 297 119 59 30 20 10 5 2.5(approximate value, mm/h)
NoteThe speed of movement of the trend display along the time axis is derived from the following
equation given the dot pitch of the LCD (0.33 mm):
The speed of movement of the trend display along the time axis = 30 (dots) × 0.33 (mm) × 60
(min)/display update rate (min)
Measured and computed values are updated every second. However, when the scaninterval on the RD-MV106/RD-MV112 is 2 s, the display update rate is also 2 s.
1.3 Display Function
1-7
Overview
of F
un
ction
s
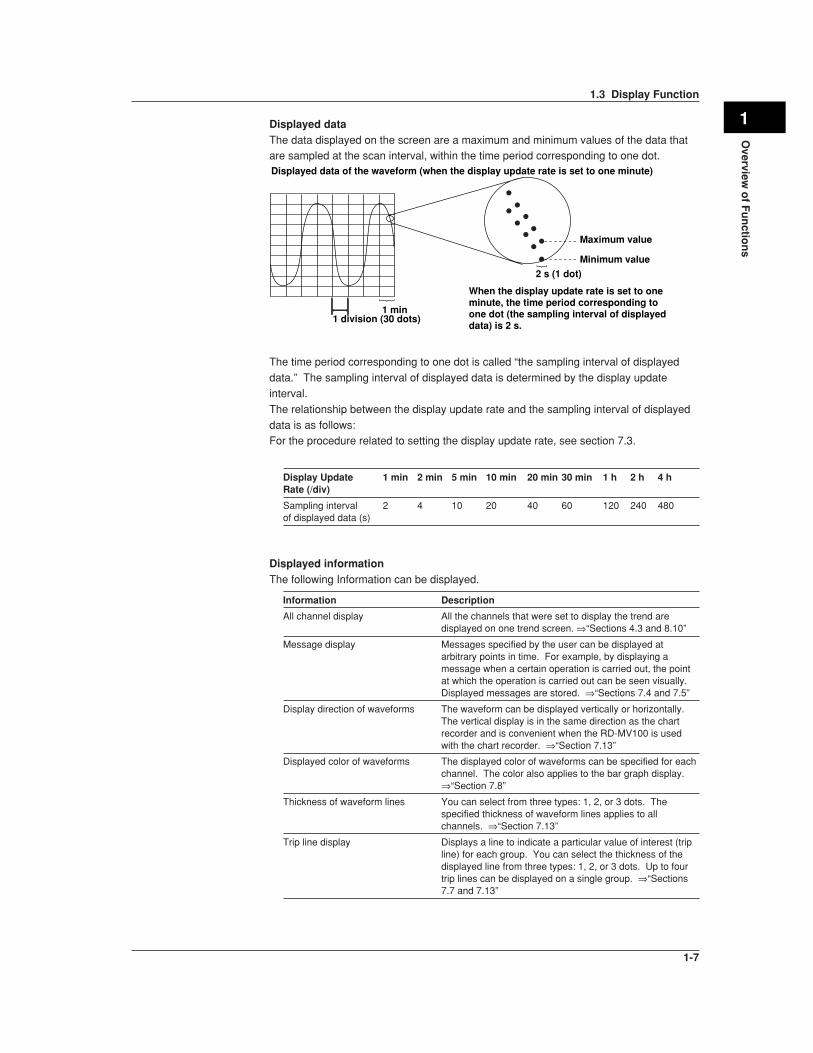
1Displayed dataThe data displayed on the screen are a maximum and minimum values of the data thatare sampled at the scan interval, within the time period corresponding to one dot.
1 min1 division (30 dots)
When the display update rate is set to one minute, the time period corresponding to one dot (the sampling interval of displayed data) is 2 s.
Displayed data of the waveform (when the display update rate is set to one minute)
2 s (1 dot)
Maximum value
Minimum value
The time period corresponding to one dot is called “the sampling interval of displayed
data.” The sampling interval of displayed data is determined by the display update
interval.
The relationship between the display update rate and the sampling interval of displayed
data is as follows:For the procedure related to setting the display update rate, see section 7.3.
Display Update 1 min 2 min 5 min 10 min 20 min 30 min 1 h 2 h 4 hRate (/div)
Sampling interval 2 4 10 20 40 60 120 240 480of displayed data (s)
Displayed informationThe following Information can be displayed.
Information Description
All channel display All the channels that were set to display the trend aredisplayed on one trend screen. ⇒“Sections 4.3 and 8.10”
Message display Messages specified by the user can be displayed atarbitrary points in time. For example, by displaying amessage when a certain operation is carried out, the pointat which the operation is carried out can be seen visually.Displayed messages are stored. ⇒“Sections 7.4 and 7.5”
Display direction of waveforms The waveform can be displayed vertically or horizontally.The vertical display is in the same direction as the chartrecorder and is convenient when the RD-MV100 is usedwith the chart recorder. ⇒“Section 7.13”
Displayed color of waveforms The displayed color of waveforms can be specified for eachchannel. The color also applies to the bar graph display.⇒“Section 7.8”
Thickness of waveform lines You can select from three types: 1, 2, or 3 dots. Thespecified thickness of waveform lines applies to allchannels. ⇒“Section 7.13”
Trip line display Displays a line to indicate a particular value of interest (tripline) for each group. You can select the thickness of thedisplayed line from three types: 1, 2, or 3 dots. Up to fourtrip lines can be displayed on a single group. ⇒“Sections7.7 and 7.13”
1.3 Display Function

1-8
Information Description
Scale display A scale appropriate for the measured item can be displayedfor each channel. The number of divisions of the displayscale created by the main scale marks can be set to a valuein the range 4 to 12 div (also applies to the bar graphdisplay). Medium and small scale marks are displayed inbetween the main scale marks.You can select whether or not to display the scale for eachchannel and the display position. ⇒“Section 7.10”
Turn ON/OFF the numerical The numerical display section can be turned ON or OFF. Ifdisplay section the numerical display section is turned OFF, the display
shows only the waveform and the scale. See section 4.3.
Zone display The waveform of each channel is displayed in its displayrange (zone). The waveforms are easier to view, becausethey do not overlap. See the explanation of the zonedisplay below. ⇒“Section 7.9”
Partial expanded display You can expand the important section of the display area.See the explanation of the partial expanded display below.⇒“Sections 7.11 and 7.12”
Explanation regarding the zone displayThe display range of the measured/computed data is called a zone. Zones can be setfor each channel. The waveforms can be set in different zones, so that they are easierto view. In the example shown in the figure below, channel 1 is displayed in the zone 0to 30%, channel 2 in the zone 30 to 60%, and channel 3 in the zone 60 to 100%.
Zone 3
Zone 2
Zone 1
Normal display Zone display
0% 0%
100%
60%
30%
100%
CH2
CH1
CH3
Explanation regarding the partial expansion displayBy compressing a section of the display scale of the measured/computed data, theremaining section of the display is expanded. You specify a value on the display scale(boundary value) to be moved to another position on the display scale (boundary valuedisplacement position). In the example shown in the figure below, 0 V (boundary value)is moved to the 30% position of the display scale (boundary value displacementposition). The section below the boundary (accounts for 30% of the entire display)represents –6 V to 0 V and the section above the boundary (accounts for 70% of theentire display) represents 0 V to 6 V.
100100 30
0
50
0 6 V6 V
0
–6 V–6 V
0
2 div
3 div
1 div
0
1 div
2 div
3 div
2 div
3 div
1 div
0
1 div
2 div
3 div
Measured value
Expanded portionCompressed
portion% of full display span
Measured value
% of full display span
1.3 Display Function

1-9
Overview
of F
un
ction
s
1Digital ScreenThe measured/computed data are displayed using numerical values in large size. Seesection “4.3.”
Measured/computed value
Channel/Tag
Unit
Alarm markDisplay update rateMeasured and computed values are updated every second. However, when the scan
interval on the RD-MV106/RD-MV112 is 2 s, the display update rate is also 2 s.
Bar graph ScreenThe measured/computed data are displayed using bar graphs. See section 4.3.
Bar graph display(Vertical)
Unit
Alarm markTag/Channel
Measured/computed value
Alarm point mark
Bar graph
Upper limit of span
Lower limit of span
Display update rateMeasured and computed values are updated every second. However, when the scaninterval on the RD-MV106/RD-MV112 is 2 s, the display update rate is also 2 s.
Displayed informationThe following Information can be displayed.
Information Description
Display direction The bar graphs can be displayed horizontally or vertically.⇒ “Section 7.13”
Base position When the bar graph is displayed horizontally, the starting pointof the bar (base position) can be set to the minimum edge of themeasurement scale or to the center position. ⇒ “Section 7.10”
Displayed color The displayed color of the channels are common with the trenddisplay. ⇒ “Section 7.8”
Scale display The number of divisions of the scale can be set to a value in therange 4 to 12 div. ⇒ “Section 7.10”(common with the trend display)
1.3 Display Function

1-10
Overview ScreenA list of measured/computed values and alarm conditions of all measurement/computation channels is displayed. You can move the cursor to select a channel and
display the trend or bar graph of the group containing the selected channel. For the
procedure used to display the overview, see section 4.4.
Measured/computed value
Channel/Tag
The area corresponding to a channel on which an alarm is not occurring is displayed in green.
The area corresponding to a channel on which an alarm is occurring is displayed in red.
Alarm type
Cursor
Unit
Updating of the numerical displayMeasured and computed value are updated every second. However, when the scan
interval on the RD-MV106/RD-MV112 is 2 s, the display update rate is also 2 s.
Alarm SummaryA list of the most recent alarms can be displayed. By scrolling the screen using a key,up to 120 incidents can be displayed.
By selecting an alarm from the list using arrow keys, the historical trend of the display
data or event data containing the alarm can be recalled. For a description on the
historical trend display, see “Historical Trend” in this section. For the operating
procedure, see section 4.5.
Cursor
Number of the alarm information displayed at the last line of the screenNumber of the alarm information in the internal memory
Tag/ChannelAlarm No. /Type
Date & Time (when the alarm occurred).
Date & Time (when the alarm released).
Mark (See section 6.1.)
1.3 Display Function

1-11
Overview
of F
un
ction
s
1Message SummaryThe messages that were entered in the trend display and the times when they wereentered (message information) are displayed in a list. By scrolling the screen using a
key, up to 100 incidents can be displayed.
By selecting a message from the list using arrow keys, the historical trend of the display
data or event data containing the message can be recalled. For a description on the
historical trend display, see “Historical Trend” in this section. For the operatingprocedure, see section 4.5.
Cursor
Number of the message displayed at the last line of the screenNumber of the messages in the internal memory
Message Date and time the message was enteredUser name(when using key login function)
Memory SummaryThe information pertaining to the display data file and event data file in the internalmemory is displayed. Display data correspond to the data on the trend display. Event
data are data acquired to the internal memory according to the specified sampling
interval and data collection period. The data are separate from the display data.
In addition, the number of manual sampled data, TLOG data (option), and report data
(option) residing in the internal memory are displayed. For models that have the alarmoutput relays (option), the ON/OFF state of the relays are also listed.
For details related to the data residing in the internal memory, see section 1.4.
By selecting the display data file or event data file using the arrow keys, the historical
trend display can be recalled. For a description on the historical trend display, see
“Historical Trend” in this section. For the operating procedure, see section 4.5.Number of data sets in the internal memory/The maximum number of data sets the internal memory can hold
Date and time the newest data were acquired
Date and time the data acquisition started
Date and time the data acquisition ended
Number of data in the file
File status
Status of alarm output relaysRed: ActivatedGreen: Released
Selection of the file type to be displayed, display data files or event data files
NoteFor models with the batch function (/BT1 option), a batch number and lot number can be
displayed in place of the date and time when the data acquisition ended.
1.3 Display Function

1-12
Report Data (/M1 Option)Report data residing in the internal memory can be displayed.The report function is used to write the average, minimum, maximum, and sum at
specified intervals for the specified channels. Reports can be made hourly, daily,
weekly, or monthly. For details related to the report data, see section 1.6. For the
operating procedure, see section 4.5.
Status of data (See section 11.11)
The index number of the report data currently displayed
The number of report data sets in the internal memory
Report type
Date and time the report startedDate and time the report was created
Historical TrendThe display data and event data of the measured/computed data stored in the internal
memory or external storage medium are displayed as a historical trend. For details
related to the display data, see “Trend Display” in this section. For details related to theevent data, see section 1.4.
Alarms and scales are not displayed on the historical trend display.
Methods used to display the historical trend• The following four methods are available in displaying the historical trend of the
display data or event data in the internal memory:
• Display from the alarm summary. For the operating procedure, see section 4.5.
• Display from the message summary. For the operating procedure, see section 4.5.• Display from the memory summary. For the operating procedure, see section 4.5.
• Recall from the screen menu. For the operating procedure, see section 4.6.
• For methods used to display the historical trend of display data or event data in the
external storage medium, see section 9.3 and 9.4.
Information displayed on the historical trendThe displayed information shown below is common to the historical trend of display data
and event data.Historical trend display (Display data example)
Zoom factor of the time axis
Time axis
Tag/Channel
Measured/computed value* (maximum and minimum value at the display reference position)
Measured/computed value (maximum and minimum value over the entire display range)
Reference positionIcons for switching screens
Unit
* For event data, the measured/computed value at the display reference position.
1.3 Display Function

1-13
Overview
of F
un
ction
s
1• The waveform can be scrolled along the time axis using the cursor keys.• The time axis can be expanded or reduced.
• The entire data of the file that is being displayed on the historical trend can be
displayed at the top section of the screen (right section if the trend display is vertical).
You can specify the position to be displayed on the historical trend display using acursor. The specified position becomes the display reference position.
All data display
CursorReference position
• The memory information of the file being displayed on the historical trend can be
displayed.
For models with the batch function (/BT1 option), information such as the batch
number and lot number are also displayed.
File name and data typeSerial number of the instrument that sampled the dataStart/stop time and user name(user name is displayed only when the key login function is used)
Half screen display (only when displaying the historical trend of the display data)Displays the historical trend of the display data on the left half of the screen and thecurrent display data on the right half of the screen.
Historical trend (display data only)
Current trend
Current trend information
1.3 Display Function

1-14
Setting ScreenThe various functions of the RD-MV100 are configured using the setting mode or thebasic setting mode.
Setting mode screenThis screen is used to set the input range, filter/moving average, alarm, group, channel
display color, etc. For details, see section 3.5.
• Setting screen example for the setting mode
Parameter selections (selected using the soft keys)
Cursor (blue)
Basic setting mode screenThis screen is used to configure the basic specifications of the various functions such as
burnout, reference junction compensation, A/D integration time, and the method used to
acquire data to the internal memory. For details, see section 3.5.
• Setting screen example for the basic setting mode
Parameter selections (selected using the soft keys)
Cursor (blue)
Setting the Display Conditions of the LCDThe following display conditions of the LCD can be configured.
Screen Attribute Settings
Background color You can select white or black for the background color of the of theoperation screen screen.The initial setting is “white.” For the setting procedure, see
section 7.13.
LCD brightness The brightness of the LCD can be set between eight levels. Theinitial setting is “4.” For the setting procedure, see section 7.14.
Backlight saver The lifetime of the LCD backlight can be extended by automaticallydimming the light when there is no key operation for a certainamount of time. The screen returns to the original brightness with akey operation or an alarm occurrence. The initial setting is set sothat the backlight saver is disabled. For the setting procedure, seesection 7.14.
1.3 Display Function

1-15
Overview
of F
un
ction
s
11.4 Storage Function
Acquiring Data to the Internal MemoryDisplay data and event dataThe measured/computed data are first acquired to the RD-MV100’s internal memory as
two types of data, display data and event data. Then, the data are saved to the externalstorage medium automatically or when press MEDIA key. You can select whether to
save the measured/computed data as display data, event data, or as both.
The capacity of the internal memory for acquiring display data and event data is 1.2 MB.
When the measured/computed data are saved as both display data and event data, 0.9
MB is used to save display data and 0.3 MB is used to save event data.
Display data Event data
0.9MB 0.3MB
Display data
1.2MB 1.2MB
Event data
Display data only Event data only Display data and event data
Internal memory
RD-MV100
Display data are used to display waveforms on the RD-MV100’s screen. Display data
consists of maximum and minimum values of the measured or computed data sampledat the scan interval within the time period corresponding to one dot on the time axis on
the screen. Display data can be likened to the conventional recording on the chart sheet
and are useful for long-term observations.
Event data are instantaneous values of the measured/computed data at specified
sampling intervals of the event data. By setting the sampling interval equal to the scaninterval, all measured or computed data sampled at the scan interval can be saved. In
addition, the event data generated when an event occurs (an alarm, for example) can
also be saved. This is useful when you wish to observe the measured/computed data in
detail.
Measurement data
Display data
Event data
Scan intervalSampling inteval for event data
The time period corresponding to one dot on the screen
Maximum valueMinimum value
1-16
Manual sampled dataEvery time a given key operation is carried out, all measured/computed data(instantaneous values) at that point are acquired to the internal memory. However, this
excludes measurement channels that are skipped and computation channels that are
turned OFF.
TLOG data (only on models with the optional computation function (/M1)The average, maximum, minimum, sum, or maximum - minimum can be computed for
the specified channels at predetermined intervals and the result can be acquired to the
internal memory. You can specify the interval.
Report data (only on models with the optional computation function (/M1)The average, maximum, minimum, and sum can be computed for the specified channels
at predetermined intervals and the result can be acquired to the internal memory. You
can select one hour (hourly report), one day (daily report), one day/one week (daily and
weekly reports), or one day/one month (daily and monthly reports) for the interval.
Saving Data to the External Storage MediaExternal storage mediaVarious data can be stored to the following storage media:
• 3.5" floppy disk (1.44 MB, 2HD)
• Zip disk (100 MB)• ATA flash memory card (4 MB to 160 MB): The size varies depending on the memory
card that you are using.
Save methodThere are two methods of storing data to the external storage medium. One methodstores the data when press MEDIA key (referred to as manual save). The other method
stores data automatically at certain time intervals to a storage medium (referred to as
auto save).
Other types of data that can be storedIn addition to the types of data described in “Acquiring Data to the Internal Memory,” the
following types of data can be stored on the external storage medium.
• Setting dataThe RD-MV100 setting data, such as the setting of the functions of the input section
as described in section 1.2, can also be stored to an external storage medium to thespecified file name. The stored data can also be loaded and used by the RD-MV100.
• Image data of the display screenThe image data of the display screen can be stored to the external storage medium.
The image data can be pasted to documents created on a PC.
Saving Data via EthernetThe display data, event data, and report data, as described in “Acquiring Data to the
Internal Memory,” can be automatically transferred to an FTP server via Ethernet for
storage. Conversely, the RD-MV100 can operate as an FTP server. The RD-MV100
can be accessed from a PC and the data in the external storage medium can beretrieved for storage. For these functions, see the “RD-MV100 Communication Interface
User’s Manual” (M3643).
1.4 Storage Function

1-17
Overview
of F
un
ction
s
11.5 Alarm Function
This function generates an alarm when the measured/computed data meets a certain
condition. When an alarm occurs, information notifying the alarm occurrence is
displayed on the screen. In addition, a signal can be output from the relay output
terminals on the rear panel of the RD-MV100 (only on models with the optional alarmoutput relay function (/A1 through /A3)).
Alarm indicationThe alarm conditions are displayed as alarm icons in the status display section and on
the trend, digital, bar graph, and overview displays. The detailed information about the
alarms is displayed in the alarm summary.Alarms are displayed when the alarm conditions are met. You can select to clear the
alarm when the conditions are no longer met (non-hold alarm) or hold the alarm until it is
cleared (hold alarm).
Alarm indication example (overview display and alarm summary display)
Measured/computed value
Channel/Tag
The area corresponding to a channel on which an alarm is not occurring is displayed in green.
The area corresponding to a channel on which an alarm is occurring is displayed in red.
Alarm type
Cursor
Unit
Cursor
Number of the alarm information displayed at the last line of the screenNumber of the alarm information in the internal memory
Tag/ChannelAlarm No. /Type
Date & Time (when the alarm occurred).
Date & Time (when the alarm released).
Mark (See section 6.1.)
Number of alarmsYou can set up to four alarms for each channel.
Alarm conditionsThe following eight conditions are available:
• Upper limit alarmAn alarm occurs when the measured value exceeds the alarm value.
• Lower limit alarmAn alarm occurs when the measured value falls below the alarm value.

1-18
alarm value
Alarm release
Measured/computed data
Alarm occurrence
Upper limit alarm Lower limit alarmMeasured/computed data Alarm release
alarm valueAlarm occurrence
• Alarm delay upper limit alarmAn alarm occurs when the measured value remains above the alarm value for the
specified time period (delay period).• Alarm delay lower limit alarm
An alarm occurs when the measured value remains below the alarm value for the
specified time period (delay period).
Alarm delay upper limit alarm example (T is the specified delay period)
Alarm releaseAlarm occurrence
T
X1 X2 X3 X4
T1
Measured/computed data
Alarm value
• Alarm does not occur at T1, because the time period is shorter than the specified
delay period (T).
• The input exceeds the alarm value at X2, but the alarm does not occur. The alarm
occurs at X3 at which the specified delay period elapses (the time when the alarm
occurs is the time at X3).• The input falls below the alarm value at X4 and the alarm is released.
• Difference upper limit alarmAn alarm occurs when the difference between the measured values of two channels
becomes greater than or equal to the alarm value.
Can be specified only on difference computation channels.• Difference lower limit alarm
An alarm occurs when the difference between the measured values of two channels
becomes smaller than or equal to the alarm value.
Can be specified only on difference computation channels.
• Upper limit on rate-of-change alarmThe amount of change of the measured values over a certain time interval is checked.
An alarm occurs when the amount of increase becomes greater than or equal to the
specified value.
Can be specified only on measurement channels.
• Lower limit on rate-of-change alarmThe amount of change of the measured values over a certain time interval is checked.
An alarm occurs when the amount of decrease becomes greater than or equal to the
specified value.
Can be specified only on measurement channels.
1.5 Alarm Function

1-19
Overview
of F
un
ction
s
1
Measuredvalue
Measuredvalue
R alarm
T1
Time
Interval t2-t1
Interval t2-t1
T2
T2
T1
t1 t2 t1 t2
Variation|T2-T1|
Variation|T2-T1|
Time
r alarm
Upper limit on rate-of-change alarm Lower limit on rate-of-change alarm
The interval is defined by the following equation and is set in terms of the number ofmeasured data points.
Interval = Scan interval × number of measurements
Alarm hysteresisThis applies to upper and lower limit alarms on measurement channels.A width (hysteresis) can be specified on the value used to set or release the alarm. This
prevents the alarm from being set or released repetitively when the measured value is
fluctuating around the alarm value. The hysteresis is fixed to 0.5% of the display span
(display scale if the range is set to [Scale]). The initial setting is [ON].
Alarm set point
Alarm releaseMeasured value
Alarm occurrence
1VHysteresis (approx. 0.5%)
1V
Measured valueAlarm release
Hysteresis (approx. 0.5%)
Alarm set pointAlarm occurrence
Upper Limit Alarm (H)
Lower Limidt Alarm (L)
Alarm output relayIf you are using a model with the optional alarm output relay (/A1 through /A3), a contact
signal can be generated according to the alarm conditions. For the procedure related to
setting the alarm output relay, see section 6.2, “Alarm Setting.”The following functions can be specified on the alarm output relay. For details, see
section 6.4.
• When multiple alarms are set to one alarm output relay, notify the succeeding alarms
after the first alarm that causes the relay operation (reflash alarm function).
• When multiple alarms are set to one alarm output relay, operate the relay when allspecified alarms are active (AND function)
• Energize or de-energize the alarm output relay when the alarm occurs (energize/de-
energize function of the output relay).
• When the alarm changes from the ON state to the OFF state (return to normal
condition), turn OFF the output relay with an alarm ACK operation (output relay holdfunction).
1.5 Alarm Function
1-20
1.6 Computation Function and Report Function(/M1, Option)
Computing equations are assigned to channels that are dedicated to performingcomputations. Displaying computation channels and acquiring computed data can becarried out in the same manner as in the measurement channels. The computation isperformed every scan interval.Reports can be created, displayed, and stored. Report channels and report types areset in the basic setting mode.For detail, see Chapter 11.
Computation Channels
Model Channel
RD-MV102 Channels 31 to 34 (4 channels)RD-MV104 Channels 31 to 34 (4 channels)RD-MV106 Channels 31 to 42 (12 channels)RD-MV112 Channels 31 to 42 (12 channels)
Types of ComputationsThe following types of computations can be performed.
Type Description
Four arithmetical operations Addition (+), subtraction (–), multiplication (×), and division (/)
SQR Computes the square root.
ABS Determines the absolute value.
LOG Determines the common logarithm.
EXP Determines the exponent.
Relational computation Determines <, ≤, >, ≥, =, ≠ and outputs “0” or “1.”
Logical computation Determines the AND (logical product), OR (logical sum), XOR(exclusive logical sum) of two channels, NOT (negation) of anarbitrary channel and outputs “0” or “1.”
Statistical computation (TLOG) Determines the average (AVE), maximum (MAX), minimum(MIN), and maximum - minimum (P-P) at specified timeintervals for the specified channels. You can specify theinterval.
Rolling average Determines the moving average of the computed result at scanintervals for the channel for which the equation is specified.The sampling interval and the number of samples are specifiedfor each channel. The maximum sampling interval is 1 hour, themaximum number of samples is 64. The initial setting is set sothat the rolling average is disabled.
The following elements can be used in the computing equations.
Element Description
Constants (K01 to K12) Set by the computation function.
Communication input data Set by the communication function. ⇒ “RD-MV100Communication(C01 to C12) Interface User’s Manual”
Condition of the remote Use ON/OFF (1 or 0) of the remote input signal.control terminals (D01 to D08)

1-21
Overview
of F
un
ction
s
1Report FunctionThe report function is one of the functions provided by the optional computationfunction (/M1).
This function computes the average, maximum, minimum, and sum for the specified
channels at specified intervals and writes the result to the internal memory.
You can select the report type from hourly reports only, daily reports only, daily and
monthly reports, and weekly and monthly reports. The reports are created every hour onthe hour for hourly reports, at the specified hour on the hour for daily reports (once a
day), at the specified hour on the hour on the specified day for weekly reports (once a
week), and at the specified hour on the hour on the specified date for monthly reports
(once a week).
For example, in the case of daily reports, the average, maximum, minimum, and sumover a day for the specified channels are computed at the specified time (on the hour),
and the results are acquired to the internal memory. This constitutes one report data set.
The report data residing in the memory can be displayed on the RD-MV100’s LCD (see
section 1.3, “Display Function”).
In addition, the report data residing in the internal memory can be saved to an externalstorage medium (section 1.4, “Storage Function”). Because the report data are saved to
the external storage medium in ASCII format, spreadsheet applications can be used to
view the data (see appendix 2, “Data Format of ASCII Files”).
For details related to the report function, see chapter 11.
Item Description
Report type Select from hourly reports only, daily reports only, daily andmonthly reports, and weekly and monthly reports.
Number of channels per report Up to 12 channels
Computed data Average, maximum, minimum, and sum
Number of reports that can be Up to 40acquired to the internal memory
Data format ASCII format
For a display example of report data, see section 1.3.
1.8 Computation Function and Report Function (/M1, Option)

1-22
This page intentionally left blank

1-23
Overview
of F
un
ction
s
1This page intentionally left blank

1-24
1.8 Other Functions
Key LockKey lock is a function that locks key operations, removal of the Zip disk, and the saving
of data to the external storage medium during manual save mode.
A password needs to be entered to release the key lock. For the setting and operatingprocedure, see section 10.2, and 10.1, respectively.
Items and behaviors of the key lock (can be set individually)
Item Behavior during Key Lock
START key DisabledSTOP key DisabledMENU key DisabledMEDIA key DisabledDISP/ENTER key Switching operation screens is disabled.[Alarm ACK] soft key DisabledMath (Computation)• [Math START] soft key*1 Disabled (option)• [Math STOP] soft key*1 Disabled (option)• [Math reset] soft key*1 Disabled (option)Write memory• [Message] soft key*2 Disabled• [Manual sample] soft key*2 Disabled• [Trigger] soft key*2 Disabled• [Save Display] soft key*2 Disabled• [Save Event] soft key*2 DisabledMedia (External storage medium)• During manual save Prevent Zip disk removal.
*1 Set together by [Math] parameter.*2 Set together by [Write memory] parameter.
Key Login/LogoutThis function allows only certain users to access the recorder. The users are
distinguished by their name, user IDs, and passwords. You can select whether or not to
use User IDs. In addition, you can set whether or not to allow operations in the basicsetting mode for each user. Up to 7 users can be registered.
For the setting and operating procedure, see section 10.4, and 10.3, respectively.

1-25
Overview
of F
un
ction
s
1Log DisplayA list of phenomena that occurred can be displayed in the order of occurrence for thefollowing items:
• Error messages (50 most recent messages)
• A log of key login and logout (50 most recent logins)
• A log of communication commands (200 most recent commands)
• A log of file transfers using the FTP client function (50 most recent transfers)For details related to the display format, see section 10.5.
Error log exampleDisplays the date and time of the error occurrence, error code number, and the
message.
Error messageError code
Date and time of occurrenceThe number of the log displayed at the last line of the screen / total number of logs
System ScreenThe total number of inputs on the RD-MV100, the capacity of the internal memory, the
communication functions, the external storage drive, the options, and the MAC address(Internet address) can be displayed. For details related to the display format, see
section 10.5.
Optional functions
Optional functions
Number of measurement channels*Number of computation channels
Internal memory capacity
Communication functionExternal storage medium drive
MAC address
* When the cramped input terminal is equipped (/H2, option), “C” is indicated as
“Analog: 12(C)” in this example.
Displayed LanguageThe displayed language can be set to English, Japanese, German, or French. If German
or French is selected, the following information is displayed in the specified language.
For all other information, the displays will be the same as those for English.
Locations where German or French is used• Menu used to switch the screen in the operation mode.
• Function menus in the operation mode
• Error Messages
• Operation guide screens (confirmation screen that appears when the STOP key is
pressed or the selection screen that appears when exiting the basic setting mode, forexample.).
For the setting procedure, see section 10.8.
1.8 Other Functions

1-26
FAIL/Memory End Function (Option)Operation at system failureThis function activates the relay output when the CPU fails. The relay is de-energized on
CPU failure. The relay is de-energized if the CPU fails. This relay action cannot be
reversed to “energized on failure” and thus this relay is de-energized also upon power-off
(including a power failure).
• Relay behavior (de-energized on failure)
NO C NC
Normal
NO C NC
Failure
NO C NC
Power-off
NO, C, and NC denote normally-opened, common, and normally closed, respectively.
Operation at memory endThis function activates the relay output when the remaining space (time) in the internalmemory or the external storage medium becomes small. The relay is energized if the
memory end is detected. The relay action cannot be reversed to “de-energized on
memory end.” When the relay is energized, save the data in the internal memory to the
external storage medium during manual save, or use another external storage medium
during auto save.The memory end detection operates as follows.
• When using auto saveWhen using auto save and the storage medium is inserted, the relay is energized
when the remaining space on the storage medium falls to 10%. At this point, the icon
of the external storage medium on the status display section on the screen turns tored from green.See section 4.2.
• When using manual save• When the type of data to be acquired is display data only or display data and event
dataWhen the remaining time for storing the display data in the internal memory falls to
the specified time, the relay is energized.
• When the type of data to be acquired is event data only
In the [Free] mode, the relay is energized when the remaining time for storing the
event data in the internal memory falls to the specified time.In the [Trigger] or [Rotate] mode, the relay is not energized. (There is no alarm
output.)
• Relay behavior (energized on memory end)
NO C NC
Normal
NO C NC
Memory end
NO C NC
Power-off
NO, C, and NC denote normally-opened, common, and normally closed, respectively.
For the setting procedure, see section 10.6.
1.8 Other Functions
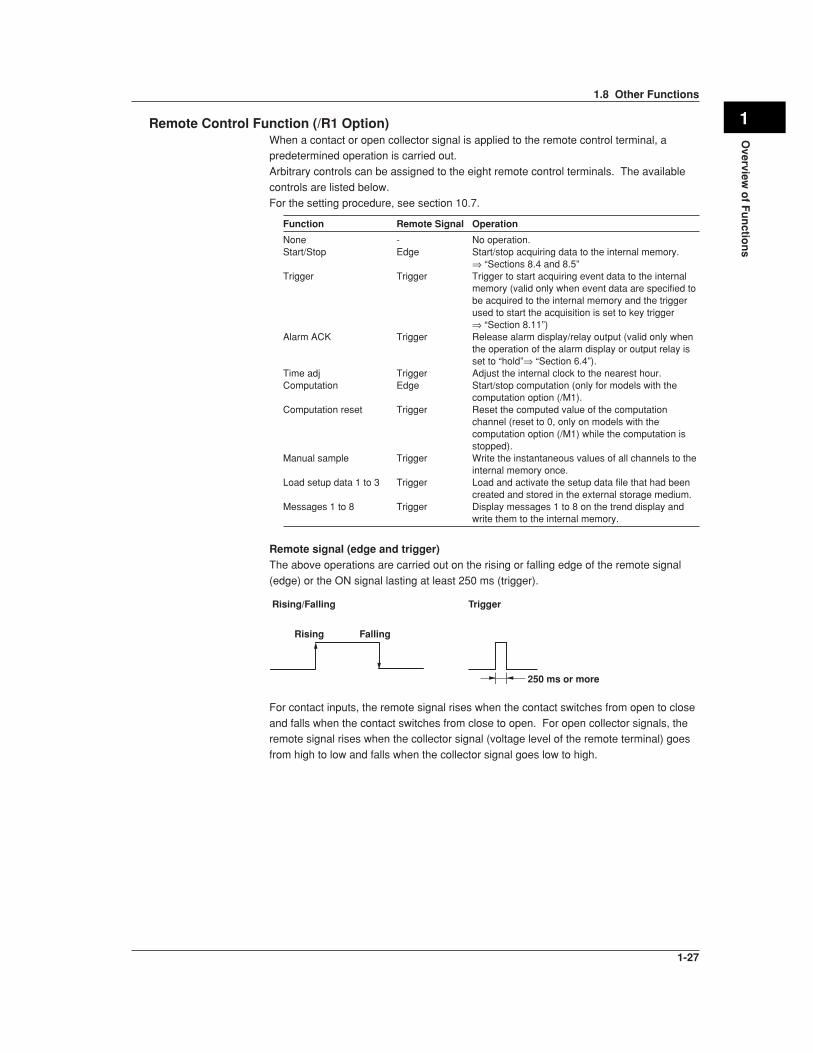
1-27
Overview
of F
un
ction
s
1Remote Control Function (/R1 Option)When a contact or open collector signal is applied to the remote control terminal, apredetermined operation is carried out.
Arbitrary controls can be assigned to the eight remote control terminals. The available
controls are listed below.
For the setting procedure, see section 10.7.
Function Remote Signal Operation
None - No operation.Start/Stop Edge Start/stop acquiring data to the internal memory.
⇒ “Sections 8.4 and 8.5”Trigger Trigger Trigger to start acquiring event data to the internal
memory (valid only when event data are specified tobe acquired to the internal memory and the triggerused to start the acquisition is set to key trigger⇒ “Section 8.11”)
Alarm ACK Trigger Release alarm display/relay output (valid only whenthe operation of the alarm display or output relay isset to “hold”⇒ “Section 6.4”).
Time adj Trigger Adjust the internal clock to the nearest hour.Computation Edge Start/stop computation (only for models with the
computation option (/M1).Computation reset Trigger Reset the computed value of the computation
channel (reset to 0, only on models with thecomputation option (/M1) while the computation isstopped).
Manual sample Trigger Write the instantaneous values of all channels to theinternal memory once.
Load setup data 1 to 3 Trigger Load and activate the setup data file that had beencreated and stored in the external storage medium.
Messages 1 to 8 Trigger Display messages 1 to 8 on the trend display andwrite them to the internal memory.
Remote signal (edge and trigger)The above operations are carried out on the rising or falling edge of the remote signal
(edge) or the ON signal lasting at least 250 ms (trigger).
Rising/Falling Trigger
Rising Falling
250 ms or more
For contact inputs, the remote signal rises when the contact switches from open to close
and falls when the contact switches from close to open. For open collector signals, theremote signal rises when the collector signal (voltage level of the remote terminal) goes
from high to low and falls when the collector signal goes low to high.
1.8 Other Functions

1-28
Daylight Savings Time• When the specified time is reached at which the daylight savings time adjustment is to
be enabled, the recorder automatically sets the clock ahead by one hour.
(Example : If the time is set to 9 O’clock on June 1, the time is set ahead to 10 O’clock
June 1.)
• When the specified time is reached at which the daylight savings time adjustment is to
be disabled, the recorder automatically sets the clock back by one hour.(Example : If the time is set to 9 O’clock on December 1, the time is set back to 8
O’clock December 1.)
For the setting procedure, see section 10.12.
Temperature UnitThe temperature unit can be set to Celsius (°C) or Fahrenheit (°F). This applies to all 8.4
and 8.5channels.
For the setting procedure, see section 10.13.
1.8 Other Functions

2-1
Befo
re Usin
g th
e Reco
rder
2
Chapter 2 Before Using the Recorder
2.1 Precautions on the Use of the Recorder
Read the following precautions before using the recorder and the external storage
medium (floppy disk, zip disk, ATA flash memory card).
Handling Precautions• Use care when cleaning the recorder, especially any plastic parts. When cleaning,
wipe with a dry, soft cloth. Do not use chemicals such as benzene or thinner, since
these may cause discoloring and deformation.
• Keep electrically charged objects away from the instrument as this may cause
malfunction.
• Do not apply volatile chemicals to the LCD monitor or panel keys. Do not allow rubber
and vinyl products to remain in contact with the recorder for long periods of time. This
may damage the recorder.
• Do not apply shock to the recorder.
• When not in use, make sure to turn OFF the power switch.
• If there are any symptoms of trouble such as strange odors or smoke coming from the
recorder, immediately turn OFF the power and unplug the power cord. Then, contact
your nearest Omega.
CAUTIONDon’t put any weight on the recorder while it is in reclined position with its front
feet up, as it may damage the feet .
Handling Precautions of External Storage Media• Take special care in handling external storage media as they are delicate products.
For general precautions, see the instruction manual that came with the externalstorage medium.
• Floppy disks and Zip disks may not operate properly under high or low temperatureenvironment. If you are using the recorder in a low-temperature environment (less
than 10°C), let the recorder warm-up for at least 30 minutes beforehand.
• If you are using them in a high-temperature environment (greater than 40°C), we
recommend the external storage medium be inserted into the drive when saving the
data and be removed after the data have been saved (manual save, see section 8.4.)
• Remove the external storage medium from the drive when turning ON/OFF the
recorder.
• Do not remove the external storage medium while the access lamp is lit. Doing so
can destroy the data on the medium.
CAUTIONDon’t expose the floppy disk drive or zip drive to vibration or shocks, as it may
damage the drives.

2-2
2.2 Installing the Recorder
Installation LocationInstall the recorder in a location that meets the following conditions. See also the normal
operating conditions described in section 14.7, “General Specifications.”
CAUTIONFor safety reasons, don't mount the recorder with the back panel downwards.
• Well-ventilated locationTo prevent overheating, install the recorder in a well-ventilated location. A space of
50 mm or more from the right, left and top surface of the recorder is recommended.
• Minimum mechanical vibrationsChoose an installation location with the minimum mechanical vibration.
• HorizontalInstall the recorder horizontally. (However, the recorder can be reclined up to 30
degrees when the front feet are up.)
Note• Condensation may occur if the instrument is moved to another place where both the ambient
temperature and humidity are higher, or if the temperature changes rapidly. In addition,
measurement errors will result when using thermocouples. In this case, let the instrument
adjust to the new environment for at least one hour before using the instrument.
• The lifetime of the LCD may be shortened if the recorder is used in a high-temperature
environment over a long period of time. When installing the recorder in a high-temperature
environment (greater than 40°C), we recommend the backlight brightness of the LCD be set
to a low setting. For setting the LCD brightness, see section 7.14.
Do not install the instrument in the following places :
• In direct sunlight or near heat sourcesInstall the recorder in a place with small temperature fluctuations near roomtemperature (23°C). Placing the instrument in direct sunlight or near heat sources
can cause adverse effects on the internal circuitry.
• Where an excessive amount of soot, steam, moisture, dust, or corrosive gasesare presentSoot, steam, moisture, dust, and corrosive gases will adversely affect the recorder.Avoid such locations.
• Near strong magnetic field sourcesDo not bring magnets or instruments that produce electromagnetic fields close to the
recorder. Operating the recorder in strong magnetic fields can cause errors in the
measurements.• Bad angle for viewing the screen
Because the recorder uses a 5.5" TFT color LCD, it is difficult to view the display from
an extreme angle. Please install the recorder so that the monitor can be viewed from
the front.

2-3
Befo
re Usin
g th
e Reco
rder
2
2.3 Input Signal Wiring
CAUTIONIf a strong tension is applied to the cable wired to the recorder, the terminals of
the recorder and/or the cable can be damaged. In order to prevent tension from
being applied directly on the terminals, fasten all wiring cables to the rear of themounting panel.
Precautions to be taken while WiringTake the following precautions when wring the input signal cables.
• It is recommended that crimp-on lugs (designed for 4 mm screws) withinsulation sleeves be used on the lead wire ends for the optional screwterminals (suffix code /H3).
Crimp-on lug
• Take measures to prevent noise from entering the measurement circuit.• Move the measurement circuit away from the power cable (power circuit) and
ground cable.• It is desirable that the item being measured does not generate noise. However, if
this is unavoidable, isolate the measurement circuit from the item. Also, ground theitem being measured.
• Shielded wires should be used to minimize noise caused by electrostatic induction.Connect the shield to the earth ground terminal of the recorder as necessary (makesure you are not grounding at two points).
• To minimize noise caused by electromagnetic induction, twist the measurementcircuit wires at short, equal intervals.
• Make sure to earth ground the earth ground terminal through minimum resistance(100 Ω).
• When using internal reference junction compensation on the thermocoupleinput, take measures to stabilize the temperature at the input terminal.• Always use the input terminal cover.• Do not use thick wires which may cause large heat dissipation (cross sectional
area 0.5 mm2 or less recommended).• Make sure that the air temperature remains reasonably stable. Large temperature
fluctuations can occur if a nearby fan turns ON or OFF.
• Connecting the input wires in parallel with other devices can cause signaldegradation, affecting all connected devices.If you need to make a parallel connection, then• Turn the burnout function OFF. (See section 5.9)• Ground the instruments to the same point.• Do not turn ON or OFF another instrument during operation. This can have
adverse effects on the other instruments.• RTDs cannot be wired in parallel.

2-4
WARNINGTo prevent electric shock, ensure the main power supply is turned OFF.
CAUTION• Do not apply input signals that exceed the following values. This can damage
the recorder.
• Maximum input voltageVoltage range of 2 VDC or less or thermocouples : ±10 VDC
Voltage range between 6 and 20 VDC : ±30 VDC
• Maximum common mode noise voltage
250 VACrms (50/60 Hz)
• This recorder is an INSTALLATION CATEGORY II product.
Wiring Procedure1. Turn OFF the recorder and remove the input terminal cover.
2. Connect the input signal wires to the input terminals.
3. Replace the input terminal cover and fasten it with screws.
NoteThe terminal block itself can be removed by loosening the two screws at the top left and
bottom right of the terminal block. This makes wiring work easier. To prevent bad contacts,
make sure to securely tighten the screws after wiring.
Loosen screw
Loosen screw
2.3 Input Signal Wiring
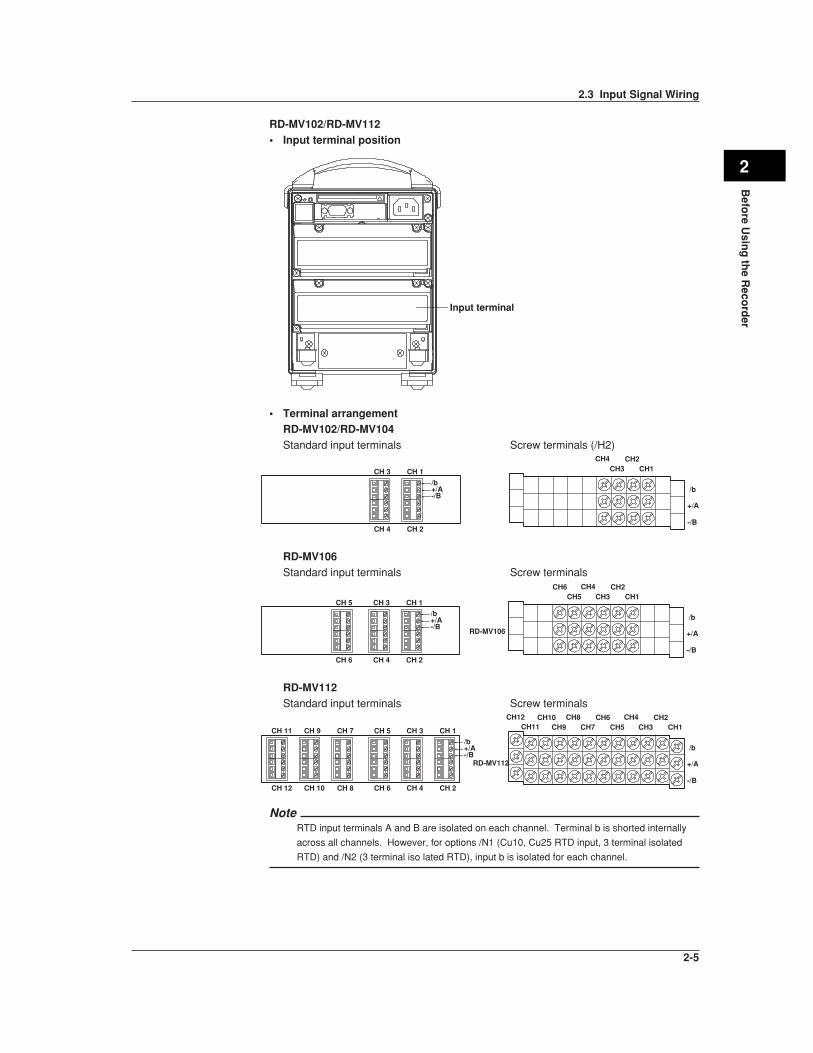
2-5
Befo
re Usin
g th
e Reco
rder
2
RD-MV102/RD-MV112• Input terminal position
Input terminal
• Terminal arrangementRD-MV102/RD-MV104Standard input terminals Screw terminals (/H2)
+/A
/b
CH1CH2
CH3CH4
-/B
CH 3 CH 1
CH 4 CH 2
/b+/A-/B
RD-MV106Standard input terminals Screw terminals
+/A
/b
CH1CH2
CH3CH4
CH5CH6
-/B
CH 5 CH 3 CH 1
/b+/A-/B
CH 6
RD-MV106
CH 4 CH 2
RD-MV112Standard input terminals Screw terminals
+/A
/b
CH1CH2
CH3CH4
CH5CH6
CH7CH8
CH9CH10
CH11CH12
-/B
RD-MV112
CH 5 CH 3 CH 1
/b+/A-/B
CH 6 CH 4 CH 2
CH 11 CH 9 CH 7
CH 12 CH 10 CH 8
NoteRTD input terminals A and B are isolated on each channel. Terminal b is shorted internally
across all channels. However, for options /N1 (Cu10, Cu25 RTD input, 3 terminal isolated
RTD) and /N2 (3 terminal iso lated RTD), input b is isolated for each channel.
2.3 Input Signal Wiring

2-6
• Wiring diagram
A
B
b
A
bB
DC Voltage and DI (Contact) Input
DC voltage input
Thermocouple Input
Resistance Temperature Detector Input DC Current Input
DC current input
Shunt resistorNOTE : For a 4 to 20 mA input, use a
shunt resistor of 250 Ω ±0.1%.Leadwire resistance : 10 Ω max./wireThe resistance of the three wires should be approximately equal.
Extension leadwire
–
+
–
+
–
+
–
+
–
+
2.3 Input Signal Wiring

2-7
Befo
re Usin
g th
e Reco
rder
2
2.4 Alarm Output Wiring (/A1 to /A3, Option)
WARNING• To prevent electric shock, ensure the main power supply is turned OFF.• If a voltage of more than 30 VAC or 60 VDC is to be applied to the alarm output
terminal, use ring-tongue crimp-on lugs with insulation sleeves on all terminals
to prevent the wires from slipping out when the screws become loose.
Furthermore, use double-insulated wires (dielectric strength of 2300 VAC or
more) for the signal wires on which a voltage of more than 30 VAC or 60 VDC isto be applied. For all other wires, use basic insulated wires (dielectric strength
of 1350 VAC). To prevent electric shock, attach the terminal cover after wiring
and make sure not to touch the terminals.
Wiring Procedure1. Turn OFF the recorder and remove the cover for the option terminal.
2. Connect the alarm output wires to the terminal.The terminal arrangement will be one of the figures shown below depending on
the alarm output relay option (number of outputs) and the /F1 option.
3. Replace the terminal cover and fasten it with screws.
NoteThe option terminal block itself can be removed by loosening the two screws at the top left
and bottom right of the terminal block. This makes wiring work easier. To prevent bad
contacts, make sure to securely tighten the screws after wiring.
Loosen screw
Loosen screw

2-8
Alarm terminal positionEnclosed in parentheses are the relay numbers assigned to each option terminal.
Option terminal
Terminal arrangement (only the position of the alarm output terminals isindicated.)When the relay is not energized, NC is closed and NO is open. C is the common
terminal.
/A1, /A1/F1
/A2, /A2/F1
/A3, /A3/R1
Contact Specifications
Item Specification
Output type Relay transfer contact (energize/de-energize switchable)
Output capacity 250 VAC (50/60 Hz), 3 A250 VDC, 0.1 A (resistive load)
Dielectric strength 1500 VAC (50/60 Hz) for one minute between output terminals andearth ground terminal
For details related to the switching of energized/de-energized state of the alarm relays,see section 6.4.
2.4 Alarm Output Wiring (/A1 to /A3, Option)

2-9
Befo
re Usin
g th
e Reco
rder
2
2.5 FAIL/Memory End Wiring (/F1, Option)
WARNING• To prevent electric shock, ensure the main power supply is turned OFF.• If a voltage of more than 30 VAC or 60 VDC is to be applied to the FAIL/Memory
End output terminal, use ring-tongue crimp-on lugs with insulation sleeves on all
terminals to prevent the wires from slipping out when the screws become loose.
Furthermore, use double-insulated wires (dielectric strength of 2300 VAC or
more) for the signal wires on which a voltage of more than 30 VAC or 60 VDC isto be applied. For all other wires, use basic insulated wires (dielectric strength
of 1350 VAC). To prevent electric shock, attach the terminal cover after wiring
and make sure not to touch the terminals.
Wiring Procedure1. Turn OFF the recorder and remove the cover for the option terminal.
2. Connect the FAIL/Memory End output wires to the terminal.
The terminal arrangement for the FAIL/Memory End output option is as follows.
Terminal position
Option terminal
Terminal arrangement (only the position of the FAIL/Memory end outputterminals is indicated.)When the relay is not energized, NC is closed and NO is open. C is the commonterminal.
3. Replace the terminal cover and fasten it with screws.
Note• The option terminal block itself can be removed by loosening the two screws at the top left
and bottom right of the terminal block. This makes wiring work easier. To prevent bad
contacts, make sure to securely tighten the screws after wiring.
• FAIL output is a de-energize relay, and the Memory End output is an energize relay.
2-10
Contact Specifications
Item Specification
Output type Relay transfer contact
Output capacity 250 VAC (50/60 Hz), 3 A250 VDC, 0.1 A (resistive load)
Dielectric strength 1500 VAC (50/60 Hz) for one minute between output terminals andearth ground terminal
For details related to the FAIL/Memory End output, see section 1.8.
2.5 FAIL/Memory End Wiring (/F1, Option)
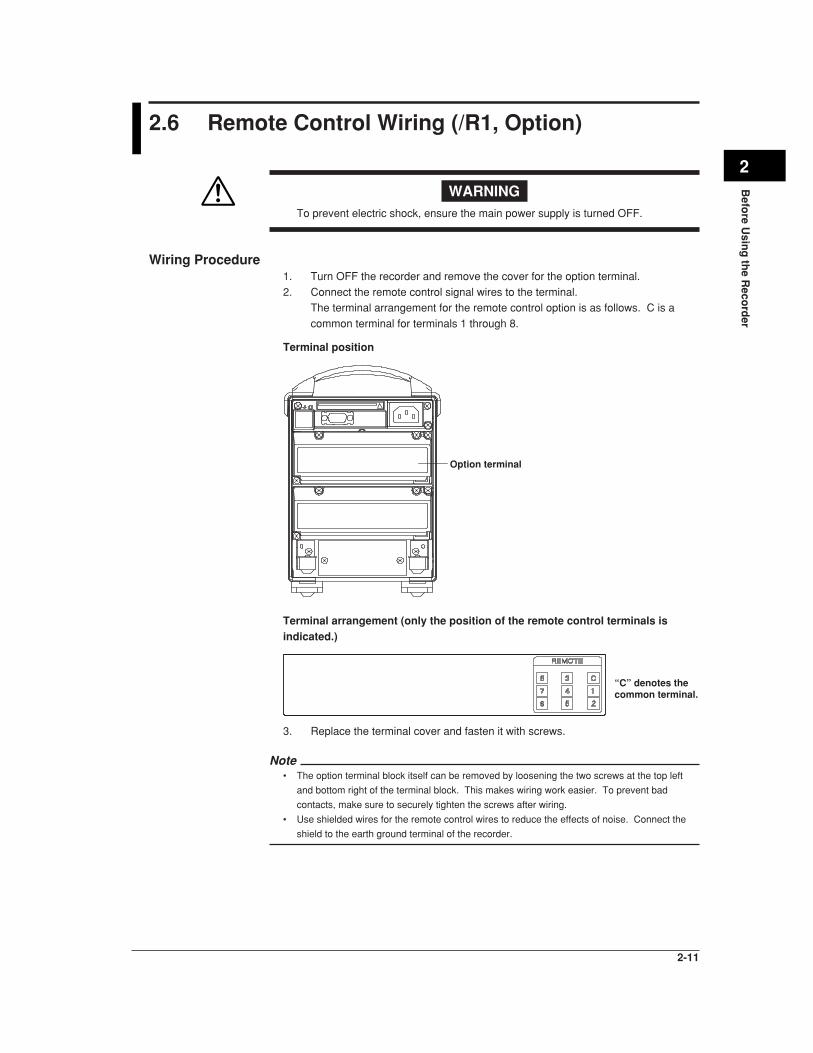
2-11
Befo
re Usin
g th
e Reco
rder
2
2.6 Remote Control Wiring (/R1, Option)
WARNINGTo prevent electric shock, ensure the main power supply is turned OFF.
Wiring Procedure1. Turn OFF the recorder and remove the cover for the option terminal.
2. Connect the remote control signal wires to the terminal.The terminal arrangement for the remote control option is as follows. C is a
common terminal for terminals 1 through 8.
Terminal position
Option terminal
Terminal arrangement (only the position of the remote control terminals isindicated.)
“C” denotes the common terminal.
3. Replace the terminal cover and fasten it with screws.
Note• The option terminal block itself can be removed by loosening the two screws at the top left
and bottom right of the terminal block. This makes wiring work easier. To prevent bad
contacts, make sure to securely tighten the screws after wiring.
• Use shielded wires for the remote control wires to reduce the effects of noise. Connect the
shield to the earth ground terminal of the recorder.
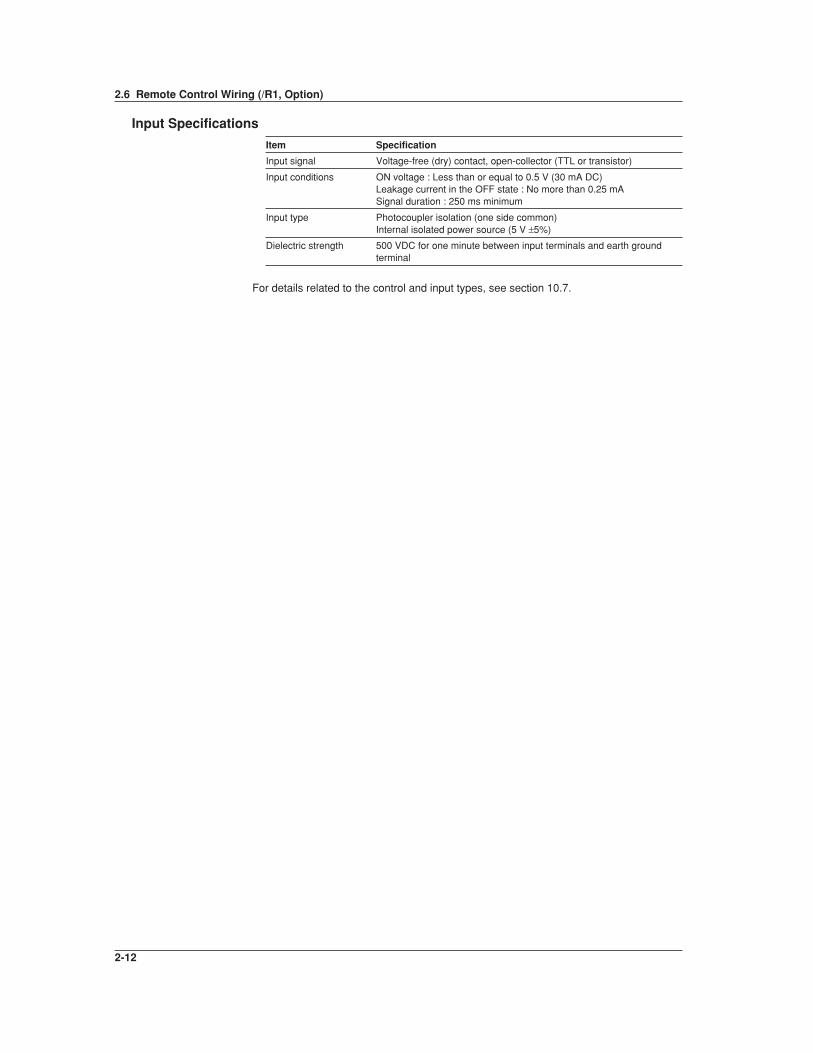
2-12
Input Specifications
Item Specification
Input signal Voltage-free (dry) contact, open-collector (TTL or transistor)
Input conditions ON voltage : Less than or equal to 0.5 V (30 mA DC)Leakage current in the OFF state : No more than 0.25 mASignal duration : 250 ms minimum
Input type Photocoupler isolation (one side common)Internal isolated power source (5 V ±5%)
Dielectric strength 500 VDC for one minute between input terminals and earth groundterminal
For details related to the control and input types, see section 10.7.
2.6 Remote Control Wiring (/R1, Option)

2-13
Befo
re Usin
g th
e Reco
rder
2
2.7 Power Supply Wiring
This section describes how to connect the power supply cable. Make sure to read this
section before wiring the power supplly cables.
100 to 120 VAC/200 to 240 VAC Power Supply ModelPrecautions to be taken when wiring the power supplyTo prevent electric shock and damage to the recorder, observe the following warnings.
WARNING• Confirm that the supply voltage meets the rated power supply voltage before
connecting the cable.• Confirm that the power is turned OFF before connecting the power cord.
• To prevent electric shock and the possibility of fire, use only the power cord that
is supplied by Omega.
• Always use protective earth terminal to prevent electric shock. Connect the
power cord to a three-pole power outlet that has a protective earth terminal.• Never use an extension cord that does not have protective earth terminal,
otherwise the protection function will be compromised.
Use a power supply that meets the following conditions:
Item Conditions
Rated power supply 100 to 240 VACAllowable power supply voltage range 90 to 132 or 180 to 264 VACRated power supply frequency 50/60 HzAllowable power supply frequency range 50/60 Hz±2%Maximum power consumption 38 VA(100 V), 53 VA(240 V)
NoteDo not use a supply voltage in the range 132 to 180 VAC, as this may have adverse effects
on the measurement accuracy.
• Connection procedure1. Check that the recorder is turned OFF.
2. Connect the power cable (supplied with the recorder) to the power connector onthe rear panel of the recorder.
3. Connect the other end of the power cord to a socket that meets the
requirements.

2-14
12 VDC Power Supply ModelUsing AC adapterFollow the warnings below to avoid electric shock or damaging the instrument.
WARNING• Connect the power wires after checking that the power supply is turned off to
prevent electric shock.
• To prevent electric shock or fire, always use the power cable supplied by
Omega.
• Before connecting the power cord, check that the voltage on the supply side
matches with the voltage rating of this recorder.• When not using the instrument for a long time, unplug the power cord of the AC
adapter.
• Only use the AC adapter from Omega (Part No.: B9230ZW).
• Do not put objects on top of the AC adapter or the power cord. Also, do not let
heat generating objects come in contact with them.• When unplugging the power cord, do not pull on the power cord. Always hold
the plug. If the power cord becomes damaged, contact your nearest
representative listed on the back cover of this manual.
Connecting Procedure1. Check that the power switch is turned OFF.
2. Connect the AC adapter to the AC adapter jack on RD-MV100.
Install the clamp filter (standard accessory) near RD-MV100 of power cord.
3. Connect the power cord plug that came with the AC adapter to the power supplyconnector of the AC adapter.
4. Connect the plug on the other end of the power cord to a power outlet meeting the
following specifications.
The power outlet should be a three-pole type with a protective grounding terminal.
Rated power supply voltage: 100 to 240 VAC
Operating supply voltage range: 90 to 250 VAC
Rated supply voltage frequency: 50/60 Hz
Maximum power consumption: 90 VAAC adapter rated output voltage: 12 VDC
AC adapter maximum rated output current: 2.6 A
Functional groundingWhen using the AC adapter, noise may be reduced if the functional ground is connectedto the earth GND. Use the functional ground terminal as necessary.
2.7 Power Supply Wiring

2-15
Befo
re Usin
g th
e Reco
rder
2
2.7 Power Supply Wiring
Using the accessory DC power terminal connectorFollow the warnings below to avoid electric shock or damaging the instrument.
WARNING• Connect the power wires after checking that the power supply is turned off to
prevent electric shock.• To prevent fire, use wires with cross sectional area of 0.3mm2(22AWG) or
more.
Connecting procedure1. Check thst the power switch is turned off.
2. Connect the accessory DC power terminal connector (part No. A1105JC) to the power
wire and the DC100/DS400/DS600. Use a power wire with a cross sectional area of
0.3 mm2 (22AWG) or more.
Install the clamp filter (standard accessory) near DC100 of power wire.
21
Soldering
-(0 VDC)
+(10 to 18 VDC)
Rated supply voltage: 12 VDC
Operating supply voltage:10 to 18 VDC
Power consumption: About 30 VA max.

3-1
Nam
es of P
arts/Ru
n M
od
e/Co
mm
on
Op
eration
s
3
Chapter 3 Names of Parts/Run Mode/Common Operations
3.1 Names of Parts and Functions
Front Panel
MEDIA FUNC ESC MENUSTART STOP
DISP/ENTER
1
23
4 5 6 78 9
10
1. LCD screen
Displays various operation screens such as the trend display and the setup screen
to configure the recorder.
2. DISP/ENTER key
Displays and confirms the settings for switching screens in the operation mode.
3. Arrow keys
Used to select the screen in the operation mode and to select the parameter.4. START key
Used to start the data acquisition to the internal memory and display the waveformon the trend display. Also starts computation and the report function when thecomputation function (/M1) is equipped.
5. STOP keyUsed to stop the data acquisition to the internal memory. It also stops the updatingof the waveform on the trend display. If the model has the optional computationfunction (/M1), the report is stopped. For computation, you can select whether or notto stop the operation when the STOP key is pressed.
6. ESC keyUsed to cancel an operation. Also used to return to the operation mode from thesetting mode (This function is the same as the MENU key).
7. MENU keyUsed to enter the setting mode. Also used to return to the operation mode from thesetting mode (This function is the same as the ESC key).

3-2
8. MEDIA keyDetects the external storage medium and saves internal memory data to the externalstorage medium.
9. FUNC keyUsed to execute various functions in the operation mode. Also, used to enter thebasic setting mode from the setting mode.
10. Soft keysWhen the FUNC key is pressed, the functions are assigned to the soft keys anddisplayed at the bottom of the screen.During the setting/basic setting modes, the parameters are assigned to the soft keysand displayed at the bottom of the screen.
START STOP USER FUNC ESC MENU
DISP/ENTER
START STOP USER FUNC ESC MENU
DISP/ENTER
START STOP USER FUNC ESC MENU
DISP/ENTER
14 12 13 12 13 12 13
with ATA flash memory card drive
with floppy disk drive with Zip drive
11. Power switchUsed to turn the power ON/OFF.
12. Storage medium driveFloppy disk drive, Zip drive, or ATA flash memory card drive depending on thespecification.
13. Eject button (access lamp for Zip drive)Used when ejecting the storage medium. Also is the access lamp for the Zip drive.The access lamp is lit while the Zip disk is being accessed.
14. Access lamp for the flopppy disk driveThe access lamp is lit while the floppy disk is being accessed.
3.1 Names of Parts and Functions

3-3
Nam
es of P
arts/Ru
n M
od
e/Co
mm
on
Op
eration
s
3
Rear Panel
3 (RS-422A/RS-485)1 (AC power supply)2 3 (RS-232)
4
5
1 (12 VDCpower supply)
1. Power terminalsConnect the power cord.
2. Ethernet portConnect the Ethernet cable (10Base-T).
3. Serial interface portRS-232 port or RS-422-A/485 port depending on the specification. Connect the
serial interface cable.4. Input terminals
Connect the input signal cable of the item being measured.
5. Option terminalsConnect optional input/output signal cables.
NoteSee “RD-MV100 Communication interface user’s manual” to use Ethernet port and the serial
interface port.
Desktop Type1. Carrying handle2. Foot
1
2
3.1 Names of Parts and Functions

3-4
3.2 Turning ON/OFF the Power Switch
This section describes the procedures to turn ON/OFF the power switch.
Procedure1. Check the following points before turning ON the power switch.
• The power cord/wires are connected correctly to the recorder.
• The recorder is connected to the correct power supply. (See section 14.7)• The proper fuse is set.
CAUTIONIf the input wires are connected in parallel with another instrument, avoid turning
ON/OFF the recorder or the other instrument when either one is in operation.This may affect the reading.
2. Turn the power switch ON.
After performing a self-diagnosis for a few seconds, a screen in the operationmode appears.
Note• If nothing is displayed when the power switch is turned ON, turn OFF the power switch and
check the points listed in step 1. After checking the points, turn ON the power switch again.
If the unit still does not work, it is probably malfunctioning. Contact Omega for repairs.
• If an error message is displayed on the screen, take measures according to the description in
chapter 12, “Troubleshooting.”
• Turn ON the power switch, let the RD-MV100 warm up for at least 30 minutes, and then start
the measurements.
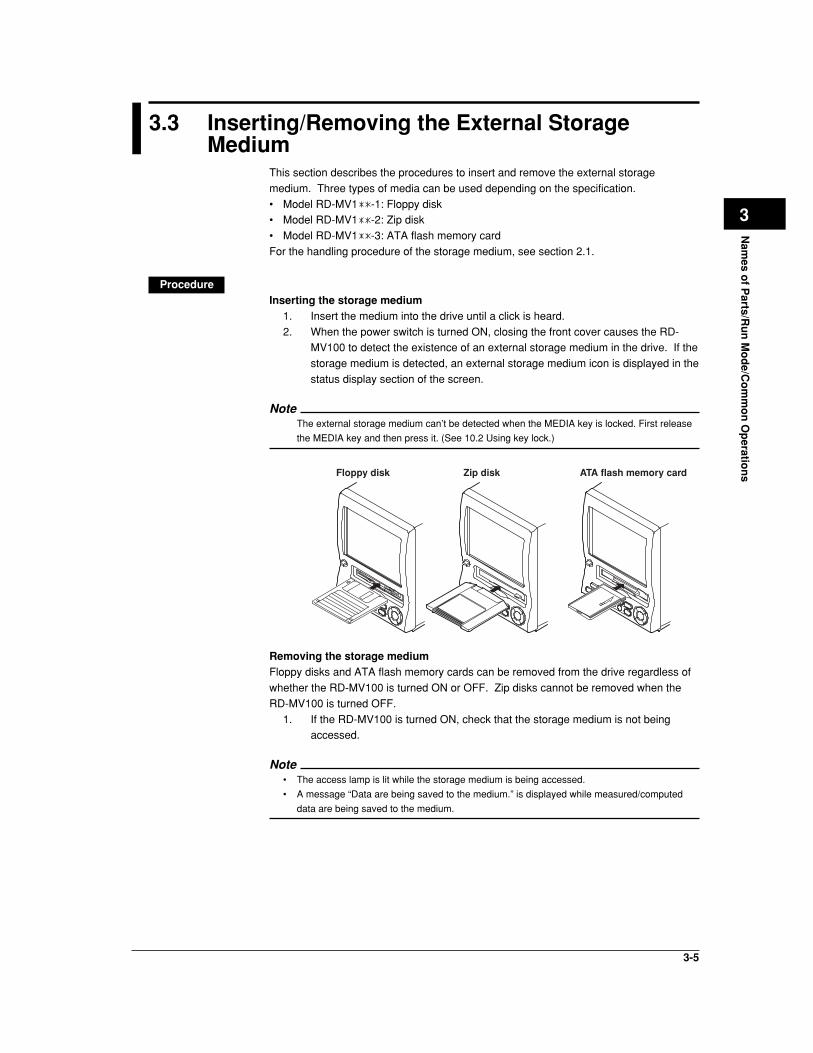
3-5
Nam
es of P
arts/Ru
n M
od
e/Co
mm
on
Op
eration
s
3
3.3 Inserting/Removing the External StorageMedium
This section describes the procedures to insert and remove the external storage
medium. Three types of media can be used depending on the specification.
• Model RD-MV1 -1: Floppy disk• Model RD-MV1 -2: Zip disk
• Model RD-MV1 -3: ATA flash memory card
For the handling procedure of the storage medium, see section 2.1.
ProcedureInserting the storage medium
1. Insert the medium into the drive until a click is heard.
2. When the power switch is turned ON, closing the front cover causes the RD-MV100 to detect the existence of an external storage medium in the drive. If the
storage medium is detected, an external storage medium icon is displayed in the
status display section of the screen.
NoteThe external storage medium can’t be detected when the MEDIA key is locked. First release
the MEDIA key and then press it. (See 10.2 Using key lock.)
Floppy disk Zip disk ATA flash memory card
Removing the storage mediumFloppy disks and ATA flash memory cards can be removed from the drive regardless of
whether the RD-MV100 is turned ON or OFF. Zip disks cannot be removed when the
RD-MV100 is turned OFF.
1. If the RD-MV100 is turned ON, check that the storage medium is not beingaccessed.
Note• The access lamp is lit while the storage medium is being accessed.
• A message “Data are being saved to the medium.” is displayed while measured/computed
data are being saved to the medium.

3-6
2. Open the front cover by pressing down on the knob that is located in the center
of the upper section of the cover and pulling forward. Push the eject button toremove the storage medium.
3. Close the front cover. If the RD-MV100 is turned ON, the external storage
medium icon in the status display section disappears (see the figure of the icon
on the previous page).
Floppy disk Zip disk ATA flash memory card
NoteIf the key lock function for the storage medium is engaged, the Zip disk cannot be ejected
even if the eject button is pressed. Release the key lock before attempting to eject the Zip
disk.
Procedure when the Zip disk cannot be ejectedIf the Zip disk cannot be removed by performing the steps given in the “Removing the
storage medium” section, carry out the following steps to remove it.
1. Open the front cover by pressing down on the knob that is located in the centerof the upper section of the cover and pulling forward.
2. Insert a pin of approx. 1 mm in diameter into the eject button hole and press
slowly. This will cause the Zip disk to be ejected.Eject button of the Zip drive
Pin Insert
Zip disk eject hole
ExplanationFormatting external storage mediaFormat the external storage medium before use.
The external storage medium is formatted to the following types using the recorder.
Format type
Floppy disk : 2 HD, 1.44 MB
Zip disk : FDISK 1 partition (hard disk format)
ATA flash memory card : FDISK 1 partition (hard disk format)
External storage media formatted on other devices can be used as long as the format
type is the same as those indicated above.
3.3 Inserting/Removing the External Storage Medium

3-7
Nam
es of P
arts/Ru
n M
od
e/Co
mm
on
Op
eration
s
3
3.4 Run Mode
There are three run modes on the recorder : operation, setting, and basic setting. This
section describes the functions and relationships of the three modes.
Mode TypesMode typesPower ON
Setting mode Basic setting mode
MENU
Menu screen
Operation screens
Operation mode
Setting screens Setting screens
Menu screen
MENU or ESC
Pressing FUNCfor 3 seconds
Soft key MENU orESC
Soft key ESC
[END] soft key - DISP/ENTER
Mode Type Description Possible Operations
Operation mode This mode is used for daily operation. Monitoring operationThis mode is entered when the power Data acquisitionis turned ON.
Setting mode This mode is used to configure the Setting the operationrecorder operation such as input Operation related to the file onrange and alarms. the external storage mediumThis mode is entered by pressing theMENU key in the operation mode.Measured data cannot be displayed inthis mode.Operations such as measurements,alarm detection, and data acquisitionare continued.
Basic setting mode This mode is used to configure the Basic settings of the functions(Setup mode) basic environment of the recorder Operation related to the file on
such as the input format and the data the external storage mediumstorage format.This mode is entered by pressing theFUNC key for three seconds at thesetting mode menu. This mode cannotbe entered while data acquisition orcomputation is in progress.Operations such as measurements,alarm detection, and data acquisitionare stopped.

3-8
Functions and Operations in the Operation ModeOperation screenDisplays various operation screens such as trend, digital, bar graph, alarm summary,
message summary, memory summary, historical trend, and report display (option).
Screens are switched by the arrow keys and the DISP/ENTER key. See chapter 4.
Operations using the FUNC keyPressing the FUNC key displays a menu that is assigned to the soft keys at the bottom
of the screen. The menu varies depending on the setup information and options. Press
the [Next] soft key to display the soft key menu in the next line.
The function is executed by pressing the soft key. Press the FUNC or ESC key to erase
the menu without executing the assigned function.
FUNC key menu
Menu Ref. Section Description
Alarm ACK 6.1, 6.4 Release alarm indication and relay output (whenalarm display and alarm output relay action is setto “hold.”)
Message 7.4 Displays messages and stores them to the internalmemory.
Manual sample 8.12 Stores instantaneous values of all channels to theinternal memory.
Key lock 10.1 Enables or disables key lock.(when key kock is in use)
Logout 10.3 Logout(when being logged in while key login is in use)
Trigger 8.6, 8.11 Starts acquiring event data (when [Key Trigger] isset as a trigger to start acquiring event data)
Math START/STOP 11.3 Starts/stops computation.(when the computation function(/M1) is equipped)
Math reset 11.3 Clears computed results.(when the computation function(/M1) is equippedand the computation is suspended)
Math ACK 11.3 Clears the computation dropout display.(when the computation function(/M1) is equippedand the computation dropout occures)
Snapshot 9.6 Saves the screen image data to the externalmedium.
Log 10.5 Displays log screens or the system informationscreen.
FTP test* Execute FTP test.Save Display/Save Event 8.7 Stores the display data or event data to the
external storage medium. (only when the display data or event data(freemode) are being acquired to the internal memory).
* See RD-MV100 Communication Interface User’s Manual.
3.4 Run Mode

3-9
Nam
es of P
arts/Ru
n M
od
e/Co
mm
on
Op
eration
s
3
Other key operations• START/STOP
Start/stop acquiring measured/computed data. For the operating procedure, see
sections 8.5 and 8.6.
The waveform on the trend display also starts/stops.
When the computation function (/M1) is equiped, computation and the report function
also start/stop. For the operating procedure, see sections 11.3 and 11.12.
• MEDIADetects the external storage medium and saves the data in the internal memory to the
external storage medium in the manual save mode.
Functions of the Setting and Basic Setting ModesConfigure recorder functions using the arrow keys, the DISP/ENTER key, the soft keys,
and the character/number input keys. See “3.5 Configuring the functions” and chapters 5
through 11 for detail. Also see section 9.1 to save the setup data.
3.4 Run Mode

3-10
3.5 Configuring the Functions
Setting Mode and Basic Setting ModeBasic setting modeThe basic setting mode is used to change the basic configuration of various functions.
Basic setting mode cannot be entered while data acquisition or computation is inprogress.
Setting modeThe setting mode is used to change the functions for each channel and the display
specifications. All items except the ones listed below can be changed while dataacquisition or computation is in operation. Items that cannot be changed are grayed and
the cursor cannot be moved on them.
• Items that cannot be changed while data acquisition is in progress• Input range
• The trend’s display update rate• Auto save interval
• Computing equation
• Constants for computation
• Items that cannot be changed while computation is in progress• Range setting
• Computing equation
• Constants for computation
• TLOG timer number and computing unit

3-11
Nam
es of P
arts/Ru
n M
od
e/Co
mm
on
Op
eration
s
3
Configuration DetailsThe configuration details of the setting mode and the basic setting mode are shownbelow. Enclosed in parentheses are reference sections.
Settings related to the input
Item Setting Mode Basic Setting Mode
Scan interval • Scan interval
Input specifications • Input type(5.1 to 5.7) • Measurement range
• Upper and lower limit of span• Reference channel for differential
computation• Upper and lower limits of scale• Unit
Burnout (5.9) • Burn out Off/Up/Down
Reference junction • Switch between [Internal] andcompensation [External]
• Compensation voltage when set to[External]
Noise elimination • Filter time constant/Off (RD-MV102/• Integration time of the A/DRD-MV104) (5.8) converter (5.9)
• Number of samples for the movingaverage/Off (RD-MV106/RD-MV112) (5.8)
Settings related to the alarm
Item Setting Mode Basic Setting Mode
Alarm • Alarm type (6.2) • Display hold/non-hold (6.4)• Alarm value (6.2) • The time interval for the rate-of-• Output relay On/Off (6.2) change alarm (for measurement• Output relay number (6.2) channels only) (6.4)• Alarm delay time (6.3) • Hysteresis (for measurement
channels only) (6.4)
Alarm output relay • Reflash alarmoperation (option) • AND operation(6.4) • Relay energize/de-energize
• Relay hold/non-hold
3.5 Configuring the Functions
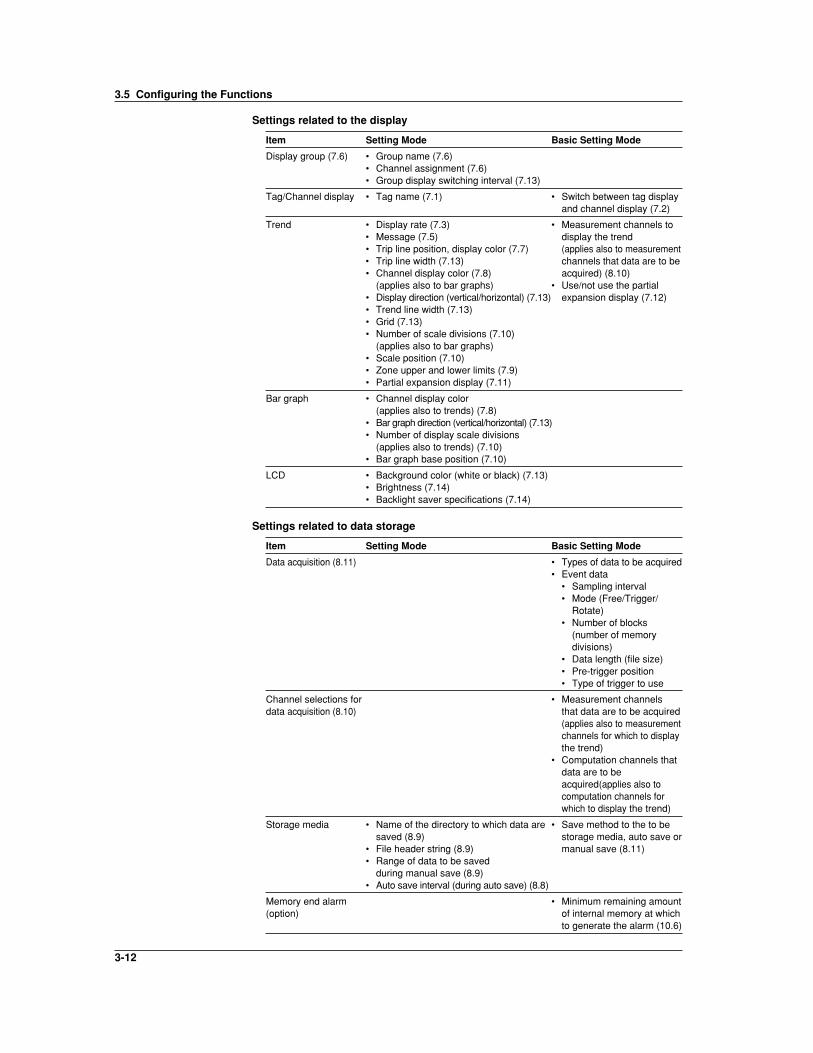
3-12
Settings related to the display
Item Setting Mode Basic Setting Mode
Display group (7.6) • Group name (7.6)• Channel assignment (7.6)• Group display switching interval (7.13)
Tag/Channel display • Tag name (7.1) • Switch between tag displayand channel display (7.2)
Trend • Display rate (7.3) • Measurement channels to• Message (7.5) display the trend• Trip line position, display color (7.7) (applies also to measurement• Trip line width (7.13) channels that data are to be• Channel display color (7.8) acquired) (8.10)
(applies also to bar graphs) • Use/not use the partial• Display direction (vertical/horizontal) (7.13) expansion display (7.12)• Trend line width (7.13)• Grid (7.13)• Number of scale divisions (7.10)
(applies also to bar graphs)• Scale position (7.10)• Zone upper and lower limits (7.9)• Partial expansion display (7.11)
Bar graph • Channel display color(applies also to trends) (7.8)
• Bar graph direction (vertical/horizontal) (7.13)• Number of display scale divisions
(applies also to trends) (7.10)• Bar graph base position (7.10)
LCD • Background color (white or black) (7.13)• Brightness (7.14)• Backlight saver specifications (7.14)
Settings related to data storage
Item Setting Mode Basic Setting Mode
Data acquisition (8.11) • Types of data to be acquired• Event data
• Sampling interval• Mode (Free/Trigger/
Rotate)• Number of blocks
(number of memorydivisions)
• Data length (file size)• Pre-trigger position• Type of trigger to use
Channel selections for • Measurement channelsdata acquisition (8.10) that data are to be acquired
(applies also to measurementchannels for which to displaythe trend)
• Computation channels thatdata are to beacquired(applies also tocomputation channels forwhich to display the trend)
Storage media • Name of the directory to which data are • Save method to the to besaved (8.9) storage media, auto save or
• File header string (8.9) manual save (8.11)• Range of data to be saved
during manual save (8.9)• Auto save interval (during auto save) (8.8)
Memory end alarm • Minimum remaining amount(option) of internal memory at which
to generate the alarm (10.6)
3.5 Configuring the Functions
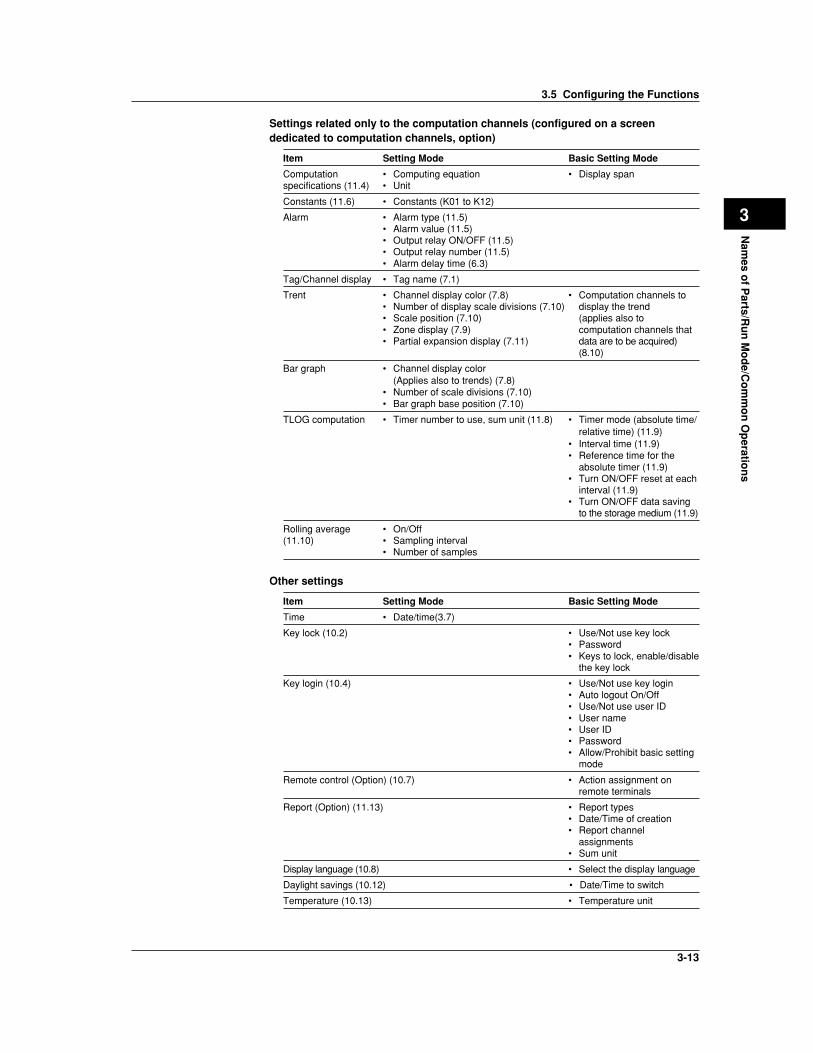
3-13
Nam
es of P
arts/Ru
n M
od
e/Co
mm
on
Op
eration
s
3
Settings related only to the computation channels (configured on a screendedicated to computation channels, option)
Item Setting Mode Basic Setting Mode
Computation • Computing equation • Display spanspecifications (11.4) • Unit
Constants (11.6) • Constants (K01 to K12)
Alarm • Alarm type (11.5)• Alarm value (11.5)• Output relay ON/OFF (11.5)• Output relay number (11.5)• Alarm delay time (6.3)
Tag/Channel display • Tag name (7.1)
Trent • Channel display color (7.8) • Computation channels to• Number of display scale divisions (7.10) display the trend• Scale position (7.10) (applies also to• Zone display (7.9) computation channels that• Partial expansion display (7.11) data are to be acquired)
(8.10)
Bar graph • Channel display color(Applies also to trends) (7.8)
• Number of scale divisions (7.10)• Bar graph base position (7.10)
TLOG computation • Timer number to use, sum unit (11.8) • Timer mode (absolute time/relative time) (11.9)
• Interval time (11.9)• Reference time for the
absolute timer (11.9)• Turn ON/OFF reset at each
interval (11.9)• Turn ON/OFF data saving
to the storage medium (11.9)
Rolling average • On/Off(11.10) • Sampling interval
• Number of samples
Other settings
Item Setting Mode Basic Setting Mode
Time • Date/time(3.7)
Key lock (10.2) • Use/Not use key lock• Password• Keys to lock, enable/disable
the key lock
Key login (10.4) • Use/Not use key login• Auto logout On/Off• Use/Not use user ID• User name• User ID• Password• Allow/Prohibit basic setting
mode
Remote control (Option) (10.7) • Action assignment onremote terminals
Report (Option) (11.13) • Report types• Date/Time of creation• Report channel
assignments• Sum unit
Display language (10.8) • Select the display language
Daylight savings (10.12) • Date/Time to switch
Temperature (10.13) • Temperature unit
3.5 Configuring the Functions

3-14
File Management and Data ClearingOperations related to the internal memory
Item Setting Mode Basic Setting Mode
Initialization of • Clear measured/computed data • Initialize settings (basicsettingsettings/data clearing in the internal memory (9.7)
mode/setting mode) and clearmeasured/computed data in theinternal memory (9.8)
Management of files on the external storage media
Item Setting Mode Basic Setting Mode
File management • Save setup data (9.1) • Save setup data (9.1)• Load setup data (9.1) • Load setup data (9.1)• Save measured data with key • Delete files (9.5)
operation (9.2) • Format external storage media (9.5)• Load/display display data (9.3)• Load/display event data (9.4)• List filesz (9.5)• Delete files (9.5)• Format external storage media (9.5)
The Menu Screen and Items of the Setting ModeThe menu screen and items of the setting mode are as follows. Enclosed in parentheses
are reference sections. [Math set1], [Math set2], [Math set3] are displayed when the
computational function(/M1) is equipped.
To [Display] menu on the next page
To [Save/Load, Clear data] menu on the next page
3.5 Configuring the Functions

3-15
Nam
es of P
arts/Ru
n M
od
e/Co
mm
on
Op
eration
s
3
[Display] menu
[Save/Load, Clear data] menu
Soft key Settings in the Setting ModeTitle Item
#1 Range (5.1 to 5.7) Input typeMeasurement rangeUpper and lower limits of spanReference channel for difference computationUpper and lower limits of scaleUnit
Alarm (6.2) Alarm typeAlarm valueOutput relay On/OffOutput relay number
#2 Tag (7.1) Tag nameFilter (5.8) Filter time constant/Off (RD-MV102/RD-MV104)Moving avarage (5.8) Number of samples for the moving average/Off
(RD-MV106/RD-MV112)Alarm delay time (6.3)
#3 Trend/Save interval Trend display rate (7.3)Auto save interval (8.8)
#4 Message (7.5) Message string
#5 Display
#5 - #1 Group set/Trip line Group name (7.6)Assign channels to groups (7.6)Trip line position, display color (7.7)
#5 - #2 Color (7.8) Measurement channel display color
3.5 Configuring the Functions
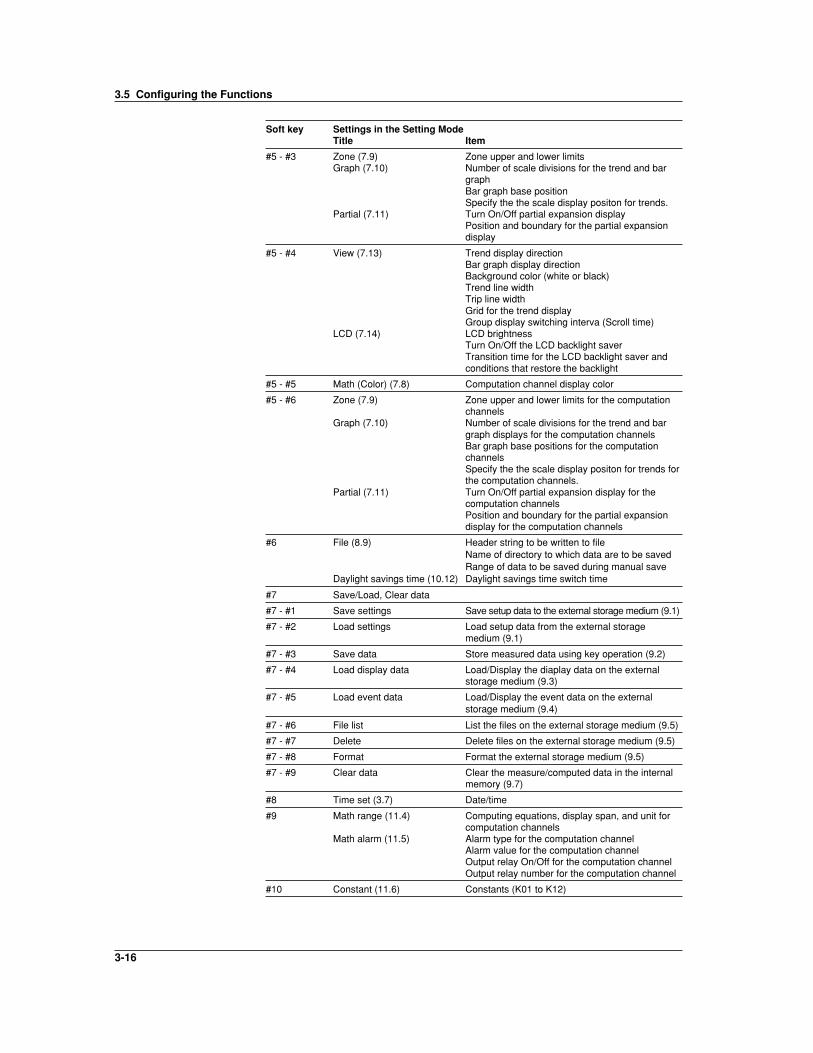
3-16
Soft key Settings in the Setting ModeTitle Item
#5 - #3 Zone (7.9) Zone upper and lower limitsGraph (7.10) Number of scale divisions for the trend and bar
graphBar graph base positionSpecify the the scale display positon for trends.
Partial (7.11) Turn On/Off partial expansion displayPosition and boundary for the partial expansiondisplay
#5 - #4 View (7.13) Trend display directionBar graph display directionBackground color (white or black)Trend line widthTrip line widthGrid for the trend displayGroup display switching interva (Scroll time)
LCD (7.14) LCD brightnessTurn On/Off the LCD backlight saverTransition time for the LCD backlight saver andconditions that restore the backlight
#5 - #5 Math (Color) (7.8) Computation channel display color
#5 - #6 Zone (7.9) Zone upper and lower limits for the computationchannels
Graph (7.10) Number of scale divisions for the trend and bargraph displays for the computation channelsBar graph base positions for the computationchannelsSpecify the the scale display positon for trends forthe computation channels.
Partial (7.11) Turn On/Off partial expansion display for thecomputation channelsPosition and boundary for the partial expansiondisplay for the computation channels
#6 File (8.9) Header string to be written to fileName of directory to which data are to be savedRange of data to be saved during manual save
Daylight savings time (10.12) Daylight savings time switch time
#7 Save/Load, Clear data
#7 - #1 Save settings Save setup data to the external storage medium (9.1)
#7 - #2 Load settings Load setup data from the external storagemedium (9.1)
#7 - #3 Save data Store measured data using key operation (9.2)
#7 - #4 Load display data Load/Display the diaplay data on the externalstorage medium (9.3)
#7 - #5 Load event data Load/Display the event data on the externalstorage medium (9.4)
#7 - #6 File list List the files on the external storage medium (9.5)
#7 - #7 Delete Delete files on the external storage medium (9.5)
#7 - #8 Format Format the external storage medium (9.5)
#7 - #9 Clear data Clear the measure/computed data in the internalmemory (9.7)
#8 Time set (3.7) Date/time
#9 Math range (11.4) Computing equations, display span, and unit forcomputation channels
Math alarm (11.5) Alarm type for the computation channelAlarm value for the computation channelOutput relay On/Off for the computation channelOutput relay number for the computation channel
#10 Constant (11.6) Constants (K01 to K12)
3.5 Configuring the Functions

3-17
Nam
es of P
arts/Ru
n M
od
e/Co
mm
on
Op
eration
s
3
Soft key Settings in the Setting ModeTitle Item
#11 Tag (7.1) Tag names of the computation channelsTLOG (11.8) Timer number used in TLOG, sum unitRolling average (11.10) Turn ON/OFF the rolling average
Sampling interval and the number of samples forthe rolling average
Alarm delay time (6.3)
The Menu Screen and Items of the Basic Setting ModeThe menu screen and items of the basic setting mode are as follows. Enclosed inparentheses are reference sections.
To [Save/Load, Initialize] menu below
[Save/Load, Initialize] menu
See RD-MV100 communication Interface User’s Manual
Soft key Settings in the Basic Setting ModeTitle Item
#1 Alarm (6.4) Reflash alarmAND operation of alarm output relaysEnergize/de-energize alarm output relaysHold/non-hold alarm output relaysHold/non-hold alarm displaysRate-of-change alarm intervalAlarm hysteresis
#2 A/D (5.9) Integration time of the A/D converterScan intervalBurn out Off/Up/DownReference junction compensation (select internal/external, compensation voltage when usingexternal)
Temperature (10.13) Temperature unit
3.5 Configuring the Functions
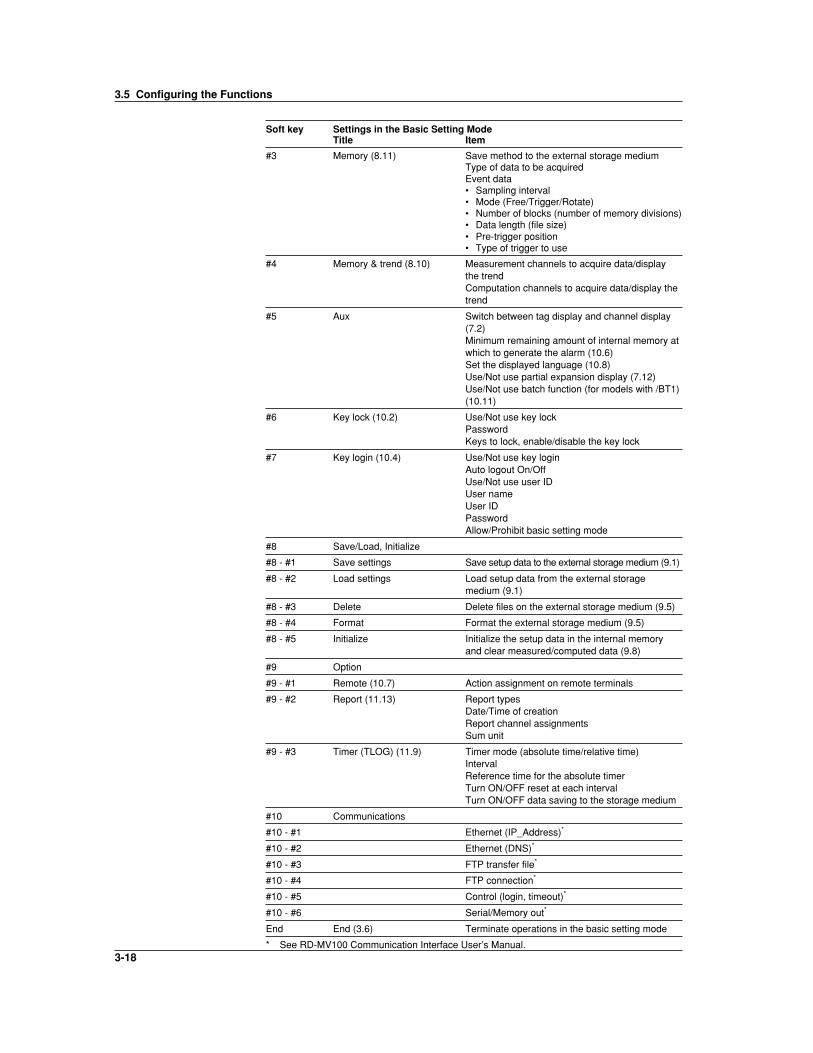
3-18
Soft key Settings in the Basic Setting ModeTitle Item
#3 Memory (8.11) Save method to the external storage mediumType of data to be acquiredEvent data• Sampling interval• Mode (Free/Trigger/Rotate)• Number of blocks (number of memory divisions)• Data length (file size)• Pre-trigger position• Type of trigger to use
#4 Memory & trend (8.10) Measurement channels to acquire data/displaythe trendComputation channels to acquire data/display thetrend
#5 Aux Switch between tag display and channel display(7.2)Minimum remaining amount of internal memory atwhich to generate the alarm (10.6)Set the displayed language (10.8)Use/Not use partial expansion display (7.12)Use/Not use batch function (for models with /BT1)(10.11)
#6 Key lock (10.2) Use/Not use key lockPasswordKeys to lock, enable/disable the key lock
#7 Key login (10.4) Use/Not use key loginAuto logout On/OffUse/Not use user IDUser nameUser IDPasswordAllow/Prohibit basic setting mode
#8 Save/Load, Initialize
#8 - #1 Save settings Save setup data to the external storage medium (9.1)
#8 - #2 Load settings Load setup data from the external storagemedium (9.1)
#8 - #3 Delete Delete files on the external storage medium (9.5)
#8 - #4 Format Format the external storage medium (9.5)
#8 - #5 Initialize Initialize the setup data in the internal memoryand clear measured/computed data (9.8)
#9 Option
#9 - #1 Remote (10.7) Action assignment on remote terminals
#9 - #2 Report (11.13) Report typesDate/Time of creationReport channel assignmentsSum unit
#9 - #3 Timer (TLOG) (11.9) Timer mode (absolute time/relative time)IntervalReference time for the absolute timerTurn ON/OFF reset at each intervalTurn ON/OFF data saving to the storage medium
#10 Communications
#10 - #1 Ethernet (IP_Address)*
#10 - #2 Ethernet (DNS)*
#10 - #3 FTP transfer file*
#10 - #4 FTP connection*
#10 - #5 Control (login, timeout)*
#10 - #6 Serial/Memory out*
End End (3.6) Terminate operations in the basic setting mode
* See RD-MV100 Communication Interface User’s Manual.
3.5 Configuring the Functions

3-19
Nam
es of P
arts/Ru
n M
od
e/Co
mm
on
Op
eration
s
3
3.6 Common Key Operations
This section describes common key operations that are used often.
DISP/ENTER
MENUESCFUNCSTART STOP
DISP/ENTER key
Arrow keysSoft keys
MEDIA
Key Operations in the Basic Setting ModeProcedure
Entering the basic setting mode1. Press the MENU key to enter the setting mode.
2. Hold the FUNC key down for three seconds to enter the basic setting mode.3. Press the soft key to enter individual setting screens.
Note• Basic setting mode cannot be entered while data acquisition or computation is in progress.
Stop data acquisition and computation first before entering the basic setting mode.
• Changing and storing the data acquiring method in the basic setting mode ([#3 Memory] and
[#4 Memory and trend]) clears the measured/computed data in the internal memory. Make
sure to save the data to the external storage medium before entering the basic setting mode.
Common key operations in the basic setting mode are described.
Setting selections (selected using the soft keys)
Cursor position(bule)

3-20
Selecting the parameter1. Use the arrow keys to move the cursor (blue) to the appropriate parameter. The
available selections are displayed at the bottom of the screen above the soft
keys.
2. Select the parameter with the soft key. The box containing the parameter that
was changed turns yellow. The cursor moves the next parameter.
To cancel the settings, press the ESC key. A window appears for you to confirmthe cancellation. Select [Yes] and press the DISP/ENTER key.
Confirming the settings1. Pressing the DISP/ENTER key confirms the new settings. The parameter boxes
return to a white color. The cursor moves to the first parameter on the page.
Returning to the menu screen of the basic setting mode1. Press the ESC key to return to the menu screen of the basic setting mode.
Exiting the basic setting modeCarry out the following steps when the basic setting menu is displayed.
1. Press the [END] soft key. A confirmation window with a message [Do you want
to store and make the new settings take effect?] appears.2. Selecting [Yes] with the arrow key and pressing the DISP/ENTER key saves the
new settings and returns to the operation mode.
If you do not wish to save the new settings, select [No] with the arrow key and
press the DISP/ENTER key to return to the operation mode.
Selecting [Cancel] with the arrow key and pressing the DISP/ENTER keycancels the “operation to exit the basic setting mode” and returns to the basic
setting mode menu. In this case, the setting changes made up to that point are
held.
Key Operations in the Setting ModeProcedure
Entering the setting mode1. Press the MENU key to enter the setting mode.
2. Press the soft key to enter individual setting screens.
Common key operations in the setting mode are described.
Setting selections (selected using the soft keys)
Cursor position(bule)
3.6 Common Key Operations

3-21
Nam
es of P
arts/Ru
n M
od
e/Co
mm
on
Op
eration
s
3
Selecting the parameter1. Use the arrow keys to move the cursor (blue) to the appropriate parameter. The
available selections are displayed at the bottom of the screen above the soft
keys.
2. Select the parameter with the soft key. The box containing the parameter that
was changed turns yellow. The cursor moves to the next parameter.
To cancel the settings, press the ESC key. A window appears for you to confirmthe cancellation. Select [Yes] and press the DISP/ENTER key.
Confirming the settings1. Pressing the DISP/ENTER key confirms the new settings. The parameter boxes
return to a white color. The cursor moves to the first parameter on the page.
Returning to the menu screen of the setting mode1. Press the Menu or ESC key to return to the menu screen of the setting mode.
Exiting the setting mode1. Press the MENU or the ESC key to save the settimgs and return to the
operation mode.
Entering NumbersThe operation to enter numbers is used such as when setting the date, time, or the
display span of the input range.
Window for entering numbers
Select numbers
ProcedureWhen the window used to enter the numbers appears, enter the value according to thefollowing key operations.
• Left and right arrow keys : Selects the input position
• Up and down arrow keys : Enters the number
3.6 Common Key Operations
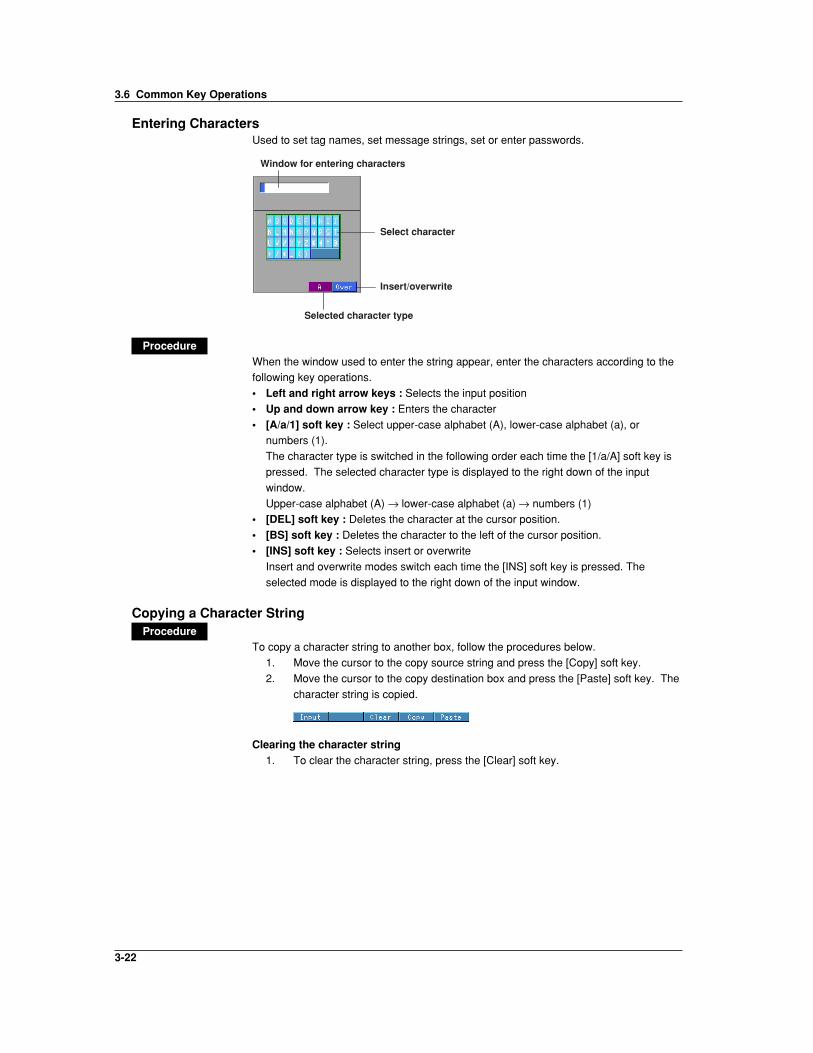
3-22
Entering CharactersUsed to set tag names, set message strings, set or enter passwords.
Window for entering characters
Select character
Insert/overwrite
Selected character type
ProcedureWhen the window used to enter the string appear, enter the characters according to thefollowing key operations.
• Left and right arrow keys : Selects the input position
• Up and down arrow key : Enters the character
• [A/a/1] soft key : Select upper-case alphabet (A), lower-case alphabet (a), ornumbers (1).
The character type is switched in the following order each time the [1/a/A] soft key is
pressed. The selected character type is displayed to the right down of the input
window.
Upper-case alphabet (A) → lower-case alphabet (a) → numbers (1)• [DEL] soft key : Deletes the character at the cursor position.
• [BS] soft key : Deletes the character to the left of the cursor position.
• [INS] soft key : Selects insert or overwrite
Insert and overwrite modes switch each time the [INS] soft key is pressed. The
selected mode is displayed to the right down of the input window.
Copying a Character StringProcedure
To copy a character string to another box, follow the procedures below.
1. Move the cursor to the copy source string and press the [Copy] soft key.
2. Move the cursor to the copy destination box and press the [Paste] soft key. The
character string is copied.
Clearing the character string1. To clear the character string, press the [Clear] soft key.
3.6 Common Key Operations

3-23
Nam
es of P
arts/Ru
n M
od
e/Co
mm
on
Op
eration
s
3
3.7 Setting the Date and Time
Set the date and time. The set date and time can be specified whether it belong to the
summer time or the winter time. The summer time and the winter time are defined by the
daylight savings time adjustment function. For detail, see section 10.12, “Using the
Daylight Savings Time Adjustment Function.”
Procedure
Press MENU .
Press the soft key Next 1/3 .
To display the window for the date and time setting, press the soft key #8 .
1. YY/MM/DD HH:MM:SSEnter the date and time.
Pressing the [Input] soft key displays a window used to enter the date and time.
Enter the date and time and press the [DISP/ENTER] key. For the procedures
related to entering numbers, see “Entering Numbers” on page 3-21.
Pressing the DISP/ENTER key closes the window without setting the [DST] box.To cancel the setting and close the window, press the ESC key.
2. DST (Daylight savings time adjustment function)
[Summer] or [Winter] is displayed in the [DST] box corresponding to the date
and time indicated in the [YY/MM/DD HH:MM:SS] box when the window is
opened.Operate as follows to set [Summer] or [Winter] for the date and time entered.
Pressing the right arrow key shifts the cursol to the [DST] box. Select [Summer]
or [Winter] by the soft key and press the DISP/ENTER key. The window closes.
To cancel the setting and close the window, press the ESC key before pressing
the DISP/ENTER key.
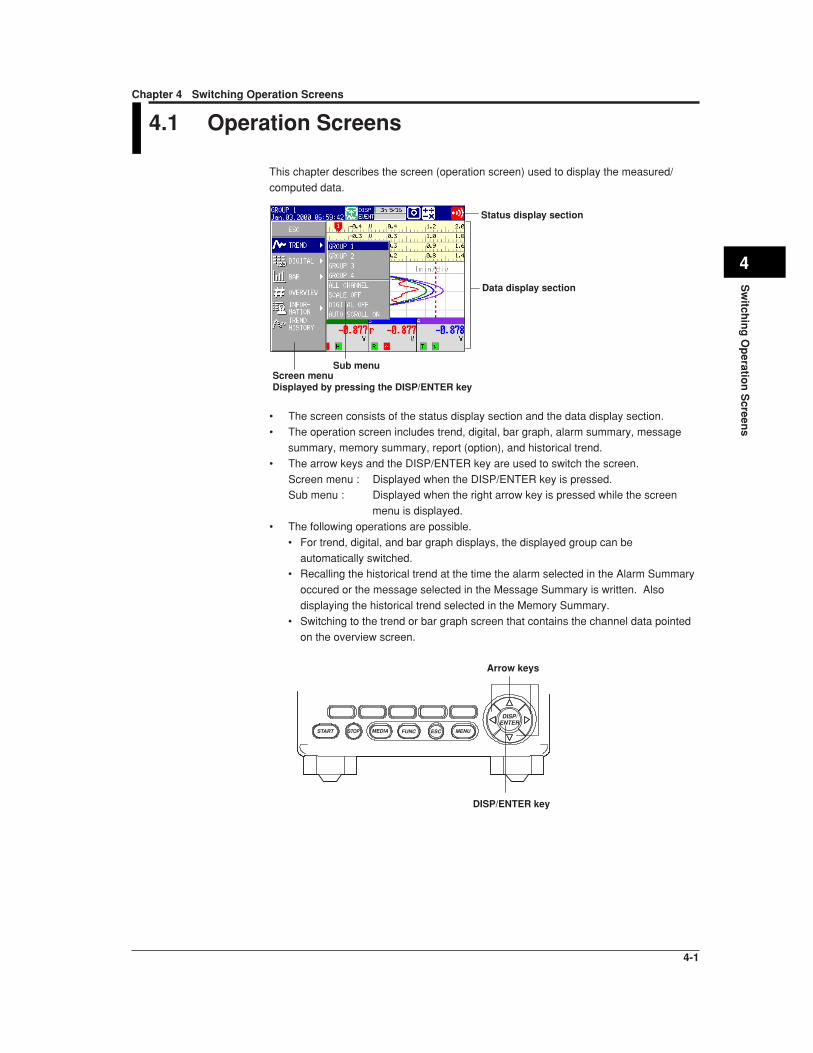
4-1
Sw
itchin
g O
peratio
n S
creens
4
Chapter 4 Switching Operation Screens
4.1 Operation Screens
This chapter describes the screen (operation screen) used to display the measured/
computed data.
Screen menuDisplayed by pressing the DISP/ENTER key
Status display section
Data display section
Sub menu
• The screen consists of the status display section and the data display section.
• The operation screen includes trend, digital, bar graph, alarm summary, message
summary, memory summary, report (option), and historical trend.
• The arrow keys and the DISP/ENTER key are used to switch the screen.
Screen menu : Displayed when the DISP/ENTER key is pressed.Sub menu : Displayed when the right arrow key is pressed while the screen
menu is displayed.
• The following operations are possible.
• For trend, digital, and bar graph displays, the displayed group can be
automatically switched.• Recalling the historical trend at the time the alarm selected in the Alarm Summary
occured or the message selected in the Message Summary is written. Also
displaying the historical trend selected in the Memory Summary.
• Switching to the trend or bar graph screen that contains the channel data pointed
on the overview screen.
MEDIA FUNC ESC MENUSTART STOP
DISP/ENTER
DISP/ENTER key
Arrow keys

4-2
4.2 Explanation of the Status Display Section
The following information is displayed in the status display section during the operation
mode and the setting mode. (The information is not displayed in the basic setting mode.
[Setup Mode] is displayed instead).
5-1
6-1 ([Free] ode)
6-2 ([Trigger] or [Rotate] mode)
1 85 9 10
3
4 7
2
6
A
B
C
D
E
F
1. User nameThe user name is displayed when a user is logged in using the key login function.
2. Group name or screen nameThe name of the group or screen that is displayed in the data display section. [ALL]
is displayed only during all channel display (see section 4.3).
3. Current date and timeThe current date and time are displayed.
4. ON/OFF state of the measured/computed data acquisition.A and B are displayed alternately : Data acquisition in progress or waiting for the
event data trigger.
C : Data acquisition is suspended.
NoteFor event data that starts acquiring data upon receiving a trigger, the indicator indicates that
the data acquisition is in progress even when it is in the trigger wait state. The trigger wait
state can be identified using the bar graph described in item 6.

4-3
Sw
itchin
g O
peratio
n S
creens
4
5. The usage condition of the display data storage area in the internal memoryThis is displayed when display data acquisition is enabled.• Bar graph
Displays the used space of the display data storage area.
• Time period
The remaining time for acquiring the display data. When the remaining time is
less than one hour, the time is displayed in units of minutes.Remaining memory Unit
Greater than or equal to 100 days : %
(Percentage of the remaining area with respect to the display data acquisition
area)
Greater than or equal to 100 hours, less than 100 days : days(unit less than one day is rounded off)
Greater than or equal to 60 minutes, less than 100 hours : hours
(unit less than one hour is rounded off)
Less than 60 minutes : minutes
(unit less than one minute is rounded off)• n/16
The maximum number of display data files* that can be written to the internal
memory is 16. “16” represents this value. “n” represents the number of files in the
internal memory.* One file contains data that are acquired between start and stop operations.
NoteThe display data are overwritten for the following cases. Be aware of these cases, because
data that are overwritten are lost.
• When the display data storage area in the internal memory becomes full.
In such case, [Overwrite] is displayed in the status display section.
• When the number of files that remains to be saved to the external medium exceeds 16.
6. The usage condition of the event data storage area in the internal memoryThis is displayed when event data acquisition is enabled.• When the trigger mode is set to [Free]
• Bar graph
Displays the used space of the event data storage area.
• Time period
The remaining time for acquiring the event data. When the remaining time isless than one hour, the time is displayed in units of minutes.
Remaining memory Unit (refer to item 5)
Greater than or equal to 100 days : %
Greater than or equal to 100 hours, less than 100 days : days
Greater than or equal to 60 minutes, less than 100 hours : hoursLess than 60 minutes : minutes
• n/16
The maximum number of event data files* that can be written to the internal
memory is 16. “16” represents this value. “n” represents the number of files in
the internal memory.* One file contains data that are acquired between start and stop operations.
NoteThe event data are overwritten for the following cases. Be aware of these cases, because
data that are overwritten are lost.
• When the event data storage area in the internal memory becomes full.
In such case, [Overwrite] is displayed in the status display section.
• When the number of files that remains to be saved to the external medium exceeds 16.
4.2 Explanation of the Status Display Section
4-4
• When the trigger mode is set to [Trigger] or [Rotate]• Bar graph
Displays the used space with respect to the specified memory length (data
length, see section 8.11).
When pretrigger is specified and the START key is pressed causing the RD-
MV100 to enter the trigger wait state, data of size equal to the pretrigger amount
are acquired to the internal memory. The bar is displayed in orange. Afteracquiring data of size equal to the pretrigger, the length of the bar stays fixed.
However, the relevant data are updated until the trigger is activated. When the
trigger is activated, the bar turns green. Data are acquired to the internal
memory after the pretrigger data.
During the [Trigger] mode (see section 8.2), [Full] is displayed when dataacquisition to all blocks is complete. When [Full] is displayed, event data are no
longer acquired even if the trigger condition is met. In this case, save the data
in the internal memory to the external storage medium.
• Block display
When the event data storage area is divided into multiple blocks, the usagecondition of the blocks are displayed.White block : No dataGreen block : Block containing data that were acquired to the internal
memory after starting the current acquisition of event data.Gray block : Block containing data that were acquired before the current
start operation.
7. The external storage medium conditionNo display : No storage medium inserted.
D and E displayed in order : Accessing the storage medium.E : Storage medium is idle (no access)
F : The used space of the storage medium is indicated by the green level indicator in
the icon. The colored section indicating the level turns red when the amount of
free space on the storage medium falls below 10%.
8. Computation icon (option)Computation icon not displayed : No computation option or computation is suspended
White computation icon : Computation in progress
Yellow computation icon : Computation data dropout occurred
NoteComputation data dropout occurs when the computation is not completed within the scan
interval. The computation icon returns to the green icon by pressing FUNC → [MathACK] soft
key(see section 11.3). If a computation dropout occurs, make the scan interval longer (see
section 5.9) or reduce the number of computation channels that are turned On (see section
11.4).
9. Key lock iconKey icon : Key lock ONNo display : Key lock OFF
10. Alarm iconDisplayed when any one of the alarms is occurring. For details, see chapter 6.
4.2 Explanation of the Status Display Section
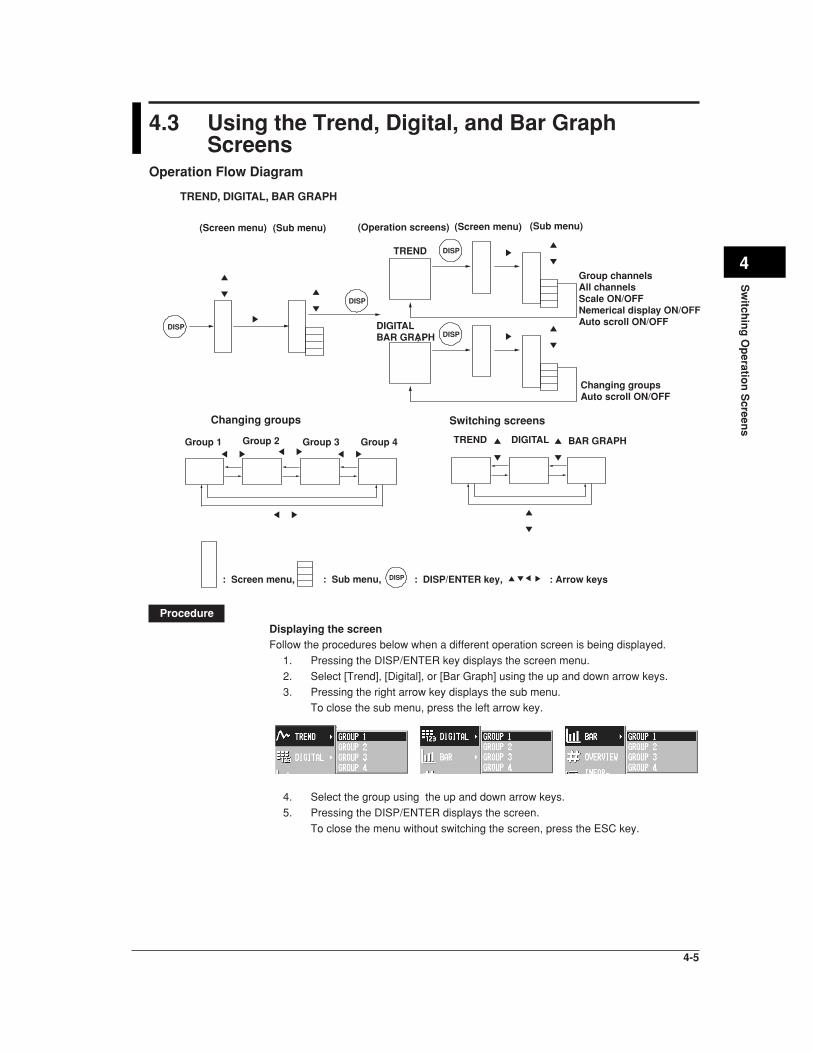
4-5
Sw
itchin
g O
peratio
n S
creens
4
4.3 Using the Trend, Digital, and Bar GraphScreens
Operation Flow Diagram
DISP
DISP
DISP
Group channelsAll channelsScale ON/OFFNemerical display ON/OFFAuto scroll ON/OFF
TREND
DISP
Changing groupsAuto scroll ON/OFF
DIGITAL BAR GRAPH
Group 1
Changing groups
TREND, DIGITAL, BAR GRAPH
Switching screens
Group 2 Group 3 Group 4 TREND DIGITAL BAR GRAPH
(Screen menu)(Sub menu) (Operation screens) (Sub menu)(Screen menu)
DISP: Screen menu, : Sub menu, : DISP/ENTER key, : Arrow keys
ProcedureDisplaying the screenFollow the procedures below when a different operation screen is being displayed.
1. Pressing the DISP/ENTER key displays the screen menu.
2. Select [Trend], [Digital], or [Bar Graph] using the up and down arrow keys.
3. Pressing the right arrow key displays the sub menu.To close the sub menu, press the left arrow key.
4. Select the group using the up and down arrow keys.
5. Pressing the DISP/ENTER displays the screen.
To close the menu without switching the screen, press the ESC key.

4-6
Displaying or clearing the scale on the trend screenThis operation is carried out on the Trend screen.
1. Pressing the DISP/ENTER displays the screen menu. ([Trend] is selected.)2. Pressing the right arrow key displays the sub menu.
To close the sub menu, press the left arrow key.3. Select [SCALE ON]* or [SCALE OFF].*
* The one that is selectable is displayed in the sub menu.
4. Pressing the DISP/ENTER key displays the scale.To close the menu without displaying/clearing the scale, press the ESC key.
Displaying all channel trend/Return to group channel trendThis operation is carried out on the Trend screen.All channel trend displays waveforms of all channels set for Trend screen. See section8.10 to set channels for Trend screen.
1. Pressing the DISP/ENTER key displays the screen menu. ([Trend] is selected.)2. Pressing the right arrow key displays the sub menu.
To close the sub menu, press the left arrow key.3. Select [ALL CHANNEL]* or [GROUP CHANNEL] using the up and down arrow
keys.* The one that is selectable is displayed in the sub menu.
4. Pressing the DISP/ENTER key displays the screen.To close the menu without switching the screen, press the ESC key.
4.3 Using the Trend, Digital, and Bar Graph Screens
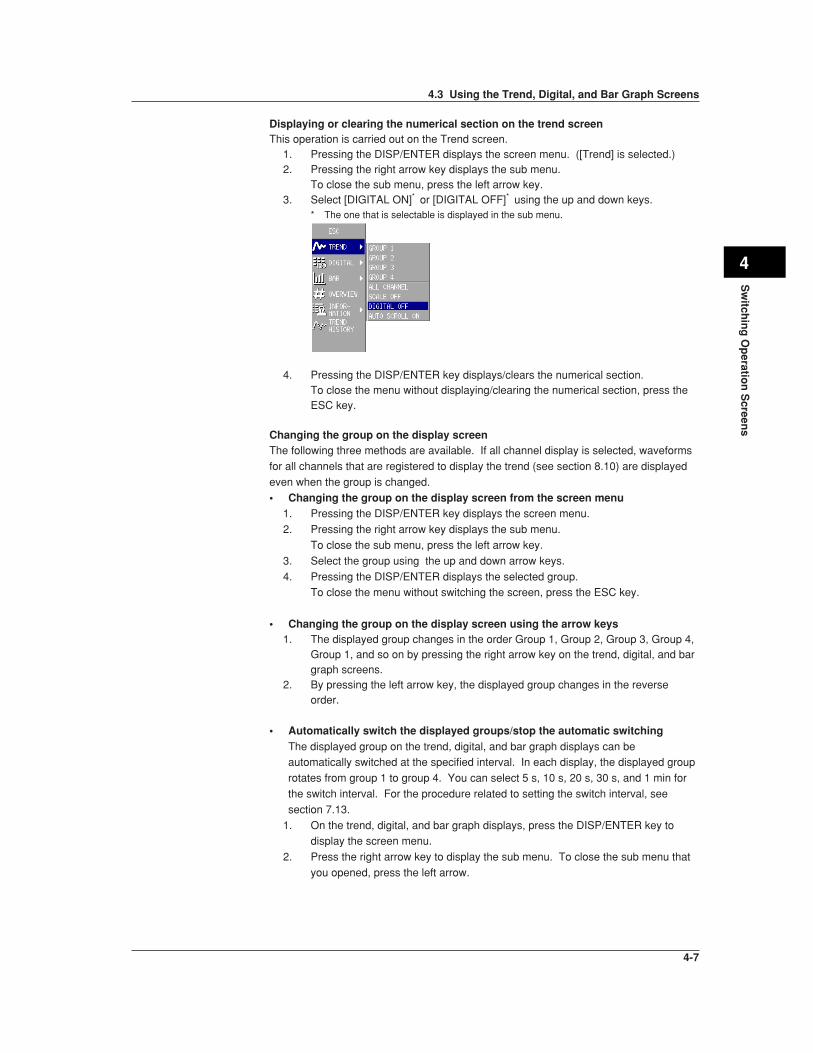
4-7
Sw
itchin
g O
peratio
n S
creens
4
Displaying or clearing the numerical section on the trend screenThis operation is carried out on the Trend screen.
1. Pressing the DISP/ENTER displays the screen menu. ([Trend] is selected.)2. Pressing the right arrow key displays the sub menu.
To close the sub menu, press the left arrow key.3. Select [DIGITAL ON]* or [DIGITAL OFF]* using the up and down keys.
* The one that is selectable is displayed in the sub menu.
4. Pressing the DISP/ENTER key displays/clears the numerical section.To close the menu without displaying/clearing the numerical section, press theESC key.
Changing the group on the display screenThe following three methods are available. If all channel display is selected, waveforms
for all channels that are registered to display the trend (see section 8.10) are displayed
even when the group is changed.
• Changing the group on the display screen from the screen menu1. Pressing the DISP/ENTER key displays the screen menu.
2. Pressing the right arrow key displays the sub menu.
To close the sub menu, press the left arrow key.
3. Select the group using the up and down arrow keys.
4. Pressing the DISP/ENTER displays the selected group.To close the menu without switching the screen, press the ESC key.
• Changing the group on the display screen using the arrow keys1. The displayed group changes in the order Group 1, Group 2, Group 3, Group 4,
Group 1, and so on by pressing the right arrow key on the trend, digital, and bargraph screens.
2. By pressing the left arrow key, the displayed group changes in the reverseorder.
• Automatically switch the displayed groups/stop the automatic switchingThe displayed group on the trend, digital, and bar graph displays can beautomatically switched at the specified interval. In each display, the displayed group
rotates from group 1 to group 4. You can select 5 s, 10 s, 20 s, 30 s, and 1 min for
the switch interval. For the procedure related to setting the switch interval, see
section 7.13.
1. On the trend, digital, and bar graph displays, press the DISP/ENTER key todisplay the screen menu.
2. Press the right arrow key to display the sub menu. To close the sub menu that
you opened, press the left arrow.
4.3 Using the Trend, Digital, and Bar Graph Screens

4-8
3. To enable automatic switching, select [AUTO SCROLL ON]* using the up and
down arrow keys. To disable automatic switching, select [AUTO SCROLLOFF]* using the up and down arrow keys.* The one that is selectable is displayed in the sub menu.
4. Press the DISP/ENTER key to enable or disable the automatic switching of the
displayed groups.
Switching the trend, digital, and bar graph screensThe following two methods are available:• Switch between trend, digital, and bar graph from the screen menu
The operating procedure is the same as “Displaying the screen” on page 4-5.
• Switching the trend, digital, and bar graph screens using the arrow keys1. The displayed screen changes in the order trend, digital, bar graph, trend, and
so on by pressing the down arrow key on the trend, digital, and bar graphscreens.
2. By pressing the up arrow key, the displayed screen changes in the reverseorder.
Starting the waveform display of the trend display/stopping the waveform updateThe operation procedure used to start the waveform display of the trend display and the
procedure used to stop the waveform update are the same as the operation used to
start/stop the data acquisition to the internal memory. When the data are being acquired
to the internal memory, the waveform is displayed. When it is stopped, the waveform is
not updated. For the operating procedure, see sections 8.4 and 8.6.
4.3 Using the Trend, Digital, and Bar Graph Screens
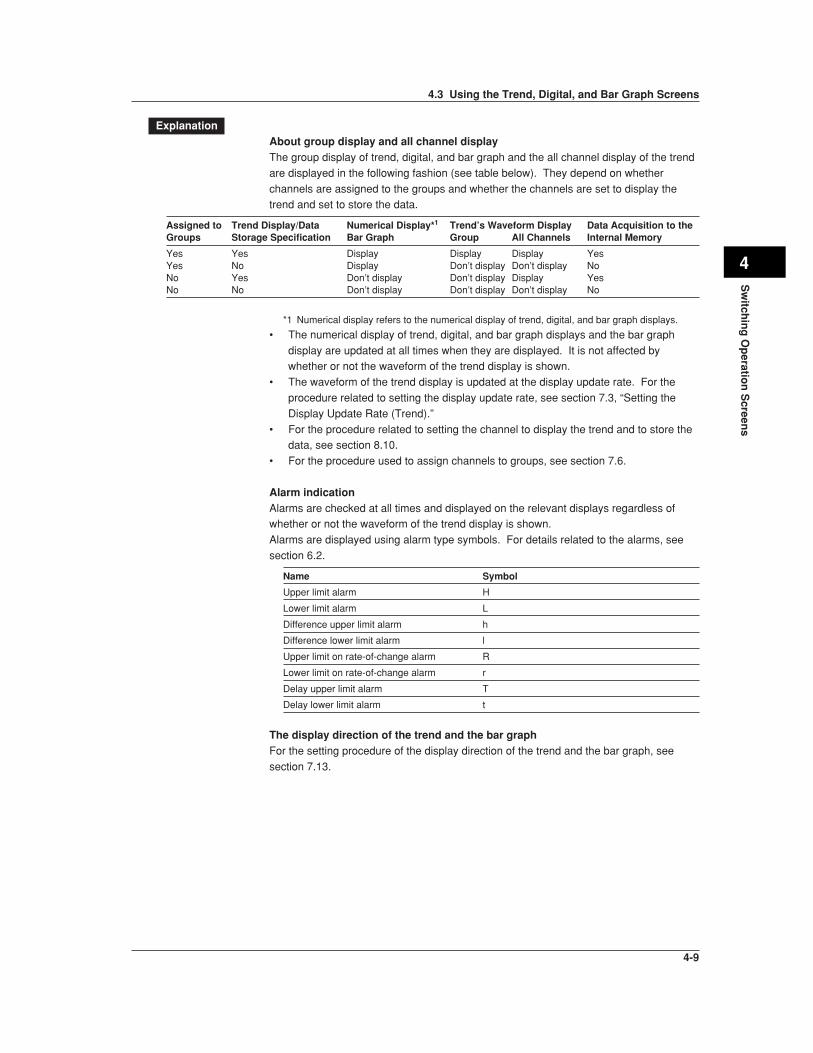
4-9
Sw
itchin
g O
peratio
n S
creens
4
ExplanationAbout group display and all channel displayThe group display of trend, digital, and bar graph and the all channel display of the trend
are displayed in the following fashion (see table below). They depend on whether
channels are assigned to the groups and whether the channels are set to display thetrend and set to store the data.
Assigned to Trend Display/Data Numerical Display*1 Trend’s Waveform Display Data Acquisition to theGroups Storage Specification Bar Graph Group All Channels Internal Memory
Yes Yes Display Display Display YesYes No Display Don’t display Don’t display NoNo Yes Don’t display Don’t display Display YesNo No Don’t display Don’t display Don’t display No
*1 Numerical display refers to the numerical display of trend, digital, and bar graph displays.
• The numerical display of trend, digital, and bar graph displays and the bar graph
display are updated at all times when they are displayed. It is not affected bywhether or not the waveform of the trend display is shown.
• The waveform of the trend display is updated at the display update rate. For the
procedure related to setting the display update rate, see section 7.3, “Setting the
Display Update Rate (Trend).”
• For the procedure related to setting the channel to display the trend and to store thedata, see section 8.10.
• For the procedure used to assign channels to groups, see section 7.6.
Alarm indicationAlarms are checked at all times and displayed on the relevant displays regardless ofwhether or not the waveform of the trend display is shown.
Alarms are displayed using alarm type symbols. For details related to the alarms, see
section 6.2.
Name Symbol
Upper limit alarm H
Lower limit alarm L
Difference upper limit alarm h
Difference lower limit alarm l
Upper limit on rate-of-change alarm R
Lower limit on rate-of-change alarm r
Delay upper limit alarm T
Delay lower limit alarm t
The display direction of the trend and the bar graphFor the setting procedure of the display direction of the trend and the bar graph, see
section 7.13.
4.3 Using the Trend, Digital, and Bar Graph Screens

4-10
Trend (vertical display)
Measured/computed valueChannel/Tag
Unit
Alarm mark
Scale
Trip line
Message
Display update rate (Time/div)
Trend (vertical display, all channel display)
Data of selected group
Waveform of all channels
Digital
Measured/computed value
Channel/Tag
Unit
Alarm mark
Bar graph (vertical display)
Unit
Alarm markTag/Channel
Measured/computed value
Alarm point mark
Bar graph
Upper limit of span
Lower limit of span
4.3 Using the Trend, Digital, and Bar Graph Screens

4-11
Sw
itchin
g O
peratio
n S
creens
4
4.4 Using the Overview Screen
Operation Flow Diagram
DISP
DISP DISP DISP
(Screen menu) (Overview screen)
Cursor ON/OFF
To TREND
To BAR GRAPHChannel selection
(Screen menu) (Sub menu)
DISP: Screen menu, : Sub menu, : DISP/ENTER key, : Arrow keys
ProcedureDisplaying the screen
1. Pressing the DISP/ENTER key displays the screen menu.
2. Select [Trend], [Digital], or [Bar Graph] using the up and down arrow keys.
Select [Overview] using the up and down arrow keys.3. Pressing the DISP/ENTER displays the screen.
To close the menu without switching the screen, press the ESC key.
Displaying or clearing the cursor1. Pressing the DISP/ENTER key displays the screen menu.2. Pressing the right arrow key displays the sub menu.
To close the sub menu, press the left arrow key.
3. Select [CURSOR ON]* or [CURSOR OFF].*
* The one that is selectable is displayed in the sub menu.
4. Pressing the DISP/ENTER key displays or clears the cursor.
To close the menu without displaying/clearing the cursor, press the ESC key.
Switching to the trend or bar graph screen of the channel selected with the cursor1. Move the cursor to select the channel using the arrow key.
2. Pressing the DISP/ENTER key displays the screen menu.
3. Pressing the right arrow key displays the sub menu.To close the sub menu, press the left arrow key.
4. Select [JUMP TO TREND] or [JUMP TO BAR] using up and down arrow keys.
5. Pressing the DISP/ENTER key displays the screen.
To close the menu without displaying the screen, press the ESC key.
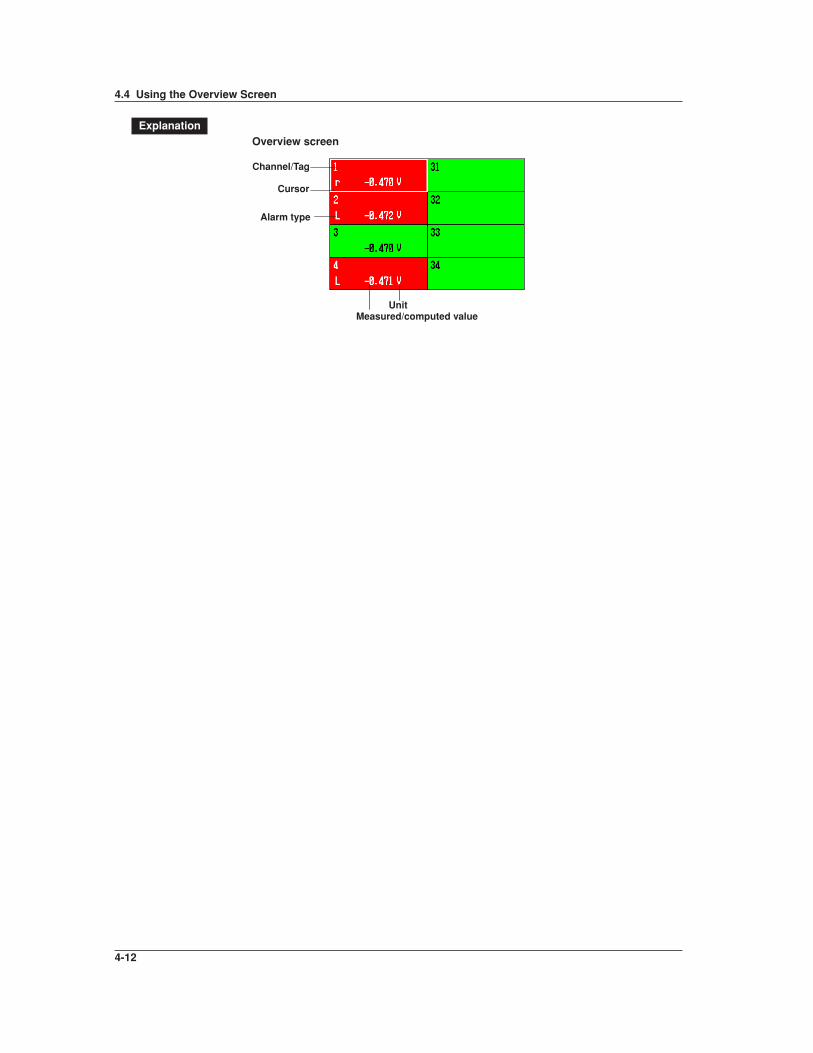
4-12
ExplanationOverview screen
Measured/computed value
Channel/Tag
Unit
Alarm type
Cursor
4.4 Using the Overview Screen

4-13
Sw
itchin
g O
peratio
n S
creens
4
4.5 Using the Information Screen (Alarm Summary,Message Summary, and Memory Summary)
Operation Flow Diagram
DISP
DISP DISP
DISP
(Screen rmenu) (INFORMATION)
To HISTORICAL TRENDInformation
selection
(Screen menu)(Sub menu) (Sub menu)
DISP
To Report dataWhen displayingReport data
MEMORY SUMMARY
DISP: Screen menu, : Sub menu, : DISP/ENTER key, : Arrow keys
ProcedureDisplaying the alarm summary, message summary, or memory summary
1. Pressing the DISP/ENTER displays the screen menu.
2. Select [INFORMATION] using the up and down arrow keys.
3. Pressing the right arrow key displays the sub menu.
To close the sub menu, press the left arrow key.
4. Select [ALARM SUMMARY], [MESSAGE SUMMARY], or [MEMORYSUMMARY] using the up and down arrow keys.
5. Pressing the DISP/ENTER key displays the screen.
To close the menu without displaying the screen, press the ESC key.
Recalling the historical trend at the time the alarm occurredThis operation is carried out on the Alarm Summary screen.
1. Select the alarm of which to display the trend using the up and down arrowkeys.
Selected alarm
2. Pressing the DISP/ENTER displays the screen menu.
3. Pressing the right arrow key displays the sub menu.
To close the sub menu, press the left arrow key.
4. Select [JUMP TO HISTORY] using the up and down arrow keys.
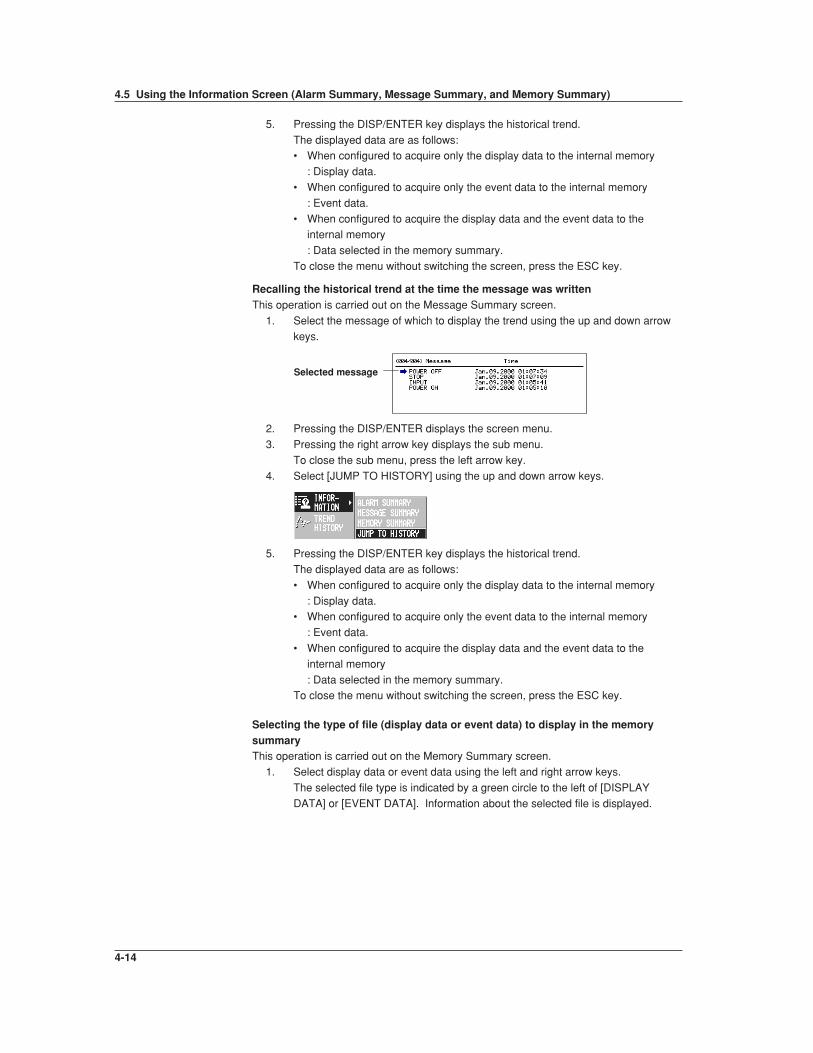
4-14
5. Pressing the DISP/ENTER key displays the historical trend.
The displayed data are as follows:• When configured to acquire only the display data to the internal memory
: Display data.
• When configured to acquire only the event data to the internal memory
: Event data.
• When configured to acquire the display data and the event data to theinternal memory
: Data selected in the memory summary.
To close the menu without switching the screen, press the ESC key.
Recalling the historical trend at the time the message was writtenThis operation is carried out on the Message Summary screen.
1. Select the message of which to display the trend using the up and down arrow
keys.
Selected message
2. Pressing the DISP/ENTER displays the screen menu.
3. Pressing the right arrow key displays the sub menu.
To close the sub menu, press the left arrow key.
4. Select [JUMP TO HISTORY] using the up and down arrow keys.
5. Pressing the DISP/ENTER key displays the historical trend.
The displayed data are as follows:
• When configured to acquire only the display data to the internal memory
: Display data.• When configured to acquire only the event data to the internal memory
: Event data.
• When configured to acquire the display data and the event data to the
internal memory
: Data selected in the memory summary.To close the menu without switching the screen, press the ESC key.
Selecting the type of file (display data or event data) to display in the memorysummaryThis operation is carried out on the Memory Summary screen.
1. Select display data or event data using the left and right arrow keys.
The selected file type is indicated by a green circle to the left of [DISPLAY
DATA] or [EVENT DATA]. Information about the selected file is displayed.
4.5 Using the Information Screen (Alarm Summary, Message Summary, and Memory Summary)

4-15
Sw
itchin
g O
peratio
n S
creens
4
Opening the display data file from memory summary (recalling the historicaltrend).This operation is carried out when displaying the information about the display data in
Memory Summary.
1. Select the file using the up and down arrow keys.
Selected file
2. Pressing the DISP/ENTER displays the screen menu.
3. Pressing the right arrow key displays the sub menu.
To close the sub menu, press the left arrow key.
4. Select [JUMP TO HISTORY] using the up and down arrow keys.
5. Pressing the DISP/ENTER key displays the historical trend.
To close the menu without switching the screen, press the ESC key.
Displaying the report data (option)This operation is carried out on the Message Summary screen. For detail of the report
data, see section 11.11.
1. Pressing the DISP/ENTER displays the screen menu.
2. Pressing the right arrow key displays the sub menu.To close the sub menu, press the left arrow key.
3. Select [REPORT DATA] using the up and down arrow keys.
4. Pressing the DISP/ENTER key displays the report data.
To close the menu without displaying the report data, press the ESC key.
Changing the report data to be displayed“The index number of the report data currently displayed/the number of report data sets
in the internal memory” is displayed in the [Index] column of the report data display. The
most recent report data set is the one with the largest report data index number.
When the report data are being displayed, the arrow keys can be pressed to switch thereport being displayed. The operation when the four arrow keys are pressed are as follows :
Up arrow key : Displays next report data.
Down arrow key : Displays the previous report data.
Right arrow key : Displays the report data that is 10 data sets after the report data being
displayed. However, if there are less than 10 data sets, the mostrecent report data (with the maximum report data number) are
displayed.
Left arrow key : Displays the report data that is 10 data sets before the report data
being displayed. However, if there are less than 10 data sets, the
oldest report data (report data number 1) are displayed.
4.5 Using the Information Screen (Alarm Summary, Message Summary, and Memory Summary)

4-16
ExplanationAlarm summary
Cursor
Number of the alarm information displayed at the bottom of the screenNumber of the alarm information in the internal memory
Tag/ChannelAlarm No. (1, 2, 3, 4)/Type (H, L, h, l, R, r, T, t)
Date & Time (Alarm activated).
Date & Time (Alarm released).
Mark ⇒ “6.1. Releasing the Alarm Indication and Output Relay (Option)”
Message summary
Cursor
Number of the message displayed at the bottom of the screen
Number of the messages in the internal memoryMessage Date and time the message was written
The date and time when the message was entered and the user name (when using key
login function) are displayed.
Memory summary
Number of data sets in the internal memory/The maximum number of data sets the internal memory can hold
Date and time the last data were acquired
Date and time the data acquisition started
Date and time the data acquisition ended
Number of data in the file
File status
Status of alarm output relaysRed: ActivatedGreen: Released
Selection of the file type to be displayed, display data files or event data files
4.5 Using the Information Screen (Alarm Summary, Message Summary, and Memory Summary)
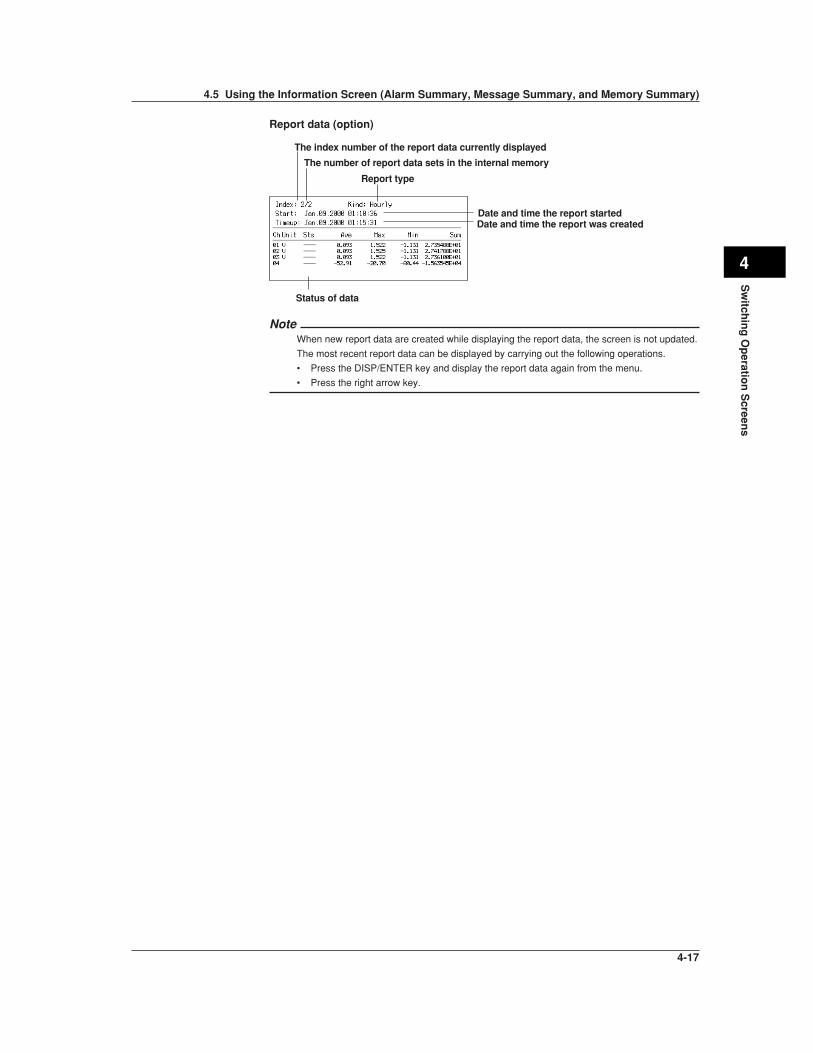
4-17
Sw
itchin
g O
peratio
n S
creens
4
Report data (option)
Status of data
The index number of the report data currently displayed
The number of report data sets in the internal memory
Report type
Date and time the report startedDate and time the report was created
NoteWhen new report data are created while displaying the report data, the screen is not updated.
The most recent report data can be displayed by carrying out the following operations.
• Press the DISP/ENTER key and display the report data again from the menu.
• Press the right arrow key.
4.5 Using the Information Screen (Alarm Summary, Message Summary, and Memory Summary)

4-18
4.6 Using the Historical Trend
Operation Flow Diagram
DISP
DISP DISPDISP
(Screen menu)
(HISTORICAL TREND)
Group channelsAll channelsExpanding/reducing the time axis
Moving the cursor
(Screen menu)
Memory information
(Sub menu)
ALARM SUMMARYMESSAGE SUMMARY MEMORY SUMMARY
LOAD EVENT DATALOAD DISPLAY DATA
DISP: Screen menu, : Sub menu, : DISP/ENTER key, : Arrow keys
ProcedureThere are 6 methods in displaying the historical trend screen.• From the alarm summary. See section 4.5.
• From the message summary. See section 4.5.
• From the memory summary. See section 4.5.
• From [Load display data]. See section 9.3.• From [Load event data]. See section 9.4.
• Recall from the screen menu. Described in this section.
Displaying the historical trend screen (from the screen menu)Of the data being sampled, the display data existing before the execution of this
operation are displayed as a historical trend.1. Pressing the DISP/ENTER displays the screen menu.
2. Select [TREND HISTORY] using the up and down arrow keys.
3. Pressing the DISP/ENTER key displays the screen.
To close the menu without switching the screen, press the ESC key.Note
Even if the display data are not configured to be acquired to the internal memory (see section
8.11), the display data existing before the execution of this operation are displayed as a
historical trend.
Showing the all channel display/returning to the group displayOn the group display, the channels that are assigned to the group are displayed (seesection 7.6.) On the all channel display, the waveform of all channels that are set to
display the trend (see section 8.10) are displayed over the current group display. See
the explanation in section 4.3.
This operation is carried out on the Historical Trend screen.
1. Pressing the DISP/ENTER displays the screen menu. ([TREND HISTORY] isselected.)

4-19
Sw
itchin
g O
peratio
n S
creens
4
2. Pressing the right arrow key displays the sub menu.
To close the sub menu, press the left arrow key.3. Select [ALL CHANNEL] or [GROUP CHANNEL] using the up and down arrow
keys.
4. Pressing the DISP/ENTER key displays the screen.To close the menu without swtiching the screen, press the ESC key.
Changing the group on the display screenIf all channel display is selected, waveforms for all channels that are registered to display
the trend (see section 8.10) are displayed even when the group is changed.1. Pressing the DISP/ENTER key displays the screen menu. ([TREND HISTORY]
is selected.)
2. Pressing the right arrow key displays the sub menu.
To close the sub menu, press the left arrow key.
3. Select the group using the up and down arrow keys.4. Pressing the DISP/ENTER displays the selected group.
To close the menu without switching the screen, press the ESC key.
Expanding/ reducing the time axisThe time axis can be expanded or reduced with respect to the display reference position.Display data : The time axis can be expanded to twice the trend display. It can also be
reduced down to 1/60th of the trend display.
Event data : The time axis can be reduced down to 1/60th.
The factor by which the display can be expanded or reduced at one time by carrying out
the procedures below varies depending on the display update rate for the display data,and the sampling interval for the event data being displayed. To expand or reduce the
display further, repeat the procedures below
1. Pressing the DISP/ENTER key displays the screen menu. ([TREND HISTORY]
is selected.)
2. Pressing the right arrow key displays the sub menu.To close the sub menu, press the left arrow key.
3. Select [ZOOM +] or [ZOOM –] using the up and down arrow keys.
4. Pressing the DISP/ENTER expand or reduce the time axis.
To close the menu without switching the screen, press the ESC key.
Scrolling the waveformPressing the up or down arrow key (vertical display) or the left or right arrow key
(horizontal display) while displaying the historical trend scrolls the waveform along the
time axis.
4.6 Using the Historical Trend

4-20
Specifying the displayed position with the cursorThe cursol position on the all data dispay locates the reference position. Enclosed inparentheses are for the horizontal trend display.
1. Pressing the right (up) arrow key displays the all data display in the right
(upper) section of the screen.
All data display
CursorReference position
2. Move the cursor to select the displayed position using the up and down (left and
right) arrow keys.
3. Pressing the left (down) arrow key switches to the historical trend screen with
shifted waveforms.
Display the current trend data and the historical trend dataDisplays the current display data on the upper (right) half of the screen and the historical
trend on the lower (left) half of the screen.
1. Pressing the left (down) arrow key displays the current trend and the historical
trend.To return to the previous screen, press the up arrow key.
Displaying the memory information1. Pressing the DISP/ENTER key displays the screen menu. ([TREND HISTORY]
is selected.)2. Pressing the right arrow key displays the sub menu.
To close the sub menu, press the left arrow key.
3. Select [INFORMATION ON] using the up and down arrow keys.
4. Pressing the DISP/ENTER displays the window with the memory information.
For models with the batch function, batch number and lot number information of
the display/event data (displayed as a historical trend) is also displayed.
5. To clear the window, press the DISP/ENTER key or one of the arrow keys.
4.6 Using the Historical Trend

4-21
Sw
itchin
g O
peratio
n S
creens
4
ExplanationBackground color of the historical trendThe background color of the historical trend is either black or white, opposite of the
background color displayed for the current trend.
Historical trend
Expanding/Reducing rateTime axis
Tag/Channel
Maximum and minimum values at the reference position*
Maximum and minimum values among the data displayed
Reference positionIcons for switching screens
Unit
* For event data, the measured/computed value at the display reference position.
Historical trend (displaying the current trend and the historical trend).
Historical trend
Current trend
Data from the current trend
NoteIt is possible that not all of the digits of the maximum and minimum values of the computation
channel data will be displayed.
4.6 Using the Historical Trend

5-1
Measu
remen
t Ch
ann
el Settin
gs
5
Chapter 5 Measurement Channel Settings
5.1 Voltage Input Setting
To measure the DC voltage input or the DC current input using an external shunt
resistor, follow the procedures below to set the voltage input. The range cannot be
changed while data acquisition or computation is in progress.
Procedure• These procedures are carried out in the setting mode.• Use the arrow keys to move the cursor (blue) to the appropriate parameter. (The
parameters that cannot be changed are grayed.)
• The possible selections are displayed at the bottom of the screen. Select using the
soft keys.
• The parameter boxes that are changed are displayed in yellow. By confirming thenew settings, they change back to white.
Press MENU .
To display the setting screen press the soft key #1 .
1
2 3 4
The numbers in front of the operating procedure shown below correspond to the
numbers in the above figure.
1. First channel and last channelSelect the desired channels.
2. Mode
Set the mode to [Volt].
3. Range
Set the input range.4. Upper and lower limits of span
Set the upper and lower limits of the display span.
Pressing the [Input] soft key displays a window used to enter a numerical value.
Enter a value in the allowed range and press the DISP/ENTER key.
For the procedures related to entering numerical values, see “EnteringNumbers” on page 3-21.
NoteSpan lower limit and span upper limit cannot be set to the same value.
Confirming operationTo confirm the new settings, press the DISP/ENTER key.
To cancel the new settings, press the ESC key. A window appears for you to confirm the
cancellation. Select [Yes] using the arrow keys and press the DISP/ENTER key.

5-2
ExplanationThe following table shows the mode, range, and measurable range.
Mode Range Measurable Range
Volt 20 mV –20.00 to 20.00 mV60 mV –60.00 to 60.00 mV200 mV –200.0 to 200.0 mV2 V –2.000 to 2.000 V6 V –6.000 to 6.000 V20 V –20.00 to 20.00 V
DC current inputAn external shunt resistor is connected to the input terminal to convert a current signal to
a voltage signal. The shunt resistors in the following table can be provided. A 250 Ωshunt resistor, for example, is used to convert a 4 to 20 mA to a 1 to 5 V.
Name Model (Part) Number Specification
Shunt resistors 415920 250 Ω ±0.1%(for screw terminals) 415921 100 Ω ±0.1%
415922 10 Ω ±0.1%
Shunt resistors 438920 250 Ω ±0.1%(for clamped terminals) 438921 100 Ω ±0.1%
438922 10 Ω ±0.1%
5.1 Voltage Input Setting
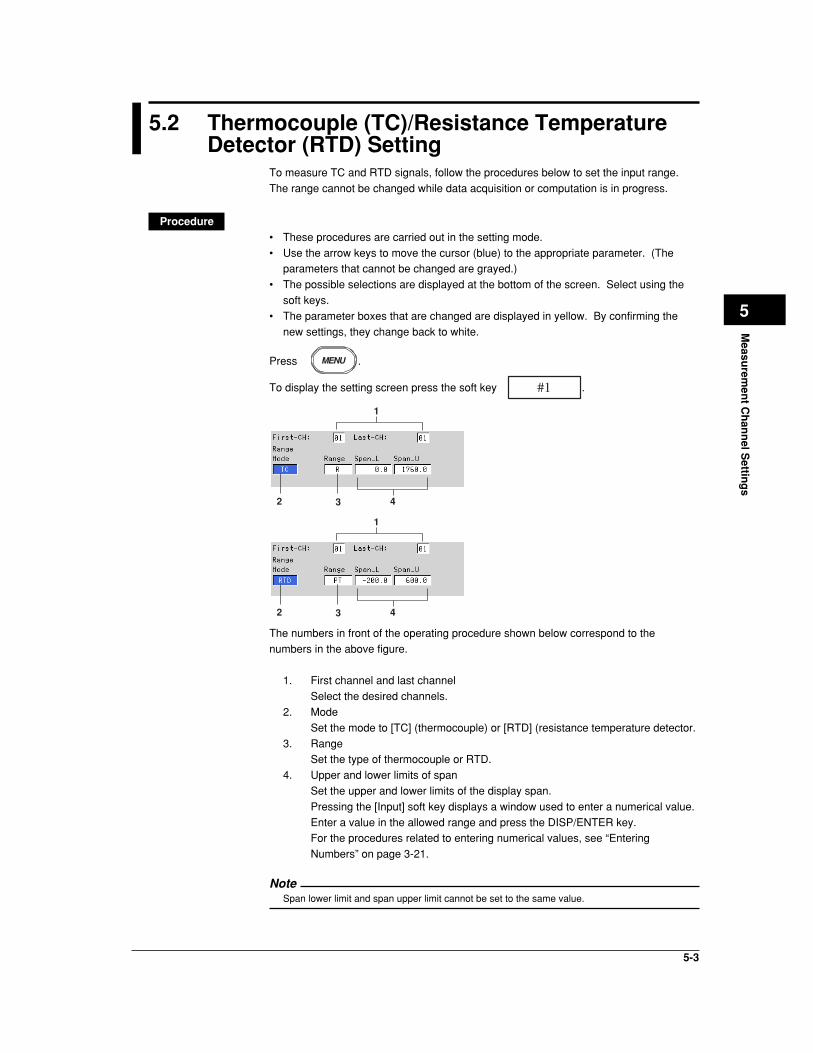
5-3
Measu
remen
t Ch
ann
el Settin
gs
5
5.2 Thermocouple (TC)/Resistance TemperatureDetector (RTD) Setting
To measure TC and RTD signals, follow the procedures below to set the input range.
The range cannot be changed while data acquisition or computation is in progress.
Procedure• These procedures are carried out in the setting mode.
• Use the arrow keys to move the cursor (blue) to the appropriate parameter. (Theparameters that cannot be changed are grayed.)
• The possible selections are displayed at the bottom of the screen. Select using the
soft keys.
• The parameter boxes that are changed are displayed in yellow. By confirming the
new settings, they change back to white.
Press MENU .
To display the setting screen press the soft key #1 .
1
2 3 4
1
2 3 4
The numbers in front of the operating procedure shown below correspond to the
numbers in the above figure.
1. First channel and last channel
Select the desired channels.
2. Mode
Set the mode to [TC] (thermocouple) or [RTD] (resistance temperature detector.
3. RangeSet the type of thermocouple or RTD.
4. Upper and lower limits of span
Set the upper and lower limits of the display span.
Pressing the [Input] soft key displays a window used to enter a numerical value.
Enter a value in the allowed range and press the DISP/ENTER key.For the procedures related to entering numerical values, see “Entering
Numbers” on page 3-21.
NoteSpan lower limit and span upper limit cannot be set to the same value.
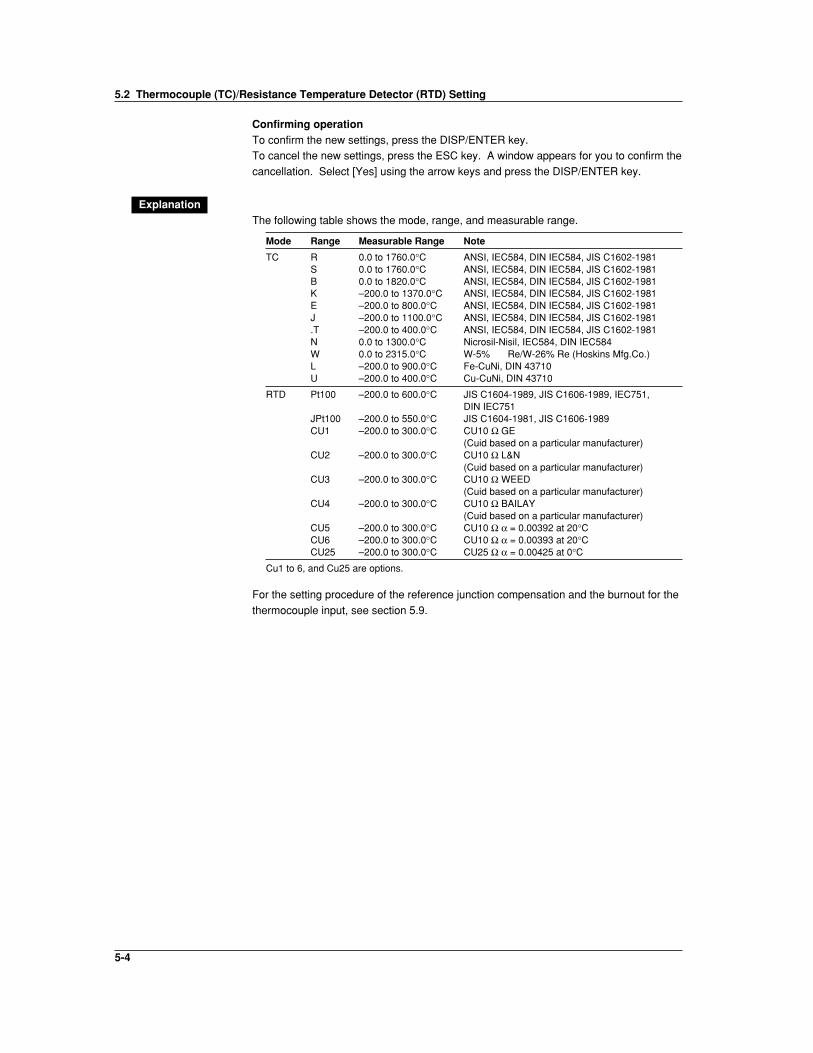
5-4
Confirming operationTo confirm the new settings, press the DISP/ENTER key.To cancel the new settings, press the ESC key. A window appears for you to confirm the
cancellation. Select [Yes] using the arrow keys and press the DISP/ENTER key.
ExplanationThe following table shows the mode, range, and measurable range.
Mode Range Measurable Range Note
TC R 0.0 to 1760.0°C ANSI, IEC584, DIN IEC584, JIS C1602-1981S 0.0 to 1760.0°C ANSI, IEC584, DIN IEC584, JIS C1602-1981B 0.0 to 1820.0°C ANSI, IEC584, DIN IEC584, JIS C1602-1981K –200.0 to 1370.0°C ANSI, IEC584, DIN IEC584, JIS C1602-1981E –200.0 to 800.0°C ANSI, IEC584, DIN IEC584, JIS C1602-1981J –200.0 to 1100.0°C ANSI, IEC584, DIN IEC584, JIS C1602-1981.T –200.0 to 400.0°C ANSI, IEC584, DIN IEC584, JIS C1602-1981N 0.0 to 1300.0°C Nicrosil-Nisil, IEC584, DIN IEC584W 0.0 to 2315.0°C W-5% Re/W-26% Re (Hoskins Mfg.Co.)L –200.0 to 900.0°C Fe-CuNi, DIN 43710U –200.0 to 400.0°C Cu-CuNi, DIN 43710
RTD Pt100 –200.0 to 600.0°C JIS C1604-1989, JIS C1606-1989, IEC751,DIN IEC751
JPt100 –200.0 to 550.0°C JIS C1604-1981, JIS C1606-1989CU1 –200.0 to 300.0°C CU10 Ω GE
(Cuid based on a particular manufacturer)CU2 –200.0 to 300.0°C CU10 Ω L&N
(Cuid based on a particular manufacturer)CU3 –200.0 to 300.0°C CU10 Ω WEED
(Cuid based on a particular manufacturer)CU4 –200.0 to 300.0°C CU10 Ω BAILAY
(Cuid based on a particular manufacturer)CU5 –200.0 to 300.0°C CU10 Ω α = 0.00392 at 20°CCU6 –200.0 to 300.0°C CU10 Ω α = 0.00393 at 20°CCU25 –200.0 to 300.0°C CU25 Ω α = 0.00425 at 0°C
Cu1 to 6, and Cu25 are options.
For the setting procedure of the reference junction compensation and the burnout for the
thermocouple input, see section 5.9.
5.2 Thermocouple (TC)/Resistance Temperature Detector (RTD) Setting

5-5
Measu
remen
t Ch
ann
el Settin
gs
5
5.3 Digital Input (DI) Setting
To measure the digital input (ON/OFF input), follow the procedures below to set the input
range. The range cannot be changed while data acquisition or computation is in
progress.
Procedure• These procedures are carried out in the setting mode.• Use the arrow keys to move the cursor (blue) to the appropriate parameter. (The
parameters that cannot be changed are grayed.)
• The possible selections are displayed at the bottom of the screen. Select using the
soft keys.
• The parameter boxes that are changed are displayed in yellow. By confirming thenew settings, they change back to white.
Press MENU .
To display the setting screen press the soft key #1 .
1
2 3 4
The numbers in front of the operating procedure shown below correspond to thenumbers in the above figure.
1. First channel and last channel
Select the desired channels.
2. ModeSet the mode to [DI].
3. Range
Select [Level] or [Cont] (Contact).
4. Upper and lower limits of span
Set the upper and lower limits of the display span.Pressing the [Input] soft key displays a window used to enter a numerical value.
Enter 0 or 1 and press the DISP/ENTER key.
For the procedures related to entering numerical values, see “Entering
Numbers” on page 3-21.
NoteSpan lower limit and span upper limit cannot be set to the same value.
Confirming operationTo confirm the new settings, press the DISP/ENTER key.
To cancel the new settings, press the ESC key. A window appears for you to confirm thecancellation. Select [Yes] using the arrow keys and press the DISP/ENTER key.

5-6
ExplanationThe following table shows the mode, range, and measurable range.
Mode Range Measurable Range
DI Level 0 : Less than 2.4 V1 : Greater than or equal to 2.4 V
Contact 0 : Opened1 : Closed
5.3 Digital Input (DI) Setting

5-7
Measu
remen
t Ch
ann
el Settin
gs
5
5.4 Difference Computation (Delta) Setting
To measure the difference between the inputs of two channels, follow the procedures
below to set the input range. The difference computation channel displays the computed
result of “(the measured value of the difference computation channel) - (the measured
value of the reference channel).” Select the input type for the difference computationchannel from DC voltage, thermocouple, RTD, and ON/OFF input. The range cannot be
changed while data acquisition or computation is in progress.
Procedure• These procedures are carried out in the setting mode.• Use the arrow keys to move the cursor (blue) to the appropriate parameter. (The
parameters that cannot be changed are grayed.)
• The possible selections are displayed at the bottom of the screen. Select using the
soft keys.
• The parameter boxes that are changed are displayed in yellow. By confirming thenew settings, they change back to white.
Press MENU .
To display the setting screen press the soft key #1 .1
2 3 4 5 6
The numbers in front of the operating procedure shown below correspond to the
numbers in the above figure.
1. First channel and last channel
Set the channels that will measure the difference.
2. Mode
Set the mode to [Delta].3. Type
Select the input type from [Volt], [TC], [RTD], and [DI].
4. Range
If the type is [Volt] enter the input range. If it is [TC] or [RTD] enter the type of
TC or RTD. If it is [DI] enter [Level] or [Cont].5. Upper and lower limits of span
Set the upper and lower limits of the display span.
Pressing the [Input] soft key displays a window used to enter a numerical value.
Enter a value in the allowed range and press the DISP/ENTER key.
For the procedures related to entering numerical values, see “EnteringNumbers” on page 3-21.
Note• For TC or RTD input, the display span cannot exceed the difference between the maximum
and the minimum of the input range.
Example : For TC type L, the input range is –200.0 to 900.0°C.
The allowed range of display span: –1100.0 to 1100.0°C.
• For DC voltage input, the display span cannot exceed the input range.
• The upper limit and the lower limit cannot be set to the same value.

5-8
6. Ref. CH
Set the reference channel (See the explanation).
Confirming operationTo confirm the new settings, press the DISP/ENTER key.
To cancel the new settings, press the ESC key. A window appears for you to confirm the
cancellation. Select [Yes] using the arrow keys and press the DISP/ENTER key.
ExplanationThe following table shows the mode, type, range, and measurable range.
Mode Type Range Measurable Range
Delta Volt 20 mV –20.00 to 20.00 mV60 mV –60.00 to 60.00 mV200 mV –200.0 to 200.0 mV2 V –2.000 to 2.000 V6 V –6.000 to 6.000 V20 V –20.00 to 20.00 V
Delta TC R –1760.0 to 1760.0°CS –1760.0 to 1760.0°CB –1820.0 to 1820.0°CK –1570.0 to 1570.0°CE –1000.0 to 1000.0°CJ –1300.0 to 1300.0°CT –600.0 to 600.0°CN –1300.0 to 1300.0°CW –2315.0 to 2315.0°CL –1100.0 to 1100.0°CU –600.0 to 600.0°C
Delta RTD Pt100 –800.0 to 800.0°CJPt100 –750.0 to 750.0°CCU1 to 6 (CU10) –500.0 to 500.0°C (option)CU25 –500.0 to 500.0°C (option)
Delta DI Level –1 to 1Contact –1 to 1
The relationship with the reference channelEven if the input type or the measurement range of the difference computation channel
and the reference channel is not the same, the difference computation is performed
according to the following rules.
• When the decimal position between the reference channel and the difference
computation channel is different, the measured value of the reference channel isadjusted to the decimal position of the measured value of the difference computation
channel to make the computation.
Example : When the measured value of the difference computation channel is 10.00
and the measured value of the reference channel is 100.0, the
computation result becomes 10.00 – 100.0 = –90.00.• When the units for the reference channel and the difference computation channel are
different, the measured value is not adjusted.
Example : When the measured value of the difference computation channel is 10.00 V
and the measured value of the reference channel is 5.00 mV, the
computation result becomes 10.00 V – 5.00 mV = 5.00 V.• When the reference channel is set to [Scale] or [Sqrt], the computation uses the
scaled values.
5.4 Difference Computation (Delta) Setting.

5-9
Measu
remen
t Ch
ann
el Settin
gs
5
5.5 Scaling Setting
For DC voltage, thermocouple, RTD and ON/OFF input, the measured values can be
scaled to a value in the appropriate unit and displayed. Set the upper and lower limits of
the input’s display span, the upper and lower limits after scaling, and the unit. The range
cannot be changed while data acquisition or computation is in progress.
Procedure• These procedures are carried out in the setting mode.
• Use the arrow keys to move the cursor (blue) to the appropriate parameter. (The
parameters that cannot be changed are grayed.)
• The possible selections are displayed at the bottom of the screen. Select using the
soft keys.• The parameter boxes that are changed are displayed in yellow. By confirming the
new settings, they change back to white.
Press MENU .
To display the setting screen press the soft key #1 .
1
2 3 4 6 7
5
The numbers in front of the operating procedure shown below correspond to the
numbers in the above figure.
1. First channel and last channelSelect the desired channels.
2. Mode
Set the mode to [Scale].
3. Type
Select the input type from [Volt], [TC], [RTD], and [DI].4. Range
Select the input range using the soft keys according to the input type.
5. Upper and lower limits of span
Set the upper and lower limits of the display span.
Pressing the [Input] soft key displays a window used to enter a numerical value.Enter a value in the allowed range and press the DISP/ENTER key.
For the procedures related to entering numerical values, see “Entering
Numbers” on page 3-21.
NoteSpan lower limit and span upper limit cannot be set to the same value.
5-10
6. Upper and lower limits of span
Set the upper and lower limits of the display span.Pressing the [Input] soft key displays a window used to enter a numerical value.
Enter a value in the allowed range and press the DISP/ENTER key. For the
procedures related to entering numerical values, see “Entering Numbers” on
page 3-21.
• Allowed range : –30000 to 30000• Decimal position :
The decimal can be set in the following positions : “ . ”
“ . ” “ . ” “ . ” “ ”
• The decimal position is determined by the scale lower limit setting.
Note• Scale lower limit and scale upper limit cannot be set to the same value.
• The recorder converts the measured data within a value span derived by removing the
decimal from the scaling upper and lower limits. In other words, conversion is performed by
using a span of 10 if the scale setting is –5 to 5, and 100 if the scale setting is –5.0 to 5.0.
The resolution of the value derived by using a span of 10 is coarser than the value derived
using a span of 100. Because the display becomes rough, set this value so that it is greater
than 100.
7. Unit
Set the unit.
Pressing the [Input] soft key displays a window used to enter a character string.
Enter the unit (up to 6 alphanumeric characters) and press the DISP/ENTERkey.
For the procedures related to entering character strings, see “Entering
Characters” on page 3-22.
Confirming operationTo confirm the new settings, press the DISP/ENTER key.
To cancel the new settings, press the ESC key. A window appears for you to confirm the
cancellation. Select [Yes] using the arrow keys and press the DISP/ENTER key.
Explanation
Mode Type Range/Measurable Range
Scale Volt See section 5.1, “Voltage Input Setting.”TC See section 5.2, “Thermocouple (TC)/Resistance Temperature
Detector (RTD) Setting.”RTD See section 5.2, “Thermocouple (TC)/Resistance Temperature
Detector (RTD) Setting.”DI See section 5.3, “Digital Input (DI) Setting.”
5.5 Scaling Setting
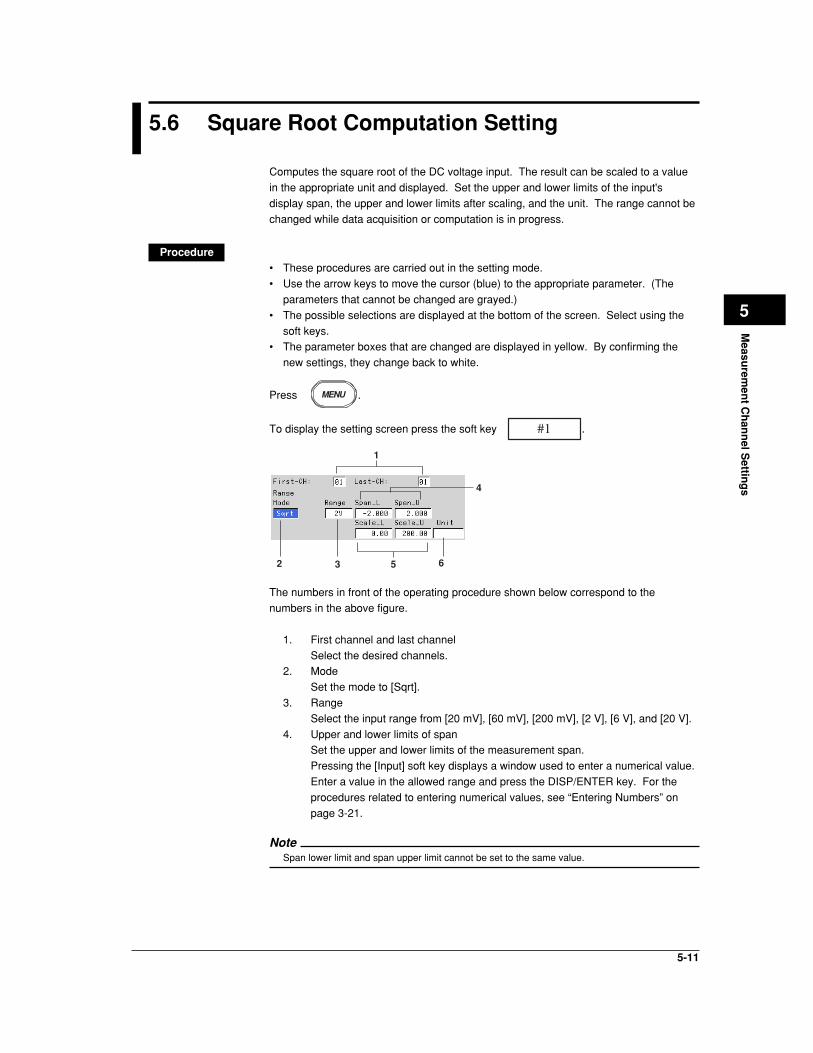
5-11
Measu
remen
t Ch
ann
el Settin
gs
5
5.6 Square Root Computation Setting
Computes the square root of the DC voltage input. The result can be scaled to a value
in the appropriate unit and displayed. Set the upper and lower limits of the input's
display span, the upper and lower limits after scaling, and the unit. The range cannot be
changed while data acquisition or computation is in progress.
Procedure• These procedures are carried out in the setting mode.
• Use the arrow keys to move the cursor (blue) to the appropriate parameter. (The
parameters that cannot be changed are grayed.)
• The possible selections are displayed at the bottom of the screen. Select using the
soft keys.• The parameter boxes that are changed are displayed in yellow. By confirming the
new settings, they change back to white.
Press MENU .
To display the setting screen press the soft key #1 .
1
2 3
4
65
The numbers in front of the operating procedure shown below correspond to the
numbers in the above figure.
1. First channel and last channel
Select the desired channels.2. Mode
Set the mode to [Sqrt].
3. Range
Select the input range from [20 mV], [60 mV], [200 mV], [2 V], [6 V], and [20 V].
4. Upper and lower limits of spanSet the upper and lower limits of the measurement span.
Pressing the [Input] soft key displays a window used to enter a numerical value.
Enter a value in the allowed range and press the DISP/ENTER key. For the
procedures related to entering numerical values, see “Entering Numbers” on
page 3-21.
NoteSpan lower limit and span upper limit cannot be set to the same value.
5-12
5. Upper and lower limits of scale
Set the upper and lower limits of the scale.Pressing the [Input] soft key displays a window used to enter a numerical value.
Enter a value in the allowed range and press the DISP/ENTER key. For the
procedures related to entering numerical values, see “Entering Numbers” on
page 3-21.
• Allowed range : –30000 to 30000• Decimal position :
The decimal can be set in the following positions : “ . ”
“ . ” “ . ” “ . ” “ ”
• The decimal position is determined by the scale lower limit setting.
Note• Scale lower limit and scale upper limit cannot be set to the same value.
• The recorder converts the measured data within a value span derived by removing the
decimal from the scaling upper and lower limits. In other words, conversion is performed by
using a span of 10 if the scale setting is –5 to 5, and 100 if the scale setting is –5.0 to 5.0.
The resolution of the value derived by using a span of 10 is coarser than the value derived
using a span of 100. Because the display becomes rough, set this value so that it is greater
than 100.
6. Unit
Set the unit.Pressing the [Input] soft key displays a window used to enter a character string.
Enter the unit (up to 6 alphanumeric characters) and press the DISP/ENTER
key. For the procedures related to entering character strings, see “Entering
Characters” on page 3-22.
Confirming operationTo confirm the new settings, press the DISP/ENTER key.
To cancel the new settings, press the ESC key. A window appears for you to confirm the
cancellation. Select “YES” using the arrow keys and press the DISP/ENTER key.
ExplanationFor the range, and measurable range, see section 5.1, “Voltage Input Setting.”
Computing equationThe RD-MV100 uses the following square-root computation :
Using the following definitions :
• Vmin : Lower limit of span• Vmax : Upper limit of span
• Fmin : Lower limit of scale
• Fmax : Upper limit of scale
• Vx : Input voltage
• Fx : Scaling value
V – V
V – V+ Fx
max minmaxF = (F – F )x min min
min
When the value inside the square root is negative,when Fmin < Fmax, Fx = negative overflow “– ”
when Fmin > Fmax, Fx = positive overflow “+ ”
5.6 Square Root Computation Setting

5-13
Measu
remen
t Ch
ann
el Settin
gs
5
5.7 Skip Setting
These channels will not be measured or displayed. The range cannot be changed while
data acquisition or computation is in progress.
Procedure• These procedures are carried out in the setting mode.
• Use the arrow keys to move the cursor (blue) to the appropriate parameter. (Theparameters that cannot be changed are grayed.)
• The possible selections are displayed at the bottom of the screen. Select using the
soft keys.
• The parameter boxes that are changed are displayed in yellow. By confirming the
new settings, they change back to white.
Press MENU .
To display the setting screen press the soft key #1 .
1
2
The numbers in front of the operating procedure shown below correspond to the
numbers in the above figure.
1. First channel and last channelSelect the desired channels.
2. Mode
Set the mode to [Skip].
Confirming operationTo confirm the new settings, press the DISP/ENTER key.
To cancel the new settings, press the ESC key. A window appears for you to confirm the
cancellation. Select [Yes] using the arrow keys and press the DISP/ENTER key.

5-14
5.8 Input Filter and Moving Average Setting
Set the input filter (for RD-MV102/RD-MV104, low pass filters) or the moving average ofthe input (for RD-MV106/RD-MV112).
Procedure• These procedures are carried out in the setting mode.• Use the arrow keys to move the cursor (blue) to the appropriate parameter. (The
parameters that cannot be changed are grayed.)• The possible selections are displayed at the bottom of the screen. Select using the
soft keys.• The parameter boxes that are changed are displayed in yellow. By confirming the
new settings, they change back to white.
Press MENU .
To display the setting screen press the soft key #2 .
11
32
The numbers in front of the operating procedure shown below correspond to the
numbers in the above figure.1. First channel and last channel
Select the desired channels. (For the channels set here, [Tag] and [Alarm DelayTime] are also simultaneously set.)
Input filter setting (for RD-MV102/RD-MV104)2. Filter - Filter
Select [Off] or set the time constant of the filter.
Moving average setting (for RD-MV106/RD-MV112)3. Moving Average - Count
Select [Off] or set the number of data points for the moving average.Note
Regardless of this setting, filter and moving average operations are not performed for thedigital inputs (DI).
Confirming operationTo confirm the new settings, press the DISP/ENTER key.To cancel the new settings, press the ESC key. A window appears for you to confirm thecancellation. Select [Yes] using the arrow keys and press the DISP/ENTER key.
ExplanationThe following table shows the values.
Filter/Moving Average Value Description
Filter Off Do not use the filter2 s Filter time constant 2 s5 s Filter time constant 5 s10 s Filter time constant 10 s
Moving Average Off Do not use moving average.2 to 16 Number of data samples for the moving average

5-15
Measu
remen
t Ch
ann
el Settin
gs
5
5.9 Setting the A/D Integration Time, Scan Interval,Burnout, and Reference JunctionCompensation (Basic Setting Mode)
Set the integration time of the input A/D converter, scan interval, thermocouple input
burnout, and reference junction compensation (RJC).
Procedure• These procedures are carried out in the basic setting mode.• Use the arrow keys to move the cursor (blue) to the appropriate parameter.
• The possible selections are displayed at the bottom of the screen. Select using the
soft keys.
• The parameter boxes that are changed are displayed in yellow. By confirming the
new settings, they change back to white.
Press MENU .
Press FUNC for 3 seconds. The menu screen for the basic setting mode appears.
To display the setting screen press the soft key #2 .
12
3456
The numbers in front of the operating procedure shown below correspond to the
numbers in the above figure.
Setting the integration time of the input A/D converter1. A/D Integration time
Select from [Auto], [50 Hz], [60 Hz], and [100 ms] using soft keys.
RD-MV102/RD-MV104 : Auto/50 Hz/60 HzRD-MV106/RD-MV112 : Auto/50 Hz/60 Hz/100 ms
AUTO : automatically switches 20/16.7 ms
50 Hz : fixed to 20 ms
60 Hz : fixed to 16.7 ms
100 ms : fixed to 100 ms (the scan interval is 2 s)Setting the scan interval
2. Scan interval
Input signals are scanned at every scan interval. For the models with
computation function (/M1) , the computation carried out at every scan interval.
RD-MV102/RD-MV104 : 125 ms/250 msRD-MV106/RD-MV112 : 1 s/2 s (when the A/D integration time is 100 ms, 2 s
only)
Setting the thermocouple input burnout and setting the reference junctioncompensationThis setting is void for all ranges other than the TC.
3. First channel and last channel
Select the desired channels.

5-16
4. Burnout
Select from [Off], [Up], and [Down].Off : Disable the burnout function.
Up : When the thermocouple burns out, the measured result is set to
positive over range “+ .”
Down : When the thermocouple burns out, the measured result is set to
negative over range “+ ”.5. RJC
Set [External] or [Internal].
External : Use the external RJC.
Internal : Use the RJC of the recorder.
6. Volt (µV)If [External] is selected, set the reference junction compensation voltage to add
to the input.
Pressing the [Input] soft key displays a window used to enter the voltage. Enter
a value (–20000 µV to 20000 µV, initial value is 0 µV) and press the DISP/
ENTER key. For the procedures related to entering numerical values, see“Entering Numbers” on page 3-21.
Confirming operationTo confirm the new settings, press the DISP/ENTER key.
To cancel the new settings, press the ESC key. A window appears for you to confirm the
cancellation. Select [Yes] using the arrow keys and press the DISP/ENTER key.
ExplanationThe integration time of the input A/D converterThe recorder uses an A/D converter to convert the input signal to a digital signal. The A/
D converter operates at an integral time of 16.7 ms (60 Hz), 20 ms (50 Hz), or 100 ms.
By setting the integration time to match the frequency of the power supply being used,
power supply frequency noise can be minimized.
Burnout of thermocouple inputWhen the alarm is set to detect positive or negative over range, the occurrence ofburnout of thermocouple can be displayed as an alarm.
Turn the burnout function OFF when connecting the input wires in parallel with other
devices.
Reference junction compensation of thermocouple inputWhen using the reference junction compensation of the RD-MV100, see “Precautions to
be taken while wiring” in section 2.3, “Input Signal Wiring.”
When using the external reference junction compensation, set an appropriate referencejunction compensation voltage. As in the example in the following figure, if the reference
junction temperature for the external reference junction compensation is T0 °C, set the
thermoelectromotive force of the 0 °C reference for T0 °C as the reference junction
compensation voltage.An example of External reference junction compensation
External reference junction compensation(Maintain the junction between the thermocouple and the copper wire at T0 °C)
ThermocoupleCopper wireRD-MV100
5.9 Setting the A/D Integration Time, Scan Interval, Burnout, and Reference Junction Compensation (BasicSetting Mode)

6-1
Ackn
ow
ledg
ing
and
Settin
g A
larms
6
6.1 Releasing the Alarm Indication and OutputRelay (Option)
This section describes the procedures to release the alarm indication and the outputrelay when the behavior of the indicator or the output relay is set to [hold]. The indicatoror output relay condition varies depending on the timing at which the alarm releaseoperation is carried out.
ProcedureThis operation is carried out in the operation mode.
1. Press the FUNC key to display the soft key menu.2. To release the alarm indication and the output relay, press the [Alarm ACK] soft
key.
Explanation• The indications and output relays generated by all alarms are released.• The release operation is void if the behavior of the indicator or the output relay is set
to [non-hold].• The release operation can be executed via remote control (option) or via
communications.
Alarm indicationThe alarm condition can be confirmed with the alarm icon in the status display sectionand the alarm indication on the operation screen such as the trend display. The indicatorpattern varies depending on the hold/non-hold setting.• The alarm icon in the status display section
Alarm icon
Indicator Hold/Non-hold Alarm Alarm Indication
Non-hold* Activated Red icon
Released No icon displayed
Hold Activated Blinking red icon (Stops blinking withalarm ACK)
Released Blinking green icon (icon disappearswith alarm ACK)
* When the alarm indication is set to non-hold, alarm ACK does not work.
Chapter 6 Acknowledging and Setting Alarms
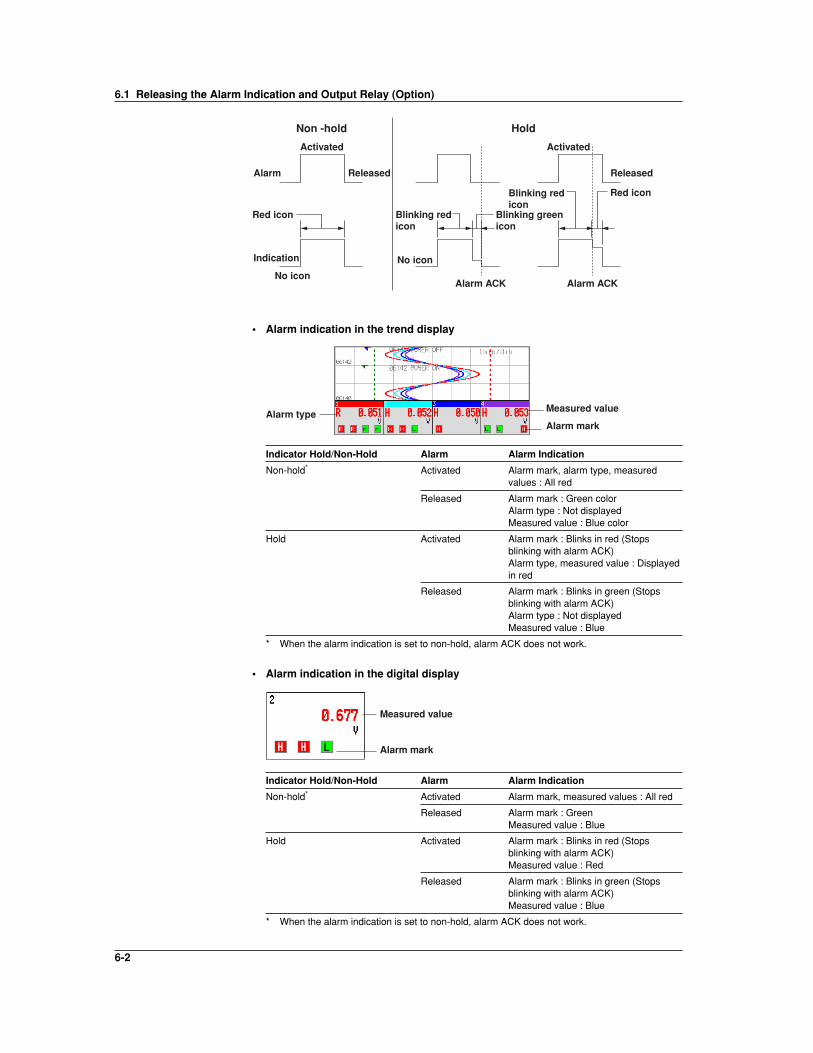
6-2
Alarm Released
Indication
No icon
No icon
Alarm ACK Alarm ACK
Activated
Non -hold Hold
Released
Activated
Red icon Blinking red icon
Blinking green icon
Red iconBlinking red icon
• Alarm indication in the trend display
Measured value
Alarm markAlarm type
Indicator Hold/Non-Hold Alarm Alarm Indication
Non-hold* Activated Alarm mark, alarm type, measuredvalues : All red
Released Alarm mark : Green colorAlarm type : Not displayedMeasured value : Blue color
Hold Activated Alarm mark : Blinks in red (Stopsblinking with alarm ACK)Alarm type, measured value : Displayedin red
Released Alarm mark : Blinks in green (Stopsblinking with alarm ACK)Alarm type : Not displayedMeasured value : Blue
* When the alarm indication is set to non-hold, alarm ACK does not work.
• Alarm indication in the digital display
Measured value
Alarm mark
Indicator Hold/Non-Hold Alarm Alarm Indication
Non-hold* Activated Alarm mark, measured values : All red
Released Alarm mark : GreenMeasured value : Blue
Hold Activated Alarm mark : Blinks in red (Stopsblinking with alarm ACK)Measured value : Red
Released Alarm mark : Blinks in green (Stopsblinking with alarm ACK)Measured value : Blue
* When the alarm indication is set to non-hold, alarm ACK does not work.
6.1 Releasing the Alarm Indication and Output Relay (Option)

6-3
Ackn
ow
ledg
ing
and
Settin
g A
larms
6
• Alarm indication in the bar graph display
Alarm mark
Alarm point mark
Measured value
Indicator Hold/Non-Hold Alarm Alarm Indication
Non-hold* Activated Alarm mark, alarm point mark, andmeasured values : All red
Released Alarm mark : GreenAlarm point mark : GreenMeasured value : Blue
Hold Activated Alarm mark : Blinks in red (Stopsblinking with alarm ACK)Alarm point, measured values : Red
Released Alarm mark : Blinks in green (Stopsblinking with alarm ACK)Alarm point mark : GreenMeasured value : Blue
* When the alarm indication is set to non-hold, alarm ACK does not work.
Alarm indication in the overview display
Channel data display area
Measured value
Channel/Tag
Alarm type
Indicator Hold/Non-Hold Alarm Alarm Indication
Non-hold* Activated Channel display area : RedChannel (tag), alarm type, andmeasured values : All white
Released Channel display area : GreenChannel (tag) and measured value :BlackAlarm type : Not displayed
Hold Activated Channel display area : RedChannel (tag) : Blinks in white (Stopsblinking with alarm ACK)Alarm type and measured value : White
Released Channel display area : GreenChannel (tag) : Blinks in black (Stopsblinking with alarm ACK)Alarm type : Not displayedMeasured value : Black
* When the alarm indication is set to non- hold, alarm ACK does not work.
6.1 Releasing the Alarm Indication and Output Relay (Option)

6-4
• Alarm summary display
Mark Alarm Information
Indicator Hold/Non-Hold Alarm Alarm Indication
Non-hold* Activated Displays alarm informationMark : Red
Released Mark : Green
Hold Activated Displays alarm infomrationMark : Blinks in red (Stops blinking withalarm ACK)
Released Mark : Blinks in green (Stops blinkingwith alarm ACK)
* When the alarm indication is set to non-hold, alarm ACK does not work.
Alarm output relay
Relay Hold/Non-Hold Alarm Alarm Indication
Non-hold* Activated Active
Released Idle
Hold Activated Active (temporarily suspend with alarmACK)
Released Idle with alarm ACK
* When the alarm output relay is set to non-hold, alarm ACK does not work.
Alarm
Activated
Released
Alarm outputrelay
Alarm ACK Alarm ACK
or
or
HoldNon-hold
Activated
Released
6.1 Releasing the Alarm Indication and Output Relay (Option)

6-5
Ackn
ow
ledg
ing
and
Settin
g A
larms
6
6.2 Alarm Setting
This section describes the procedures related to setting the alarm specification on each
channel. The auxiliary alarm function are set in the basic setting mode. (See section 6.4)
Note• Set the measurement range before setting the alarm.
• All of the alarm settings of a channel are canceled in the following cases :
• When the input type is changed (Volt, TC, etc.).
• When the input range is changed.
• When displaying the scale or computing the square root and the measurement span or
scaling value is changed (includes decimal position change).
• If the range setting is set to [Skip], alarm setting is not possible. (The alarm setting boxes are
grayed in this case.)
Procedure• These procedures are carried out in the setting mode.
• Use the arrow keys to move the cursor (blue) to the appropriate parameter. (Theparameters that cannot be changed are grayed.)
• The possible selections are displayed at the bottom of the screen. Select using the
soft keys.
• The parameter boxes that are changed are displayed in yellow. Once new settings
are confirmed, they change back to white.
Press MENU .
To display the setting screen press the soft key #1 .
1
2 3 4 5 6
The numbers in front of the operating procedure shown below correspond to the
numbers in the above figure.
1. First channel and last channel
Select the desired channels. (For the channels set here, [Range] is alsosimultaneously set.)
2. On/Off
When the alarm is turned on, [Type], [Value], and [Relay On/Off] are displayed.
3. Type
Set the alarm type. For the alarm types, see “Explanation.”

6-6
NoteIf you select delay alarm (T or t) for the alarm type, you must set the alarm delay period. See
section 6.3.
4. ValueEnter the value at which the alarm is activated.
Pressing the [Input] soft key displays a window used to enter a numerical value.
Enter a value in the allowed range and press the DISP/ENTER key.
For the procedures related to entering numerical values, see “Entering
Numbers” on page 3-21.5.* Relay On/Off
Set whether or not to activate the output relay (On/Off). When turned ON, the
output relay number box appears.
6.* Number
Set the output relay number. For the correspondence between the output relaynumber and the output relay position, see section 2.4, “Alarm Output Wiring
(Option).”
* When the alarm output relay option is not installed, these settings are void.
Confirming operationTo confirm the new settings, press the DISP/ENTER key.
To cancel the new settings, press the ESC key. A window appears for you to confirm the
cancellation. Select [Yes] using the arrow keys and press the DISP/ENTER key.
ExplanationAlarm typeThe following eight types of alarm type are available.
Name Symbol Description
Upper limit alarm H An alarm occurs when the measured valuebecomes greater than or equal to the alarmvalue.
Lower limit alarm L An alarm occurs when the measured valuebecomes smaller than or equal to below thealarm value.
Difference upper limit alarm*1 h An alarm occurs when the differencebetween the measured values of twochannels becomes greater than or equal tothe alarm value.
Difference lower limit alarm*1 l An alarm occurs when the differencebetween the measured values of twochannels becomes smaller than or equal tothe alarm value.
Upper limit on rate-of-change alarm*2 R The amount of change of the measuredvalues over a certain time interval ischecked. An alarm occurs when theamount of increase becomes greater thanor equal to the specified value (see section6.4).The time interval is specified using anumber of measurements.
6.2 Alarm Setting

6-7
Ackn
ow
ledg
ing
and
Settin
g A
larms
6
Name Symbol Description
Lower limit on rate-of-change alarm*2 r The amount of change of the measuredvalues over a certain time interval ischecked. An alarm occurs when theamount of decrease becomes greater thanor equal to the specified value (see section6.4).The time interval is specified using anumber of measurements.
Delay upper limit alarm T An alarm occurs when the measured valueremains above or equal to the alarm valuefor the specified time period (delay period,see section 6.3, “Setting the Alarm DelayPeriod.”).
Delay lower limit alarm t An alarm occurs when the measured valueremains below or equal to the alarm valuefor the specified time period (delay period,see section 6.3, “Setting the Alarm DelayPeriod.”).
*1 Can be specified only on difference computation channels.*2 Can be specified only on measurement channels.
6.2 Alarm Setting

6-8
6.3 Setting the Alarm Delay Period
Set the alarm delay period for delayupper/lower limit alarm.
Procedure• These procedures are carried out in the setting mode.
• Use the arrow keys to move the cursor (blue) to the appropriate parameter. (The
parameters that cannot be changed are grayed.)• The possible selections are displayed at the bottom of the screen. Select using the
soft keys.
• The parameter boxes that are changed are displayed in yellow. Once new settings
are confirmed, they change back to white.
Press MENU .
Setting on a measurement channel
To display the setting screen press the soft key #2 .
Setting on a computation channel (option)
Twice press the soft key Next 1/3 .
To display the setting screen press the soft key #11 .
2
1
The numbers in front of the operating procedure shown below correspond to the
numbers in the above figure.
1. First channel and last channel
Select the desired channels. (For the channels set here, [Tag], [MovingAverage] or [Filter] for measurement channels, and [Tag], [TLOG] or [Rolling
Average] for computation channels are also simultaneously set.)
2. Alarm delay period
Pressing the [Input] soft key displays a window used to enter the alarm delay
period. Enter an integer value in the range 1 to 3600 s and press the DISP/ENTER key. Procedures related to entering numerical values, see “Entering
Numbers” on page 3-21.
If the scan interval is 2 s and you set an odd value for the alarm delay period, it
will operate at the specified period + 1 s.
Example : If the alarm delay period is set to 5 s, it will operate at 6 s.
Confirming operationTo confirm the new settings, press the DISP/ENTER key.To cancel the new settings, press the ESC key. A window appears for you to confirm the
cancellation. Select [Yes] using the arrow keys and press the DISP/ENTER key.

6-9
Ackn
ow
ledg
ing
and
Settin
g A
larms
6
ExplanationOperation of the delay upper/lower limit alarmFor the operation of the delay upper/lower limit alarm, see section 1.5, “Alarm Function.”
This section will describe special cases of its operation.
• When delay alarm is set on a computation channel and the computation isstoppedIf the computation is stopped in a condition in which the computed value is exceeding
the alarm setting, the alarm is turned ON after the specified period (delay period)
elapses.
Alarm turns ON
TComputed value
Computation stopped
Alarm setting
• Delay alarm when a power failure occursAlarm detection is reset upon a power failure. It restarts the operation after the powerrecovers.
Power failure/recovery Power failure/recovery
TT T T
Alarm Off On Off On Off On Off
Measured/computed value
Alarm setting
• Operation when the alarm setting is changedIf a new delay alarm is set, the alarm detection starts at that time. It is unaffected by
the conditions existing before the alarm is set.
If the alarm setting of a preexisting delay alarm is changed
• If an alarm is not occurring at the time of the change, alarm detection starts at thenew setting.
• If an alarm is occurring at the time of the change and the alarm type is set to delay
upper limit alarm, the alarm continues as long as the input is above or equal to the
new setting. If the input is below the new setting, the alarm turns OFF. If the alarm
type is set to delay lower limit alarm, the alarm continues as long as the input isbelow or equal to the new setting. If the input is above the new setting, the alarm
turns OFF.
6.3 Setting the Auxiliary Alarm Function (Basic Setting Mode)

6-10
6.4 Setting the Auxiliary Alarm Function (BasicSetting Mode)
Set the auxiliary alarm function.
Procedure• These procedures are carried out in the basic setting mode.
• Use the arrow keys to move the cursor (blue) to the appropriate parameter.
• The possible selections are displayed at the bottom of the screen. Select using the
soft keys.• The parameter boxes that are changed are displayed in yellow. Once new settings
are confirmed, they change back to white.
Press MENU .
Press FUNC for 3 seconds. The menu screen for the basic setting mode appears.
To display the setting screen press the soft key #1 .
12345
6
7
The numbers in front of the operating procedure shown below correspond to the
numbers in the above figure.
Setting reflash1.* Reflash
Select [On] or [Off].
On : Use reflash function
Off : Not use reflash functionSetting the AND/OR logic of output relays
2.* Relay - AND
Select the relays that are to use the AND logic. Set the last relay that is to use
the AND logic. The relays beyond this relay will use the OR logic.
Select from [None], [I01] (I01 only), [I01 - I02] (I01 and I02), ... , and [I01 - I06](I01 to I06). The setting is valid for relays specified by options.
Setting the output relay operation (energized/de-energized)3.* Relay - Action
Select energize or de-energize using the soft key.
Setting the output relay operation (hold/non-hold)4.* Relay - Behavior
Select hold or non-hold using the soft key.* When the alarm output relay option is not installed, these settings are void.
Setting the alarm indication operation (hold/non-hold)5. Indicator
Select hold or non-hold using the soft key.
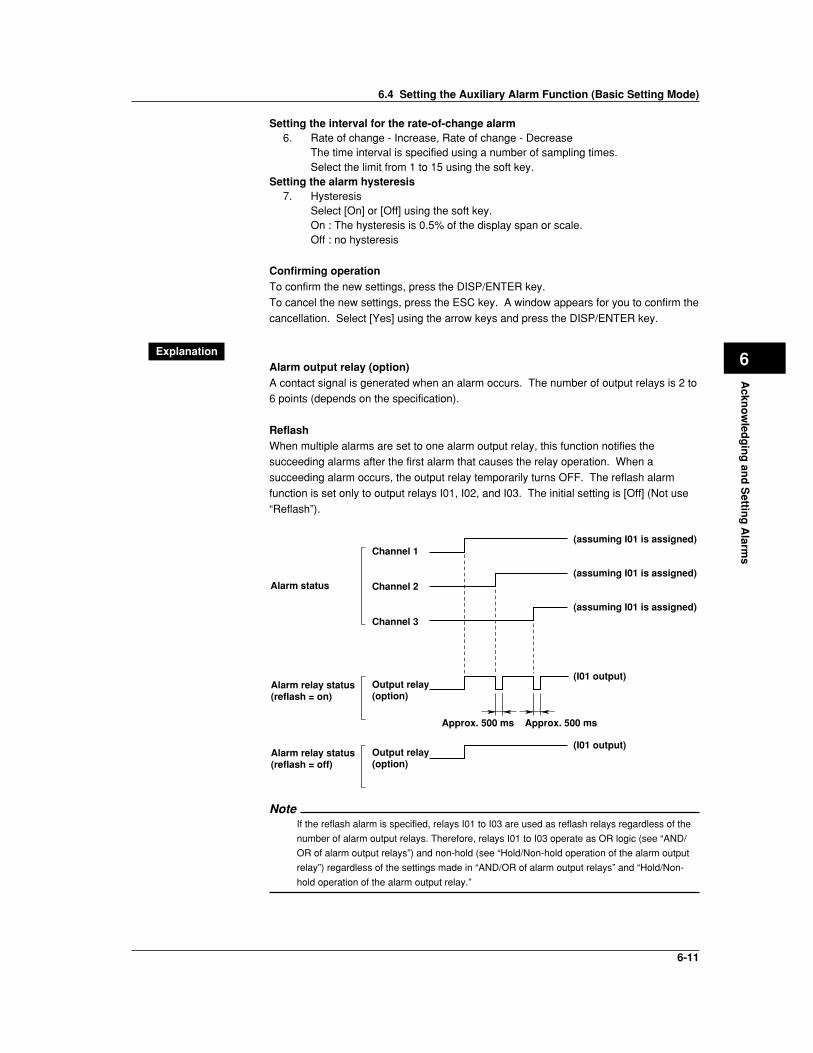
6-11
Ackn
ow
ledg
ing
and
Settin
g A
larms
6
Setting the interval for the rate-of-change alarm6. Rate of change - Increase, Rate of change - Decrease
The time interval is specified using a number of sampling times.Select the limit from 1 to 15 using the soft key.
Setting the alarm hysteresis7. Hysteresis
Select [On] or [Off] using the soft key.On : The hysteresis is 0.5% of the display span or scale.Off : no hysteresis
Confirming operationTo confirm the new settings, press the DISP/ENTER key.
To cancel the new settings, press the ESC key. A window appears for you to confirm the
cancellation. Select [Yes] using the arrow keys and press the DISP/ENTER key.
ExplanationAlarm output relay (option)A contact signal is generated when an alarm occurs. The number of output relays is 2 to6 points (depends on the specification).
ReflashWhen multiple alarms are set to one alarm output relay, this function notifies thesucceeding alarms after the first alarm that causes the relay operation. When a
succeeding alarm occurs, the output relay temporarily turns OFF. The reflash alarm
function is set only to output relays I01, I02, and I03. The initial setting is [Off] (Not use
“Reflash”).
Alarm status
Alarm relay status(reflash = on)
Channel 1
Channel 2
Channel 3
Output relay(option)
Approx. 500 ms Approx. 500 ms
Alarm relay status(reflash = off)
Output relay(option)
(assuming I01 is assigned)
(assuming I01 is assigned)
(assuming I01 is assigned)
(I01 output)
(I01 output)
NoteIf the reflash alarm is specified, relays I01 to I03 are used as reflash relays regardless of the
number of alarm output relays. Therefore, relays I01 to I03 operate as OR logic (see “AND/
OR of alarm output relays”) and non-hold (see “Hold/Non-hold operation of the alarm output
relay”) regardless of the settings made in “AND/OR of alarm output relays” and “Hold/Non-
hold operation of the alarm output relay.”
6.4 Setting the Auxiliary Alarm Function (Basic Setting Mode)

6-12
AND/OR of alarm output relaysWhen sharing an alarm output relay among multiple alarms, you can select from thefollowing conditions that cause the alarm output relay to be activated.
• AND : Activated when all alarms are being generated simultaneously.
• OR : Activated when at least one of the alarms is being generated.
Specify the alarm output relay to operate under the AND condition as in [I01 (first relay)
to Ixx (where xx is the relay number)]. The initial setting is set to [None].
Alarm status
Channel 1
AND
Channel 2
OR
Alarm relay status
NoteIf the reflash alarm is turned ON, I01 to I03 operates as reflash alarms. They are fixed to OR
logic operation. Specifying AND produces no effect.
Energize/de-energize operation of the alarm output relayYou can select whether to energize or de-energize the alarm output relay when thealarm occurs. By selecting de-energize, the alarm output relay will operate in the same
manner as when the alarm occurs when the power supply is disrupted. Energize or de-
energize applies to all alarm output relays. The initial setting is set to [energize].
NOEnergized
De-energized
C NC NO C NC NO C NC
NO C NC NO C NCNO C NC
Power failure
NO = Normally opened ; C = common ; and NC = normally closed
Alarm off Alarm on
6.4 Setting the Auxiliary Alarm Function (Basic Setting Mode)
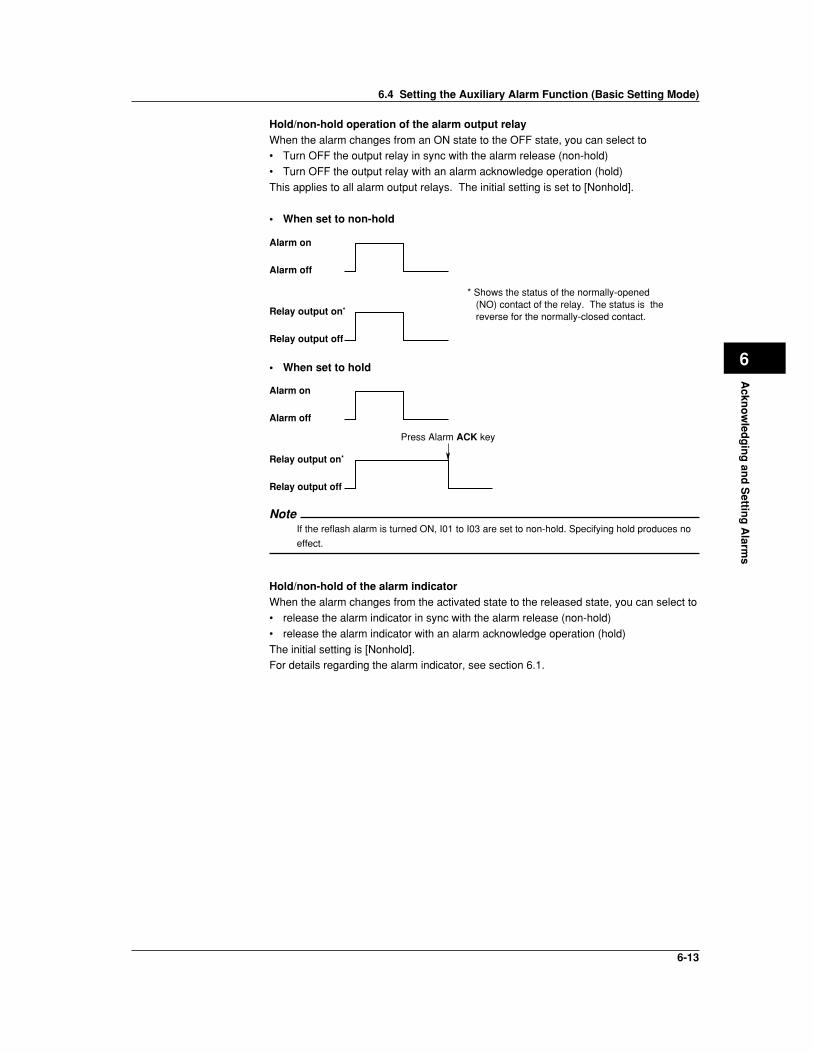
6-13
Ackn
ow
ledg
ing
and
Settin
g A
larms
6
6.4 Setting the Auxiliary Alarm Function (Basic Setting Mode)
Hold/non-hold operation of the alarm output relayWhen the alarm changes from an ON state to the OFF state, you can select to• Turn OFF the output relay in sync with the alarm release (non-hold)
• Turn OFF the output relay with an alarm acknowledge operation (hold)
This applies to all alarm output relays. The initial setting is set to [Nonhold].
• When set to non-hold
Alarm on
Alarm off
Relay output on*
Relay output off
* Shows the status of the normally-opened (NO) contact of the relay. The status is the reverse for the normally-closed contact.
• When set to hold
Press Alarm ACK key
Alarm on
Alarm off
Relay output on*
Relay output off
NoteIf the reflash alarm is turned ON, I01 to I03 are set to non-hold. Specifying hold produces no
effect.
Hold/non-hold of the alarm indicatorWhen the alarm changes from the activated state to the released state, you can select to
• release the alarm indicator in sync with the alarm release (non-hold)
• release the alarm indicator with an alarm acknowledge operation (hold)
The initial setting is [Nonhold].For details regarding the alarm indicator, see section 6.1.

7-1
Settin
g an
d O
peratin
g th
e Disp
lay
7
Chapter 7 Setting and Operating the Display
7.1 Setting Tag Names
Tag names can be displayed in place of channel numbers on the operation screen (trenddisplay, digital display, etc.). Tag names are saved to the file along with the data.The basic setting mode is used to select whether tags or channel numbers aredisplayed.
ProcedureSetting tag names• These procedures are carried out in the setting mode.• Use the arrow keys to move the cursor (blue) to the appropriate parameter. (The
parameters that cannot be changed are grayed.)• The possible selections are displayed at the bottom of the screen. Select using the
soft keys.• The parameter boxes that are changed are displayed in yellow. By confirming the
new settings, they change back to white.
Press MENU .
Setting on a measurement channel
To display the setting screen press the soft key #2 .
Setting on a computation channel (option)
Twice press the soft key Next 1/3 .
To display the setting screen press the soft key #11 .
2
1 1
2
The numbers in front of the operating procedure shown below correspond to the
numbers in the above figure.
1. First channel and last channelSelect the desired channels. (For the measurement channels set here, [MovingAverage] or [Filter], and [Alarm Delay Time] are also simultaneously set. For thecomputation channels, [TLOG], [Rolling Average], and [Alarm Delay Time] arealso simultaneously set.)
2. TagPressing the [Input] soft key displays a window used to enter the tag name.Enter the tag name (up to 16 alphanumeric characters) and press the DISP/ENTER key. For the procedures related to entering character strings, see“Entering Characters” on page 3-22.
Confirming operationTo confirm the new settings, press the DISP/ENTER key.To cancel the new settings, press the ESC key. A window appears for you to confirm thecancellation. Select [Yes] using the arrow keys and press the DISP/ENTER key.
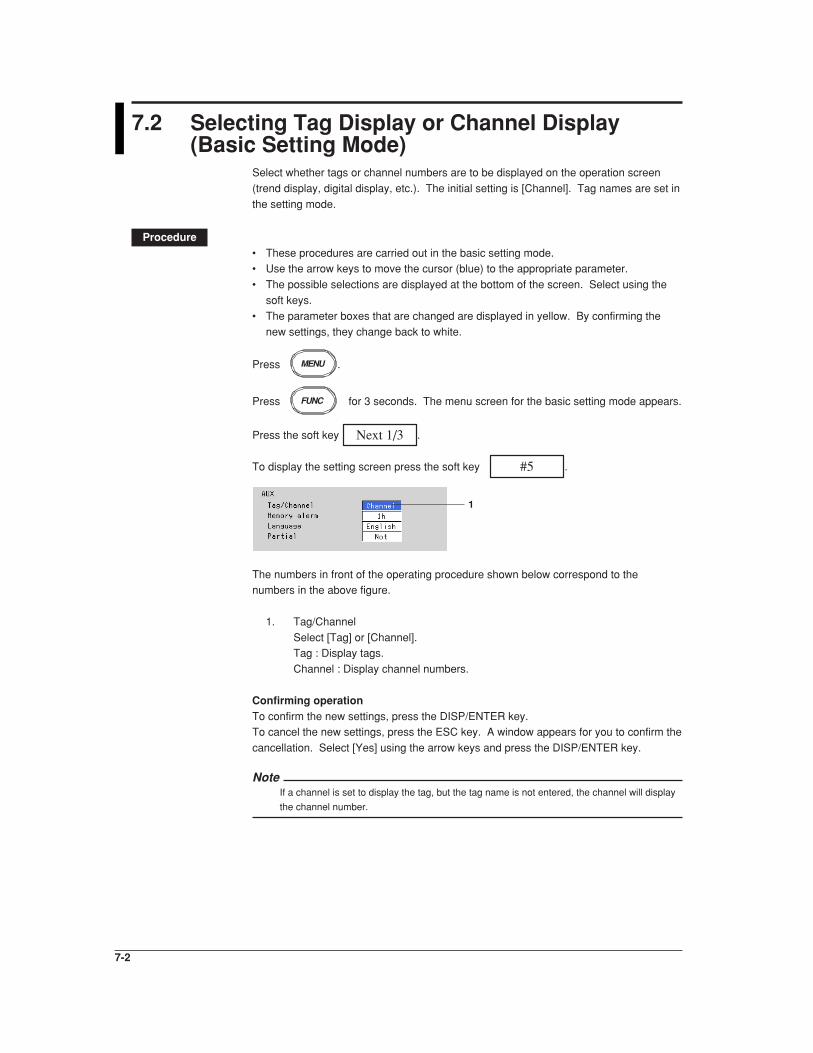
7-2
7.2 Selecting Tag Display or Channel Display(Basic Setting Mode)
Select whether tags or channel numbers are to be displayed on the operation screen
(trend display, digital display, etc.). The initial setting is [Channel]. Tag names are set in
the setting mode.
Procedure• These procedures are carried out in the basic setting mode.• Use the arrow keys to move the cursor (blue) to the appropriate parameter.
• The possible selections are displayed at the bottom of the screen. Select using the
soft keys.
• The parameter boxes that are changed are displayed in yellow. By confirming the
new settings, they change back to white.
Press MENU .
Press FUNC for 3 seconds. The menu screen for the basic setting mode appears.
Press the soft key Next 1/3 .
To display the setting screen press the soft key #5 .
1
The numbers in front of the operating procedure shown below correspond to thenumbers in the above figure.
1. Tag/Channel
Select [Tag] or [Channel].Tag : Display tags.
Channel : Display channel numbers.
Confirming operationTo confirm the new settings, press the DISP/ENTER key.To cancel the new settings, press the ESC key. A window appears for you to confirm the
cancellation. Select [Yes] using the arrow keys and press the DISP/ENTER key.
NoteIf a channel is set to display the tag, but the tag name is not entered, the channel will display
the channel number.

7-3
Settin
g an
d O
peratin
g th
e Disp
lay
7
7.3 Setting the Display Rate (Trend)
The time period corresponding to 1 division on the time axis on the trend display isspecified. The time axis on the trend display is determined by the display rate. Thesampling interval of the display data is also determined by the display rate. The displayrate cannot be changed while data sampling is in progress.
Procedure• These procedures are carried out in the setting mode.• Use the arrow keys to move the cursor (blue) to the appropriate parameter. (The
parameters that cannot be changed are grayed.)• The possible selections are displayed at the bottom of the screen. Select using the
soft keys.• The parameter boxes that are changed are displayed in yellow. By confirming the
new settings, they change back to white.
Press MENU .
To display the setting screen press the soft key #3 .
1
The numbers in front of the operating procedure shown below correspond to the
numbers in the above figure.
1. Display update rate (Time/div)Select the display rate from 1 min, 2 min, 5 min, 10 min, 20 min, 30 min, 1 h, 2h, and 4 h.
Confirming operationTo confirm the new settings, press the DISP/ENTER key.To cancel the new settings, press the ESC key. A window appears for you to confirm thecancellation. Select [Yes] using the arrow keys and press the DISP/ENTER key.
NoteWhen [Auto save] is set for saving data to the external storage medium, the [Auto saveinterval] box is displayed under [Time/div]. [Auto save interval] is the interval at which thedisplay data residing in the internal memory are stored to the external storage medium. The
selectable values for [Auto save interval] vary depending on the [Time/div] setting. For thesetting procedure, see section 8.8.
ExplanationThe display data sampling interval and the speed of movement of the trend along thetime axisThe following table shows the display rate, display data sampling interval, and the speedof movement of the trend along the time axis
Display Rate (/DIV) 1 min 2 min 5 min 10 min 20 min 30 min 1 h 2 h 4 h
Display data 2 4 10 20 40 60 120 240 480sampling interval (s)
Speed of movement of the 594 297 119 59 30 20 10 5 2.5trend (Estimated value) (mm/h)

7-4
7.4 Using Message Strings (Trend)
Arbitrary character strings can be registered. They can be displayed on the trend
display and stored along with the display/event data.
• Number of messages : 8
• Number of characters : Up to 16 alphanumeric charactersA list of messages can be displayed on the message summary screen. See section 4.5.
For models with the batch function (/BT1 option), messages 1, 2, and 3 can be altered
from the operation screen to be used.
ProcedureDisplaying a message on the trend display/writing a message to the internalmemoryThis operation is carried out in the operation mode.
1. Press the FUNC key to display the soft keys.
2. Press the [Message] soft key. Eight soft keys for the messages and a window
containing a list of messages are displayed.
3. Press the soft key corresponding to the message you wish to display. A
message mark, time, and the message are displayed on the trend display.
NoteMessages can be displayed on the trend display and written into the internal memory along
with the display data file and the event data file while data acquisition is in progress.

7-5
Settin
g an
d O
peratin
g th
e Disp
lay
7
This page intentionally left blank

7-6
This page intentionally left blank
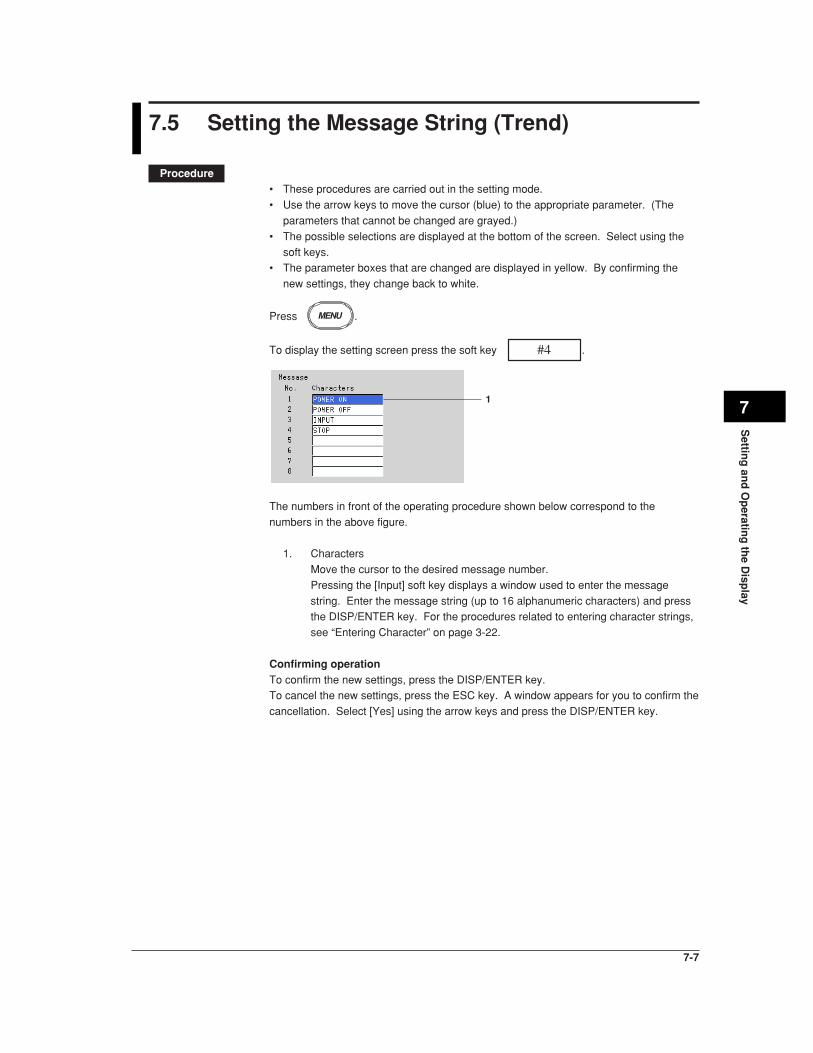
7-7
Settin
g an
d O
peratin
g th
e Disp
lay
7
7.5 Setting the Message String (Trend)
Procedure• These procedures are carried out in the setting mode.
• Use the arrow keys to move the cursor (blue) to the appropriate parameter. (The
parameters that cannot be changed are grayed.)
• The possible selections are displayed at the bottom of the screen. Select using the
soft keys.• The parameter boxes that are changed are displayed in yellow. By confirming the
new settings, they change back to white.
Press MENU .
To display the setting screen press the soft key #4 .
1
The numbers in front of the operating procedure shown below correspond to the
numbers in the above figure.
1. Characters
Move the cursor to the desired message number.
Pressing the [Input] soft key displays a window used to enter the message
string. Enter the message string (up to 16 alphanumeric characters) and pressthe DISP/ENTER key. For the procedures related to entering character strings,
see “Entering Character” on page 3-22.
Confirming operationTo confirm the new settings, press the DISP/ENTER key.To cancel the new settings, press the ESC key. A window appears for you to confirm the
cancellation. Select [Yes] using the arrow keys and press the DISP/ENTER key.

7-8
7.6 Setting Groups
Trend, digital, and bar graph displays are displayed in groups. Channels can beassigned to each group and the group name can be registered.• Number of groups : 4• Number of channels : Up to 6 channels/group• As for setting the channels to display the trend, see section 8.10.
Procedure• These procedures are carried out in the setting mode.• Use the arrow keys to move the cursor (blue) to the appropriate parameter. (The
parameters that cannot be changed are grayed.)• The possible selections are displayed at the bottom of the screen. Select using the
soft keys.• The parameter boxes that are changed are displayed in yellow. By confirming the
new settings, they change back to white.
Press MENU .
Press the soft key Next 1/3 .
Press the soft key #5 .
To display the setting screen press the soft key #1 .
1
23
The numbers in front of the operating procedure shown below correspond to the
numbers in the above figure.
1. Group numberSelect the group number (1 to 4).
2. Group namePressing the [Input] soft key displays a window used to enter the group name.Enter the group name (up to 16 alphanumeric characters) and press the DISP/ENTER key. For the procedures related to entering character strings, see“Entering Characters” on page 3-22.
3. CH setAssign measurement channels to groups.
Pressing the [Input] soft key displays a window used to enter the channel
number to be assigned. Enter the channel number according to the following
rules and press the DISP/ENTER key.
• Enter the channel number using two digits.• Separate each channel with a period.
• Consecutive channels can be specified using a hyphen.
Example : To set CH1, CH3, CH5 to CH8 to a particular group, “01.03.05-
08” is entered.

7-9
Settin
g an
d O
peratin
g th
e Disp
lay
7
For the procedures related to entering character strings, see “Entering
Characters” on page 3-22.
Note• The channels are displayed in the order they are specified on the trend, digital, bar graph
displays.
• One channel can be assigned to multiple groups.
• A channel cannot be assigned twice in the same group.
Confirming operationTo confirm the new settings, press the DISP/ENTER key.
To cancel the new settings, press the ESC key. A window appears for you to confirm the
cancellation. Select [Yes] using the arrow keys and press the DISP/ENTER key.
ExplanationThe initial settings of the groups are as follows :
Group NameGroup 1 : GROUP 1
Group 2 : GROUP 2
Group 3 : GROUP 3
Group 4 : GROUP 4
The initial value varies depending on the number of installed channels.
Group Number RD-MV102 RD-MV104 RD-MV106 RD-MV112
1 01.02 01.02.03.04 01.02.03.04.05.06 01.02.03.04.05.062 01.02 01.02.03.04 01.02.03.04.05.06 07.08.09.10.11.123 01.02 01.02.03.04 01.02.03.04.05.06 01.02.03.04.05.064 01.02 01.02.03.04 01.02.03.04.05.06 07.08.09.10.11.12
7.6 Setting Groups

7-10
7.7 Setting the Trip Line (Trend)
A line to indicate a particular value of interest (trip line) can be displayed on the trend
display.
• The maximum number of trip lines that can be displayed in one group is four.
• The position of the trip line is specified as a percentage of the display span.• You can specify the thickness of the trip lines. See section 7.13.
Procedure• These procedures are carried out in the setting mode.
• Use the arrow keys to move the cursor (blue) to the appropriate parameter. (The
parameters that cannot be changed are grayed.)
• The possible selections are displayed at the bottom of the screen. Select using thesoft keys.
• The parameter boxes that are changed are displayed in yellow. By confirming the
new settings, they change back to white.
Press MENU .
Press the soft key Next 1/3 .
Press the soft key #5 .
To display the setting screen press the soft key #1 .
1
2 3 4
The numbers in front of the operating procedure shown below correspond to the
numbers in the above figure.
1. Group number
Select the group number (1 to 4).
2. On/Off
Move the cursor to the desired trip line and press the [On] soft key.On : Use the trip line. The [Position] and [Color] boxes appear.
Off : Not use the trip line.
3. Position (display position)
Specify the display position of the trip line in the range 0% to 100% of the
display span.4. Color
Select the color of the trip line from 16 colors.

7-11
Settin
g an
d O
peratin
g th
e Disp
lay
7
Confirming operationTo confirm the new settings, press the DISP/ENTER key.To cancel the new settings, press the ESC key. A window appears for you to confirm the
cancellation. Select [Yes] using the arrow keys and press the DISP/ENTER key.
ExplanationInitial colors of the trip linesTrip line No.1 : Red
Trip line No.2 : Green
Trip line No.3 : BlueTrip line No.4 : Yellow
Available colors for the trip lineRed, green, blue, blue violet, brown, orange, yellow-green, light blue, violet, gray, limes,
cyan, dark blue, yellow, silver, and purple
7.7 Setting the Trip Line (Trend)

7-12
7.8 Setting the Channel Display Colors (Trend, BarGraph)
Trend and bar graph colors can be specified for each channel.
Procedure• These procedures are carried out in the setting mode.
• Use the arrow keys to move the cursor (blue) to the appropriate parameter. (The
parameters that cannot be changed are grayed.)• The possible selections are displayed at the bottom of the screen. Select using the
soft keys.
• The parameter boxes that are changed are displayed in yellow. By confirming the
new settings, they change back to white.
Press MENU .
Press the soft key Next 1/3 .
Press the soft key #5 .
Setting on a measurement channel
To display the setting screen press the soft key #2 .
Setting on a computation channel (option)
To display the setting screen press the soft key #5 .
1
The numbers in front of the operating procedure shown below correspond to the
numbers in the above figure.
1. Channel display color
Move the cursor to the desired channel and set the channel display color (selectfrom 16 colors).
Confirming operationTo confirm the new settings, press the DISP/ENTER key.
To cancel the new settings, press the ESC key. A window appears for you to confirm the
cancellation. Select [Yes] using the arrow keys and press the DISP/ENTER key.
ExplanationInitial settings of channel display colorChannel 1 : Red, Channel 2 : Green, Channel 3 : Blue, Channel 4 : Blue violet, Channel
5 : Brown, Channel 6 : Orange, Channel 7 : Yellow-green, Channel 8 : Light blue,Channel 9 : violet, Channel 10 : Gray, Channel 11 : Lime, Channel 12 : Cyan
Available colors for the channelsRed, green, blue, blue violet, brown, orange, yellow-green, light blue, violet, gray, limes,
cyan, dark blue, yellow, silver, and purple
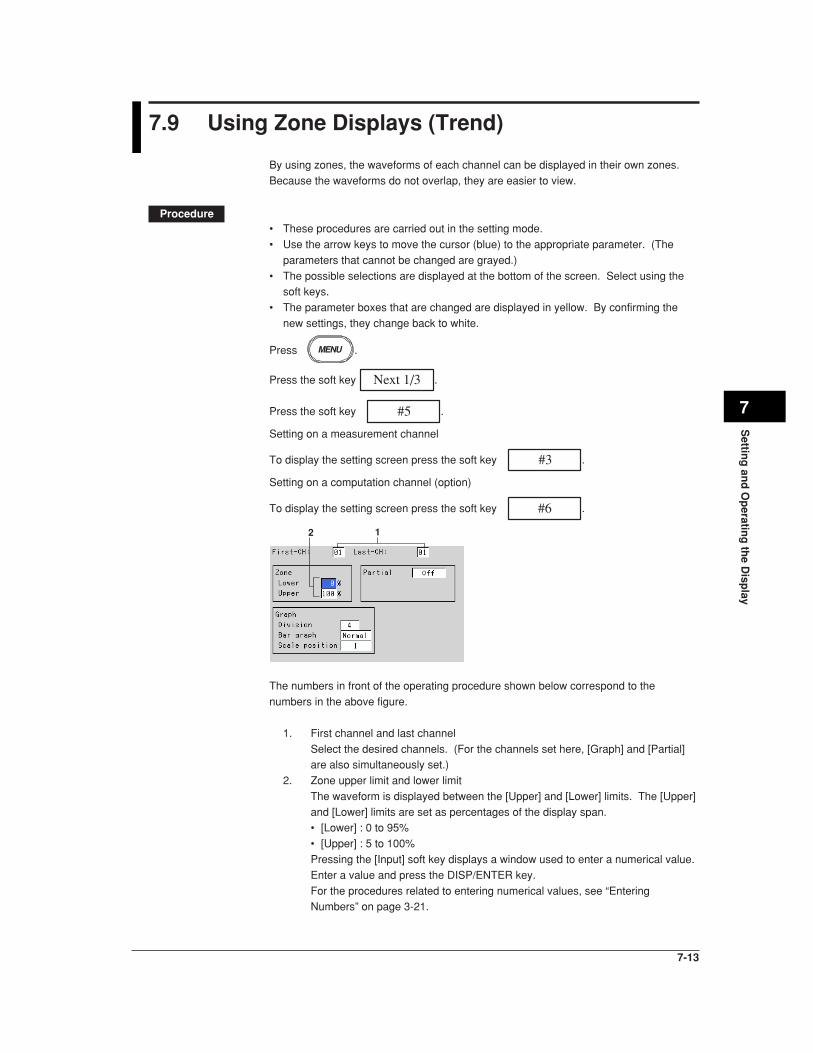
7-13
Settin
g an
d O
peratin
g th
e Disp
lay
7
7.9 Using Zone Displays (Trend)
By using zones, the waveforms of each channel can be displayed in their own zones.
Because the waveforms do not overlap, they are easier to view.
Procedure• These procedures are carried out in the setting mode.
• Use the arrow keys to move the cursor (blue) to the appropriate parameter. (The
parameters that cannot be changed are grayed.)
• The possible selections are displayed at the bottom of the screen. Select using thesoft keys.
• The parameter boxes that are changed are displayed in yellow. By confirming the
new settings, they change back to white.
Press MENU .
Press the soft key Next 1/3 .
Press the soft key #5 .
Setting on a measurement channel
To display the setting screen press the soft key #3 .
Setting on a computation channel (option)
To display the setting screen press the soft key #6 .
12
The numbers in front of the operating procedure shown below correspond to the
numbers in the above figure.
1. First channel and last channel
Select the desired channels. (For the channels set here, [Graph] and [Partial]are also simultaneously set.)
2. Zone upper limit and lower limit
The waveform is displayed between the [Upper] and [Lower] limits. The [Upper]
and [Lower] limits are set as percentages of the display span.• [Lower] : 0 to 95%
• [Upper] : 5 to 100%
Pressing the [Input] soft key displays a window used to enter a numerical value.
Enter a value and press the DISP/ENTER key.
For the procedures related to entering numerical values, see “EnteringNumbers” on page 3-21.

7-14
Note• [Lower] must be a smaller value than [Upper].
• The width of the zone (upper limit – lower limit) must be greater than or equal to 5%.
Confirming operationTo confirm the new settings, press the DISP/ENTER key.
To cancel the new settings, press the ESC key. A window appears for you to confirm the
cancellation. Select [Yes] using the arrow keys and press the DISP/ENTER key.
7.9 Using Zone Displays (Trend)
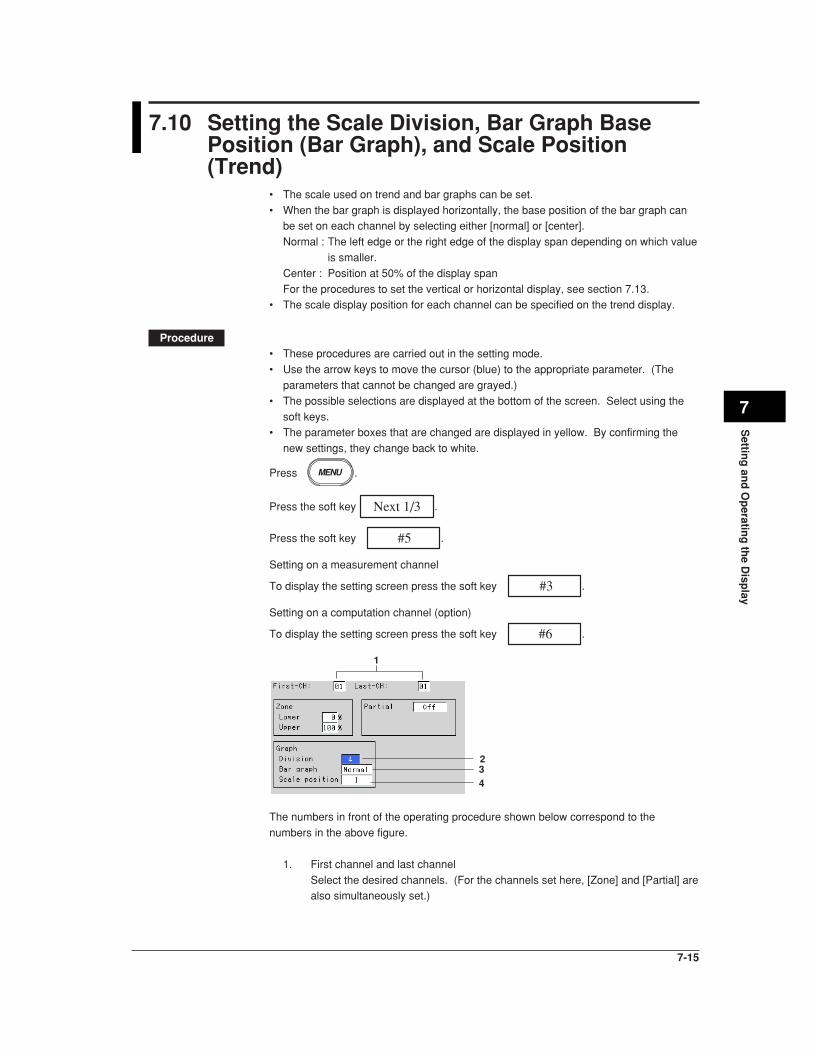
7-15
Settin
g an
d O
peratin
g th
e Disp
lay
7
7.10 Setting the Scale Division, Bar Graph BasePosition (Bar Graph), and Scale Position(Trend)
• The scale used on trend and bar graphs can be set.
• When the bar graph is displayed horizontally, the base position of the bar graph canbe set on each channel by selecting either [normal] or [center].
Normal : The left edge or the right edge of the display span depending on which value
is smaller.
Center : Position at 50% of the display span
For the procedures to set the vertical or horizontal display, see section 7.13.• The scale display position for each channel can be specified on the trend display.
Procedure• These procedures are carried out in the setting mode.
• Use the arrow keys to move the cursor (blue) to the appropriate parameter. (The
parameters that cannot be changed are grayed.)
• The possible selections are displayed at the bottom of the screen. Select using the
soft keys.• The parameter boxes that are changed are displayed in yellow. By confirming the
new settings, they change back to white.
Press MENU .
Press the soft key Next 1/3 .
Press the soft key #5 .
Setting on a measurement channel
To display the setting screen press the soft key #3 .
Setting on a computation channel (option)
To display the setting screen press the soft key #6 .
1
234
The numbers in front of the operating procedure shown below correspond to the
numbers in the above figure.
1. First channel and last channel
Select the desired channels. (For the channels set here, [Zone] and [Partial] arealso simultaneously set.)

7-16
Setting the number of divisions for the scale2. Division
This is the number of scale divisions. The scale is equally divided and scale
marks are displayed at the divided position. Select the number of divisions from
4 to 12.
For bar graph display : Only the main scale marks are displayed.
For trend display : See the explanation.
Setting the bar graph’s base position3. Bar graph (base position of the bar graph)
Select normal or center.
NoteWhen the bar graph is displayed vertically (see section 7.13), the base position is fixed to
[Normal] (the bottom of the bar graph is the base position).
Setting the scale position on the trend display4. Scale position
The [Scale position] is used to set the scale display position for each channel
when the scale display is turned [On] (see section 4.3) on the trend display.Select the position from [1] to [6]. Select [Off] for channels without scale.
Note• The scale for the channels that are assigned to the group in the trend display are displayed.
• The larger the number of scales to be displayed, less amount of area there is to display the
waveform.
Confirming operationTo confirm the new settings, press the DISP/ENTER key.
To cancel the new settings, press the ESC key. A window appears for you to confirm thecancellation. Select [Yes] using the arrow keys and press the DISP/ENTER key.
7.10 Setting the Scale Division, Bar Graph Base Position (Bar Graph), and Scale Position (Trend)

7-17
Settin
g an
d O
peratin
g th
e Disp
lay
7
ExplanationScale Specifications
Scale display positionOn the trend display, the scale display position for the channels that are assigned to
groups can be displayed in 6 different positions. (See the figure below.)
• During trend vertical displayThe scale display position is 6, 5, 4, 3, 2, and 1 from the top.
4 scale division sample5 scale division sample6 scale division sample7 scale division sample8 scale division sample9 scale division sample
10 scale division sample11 scale division sample12 scale division sample
The scale is divided into 4 to 12 sections as shown in the figure above.
• If the scales for two or more channels are specified to the same position, the scale for
the channel that was assigned first to the group is displayed.
Example 1 If the channels were assigned to a group in the following order :
[03.02.01.05]
If the scale display positions for channels 3, 2, 1, and 5 are all set to [1], the scale forchannel 3 is displayed at position 1.
Vacant positions in between scale assigned positions are void. The scales are displayed
close together from the display position 1.
Example 2 If the channels were assigned to a group in the following order :
[01.02.03.05]If the scale display position for channels 1, 2, 3, and 5 are set to positions 1, 3, 5, and
6, respectively, the scales for the channels are actually displayed at positions 1, 2, 3,
and 4, respectively.
• If the scale display position is set to [Off], the scale is not displayed.
Scale marksThe scale can be divided into 4 to 12 sections using the main scale marks. When the
scale is divided into 4 or 5 section, the area between the main scale marks is dividedfurther into 10 sections using small and medium marks. When the scale is divided into 6
to 12 sections, the area between the main scale marks is divided further into 5 sections
using small marks.
However, small marks are not displayed for the following cases :
• When the measurement/computation range resolution is smaller than the total numberof sections created by small marks.
• When zone display is used
• When partial expanded display is used
7.10 Setting the Scale Division, Bar Graph Base Position (Bar Graph), and Scale Position (Trend)
7-18
Scale valuesThe scale values are displayed at all main scale marks when the scale is divided into 4to 7 sections using the main scale marks. When the scale is divided into 8 to 12
sections, the scale values are displayed at every other main scale mark.
In addition, the upper or lower limit of the scale is displayed at the end of the scale.
Rule 1 Up to 3 digits excluding the minus sign can be displayed for the scale values.
Rule 2 If the integer section of either value at the end of the scale is less than or equalto one digit, the value is displayed as . or 0. .
Example 1 If the scale is set to –0.05 to 0.5, the scale display for the upper
and lower limits is –0.0 to 0.5.
Example 2 If the scale is set to –0.005 to 0.05, the scale display for the upper
and lower limits are –0.0 to 0.0.Rule 3 If the integer section of either value at the end of the scale is greater than or
equal to two digits and less than three digits, the value is displayed with the
decimal fraction is discarded.
Example 3 If the scale is set to 0.1 to 100.0, the scale display for the upper
and lower limits is 0 to 100.Rule 4 If the integer section of either value at the end of the scale is greater than or
equal to four digits, a three-digit mantissa and exponent are displayed (×10 or
×102, for example).
Example 4 If the scale is set to 10 to 2000, the scale display for the upper
and lower limits are 0 to 200 × 10.Rule 5 If the difference in the number of digits between the upper and lower limits of
the scale is larger than the number of digits that can be displayed, the smaller
value is set to zero (0 or 0.0).
Example 5 If the scale is set to –0.0005 to 0.5000, the upper and lower limits
of the scale are displayed as 0.0 to 0.5.
UnitThe unit is displayed near the center of the scale. When the partial expansion display is
used, the position will be shifted.
When the trend is displayed horizontally, the number of characters that can be displayedis up to 4.
The unit is not displayed if the resolution of the measuring range is less than the number
of scale divisions using small marks.
7.10 Setting the Scale Division, Bar Graph Base Position (Bar Graph), and Scale Position (Trend)

7-19
Settin
g an
d O
peratin
g th
e Disp
lay
7
• During trend horizontal displayThe scale display position is 6, 5, 4, 3, 2, and 1 from the left.
Bar Base Position
Bar base position: normal
Bar base position: centerThe base position is at the center (50%) of the display span.
7.10 Setting the Scale Division, Bar Graph Base Position (Bar Graph), and Scale Position (Trend)

7-20
7.11 Using Partial Expansion Display (Trend)
By compressing a section of the display scale of the measured/computed data, theremaining section of the display is expanded. For detail, see section 1.3.To use the partial expansion display, first, set the partial expansion display to [Use] in the
basic setting mode. This will display a partial expansion display setting box in the settingmode (see section 7.12).
Procedure• These procedures are carried out in the setting mode.• Use the arrow keys to move the cursor (blue) to the appropriate parameter. (The
parameters that cannot be changed are grayed.)• The possible selections are displayed at the bottom of the screen. Select using the
soft keys.• The parameter boxes that are changed are displayed in yellow. By confirming the
new settings, they change back to white.
Press MENU .
Press the soft key Next 1/3 .
Press the soft key #5 .
Setting on a measurement channel
To display the setting screen press the soft key #3 .
Setting on a computation channel (option)
To display the setting screen press the soft key #6 .
1
234
The numbers in front of the operating procedure shown below correspond to the
numbers in the above figure.
1. First channel and last channelSelect the desired channels. (For the channels set here, [Zone] and [Graph] arealso simultaneously set.)
2. On/OffWhen [On] is selected, the [Expand] and [Boundary] boxes are displayed.On : Use the partial expansion display.
Off : Not use the partial expansion display.3. Expand (Boundary displacement position)
Set the position to which a particular value (the boundary, see step 4) in thedisplay span is to be moved as a percentage of the display span.Pressing the [Input] soft key displays a window used to enter a numerical value.Enter the position and press the DISP/ENTER key. For the procedures relatedto entering numerical values, see “Entering Numbers” on page 3-21.The range for the position : 1 to 99

7-21
Settin
g an
d O
peratin
g th
e Disp
lay
7
4. Boundary
This is a value within the display span. By moving the value within the displayspan to another position (see step 3), the area on either side of the boundary is
expanded or compressed.
Pressing the [Input] soft key displays a window used to enter a numerical value.
Enter the boundary and press the DISP/ENTER key. For the procedures related
to entering numerical values, see “Entering Numbers” on page 3-21.The range for the boundary :
The minimum value of the span +1 to the maximum value of the span –1
(when the range is not set to scaling)
The minimum value of the scale +1 to the maximum value of the scale –1
(when the range is set to scale).
Confirming operationTo confirm the new settings, press the DISP/ENTER key.To cancel the new settings, press the ESC key. A window appears for you to confirm the
cancellation. Select [Yes] using the arrow keys and press the DISP/ENTER key.
Note• The partial expansion display is turned OFF for all channels if the partial expansion display
setting (use/not use) in the basic setting mode is changed and stored.
• When the range setting of the channel is set to [Skip] or when the span width is less than or
equal to 1, the partial expanded display cannot be specified. (The box is grayed in this case.)
7.11 Using Partial Expanded Display (Trend)

7-22
7.12 Setting Whether or Not to Use the PartialExpansion Display (Basic Setting Mode)
Set whether or not to use the partial expansion display.
• The initial value is [Not].
• The display specifications of the partial expansion display are set in the setting mode.
Procedure• These procedures are carried out in the basic setting mode.• Use the arrow keys to move the cursor (blue) to the appropriate parameter.
• The possible selections are displayed at the bottom of the screen. Select using the
soft keys.
• The parameter boxes that are changed are displayed in yellow. By confirming the
new settings, they change back to white.
Press MENU .
Press FUNC for 3 seconds. The menu screen for the basic setting mode appears.
Press the soft key Next 1/3 .
To display the setting screen press the soft key #5 .
1
The numbers in front of the operating procedure shown below correspond to the
numbers in the above figure.
1. Partial
Select [Use] or [Not].
Use : Partial expansion display can be set in the setting mode.
Not : Partial expansion display cannot be set.
Confirming operationTo confirm the new settings, press the DISP/ENTER key.
To cancel the new settings, press the ESC key. A window appears for you to confirm the
cancellation. Select [Yes] using the arrow keys and press the DISP/ENTER key.

7-23
Settin
g an
d O
peratin
g th
e Disp
lay
7
7.13 Setting the Display Direction, BackgroundColor, Waveform Line Width, Trip Line Width,Grid, and Scroll Time
• The display direction of the trend and bar graph can be set to horizontal or vertical.
• The background color used in the trend, digital, bar graph, and summary displays canbe set to white or black (common to all screens).
• The line width of the trend can be selected as 1, 2, or 3 dots.
• The line width of the trip line can be selected as 1, 2, or 3 dots.
• The grid lines can be displayed on the trend's waveform display area by dividing the
display span into 4 to 12 sections.• The interval at which the displayed group is automatically switched on the trend,
digital, and bar graph displays can be specified. The displayed group rotates from
group 1 to group 4.
Procedure• These procedures are carried out in the setting mode.
• Use the arrow keys to move the cursor (blue) to the appropriate parameter. (The
parameters that cannot be changed are grayed.)• The possible selections are displayed at the bottom of the screen. Select using the
soft keys.
• The parameter boxes that are changed are displayed in yellow. By confirming the
new settings, they change back to white.
Press MENU .
Press the soft key Next 1/3 .
Press the soft key #5 .
To display the setting screen press the soft key #4 .
1234567
The numbers in front of the operating procedure shown below correspond to the
numbers in the above figure.
Set the display direction of the trend1. Direction - Trend
Select horizontal or vertical.
Set the display direction of the bar graph2. Direction - Bar graph
Select horizontal or vertical.
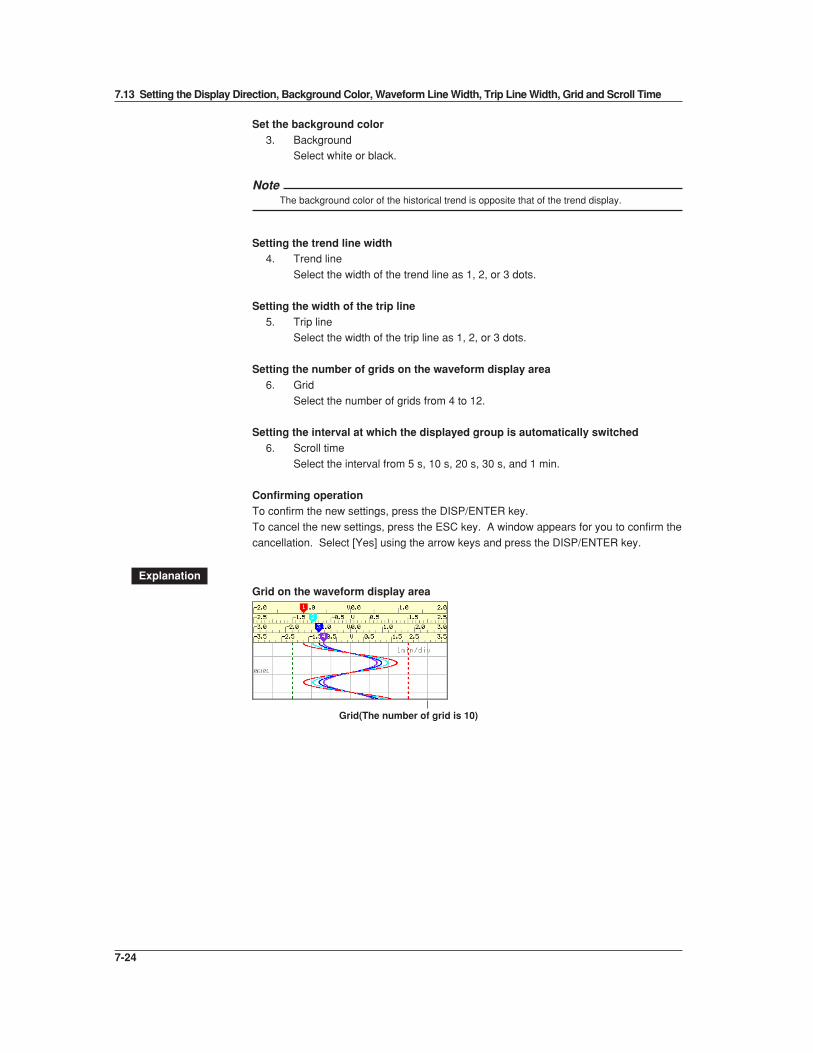
7-24
Set the background color3. Background
Select white or black.
NoteThe background color of the historical trend is opposite that of the trend display.
Setting the trend line width4. Trend line
Select the width of the trend line as 1, 2, or 3 dots.
Setting the width of the trip line5. Trip line
Select the width of the trip line as 1, 2, or 3 dots.
Setting the number of grids on the waveform display area6. Grid
Select the number of grids from 4 to 12.
Setting the interval at which the displayed group is automatically switched6. Scroll time
Select the interval from 5 s, 10 s, 20 s, 30 s, and 1 min.
Confirming operationTo confirm the new settings, press the DISP/ENTER key.
To cancel the new settings, press the ESC key. A window appears for you to confirm the
cancellation. Select [Yes] using the arrow keys and press the DISP/ENTER key.
ExplanationGrid on the waveform display area
Grid(The number of grid is 10)
7.13 Setting the Display Direction, Background Color, Waveform Line Width, Trip Line Width, Grid and Scroll Time

7-25
Settin
g an
d O
peratin
g th
e Disp
lay
7
7.14 Setting the Brightness of the Screen and theBacklight Saver Function
• There are eight screen brightness settings which can be selected (1 to 8).
• The lifetime of the LCD backlight can be extended by automatically dimming the light
when there has been no key operation for a certain amount of time. The screen will
return to the original brightness with a key operation or an alarm occurrence. Theinitial setting is [Off].
Procedure• These procedures are carried out in the setting mode.
• Use the arrow keys to move the cursor (blue) to the appropriate parameter. (The
parameters that cannot be changed are grayed.)
• The possible selections are displayed at the bottom of the screen. Select using thesoft keys.
• The parameter boxes that are changed are displayed in yellow. By confirming the
new settings, they change back to white.
Press MENU .
Press the soft key Next 1/3 .
Press the soft key #5 .
To display the setting screen press the soft key #4 .
1
234
The numbers in front of the operating procedure shown below correspond to the
numbers in the above figure.
Setting the brightness of the screen1. Brightness
Select from 1 to 8. A higher number corresponds to a brighter screen setting.Setting the backlight saver
2. On/Off
When [On] is selected, [Saver time] and [Restore] boxes are displayed.
3. Saver time
Select the time from 1 min, 2 min, 5 min, 10 min, 30 min, and 1 hour.If the specified time elapses without any key operation, the LCD backlight is
automatically dimmed.
4. Restore
Select [Key] or [Key + Alm] (Key + Alarm).
Key : The screen will return to the original brightness with a key operation.Key + Alarm : The screen will return to the original brightness with a key
operation or an alarm occurrence.
Confirming operationTo confirm the new settings, press the DISP/ENTER key.
To cancel the new settings, press the ESC key. A window appears for you to confirm thecancellation. Select [Yes] using the arrow keys and press the DISP/ENTER key.

8-1
Data A
cqu
isition
and
Savin
g to
Extern
al Sto
rage M
ediu
m
8
Chapter 8 Data Acquisition and Saving to External Storage Medium
8.1 Data Types to be Acquired and Saved
Data Types and File NamesData typeThe types and the contents of the data that are acquired are as follows. Beside those
data listed below, the setup data (see section 9.1) and the screen image data (seesection 9.6) can be saved to the external storage medium.
Type Content
Display data • Waveform data that are used to display trends on the LCD screen.• The maximum and minimum values from measured/computed data
within the sampling intervals are held.• A header string can be written into the display data file (a character
string that is common to all data files).• Alarm and message information is held.• Data format : Binary format
Event data • The instantaneous values of the measured/computed data areacquired at the specified sampling interval. There is a mode in whichthe data acquisition is started when a trigger occurs or another modein which the data acquisition is started when the START key ispressed.
• The header string can be written into the event data file (a characterstring that is common to all data files).
• Alarm and message is held.• Data format : Binary format
Manual sampled data • Every time a key that executes manual sampling is pressed,measured/computed data (instantaneous values) of all channels atthat point are acquired.
• Up to 50 samples of data can be stored in the internal memory.• The header string can be written into the manual sampled data file (a
character string that is common to all data files).• Data format : ASCII format
TLOG data (option) • TLOG data are statistical computation data.• Data are added to the internal memory at the end of every interval
period.• Up to 400 data sets can be stored in the internal memory.• The header string can be written into the TLOG data file (a character
string that is common to all data files).• Data format : Binary format
Report data (option) • Consists of hourly, daily, weekly, and monthly reports. Data arecomputed at intervals depending on the report type (one hour forhourly report, one day for daily report, etc). Data are added to theinternal memory at the end of every interval period.
• Up to 40 reports can be stored in the internal memory.• Each report file can contain up to 12 measured/computed channels
of report data.• The header string can be written into the report data file (a character
string that is common to all data files).• Data format : ASCII format

8-2
File nameFile names are automatically assigned (month/day/hour/minute of the first sampled data+ serial number. extension) for display data, event data, manual sampled data, TLOG
data (option), and report data (option).
• Display data file : Mddhhmma.DDS
• Event data file : Mddhhmma.DEV
• Manual sampled data file : Mddhhmma.DMN• TLOG data file : Mddhhmma.DTG
• Hourly report data file : Mddhhmma.DHR
• Daily report data file : Mddhhmma.DDR
• Weekly report data file : Mddhhmma.DWR
• Monthly report data file : Mddhhmma.DMRwhere, M : month (1 to 9, X (10), Y (11), Z (12)), dd : date, hh : hour, mm : minute,
a : serial number
NoteThe serial number of the file name is set to 0. However, if the display data acquisition is
started, stopped, and restarted within one minute, for example, then the file name of the two
files will have serial numbers 0 and 1 for the first and second files, respectively. (The two files
will have the same Mddhhmm (month/day/hour/minute) section).
8.1 Data Types to be Acquired and Saved

8-3
Data A
cqu
isition
and
Savin
g to
Extern
al Sto
rage M
ediu
m
8
8.2 Function to Acquire Display Data and EventData
The display and event data are acquired by specifying the channels, sampling interval,
file size, and other information.
Specifying the Data to be AcquiredDisplay data and event dataSpecify the type of data to be acquired depending on the application. Several examples
are shown below. Please use them as references.
Example 1. Continuously record the waveform data as in the conventional chart-type recorders.
Select “display data only.”
Example 2. Continuously record the waveform data and when an alarm occurs,
record detailed data around the alarm incident.
Select “display data and event data.” For the event data, select“Trigger” or “Rotate” for the mode. Specify the trigger used to start the
event data acquisition and the time period during which to acquire the
data (event data file size).
Example 3. Continuously record detailed data.
Select “even data only.” Select “Free” for the mode.Example 4. Recording is not necessary under normal circumstances. Only record
detailed data around the alarm incident.
Select “event data only.” Select “Trigger” or “Rotate” for the mode.
Specify the trigger used to start the event data acquisition and the time
period during which to acquire the data.
Data TypeSelect “display data only,” “display data and event data,” or “event data only.”
Channels to be StoredSelect the channels to be acquired from measurement and computation channels.
Data Acquisition• Display data
This operation is performed when the type of data acquired is set to “display dataonly,” or “display data and event data.”
Data acquisition starts when the START key is pressed and stopps when the STOP
key is pressed.
The display data are overwritten when the display data storage area in the internal
memory becomes full, or the number of files exceeds 16.The number of display data files is equivalent to the number of times the data
acquisition is started/stopped or the number of files that are segmented by the auto
save interval (during auto save). For details related to the manual save and auto
save, see section 8.4.
Note• The display data in the internal memory can be confirmed with the memory summary. ⇒
“Section 4.5”
• When a power disruption occurs the file is closed.
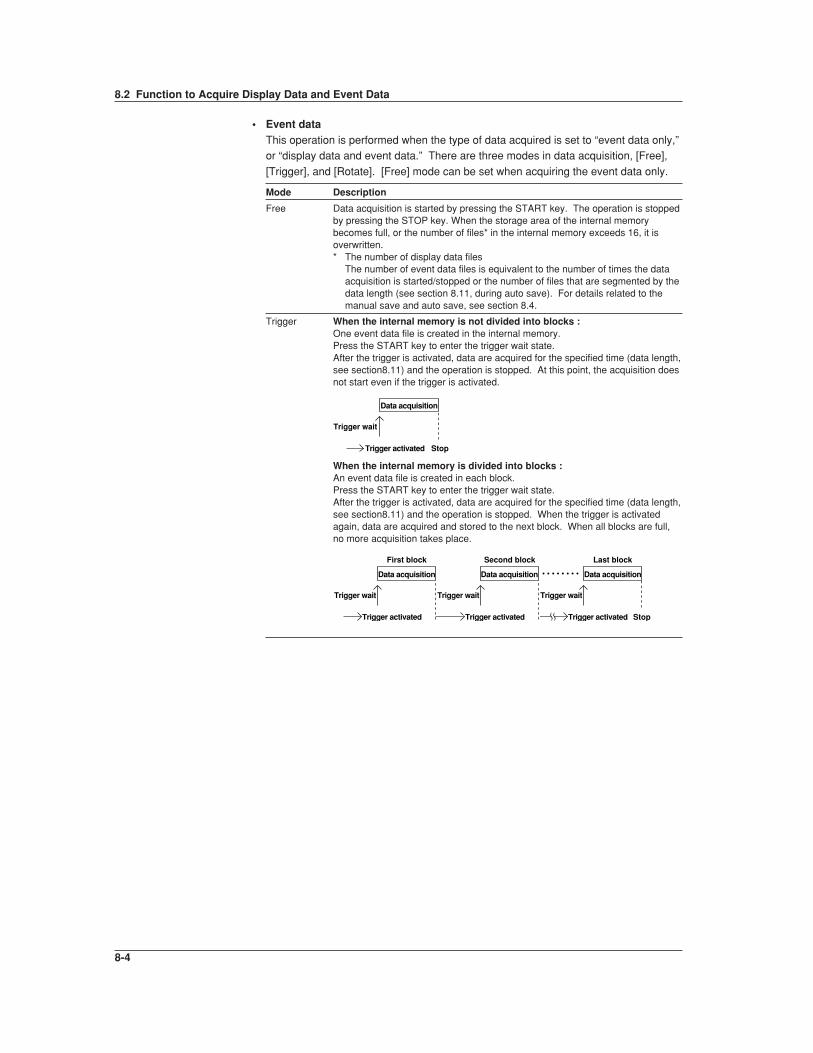
8-4
• Event dataThis operation is performed when the type of data acquired is set to “event data only,”or “display data and event data.” There are three modes in data acquisition, [Free],
[Trigger], and [Rotate]. [Free] mode can be set when acquiring the event data only.
Mode Description
Free Data acquisition is started by pressing the START key. The operation is stoppedby pressing the STOP key. When the storage area of the internal memorybecomes full, or the number of files* in the internal memory exceeds 16, it isoverwritten.* The number of display data files
The number of event data files is equivalent to the number of times the dataacquisition is started/stopped or the number of files that are segmented by thedata length (see section 8.11, during auto save). For details related to themanual save and auto save, see section 8.4.
Trigger When the internal memory is not divided into blocks :One event data file is created in the internal memory.Press the START key to enter the trigger wait state.After the trigger is activated, data are acquired for the specified time (data length,see section8.11) and the operation is stopped. At this point, the acquisition doesnot start even if the trigger is activated.
Data acquisition
Trigger activated Stop
Trigger wait
When the internal memory is divided into blocks :An event data file is created in each block.Press the START key to enter the trigger wait state.After the trigger is activated, data are acquired for the specified time (data length,see section8.11) and the operation is stopped. When the trigger is activatedagain, data are acquired and stored to the next block. When all blocks are full,no more acquisition takes place.
Data acquisition
Trigger wait Trigger wait Trigger wait
Trigger activated Trigger activated Trigger activated
First block
Data acquisition
Second block
Data acquisition
Stop
Last block
8.2 Function to Acquire Display Data and Event Data

8-5
Data A
cqu
isition
and
Savin
g to
Extern
al Sto
rage M
ediu
m
8
Mode Description
Rotate When the internal memory is not divided into blocks :One event data file is created in the internal memory.Press the START key to enter the trigger wait state.After the trigger is activated, data are acquired for the specified time (data length,see section8.11) and the operation is stopped. Data are overwritten when thetrigger is activated again. Every time the trigger is activated during the triggerwait state, data are overwritten. Press the STOP key to terminate dtataacquisition.
Data acquisition
Trigger activated
Trigger wait
When the internal memory is divided into blocks :An event data file each in the blocks is created.Press the START key to enter the trigger wait state.After the trigger is activated, data are acquired for the specified time (data length,see section8.11) and the operation is stopped. When the trigger is activatedagain, data are acquired and stored to the next block. When all blocks are fulland the trigger is activated, data are overwritten to the first block. Every time thetrigger is activated during the trigger wait state, data are overwritten to the nextblock. Press the STOP key to terminate data acquisition.
Data acquisition
Trigger wait Trigger wait Trigger wait
Trigger activated Trigger activated Trigger activated
First block
Data acquisition
Second block
Data acquisition
Last block
Note• The event data in the internal memory can be confirmed with the memory summary. ⇒
“Section 4.5”
• When a power failure occurs, the event data file in the internal memory is closed as one file.
Pre-Trigger for the Event DataPre-trigger is applied to the event data with [Trigger] or [Rotate] modes.
You can have event data before the trigger point be stored.
It is specified in terms of a percentage of the data length (0, 5, 25, 50, 75, 95, 100%). If
0% is selected, all data are after the trigger point. The initial setting is 0%.
Trigger Type for the Event DataWhen [Trigger] or [Rotate] is selected, the trigger type is selected by turning each type of
trigger ON/OFF. The triggers operate in an OR fashion : the trigger is activated when
any of the conditions that are turned ON are satisfied.
Type Description
Key trigger The trigger condition is satisfied when the FUNC - [Trigger] soft key is pressed.External trigger The trigger condition is satisfied when the external contact specified by Remote
Control function is turned ON. See section 10.9.Alarm trigger The trigger condition is satisfied when any of the alarms occur.
8.2 Function to Acquire Display Data and Event Data

8-6
Number of Data Points that can be Acquired and Sampling Length (The Maximum AutoSave Interval for Display Data, the Maximum Data Length for Event Data)
This section describes the number of data points of the display data/event data that can
be acquired and the sampling length. Use the information when determining the amount
of time it takes for the internal memory to become full or when deciding the channels to
be acquired or the sampling interval.
The possible range of menus of the auto save interval of display data and the data lengthof event data is displayed in the soft keys based on the information described here.
Data formatThe display data have minimum and maximum values for each sampling interval. Event
data consists of instantaneous values.
The number of data bytes per channel is shown in the following table.
Data Type Measurement Channel Computation Channel
Display data 4 bytes/channel 8 bytes/channelEvent data 2 bytes/channel 4 bytes/channel
ExampleData format when the data of measurement channels 1 to 4 and a computationchannel 31 are acquired.
Display data
CH1min
2 bytes (binary data)
CH1max
1st scan
CH2min
CH2max
CH3min
CH3max
CH4min
CH4max
2nd scan
nth scan
CH31min
CH31max
CH1min
CH1max
CH2min
CH2max
CH3min
CH3max
CH4min
CH4max
CH31min
CH31max
CH1min
CH1max
CH2min
CH2max
CH3min
CH3max
CH4min
CH4max
CH31min
CH31max
to
Event data
2 bytes (binary data)
1st scan
CH31CH1 CH2 CH3 CH4
CH31CH1 CH2 CH3 CH4
CH31CH1 CH2 CH3 CH4
2nd scan
nth scanto
Internal memory capacityThe capacity of the internal memory that is used for data storage is 1.2 MB. The internalmemory is allocated depending on the acquired data as follows.
Data being Acquired Internal Memory Capacity
Display data only 1.2 MB
Display data and event data Display data : 0.9 MBEvent data : 0.3 MB
Event data only 1.2 MB
8.2 Function to Acquire Display Data and Event Data
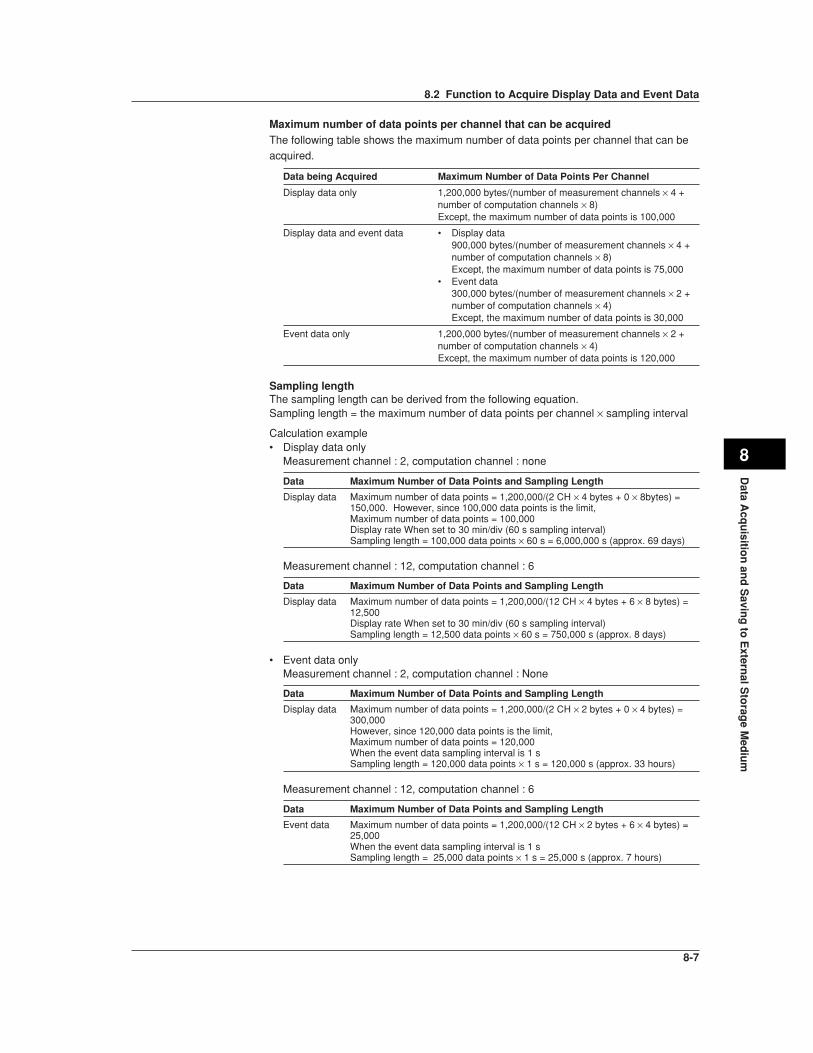
8-7
Data A
cqu
isition
and
Savin
g to
Extern
al Sto
rage M
ediu
m
8
Maximum number of data points per channel that can be acquiredThe following table shows the maximum number of data points per channel that can beacquired.
Data being Acquired Maximum Number of Data Points Per Channel
Display data only 1,200,000 bytes/(number of measurement channels × 4 +number of computation channels × 8)Except, the maximum number of data points is 100,000
Display data and event data • Display data900,000 bytes/(number of measurement channels × 4 +number of computation channels × 8)Except, the maximum number of data points is 75,000
• Event data300,000 bytes/(number of measurement channels × 2 +number of computation channels × 4)Except, the maximum number of data points is 30,000
Event data only 1,200,000 bytes/(number of measurement channels × 2 +number of computation channels × 4)Except, the maximum number of data points is 120,000
Sampling lengthThe sampling length can be derived from the following equation.Sampling length = the maximum number of data points per channel × sampling interval
Calculation example• Display data only
Measurement channel : 2, computation channel : none
Data Maximum Number of Data Points and Sampling Length
Display data Maximum number of data points = 1,200,000/(2 CH × 4 bytes + 0 × 8bytes) =150,000. However, since 100,000 data points is the limit,Maximum number of data points = 100,000Display rate When set to 30 min/div (60 s sampling interval)Sampling length = 100,000 data points × 60 s = 6,000,000 s (approx. 69 days)
Measurement channel : 12, computation channel : 6
Data Maximum Number of Data Points and Sampling Length
Display data Maximum number of data points = 1,200,000/(12 CH × 4 bytes + 6 × 8 bytes) =12,500Display rate When set to 30 min/div (60 s sampling interval)Sampling length = 12,500 data points × 60 s = 750,000 s (approx. 8 days)
• Event data onlyMeasurement channel : 2, computation channel : None
Data Maximum Number of Data Points and Sampling Length
Display data Maximum number of data points = 1,200,000/(2 CH × 2 bytes + 0 × 4 bytes) =300,000However, since 120,000 data points is the limit,Maximum number of data points = 120,000When the event data sampling interval is 1 sSampling length = 120,000 data points × 1 s = 120,000 s (approx. 33 hours)
Measurement channel : 12, computation channel : 6
Data Maximum Number of Data Points and Sampling Length
Event data Maximum number of data points = 1,200,000/(12 CH × 2 bytes + 6 × 4 bytes) =25,000When the event data sampling interval is 1 sSampling length = 25,000 data points × 1 s = 25,000 s (approx. 7 hours)
8.2 Function to Acquire Display Data and Event Data

8-8
• Display data and event dataMeasurement channel : 2, computation channel : none
Data Maximum Number of Data Points and Sampling Length
Display data Maximum number of data points = 900,000/(2 CH × 4 bytes + 0 × 8 bytes) =112,500However, since 75,000 data points is the limit,Maximum number of data points = 75,000Display rate When set to 30 min/div (60 s sampling interval)Sampling length = 75,000 data points × 60 s = 4,500,000 s (approx. 52 days)
Event data Maximum number of data points = 300,000/(2 CH × 2 bytes + 0 × 4 bytes) =75,000However, since 30,000 data points is the limit,Maximum number of data points = 30,000 data pointsWhen the event data sampling interval is 1 sSampling length = 30,000 data points × 1 s = 30,000 s (approx. 8 hours)
Measurement channel : 12, computation channel : 6
Data Maximum Number of Data Points and Sampling Length
Display data Maximum number of data points = 900,000/(12 CH × 4 bytes + 6 × 8 bytes) =9,375Display rate When set to 30 min/div (60 s sampling interval)Sampling length = 9,375 data points × 60 s = 562,500 s (approx. 6.5 days)
Event data Maximum number of data points = 300,000/(12 CH × 2 bytes + 6 × 4 bytes) =6,250When the event data sampling interval is 1 sSampling length = 6,250 data points × 1 s = 6,250 s (approx. 1.7 hours)
8.2 Function to Acquire Display Data and Event Data

8-9
Data A
cqu
isition
and
Savin
g to
Extern
al Sto
rage M
ediu
m
8
8.3 Function to Acquire Other Data
Manual Sampled Data• When the manual sample key is pressed, the instantaneous values of all channels
(excluding the measurement channels that are set to [Skip] and the computation
channels that are turned Off) are acquired.• Up to 50 data sets can be stored in the internal memory. When this number is
exceeded, data are overwritten from the oldest data.
NoteThe number of manual sampled data in the internal memory can be confirmed with the
memory summary. ⇒ “Section 4.5”
TLOG Data (Option)• TLOG data are acquired at each time interval set by timers.• Up to 400 data sets can be stored in the internal memory. When this number is
exceeded, data are overwritten from the oldest data.
Note• Up to 16 TLOG files (number of start and stop) can be stored to the internal memory. When
the number of files in the internal memory exceeds 16, TLOG data are overwritten even if the
number of data sets is less than 400.
• The number of TLOG data sets in the internal memory can be confirmed with the memory
summary. ⇒ “Section 4.5”
Report Data (Option)• Report data are acquired at each time interval (one hour for hourly report, one day for
daily report, etc).
• Up to 40 data sets can be stored in the internal memory. When this number is
exceeded, data are overwritten from the oldest data.For “hourly only”, this constitutes 40 minutes of report data. For “daily+monthly”, this
constitutes 39 daily reports and one monthly report or 38 daily reports and two
monthly reports.
NoteThe number of report data sets in the internal memory can be confirmed with the memory
summary. ⇒ “Section 4.5”

8-10
8.4 Function that Saves the Data in the InternalMemory to the External Storage Medium
There are two methods in which the data are saved to the external storage medium,
manual save and auto save.
Manual SaveThe external storage medium is inserted into the drive only when storing the data
residing in the internal memory.
The data residing in the internal memory are saved to the external storage medium when
the storage medium is inserted into the drive and press MEDIA key.Whether to store the entire data in the memory or only the data that have not been saved
is specified beforehand.
Auto SaveThe external storage medium is placed in the drive at all times. Data saving to theexternal storage medium is done automatically.
NoteEven in the Auto Save mode, the MEDIA key must be pressed to detect the external medium
when it is first inserted into the drive.
Displayed dataThe display data in the internal memory are saved to the external storage medium at thespecified interval (auto save interval, see section 8.8).
Event data• During the free mode
The event data in the internal memory are saved to the external storage medium at
the specified interval (data length, see section 8.11).• During trigger or rotate mode
After acquiring the data to the internal memory over the specified period (data length,
see section 8.11), the event data in the internal memory are saved to the external
storage medium.
The following figure shows the operation when the acquisition area in the internalmemory is divided using the trigger mode.
Data acquisition
Trigger wait Trigger wait Trigger wait
Trigger activated Trigger activated Trigger activated
First block
Data acquisition
Second block Last block
Stop
Data acquisition
Data save to the external storage medium
Manual sampled dataThe first time manual sample is executed, a manual sampled data file is created on the
external storage medium. The data are appended to this file for each successive manual
sample operation.
NoteIf the external storage medium is not inserted, the unsaved data are saved the first time when
manual sample is executed after the external storage medium is inserted.

8-11
Data A
cqu
isition
and
Savin
g to
Extern
al Sto
rage M
ediu
m
8
TLOG dataThe first time TLOG computation is executed, a TLOG computation data file is createdon the external storage medium. The data are appended to this file at each time interval.
When the number of TLOG data sets exceeds 400, a new file is created.
Note• When auto save is selected and there is no medium in the drive at the time when data are
supposed to be saved, all unsaved data are saved the first time when the interval time
expires after the storage medium is reinserted into the drive.
• The “maximum value - minimum value” are not saved to the external medium.
Report dataThe first time report computation is executed, a report data file is created on the external
storage medium. The data are appended to this file at each time interval. A file iscreated for each type of report such as hourly reports and daily reports.
NoteWhen auto save is selected and there is no medium in the drive at the time when data are
supposed to be saved, all unsaved data are saved the first time when the interval time
expires after the storage medium is reinserted into the drive.
Dividing report filesThe report files are divided at the following times.
• When data acquisition is stopped.
• For hourly reports
• When the 0:00 report is created every day.
• When the number of data sets in the file reaches 25.• For daily reports
• When the report for the first day of the month is created every month
• When the number of data sets in the file reaches 32.
8.4 Function that Saves the Data in the Internal Memory to the External Storage Medium
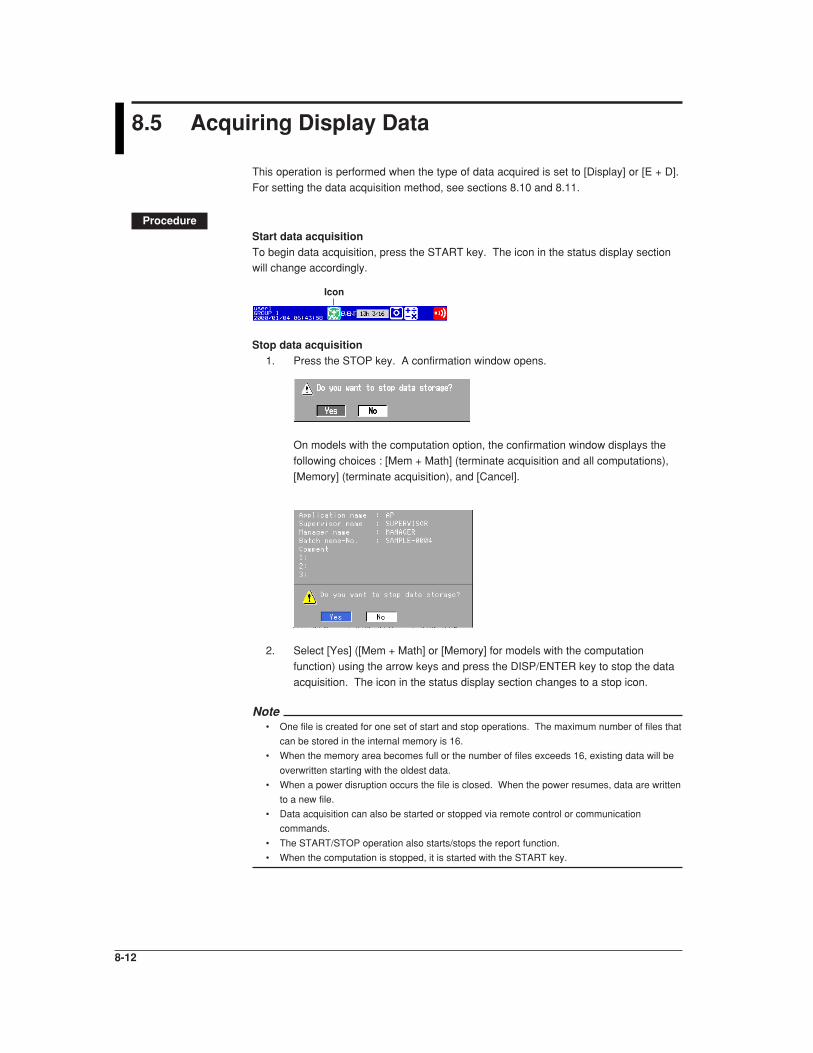
8-12
8.5 Acquiring Display Data
This operation is performed when the type of data acquired is set to [Display] or [E + D].
For setting the data acquisition method, see sections 8.10 and 8.11.
ProcedureStart data acquisitionTo begin data acquisition, press the START key. The icon in the status display sectionwill change accordingly.
Icon
Stop data acquisition1. Press the STOP key. A confirmation window opens.
On models with the computation option, the confirmation window displays the
following choices : [Mem + Math] (terminate acquisition and all computations),
[Memory] (terminate acquisition), and [Cancel].
2. Select [Yes] ([Mem + Math] or [Memory] for models with the computation
function) using the arrow keys and press the DISP/ENTER key to stop the data
acquisition. The icon in the status display section changes to a stop icon.
Note• One file is created for one set of start and stop operations. The maximum number of files that
can be stored in the internal memory is 16.
• When the memory area becomes full or the number of files exceeds 16, existing data will be
overwritten starting with the oldest data.
• When a power disruption occurs the file is closed. When the power resumes, data are written
to a new file.
• Data acquisition can also be started or stopped via remote control or communication
commands.
• The START/STOP operation also starts/stops the report function.
• When the computation is stopped, it is started with the START key.
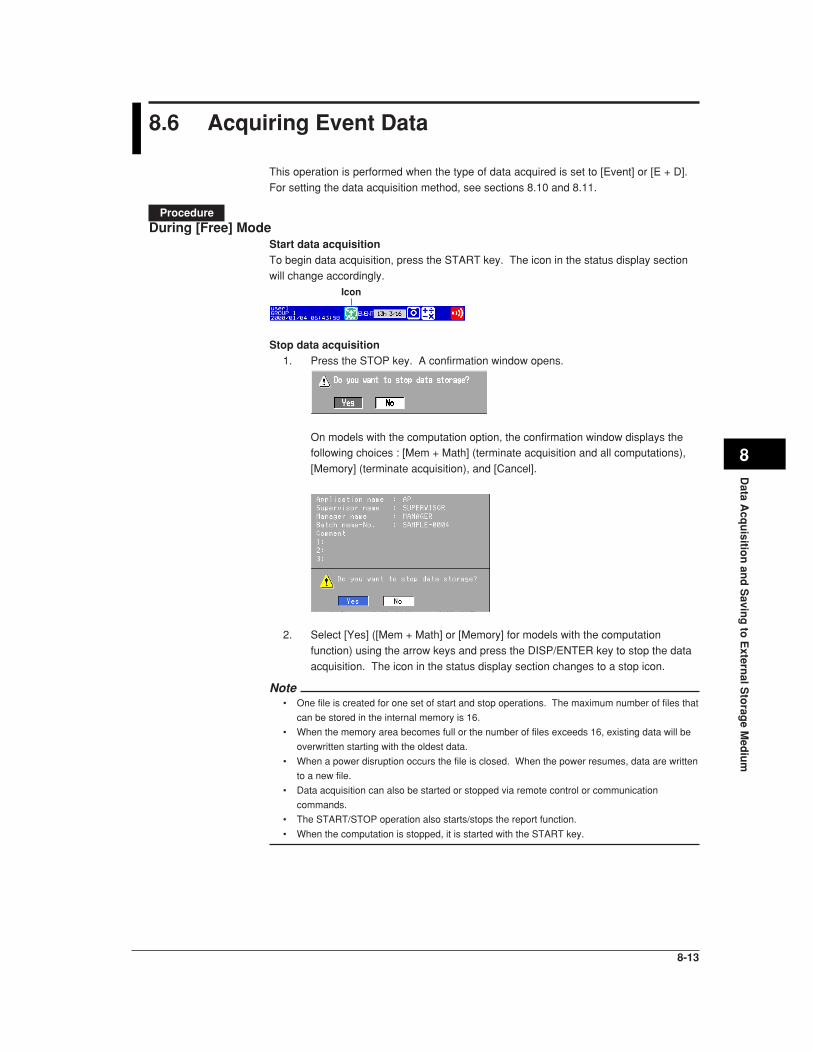
8-13
Data A
cqu
isition
and
Savin
g to
Extern
al Sto
rage M
ediu
m
8
8.6 Acquiring Event Data
This operation is performed when the type of data acquired is set to [Event] or [E + D].
For setting the data acquisition method, see sections 8.10 and 8.11.
ProcedureDuring [Free] Mode
Start data acquisitionTo begin data acquisition, press the START key. The icon in the status display section
will change accordingly.Icon
Stop data acquisition1. Press the STOP key. A confirmation window opens.
On models with the computation option, the confirmation window displays thefollowing choices : [Mem + Math] (terminate acquisition and all computations),
[Memory] (terminate acquisition), and [Cancel].
2. Select [Yes] ([Mem + Math] or [Memory] for models with the computation
function) using the arrow keys and press the DISP/ENTER key to stop the data
acquisition. The icon in the status display section changes to a stop icon.
Note• One file is created for one set of start and stop operations. The maximum number of files that
can be stored in the internal memory is 16.
• When the memory area becomes full or the number of files exceeds 16, existing data will be
overwritten starting with the oldest data.
• When a power disruption occurs the file is closed. When the power resumes, data are written
to a new file.
• Data acquisition can also be started or stopped via remote control or communication
commands.
• The START/STOP operation also starts/stops the report function.
• When the computation is stopped, it is started with the START key.
8-14
During [Trigger] Mode or [Rotate] ModeStart data acquisition
1. Press the START key to enter the trigger wait state. The icon in the status
display section will change accordingly. A bar indicating the pre-trigger data in
the status display section is displayed in orange.
2. When the trigger occurs, data acquisition starts.
Providing the key trigger that starts the data acquisition to the internal memoryThis operation is carried out in the trigger wait state. For all other cases, this operation
produces no effect. For details related to triggers other than the key trigger, see section
sections 8.2 or 8.11.
1. Press the FUNC key to display the soft key menu.2. Press the [Trigger] soft key to start the data acquisition of the event data to the
internal memory.
Stop data acquisitionWriting stops upon reaching the specified time (data length). In the status displaysection, the block to which data were stored turns green. See section 4.2.
NoteDuring the [Trigger] mode, [Full] is displayed when data acquisition to all blocks is complete.
When [Full] is displayed, event data are no longer acquired even if the trigger condition is
met. In this case, save the data in the internal memory to the external storage medium.
Terminate data acquisition with a key operation (in sync with the termination ofthe display data acquisition when acquiring the display data and the event data)
1. Press the STOP key. A confirmation window opens.On models with the computation option, the confirmation window displays the
following choices : [Mem + Math] (terminate acquisition and all computations),
[Memory] (terminate acquisition), and [Cancel].
2. Select [Yes] ([Mem + Math] or [Memory] for models with the computation
function) using the arrow keys and press the DISP/ENTER key to stop the dataacquisition. The icon in the status display section changes to a stop icon.
Note• One file is created for one set of start and stop operations. The maximum number of files that
can be stored in the internal memory is the specified number of blocks.
• When a power disruption occurs the file is closed. When the power resumes, data are written
to a new file.
• Memory write operation can also be started or stopped via remote control or communication
commands.
• The START/STOP operation also starts/stops the report function.
• When the computation is stopped, it is started with the START key.
8.6 Acquiring Event Data
8-15
Data A
cqu
isition
and
Savin
g to
Extern
al Sto
rage M
ediu
m
8
8.7 Saving the Data in the Internal Memory to theExternal Storage Medium
This operation saves the data in the internal memory to the external storage medium.Here, data refers to display data, event data, manual sampled data, TLOG data (option),and report data (option).
When Using Manual SaveProcedure
The operation to save data in the internal memory to the external storage medium canbe carried out when the storage medium is inserted into the drive.
1. Insert the storage medium into the drive and press MEDIA key. A window with a
confirming message, [Do you want to save measured data?] appears.
2. Select [Yes] using the arrow keys and press the DISP/ENTER Key to save data.Select [No] using the arrow keys and press the DISP/ENTER key not to save
data.
Note• You can select whether to save all the data residing in the internal memory or only the data
that have not been saved to the storage medium. See section 8.10.
• If saving to the storage medium is prevented with the key lock function and the key lock is
enabled, data cannot be saved when the medium is inserted into the drive. Turn OFF the key
lock before inserting the medium.
• It is possible that the data in the internal memory are overwritten before the data are stored to
the external storage medium due to limitations such as the capacity of the internal memory.
Refer to sections 8.2 and 8.3 and save the data to the external storage medium before they
are overwritten. For the memory usage display of the internal memory, see section 4.2,
“Using the Status Display Section.”
• When press MEDIA key, the recorder checks whether or not an external storage medium is
inserted in the drive.
When the external storage medium does not have enough spaceChange the external storage medium to save the remaining data.
1. The message [Exchange media to continue the saving operation] will be
displayed. Change the external storage medium and press MEDIA key. The
message [Do you want to continue to save measured data?] will bedisplayed.
2. Selecting [Yes] and pressing the DISP/ENTER key saves the remaining data
to the external storage medium. Selecting [No] and pressing the DISP/
ENTER key does not save the remaining data.
NoteThe data saving operation is interrupted in five minutes after the message [Exchange media
to continue......] was displayed. The message [Memory save to media was interrupted] will be
displayed in this case.
The remaining data can be saved to the external storage medium by another manual save
operation.

8-16
ExplanationName of the directory to which to save the dataFor the setting procedure of the directory to which to save the data, see section 8.9.
• Each time the storage medium is inserted into the drive and the data are saved, the
sequence number of the directory name increments by one.Example When the specified directory name is “DATA0,” the first set of data are
saved to “DATA0.000” and the second set of data are saved to
“DATA0.001.”
• When the directory name is changed, the sequence number is reset to zero.
• When the data are divided and saved over multiple external storage media due to lackof space on the storage medium, the same directory name is used.
• If the specified directory already exists in the external storage medium, an error
message is displayed and the operation terminates (data are not saved).
When Using Auto SaveProcedure
Data are automatically stored by leaving the external storage medium inserted in thedrive. For the data storage operation, see section 8.4.
1. Insert the external medium into the drive and then press the MEDIA key to
detect it.
Note• For the memory usage display of the internal memory, see section 4.2.
• To check the free space on the storage medium, see section 9.5.
• For the name of the directory in which the data are saved, see section 8.9.
When the external storage medium does not have enough spaceReplace the storage medium that is inserted in the drive.
1. The message [Not enough free space on media] appears.
Change the external storage medium. The unsaved data are saved to the
external storage medium at the time for the next “auto save” execution.
NoteBe aware that data in the internal memory will be overwritten if there is not enough free space
on the external storage medium or if the storage medium is not inserted in the drive in the
following cases:
• When the number of display data files exceeds 16. A file is created for each auto save
interval (see section 8.8).
• When the event data are acquired to the internal memory in the free run mode and the
number of files exceeds 16. A file is created at specified acquisition periods (data length,
see section 8.11).
8.7 Saving the Data in the Internal Memory to the External Storage Medium

8-17
Data A
cqu
isition
and
Savin
g to
Extern
al Sto
rage M
ediu
m
8
8.7 Saving the Data in the Internal Memory to the External Storage Medium
Saving the data to the external storage medium using key operation during autosave modeThis operation applies when the data acquisition of the display data, or the data
acquisition of event data in the free mode is in progress and the data storage to the
storage medium is set to auto save. The display data or event data can be saved to the
external storage medium at arbitrary times. The data acquisition to the internal memory
continues even if this operation is carried out.1. Press the FUNC key to display the soft key menu shown below.
[Save Display] : When the type of data acquired to the internal memory*1 is
display data or display data and event data.
[Save Event] : When the type of data acquired to the internal memory*1 is
event data and the trigger is set to free mode*1*2
*1 For the setting procedure, see section 8.11.
*2 The soft key is not displayed in the trigger or rotate mode.
2. Press the soft key to save the data in the internal memory to the external
storage medium.
[Save Display] : The display data file in the internal memory is closed and
saved to the external storage medium. The event data in thetrigger or rotate mode are unaffected by this operation.
[Save Event] : The event data file in the internal memory is closed and
saved to the external storage medium.
ExplanationThe data are acquired to the internal memory for the specified period from the point at
which the data were previously saved to the external storage medium using keyoperation. Then, the data in the internal memory are saved to the storage medium. This
operation is repeated.
Time10:00 11:00 12:0012:20 13:20
11:20
Execute data saving to the external storage medium using key operation.
Store to external storage medium
Saving the Data to the Storage Medium Using Key OperationAll data in the internal memory are saved to the external storage medium.This cannot be executed while data acquisition or computation is in progress. For theoperating procedure, see section 9.2.
NoteSee section 9.7 or 9.8 to clear data in the internal memory.
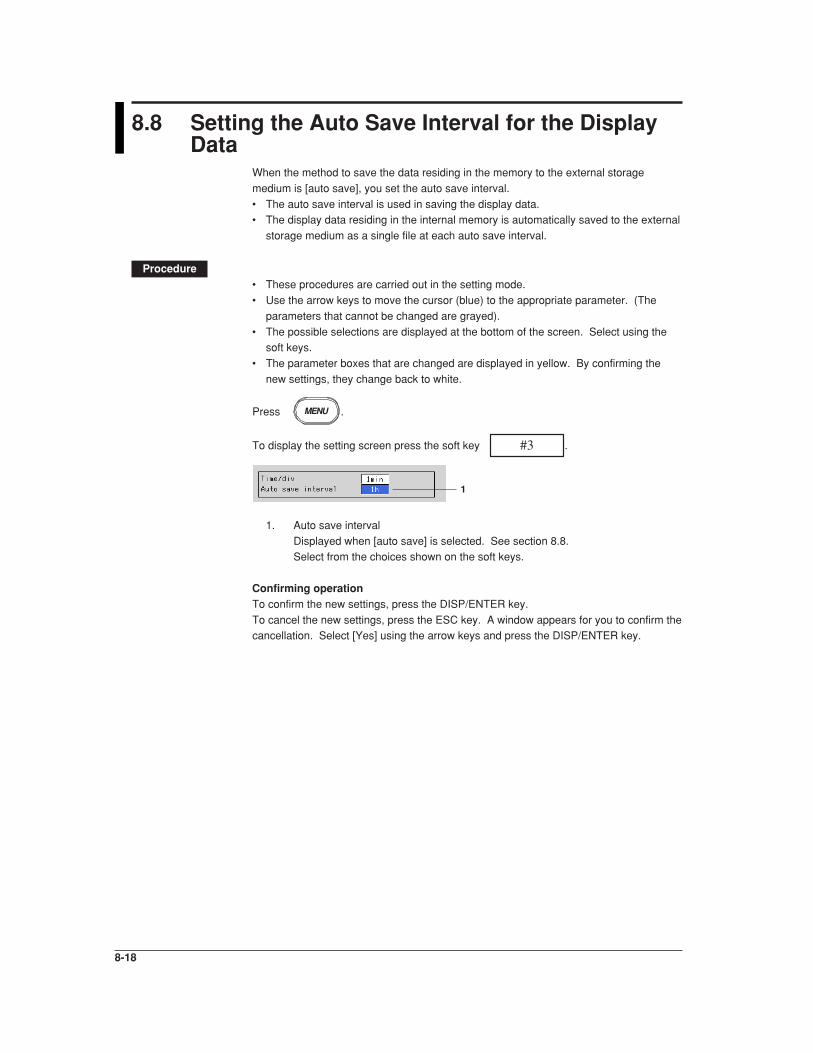
8-18
8.8 Setting the Auto Save Interval for the DisplayData
When the method to save the data residing in the memory to the external storage
medium is [auto save], you set the auto save interval.
• The auto save interval is used in saving the display data.• The display data residing in the internal memory is automatically saved to the external
storage medium as a single file at each auto save interval.
Procedure• These procedures are carried out in the setting mode.
• Use the arrow keys to move the cursor (blue) to the appropriate parameter. (The
parameters that cannot be changed are grayed).
• The possible selections are displayed at the bottom of the screen. Select using thesoft keys.
• The parameter boxes that are changed are displayed in yellow. By confirming the
new settings, they change back to white.
Press MENU .
To display the setting screen press the soft key #3 .
1
1. Auto save interval
Displayed when [auto save] is selected. See section 8.8.Select from the choices shown on the soft keys.
Confirming operationTo confirm the new settings, press the DISP/ENTER key.
To cancel the new settings, press the ESC key. A window appears for you to confirm thecancellation. Select [Yes] using the arrow keys and press the DISP/ENTER key.

8-19
Data A
cqu
isition
and
Savin
g to
Extern
al Sto
rage M
ediu
m
8
ExplanationChoices for the auto save intervalThe maximum auto save interval varies depending on the display update rate (sampling
interval is determined from the display update rate), the data type (display data only/
display data and event data), and the number of measurement and computationchannels to be stored (see section 8.10). The available choices for the auto save interval
are displayed on the soft key. See the table below.
Display Update 1 min 2 min 5 min 10 min 20 min 30 min 1 h 2 h 4 hRate (/DIV)
Sampling 2 4 10 20 40 60 120 240 480interval (s)
Auto save 10 min 10 min 10 min 10 mininterval (choices) 20 min 20 min 20 min 20 min
30 min 30 min 30 min 30 min1 h 1 h 1 h 1 h 1 h 1 h 1 h2 h 2 h 2 h 2 h 2 h 2 h 2 h 2 h3 h 3 h 3 h 3 h 3 h 3 h 3 h 3 h4 h 4 h 4 h 4 h 4 h 4 h 4 h 4 h 4 h6 h 6 h 6 h 6 h 6 h 6 h 6 h 6 h 6 h8 h 8 h 8 h 8 h 8 h 8 h 8 h 8 h 8 h12 h 12 h 12 h 12 h 12 h 12 h 12 h 12 h 12 h1 day 1 day 1 day 1 day 1 day 1 day 1 day 1 day 1 day
2 day 2 day 2 day 2 day 2 day 2 day 2 day 2 day3 day 3 day 3 day 3 day 3 day 3 day 3 day5 day 5 day 5 day 5 day 5 day 5 day 5 day
7 day 7 day 7 day 7 day 7 day 7 day10 day 10 day 10 day 10 day 10 day 10 day
14 day 14 day 14 day 14 day 14 day31 day 31 day 31 day 31 day
8.8 Setting the Auto Save Interval for the Display Data
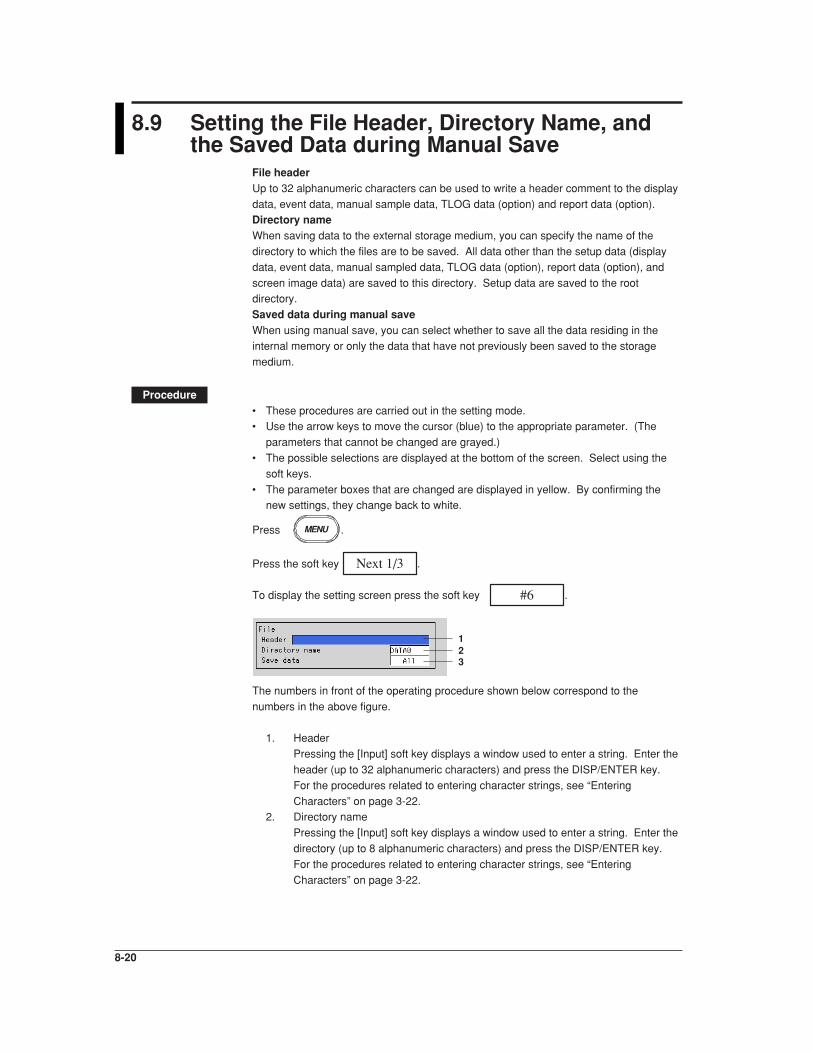
8-20
8.9 Setting the File Header, Directory Name, andthe Saved Data during Manual Save
File headerUp to 32 alphanumeric characters can be used to write a header comment to the display
data, event data, manual sample data, TLOG data (option) and report data (option).Directory nameWhen saving data to the external storage medium, you can specify the name of the
directory to which the files are to be saved. All data other than the setup data (display
data, event data, manual sampled data, TLOG data (option), report data (option), and
screen image data) are saved to this directory. Setup data are saved to the rootdirectory.
Saved data during manual saveWhen using manual save, you can select whether to save all the data residing in the
internal memory or only the data that have not previously been saved to the storage
medium.
Procedure• These procedures are carried out in the setting mode.• Use the arrow keys to move the cursor (blue) to the appropriate parameter. (The
parameters that cannot be changed are grayed.)
• The possible selections are displayed at the bottom of the screen. Select using the
soft keys.
• The parameter boxes that are changed are displayed in yellow. By confirming thenew settings, they change back to white.
Press MENU .
Press the soft key Next 1/3 .
To display the setting screen press the soft key #6 .
123
The numbers in front of the operating procedure shown below correspond to the
numbers in the above figure.
1. Header
Pressing the [Input] soft key displays a window used to enter a string. Enter the
header (up to 32 alphanumeric characters) and press the DISP/ENTER key.
For the procedures related to entering character strings, see “Entering
Characters” on page 3-22.2. Directory name
Pressing the [Input] soft key displays a window used to enter a string. Enter the
directory (up to 8 alphanumeric characters) and press the DISP/ENTER key.
For the procedures related to entering character strings, see “Entering
Characters” on page 3-22.
8-21
Data A
cqu
isition
and
Savin
g to
Extern
al Sto
rage M
ediu
m
8
Note• The following character combinations can not be used as directory names : “AUX”, “CON”,
“PRN”, “NUL”, “CLOCK”.
• All spaces, or spaces at the top or in the middle of character strings are also not allowed for
directory names.
3. Save data
Displayed when [Manual Save] is selected. Select [Unsave] or [All].
The initial setting is [All].• Unsave : Saves only the data that have not been saved when the medium is
inserted into the drive.
• All : Save all the data residing in the memory when the medium is
inserted into the drive.
Confirming operationTo confirm the new settings, press the DISP/ENTER key.
To cancel the new settings, press the ESC key. A window appears for you to confirm the
cancellation. Select [Yes] using the arrow keys and press the DISP/ENTER key.
8.9 Setting the File Header, Directory Name, and the Saved Data during Manual Save

8-22
8.10 Setting the Channels to Display the Trend andAcquire the Data (Basic Setting Mode)
Select the channels for which the trend is to be displayed. The measured and computed
data of these channels can be acquired.
The waveforms for the channels that are turned OFF are not displayed, but numericalvalues, bar graphs and alarms are displayed.
Procedure• These procedures are carried out in the basic setting mode.
• Use the arrow keys to move the cursor (blue) to the appropriate parameter.
• The possible selections are displayed at the bottom of the screen. Select using the
soft keys.
• The parameter boxes that are changed are displayed in yellow. By confirming thenew settings, they change back to white.
Press MENU .
Press FUNC for 3 seconds. The menu screen for the basic setting mode appears.
To display the setting screen press the soft key #4 .
12
3
The numbers in front of the operating procedure shown below correspond to the
numbers in the above figure.
1. Meas CH/Math CH
To set the measurement channels, select [Meas CH]. To set the computation
channels, select [Math CH].2. First channel and last channel
Select the desired channel numbers.
3. On/Off
On : Display the trendOff : Do not display the trend
The initial setting is [On] for all channels.
Confirming operationTo confirm the new settings, press the DISP/ENTER key.
To cancel the new settings, press the ESC key. A window appears for you to confirm the
cancellation. Select [Yes] using the arrow keys and press the DISP/ENTER key.
ExplanationThe number of measurement and computation channels available in the differentmodels
Model Measurement Channel Computation Channel
RD-MV102 2 channels (1 to 2) 4 channels (31 to 34)RD-MV104 4 channels (1 to 4) 4 channels (31 to 34)RD-MV106 6 channels (1 to 6) 12 channels (31 to 42)RD-MV112 12 channels (1 to 12) 12 channels (31 to 42)

8-23
Data A
cqu
isition
and
Savin
g to
Extern
al Sto
rage M
ediu
m
8
8.11 Setting the Method of the Display/Event DataAcquisition (Basic Setting Mode)
Set the method of the display/event data acquisition.
Procedure• These procedures are carried out in the basic setting mode.
• Use the arrow keys to move the cursor (blue) to the appropriate parameter.
• The possible selections are displayed at the bottom of the screen. Select using thesoft keys.
• The parameter boxes that are changed are displayed in yellow. By confirming the
new settings, they change back to white.
Press MENU .
Press FUNC for 3 seconds. The menu screen for the basic setting mode appears.
To display the setting screen press the soft key #3 .
12
34567
8
The numbers in front of the operating procedure shown below correspond to the
numbers in the above figure.
Data save to the external storage medium1. Save
Set save method to the external storage medium.Select [Auto] or [Manual].
Auto : auto save
Manual : manual saveNote
If [Manual] (manual save) is selected in step 1, set whether to save all the data in the internal
memory or only the data that have not been saved when the storage medium is inserted into
the drive and the front cover is closed. See section 8.9.
Data acquisition• Acquiring only the display data
2. Data
Select [Display].
NoteIf [Auto] (auto save) is selected in step 1 and [Display] is selected in step 2, set the auto save
interval for the display data. See section 8.8.

8-24
• Acquiring only the event data2. Data
Select [Event].
Boxes used to set the method for event data acquisition are displayed.Note
If [Manual] (manual save) is selected in step 1, set whether to save all the data in the internal
memory or only the data that have not been saved when the storage medium is inserted into
the drive and the front cover is closed. See section 8.10.
3. Event - Sample rate
This is the sampling interval for the event data.
RD-MV102, RD-MV104 : 125 ms, 250 ms, 500 ms, 1 s, 2 s, 5 s, 10 s, 30 s, 60
s, and 120 sRD-MV106, RD-MV112 : 1 s, 2 s, 5 s, 10 s, 30 s, 60 s, 120 s
4. Event - Mode
Select from [Free], [Trigger], or [Rotate].
If [Free] is selected, item 6 is displayed.
If [Trigger] or [Rotate] is selected, items 5, 6, 7, and 8 are displayed.5. Event - Block
The event data storage area in the internal mamory is divided by the specified
number.
Select 1, 2, 4, 8, or 16. (Select 1, 2, or 4 when acquiring display and event data)
6. Event - Data lengthThe size of the event data file is expressed as a length of time over which data
are acquired.
The data length that can be specified varies depending on the sampling interval
([sample rate] in item 3), number of blocks, and the number of measurement
and computation channels that are acquired.7. Event - Pre-Trigger
This is the range of data to be acquired before the trigger point. It is specified
as a percentage of the data length (0, 5, 25, 50, 75, 95, and 100%). If 0% is
selected, all data after the trigger point are acquired. The initial setting is 0%.
8. Event - TriggerKey : When using key operation to activate the trigger, turn this parameter On.
External : When using remote control function (option) to activate the trigger,
turn this parameter On.
Alarm : When using alarms as triggers, turn this parameter On.
Note• If the [Alarm] parameter is turned On, trigger is activated if any one of the alarms occurs.
• If [Alarm] parameter is turned On and the alarm was already activated when the START key
is pressed, trigger is also activated.
• OR logic applies to the [Key], [External], and [Alarm] parameters. If any one of the conditions
that are turned On is met, the trigger is activated.
• Acquiring display data and event data2. Data type
Select [E + D].
NoteIf [Auto] (auto save) is selected in step 1 and [E + D] is selected in step 2, set the auto save
interval for the display data. See section 8.8.
8.11 Setting the Method of the Display/Event Data Acquisition (Basic Setting Mode)
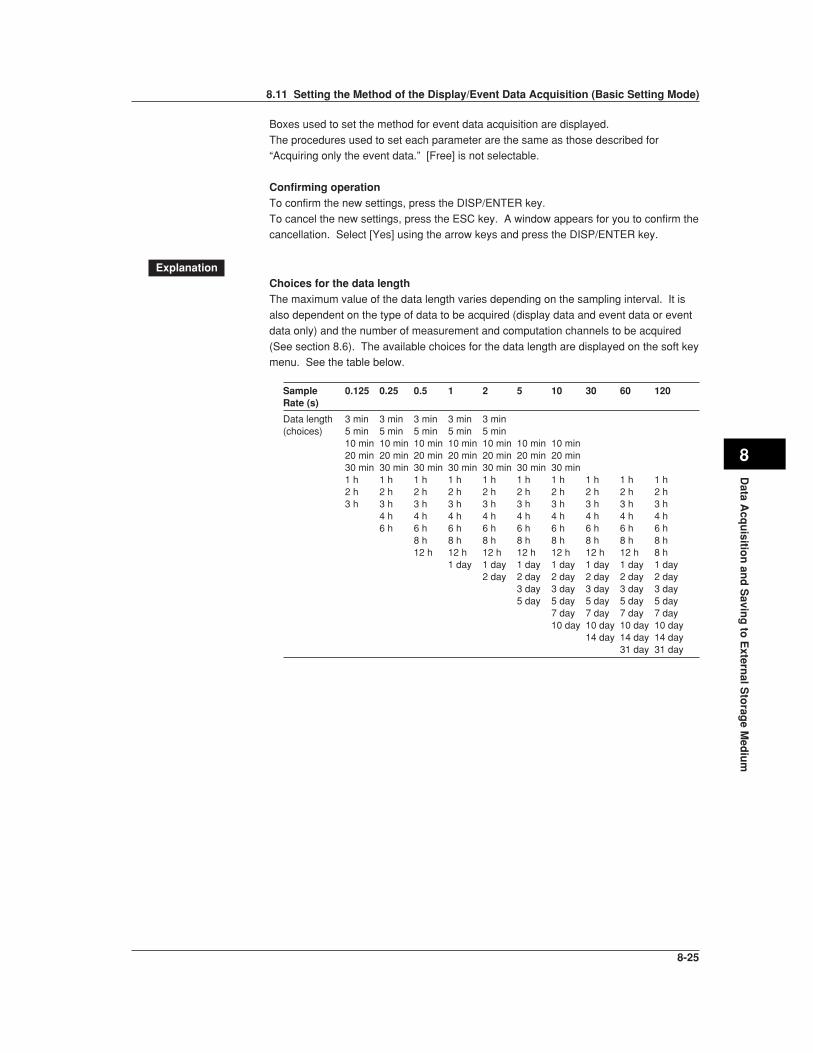
8-25
Data A
cqu
isition
and
Savin
g to
Extern
al Sto
rage M
ediu
m
8
Boxes used to set the method for event data acquisition are displayed.
The procedures used to set each parameter are the same as those described for“Acquiring only the event data.” [Free] is not selectable.
Confirming operationTo confirm the new settings, press the DISP/ENTER key.
To cancel the new settings, press the ESC key. A window appears for you to confirm thecancellation. Select [Yes] using the arrow keys and press the DISP/ENTER key.
ExplanationChoices for the data lengthThe maximum value of the data length varies depending on the sampling interval. It is
also dependent on the type of data to be acquired (display data and event data or event
data only) and the number of measurement and computation channels to be acquired
(See section 8.6). The available choices for the data length are displayed on the soft keymenu. See the table below.
Sample 0.125 0.25 0.5 1 2 5 10 30 60 120Rate (s)
Data length 3 min 3 min 3 min 3 min 3 min(choices) 5 min 5 min 5 min 5 min 5 min
10 min 10 min 10 min 10 min 10 min 10 min 10 min20 min 20 min 20 min 20 min 20 min 20 min 20 min30 min 30 min 30 min 30 min 30 min 30 min 30 min1 h 1 h 1 h 1 h 1 h 1 h 1 h 1 h 1 h 1 h2 h 2 h 2 h 2 h 2 h 2 h 2 h 2 h 2 h 2 h3 h 3 h 3 h 3 h 3 h 3 h 3 h 3 h 3 h 3 h
4 h 4 h 4 h 4 h 4 h 4 h 4 h 4 h 4 h6 h 6 h 6 h 6 h 6 h 6 h 6 h 6 h 6 h
8 h 8 h 8 h 8 h 8 h 8 h 8 h 8 h12 h 12 h 12 h 12 h 12 h 12 h 12 h 8 h
1 day 1 day 1 day 1 day 1 day 1 day 1 day2 day 2 day 2 day 2 day 2 day 2 day
3 day 3 day 3 day 3 day 3 day5 day 5 day 5 day 5 day 5 day
7 day 7 day 7 day 7 day10 day 10 day 10 day 10 day
14 day 14 day 14 day31 day 31 day
8.11 Setting the Method of the Display/Event Data Acquisition (Basic Setting Mode)

8-26
8.12 Storing Measured/Computed Data at ArbitraryTimes (Manual Sampling)
The instantaneous values of all measurement and computation channels (excluding the
measurement channels that are set to [Skip] and the computation channels that are
turned Off) can be stored to the internal memory with a key operation.Computation channels are options.
See section 8.3.
ProcedureThis operation is carried out in the operation mode.
1. Press the FUNC key to display the soft key menu.
2. Press the [Manual sample] soft key. The instantaneous values of all channels
(excluding the measurement channels that are set to [Skip] and the computationchannels that are turned Off) are stored to the internal memory.
NoteThe manual sampling can also be carried out via remote control or communication commands.
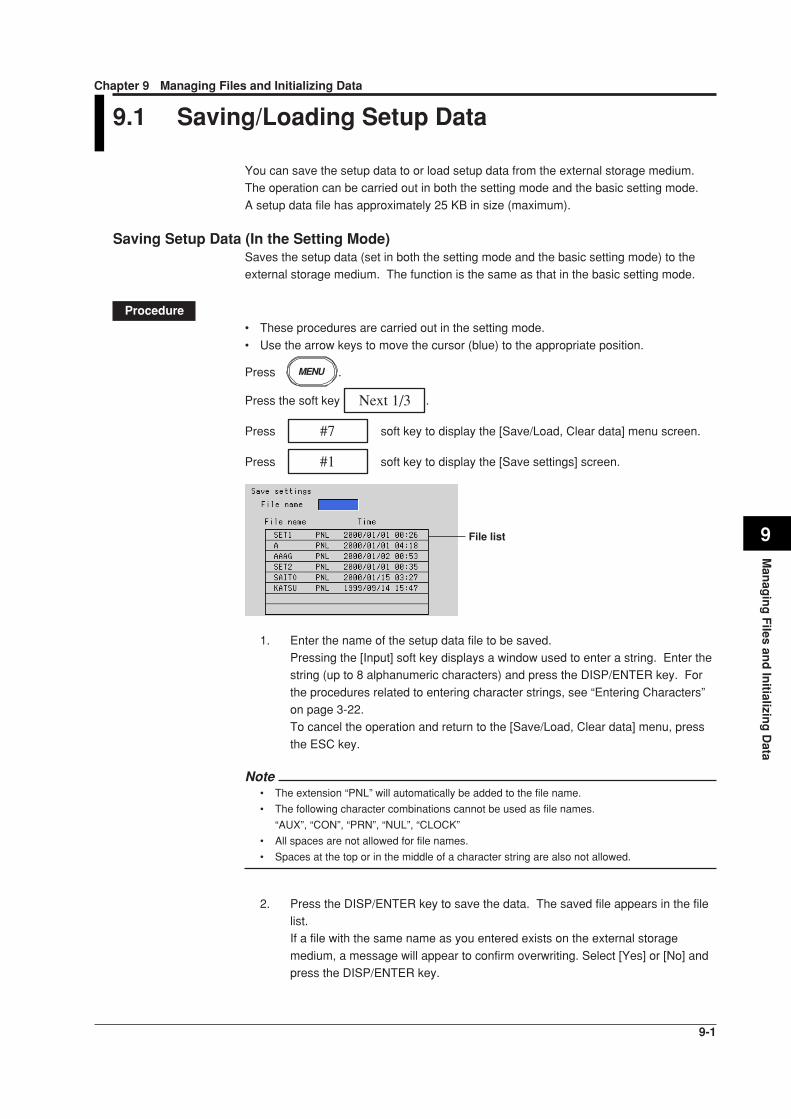
9-1
Man
agin
g F
iles and
Initializin
g D
ata
9
Chapter 9 Managing Files and Initializing Data
9.1 Saving/Loading Setup Data
You can save the setup data to or load setup data from the external storage medium.The operation can be carried out in both the setting mode and the basic setting mode.
A setup data file has approximately 25 KB in size (maximum).
Saving Setup Data (In the Setting Mode)Saves the setup data (set in both the setting mode and the basic setting mode) to theexternal storage medium. The function is the same as that in the basic setting mode.
Procedure• These procedures are carried out in the setting mode.
• Use the arrow keys to move the cursor (blue) to the appropriate position.
Press MENU .
Press the soft key Next 1/3 .
Press #7 soft key to display the [Save/Load, Clear data] menu screen.
Press #1 soft key to display the [Save settings] screen.
File list
1. Enter the name of the setup data file to be saved.Pressing the [Input] soft key displays a window used to enter a string. Enter thestring (up to 8 alphanumeric characters) and press the DISP/ENTER key. For
the procedures related to entering character strings, see “Entering Characters”on page 3-22.To cancel the operation and return to the [Save/Load, Clear data] menu, press
the ESC key.
Note• The extension “PNL” will automatically be added to the file name.
• The following character combinations cannot be used as file names.
“AUX”, “CON”, “PRN”, “NUL”, “CLOCK”
• All spaces are not allowed for file names.
• Spaces at the top or in the middle of a character string are also not allowed.
2. Press the DISP/ENTER key to save the data. The saved file appears in the filelist.If a file with the same name as you entered exists on the external storage
medium, a message will appear to confirm overwriting. Select [Yes] or [No] andpress the DISP/ENTER key.
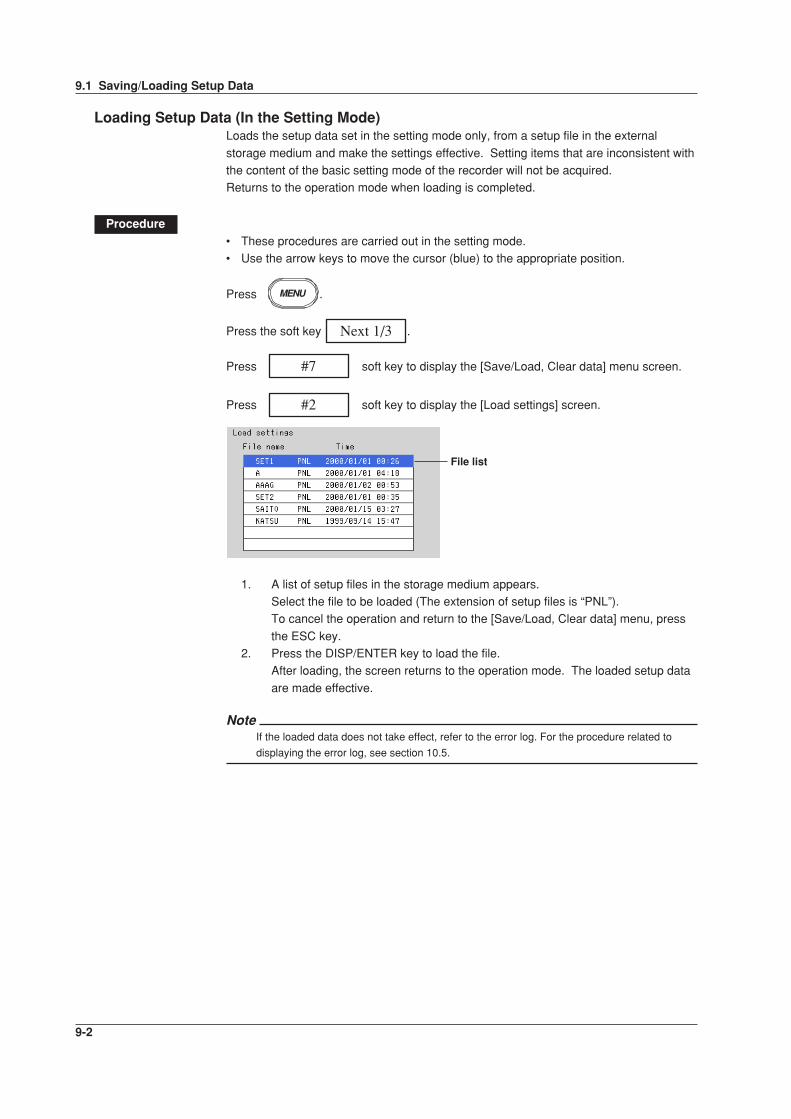
9-2
Loading Setup Data (In the Setting Mode)Loads the setup data set in the setting mode only, from a setup file in the external
storage medium and make the settings effective. Setting items that are inconsistent withthe content of the basic setting mode of the recorder will not be acquired.Returns to the operation mode when loading is completed.
Procedure• These procedures are carried out in the setting mode.• Use the arrow keys to move the cursor (blue) to the appropriate position.
Press MENU .
Press the soft key Next 1/3 .
Press #7 soft key to display the [Save/Load, Clear data] menu screen.
Press #2 soft key to display the [Load settings] screen.
File list
1. A list of setup files in the storage medium appears.Select the file to be loaded (The extension of setup files is “PNL”).To cancel the operation and return to the [Save/Load, Clear data] menu, press
the ESC key.2. Press the DISP/ENTER key to load the file.
After loading, the screen returns to the operation mode. The loaded setup data
are made effective.
NoteIf the loaded data does not take effect, refer to the error log. For the procedure related to
displaying the error log, see section 10.5.
9.1 Saving/Loading Setup Data

9-3
Man
agin
g F
iles and
Initializin
g D
ata
9
Saving Setup Data (In the Basic Setting Mode)Saves the setup data (set in both the setting mode and the basic setting mode) to the
external storage medium. The function is the same as that in the setting mode.
Procedure• These procedures are carried out in the basic setting mode.• Use the arrow keys to move the cursor (blue) to the appropriate position.
Press MENU .
Press FUNC for 3 seconds. The menu screen for the basic setting mode appears.
Press the soft key Next 1/3 .
Press #8 soft key to display the [Save/Load, Initialize] menu screen.
Press #1 soft key to display the [Save settings] screen.
File list
1. Enter the name of the setup data file to be saved.Pressing the [Input] soft key displays a window used to enter a string. Enter the
string (up to 8 alphanumeric characters) and press the DISP/ENTER key. Forthe procedures related to entering character strings, see “Entering Characters”on page 3-22.
To cancel the operation and return to the [Save/Load, Initialize] menu, press theESC key.
Note• The extension “PNL” will automatically be added to the file name.
• The following character combinations cannot be used as file names.
“AUX”, “CON”, “PRN”, “NUL”, “CLOCK”
• All spaces are not allowed for file names.
• Spaces at the top or in the middle of a character string are also not allowed.
2. Press the DISP/ENTER key to save the data. The saved file appears in the filelist.
If a file with the same name as you entered exists on the external storagemedium, a message will appear to confirm overwriting. Select [Yes] or [No] andpress the DISP/ENTER key.
9.1 Saving/Loading Setup Data

9-4
Loading Setup Data (In the Basic Setting Mode)Loads the setup data (set in both the setting mode and the basic Setting mode) from a
setup file in the external storage medium and make the settings effective.Returns to the operation mode when loading is completed.
Procedure• These procedures are carried out in the basic setting mode.
• Use the arrow keys to move the cursor (blue) to the appropriate position.
Press MENU .
Press FUNC for 3 seconds. The menu screen for the basic setting mode appears.
Press the soft key Next 1/3 .
Press #8 soft key to display the [Save/Load, Initialize] menu screen.
Press #2 soft key to display the [Load settings] screen.
File list
1. A list of setup files in the storage medium appears.
Select the file to be loaded (The extension of setup files is “PNL”).To cancel the operation and return to the [Save/Load, Initialize] menu, press theESC key.
2. Press the DISP/ENTER key to load the file.After loading, the screen returns to the operation mode. The loaded setup datatake effect.
NoteIf the loaded data does not take effect, refer to the error log. For the procedure related to
displaying the error log, see section 10.5.
9.1 Saving/Loading Setup Data

9-5
Man
agin
g F
iles and
Initializin
g D
ata
9
9.2 Saving Data in the Internal Memory to theExternal Storage Medium Using Key Operation
The following data in the internal storage memory are saved to the external storage
medium using key operation.Display data/Event data/Menual sampled data/TLOG data (option)/Report data (option)
Procedure• These procedures are carried out in the setting mode.
Press MENU .
Press the soft key Next 1/3 .
Press #7 soft key to display the [Save/Load, Clear data] menu screen.
Press #3 [Save data] soft key to save the data in the internal memory to
the external storage medium.
NoteThe data in the internal memory cannot be saved to the external storage medium while data
acquisition or computation is in progress.
ExplanationName of the directory to which to save the dataThe name of the directory to which to save the data is “the specified name”. AXX, whereXX is the sequence number. Each time carrying out the key operation and the data aresaved, the sequence number of the directory name increments by one.
Example When the specified directory name is “DATA0”, the first set of data aresaved to “DATA0.A00” and the second set of data are saved to“DATA0.A01”.

9-6
9.3 Viewing Display Data in the External StorageMedium
Loads the display data saved in the external storage medium and displays the waveform
on the historical trend screen. This operation can be carried out when the acquisition ofdisplay data is set ([Display] or [E+D] in section 8.11). See section 4.6, for the use of thehistorical trend.
Procedure• These procedures are carried out in the setting mode.• Use the arrow keys to move the cursor (blue) to the appropriate position.
Press MENU .
Press the soft key Next 1/3 .
Press #7 soft key to display the [Save/Load, Clear data] menu screen.
Press #4 soft key to display the [Load display data] screen.
File list
For models with the batch function (/BT1 option), press the [Time] soft key when
displaying the date and time of file creation and the [Batch] soft key when displaying thebatch number and lot number.
1. The directories in the external storage medium are displayed in the [Directoryname] column. Press the up or down arrow key to select the directorycontaining the display data to be loaded. A list of files in the selected directory
is displayed in the right column. Root directory is denoted by [/]. 2. Press the right arrow key to move the cursor on to the file list. Press the up or
arrow key to select the display data file to be loaded. To move back to the
[Directory name] column, press the left arrow key.3. Press the DISP/ENTER key to display the waveform on the historical trend
screen. To return to the [Save/Load, Clear data] menu screen without displaying
the historical trend, press the ESC key.
NoteFiles saved in the internal memory as Event Data File Only can’t be loaded.

9-7
Man
agin
g F
iles and
Initializin
g D
ata
9
9.4 Viewing Event Data in the External StorageMedium
Loads the event data saved in the external storage medium and displays the waveform
on the historical trend screen. This operation can be carried out when the acquisition ofevent data is set ([Event] or [E+D] in section 8.11). See section 4.6, for the use of thehistorical trend.
Procedure• These procedures are carried out in the setting mode.• Use the arrow keys to move the cursor (blue) to the appropriate position.
Press MENU .
Press the soft key Next 1/3 .
Press #7 soft key to display the [Save/Load, Clear data] menu screen.
Press the soft key Next 1/3 .
Press #5 soft key to display the [Load event data] screen.
File list
For models with the batch function (/BT1 option), press the [Time] soft key whendisplaying the date and time of file creation and the [Batch] soft key when displaying the
batch number and lot number.
1. The directories in the external storage medium are displayed in the [Directoryname] column. Press the up or down arrow key to select the directorycontaining the event data to be loaded. A list of files in the selected directory is
displayed in the right column. Root directory is denoted by [/]. 2. Press the right arrow key to move the cursor on to the file list. Press the up or
arrow key to select the event data file to be loaded. To move back to the
[Directory name] column, press the left arrow key.3. Press the DISP/ENTER key to display the waveform on the historical trend
screen. To return to the [Save/Load, Clear data] menu screen without displaying
the historical trend, press the ESC key.
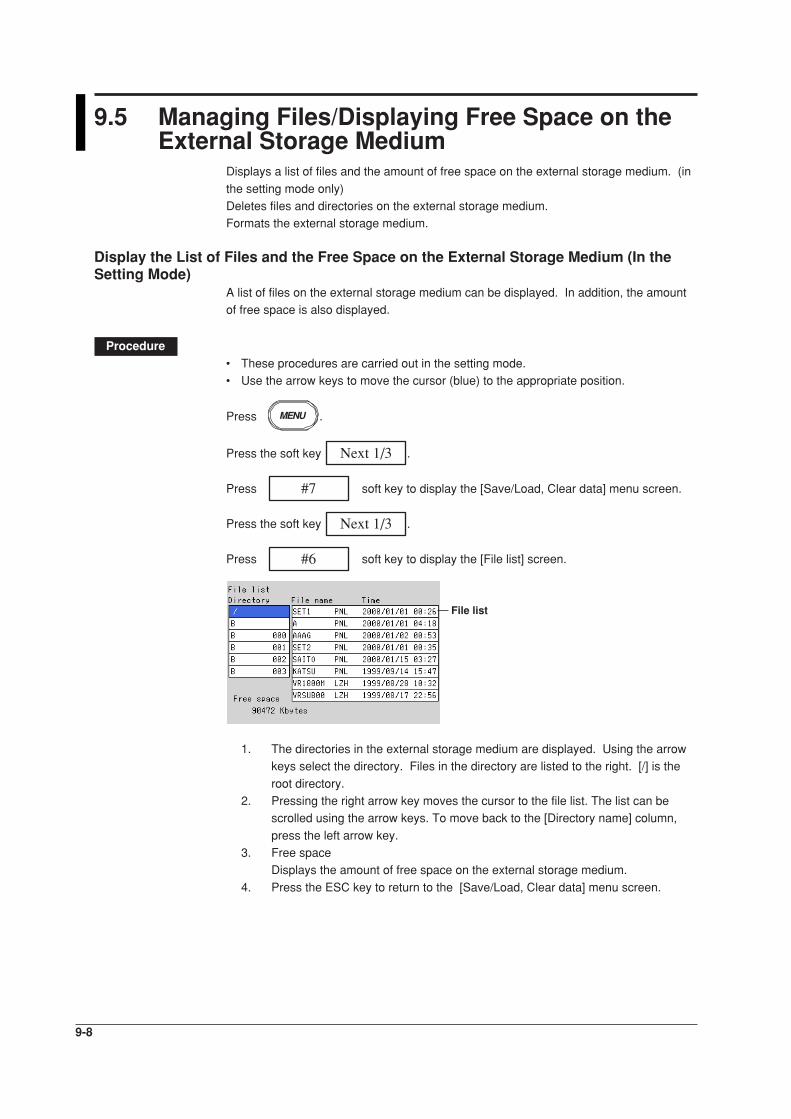
9-8
9.5 Managing Files/Displaying Free Space on theExternal Storage Medium
Displays a list of files and the amount of free space on the external storage medium. (in
the setting mode only)Deletes files and directories on the external storage medium.Formats the external storage medium.
Display the List of Files and the Free Space on the External Storage Medium (In theSetting Mode)
A list of files on the external storage medium can be displayed. In addition, the amountof free space is also displayed.
Procedure• These procedures are carried out in the setting mode.• Use the arrow keys to move the cursor (blue) to the appropriate position.
Press MENU .
Press the soft key Next 1/3 .
Press #7 soft key to display the [Save/Load, Clear data] menu screen.
Press the soft key Next 1/3 .
Press #6 soft key to display the [File list] screen.
File list
1. The directories in the external storage medium are displayed. Using the arrowkeys select the directory. Files in the directory are listed to the right. [/] is the
root directory.2. Pressing the right arrow key moves the cursor to the file list. The list can be
scrolled using the arrow keys. To move back to the [Directory name] column,
press the left arrow key.3. Free space
Displays the amount of free space on the external storage medium.
4. Press the ESC key to return to the [Save/Load, Clear data] menu screen.

9-9
Man
agin
g F
iles and
Initializin
g D
ata
9
Deleting Files and Directories on the External Storage Medium (In the Setting Mode)Deletes files and directories on the external storage medium. The function is the same
as that in the basic setting mode.
Procedure• These procedures are carried out in the setting mode.• Use the arrow keys to move the cursor (blue) to the appropriate position.
Press MENU .
Press the soft key Next 1/3 .
Press #7 soft key to display the [Save/Load, Clear data] menu screen.
Press the soft key Next 1/3 .
Press #7 soft key to display the [Delete] screen.
File list
Deleting a file in a directory1. Of the directories listed in the [Directory name] frame, select the directory in
which the file you wish to delete exists using the up and down arrow keys. The
[File name] frame displays a list of files in the selected directory. [/] is the rootdirectory.
2. Pressing the right arrow key moves the cursor onto the [File name] frame. Use
the up and down arrow keys to select the file to be deleted.3. Pressing the DISP/ENTER key displays a confirmation dialog box.4. Use the arrow keys to select [Yes] and press the DISP/ENTER key to delete the
selected file. The file is cleared from the file list.To cancel the delete operation, select [No] and press the DISP/ENTER key.
NoteIf the ESC key is pressed in the middle of the operation, the screen returns to the [Save/Load,
Clear Data] menu.
9.5 Managing Files/Displaying Free Space on the External Storage Medium
9-10
Deleting all the files in the directory1. Of the directories listed in the [Directory name] frame, select the directory in
which the files you wish to delete exist using the up and down arrow keys. The[File name] frame displays a list of files in the selected directory. [/] is the rootdirectory.
2. Pressing the DISP/ENTER key displays a confirmation dialog box.3. Use the arrow keys to select [Yes] and press the DISP/ENTER key to delete all
the files in the directory. All files are cleared from the file list.
To cancel the delete operation, select [No] and press the DISP/ENTER key.
NoteIf the ESC key is pressed in the middle of the operation, the screen returns to the [Save/Load,
Clear Data] menu.
Deleting a directoryA directory can be deleted if there are no files in the directory. To delete a directory thathas files, delete all the files in the directory first.
1. Of the directories listed in the [Directory name] frame, select the directory youwish to delete using the up and down arrow keys. Check that no files aredisplayed in the [File name] frame. [/] is the root directory. The root directory
cannot be deleted.2. Pressing the DISP/ENTER key displays a confirmation dialog box.3. Use the arrow keys to select [Yes] and press the DISP/ENTER key to delete the
directory. The directory name is cleared from the [Directory name] frame.To cancel the delete operation, select [No] and press the DISP/ENTER key.
NoteIf the ESC key is pressed in the middle of the operation, the screen returns to the [Save/Load,
Clear Data] menu.
9.5 Managing Files/Displaying Free Space on the External Storage Medium
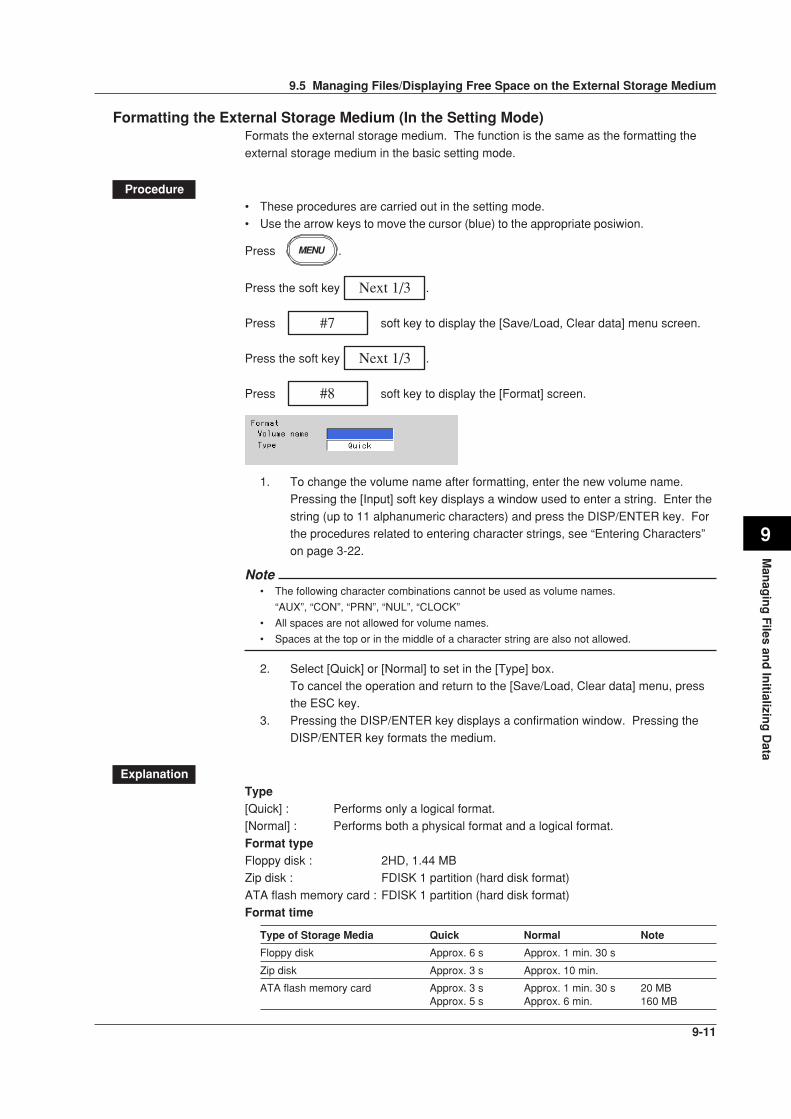
9-11
Man
agin
g F
iles and
Initializin
g D
ata
9
Formatting the External Storage Medium (In the Setting Mode)Formats the external storage medium. The function is the same as the formatting the
external storage medium in the basic setting mode.
Procedure• These procedures are carried out in the setting mode.• Use the arrow keys to move the cursor (blue) to the appropriate posiwion.
Press MENU .
Press the soft key Next 1/3 .
Press #7 soft key to display the [Save/Load, Clear data] menu screen.
Press the soft key Next 1/3 .
Press #8 soft key to display the [Format] screen.
1. To change the volume name after formatting, enter the new volume name.Pressing the [Input] soft key displays a window used to enter a string. Enter the
string (up to 11 alphanumeric characters) and press the DISP/ENTER key. Forthe procedures related to entering character strings, see “Entering Characters”on page 3-22.
Note• The following character combinations cannot be used as volume names.
“AUX”, “CON”, “PRN”, “NUL”, “CLOCK”
• All spaces are not allowed for volume names.
• Spaces at the top or in the middle of a character string are also not allowed.
2. Select [Quick] or [Normal] to set in the [Type] box.To cancel the operation and return to the [Save/Load, Clear data] menu, pressthe ESC key.
3. Pressing the DISP/ENTER key displays a confirmation window. Pressing theDISP/ENTER key formats the medium.
ExplanationType[Quick] : Performs only a logical format.[Normal] : Performs both a physical format and a logical format.
Format typeFloppy disk : 2HD, 1.44 MBZip disk : FDISK 1 partition (hard disk format)
ATA flash memory card : FDISK 1 partition (hard disk format)Format time
Type of Storage Media Quick Normal Note
Floppy disk Approx. 6 s Approx. 1 min. 30 s
Zip disk Approx. 3 s Approx. 10 min.
ATA flash memory card Approx. 3 s Approx. 1 min. 30 s 20 MBApprox. 5 s Approx. 6 min. 160 MB
9.5 Managing Files/Displaying Free Space on the External Storage Medium

9-12
Deleting Files and Directories on the External Storage Medium (In the Basic SettingMode)
Deletes files and directories on the external storage medium. The function is the sameas that in the setting mode.
Procedure• These procedures are carried out in the basic setting mode.
• Use the arrow keys to move the cursor (blue) to the appropriate position.
Press MENU .
Press FUNC for 3 seconds. The menu screen for the basic setting mode appears.
Press the soft key Next 1/3 .
Press #8 soft key to display the [Save/Load, Initialize] menu screen.
Press #3 soft key to display the [Delete] screen.
File list
Deleting files and directories can be excuted in the same procedure as that in the settingmode. See page 9-9.
Formatting the External Storage Medium (In the Basic Setting Mode)Formats the external storage medium. The function is the same as that in the settingmode.
Procedure• These procedures are carried out in the basic setting mode.• Use the arrow keys to move the cursor (blue) to the appropriate position.
Press MENU .
Press FUNC for 3 seconds. The menu screen for the basic setting mode appears.
Press the soft key Next 1/3 .
Press #8 soft key to display the [Save/Load, Initialize] menu screen.
Press #4 soft key to display the [Format] screen.
Formatting the external storage medium can be excuted in the same procedure as that inthe setting mode. See page 9-11.
9.5 Managing Files/Displaying Free Space on the External Storage Medium
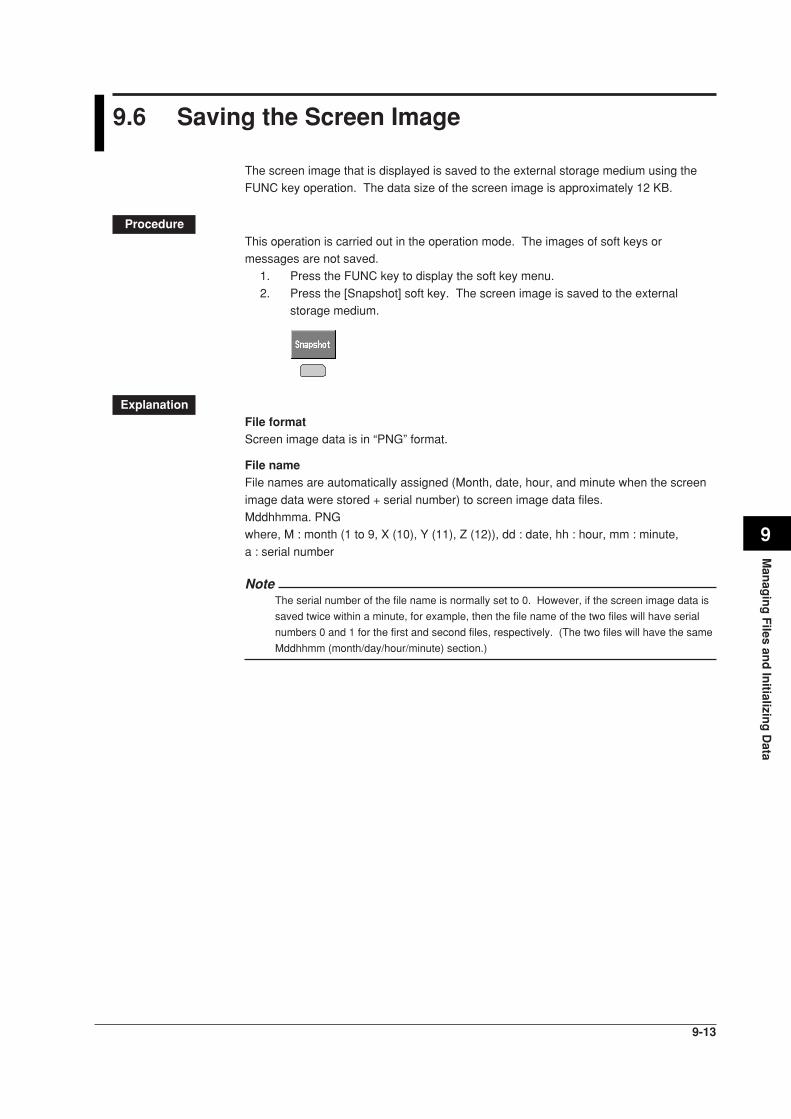
9-13
Man
agin
g F
iles and
Initializin
g D
ata
9
9.6 Saving the Screen Image
The screen image that is displayed is saved to the external storage medium using theFUNC key operation. The data size of the screen image is approximately 12 KB.
ProcedureThis operation is carried out in the operation mode. The images of soft keys ormessages are not saved.
1. Press the FUNC key to display the soft key menu.
2. Press the [Snapshot] soft key. The screen image is saved to the externalstorage medium.
ExplanationFile formatScreen image data is in “PNG” format.
File nameFile names are automatically assigned (Month, date, hour, and minute when the screen
image data were stored + serial number) to screen image data files.Mddhhmma. PNGwhere, M : month (1 to 9, X (10), Y (11), Z (12)), dd : date, hh : hour, mm : minute,
a : serial number
NoteThe serial number of the file name is normally set to 0. However, if the screen image data is
saved twice within a minute, for example, then the file name of the two files will have serial
numbers 0 and 1 for the first and second files, respectively. (The two files will have the same
Mddhhmm (month/day/hour/minute) section.)

9-14
9.7 Clearing Data from the Internal Memory
Clears display data, event data, manual sampled data, TLOG data (option), report data(option), and logs from the internal memory.
Procedure• These procedures are carried out in the setting mode.• Use the arrow keys to move the cursor (blue) to the appropriate position.
Press MENU .
Press the soft key Next 1/3 .
Press #7 soft key to display the [Save/Load, Clear data] menu screen.
Twice press the soft key Next 1/3 .
Press #9 [Clear data] soft key to display a confirmation window.
Selecting [Yes] and pressing the DISP/ENTER key clears the data from the internal
memory.

9-15
Man
agin
g F
iles and
Initializin
g D
ata
9
9.8 Initializing Setup Data
Initializes the setup data in the internal memory. Also Clears display data, event data,manual sampled data, TLOG data (option), report data (option), and logs from the
internal memory (this is the same function as clearing data in the setting mode explainedin section9.7). The recorder returns to the operation mode .For the initial settings of the setup data, see Appendix 1.
Procedure• These procedures are carried out in the basic setting mode.
Press MENU .
Press FUNC for 3 seconds. The menu screen for the basic setting mode appears.
Press the soft key Next 1/3 .
Press #8 soft key to display the [Save/Load, Initialize] menu screen.
Press #5 soft key to display the [Initialize] screen.
1
1. Select the type of initialization to set in the [Type] box.
To cancel the operation and return to the [Save/Load, Initialize] menu, press theESC key.Clear 1 : Clears the settings in the basic setting mode, settings in the setting
mode and the internal memory.Clear 2 : Clears the settings in the setting mode and the internal memory.Clear 3 : Clears the internal memory.
2. Pressing the DISP/ENTER key displays a confirmation window. Pressing theDISP/ENTER key initializes the settings and returns to the operation mode.
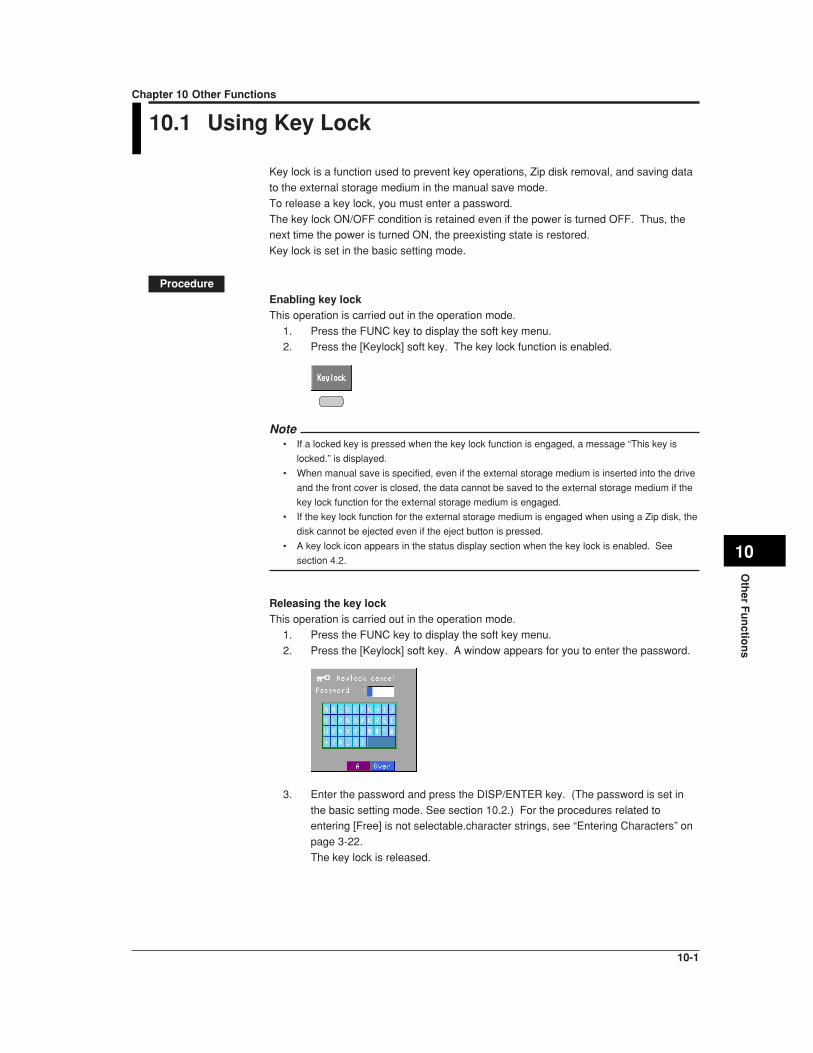
10-1
Oth
er Fu
nctio
ns
10
Chapter 10 Other Functions
10.1 Using Key Lock
Key lock is a function used to prevent key operations, Zip disk removal, and saving data
to the external storage medium in the manual save mode.
To release a key lock, you must enter a password.
The key lock ON/OFF condition is retained even if the power is turned OFF. Thus, thenext time the power is turned ON, the preexisting state is restored.
Key lock is set in the basic setting mode.
ProcedureEnabling key lockThis operation is carried out in the operation mode.
1. Press the FUNC key to display the soft key menu.2. Press the [Keylock] soft key. The key lock function is enabled.
Note• If a locked key is pressed when the key lock function is engaged, a message “This key is
locked.” is displayed.
• When manual save is specified, even if the external storage medium is inserted into the drive
and the front cover is closed, the data cannot be saved to the external storage medium if the
key lock function for the external storage medium is engaged.
• If the key lock function for the external storage medium is engaged when using a Zip disk, the
disk cannot be ejected even if the eject button is pressed.
• A key lock icon appears in the status display section when the key lock is enabled. See
section 4.2.
Releasing the key lockThis operation is carried out in the operation mode.
1. Press the FUNC key to display the soft key menu.
2. Press the [Keylock] soft key. A window appears for you to enter the password.
3. Enter the password and press the DISP/ENTER key. (The password is set in
the basic setting mode. See section 10.2.) For the procedures related toentering [Free] is not selectable.character strings, see “Entering Characters” on
page 3-22.
The key lock is released.

10-2
10.2 Setting the Key Lock Function (Basic SettingMode)
Select whether or not to enable the key lock on the individual keys and the external
storage medium. The initial setting is [Free] (disabled) on all parameters.
Procedure• These procedures are carried out in the basic setting mode.
• Use the arrow keys to move the cursor (blue) to the appropriate parameter.• The possible selections are displayed at the bottom of the screen. Select using the
soft keys.
• The parameter boxes that are changed are displayed in yellow. By confirming the
new settings, they change back to white.
Press MENU .
Press FUNC for 3 seconds. The menu screen for the basic setting mode appears.
Press the soft key Next 1/3 .
To display the setting screen press the soft key #6 .
3
12
The numbers in front of the operating procedure shown below correspond to the
numbers in the above figure.
1. Use/Not
Select [Use] or [Not]. If [Use] is selected, various parameters are displayed.
[Use] : Use key lock.
[Not] : Do not use key lock.2. Password
Set the password used to release the key lock in the operation mode.
Pressing the [Input] soft key displays a window used to enter a string. Enter the
string (up to 6 alphanumeric characters) and press the DISP/ENTER key. For
the procedures related to entering character strings, see “Entering Characters”on page 3-22.
3. For each parameter, select whether or not to enable the key lock.
[Free] : Disable
[Lock] : Enable
Confirming operationTo confirm the new settings, press the DISP/ENTER key.
To cancel the new settings, press the ESC key. A window appears for you to confirm the
cancellation. Select [Yes] using the arrow keys and press the DISP/ENTER key.
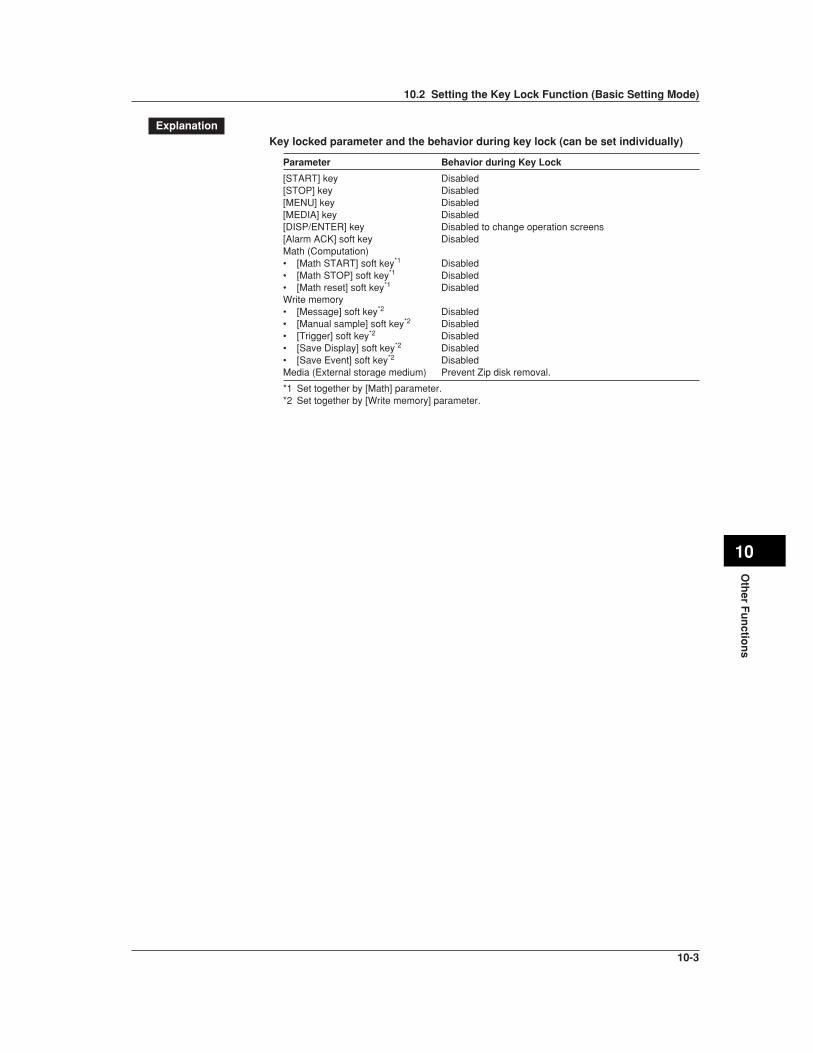
10-3
Oth
er Fu
nctio
ns
10
ExplanationKey locked parameter and the behavior during key lock (can be set individually)
Parameter Behavior during Key Lock
[START] key Disabled[STOP] key Disabled[MENU] key Disabled[MEDIA] key Disabled[DISP/ENTER] key Disabled to change operation screens[Alarm ACK] soft key DisabledMath (Computation)• [Math START] soft key*1 Disabled• [Math STOP] soft key*1 Disabled• [Math reset] soft key*1 DisabledWrite memory• [Message] soft key*2 Disabled• [Manual sample] soft key*2 Disabled• [Trigger] soft key*2 Disabled• [Save Display] soft key*2 Disabled• [Save Event] soft key*2 DisabledMedia (External storage medium) Prevent Zip disk removal.
*1 Set together by [Math] parameter.*2 Set together by [Write memory] parameter.
10.2 Setting the Key Lock Function (Basic Setting Mode)

10-4
10.3 Using the Key Login/Logout Function
This function allows only certain users to access the recorder. The users are
distinguished by their user IDs and passwords. You can select whether or not to use
User IDs. In addition, you can set whether or not to allow operations in the basic setting
mode for each user. When logged out, only the login operation can be accessed.Enabling/Disabling the key login/logout and using/not using the user ID are set in the
basic setting mode. See the next section.
When logged in, the user name is displayed in the status display section. See section
4.2.
The records of key login/logout can be viewed on the log screen. See section 10.7.
NoteWhen the power is turned OFF and turned ON again, the recorder starts in the logged out
condition.
ProcedureLogging in
1. Press the FUNC key. Soft keys and a list of user names are displayed.2. Select the user using the soft key.
3. When using the user ID, a window appears for you to enter the user ID. Enter
the user ID and press the DISP/ENTER key. For the procedures related to
entering character strings, see “Entering Characters” on page 3-22.
4. A window appears for you to enter the password. Enter the password and press
the DISP/ENTER key. For the procedures related to entering character strings,
see “Entering Characters” on page 3-22.
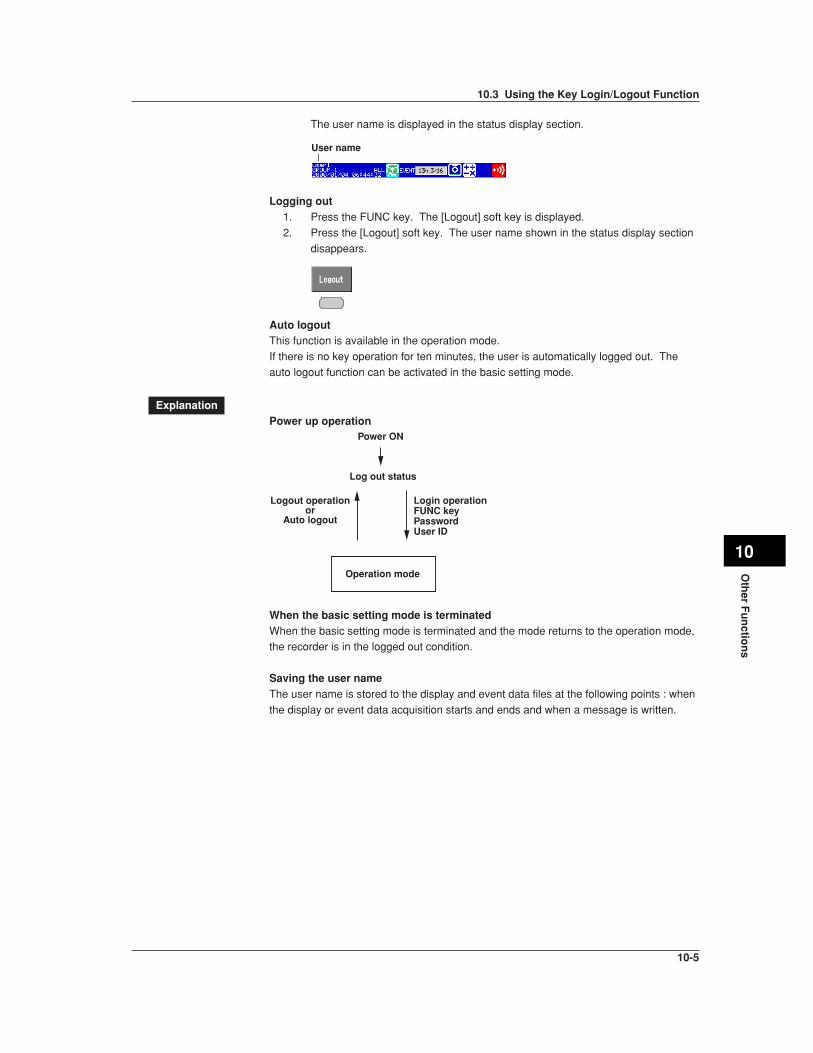
10-5
Oth
er Fu
nctio
ns
10
The user name is displayed in the status display section.
User name
Logging out1. Press the FUNC key. The [Logout] soft key is displayed.
2. Press the [Logout] soft key. The user name shown in the status display section
disappears.
Auto logoutThis function is available in the operation mode.
If there is no key operation for ten minutes, the user is automatically logged out. The
auto logout function can be activated in the basic setting mode.
ExplanationPower up operation
Power ON
Log out status
Logout operationor
Auto logout
Login operationFUNC keyPasswordUser ID
Operation mode
When the basic setting mode is terminatedWhen the basic setting mode is terminated and the mode returns to the operation mode,the recorder is in the logged out condition.
Saving the user nameThe user name is stored to the display and event data files at the following points : when
the display or event data acquisition starts and ends and when a message is written.
10.3 Using the Key Login/Logout Function

10-6
10.4 Setting the Key Login/Logout Functions (BasicSetting Mode)
Procedure• These procedures are carried out in the basic setting mode.• Use the arrow keys to move the cursor (blue) to the appropriate parameter.• The possible selections are displayed at the bottom of the screen. Select using the
soft keys.• The parameter boxes that are changed are displayed in yellow. By confirming the
new settings, they change back to white.
Press MENU .
Press FUNC for 3 seconds. The menu screen for the basic setting mode appears.
Press the soft key Next 1/3 .
To display the setting screen press the soft key #7 .
3
12
456789
The numbers in front of the operating procedure shown below correspond to thenumbers in the above figure.
1. Use/NotSelect [Use] or [Not]. If [Use] is selected, items 2, 3, 4, 5, 6, 8, and 9 aredisplayed.[Use] : Use key login.[Not] : Do not use key login.
2. Auto logoutSelect [On] or [Off].[On] : Use the auto logout.[Off] : Do not use the auto logout.
3. User ID Use/Not[Use] : Use the user ID.[Not] : Do not use the user ID.If [Use] is selected, item 7 (User ID) appears.
NoteFor models with the batch function, The key login function of all users (1 to 7, item 4) turns[Off](item 5), when [User ID] is changed to [Use] from [Not].
4. NumberThis is the user registration number (1 to 7). Select the user number to be set.
5. On/OffSet whether or not to enable the key login function for the selected user. Even ifthe user name and other parameters below are specified, the login functioncannot be used if it is turned Off here.[On] : Enable the key login function for the selected user.[Off] : Disable the key login function for the selected user.

10-7
Oth
er Fu
nctio
ns
10
6. User name
Enter the user name (up to 16 alphanumeric characters).Pressing the [Input] soft key displays a window used to enter a string. Enter the
string and press the DISP/ENTER key. For the procedures related to entering
character strings, see “Entering Characters” on page 3-22.
Note• For models with the batch function (/BT1 option), duplicate user names cannot be registered.
See "Confirming operation" below.
• “quit” cannot be used as the user name.
• All spaces are also not allowed for the user name.
7. User IDEnter the user ID (up to 4 alphanumeric characters).
Pressing the [Input] soft key displays a window used to enter a string. Enter the
string and press the DISP/ENTER key. For the procedures related to entering
character strings, see “Entering Characters” on page 3-22.
8. PasswordEnter the password (up to 6 alphanumeric characters).
Pressing the [Input] soft key displays a window used to enter a string. Enter the
string and press the DISP/ENTER key. For the procedures related to entering
character strings, see “Entering Characters” on page 3-22.
NoteFor models with the batch function (/BT1 option), the combinations of user IDs and
passwords that are identical to those that have been registered by any user in the past cannot
be specified. See “Confirming operation” below.
9. Enter setup
Select whether or not to allow the login user to enter the basic setting mode.
[Enable] : The user can enter the basic setting mode.
[Disable] : The user can not enter the basic setting mode.
NoteThe [Enter Setup] of all users cannot be set to [Disabled]. If specified, the user with the
lowest registration number with the fifth parameter turned [On] is automatically set to
[Enabled] (The setting is changed when the setup data is stored and the basic setting mode is
terminated.).
Confirming operationTo confirm the new settings, press the DISP/ENTER key.
• For models without the batch function (/BT1 option)
• If the user name already exists, a confirmation message “This username is alreadyregistered,” is displayed. At this point the user name is confirmed (confirmed but
not yet registered). If necessary, change the user name to be registered. Press the
DISP/ENTER key to register the user name.
• For models with the batch function (/BT1 option),
• If the user name already exists, an error message “This username is alreadyregistered,” is displayed. The user name entry box stays yellow, and the user
name is not registered. Change the user name to be registered.
• If the combination of the user ID and password already exists, an error message
“Duplicate used combination of user ID and password,” is displayed. Change the
combination of the user ID and password to be registered.To cancel the new settings, press the ESC key. A window appears for you to confirm the
cancellation. Select [Yes] using the arrow keys and press the DISP/ENTER key.
10.4 Setting the Key Login/Logout Functions (Basic Setting Mode)
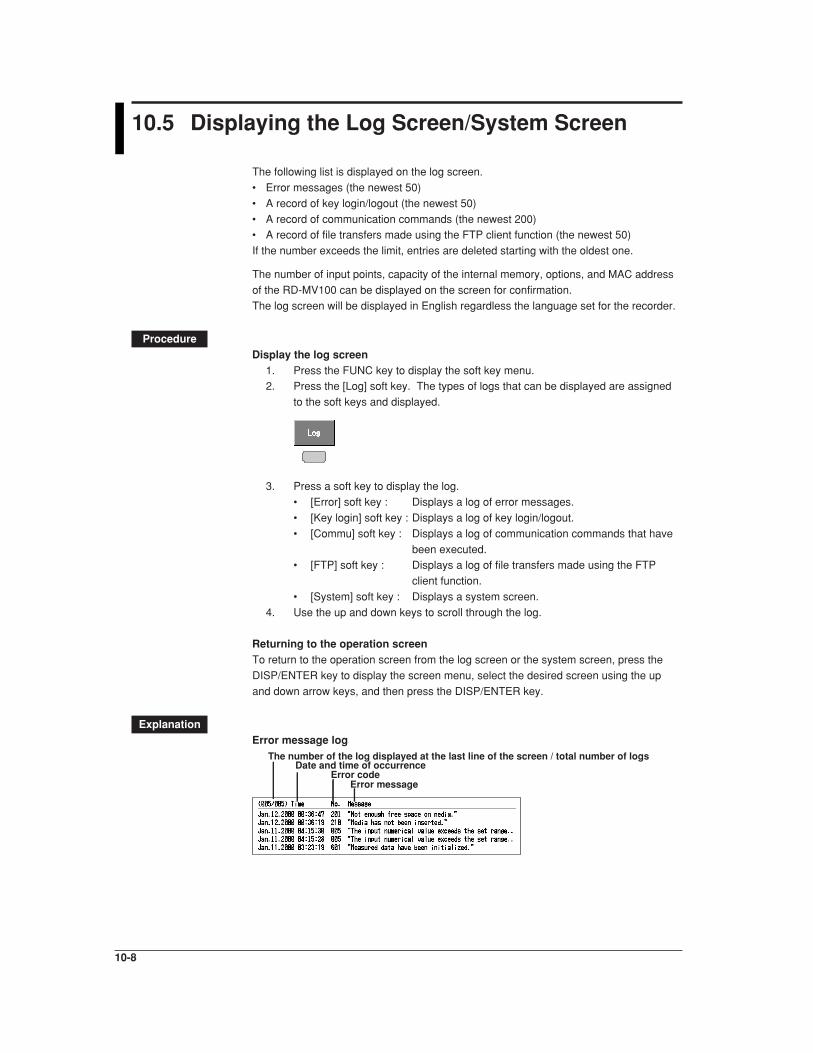
10-8
10.5 Displaying the Log Screen/System Screen
The following list is displayed on the log screen.
• Error messages (the newest 50)
• A record of key login/logout (the newest 50)
• A record of communication commands (the newest 200)• A record of file transfers made using the FTP client function (the newest 50)
If the number exceeds the limit, entries are deleted starting with the oldest one.
The number of input points, capacity of the internal memory, options, and MAC address
of the RD-MV100 can be displayed on the screen for confirmation.
The log screen will be displayed in English regardless the language set for the recorder.
ProcedureDisplay the log screen
1. Press the FUNC key to display the soft key menu.2. Press the [Log] soft key. The types of logs that can be displayed are assigned
to the soft keys and displayed.
3. Press a soft key to display the log.
• [Error] soft key : Displays a log of error messages.
• [Key login] soft key : Displays a log of key login/logout.
• [Commu] soft key : Displays a log of communication commands that have
been executed.• [FTP] soft key : Displays a log of file transfers made using the FTP
client function.
• [System] soft key : Displays a system screen.
4. Use the up and down keys to scroll through the log.
Returning to the operation screenTo return to the operation screen from the log screen or the system screen, press the
DISP/ENTER key to display the screen menu, select the desired screen using the up
and down arrow keys, and then press the DISP/ENTER key.
ExplanationError message log
Error messageError code
Date and time of occurrenceThe number of the log displayed at the last line of the screen / total number of logs

10-9
Oth
er Fu
nctio
ns
10
Key login/logout log
User nameUser No.
Login/logoutDate/time
Communication command logFor detail, see “RD-MV100 Communication Interface User’s Manual.”
Date and time when the access occurred
Name of the user that accessed this instrument
I/O symbol(> : input, < : output)
Message
A number used to identify the user that is connected
FTP logFor detail, see “RD-MV100 Communication Interface User’s Manual.”
Date and time when the file transfer was madeError code
FTP server (P : primary, S : secondary)
File name
System screenSee section 1.8.
10.5 Displaying the Log Screen/System Screen

10-10
10.6 Setting the Memory End Relay Output Time(Option, /F1, Basic Setting Mode)
This function activates the relay output when the remaining space (time) in the internal
memory or storage medium becomes small.
• Set the minimum storage time of the internal memory at which the relay should beactivated. (The initial setting is 1 hour.)
• This function is valid when the FAIL/Memory End output relay (/F1) option is installed.
Procedure• These procedures are carried out in the basic setting mode.
• Use the arrow keys to move the cursor (blue) to the appropriate parameter.
• The possible selections are displayed at the bottom of the screen. Select using the
soft keys.• The parameter boxes that are changed are displayed in yellow. By confirming the
new settings, they change back to white.
Press MENU .
Press FUNC for 3 seconds. The menu screen for the basic setting mode appears.
Press the soft key Next 1/3 .
To display the setting screen press the soft key #5 .
1
The numbers in front of the operating procedure shown below correspond to the
numbers in the above figure.
1. Memory alarm
This is the minimum storage time of the internal memory at which the relay
should be activated.
Select a value from 1 h, 2 h, 5 h, 10 h, 20 h, 50 h, and 100 h.
Confirming operationTo confirm the new settings, press the DISP/ENTER key.
To cancel the new settings, press the ESC key. A window appears for you to confirm the
cancellation. Select [Yes] using the arrow keys and press the DISP/ENTER key.

10-11
Oth
er Fu
nctio
ns
10
10.7 Setting the Remote Control Functions (Option,/R1, Basic Setting Mode)
Various actions can be assigned to the eight remote control terminals. The assigned
action can then be executed by applying a remote input signal to the corresponding
terminal.
Procedure• These procedures are carried out in the basic setting mode.
• Use the arrow keys to move the cursor (blue) to the appropriate parameter.• The possible selections are displayed at the bottom of the screen. Select using the
soft keys.
• The parameter boxes that are changed are displayed in yellow. By confirming the
new settings, they change back to white.
Press MENU .
Press FUNC for 3 seconds. The menu screen for the basic setting mode appears.
Twice press the soft key Next 1/3 .
Press the soft key #9 .
To display the setting screen press the soft key #1 .
1
The numbers in front of the operating procedure shown below correspond to the
numbers in the above figure.
1. Action
Assign actions to Remote numbers 1 to 8. For the functions that can beassigned, see the explanation.
Confirming operationTo confirm the new settings, press the DISP/ENTER key.
To cancel the new settings, press the ESC key. A window appears for you to confirm the
cancellation. Select [Yes] using the arrow keys and press the DISP/ENTER key.
ExplanationActions that can be assigned• None
No action is assigned.
10-12
• Start/Stop• Remote input : Rising/start, falling/stop• Start
Starts/stops the acquisition of the display data and the event data, the computation
(option) , and the report (option).
• Stop
Stops the acquisition of the display data and the event data, and the report(option).
• If the RD-MV100 is started, applying a rising signal produces no effect. If the RD-
MV100 is stopped, applying a falling signal produces no effect.
• Trigger• Remote input : Trigger, 250 ms or more
• This becomes the external trigger that starts the acquisition of the event data to the
internal memory. This is valid only when acquiring the event data to the internal
memory using the trigger or rotate mode, the acquisition start trigger is set to
external trigger, and the RD-MV100 is in the trigger wait state (see section 8.2).For all other cases, applying the remote signal produces no effect.
• Alarm ACK• Remote input : Trigger, 250 ms or more
• Releases the alarm indication and relay output (option). This is the same function
as when the [Alarm ACK] soft key is pressed.
• Time adj• Remote input : Trigger, 250 ms or more
• Adjusts the internal clock of the RD-MV100 to the nearest hour depending on the
time when the remote signal is applied.
Time of Signal Input New Time
00 min. 00 s to 01 min. 59 s Adjusts the internal clock down to the nearest hour.Example : 10 hr. 01 min. 50 s becomes 10 hr. 00 min. 00 s.
02 min. 00 s to 57 min. 59 s Time is unchanged.
58 min. 00 s to 59 min. 59 s Adjusts the internal clock down to the nearest hour.Example : 10 hr. 59 min. 50 s becomes 11 hr. 00 min. 00 s.
• Math (option)• Remote input : Rising/start, falling/stop
• Starts/stops the computation. This is valid only on models with the computation
function (/M1 option).
• If the computation is started, applying a rising signal produces no effect. If the
computation is stopped, applying a falling signal produces no effect.
• Math rst (option)• Remote input : Trigger, 250 ms or more
• Resets the data on all computation channels. This is valid only on models with the
computation function (/M1 option) and while the computation is stopped. For allother cases, applying the remote signal produces no effect.
• M. sample• Remote input : Trigger, 250 ms or more
• The instantaneous values of all measurement and computation channels(excluding the measurement channels that are set to [Skip] and the computation
channels that are turned Off) can be stored to the internal memory.
10.7 Setting the Remote Control Functions (Option, /R1, Basic Setting Mode)

10-13
Oth
er Fu
nctio
ns
10
• Pnl 1 to Pnl 3 load• Remote input : Trigger, 250 ms or more• The setup data of the file “LOAD 1.PNL,” “LOAD 2.PNL,” or “LOAD 3.PNL” that is
saved in the external storage medium are loaded for use. The file, “LOAD 1.PNL,”
“LOAD 2.PNL,” or “LOAD 3.PNL” must be created and saved to the external
storage medium beforehand.
• Message 1 to message 8• Remote input : Trigger, 250 ms or more
• Displays a message at the position corresponding to the time when the signal was
applied on the trend display. The displayed message is also written to the internal
memory. When the data acquisition to the internal memory is stopped, messagescannot be displayed or written. Applying a remote signal produces no effect.
Remote input signalThe above operations are carried out on the rising or falling edge of the remote signal
(edge) or the ON signal lasting at least 250 ms (trigger).
Rising/Falling Trigger
Rising Falling
250 ms or more
For contact inputs, the remote signal rises when the contact switches from open to
closed and falls when the contact switches from closed to open. For open collectorsignals, the remote signal rises when the collector signal (voltage level of the remote
terminal) goes from high to low and falls when the collector signal goes low to high.
10.7 Setting the Remote Control Functions (Option, /R1, Basic Setting Mode)
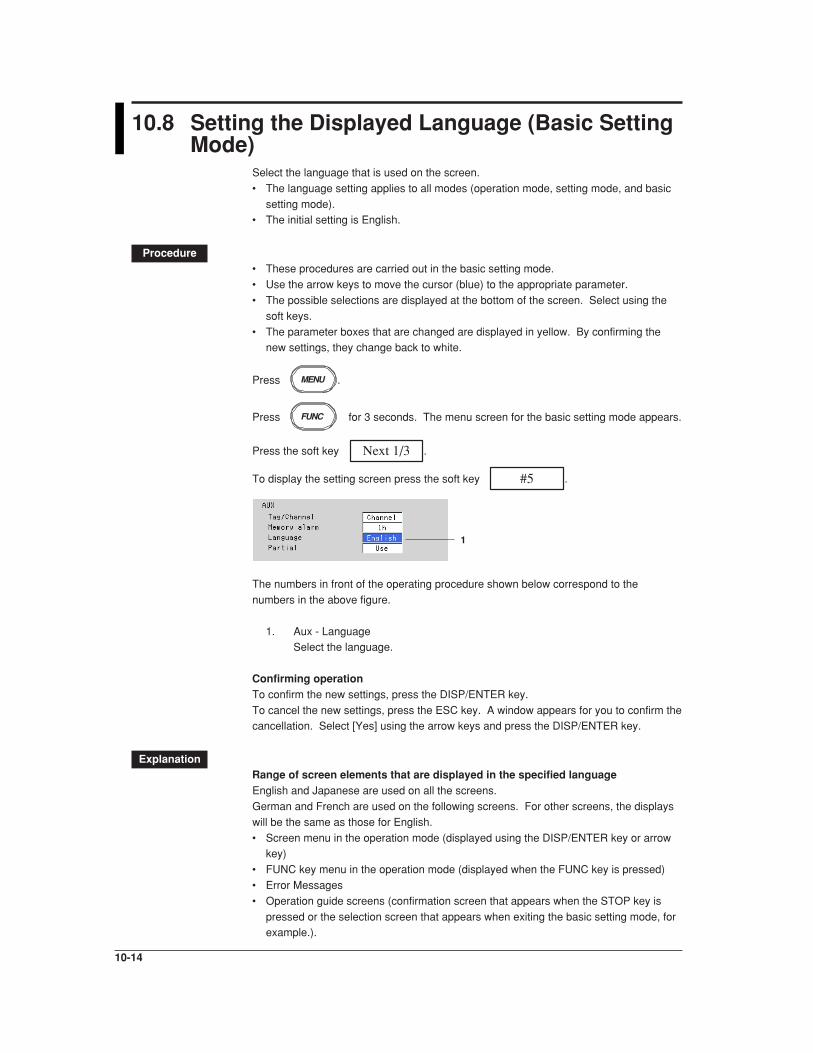
10-14
10.8 Setting the Displayed Language (Basic SettingMode)
Select the language that is used on the screen.
• The language setting applies to all modes (operation mode, setting mode, and basic
setting mode).• The initial setting is English.
Procedure• These procedures are carried out in the basic setting mode.
• Use the arrow keys to move the cursor (blue) to the appropriate parameter.
• The possible selections are displayed at the bottom of the screen. Select using the
soft keys.
• The parameter boxes that are changed are displayed in yellow. By confirming thenew settings, they change back to white.
Press MENU .
Press FUNC for 3 seconds. The menu screen for the basic setting mode appears.
Press the soft key Next 1/3 .
To display the setting screen press the soft key #5 .
1
The numbers in front of the operating procedure shown below correspond to the
numbers in the above figure.
1. Aux - LanguageSelect the language.
Confirming operationTo confirm the new settings, press the DISP/ENTER key.
To cancel the new settings, press the ESC key. A window appears for you to confirm thecancellation. Select [Yes] using the arrow keys and press the DISP/ENTER key.
ExplanationRange of screen elements that are displayed in the specified languageEnglish and Japanese are used on all the screens.
German and French are used on the following screens. For other screens, the displays
will be the same as those for English.
• Screen menu in the operation mode (displayed using the DISP/ENTER key or arrowkey)
• FUNC key menu in the operation mode (displayed when the FUNC key is pressed)
• Error Messages
• Operation guide screens (confirmation screen that appears when the STOP key is
pressed or the selection screen that appears when exiting the basic setting mode, forexample.).

10-15
Oth
er Fu
nctio
ns
10
This page intentionally left blank

10-16
This page intentionally left blank

10-17
Oth
er Fu
nctio
ns
10
This page intentionally left blank

10-18
This page intentionally left blank

10-19
Oth
er Fu
nctio
ns
10
This page intentionally left blank
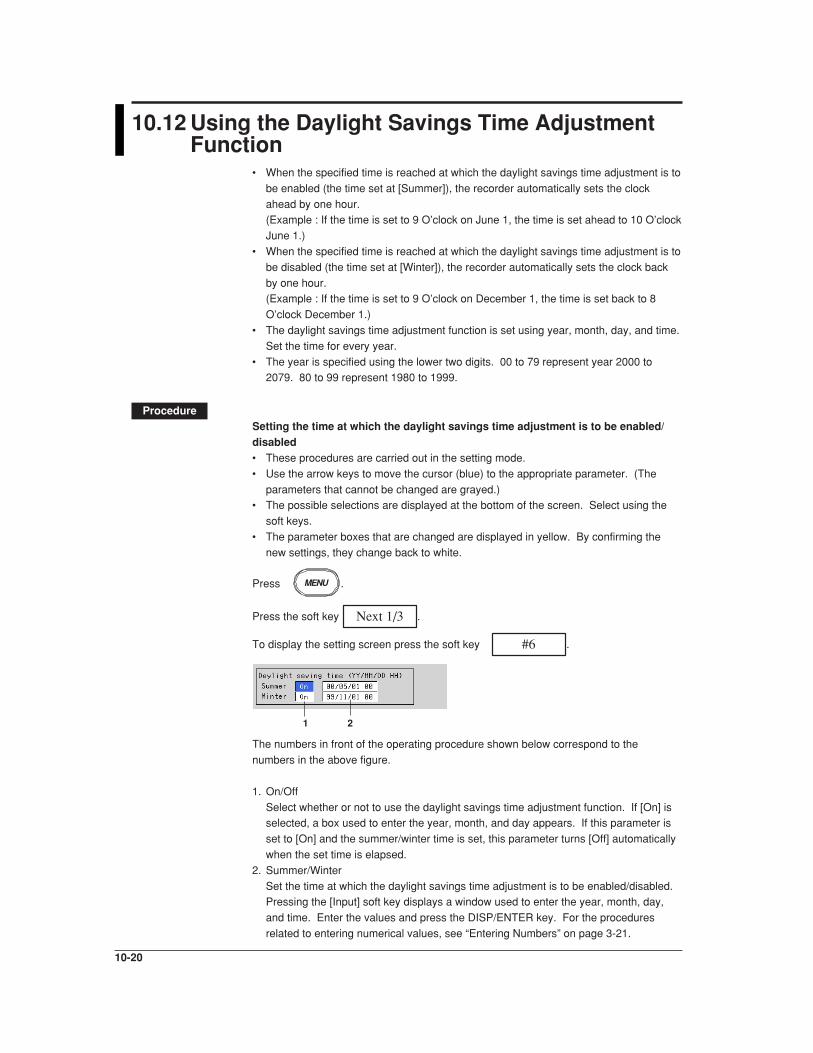
10-20
10.12 Using the Daylight Savings Time AdjustmentFunction
• When the specified time is reached at which the daylight savings time adjustment is to
be enabled (the time set at [Summer]), the recorder automatically sets the clock
ahead by one hour.(Example : If the time is set to 9 O’clock on June 1, the time is set ahead to 10 O’clock
June 1.)
• When the specified time is reached at which the daylight savings time adjustment is to
be disabled (the time set at [Winter]), the recorder automatically sets the clock back
by one hour.(Example : If the time is set to 9 O’clock on December 1, the time is set back to 8
O’clock December 1.)
• The daylight savings time adjustment function is set using year, month, day, and time.
Set the time for every year.
• The year is specified using the lower two digits. 00 to 79 represent year 2000 to2079. 80 to 99 represent 1980 to 1999.
ProcedureSetting the time at which the daylight savings time adjustment is to be enabled/disabled• These procedures are carried out in the setting mode.
• Use the arrow keys to move the cursor (blue) to the appropriate parameter. (The
parameters that cannot be changed are grayed.)• The possible selections are displayed at the bottom of the screen. Select using the
soft keys.
• The parameter boxes that are changed are displayed in yellow. By confirming the
new settings, they change back to white.
Press MENU .
Press the soft key Next 1/3 .
To display the setting screen press the soft key #6 .
1 2
The numbers in front of the operating procedure shown below correspond to the
numbers in the above figure.
1. On/Off
Select whether or not to use the daylight savings time adjustment function. If [On] isselected, a box used to enter the year, month, and day appears. If this parameter is
set to [On] and the summer/winter time is set, this parameter turns [Off] automatically
when the set time is elapsed.
2. Summer/Winter
Set the time at which the daylight savings time adjustment is to be enabled/disabled.Pressing the [Input] soft key displays a window used to enter the year, month, day,
and time. Enter the values and press the DISP/ENTER key. For the procedures
related to entering numerical values, see “Entering Numbers” on page 3-21.

10-21
Oth
er Fu
nctio
ns
10
Confirming operationTo confirm the new settings, press the DISP/ENTER key.To cancel the new settings, press the ESC key. A window appears for you to confirm the
cancellation. Select [Yes] using the arrow keys and press the DISP/ENTER key.
10.12 Using the Daylight Savings Time Adjustment Function
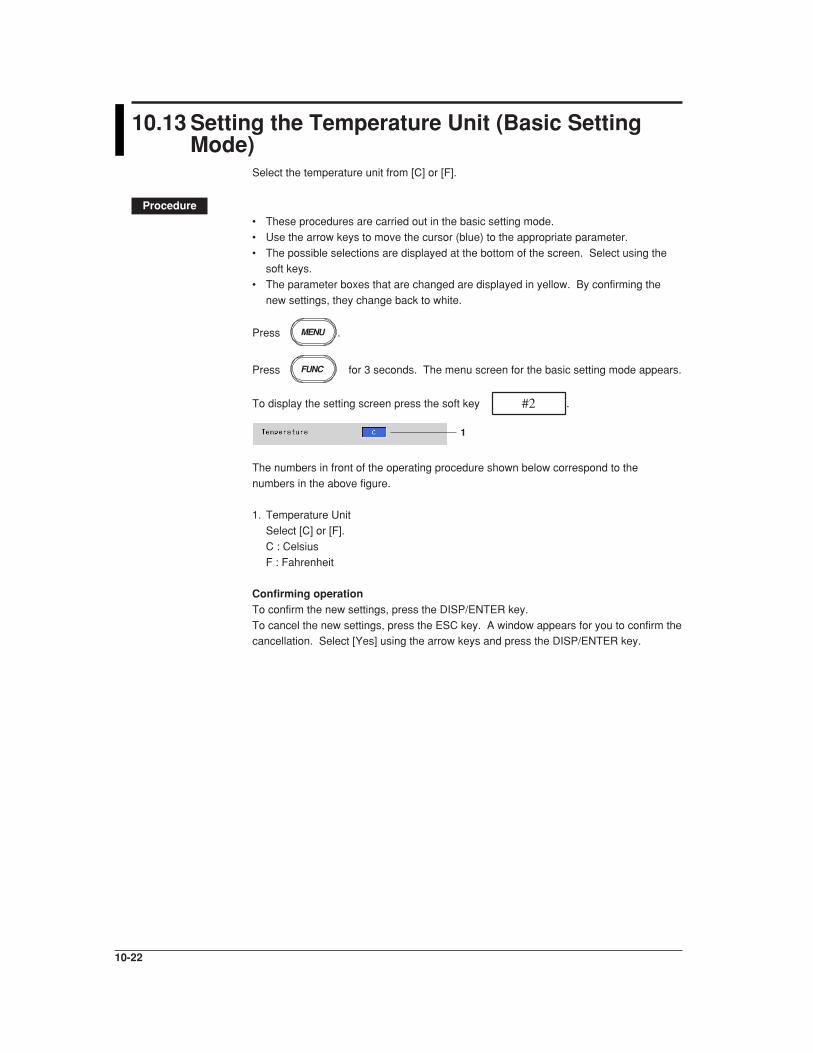
10-22
10.13 Setting the Temperature Unit (Basic SettingMode)
Select the temperature unit from [C] or [F].
Procedure• These procedures are carried out in the basic setting mode.
• Use the arrow keys to move the cursor (blue) to the appropriate parameter.
• The possible selections are displayed at the bottom of the screen. Select using thesoft keys.
• The parameter boxes that are changed are displayed in yellow. By confirming the
new settings, they change back to white.
Press MENU .
Press FUNC for 3 seconds. The menu screen for the basic setting mode appears.
To display the setting screen press the soft key #2 .
1
The numbers in front of the operating procedure shown below correspond to the
numbers in the above figure.
1. Temperature Unit
Select [C] or [F].
C : Celsius
F : Fahrenheit
Confirming operationTo confirm the new settings, press the DISP/ENTER key.
To cancel the new settings, press the ESC key. A window appears for you to confirm thecancellation. Select [Yes] using the arrow keys and press the DISP/ENTER key.
11-1
Co
mp
utatio
n/R
epo
rt Fu
nctio
n (O
ptio
n)
11
Chapter 11 Computation/Report Function (Option)
11.1 Overview of the Computation Function
Equations can be written to computation channels by using the measured data ofmeasurement channels or computed data from computation channels as variables. Theresult of the computation can be displayed or stored. Computation is performed everyscan interval. In addition, a moving average (“rolling average”) can be calculated on thecomputed result of a computation channel, and the moving average value can be usedas the computed data for that channel.For report functions, see sections 11.11 to 11.13.
Computation FunctionComputation channels
Model Channels
RD-MV102 Channel 31 to 34 (4 channels)RD-MV104 Channel 31 to 34 (4 channels)RD-MV106 Channel 31 to 42 (12 channels)RD-MV112 Channel 31 to 42 (12 channels)
Types of ComputationsThe following computations can be performed:In the table below, y represents the computed result. X and n generally represent themeasured data of a measurement channel and a constant. For details, see “Data thatcan be used in equations.”
Type Description
Four arithmetical operations Addition (+), subtraction (–), multiplication (×), and division(/)
Determines the power. y = Xn
SQR Determines the square root.
ABS Determines the absolute value.
LOG Determines the common logarithm. y = log10x
EXP Determines the exponent. y = ex
Relational computation Determines <, ≤, >, ≥, =, ≠ and outputs “0” or “1”.
Logical computation Determines the AND (logical product), OR (logical sum),XOR (exclusive logical sum) of two channels, NOT(negation) of an arbitrary channel and outputs “0” or “1”.
Statistical computation (TLOG) Determines the sum, maximum, minimum, average, andmaximum – minimum (P–P) values at specified timeintervals over the time interval. There are three timers usedto set the time interval. For detail, see section 11.7.
Data that can be Used in EquationsThe following types of data are used to perform computations. For TLOG computation,
only measured and computed data can be used. For all other computations, all types of
data can be used.
Measured dataThe data are specified using channel numbers in computing equations. If scaling is ineffect, the scaled values are used in the computation.
Computed dataThe data are specified using channel numbers in computing equations.
Constants (K01 to K12)The values assigned to K01 to K12 can be used as constants. Enter the values as K01to K12 in the equations.Range of constants (Maximum number of significant digits is 5) :–9.9999E + 29 to –1.0000E – 30, 0, 1.0000E – 30 to 9.9999E + 29

11-2
Communication input data (C01 to C12)Data that have been specified through the communication interface can be used. Enter
the data as C01 to C12 in the equations. For the procedure used to set the data, see the
“RD-MV100 Communication Interface User’s Manual” (IM RD-MV100-17E).Range of numerical values (Maximum number of significant digits is 5) :–9.9999E + 29 to –1.0000E – 30, 0, 1.0000E – 30 to 9.9999E + 29
Conditions of the remote control terminals (D01 to D08)The conditions of the remote input signal can be assigned to “1” and “0,” and used in the
equations. Enter the data as D01 to D08 (the number following the letter D is the remote
terminal number) in the equations.
The correlation between the conditions of the remote input signal and the value “1” and“0” are shown below.
Type ofthe RemoteInput Signal Status “1” or “0”
Contact close 1open 0
Open collector Voltage level is Lo at the remote terminal 1Voltage level is Hi at the remote terminal 0
Unit HandlingThe unit corresponding to the measured/computed data in the equation is not
compensated. In computations, measured and computed data are handled as values
without units. For example, if the measured data from channel 01 is 20 mV and the
measured data from channel 02 is 20 V, the computed result of 01 + 02 is 40.
Order of Precedence of the OperatorsThe order of precedence of the operators in the equation is as follows. The operators
are placed in order from the highest precedence.
Type Operator
(higher precedence)Functions ABS( ), SQR( ), LOG( ), EXP( ), TLOG.MAX( ),
TLOG.MIN(), TLOG.P-P( ), TLOG.SUM( ), TLOG.AVE( )PowerLogical negation NOTMultiplication and division , /Addition and subtraction +, –Greater than/less than .GT., .LT., .GE., .LE.Equal/not equal .EQ., .NE.Logical AND ANDLogical OR, exclusive OR OR, XOR
(lower precedence)
Displaying the Computed ResultThe computed data of computation channels can be displayed in each operation screen.
Displaying the waveform and bar graphThe data are displayed in the range defined by the upper and lower limits of the span.
For the settings related to displaying the computed result, see sections below.
Set computation channels : See section 11.4.Assign channels to groups : See section 7.6.
Display tags : See sections 7.1 and 7.2.
Set the channel display color : See section 7.8.
Use zone display : See section 7.9.
Set the number of scale divisions : See section 7.10.
11.1 Overview of the Computation Function
11-3
Co
mp
utatio
n/R
epo
rt Fu
nctio
n (O
ptio
n)
11
Set the base position of the bar graph : See section 7.10.
Specify the scale display position : See section 7.10.Use partial expansion display : See sections 7.11 and 7.12.
Numerical displayThe range of displayed values of computed data is from –9999999 to 99999999
excluding the decimal point. The decimal point position corresponds to the position of
the decimal point of the upper and lower limit span of the computation channel.However, special displays are used for cases given in the table below.
Data Condition Computation Display
The computed result exceeds 99999999. plus over +
The computed result is below –9999999. minus over –
The value exceeds 3.4E + 38, or is below overflow + or ––3.4E + 38 in the middle of computation.
An error is detected. error +When the following computation is specified,a computation error occurs.• X/0• SQR (–X)• LOG (–X)• When a skipped channel No. is entered in the equation.
The number of stacks (see section 11.2) stack over + in the equation exceeds 17.
Rolling AverageThe moving average of the computed result of the equation specified for the computation
channel is determined, and the result is displayed as computed data for that channel.
The sampling interval and the number of samples can be specified for each channel.
The maximum sampling interval is 1 hour; the maximum number of samples is 64. Theinitial setting is [OFF] (do not perform moving average). For the setting procedure, see
section 11.10.
AlarmYou can set up to 4 alarms on each computation channel. The alarm types are upperlimit alarm (H), lower limit alarm (L), delay upper limit alarm (T), and delay lower limit
alarm (t). The hysteresis is fixed to 0. For the procedures to set the alarms, see section
11.5. For the alarm indication, see section 4.2 and 6.1.
Acquiring the Computed DataDisplay data and event dataThe computed data from the computation channels can be acquired as the display data
and event data in the same manner as for the measurement channels. See chapter 8.
Manual sampled dataThe instantaneous values of all computation channels (excluding the computationchannels that are turned Off) can be stored to the internal memory with the manual
sampling operation. For the operating procedure, see sections 8.12.
TLOG dataThe TLOG computation data are acquired every interval. For the setting procedure, see
sections 11.8 and 11.9.
Setting Computation ChannelsThe computation channel specifications are set in the setting mode. For detail, seesections 11.4 through 11.6.
The timer used in the TLOG computation is set in the basic setting mode. For detail, see
section 11.9.
11.1 Overview of the Computation Function

11-4
11.2 Explanation of Computing Equations
This section describes the meaning of the computation equation and how to write them.
Four Arithmetical ComputationsThe types of data that can be used in equations are measurement channels,computation channels, constants (K01 to K12), communication interface data (C01 to
C12), and the remote control terminal conditions (D01 to D08).
EXAMPLE :Addition (+) : 01+02
Computes the value of channel 1 plus the value of channel 2Subtraction (–) : 01-02
Computes the value of channel 1 minus the value of channel 2
Multiplication ( ) : 01 K03
Computes the value of channel 1 multiplied by constant number 3
Division (/) : 01/K02Computes the value of channel 1 divided by constant number 2
NoteWhen you set an expression as e.g. 31 = 31 + 01, the summation of channel number 1 will be
displayed in channel 31.
Power, SQR, ABS, LOG, EXP ComputationsThe types of data that can be used in equations are measurement channels,
computation channels, constants (K01 to K12), communication interface data (C01 to
C12), and the remote control terminal conditions (D01 to D08). You can nest a
computing element inside the parentheses of another computing element.
EXAMPLE :Power ( ) : 01 02
Raises measured value of channel 1 to the power of measured value of channel 2
Square root (SQR) : SQR (01)
Returns the square root of the measured value of channel 1
Absolute value (ABS) : ABS (01)Returns the absolute value of the measured value of channel 1
Logarithm (LOG) : LOG (01)
Returns the common logarithm of the measured value of channel 1
Exponent (EXP) : EXP (01)
Raises e to the power of the measured value of channel 1
NoteThe natural logarithm is not directly provided, but can be obtained by using the following :
logbx = logax/logab or lnx = logx/loge
Therefore, to calculate the natural logarithm of the value of channel 01, set K01 = 1.
Then the expression will become : LOG (01)/LOG (EXP(K01))

11-5
Co
mp
utatio
n/R
epo
rt Fu
nctio
n (O
ptio
n)
11
Relational ComputationThe types of data that can be used in equations are measurement channels,computation channels, constants (K01 to K12), communication interface data (C01 to
C12), and the remote control terminal conditions (D01 to D08). You can specify a
computing equation that performs relational computation on a computing element
(Example : 01.LT.ABS(02)).
EXAMPLE :02.LT.03The computed result will be “1” if the measured value in channel 2 is less than the
measured value in channel 3, otherwise the value will be “0”.
02.GT.03The computed result will be “1” if the measured value in channel 2 is greater than the
measured value in channel 3, otherwise the value will be “0”.
02.EQ.03The computed result will be “1” if the measured value in channel 2 is equal to themeasured value in channel 3, otherwise the value will be “0”.
02.NE.03The computed result will be “1” if the measured value in channel 2 is not equal to the
measured value in channel 3, otherwise the value will be “0”.
02.GE.03The computed result will be “1” if the measured value in channel 2 is greater than or
equal to the measured value in channel 3, otherwise the value will be “0”.
02.LE.03The computed result will be “1” if the measured value in channel 2 is less than or equal
to the measured value in channel 3, otherwise the value will be “0”.
Logical ComputationThe computation is performed using e1 and e2 which are identified as either “zero” or
“non zero”. The types of data that can be used in equations are measurement channels,
computation channels, constants (K01 to K12), communication interface data (C01 to
C12), and the remote control terminal conditions (D01 to D08). You can specify a
computing equation that performs relational computation on a computing element.
AND Logical productSyntax : e1ANDe2Condition : If both e1 and e2 are “non 0”, the operation results in “1”, otherwise in
“0”.
Status : e1 = 0, e2 = 0
e1ANDe2 = 0
e1 ≠ 0, e2 = 0
e1ANDe2 = 0
e1 = 0, e2 ≠ 0
e1ANDe2 = 0
e1 ≠ 0, e2 ≠ 0
e1ANDe2 = 1
11.2 Explanation of Computing Equations

11-6
OR Logical sumSyntax : e1ORe2Condition : If both e1 and e2 are “0”, the operation results in “0”, otherwise in “1”.
Status : e1 = 0, e2 = 0
e1ORe2 = 0
e1 ≠ 0, e2 = 0e1ORe2 = 1
e1 = 0, e2 ≠ 0
e1ORe2 = 1
e1 ≠ 0, e2 ≠ 0
e1ORe2 = 1
XOR Mutually exclusive logical sumSyntax : e1XORe2Condition : If e1 and e2 have different values, the operation results in “1”, otherwise
in “0”.
Status : e1 = 0, e2 = 0
e1XORe2 = 0
e1 ≠ 0, e2 = 0
e1XORe2 = 1
e1 = 0, e2 ≠ 0
e1XORe2 = 1
e1 ≠ 0, e2 ≠ 0
e1XORe2 = 0
NOT Logical negationSyntax : NOTe1
Condition : Reverses the value of data e1
Status : e1 = 0 NOTe1 = 1
e1 ≠ 0 NOTe1 = 0
EXAMPLE :01-02OR03.GT.04Determines the OR of the computed results of “01-02” and “03.GT.04.”
11.2 Explanation of Computing Equations
11-7
Co
mp
utatio
n/R
epo
rt Fu
nctio
n (O
ptio
n)
11
TLOG Computation (MAX, MIN, AVE, SUM, MAX–MIN)Only measurement channels and computation channels can be used in the TLOGcomputation. In the explanation below, e1 is used to represent a measurement or
computation channel. You cannot specify an equation that contains a computing
element inside e1. In addition, only one TLOG computation can be specified in a single
computing equation.
TLOG.MAX ( )Syntax : TLOG.MAX (e1)
Result : Computes the maximum value of channel e1
TLOG.MIN ( )Syntax : TLOG.MIN (e1)
Result : Computes the minimum value of channel e1
TLOG.AVE ( )Syntax : TLOG.AVE (e1)Result : Computes the average value of channel e1
TLOG.SUM ( )Syntax : TLOG.SUM (e1)
Result : Computes the summation of channel e1
TLOG.P-P ( )Syntax : TLOG.SUM (e1)
Result : Computes the maximum value–minimum value of channel e1
Rules for Writing an Equation (Common Items)Follow the rules below in writing the computing equations.
• Use up to 40 characters to write equations.• The precedence of computing terms can be specified using parentheses.
• Specify the channels in the equation using channel numbers. (Example: Channel 1 is
“01” or “1”)
• You can use “01” or “1,” for example, to specify one-digit numbers for channels,
constants, communication input data, and conditions of the remote control terminals inequations.
Example : 01, 1, K01, K1, C01, C1, D01, D1
• The data value for the channel used in the equation, and for all channels greater in
number than that channel, are substituted with data from the previous scan.
• Do not use more than 16 stacks (channel, K01 to K12, C01 to C12, D01 to D08) inone equation. Otherwise, a computation error may occur. The computed result is set
to positive overflow (displayed as + ) in this case.
Example: The number of stacks in the equation 01+K01 (03+04 K02) is five.
11.2 Explanation of Computing Equations

11-8
11.3 Using the Computation Function
Operations related to the computation function are as follows :
• Start/stop computation.
This operation can be carried out with the START/STOP key or the FUNC key. The
computation can also be started or stopped via remote control or communicationcommands.
• Reset computation data.
This operation can be carried out with the FUNC key. The computation data can also
be reset via remote control or communication commands.
• Release the computation data dropout display.This operation is carried out with the FUNC key. The computation data dropout
display can also be released via communication commands.
For the remote control function, see section 10.7. For the communication function, see
MV100 Communication Interface User’s Manual.
Start/Stop ComputationProcedure
Operation using the START/STOP key• Starting the computation (also starts the data acquisition to the internal
memory)1. Press the START key to start the computation. At this point, the data acquisition
to the internal memory is also started. When the computation is started, acomputation icon is displayed in the status display section. For details related to
the status display section, see section 4.2.
• Stopping the computation (also stops the data acquisition to the internalmemory)1. Press the STOP key. A confirmation window is displayed. For models with the
batch function (/BT1 option), the batch information is also displayed.
2. Use the arrow keys to select [Mem + Math] and press DISP/ENTER to stop the
computation. At this point, the data acquisition to the internal memory is also
stopped. The computation icon in the status display section also disappears.
Operation using the FUNC key1. Press the FUNC key to display the soft key menu.
When the computation is suspended the [Math START] soft key is displayed. If
the computation is in progress the [Math STOP] soft key is displayed.
• Starting the computation2. Press the [Math START] key to start the computation. When the computation is
started, a computation icon is displayed in the status display section. For details
related to the status display section, see section 4.2.
• Stopping the computation2. Press the [Math STOP] key to stop the computation. The computation icon in
the status display section also disappears.

11-9
Co
mp
utatio
n/R
epo
rt Fu
nctio
n (O
ptio
n)
11
Resetting the ComputationThis is executable only when the computation is suspended. Data from all computationchannels are cleared.
Procedure1. Pressing the FUNC key displays the soft key menu.
The [Math RESET] soft key is displayed only when the computation is
suspended.
2. Pressing the [Math RESET] soft key clears the data from all computation
channels.
Clearing the Computation Dropout DisplayWhen a computation data dropout occurs during computation, the computation icondisplayed in the status display section turns yellow. The computation icon will return to a
white color once the computation data dropout has been acknowledged.
Computation icon
Procedure1. Pressing the FUNC key displays the soft key menu.
The [Math ACK] soft key is displayed only when a computation data dropout
occurs.
2. Pressing the [Math ACK] soft key causes the yellow computation icon in the
status display section to return to a white color.
ExplanationComputation data dropout occurs when the computation is not completed within the scaninterval. When this occurs frequently, lower the CPU load by reducing the number of
computation channels or making the scan interval longer.
11.3 Using the Computation Function
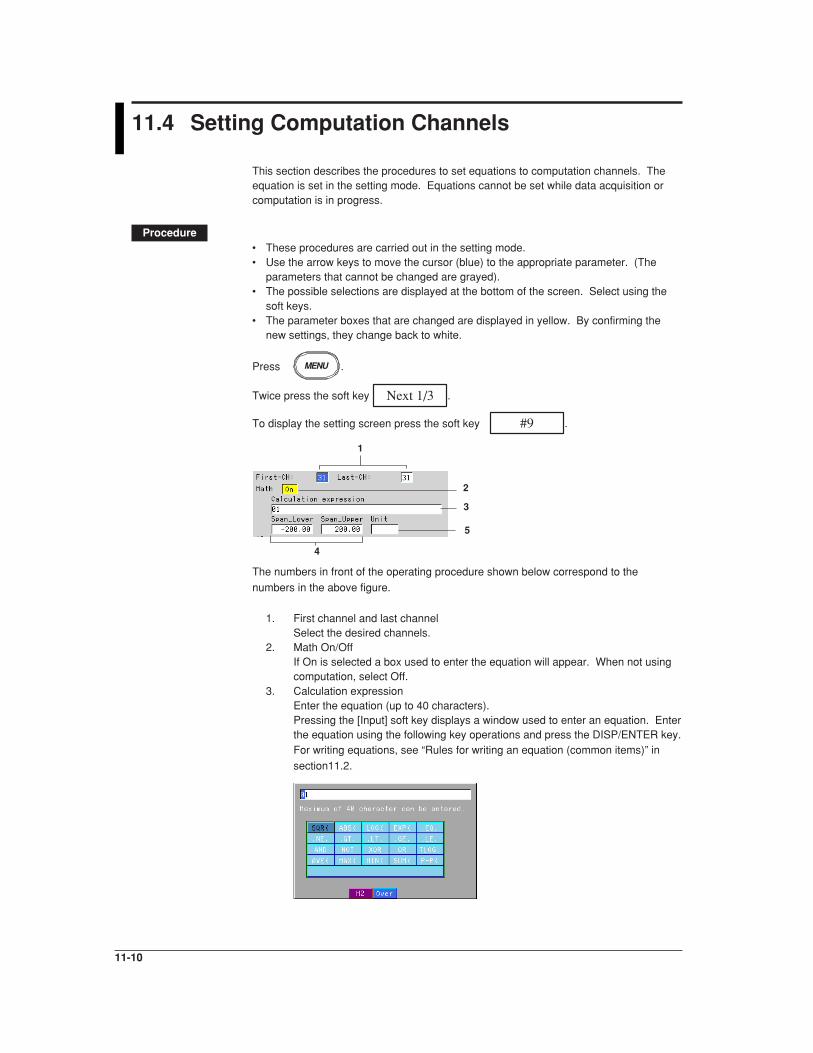
11-10
11.4 Setting Computation Channels
This section describes the procedures to set equations to computation channels. Theequation is set in the setting mode. Equations cannot be set while data acquisition orcomputation is in progress.
Procedure• These procedures are carried out in the setting mode.• Use the arrow keys to move the cursor (blue) to the appropriate parameter. (The
parameters that cannot be changed are grayed).• The possible selections are displayed at the bottom of the screen. Select using the
soft keys.• The parameter boxes that are changed are displayed in yellow. By confirming the
new settings, they change back to white.
Press MENU .
Twice press the soft key Next 1/3 .
To display the setting screen press the soft key #9 .
1
2
3
4
5
The numbers in front of the operating procedure shown below correspond to the
numbers in the above figure.
1. First channel and last channelSelect the desired channels.
2. Math On/OffIf On is selected a box used to enter the equation will appear. When not usingcomputation, select Off.
3. Calculation expressionEnter the equation (up to 40 characters).Pressing the [Input] soft key displays a window used to enter an equation. Enterthe equation using the following key operations and press the DISP/ENTER key.For writing equations, see “Rules for writing an equation (common items)” in
section11.2.
11-11
Co
mp
utatio
n/R
epo
rt Fu
nctio
n (O
ptio
n)
11
• Left and right arrow key : Select the input position.• Up and down arrow key : Select the input character.
Use the [M1/M2] soft key to switch the function of the window between number input
and computing element input. See the explanation.Each time the [M1/M2] soft key is pressed the function of the window switches
between number input and computing element input. The selected function is
displayed to the top of the soft key display section.
[M1] : Number is selected.
[M2] : Computing element is selected.• [Del] soft key : Delete the character at the cursor position.
• [Bs] soft key : Delete the character before the cursor position.
• [Ins] soft key : Switch between insert and overwrite.
Each time the [Ins] soft key is pressed insert and overwrite switches. The selected
function is displayed to the right of the soft key display section.[Over] : Overwrites the cursor position.
[Ins] : Inserts at the cursor position.
NoteWhen using TLOG computation, timers must be set in the basic setting mode and the number
of the timer and the sum unit (only for TLOG.SUM) must be set in the setting mode.
4. Upper and lower limits of span
Set the upper and lower limits of the display span.
Pressing the [Input] soft key displays a window used to enter a numerical value.Enter a value in the allowed range given below and press the DISP/ENTER key.
For the procedures related to entering numerical values, see “Entering
Numbers” on page 3-21.
Allowed range : –9999999 to 99999999
The decimal can be set in the following positions :“ . ” “ . ” “ . ” “ . ”
“ ”
NoteThe upper and lower limits of span cannot be set to the same value.
5. Unit
Set the unit
Pressing the [Input] soft key displays a window used to enter a character string.
Enter the unit (up to 6 alphanumeric characters) and press the DISP/ENTERkey. For the procedures related to entering character strings, see “Entering
Characters” on page 3-22.
Confirming operationTo confirm the new settings, press the DISP/ENTER key.To cancel the new settings, press the ESC key. A window appears for you to confirm the
cancellation. Select [Yes] using the arrow keys and press the DISP/ENTER key.
NoteWhen computation is turned On/Off or when equations and span settings are changed, the
alarm setting for that channel is turned OFF.
11.4 Setting Computation Channels
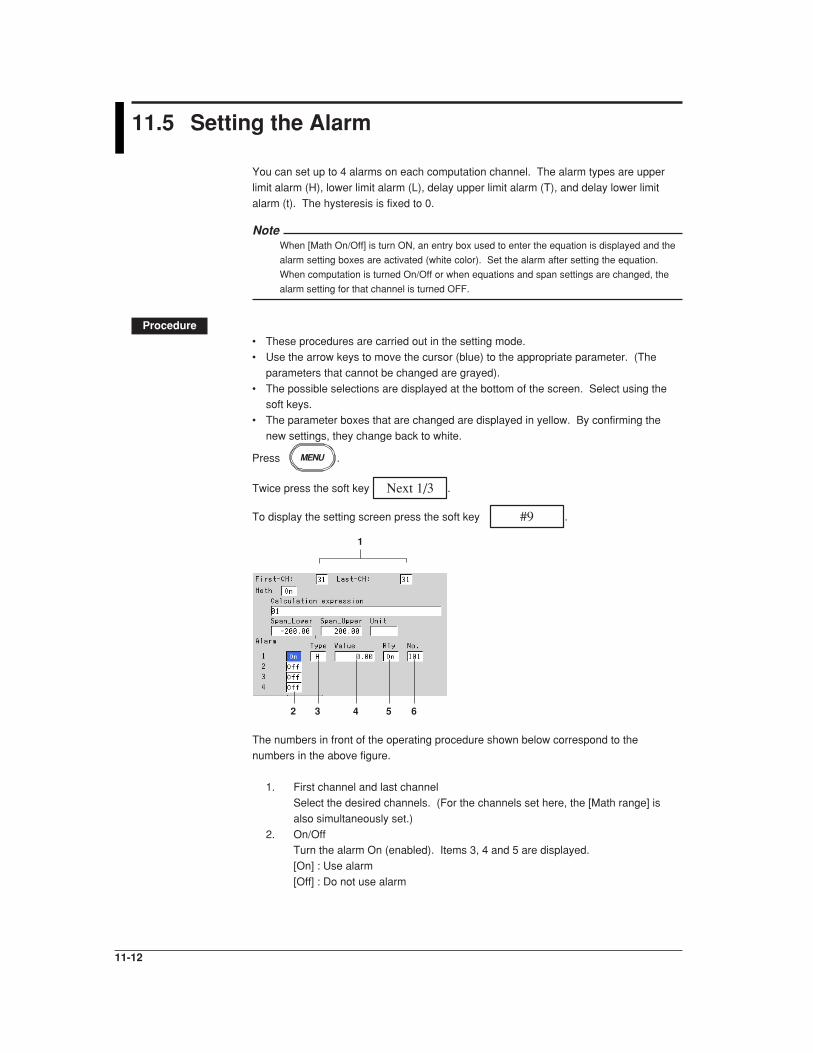
11-12
11.5 Setting the Alarm
You can set up to 4 alarms on each computation channel. The alarm types are upper
limit alarm (H), lower limit alarm (L), delay upper limit alarm (T), and delay lower limit
alarm (t). The hysteresis is fixed to 0.
NoteWhen [Math On/Off] is turn ON, an entry box used to enter the equation is displayed and the
alarm setting boxes are activated (white color). Set the alarm after setting the equation.
When computation is turned On/Off or when equations and span settings are changed, the
alarm setting for that channel is turned OFF.
Procedure• These procedures are carried out in the setting mode.
• Use the arrow keys to move the cursor (blue) to the appropriate parameter. (The
parameters that cannot be changed are grayed).
• The possible selections are displayed at the bottom of the screen. Select using thesoft keys.
• The parameter boxes that are changed are displayed in yellow. By confirming the
new settings, they change back to white.
Press MENU .
Twice press the soft key Next 1/3 .
To display the setting screen press the soft key #9 .
1
2 3 4 5 6
The numbers in front of the operating procedure shown below correspond to the
numbers in the above figure.
1. First channel and last channel
Select the desired channels. (For the channels set here, the [Math range] is
also simultaneously set.)
2. On/OffTurn the alarm On (enabled). Items 3, 4 and 5 are displayed.
[On] : Use alarm
[Off] : Do not use alarm

11-13
Co
mp
utatio
n/R
epo
rt Fu
nctio
n (O
ptio
n)
11
3. Type
Set the alarm type.H : Upper limit alarm
L : Lower limit alarm
T : Delay upper limit alarm
t : Delay lower limit alarmNote
If you select delay alarm (T or t) for the alarm type, you must set the alarm delay period. See
section 6.3.
4. Value
Set the value at which the alarm is activated.
Pressing the [Input] soft key displays a window used to enter a numerical value.
Enter a value and press the DISP/ENTER key. For the procedures related to
entering numerical values, see “Entering Numbers” on page 3-21.5.* Relay On/Off
Set whether or not to activate the relay output. If [On] is selected, output relay
[Number] is displayed.
6.* Number
Set the output relay number.For the correspondence between the output relay number and the output relay
position, see section 2.4 “Alarm Output Wiring (Option)”.
* If the alarm output relay option (/A ) is not installed, this setting is void.
Confirming operationTo confirm the new settings, press the DISP/ENTER key.
To cancel the new settings, press the ESC key. A window appears for you to confirm the
cancellation. Select [Yes] using the arrow keys and press the DISP/ENTER key.
ExplanationAlarm typeTwo types of alarms are available.
Name Symbol Description
Upper limit alarm H An alarm occurs when the measured value becomesgreater than or equal to the alarm value.
Lower limit alarm L An alarm occurs when the measured value becomessmaller than or equal to the alarm value.
Delay upper limit alarm T An alarm occurs when the measured value remainsabove or equal to the alarm value for the specified timeperiod (delay period, see section 6.3, “Setting the AlarmDelay Period.”).
Delay lower limit alarm t An alarm occurs when the measured value remainsbelow or equal to the alarm value for the specified timeperiod (delay period, see section 6.3, “Setting the AlarmDelay Period.”).
11.5 Setting the Alarm
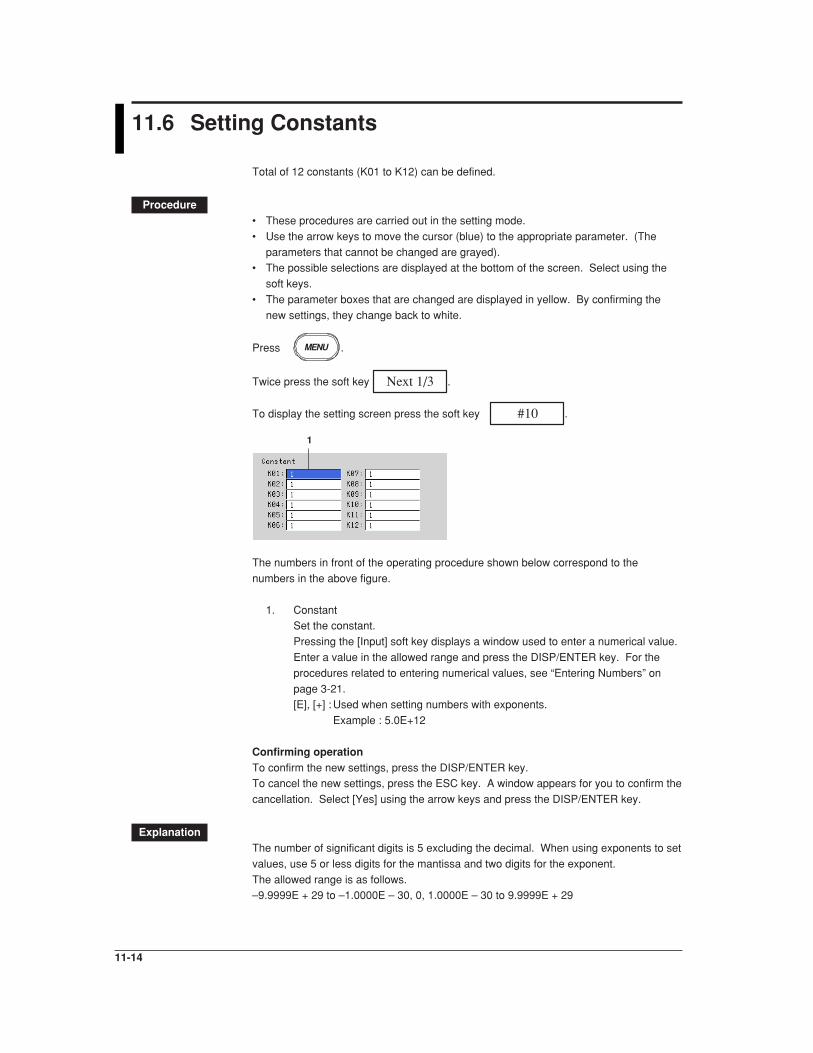
11-14
11.6 Setting Constants
Total of 12 constants (K01 to K12) can be defined.
Procedure• These procedures are carried out in the setting mode.
• Use the arrow keys to move the cursor (blue) to the appropriate parameter. (The
parameters that cannot be changed are grayed).• The possible selections are displayed at the bottom of the screen. Select using the
soft keys.
• The parameter boxes that are changed are displayed in yellow. By confirming the
new settings, they change back to white.
Press MENU .
Twice press the soft key Next 1/3 .
To display the setting screen press the soft key #10 .
1
The numbers in front of the operating procedure shown below correspond to the
numbers in the above figure.
1. ConstantSet the constant.
Pressing the [Input] soft key displays a window used to enter a numerical value.
Enter a value in the allowed range and press the DISP/ENTER key. For the
procedures related to entering numerical values, see “Entering Numbers” on
page 3-21.[E], [+] : Used when setting numbers with exponents.
Example : 5.0E+12
Confirming operationTo confirm the new settings, press the DISP/ENTER key.To cancel the new settings, press the ESC key. A window appears for you to confirm the
cancellation. Select [Yes] using the arrow keys and press the DISP/ENTER key.
ExplanationThe number of significant digits is 5 excluding the decimal. When using exponents to set
values, use 5 or less digits for the mantissa and two digits for the exponent.
The allowed range is as follows.–9.9999E + 29 to –1.0000E – 30, 0, 1.0000E – 30 to 9.9999E + 29

11-15
Co
mp
utatio
n/R
epo
rt Fu
nctio
n (O
ptio
n)
11
11.7 TLOG Computation
Determines the sum, maximum, minimum, average, and maximum – minimum (P–P)
values of the specified channel at specified time intervals. The interval is set by timers.
The example shown in the following figure indicates the case in which the average value
of channel 1 over each interval, TLOG.AVE(01), is determined.
Interval set by a timerScan interval
SamplingTime
Average value Average valueEquation: TLOG.AVG(01)
TLOG computation cannot be performed when the corresponding measurement channel
is set to [Skip] or the corresponding computation channel is turned Off.
Timer Mode and ActionTimer modeThere are two timer modes : absolute mode and relative mode.
• Absolute modeTimer expires at times determined from the reference time and the interval. Thereference time is specified by the hour (00 to 23).
Example 1 : Reference time : 14:00Interval : 12 h
The expiration time is set to 2:00 (2:00 AM) and 14:00 (2:00 PM).
Example 2 : Reference time : 00:00
Interval : 10 min
The expiration time is set to 0:00, 0:10, 0:20, ..., 23:40, and 23:50. For
example, if the computation is started at 9:30, the time expiration will
occur at 09:40, 09:50, 10:00, and so on.
• Relative modeThe timer is started when the computation is started. The timer is repeated at eachinterval. The timer is suspended while the power is lost.
Example : Interval : 00:15The timer expires every 15 minutes after the computation is started.
Setting timersTimers are set in the basic setting mode. For detail, seesection 11.9.
Setting the timer No. for TLOG computationThe number of the timer used by the channel computing the TLOG is selected from 1, 2,
and 3 in the setting mode. For the setting procedure, see section 11.8.
About the Sum Unit of the TLOG.SUMIn the sum computation (TLOG.SUM) of time series, data are summed over the scan
interval. However, for flow values that have units /s, /min, or /h, a simple summation
results in the actual value not matching the computed result, because the scan intervaland the unit of the input values are different. In these cases, the unit of the data
measured over the scan interval is converted to match the unit of the input values and
the computation is performed.

11-16
For example, if the scan interval is 2 s, and the input value is 100 m3/min, a simple
summation would add 100 every 2 s resulting in 3000 after one minute. However, if thecomputing unit is set to /min, then 2s/60s is multiplied every scan interval before the
value is added giving a result that is close to the actual input value. The scan interval
unit is in seconds.
OFF ∑(measured value)
/S ∑(measured value) × scan interval/MIN ∑(measured value) × scan interval/60
/HOUR ∑(measured value) × scan interval/3600
For the setting procedure, see section 11.8.
About [Reset]Whether or not to reset the computed result at every timeout is selectable. The figure
below shows the action of TLOG.SUM computation.
Example : Result of the TLOG.SUM computation
Interval 1 2 3
ResetReset ResetReset = On
Reset = Off
In case of TLOG.MAX computation, for example, the maximum value is derived for every
interval when “Reset” is “On,” and the maximum value from the start of computation is
derived when “Reset” is “Off.”
If Power is Lost while the TLOG Computation was in ProgressThe TLOG computation is resumed when the power is restored. The operation varies
depending on whether power is restored before or after the scheduled time to create the
TLOG data.
Time of Recovery TLOG Computation Operation
After the time to create TLOG data are created immediately when power isthe TLOG data restored. The measured/computed data up to the time of the power
disruption are used. At the next scheduled TLOG computation time,data will be used from the point in time after the power wasrestored.
Before the time to create After power is restored, TLOG data are created at the normallythe TLOG data scheduled time to perform the TLOG computation. All measured/
computed data excluding the power disruption period are used.
How the Measured/Computed Data are Handled when there is an Abnormality in theData
Type of Abnormal Data Report DataAVE MAX/MIN/P-P SUM
Positive overflow not used used not usedNegative overflow not used used not usedError not used not used not used
11.7 TLOG Computation

11-17
Co
mp
utatio
n/R
epo
rt Fu
nctio
n (O
ptio
n)
11
11.8 Setting the Timer Number and Sum Unit forTLOG Computation
Set the number of the timer used by the channel computing the TLOG. Also, set the
[sum scale] that is used when determining the sum in TLOG.SUM. These are set in the
setting mode.The timer specifications are set in the basic setting mode.
Procedure• These procedures are carried out in the setting mode.
• Use the arrow keys to move the cursor (blue) to the appropriate parameter. (The
parameters that cannot be changed are grayed).
• The possible selections are displayed at the bottom of the screen. Select using the
soft keys.• The parameter boxes that are changed are displayed in yellow. By confirming the
new settings, they change back to white.
Press MENU .
Twice press the soft key Next 1/3 .
To display the setting screen press the soft key #11 .
23
1
The numbers in front of the operating procedure shown below correspond to the
numbers in the above figure.
1. First-CH and Last-CH
Select the desired channels. (For the channels set here, the [Tag] and [Rolling
average] are also simultaneously set.)
2. Timer No.
This is the timer specified in the basic setting mode. Select 1, 2, or 3.3. Sum scale
When the channel is computing TLOG.SUM, select [Off], [/s], [/min], or [/h]. The
initial setting is [Off]. You do not have to set this for channels that are not
computing TLOG.SUM (leave it [Off]).
Confirming operationTo confirm the new settings, press the DISP/ENTER key.
To cancel the new settings, press the ESC key. A window appears for you to confirm the
cancellation. Select [Yes] using the arrow keys and press the DISP/ENTER key.

11-18
11.9 Setting the Timer (Basic Setting Mode)
Up to three timers can be specified. The timers specified here are used to determine the
interval for the TLOG computation. In addition, all the data of measurement and
computation channels can be saved at the interval determined by the timers.
Procedure• These procedures are carried out in the basic setting mode.• Use the arrow keys to move the cursor (blue) to the appropriate parameter.
• The possible selections are displayed at the bottom of the screen. Select using the
soft keys.
• The parameter boxes that are changed are displayed in yellow. By confirming the
new settings, they change back to white.
Press MENU .
Press FUNC for 3 seconds. The menu screen for the basic setting mode appears.
Twice press the soft key Next 1/3 .
Press the soft key #9 .
To display the setting screen press the soft key #3 .
123
45
126789
The numbers in front of the operating procedure shown below correspond to the
numbers in the above figure.
Setting the relative timer1. Timer Number
Select the desired timer number.
2. Mode
Select [Relative]. [Interval], [Reset], and [Action] are displayed.3. Interval
Set the time to the next timeout.
Pressing the [Input] soft key displays a window used to enter the time. Enter the
time (00:01 to 24:00) and press the DISP/ENTER key. For the procedures
related to entering numerical values, see “Entering Numbers” on page 3-21.4. Reset
[On] : Resets the TLOG value when the timer expires.
[Off] : Does not reset the TLOG value when the timer expires.
5. Action
[DataSave] : Stores the instantaneous values of all measurement/computationchannels to the internal memory when the time expires.
[Off] : Does not store the measured/computed data.

11-19
Co
mp
utatio
n/R
epo
rt Fu
nctio
n (O
ptio
n)
11
Setting the absolute timer2. Mode
Select [Absolute]. [Interval], [Reset], [Ref. time], and [Action] are displayed.
6. Interval
Set the time to the next timeout from 19 choices below.
1 min, 2 min, 3 min, 4 min, 5 min, 6 min, 10 min, 12 min, 15 min, 20 min, 30 min,
1 h, 2 h, 3 h, 4 h,6 h, 8 h, 12 h, 24 h.7. Ref. time
Pressing the [Input] soft key displays a window used to enter the time. Enter the
time and press the DISP/ENTER key. For the procedures related to entering
numerical values, see “Entering Numbers” on page 3-21.
8. Reset[On] : Resets the TLOG value when the timer expires.
[Off] : Does not reset the TLOG value when the timer expires.
9. Action
[DataSave] : Stores the instantaneous values of all measurement/computation
channels to the internal memory when the time expires.[Off] : Does not store the TLOG data.
Confirming operationTo confirm the new settings, press the DISP/ENTER key.
To cancel the new settings, press the ESC key. A window appears for you to confirm the
cancellation. Select [Yes] using the arrow keys and press the DISP/ENTER key.
ExplanationAcquiring the data of all channels to the internal memory at each interval (settingat the [Action] box)If [Save data] is specified in the [Action] box, the instantaneous values of not only the
channels set to compute the TLOG computation, but also those of every channel can be
acquired to the internal memory at the specified interval (whether or not any channel is
set to compute the TLOG computation has no relevance).
The data along with the TLOG data are written to the area for writing the TLOGcomputed data of the internal memory. When storing to the external storage medium,
the data are stored to the TLOG data file (“DTG” extension). For details related to the
data acquisition of data to the internal memory and the storage to the external storage
medium, see the explanation on the TLOG data in chapter 8.
NoteTLOG data are written to the internal memory at the interval determined by the timer when
the timer is specified (see section 11.8) (writing to the internal memory is carried out
regardless of the setting specified in the above-mentioned [Action] box).
11.9 Setting the Timer (Basic Setting Mode)

11-20
11.10 Using the Rolling Average
A rolling average can be specified as the moving average on the computed results of
each computation channel. Set the sampling interval and the number of samples. The
maximum sampling interval is 1 hour, the maximum number of samples is 64. The
rolling average can be used to suppress fluctuations in the computed results.
Procedure• These procedures are carried out in the setting mode.
• Use the arrow keys to move the cursor (blue) to the appropriate parameter. (The
parameters that cannot be changed are grayed).
• The possible selections are displayed at the bottom of the screen. Select using the
soft keys.• The parameter boxes that are changed are displayed in yellow. By confirming the
new settings, they change back to white.
Press MENU .
Twice press the soft key Next 1/3 .
To display the setting screen press the soft key #11 .
234
1
The numbers in front of the operating procedure shown below correspond to the
numbers in the above figure.
1. First channel and last channel
Select the desired channels. (For the channels set here, the [Tag] and [TLOG]are also simultaneously set.)
2. On/Off
[On] : Use rolling average
[Off] : Do not use rolling average
If [On] is selected, [Interval] and [Number of samples] are displayed.3. Interval
Select the interval from the selections below. However, when the scan interval
is set to 2 s, even if the sampling interval is set to 1 s, 3 s, 5 s, or 15 s, the
sampling will be performed at 2 s, 4 s, 6 s, or 16 s.
1 s, 2 s, 3 s, 4 s, 5 s, 6 s, 10 s, 12 s, 15 s, 20 s, 30 s, 1 min, 2 min, 3 min, 4 min,5 min, 6 min, 10 min, 12 min, 15 min, 20 min, 30 min, 1 h
4. Number of samples
This is the number of data points used to compute the rolling average. Set an
integer value between 1 and 64.

11-21
Co
mp
utatio
n/R
epo
rt Fu
nctio
n (O
ptio
n)
11
Confirming operationTo confirm the new settings, press the DISP/ENTER key.To cancel the new settings, press the ESC key. A window appears for you to confirm the
cancellation. Select [Yes] using the arrow keys and press the DISP/ENTER key.
Explanation• While the number of samples acquired is less than the specified number of samples,
the avarage of acquired data is computed.
• The computation error data are not included in the rolling average computation.
• When the measured data exceed the upper and lower limits indicated below, thevalue is clipped at the upper or lower limit and the moving average is calculated. The
upper and lower limits vary depending on the decimal position of the span upper and
lower limits of the computation channel.
Decimal Position of the Span Upper/Lower Limit of the Upper/Lower LimitComputation Channel
±100000000
. ±10000000
. ±1000000
. ±100000
. ±10000
. ±1000
11.10 Using the Rolling Average
11-22
11.11 Overview of the Report Function
This function is used to create hourly, daily, weekly, and monthly reports. The report
data can be displayed on the screen. The report data are saved to the external storage
medium in ASCII format. For data formats, see appendix 2, “Data Formats of ASCII
Files.”
Types of Reports and SpecificationsTypes of reports• Hourly report
On every hour on the hour, the average, maximum, minimum, and sum values of thespecified channels are determined from an hour of data up to the current hour and
written to the internal memory.
• Daily reportAt the specified time everyday, the average, maximum, minimum, and sum values of
the specified channels are determined from a day of data up to the specified time andwritten to the internal memory.
• Weekly reportAt the specified time of the specified day every week, the average, maximum,
minimum, and sum values of the specified channels are determined from a week ofdata up to the specified time and written to the internal memory.
• Monthly reportAt the specified time of the specified date every month, the average, maximum,
minimum, and sum values of the specified channels are determined from a month of
data up to the specified time and written to the internal memory. The number days ina month may be 28, 29, 30, or 31 days depending on the month.
Types of reports• Hourly only : Creates reports every hour.
• Daily only : Creates reports every day.
• Daily and weekly : Creates daily and weekly reports.• Daily and monthly : Creates daily and monthly reports.
For the report data display, see section 4.5.
Combinations of reports that can be createdThe reports created by the RD-MV100 can be set to “hourly only,” “daily only,” “daily and
weekly,” or “daily and monthly.”
Number of measurement and computation channels that can be assigned to thereportUp to 12 channels can be assigned to one report.
The report data are not created for channels that are set to [Skip] or those that have the
computation turned [Off].
About the sum unit (sum scale)In the sum computation (TLOG.SUM) of time series, data are summed over the scan
interval. However, for flow values that have units /s, /min, /h, or /day a simple
summation results in the actual value not matching the computed result, because the
scan interval and the unit of the input values are different. In these cases, the unit of the
data measured over the scan interval is converted to match the unit of the input valuesand the computation is performed.

11-23
Co
mp
utatio
n/R
epo
rt Fu
nctio
n (O
ptio
n)
11
For example, if the scan interval is 2 s, and the input value is 100 m3/min, a simple
summation would add 100 every 2 s resulting in 3000 after one minute. However, if thesum unit is set to /min, then 2s/60s is multiplied every scan interval before the value is
added giving a result that is close to the actual input value. The scan interval unit is in
seconds.
OFF ∑(measured value)
/S ∑(measured value) × scan interval/MIN ∑(measured value) × scan interval/60
/HOUR ∑(measured value) × scan interval/3600
/DAY ∑(measured value) × scan interval/86400
For the setting procedure, see section 11.13.
If power is lost while the report function is in progressIf a power disruption occurred while the report function was in progress, the report
function will resume after the power is restored. The exact operation will vary depending
on whether the power is restored before or after the scheduled time to create a report.
Time of Recovery Report Operation
After the time to create the Report data are created immediately after power is restored. Thereport measured/computed data up to the time of the power disruption are
used. For the next scheduled report, data after the power recoveryare used.
Before the time to create After power is restored, report data are created at the time of thethe report next normally scheduled report. All measured/computed data
excluding the power disruption period are used.
How the measured/computed data are handled when there is an abnormality in thedata
Type of Abnormal Data Report DataAverage Value Maximum/Minimum Value Integrated Value
Positive overflow not used used not usedNegative overflow not used used not usedError not used not used not used
Displaying the ReportReport data displayThe reports can be displayed from the [Information] - [Memory Summary] menu in the
operation mode. See section 4.5.
Status displayIf the data of a measurement or a computation channel enter any of the conditions listedbelow within the relevant time period (one hour for hourly reports and one day for daily
reports, for example), status “E” or “O” is output to the report. In addition, if a power
failure occurred or the time was changed, status “P” and “C” are output to the report,
respectively. For the displayed position, see the report data output example in section
4.5.
11.11 Overview of the Report Function
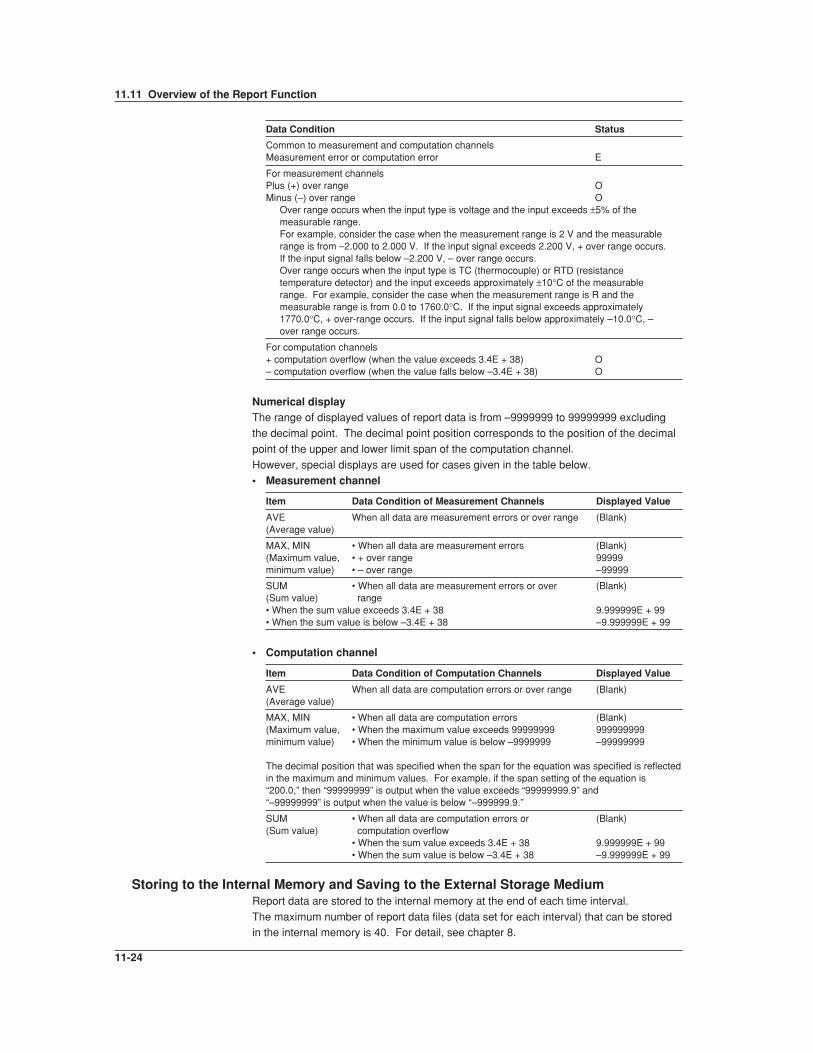
11-24
Data Condition Status
Common to measurement and computation channelsMeasurement error or computation error E
For measurement channelsPlus (+) over range OMinus (–) over range O
Over range occurs when the input type is voltage and the input exceeds ±5% of themeasurable range.For example, consider the case when the measurement range is 2 V and the measurablerange is from –2.000 to 2.000 V. If the input signal exceeds 2.200 V, + over range occurs.If the input signal falls below –2.200 V, – over range occurs.Over range occurs when the input type is TC (thermocouple) or RTD (resistancetemperature detector) and the input exceeds approximately ±10°C of the measurablerange. For example, consider the case when the measurement range is R and themeasurable range is from 0.0 to 1760.0°C. If the input signal exceeds approximately1770.0°C, + over-range occurs. If the input signal falls below approximately –10.0°C, –over range occurs.
For computation channels+ computation overflow (when the value exceeds 3.4E + 38) O– computation overflow (when the value falls below –3.4E + 38) O
Numerical displayThe range of displayed values of report data is from –9999999 to 99999999 excluding
the decimal point. The decimal point position corresponds to the position of the decimal
point of the upper and lower limit span of the computation channel.
However, special displays are used for cases given in the table below.
• Measurement channel
Item Data Condition of Measurement Channels Displayed Value
AVE When all data are measurement errors or over range (Blank)(Average value)
MAX, MIN • When all data are measurement errors (Blank)(Maximum value, • + over range 99999minimum value) • – over range –99999
SUM • When all data are measurement errors or over (Blank)(Sum value) range• When the sum value exceeds 3.4E + 38 9.999999E + 99• When the sum value is below –3.4E + 38 –9.999999E + 99
• Computation channel
Item Data Condition of Computation Channels Displayed Value
AVE When all data are computation errors or over range (Blank)(Average value)
MAX, MIN • When all data are computation errors (Blank)(Maximum value, • When the maximum value exceeds 99999999 999999999minimum value) • When the minimum value is below –9999999 –99999999
The decimal position that was specified when the span for the equation was specified is reflectedin the maximum and minimum values. For example, if the span setting of the equation is“200.0,” then “99999999” is output when the value exceeds “99999999.9” and“–99999999” is output when the value is below “–999999.9.”
SUM • When all data are computation errors or (Blank)(Sum value) computation overflow
• When the sum value exceeds 3.4E + 38 9.999999E + 99• When the sum value is below –3.4E + 38 –9.999999E + 99
Storing to the Internal Memory and Saving to the External Storage MediumReport data are stored to the internal memory at the end of each time interval.
The maximum number of report data files (data set for each interval) that can be storedin the internal memory is 40. For detail, see chapter 8.
11.11 Overview of the Report Function
11-25
Co
mp
utatio
n/R
epo
rt Fu
nctio
n (O
ptio
n)
11
11.12 Using the Report Function
Starting/Stopping the Report FunctionThe report start/stop is in sync with the data acquisition start/stop. The report can also
be started or stopped via remote control or communication commands. For the remote
control function, see section 10.9. For the communication function, see RD-MV100Communication Interface User’s Manual.
ProcedureStarting the report (also starts the data acquisition to the internal memory)
1. Press the START key. The icon that indicates the data acquisition to the
internal memory turns to a start icon and the computation icon appears. For
details related to the status display section, see section 4.2.The report function starts. When the time to create the report arrives, the report
data are written to the internal memory.
Stopping the report (also stops the data acquisition to the internal memory)1. Press the STOP key. A confirmation window opens.
2. Use the arrow keys to select [Mem + Math] (stop the data acquisition to theinternal memory and computation) or [Mem] (stop the data acquisition), and
press the DISP/ENTER key.
The icon that indicates the data acquisition to the internal memory turns to a
stop icon and the computation icon disappears.
The report stops.
NoteWhen the report function is stopped, the report file is closed. When the report is restarted,
data are written to a new file.
Clearing the Report Data in the Internal MemoryThese procedures are carried out in the setting mode. The report data are cleared along
with the display data, for example. For the procedures, see section 9.7.

11-26
11.13 Setting the Report Function
Set the report type, report channels, the time and date to create the report. The report
function is set in the basic setting mode.
Procedure• These procedures are carried out in the basic setting mode.
• Use the arrow keys to move the cursor (blue) to the appropriate parameter.• The possible selections are displayed at the bottom of the screen. Select using the
soft keys.
• The parameter boxes that are changed are displayed in yellow. By confirming the
new settings, they change back to white.
Press MENU .
Press FUNC for 3 seconds. The menu screen for the basic setting mode appears.
Twice press the soft key Next 1/3 .
Press the soft key #9 .
To display the setting screen press the soft key #2 .
1234567
The numbers in front of the operating procedure shown below correspond to the
numbers in the above figure.
1. Report set
[Hour] : Creates hourly reports.[Day] : Creates daily reports.
[Day+Week] : Creates daily and weekly reports.
[Day+Month] : Creates daily and monthly reports.
2. Date/Day of the week
This is the date or day of the week on which the report is created.If the [Report set] is set to [Day+Month], [Date] is displayed. If [Day+Week] is
specified, [Day] is displayed. If [Hour] or [Day] is specified, [Date] is displayed.
However, this setting is void.
• Date (for monthly reports)
Pressing the [Input] soft key displays a window used to enter the date. Enterthe date (01-28)* and press the DISP/ENTER key. Procedures related to
entering numerical values, see “Entering Numbers” on page 3-21.
* You cannot specify 30 or 31.
• Day (for weekly reports)
Enter the day of the week using the soft key.

11-27
Co
mp
utatio
n/R
epo
rt Fu
nctio
n (O
ptio
n)
11
11.13 Setting the Report Function
3. Time (hour)
Set the time to create daily, weekly, and monthly reports with the time on thehour (00 to 23).
Pressing the [Input] soft key displays a window used to enter the time. Enter the
time and press the DISP/ENTER key. For the procedures related to entering
numerical values, see “Entering Numbers” on page 3-21.
This setting is void for hourly reports.4. Report CH
This is the report data number to which the measurement/computation channel
is assigned. Select from R01 to R12. The reports are output in order according
to this number.5. On/Off
[On] : Assign channels to “Report CH.”
[Off] : Do not assign report channels to “Report CH.”6. Channel
Set the measurement or computation channel to assign to the report channel.
All measurement and computation channels can be specified. However, the
reports are not created for channels that are set to [Skip] or those that have the
computation turned [Off].7. Sum scale (sum unit)
Select [Off], [/s], [/min], [/h], or [/day]. See section 11.11.
Confirming operationTo confirm the new settings, press the DISP/ENTER key.To cancel the new settings, press the ESC key. A window appears for you to confirm the
cancellation. Select [Yes] using the arrow keys and press the DISP/ENTER key.
ExplanationDate/Day of the weekThis is the date for monthly reports or the day of the week for weekly reports. The report
is created at the specified time on the specified date or day of the week.
TimeThis is the time at which daily, weekly, and monthly reports are created. Hourly reports
are created every hour on the hour.

12-1
Tro
ub
lesho
otin
g
12
Chapter 12 Troubleshooting
12.1 A List of Messages
Occasionally, error codes and messages appear on the screen while using the recorder.
The entire list of messages is given below. Error codes and messages related to
communications are also listed here.
The messages are displayed in the language that you have chosen. For the proceduresregarding language selection, see section 10.10.
However, the following messages are displayed only in English.
• messages displayed on tne error log screen
• messages corresponding to communication commands
Errors Related to Parameter Settings• Setting Errors
Code Message Explanation/Countermeasures/Ref. Section
1 System error. Contact your nearest Omega dealer.
2 Incorrect date or time setting. See section 3.7.
3 A disabled channel is selected. See Communication Interface User’s Manual.
4 Incorrect function parameter. See Communication Interface User’s Manual.
5 The input numerical value exceeds the set range. Enter a proper value.
6 Incorrect input character string. Enter a proper character string.
7 Too many characters. Enter specified number of characters.
8 Incorrect input mode. See Communication Interface User’s Manual.
9 Incorrect input range code. See Communication Interface User’s Manual.
21 Cannot set an alarm for a skipped channel. See Communication Interface User’s Manual.
22 The upper and lower span limits are equal. See sections 5.1 to 5.7.
23 The upper and lower scale limits are equal. See sections 5.5 and 5.6.
30 The partial boundary value exceeds the range of the span. See section 7.11.
31 Partialexpansion display is set ON for a SKIPPED channel. See Communication Interface User’s Manual.
35 The upper and lower limits of the display band are equal. See section 7.9.
36 The lower limit of the display band is greater than the upper limit. See section 7.9.
37 The display band is narrower than 4% of the entire display. See section 7.9.
40 Incorrect group set character string. See section 7.6.
41 There is no specified input channel. See Communication Interface User’s Manual.
42 Exceeded the number of channels which can be set. See Communication Interface User’s Manual.
43 A channel number cannot repeat in a group. See section 7.6.
45 There is no character string saved in the clipboard. Copy a character string to the clipboard.
46 The character string saved in the clipboard is too long. Paste a character string with the specified numberof characters.
61 There is no channel specified by the MATH expression. See section 11.4.
62 MATH expression grammar is incorrect. See section 11.2.
63 MATH expression sequence is incorrect. See section 11.2.
64 MATH upper and lower span values are equal. See section 11.4.
70 The range of the MATH constant is exceeded. See section 11.4.
71 Set range of the MATH constant is exceeded. See section 11.6.
81 All space or ‘quit’ string cannot be specified. See section 10.4.
83 Duplicate used combination of user ID and password. See section 10.4
85 The login password is incorrect. See section 10.1.
86 The key-lock release password is incorrect. See section 10.1.
87 This key is locked. See section 10.1.
88 This function is locked. See section 10.1.
89 Press [FUNC] key to login. See section 10.3.
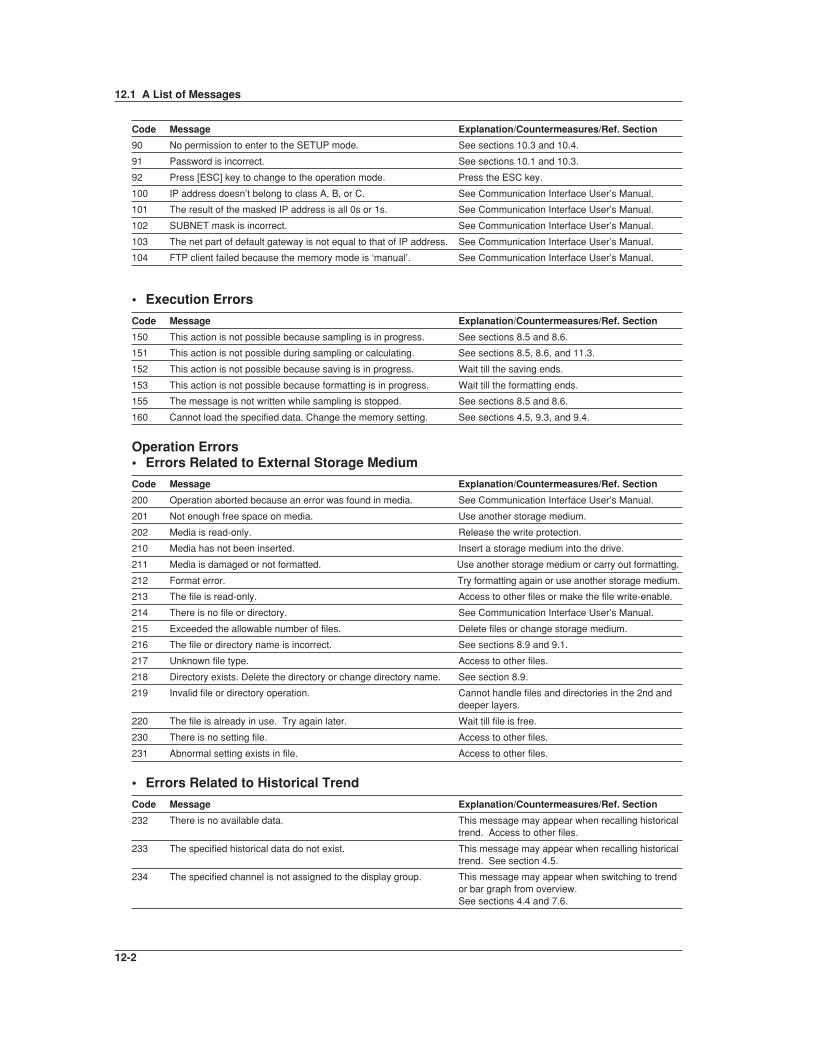
12-2
Code Message Explanation/Countermeasures/Ref. Section
90 No permission to enter to the SETUP mode. See sections 10.3 and 10.4.
91 Password is incorrect. See sections 10.1 and 10.3.
92 Press [ESC] key to change to the operation mode. Press the ESC key.
100 IP address doesn’t belong to class A, B, or C. See Communication Interface User’s Manual.
101 The result of the masked IP address is all 0s or 1s. See Communication Interface User’s Manual.
102 SUBNET mask is incorrect. See Communication Interface User’s Manual.
103 The net part of default gateway is not equal to that of IP address. See Communication Interface User’s Manual.
104 FTP client failed because the memory mode is ‘manual’. See Communication Interface User’s Manual.
• Execution Errors
Code Message Explanation/Countermeasures/Ref. Section
150 This action is not possible because sampling is in progress. See sections 8.5 and 8.6.
151 This action is not possible during sampling or calculating. See sections 8.5, 8.6, and 11.3.
152 This action is not possible because saving is in progress. Wait till the saving ends.
153 This action is not possible because formatting is in progress. Wait till the formatting ends.
155 The message is not written while sampling is stopped. See sections 8.5 and 8.6.
160 Cannot load the specified data. Change the memory setting. See sections 4.5, 9.3, and 9.4.
Operation Errors• Errors Related to External Storage Medium
Code Message Explanation/Countermeasures/Ref. Section
200 Operation aborted because an error was found in media. See Communication Interface User’s Manual.
201 Not enough free space on media. Use another storage medium.
202 Media is read-only. Release the write protection.
210 Media has not been inserted. Insert a storage medium into the drive.
211 Media is damaged or not formatted. Use another storage medium or carry out formatting.
212 Format error. Try formatting again or use another storage medium.
213 The file is read-only. Access to other files or make the file write-enable.
214 There is no file or directory. See Communication Interface User’s Manual.
215 Exceeded the allowable number of files. Delete files or change storage medium.
216 The file or directory name is incorrect. See sections 8.9 and 9.1.
217 Unknown file type. Access to other files.
218 Directory exists. Delete the directory or change directory name. See section 8.9.
219 Invalid file or directory operation. Cannot handle files and directories in the 2nd anddeeper layers.
220 The file is already in use. Try again later. Wait till file is free.
230 There is no setting file. Access to other files.
231 Abnormal setting exists in file. Access to other files.
• Errors Related to Historical Trend
Code Message Explanation/Countermeasures/Ref. Section
232 There is no available data. This message may appear when recalling historicaltrend. Access to other files.
233 The specified historical data do not exist. This message may appear when recalling historicaltrend. See section 4.5.
234 The specified channel is not assigned to the display group. This message may appear when switching to trendor bar graph from overview.See sections 4.4 and 7.6.
12.1 A List of Messages
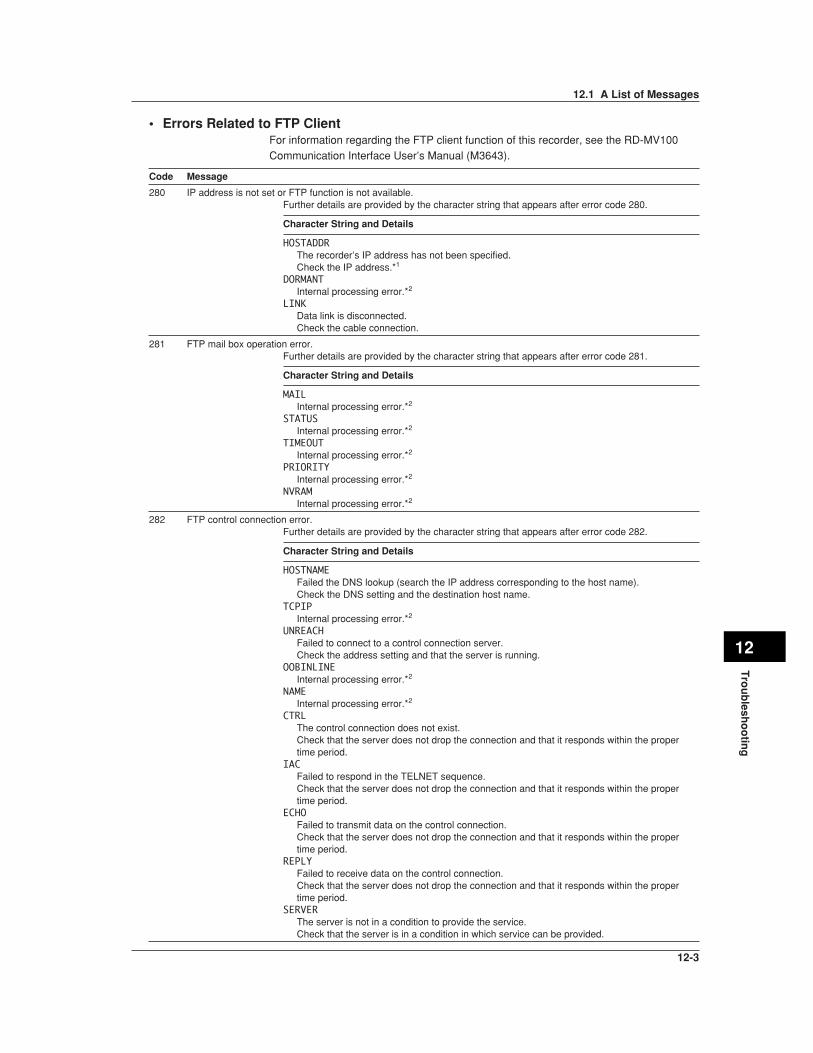
12-3
Tro
ub
lesho
otin
g
12
• Errors Related to FTP ClientFor information regarding the FTP client function of this recorder, see the RD-MV100Communication Interface User’s Manual (M3643).
Code Message
280 IP address is not set or FTP function is not available.Further details are provided by the character string that appears after error code 280.
Character String and Details
HOSTADDRThe recorder’s IP address has not been specified.Check the IP address.*1
DORMANTInternal processing error.*2
LINKData link is disconnected.Check the cable connection.
281 FTP mail box operation error.Further details are provided by the character string that appears after error code 281.
Character String and Details
MAILInternal processing error.*2
STATUSInternal processing error.*2
TIMEOUTInternal processing error.*2
PRIORITYInternal processing error.*2
NVRAMInternal processing error.*2
282 FTP control connection error.Further details are provided by the character string that appears after error code 282.
Character String and Details
HOSTNAMEFailed the DNS lookup (search the IP address corresponding to the host name).Check the DNS setting and the destination host name.
TCPIPInternal processing error.*2
UNREACHFailed to connect to a control connection server.Check the address setting and that the server is running.
OOBINLINEInternal processing error.*2
NAMEInternal processing error.*2
CTRLThe control connection does not exist.Check that the server does not drop the connection and that it responds within the propertime period.
IACFailed to respond in the TELNET sequence.Check that the server does not drop the connection and that it responds within the propertime period.
ECHOFailed to transmit data on the control connection.Check that the server does not drop the connection and that it responds within the propertime period.
REPLYFailed to receive data on the control connection.Check that the server does not drop the connection and that it responds within the propertime period.
SERVERThe server is not in a condition to provide the service.Check that the server is in a condition in which service can be provided.
12.1 A List of Messages

12-4
Code Message
283 FTP command was not accepted.Further details are provided by the character string that appears after error code 283.
Character String and Details
USERFailed user name verification.Check the user name setting.
PASSFailed password verificationCheck the password setting.
ACCTFailed account verification.Check the account setting.
TYPEFailed to change the transfer type.Check that the server supports the binary transfer mode.
CWDFailed to change the directory.Check the initial path setting.
PORTFailed to set the transfer connection.Check that the security function is disabled.
PASVFailed to set the transfer connection.Check that the server supports PASV commands.
SCANFailed to read the transfer connection settings.Check that proper response to the PASV command is received from the server.
284 FTP transfer setting error.Further details are provided by the character string that appears after error code 284.
Character String and Details
MODEInternal processing error.*2
LOCALInternal processing error.*2
REMOTEThe destination file name is not correct.Check that you have the authority to create or overwrite files.
ABORTFile transfer abort was requested by the server.Check the server for the reason for the abort request.
12.1 A List of Messages
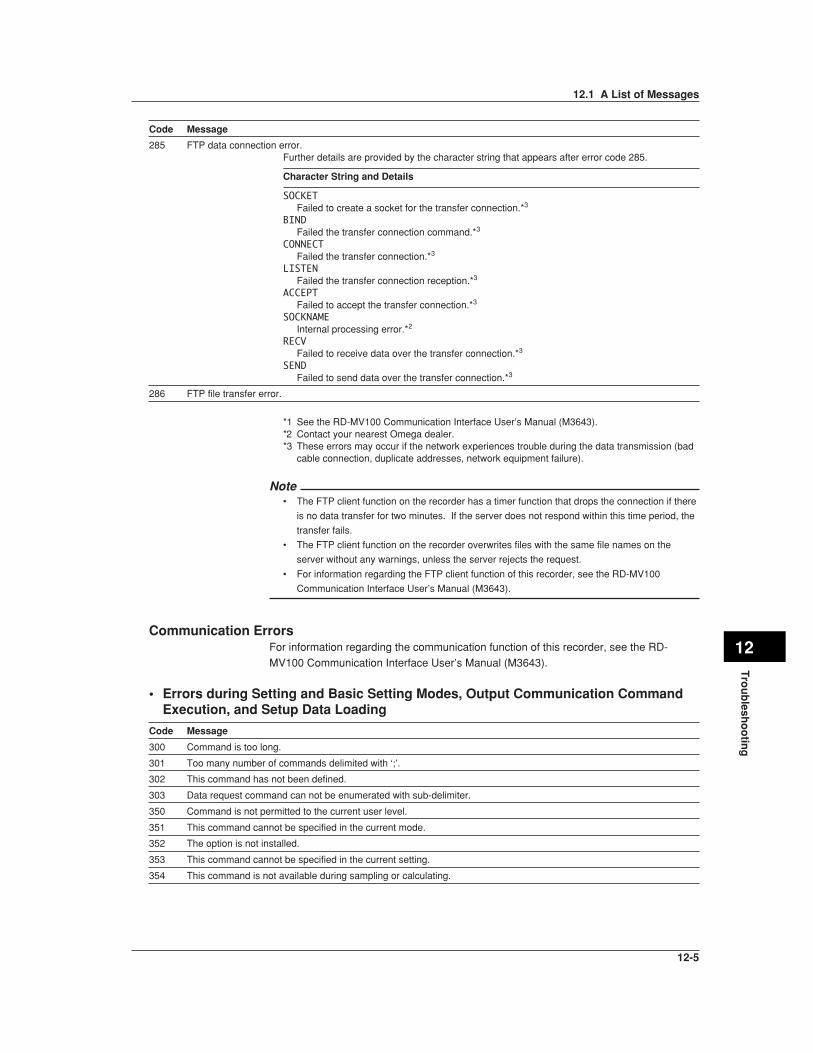
12-5
Tro
ub
lesho
otin
g
12
Code Message
285 FTP data connection error.Further details are provided by the character string that appears after error code 285.
Character String and Details
SOCKETFailed to create a socket for the transfer connection.*3
BINDFailed the transfer connection command.*3
CONNECTFailed the transfer connection.*3
LISTENFailed the transfer connection reception.*3
ACCEPTFailed to accept the transfer connection.*3
SOCKNAMEInternal processing error.*2
RECVFailed to receive data over the transfer connection.*3
SENDFailed to send data over the transfer connection.*3
286 FTP file transfer error.
*1 See the RD-MV100 Communication Interface User’s Manual (M3643).*2 Contact your nearest Omega dealer.*3 These errors may occur if the network experiences trouble during the data transmission (bad
cable connection, duplicate addresses, network equipment failure).
Note• The FTP client function on the recorder has a timer function that drops the connection if there
is no data transfer for two minutes. If the server does not respond within this time period, the
transfer fails.
• The FTP client function on the recorder overwrites files with the same file names on the
server without any warnings, unless the server rejects the request.
• For information regarding the FTP client function of this recorder, see the RD-MV100
Communication Interface User’s Manual (M3643).
Communication ErrorsFor information regarding the communication function of this recorder, see the RD-
MV100 Communication Interface User’s Manual (M3643).
• Errors during Setting and Basic Setting Modes, Output Communication CommandExecution, and Setup Data Loading
Code Message
300 Command is too long.
301 Too many number of commands delimited with ‘;’.
302 This command has not been defined.
303 Data request command can not be enumerated with sub-delimiter.
350 Command is not permitted to the current user level.
351 This command cannot be specified in the current mode.
352 The option is not installed.
353 This command cannot be specified in the current setting.
354 This command is not available during sampling or calculating.
12.1 A List of Messages

12-6
• Memory Access Errors during Setting and Basic Setting Modes and OutputCommunication Command Execution
An English error message is returned via the communication interface. It is not
displayed on the screen.
Code Message
360 Output interface must be chosen from Ethernet or RS by using ‘XO’ command.
361 The memory data is not saved for the communication output.
362 There are no data to send ‘NEXT’ or ‘RESEND’.
363 All data have already been transferred.
• Maintenance and Test Communication Command ErrorsAn English error message is returned via the communication interface. It is not
displayed on the screen.
Code Message
390 Command error.
391 Delimiter error.
392 Parameter error.
393 No permission.
394 No such connection.
395 Use ‘quit’ to close this connection.
396 Failed to disconnect.
397 No TCP control block.
• Other Communication ErrorsAn English error message is returned via the communication interface. It is not
displayed on the screen.
Code Message
400 Input username.
401 Input password.
402 Select username from ‘admin’ or ‘user’.
403 Login incorrect, try again!
404 No more login at the specified level is acceptable.
410 Login successful. (The special user level)
411 Login successful. (The general user level)
420 Connection has been lost.
421 The number of simultaneous connection has been exceeded.
422 Communication has timed-out.
NoteFor information regarding the communication function of this recorder, see the RD-MV100
Communication Interface User’s Manual (M3643).
12.1 A List of Messages

12-7
Tro
ub
lesho
otin
g
12
Status Messages
Code Message
500 Execution is complete.
501 Please wait a moment...
503 Data are being saved to media...
504 File is being loaded from media...
505 Formatting...
506 Memory save to media was interrupted.
507 Exchange media to continue the saving operation.
510 Range cannot be changed during sampling or calculating.
511 MATH expression cannot be changed during sampling or calculating.
512 Because memory save is ‘manual’ mode, FTP is not available.
520 Connecting to the line...
521 The data file is being transferred.
551 FTP test is being executed...
Cautions
Code Message Ref. Section
600 Measured data and Settings have been initialized. –
601 Measured data have been initialized. –
610 This username is already registered. See section 10.6.
611 There is no user who can enter to the SETUP mode. See section 10.6.
System ErrorsServicing is required when a system error occurs. Contact your nearest Omega dealer
for repairs.
Code Message
901 ROM failure.
902 RAM failure.
910 A/D memory failure for all input channels.
911 Channel 1 A/D memory failure.
912 Channel 2 A/D memory failure.
913 Channel 3 A/D memory failure.
914 Channel 4 A/D memory failure.
921 Channel 1 A/D calibration value error.
922 Channel 2 A/D calibration value error.
923 Channel 3 A/D calibration value error.
924 Channel 4 A/D calibration value error.
930 Memory acquisition failure.
940 The Ethernet module is down.
12.1 A List of Messages

12-8
12.2 Troubleshooting Flow Chart
Is the power supplyconnected properly?
Is the power supplied properly?
NO
NO
NO
NO
NO
YES
YES
YES
YES
YES
Nothing is displayed.
YES
Is the power switch on? Does the switch work properly?
Is the fuse blown?
Connect properly (See section 2.7).
Turn on the power properly(See section 3.2).
Replace the fuse (See section 13.2).
Does the fuse stay intactwhen the power is turned
on again?
Contact Omega.
Contact Omega.
Contact Omega.
Supply the power at the specifiedvoltage and frequency. (See section 14.7)

12-9
Tro
ub
lesho
otin
g
12
Does the inputmeet the specifications
(signal source resistance,etc.)?
NO
NO
NO
NO
NO
YES
YES
YES
YES
• The reading error is large.• The digital indication or trend trace (waveform) is unstable.• The trend trace (waveform) stays at 0 or 100%.
YES
Adjust the span and range(See sections 5.1 to 5.7).
Change the input to meet the specifications(See section 14.1).
Is the input wiring correct?
Are the span andrange settings correct?
Is the input free of noise?
Is the environmentaltemperature kept constant
(for temperaturemeasurement)?
Is the input wiring parallelwith other equipment?
YES
NO
NO
YES
Is the RJC setting correct(for TC input)?
Set correctly (See section 5.9).
Contact Omega.
• Separate the input wiring from the noise source.
• Ground the recorder properly.• Ground the measuring object
properly.• Insulate the TC from the measured
object.• Use shielded cable for input.• Correct the A/D integration frequency
(See section 5.9).• Use the input filter (See section 5.8).
• Use the cover for the input terminal.• Protect the input terminal from wind
or fans.• Keep the room temperature constant
around the input terminal.
• Wire correctly (See section 2.3).• Fix the terminal block properly.• Fasten the terminal screws.• Insulate the RTD from ground.• If burnt, replace the TC.
• Stop the TC burnout upscale/downscale function of other equipment.
• Ground the recorder and other equipment at the same grounding pole.
• Disconnect parallel wiring. (Use a double-element TC, for instance.)
12.2 Troubleshooting Flow Chart
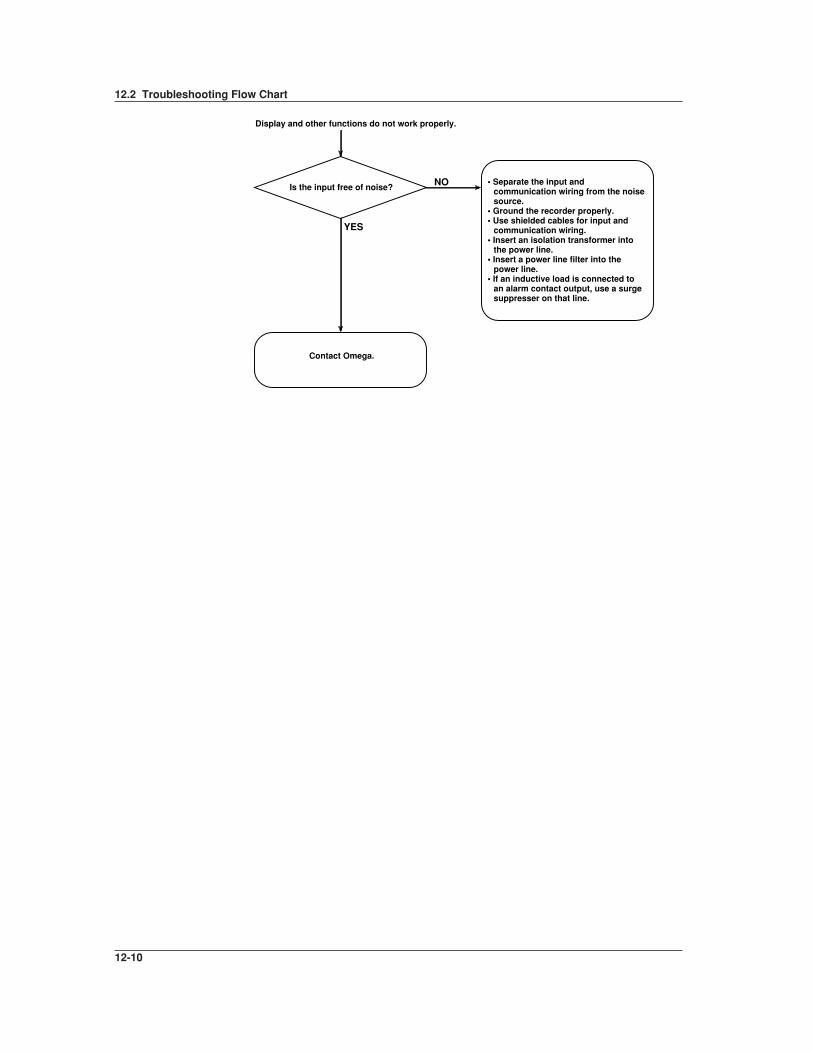
12-10
Is the input free of noise? NO
YES
Contact Omega.
Display and other functions do not work properly.
• Separate the input and communication wiring from the noise source.
• Ground the recorder properly.• Use shielded cables for input and
communication wiring.• Insert an isolation transformer into
the power line.• Insert a power line filter into the
power line.• If an inductive load is connected to
an alarm contact output, use a surge suppresser on that line.
12.2 Troubleshooting Flow Chart

13-1
Main
tenan
ce
13
Chapter 13 Maintenance
13.1 Periodic Maintenance
Check the recorder operation periodically to keep the recorder in good working order.
Perform the following checks and replace worn parts as needed.
• Is the display and storage functioning properly?In the event of problems, see section 12.2.
• Has the brightness of the LCD backlight deteriorated?
If replacement is necessary, see section 13.4 “Recommended Replacement Periods
for Worn Parts.”

13-2
13.2 Replacing the Fuse
Don’t replace the fuses for 100-120 VCA/200-240 VCA power supply models by yourself.
For replacement, please, contact Omega.
Replace the fuse every two years for preventive maintenance.
For 12 VDC Power Supply Model
WARNING• For safety reasons, make sure to turn OFF the power switch and disconnect the
recorder from the main power supply before replacing the fuse.
• To prevent the possibility of fire, use only the specified fuse purchased from
Omega.
• Never short circuit the fuse holder to bypass the use of a fuse.
Follow the procedures below to replace the fuse of the 12 VDC power supply model.
For fuse rating, see section 13.4 “Recommended Replacement Periods for Worn Parts.”
Follow the procedures below to replace the fuse.
1. Turn OFF the power switch.2. Disconnect the recorder from the main power supply.
3. While pressing the fuse carrier located to the right of the power switch, turn it
counter-clockwise approximately 45 degrees. The carrier and the fuse will slide
out.
4. Replace with a new fuse, insert the carrier in the fuse holder, and turn itclockwise while pressing the carrier to fix it in place.
For 100-120 VAC/200-240 VAC Power Supply Model
WARNING• Don’t replace the fuse by yourself. Never take RD-MV100 part to replace a
fuse.
Fuse ratingsRated voltage: 250 V
Rated current: 1 AType: Time lag
Approved standard: IEC/VDE

13-3
Main
tenan
ce
13
13.3 Calibration
To maintain the measurement accuracy, we recommend the recorder be calibrated
once a year. Calibration service is also provided by Omega. For details contact Omega.
Required InstrumentsFor calibrating the recorder, calibration instruments with the following resolution are
necessary.
Recommended instruments• DC voltage standard : Omega Model 2552 or equivalent
Main specificationsAccuracy of output in the range 20 mV to 20 V : ±0.005%
• Decade resistance box : Omega Model 2793-01 or equivalent
Main specifications
Accuracy of output in the range 0.1 to 500 Ω : ±0.001%
Resolution : 0.001 Ω(To purchase these instruments, contact the supplier of this recorder.)
Calibration Procedure1. Connect the recorder and the calibration instruments as shown in the following
figure, and allow the instruments to warm-up adequately. (The warm-up time for
the recorder is at least 30 minutes.)
2. Check that the ambient temperature and humidity are within the normal
operating conditions (See chapter 14).
3. Apply input signals corresponding to 0, 50, and 100% of the specified inputrange and calculate the errors from the readings.
If the error is not within the accuracy specifications, contact Omega.
NoteFor TC input, the temperature of the input terminals must be measured and a voltage
corresponding to the temperature at the reference junction must be added.
DC voltage measurement (example for the RD-MV112)
+-
DC voltage standard
Input terminals(DC volt and TC inputs)
+
-
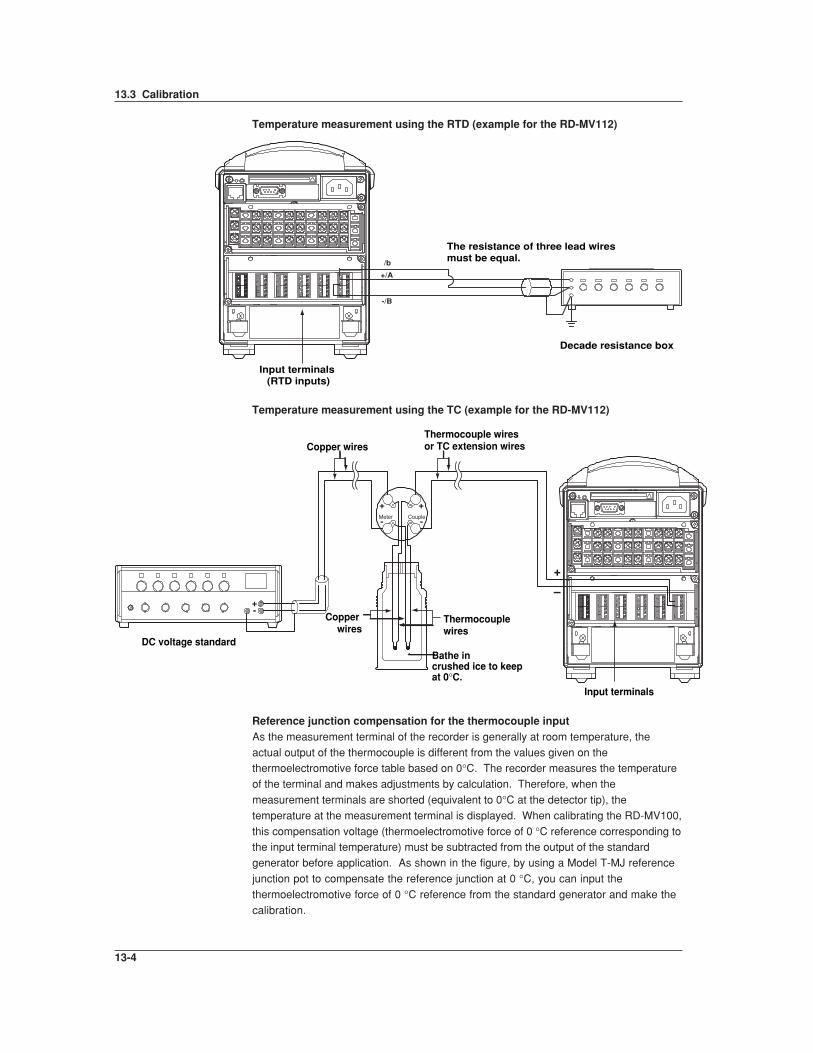
13-4
Temperature measurement using the RTD (example for the RD-MV112)
Decade resistance box
The resistance of three lead wires must be equal.
+/A
-/B
/b
Input terminals (RTD inputs)
Temperature measurement using the TC (example for the RD-MV112)
CoupleMeter
+ +
- -
+-
Thermocouple wiresor TC extension wires
Thermocouple wires
Bathe in crushed ice to keep at 0°C.
Copper wires
Copper wires
DC voltage standard
Input terminals
+
–
Reference junction compensation for the thermocouple inputAs the measurement terminal of the recorder is generally at room temperature, the
actual output of the thermocouple is different from the values given on thethermoelectromotive force table based on 0°C. The recorder measures the temperature
of the terminal and makes adjustments by calculation. Therefore, when the
measurement terminals are shorted (equivalent to 0°C at the detector tip), the
temperature at the measurement terminal is displayed. When calibrating the RD-MV100,
this compensation voltage (thermoelectromotive force of 0 °C reference corresponding tothe input terminal temperature) must be subtracted from the output of the standard
generator before application. As shown in the figure, by using a Model T-MJ reference
junction pot to compensate the reference junction at 0 °C, you can input the
thermoelectromotive force of 0 °C reference from the standard generator and make the
calibration.
13.3 Calibration

13-5
Main
tenan
ce
13
13.4 Recommended Replacement Periods for WornParts
To maintain the reliability of the recorder and to use it in good working order for a long
time, we recommend periodic replacement of worn parts as preventive maintenance.
The recommended replacement periods for worn parts are shown in the following table.
The replacement periods apply when the recorder is operated under standard operating
conditions.
Please consider the actual operating conditions when determining the actual
replacement periods for your recorder.The replacement of the LCD, the battery, and the rubber strips must be conducted by a
qualified Omega personnel. Contact Omega to have the LCD replaced.
Item Replacement Part Name Part Number Specifications Quantity UsedPeriod
Fuse 2 years FUSE A1352EF 250 V, 4 A, time lag 1(for 12 VDC power supply) (for /P1 model)
LCD 5 years Back light module 1
Battery 10 years Lithium battery 1
Rubber 5 years Dust and water proof for front panel, 1 eachstrip rubber strip for front cover
Floppy 5 years – – 1disk drive
ZIP 5 years – – 1drive
NoteThe recommended replacement period for the back light module is the period when the
brightness falls to half. The speed of degradation of the brightness varies depending on the
operating conditions and the judgement is subjective.
These factors should be considered when determining the actual replacement period.
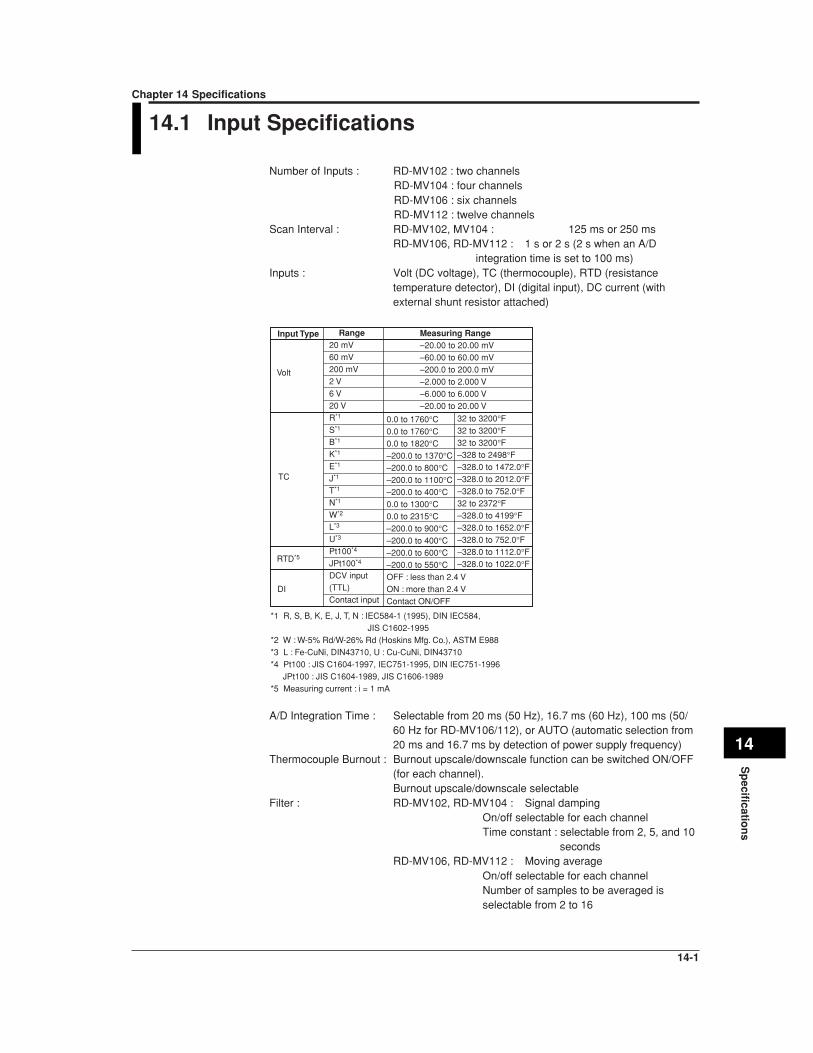
14-1
Sp
ecification
s
14
Chapter 14 Specifications
14.1 Input Specifications
Number of Inputs : RD-MV102 : two channelsRD-MV104 : four channelsRD-MV106 : six channelsRD-MV112 : twelve channels
Scan Interval : RD-MV102, MV104 : 125 ms or 250 msRD-MV106, RD-MV112 : 1 s or 2 s (2 s when an A/D
integration time is set to 100 ms)Inputs : Volt (DC voltage), TC (thermocouple), RTD (resistance
temperature detector), DI (digital input), DC current (withexternal shunt resistor attached)
Input Type Range20 mV60 mV200 mV2 V6 V20 VR*1
S*1
B*1
K*1
E*1
J*1
T*1
N*1
W*2
L*3
U*3
Pt100*4
JPt100*4
DCV input(TTL)Contact input
0.0 to 1760°C0.0 to 1760°C0.0 to 1820°C–200.0 to 1370°C–200.0 to 800°C–200.0 to 1100°C–200.0 to 400°C0.0 to 1300°C0.0 to 2315°C–200.0 to 900°C–200.0 to 400°C–200.0 to 600°C–200.0 to 550°COFF : less than 2.4 VON : more than 2.4 VContact ON/OFF
Volt
TC
RTD*5
DI
*1 R, S, B, K, E, J, T, N : IEC584-1 (1995), DIN IEC584, JIS C1602-1995
*2 W : W-5% Rd/W-26% Rd (Hoskins Mfg. Co.), ASTM E988*3 L : Fe-CuNi, DIN43710, U : Cu-CuNi, DIN43710*4 Pt100 : JIS C1604-1997, IEC751-1995, DIN IEC751-1996
JPt100 : JIS C1604-1989, JIS C1606-1989*5 Measuring current : i = 1 mA
32 to 3200°F32 to 3200°F32 to 3200°F–328 to 2498°F–328.0 to 1472.0°F–328.0 to 2012.0°F–328.0 to 752.0°F32 to 2372°F–328.0 to 4199°F–328.0 to 1652.0°F–328.0 to 752.0°F–328.0 to 1112.0°F–328.0 to 1022.0°F
Measuring Range–20.00 to 20.00 mV–60.00 to 60.00 mV–200.0 to 200.0 mV–2.000 to 2.000 V–6.000 to 6.000 V–20.00 to 20.00 V
A/D Integration Time : Selectable from 20 ms (50 Hz), 16.7 ms (60 Hz), 100 ms (50/60 Hz for RD-MV106/112), or AUTO (automatic selection from20 ms and 16.7 ms by detection of power supply frequency)
Thermocouple Burnout : Burnout upscale/downscale function can be switched ON/OFF(for each channel).Burnout upscale/downscale selectable
Filter : RD-MV102, RD-MV104 : Signal dampingOn/off selectable for each channelTime constant : selectable from 2, 5, and 10
secondsRD-MV106, RD-MV112 : Moving average
On/off selectable for each channelNumber of samples to be averaged isselectable from 2 to 16

14-2
Computation : Differential computation : Between any two channels
Available for Volt, TC, RTD, and DI ranges.Linear scaling : Available for Volt, TC, RTD, and DI ranges.
Scaling limits : –30000 to 30000
Decimal point : user selectable
Engineering unit : user definable, up to 6
charactersSquare root : Square root computation and linear scaling
Available for Volt range.
Scaling limits : –30000 to 30000
Decimal point : user selectable
Engineering unit : user definable, up to 6characters
14.1 Input Specifications

14-3
Sp
ecification
s
14
14.2 Display Specifications
Display unit : 5.5-inch TFT color LCD
(VGA, 320 × 240 dot resolution)
Channel display color : Trend/Bar graph : Selectable from 16 colors (Red, Green,
Blue, Blue violet, Brown, Orange, Yellow
green, Lightblue, Violet, Gray, Lime, Cyan,Darkblue, Yellow, Light Gray, Purple)
Initial settings of channel display color :
Channel 1 : Red, Channel 2 : Green,
Channel 3 : Blue, Channel 4 : Blue violet,
Channel 5 : Brown, Channel 6 : Orange,Channel 7 : Yellow-green, Channel 8 : Light
blue, Channel 9 : violet, Channel 10 : Gray,
Channel 11 : Lime 12 : Cyan
Background : White or black selectable
Trend screen : Direction : vertical or horizontal selectableNumber of indication channels :
6 channels per screen (maximum)
Number of group screens : 4
All channels indication : 24 channels (maximum, including
computation channels)Line width : 1, 2, and 3 dots selectable
Display rate : Waveform : 1, 2, 5, 10, 20, 30 min., 1, 2, 4
hours/div selectable (One division has 30
dots.)
Numerical value : 1 s (2 s when the scaninterval is 2 s.)
Contents : Waveform, Numerical value (numerical
display section can be turned ON/OFF), scale
(scale display can be turned ON/OFF), grid
lines (number of divisions selectable from 4 to12), hours : minutes on time axis, trip lines
(line widths are selectable from 1, 2 and 3
dots), messages (up to eight different
messages of up to 16 characters for each),
alarm indicationZone display and partial expansion dispaly is
available.
Bar graph screen : Direction : Vertical or horizontal selectable
Number of indication channels :
6 channels per screen (maximum)Number of group screens : 4
Scales : 4 to 12 divisions selectable
Base position of bar :
Left, right or center (only for horizontal display)
Display update rate : 1 s (2 s when the scan interval is 2 s)Contents : Bar graph, numerical value, unit, scale,
alarm indication
14-4
Digital screen : Number of indication channels :
6 channels per screen (maximum)Number of group screens : 4
Display update rate : 1 s (2 s when the scan interval is 2 s)
Contents : Numerical value, unit, alarm indication
Automatic display switching :
The displayed group can be automatically changed on thetrend, digital, and bar graph displays.
The display switching interval is selectable from 5 s, 10 s, 20
s, 30 s, and 1 min.
Overview screen : Number of indication channels :
Measured values and alarm status of all channelsInformation screen : Alarm summary :
Displays the list of alarms. Capable to switch to historical
trend screen by cursor pointing.
Message summary :
Display the list of messages and time. Capable to switch tohistorical trend screen by cursor pointing.
Memory summary :
Display the file list in internal memory. Capable to switch to
historical trend screen by cursor pointing.
Tags : Number of characters : 16 characters maximumHistorical trend screen : Display the retrieved data from internal or external memory.
Display format :
Whole screen display or divided into 2 areas
Time axis operation :
Can be expanded, reduced, and scrolledMemory information :
The following information of the retrieved data are displaye:
File name, serial number of the RD-MV which is used to
acquire data, starting and ending time of data acquisition,
user name (when using key login function), and batchinformation (models with /BT1)
Log display : Display the logs of error messages, key login/logout,
communication interface commands, and file transfers via
FTP.
System screen : Display the number of input points, capacity of the internalmemory, options, and MAC address.
Backlight saver function :
The LCD backlight automatically dims if no key is pressed for
a certain preset time (can be set from 1, 2, 5, 10, 20 and 60
minutes).Display language : Selectable from English, German, French, and Japanese.
German and French are used on the following screens. For
other screens, the displays will be the same as those for
English.
Screen menu in the operation modeFUNC key menu in the operation mode
Error Messages
Operation guide screens
Temperature unit : °C or °F selectable
14.2 Display Specifications

14-5
Sp
ecification
s
14
14.3 Data Storage Specifications
External storage medium : Selectable from :
1) 3.5-inch floppy disk (2HD, 1.44 MB)
2) PCMCIA ATA flash memory card (4 to 160 MB)
3) Zip disk (100 MB)Saving method : Manual or automatic selectable
Manual saving : Data saving by inserting external storage medium and
pressing MEDIA key
Automatic saving : Display data :
Periodic saving (10 min to 31 days) to externalstorage medium
Event data :
In case of trigger free...Periodic saving (3 min to 31
days) to external storage medium
In case of using trigger...Save the data when dataacquisition is finished
Sampling Interval : Display data :
Linked with the waveform display rate
Event data :Linked with the specified sampling interval
Sampling Interval for Event Data :
RD-MV102, RD-MV104 :
Selectable from 125, 250, 500 ms, and 1, 2, 5, 10, 30,
60, 120 sRD-MV106, RD-MV112 :
Selectable from 1, 2, 5, 10, 30, 60 and 120 sFile types : The following two file types can be created.
• Event data file (stores instantaneous values acquiredperiodically at a specified sampling interval)
• Display data file (stores the maximum and minimumvalues for each sampling interval from among measureddata acquired at scan intervals)
Files can be created in the following combinations.(a) Event data file (only for trigger mode) + display data file(b) Display data file only(c) Event data file only
Data format : BinaryData size per channel :
Display data : Measurement data...4 bytes/datum,computation data...8 bytes/datum
Event data : Measurement data...2 bytes/datum,computation data...4 bytes/datum
Trigger function : Event data : Selectable from Free, Trigger or RotateDisplay data + Event data : Selectable from Trigger or Rotate
Sampling length : The sampling length(the maximum data length) can bederived from the following equation.Sampling length = the maximum number of data points perchannel × sampling intervalMaximum number of data points per channel : calculatedfrom internal memory capacity, types of data, data size,andnumber of measurment or computation channels data to bestored

14-6
Internal memory capacity
Data Type Capacity of Internal Memory
Display data only 1.2 MB
Display data and event data Display data : 0.9 MBEvent data : 0.3 MB
Event data only 1.2 MB
Maximum number of data points per channel that can be stored
Data Type Maximum Number of Data Points Per Channel
Display data only 1,200,000 bytes/(number of measurement channels × 4 +number of computation channels × 8)Except, the maximum number of data points is 100,000
Display data and event data • Display data900,000 bytes/(number of measurement channels × 4 +number of computation channels × 8)Except, the maximum number of data points is 75,000
• Event data300,000 bytes/(number of measurement channels × 2 +number of computation channels × 4)Except, the maximum number of data points is 30,000
Event data only 1,200,000 bytes/(number of measurement channels × 2 +number of computation channels × 4)Except, the maximum number of data points is 120,000
This logic is explained in more detail below :1) When acquiring display data only
If we assume that the number of measuring channels is
20, the number of computing channels is 10, and the
display rate is 30 min/div (60 sec sampling interval),
then :Number of data per channel = 1,200,000 bytes/(20 × 4
bytes + 10 × 8 bytes) = 7,500 data*
* Maximum number of data points is 100,000.
Sampling length per file = 7,500 × 60 sec = 450,000 sec
= approx. 5 days2) When acquiring event data only
If we assume that the number of measuring channels is
20, the number of computing channels is 10, and the
sampling interval is 1 sec, then :
Number of data per channel = 1,200,000 bytes/(20 × 2bytes + 10 × 4 bytes) = 15,000 data*
* Maximum number of data points is 120,000.
Sampling length = 15,000 × 1 sec = 15,000 sec =
approx. 4 hours3) When acquiring both display data and event data
The sampling length is calculated by defining the
capacity for display data as 900,000 bytes and the
capacity for event data as 300,000 bytes. The method
of calculation is the same as shown above.Except, the maximum number of data points is 75,000
for display data and 30,000 for event data.
14.3 Data Storage Specifications

14-7
Sp
ecification
s
14
Example of sampling length :
In case measurement ch = 4 ch, mathematical ch = 0 ch
Display data file only
Display Rate(min/div)
Sampling Interval(s)
Sampling Length
1 min
2 s
41 h
5 min
10 s
8 days
20 min
40 s
34 days
30 min
60 s
52 days
60 min
120 s
104 days
240 min
480 s
416 days
Event data file only
Sampling IntervalSampling Length
125 ms4.2 h
500 ms16 h
1 s33 h
5 s6 days
30 s41 days
120 s166 days
Display data fileDisplay data file + Event data file
Display Rate(min/div)
Sampling Interval(s)
Sampling Length
1 min
2 s
31 h
5 min
10 s
6 days
20 min
40 s
26 days
30 min
60 s
39 days
60 min
120 s
78 days
240 min
480 s
312 days
Event data file
Sampling IntervalSampling Length
125 ms1 h
500 ms4.2 h
1 s8.3 h
5 s41 h
30 s10 days
120 s41 days
In case measurement ch = 6 ch, mathematical ch = 0 ch
Display data file only
Display Rate(min/div)
Sampling Interval(s)
Sampling Length
1 min
2 s
27 h
5 min
10 s
5 days
20 min
40 s
23 days
30 min
60 s
34 days
60 min
120 s
69 days
240 min
480 s
277 days
Event data file only
Sampling IntervalSampling Length
10 s11 days
5 s5 days
1 s27 h
30 s34 days
60 s69 days
120 s138 days
Display data fileDisplay data file + Event data file
Display Rate(min/div)
Sampling Interval(s)
Sampling Length
1 min
2 s
20 h
5 min
10 s
4 days
20 min
40 s
17 days
30 min
60 s
26 days
60 min
120 s
52 days
240 min
480 s
208 days
Event data file
Sampling IntervalSampling Length
10 s2 days
5 s34 h
1 s6.9 h
30 s8 days
60 s17 days
120 s34 days
(approx.)
(approx.)
(approx.)
(approx.)
(approx.)
(approx.)
(approx.)
(approx.)
Manual sample data :Trigger : Key operation or remote contact
Data format : ASCII
Max. number of data sets internal memory can hold : 50 data sets
TLOG data (only for computation option) :
Trigger : Timeout of the timerReport data (only for computation option) :
Types : Hourly, daily, daily + monthly and daily + weekly
Data format : ASCII
Screen image data :
Trigger : Key operationData format : png format
Output : External storage medium or communication interface
14.3 Data Storage Specifications

14-8
14.4 Alarm Function Specifications
Number of alarms : Up to four alarms for each channel
Alarm types : Upper and lower limits, delay upper and lower limits,
difference upper and lower limits, and upper limit and lower on
rate-of-changeAlarm delay time : Selectable from 0 s to 3600 s for each channel
Interval time of rate-of-change alarms :
The scan interval times 1 to 15, common to all channels.
Display : The alarm status (type) is displayed in the numerical value
display area upon occurrence of an alarm. A common alarmindication is also displayed in the status display section.
The alarm indication behavior : non-hold or hold-type can be
selectable for common to all channels.
Hysteresis : On (0.5% of display span)/off selectable (applied to upper and
lower limits alarms, common to all measurement channels)Relay outputs (option) : Number of points : 2, 4, 6 points
Relay action : Energized/deenergized, hold/non-hold, AND/
OR, reflash function selectable.
Alarm information : The times of alarm occurrences/recoveries, alarm types, etc.Up to 120 latest alarms are stored in the internal memory.
Displayed on the alarm summary screen.
14-9
Sp
ecification
s
14
14.5 Specifications of Communication Functions
Connection : Ethernet (10BASE-T)
Protocols : TCP/IP
FTP client functions : Automatic file transport from RD-MV (FTP client protocol)
FTP server functions : File transport on request by host computer (FTP serverprotocol)
Directory operation, file output, file delete and informing of the
rest of memory space on the external storge medium
Files can be transported : Display data file, event data file and report data file
Real time monitor function :Monitor the measured/computed data on RD-MV.
Omega private protocol is used.

14-10
14.6 Specifications of Optional Functions
Alarm Output Relays (/A1, /A2, /A3) :An alarm signal is output from the rear panel as a relay contact signal.
/A1 and /A2 includes remote control functions (/R1)
Relay contact rating : 250 VAC (50/60 Hz)/3 A, 250 VDC/0.1 A (for resistance load)Terminal configuration : SPDT (NO-C-NC). Energized-at-alarm/deenergized-at-alarm,
AND/OR, and hold/non-hold actions are selectable.
Batch Function (/BT1) :Information added to the measured/computed data :
Serial number of the RD-MV, Application name, Supervisor
name, Manager name, Batch number, Lot number, Comment
informationIdentifying operators (users) by using the key login function :
User names that are already registered cannot be specified.
The combinations of user IDs and passwords that are identical
to those that have been registered in the past cannot bespecified.
Messages : Messages 1 through 3 can be changed in the operation mode.
Confirming the stored data :
Batch information can be shown on the memory information
display.
Serial Communication Interface (/C2, /C3) :This interface allows the host computer to control and make settings for the recorder aswell as receive data from the recorder.
Connection : EIA RS-232 (/C2) or RS-422-A/485 (/C3)
Protocols : Omega private protocol, Modbus protocol
Synchronization method : Start-stop asynchronous transmission
Connection method (RS-422-A/485) :4-wire half-duplex multi-drop connection
(1 : N where N = 1 to 31)
Transmission speed : 1200, 2400, 4800, 9600, 19200 or 38400 bps
Data length : 7 or 8 bits
Stop bit : 1 bitParity : Odd, even, or none
Communication distance (RS-422-A/485) :
Up to 1200 m
Communication mode : ASCII for input/output for control and setting
ASCII or binary for output of measured dataModbus : Mode : RTU SLAVE
Data type : Data read, data write
Wiring : 4 wires (for RS-422-A/485)
Fail/Memory End Output (/F1) :The relay contact output on the rear panel informs of the occurrence of a system error.
Another relay contact output informs of the time until end of the internal memory space
(selectable from 1, 2, 5, 10, 20, 50 or 100 hours) before the data is overwritten, or of thetime when the remaining space on the external storage medium reaches to 10% of
whole capacity.
Relay contact rating : 250 VAC (50/60 Hz)/3 A
250 VDC/0.1 A (for resistance load)

14-11
Sp
ecification
s
14
Clamped Input Terminal (/H2) :Clamped input terminal is used for input terminal.
Desk Top Type (/H5[ ]) :Provides carrying handle and power cord when /H5D, /H5F/, H5R, or /H5J is specified.
Computation Functions (/M1) :Can perfom computation, display the computed data assigned to channels in trends and
numerical values, and store computed data.Channels assignable to computed data :
RD-MV102, RD-MV104 : Up to 4 channels
RD-MV106, RD-MV112 : Up to 12 channels
Operation : General arithmetic operations :
Four arithmetic operations, square root, absolute,common logarithm, exponential, power, relational
operations (<, ≤, >, ≥, =, ≠), logical operations
(AND, OR, NOT, XOR)
Statistical operations : Average, maximum, minimum and
summationSpecial operations : Rolling average
Constant : Available (Up to 12 constants)
Digital input data via communication :
Digital data via communication can be used in calculation
expression (Up to 12 data)Remote input status : Remote input status (0/1) can be used in calculation
expression (Up to 8 inputs)
Report functions : Report type : Hourly, daily, daily + monthly and daily +
weekly
Operation : Average, maximum, minimum and summationData format : ASCII
14.6 Specifications of Optional Functions

14-12
3 terminal Isolated RTD Input (/N2) :A, B, b terminals are of isolated input type.* Can be specified only for RD-MV106 and RD-MV112.
A,B,b terminals of RD-MV102 and RD-MV104 are isolated as standard.
12 VDC Power Supply:Powered by 12 VDCFor related specifications, see “Power Supply,” “Normal Operating Conditions,” “Effects
of Operating Conditions,” and “Other Specifications” in section 14.7.
Rated power supply : 12 VDC
Allowable power supply voltage range :
10 to 18 VDCRated power consumption :
30 VA
Remote Control (/R1) :This option allows the following functions to be controlled remotely by a contact input (upto eight contact inputs) :
• Start/stop of memory (rising and falling edge)
• Trigger for event data acquisition (trigger, 250 ms or longer)
• Time adjustment (adjusting the time to a preset time upon contact signal, trigger, 250
ms or longer)
Time of Trigger-On Processing
Cut off reading of less than one minute.e.g. 10:00:50 is corrected as 10:00:00Round up reading of less than one minute.e.g. 10:59:50 is corrected as 11:00:00No process is to be performed.
hh:00:00 to hh:01:59
hh:58:00 to hh:59:59
hh:02:00 to hh:57:59
• Start/stop of computation (rising and falling edge)
• Reset of computation data (trigger, 250 ms or longer)
• Manual sample (trigger, 250 ms or longer)
• Message display (Up to 8 different messages can be set, trigger, 250 ms or longer)• Load of setting parameters (Up to 3 settings can be set, trigger, 250 ms or longer)
• Alarm acknowledgement (trigger, 250 ms or longer)
14.6 Specifications of Optional Functions
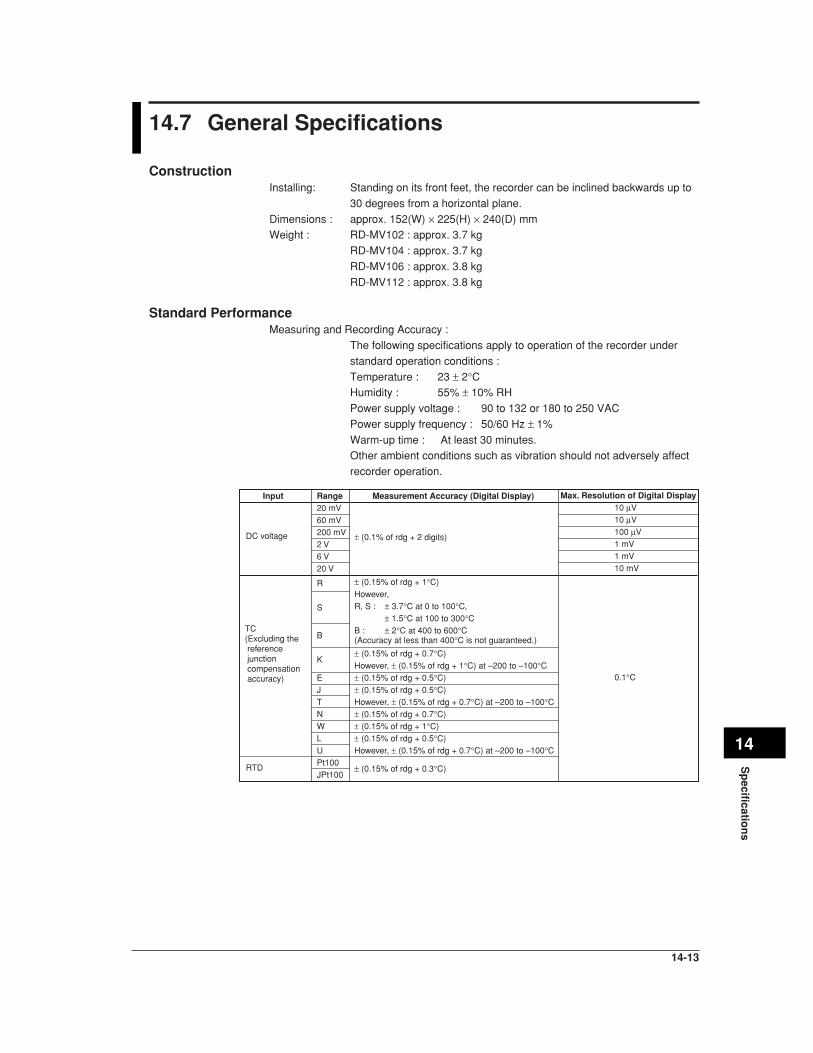
14-13
Sp
ecification
s
14
14.7 General Specifications
ConstructionInstalling: Standing on its front feet, the recorder can be inclined backwards up to
30 degrees from a horizontal plane.
Dimensions : approx. 152(W) × 225(H) × 240(D) mmWeight : RD-MV102 : approx. 3.7 kg
RD-MV104 : approx. 3.7 kg
RD-MV106 : approx. 3.8 kg
RD-MV112 : approx. 3.8 kg
Standard PerformanceMeasuring and Recording Accuracy :
The following specifications apply to operation of the recorder under
standard operation conditions :
Temperature : 23 ± 2°CHumidity : 55% ± 10% RH
Power supply voltage : 90 to 132 or 180 to 250 VAC
Power supply frequency : 50/60 Hz ± 1%
Warm-up time : At least 30 minutes.Other ambient conditions such as vibration should not adversely affect
recorder operation.
Input Range20 mV60 mV200 mV2 V6 V20 V
R
S
B
K
EJTNWLUPt100JPt100
Measurement Accuracy (Digital Display)
± (0.1% of rdg + 2 digits)
± (0.15% of rdg + 1°C)However, R, S : ± 3.7°C at 0 to 100°C,
± 1.5°C at 100 to 300°CB : ± 2°C at 400 to 600°C(Accuracy at less than 400°C is not guaranteed.)
± (0.15% of rdg + 0.7°C)However, ± (0.15% of rdg + 1°C) at –200 to –100°C± (0.15% of rdg + 0.5°C)± (0.15% of rdg + 0.5°C)However, ± (0.15% of rdg + 0.7°C) at –200 to –100°C± (0.15% of rdg + 0.7°C)± (0.15% of rdg + 1°C)± (0.15% of rdg + 0.5°C)However, ± (0.15% of rdg + 0.7°C) at –200 to –100°C
± (0.15% of rdg + 0.3°C)
DC voltage
TC (Excluding the reference junction compensation accuracy)
RTD
Max. Resolution of Digital Display10 µV10 µV100 µV1 mV1 mV10 mV
0.1°C
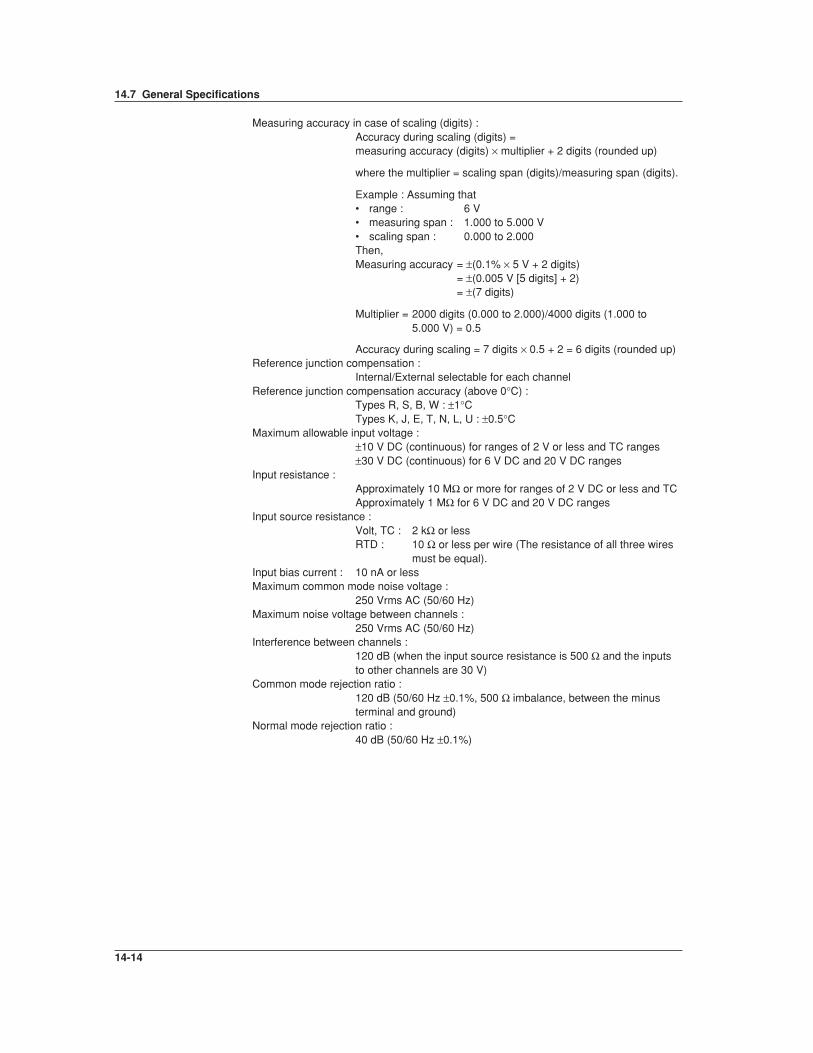
14-14
Measuring accuracy in case of scaling (digits) :Accuracy during scaling (digits) =measuring accuracy (digits) × multiplier + 2 digits (rounded up)
where the multiplier = scaling span (digits)/measuring span (digits).
Example : Assuming that• range : 6 V• measuring span : 1.000 to 5.000 V• scaling span : 0.000 to 2.000Then,Measuring accuracy = ±(0.1% × 5 V + 2 digits)
= ±(0.005 V [5 digits] + 2)= ±(7 digits)
Multiplier = 2000 digits (0.000 to 2.000)/4000 digits (1.000 to5.000 V) = 0.5
Accuracy during scaling = 7 digits × 0.5 + 2 = 6 digits (rounded up)Reference junction compensation :
Internal/External selectable for each channelReference junction compensation accuracy (above 0°C) :
Types R, S, B, W : ±1°CTypes K, J, E, T, N, L, U : ±0.5°C
Maximum allowable input voltage :±10 V DC (continuous) for ranges of 2 V or less and TC ranges±30 V DC (continuous) for 6 V DC and 20 V DC ranges
Input resistance :Approximately 10 MΩ or more for ranges of 2 V DC or less and TCApproximately 1 MΩ for 6 V DC and 20 V DC ranges
Input source resistance :Volt, TC : 2 kΩ or lessRTD : 10 Ω or less per wire (The resistance of all three wires
must be equal).Input bias current : 10 nA or lessMaximum common mode noise voltage :
250 Vrms AC (50/60 Hz)Maximum noise voltage between channels :
250 Vrms AC (50/60 Hz)Interference between channels :
120 dB (when the input source resistance is 500 Ω and the inputsto other channels are 30 V)
Common mode rejection ratio :120 dB (50/60 Hz ±0.1%, 500 Ω imbalance, between the minusterminal and ground)
Normal mode rejection ratio :40 dB (50/60 Hz ±0.1%)
14.7 General Specifications

14-15
Sp
ecification
s
14
Power SupplyRated power supply :100 to 240 VAC (automatic switching)
12 VDC/AC (for 12 VDC power supply model)Allowable power supply voltage range :
90 to 132 or 180 to 264 VAC10 to 18 VDC (for 12 VDC power supply model)
Rated power supply frequency :50/60 Hz (automatic switching, for AC)
Rated Power consumption :53 VA (except for /P1 model)30 VA (for 12 VDC power supply model)
Power consumption :Supply Voltage100 VAC240 VAC12 VDC
Backlight Saving Mode17 VA26 VA10VA
Normal20 VA30 VA11VA
Max.38 VA53 VA30VA
Normal Operating ConditionsPower supply voltage : 90 to 132 or 180 to 250 VAC
10 to 18 VDC (for 12 VDC power supply model)Power supply frequency : 50 Hz ±2%, 60 Hz ±2%Ambient temperature : 0 to 50°C (when using FDD or Zip drive : 5 to 40°C)Ambient humidity : 20% to 80% RH (at 5 to 40°C)Vibration : 10 to 60 Hz, 0.2 m/s2 or lessShock : Not acceptableMagnetic field : 400 A/m or less (DC and 50/60 Hz)Noise : Normal mode (50/60 Hz) :
Volt : The peak value including the signal must be less than1.2 times the measuring range.
TC : The peak value including the signal must be less than1.2 times the measuring thermal electromotive force.
RTD : 50 mV or lessCommon mode noise(50/60 Hz) :
250 Vrms AC or less for all rangesMaximum noise voltage between channels (50/60 Hz) :
250 Vrms AC or lessMounting position : Can be inclined up to 30 deg backward. Mounting at an angle
away from the perpendicular is not acceptable.Warm-up time : At least 30 minutes after power onAltitude : 2000 m or less
Effects of Operating ConditionsAmbient temperature : With temperature variation of 10°C :
±(0.1% of rdg + 1 digit) or less for Volt and TC rangesExcluding the error of reference junction compensation±(0.1% of rdg + 2 digit) or less for RTD ranges
Power supply : For 100 to 240 VAC power supply modelWith variation within 90 to 132 V and 180 to 250 VAC (50/60Hz) : ±1 digit or lessWith variation of ±2 Hz from rated power frequency (at 100VAC) : ±(0.1% of rdg + 1 digit) or lessFor 12 VDC power supply modelWith variation within 10 to 18 VDC :±1 digit or less
Magnetic field : AC (50/60 Hz) and DC 400 A/m fields :±(0.1% of rdg + 10 digits) or less
14.7 General Specifications

14-16
Input source resistance : (1) Volt range
With variation of +1 kΩ :Ranges of 2 V or less : within ±10 µV
Ranges of 6 V or greater : –0.1% of rdg or less
(2) TC range
With variation of +1 kΩ :
Within ±10 µV (±100 µV when the burnout upscale/downscale function is switched on)
(3) RTD range (Pt100)
With variation of 10 Ω per wire (resistance of all three
wires must be equal) :
±(0.1% of rdg + 1 digit) or lessWith maximum difference of 40 mohms between wires :
approximately 0.1°C
Transport and Storage ConditionsThe following specifies the environmental conditions required during transportation fromshipment to the start of service and during storage as well as during transportation and
storage if this instrument is temporarily taken out of service.
No malfunction will occur under these conditions with serious damage, which is
impossible to repair; however, calibration may be necessary to recover normal operation
performance.Ambient temperature : –25°C to 60°CHumidity : 5% to 95% RH (No condensation is allowed).
Vibration : 10 to 60 Hz, 4.9 m/s2 maximum
Shock : 392 m/s2 maximum (while being packed)
Other SpecificationsClock : With calendar function (year of grace)
The time can be adjusted by a remote contact (with theremote control option).
Daylight saving : Summer and wintertime can be set.
Accuracy of clock : ±100 ppm, excluding a delay (of 1 second, maximum) caused
each time the power is turned on.
Memory backup : A built-in lithium battery backs up the setup parameters(battery life : approximately ten years at room temperature).
Key lock function : ON/OFF and password can be set.
Key login function : Power on with log out mode and all key operations are not
permitted.
“User name”, “User ID” and “password” are required to enterthe operation mode.
Insulation resistance : Each terminal to ground terminal : 20 MΩ or greater (at 500
VDC)
14.7 General Specifications
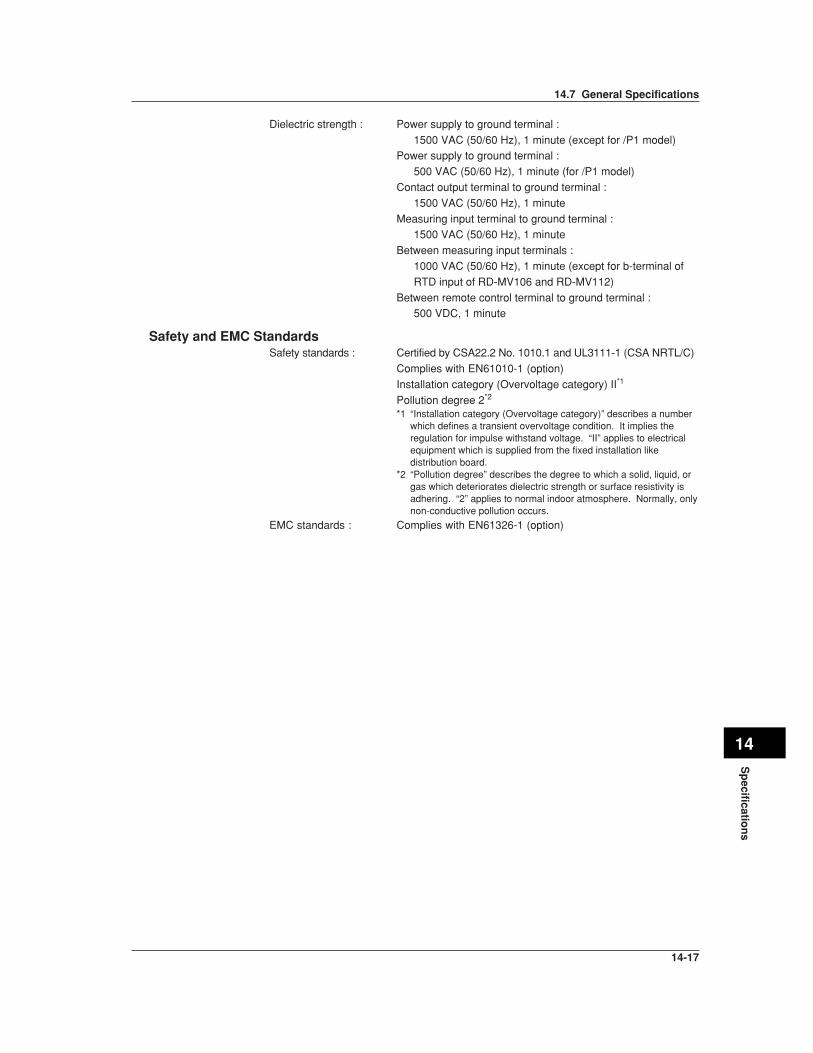
14-17
Sp
ecification
s
14
Dielectric strength : Power supply to ground terminal :
1500 VAC (50/60 Hz), 1 minute (except for /P1 model)Power supply to ground terminal :
500 VAC (50/60 Hz), 1 minute (for /P1 model)
Contact output terminal to ground terminal :
1500 VAC (50/60 Hz), 1 minute
Measuring input terminal to ground terminal :1500 VAC (50/60 Hz), 1 minute
Between measuring input terminals :
1000 VAC (50/60 Hz), 1 minute (except for b-terminal of
RTD input of RD-MV106 and RD-MV112)
Between remote control terminal to ground terminal :500 VDC, 1 minute
Safety and EMC StandardsSafety standards : Certified by CSA22.2 No. 1010.1 and UL3111-1 (CSA NRTL/C)
Complies with EN61010-1 (option)
Installation category (Overvoltage category) II*1
Pollution degree 2*2
*1 “Installation category (Overvoltage category)” describes a numberwhich defines a transient overvoltage condition. It implies theregulation for impulse withstand voltage. “II” applies to electricalequipment which is supplied from the fixed installation likedistribution board.
*2 “Pollution degree” describes the degree to which a solid, liquid, orgas which deteriorates dielectric strength or surface resistivity isadhering. “2” applies to normal indoor atmosphere. Normally, onlynon-conductive pollution occurs.
EMC standards : Complies with EN61326-1 (option)
14.7 General Specifications

14-18
14.8 Dimentional Drawings
Unit: mm(approv. inch)Rear View
151.7 (5.97)187.7 (7.39)
144 (5.67)
52 (2.05)
180
(7.0
9)14
.6 27°
29.8
(1.1
7)(0
.57)

App-1
Ap
pen
dix
App
Appendix
Appendix 1 Parameters and Initial Settings
Setting ModeInitial settings are thick-framed.
Parameters Menu Notes
Range Volt 20 mV 60 mV
6 V 20 V
200 mV 2 V Other parameters : Upper/lower limits of span
Other parameters : Upper/lower limits of span
Moving average Count Off 2 3 4
5 6 7 8
9 10 11 12
13 14 15 16
RD-MV106/RD-MV112
Trend/Save interval
Time/div 1 min 2 min 5 min
Aute save interval 10 min to 31 days
10 min
20 min 30 min 1 h 2 h
4 h
Filter
Alarm delay time 1 s to 3600 s
Off
10 s
2 s 5 s 10 s RD-MV102/RD-MV104
Message Characters No.1 to No.8
Up to other parameters set
Tag Tag Character string, Initial setting is “all space”
Character string
Character string
Alarm On/Off On Off
On OffRelay On/Off
Number I01 to I06
Scale Volt 20 mV 60 mV
6 V 20 V
200 mV 2 V Other parameters : Upper/lower limits of spanUpper/lower limits of scale
Other parameters : Upper/lower limits of spanUpper/lower limits of scale
Volt 20 mV 60 mV
6 V 20 V
200 mV 2 V Other parameters : Upper/lower limits of span
Delta
Sqrt
Skip
R r
Type H L h l
T t
Value Numerical value
Numerical value
Up to model types
Up to model types
TC R S B K
E J T N
W L U
TC R S B K
E J T N
W L U
RTD PT JPT
RTD PT JPT
20 mV 60 mV
20 V
200 mV 2 V
6 V
Unit
TC R S B K
E J T NW L U
RTD PT JPT
DI
Unit
Level Cont
DI
Ref. CH
Level Cont
Level ContDI
Other parameters : Upper/lower limits of span
File Header Character string, Initial setting is “all space”
Character string, Initial setting is “all space”
Directory name Character string, Initial setting is [DATA 0]
Save data Unsave All
1 h

App-2
Parameters Menu Notes
8
5 s 10 s 20 s 30 s
1 min
9 10 11
4 5 6 7
On Off
Off
LCD Brightness
Backlight saver
1 2 3 4
5 6 7 8
On Off
5 min 10 min1 min
30 min
2 min
1 h
Key Key + Alm
Numerical value
Restore
Grid
Scroll
View
Partial
1 2 3
1 2 3
Trend line
Trip line
Boundary
On/Off
On/Off
Saver time
Expand
Group number
Group name
CH set See section 7.6 for initial settings.
CH1 to CH12
Lower
Division
Bar graph
Scale position
Upper
Trip line
1 2 3 4
GROUP 1 GROUP 2 GROUP 3 GROUP 4
Fixed
Character string
Numerical value
Initial values are No.1 : Red, No.2 : Green, No.3 : Blue, No.4 : Yellow
Horizontal Vertical
White Black
Direction Trend
Bar graph
Horizontal Vertical
Background
On Off
Color
Position
On/Off
Red Green Blue B. violet
Brown Orange Y. green Lightblue
Violet Gray Lime Cyan
Darkblue Yellow Lightgray Purple
See section 14.2 for initial settings.
Numerical value
Red Green Blue B. violet
Brown Orange Y. green Lightblue
Violet Gray Lime Cyan
Darkblue Yellow Lightgray Purple
12
Center
8 9 10 11
4 5 6 7
1 2 3 4
5 6 7 8
9 10
Normal
0 to 95
5 to 100
Group set
Color
Zone
Graph
CH31 to CH60 Red Green Blue B. violet
Brown Orange Y. green Lightblue
Violet Gray Lime Cyan
Darkblue Yellow Lightgray Purple
Math color
Lower
Upper
Numerical value0 to 95
5 to 100
Math Zone
See section 14.2 for initial settings.
On
1 to 99
1 to 99
On/Off Off
Numerical value
Math partial
Boundary
Expand
Appendix 1 Parameters and Initial Settings
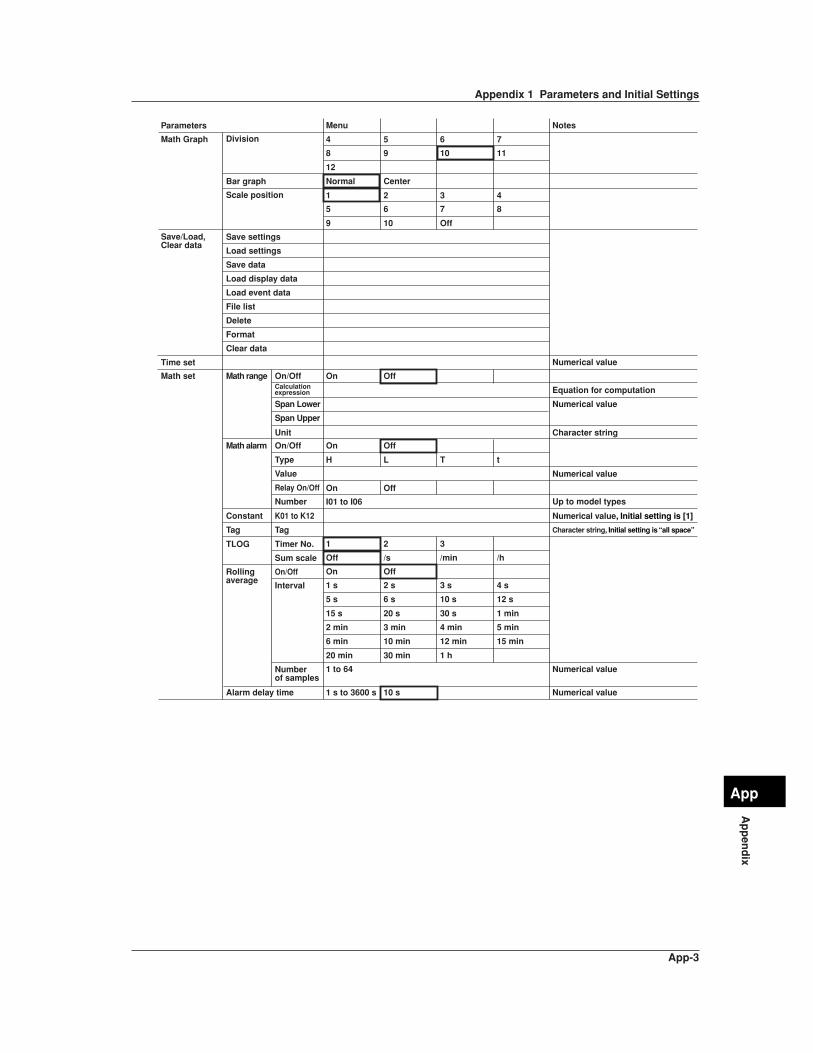
App-3
Ap
pen
dix
App
Parameters Menu Notes
Rolling average
Save/Load, Clear data
Save settings
Load settings
Save data
Load display data
Load event data
File list
Delete
Format
Clear data
Math range On/OffCalculation expression Equation for computation
Span Lower Numerical value
Span Upper
Unit Character string
On Off
Math alarm On/Off
Constant K01 to K12
Tag Tag
TLOG Timer No.
Type
Value
Relay On/Off
Number
On Off
On Off
H L T t
Division
Bar graph
Scale position
Numerical value
Numerical value
Numerical value, Initial setting is [1]
Numerical value
Numerical value
Character string, Initial setting is “all space”
12
Center
8 9 10 11
4 5 6 7
1 2 3 4
5 6 7
Off
8
9 10
Normal
Math set
Alarm delay time 1 s to 3600 s 10 s
Time set
Math Graph
1 2 3
Sum scale Off /s /min /h
On/Off On Off
Interval 1 s 2 s 3 s 4 s
5 s 6 s 10 s 12 s
15 s 20 s 30 s 1 min
2 min 3 min 4 min 5 min
6 min 10 min 12 min 15 min
20 min
1 to 64Number of samples
30 min 1 h
I01 to I06 Up to model types
Appendix 1 Parameters and Initial Settings

App-4
Basic Setting ModeInitial settings are thick-framed.
Parameters Menu Notes
Alarm Reflash
Action
On Off
None I01 Up to model types
RD-MV102/RD-MV104
100 ms is for DX106 and RD-MV112 only
RD-MV106/RD-MV112
Numerical value
AND I01 - I02 I01 - I03
I01 - I04 I01 - I05 I01 - I06
Energize De-energ
Behavior Hold Nonhold
Indicator Hold Nonhold
Hysterisis On Off
Relay
Memory Save
Data
Auto Manual
Memory and trend
Meas CH/Math CH
First-CH
Last-CH
Meas CH Math CH
AUX Tag/Channel Tag Channel
Language English Japanese
Partial
Batch
Use
Use Not
Not
On/Off On Off
Display E + D
Up to other parameters set
1, 2, and 4 when [Data] is set to [E + D]
125 ms, 250 ms, and 500 ms arefor RD-MV102 and RD-MV104 only
Up to model types
For models with /BT1
Event Sample rate
Mode
Event
125 ms 250 ms 500 ms 1 s
2 s 5 s
120 s
10 s 30 s
Block 1
Data length 3 min to 31 days
2 4 8
Pre-trigger 0 5 25 50
75 95 100
Memory alarm 1 h 2 h 5 h 10 h
German French
20 h 50 h 100 h
16
60 s
Trigger
Key On Off
External On Off
Alarm On Off
Free Trigger Rotate
Auto 50 Hz 60 Hz 100 msIntegrate
125 ms 250 msScaninterval
1 s 2 s
Off Up DownBurnout set
Internal External
Volt (µV)
RJC
A/D
1 2IncreaseDecrease
3 4
5 6 7 8
9 10 11 12
13 14 15
Rate of change
Appendix 1 Parameters and Initial Settings
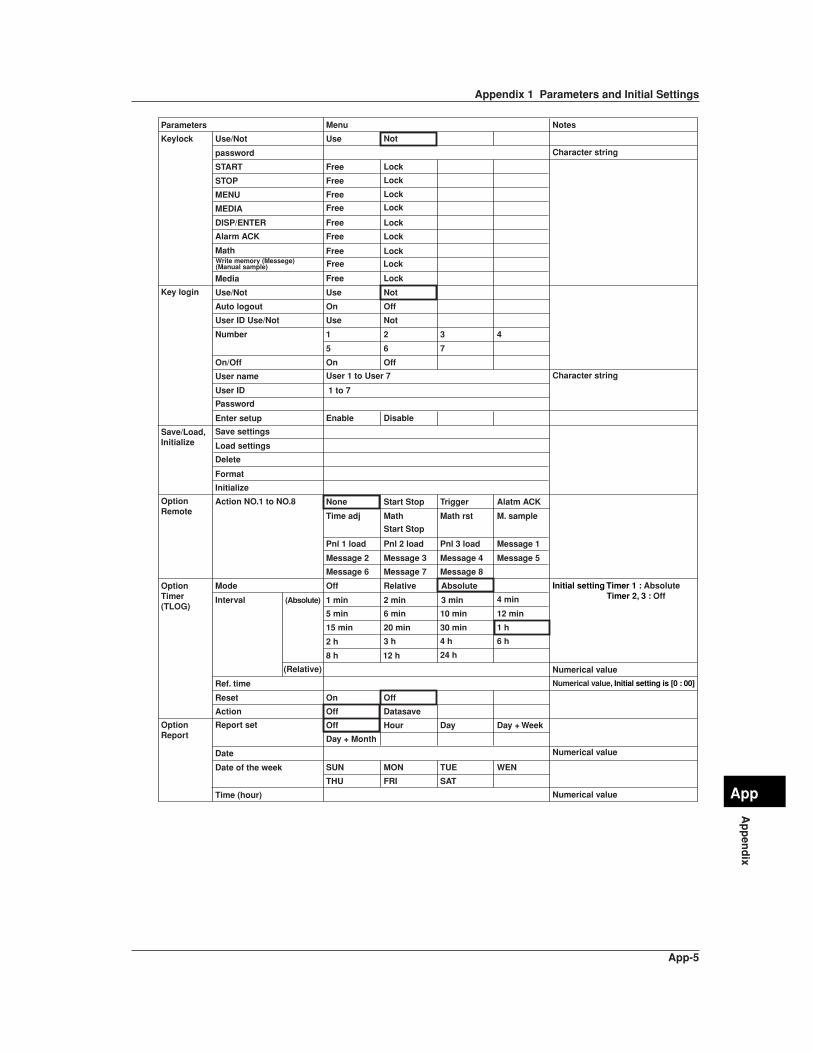
App-5
Ap
pen
dix
App
Parameters Menu Notes
15 min
2 h
20 min 30 min
3 h
1 h
5 min 6 min 10 min 12 min
24 h
4 h 6 h
4 min
8 h 12 h
Reset
Action
On Off
Off Datasave
Day Day + WeekOff
Day + Month
Hour
Numerical value
Initial setting Timer 1 : AbsoluteTimer 2, 3 : Off
Numerical value
Numerical value
Numerical value, Initial setting is [0 : 00]
Date
Option Remote
Off Relative Absolute
1 min 2 min 3 min
ModeOption Timer(TLOG)
Report setOption Report
Interval (Absolute)
(Relative)
Ref. time
DISP/ENTER
Alarm ACK
Math
Password
Save settings
Format
Initialize
Load settings
Delete
Enter setup
Write memory (Messege) (Manual sample)
Media
Free Lock
Free Lock
Free Lock
Free Lock
Character string
Character string
Action NO.1 to NO.8
Free Lock
Use Not
On Off
Use Not
1 2 3 4
5 6 7
On
User 1 to User 7
1 to 7
Off
Use/Not
Auto logout
User ID Use/Not
Number
On/Off
User name
User ID
Disable
None Start Stop Trigger Alatm ACK
Time adj Math
Start Stop
Math rst M. sample
Pnl 1 load Pnl 2 load Pnl 3 load Message 1
Message 2 Message 3 Message 4 Message 5
Message 6 Message 7 Message 8
Enable
Keylock
Key login
Save/Load, Initialize
Use/Not
password
START
STOP
MENU
MEDIA
Use Not
Free Lock
Free Lock
Free Lock
Free Lock
Date of the week
Time (hour)
SUN MON TUE WEN
THU FRI SAT
Appendix 1 Parameters and Initial Settings
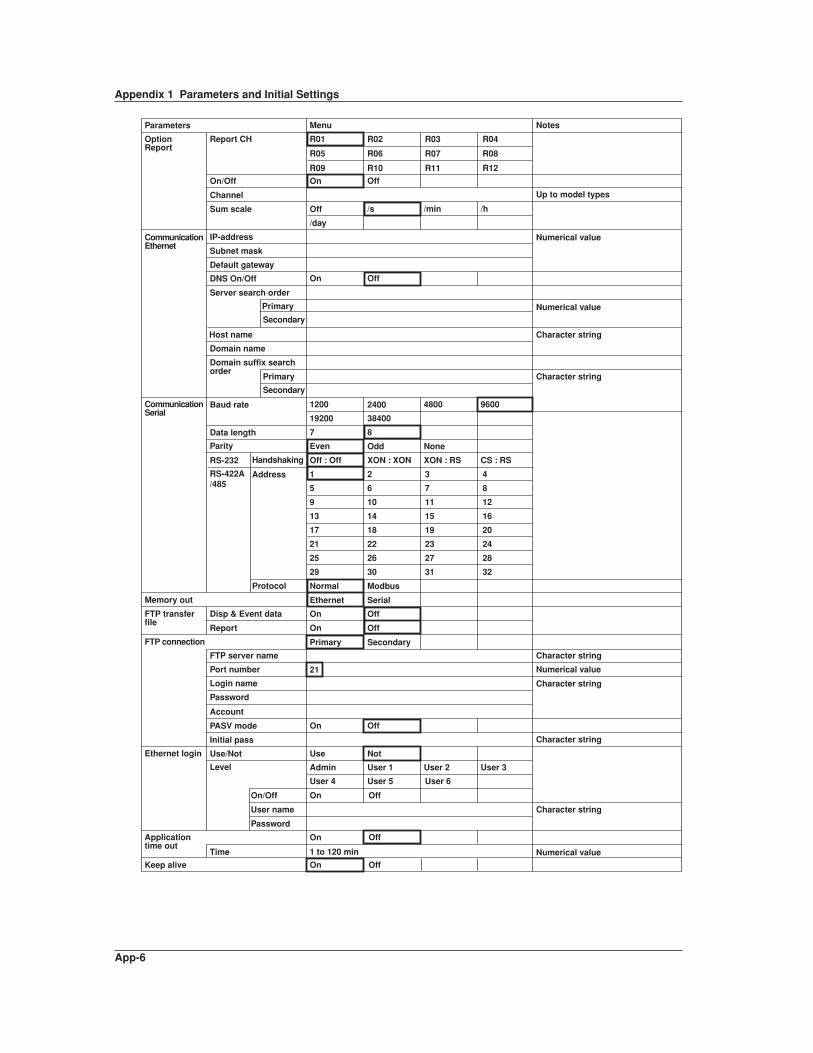
App-6
Parameters Menu Notes
21
Initial pass
Use/Not
On Off
Use Not
User 2 User 3Admin
User 4 User 5 User 6
User 1
Character string
Character string
Character string
Character string
Character string
Character string
Numerical value
Numerical value
On Off
Primary Secondary
Memory out
FTP transferfile
FTP connection
Level
Time
Ethernet login
Disp & Event data
Report
FTP server name
Port number
Login name
Password
Account
PASV mode
Default gateway
DNS On/Off
Server search order
Parity
RS-422A/485
RS-232
Up to model types
Numerical value
Numerical value
On Off
1200 2400
19200 38400
7 8
4800 9600
Host name
Domain name
Domain suffix search order
Primary
Secondary
Primary
Secondary
Handshaking
Address
Protocol
On/Off On Off
1 to 120 min
Off
User name
Password
Baud rate
Data length
XON : XON XON : RS CS : RS
Normal Modbus
Ethernet Serial
On Off
Off : Off
1 2 3 4
5 6 7 8
9 10 11 12
13 14 15 16
17 18 19 20
21 22 23 24
25 26 27 28
29 30 31 32
Odd NoneEven
Option Report
Report CH R01 R02 R03 R04
R05 R06 R07 R08
R09 R10 R11 R12
Communication Ethernet
Communication Serial
On/Off
Channel
Sum scale
IP-address
Subnet mask
On Off
Off /s /min /h
/day
Application time out
On
On
OffKeep alive
Appendix 1 Parameters and Initial Settings

App-7
Ap
pen
dix
App
Appendix 2 Data Formats of ASCII Files
This section describes the data format of the ASCII file. The RD-MV100 creates two
types of ASCII files, the manual sampled data file and the report file.
Data Format of the Manual Sampled Data File• The manual sampled data are output in ASCII format using values and strings that are
separated by commas.
• The channel/tag, unit, and manual sampled values are not output for channels in
which the input range is set to [Skip] or for which the computation is turned OFF.
ExampleThe following example is for channels 1, 2, 3, 4, and 31.
“MANUAL SAMPLE DATA”
“Model Serial No.:”, “XXXXXXXXXXXXXXXX”“File Header : ”, “AAAAAAAAAAAAAAAAAAAAAAAAAAAAAAAA”
“CH/TAG”, 1 “CH01 ”, “CH02 ”, “CH03 ”, “CH04 ”, “CH31 ”
“UNIT”, “V ”, “V ”, “V ”, “V ”, “mV ”
2000/01/01 01:08:43, 0.000, 0.000, 0.000, -0.014, 12.002000/01/01 01:08:48, 0.000, 0.000, 0.000, -0.014, 12.00
2000/01/01 01:09:15, 0.000, 0.000, 0.000, -0.014, 12.00
“CH/TAG”, 1 “CH01 ”, “CH02 ”, “CH03 ”, “CH04 ”, “CH31 ”
“UNIT”, “V ”, “V ”, “V ”, “V ”, “V ”
2000/01/01 01:15:30, 0.000, 0.000, 0.000, -0.014, 12.00
2000/01/01 01:18:12, 0.000, 0.000, 0.000, -0.014, 12.00
Data size• Size of the header section
The following equation can be used to derive the size of the header section.
Title + carriage return line feed + serial number + carriage return line feed + fileheader + carriage return line feed + channel/tag (8 + 19 × number of channelsthat are output) + carriage return line feed + unit (6 + 9 × number of channelsthat are output) + carriage return line feed• The size of the title is fixed to 20 bytes.
• The size of the serial number is fixed to 38 bytes.
• The size of the file header is fixed to 49 bytes.• The size of the carriage return line feed is fixed to 2 bytes.
Calculation exampleManual sampled data for 30 channels
20 + 2 + 38 + 2 + 49 + 2 + (8 + 19 × 30) + 2 + (6 + 9 × 30) + 2 = 971 bytes
• Size of the data section of one data setThe following equation can be used to derive the size of data section of one data set.
Date and time of manual sampling + measured value(8 × number ofmeasurement channe) + computed value (10 × number of computationchannels) + carriage return line feed• The size of the date and time of creation is fixed to 19 bytes.
• The size of the carriage return line feed is fixed to 2 bytes.
Calculation exampleManual sampled data for 30 measurement channels
19 + (8 × 30) + (10 × 0) + 2 = 261 bytes
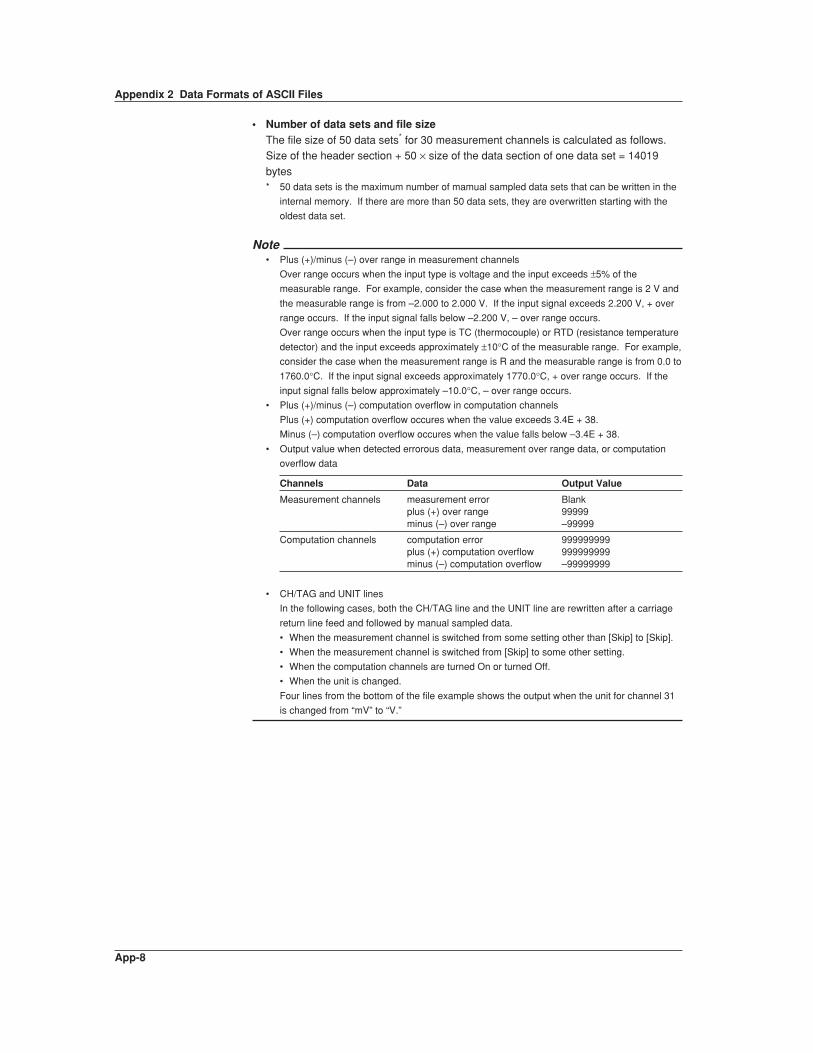
App-8
• Number of data sets and file sizeThe file size of 50 data sets* for 30 measurement channels is calculated as follows.Size of the header section + 50 × size of the data section of one data set = 14019
bytes* 50 data sets is the maximum number of mamual sampled data sets that can be written in the
internal memory. If there are more than 50 data sets, they are overwritten starting with the
oldest data set.
Note• Plus (+)/minus (–) over range in measurement channels
Over range occurs when the input type is voltage and the input exceeds ±5% of the
measurable range. For example, consider the case when the measurement range is 2 V and
the measurable range is from –2.000 to 2.000 V. If the input signal exceeds 2.200 V, + over
range occurs. If the input signal falls below –2.200 V, – over range occurs.
Over range occurs when the input type is TC (thermocouple) or RTD (resistance temperature
detector) and the input exceeds approximately ±10°C of the measurable range. For example,
consider the case when the measurement range is R and the measurable range is from 0.0 to
1760.0°C. If the input signal exceeds approximately 1770.0°C, + over range occurs. If the
input signal falls below approximately –10.0°C, – over range occurs.
• Plus (+)/minus (–) computation overflow in computation channels
Plus (+) computation overflow occures when the value exceeds 3.4E + 38.
Minus (–) computation overflow occures when the value falls below –3.4E + 38.
• Output value when detected errorous data, measurement over range data, or computation
overflow data
Channels Data Output Value
Measurement channels measurement error Blankplus (+) over range 99999minus (–) over range –99999
Computation channels computation error 999999999plus (+) computation overflow 999999999minus (–) computation overflow –99999999
• CH/TAG and UNIT lines
In the following cases, both the CH/TAG line and the UNIT line are rewritten after a carriage
return line feed and followed by manual sampled data.
• When the measurement channel is switched from some setting other than [Skip] to [Skip].
• When the measurement channel is switched from [Skip] to some other setting.
• When the computation channels are turned On or turned Off.
• When the unit is changed.
Four lines from the bottom of the file example shows the output when the unit for channel 31
is changed from “mV” to “V.”
Appendix 2 Data Formats of ASCII Files

App-9
Ap
pen
dix
App
Data Format of the Report File• The hourly, daily, weekly, and monthly reports are output in ASCII format using values
and strings that are separated by commas.
• The channel/tag, unit, average value, maximum value, minimum value, and sum value
are not output for channels in which the input range is set to [Skip] or for which the
computation is turned OFF.
ExampleThe following example is the daily report for four channels.
“DAILY REPORT”, “START TIME”, 2000/01/31 20:00
“Model Serial No.:”, “XXXXXXXXXXXXXXXX”
“File Header:”, “AAAAAAAAAAAAAAAAAAAAAAAAAAAAAAAA”
“CH/TAG”, “CH01 ”, “CH02 ”, “CH03 ”, “CH04 ”
“UNIT”, “V ”, “V ”, “V ”, “V ”
2000/01/01 00:00, “ C”, “ C”, “ C”, “ C”
“AVE”, 0.00, 0.10, 0.20, 0.30
“MAX”, 0.00, 1.00, 2.00, 3.00
“MIN”, 0.00, -1.00, -2.00, -3.00“SUM”, 0.000000E-01, 1.000000E+04, 2.000000E+04, 3.000000E+04
Status• Various events that occur while creating the report data are saved as status data and
output in the report.• The positions of the various statuses in the report are fixed.
E : Error (an error is detected)O : Over (an over range/computation overflow is detected)
P : Power failure (a power disruption has occurred)
C : Change (the time has been changed)
Data size• Size of the header section
The following equation can be used to derive the size of the header section.
Title + carriage return line feed + serial number + carriage return line feed + fileheader + carriage return line feed + channel/tag (8 + 19 × number of channelsthat are output) + carriage return line feed + unit (6 + 9 × number of channelsthat are output) + carriage return line feed• The size of the title varies depending on the report type as follows.
• For hourly reports (HOURLY) : 45 bytes
• For daily reports (DAILY) : 44 bytes
• For weekly reports (WEEKLY) : 45 bytes• For monthly reports (MONTHLY) : 46 bytes
• The size of the serial number is fixed to 38 bytes.
• The size of the file header is fixed to 49 bytes.
• The size of the carriage return line feed is fixed to 2 bytes.
Calculation exampleMonthly data for 30 channels
46 + 2 + 38 + 2 + 49 + 2 + (8 + 19 × 30) + 2 + (6 + 9 × 30) + 2 = 997 bytes
Appendix 2 Data Formats of ASCII Files

App-10
• Size of the data section of one report data setThe following equation can be used to derive the size of data section of one reportdata.
Carriage return line feed + date and time of creation + status (11 × number ofchannels that are output) + carriage return line feed + average value (5 + 14 ×number of channels that are output) + carriage return line feed + maximumvalue (5 + 14 × number of channels that are output) + carriage return line feed +minimum value (5 + 14 × number of channels that are output) + carriage returnline feed + sum value (5 + 14 × number of channels that are output) + carriagereturn line feed• The size of the date and time of creation is fixed to 16 bytes.
• The size of the carriage return line feed is fixed to 2 bytes.
Calculation exampleMonthly data for 30 channels
2 + 16 + (11 × 30) + 2 + (5 + 14 × 30) + 2 + (5 + 14 × 30) + 2 + (5 + 14 × 30) + 2 + (5 +
14 × 30) + 2 = 2058 bytes
• Number of report data sets and file sizeThe file size varies depending on the number of report data sets as follows.
• One report data set of monthly reports
Size of the header section + size of the data section of one report data set = 3055bytes
• 40 report data sets* of monthly reports
Size of the header section + 40 × size of the data section of one report data set =
83317 bytes* 40 report data sets is the maximum number of report data sets that can be written in the
internal memory. If there are more than 40 data sets, they are cleared starting with the
oldest data set.
Note• When the measurement and computation channel data enter the condition described in the
following table, status “E” and “O” are output in the report.
Data Condition Status
Common to measurement and computation channelsMeasurement error or computation error E
For measurement channelsPlus (+) over range OMinus (–) over range OOver range occurs when the input type is voltage and the input exceeds ±5% of themeasurable range.For example, consider the case when the measurement range is 2 V and the measurablerange is from –2.000 to 2.000 V. If the input signal exceeds 2.200 V, + over range occurs.If the input signal falls below –2.200 V, – over range occurs.Over range occurs when the input type is TC (thermocouple) or RTD (resistancetemperature detector) and the input exceeds approximately ±10°C of the measurablerange. For example, consider the case when the measurement range is R and themeasurable range is from 0.0 to 1760.0°C. If the input signal exceeds approximately1770.0°C, + over-range occurs. If the input signal falls below approximately –10.0°C, –over range occurs.
For computation channels+ computation overflow (when the value exceeds 3.4E + 38) O– computation overflow (when the value falls below –3.4E + 38) O
Appendix 2 Data Formats of ASCII Files
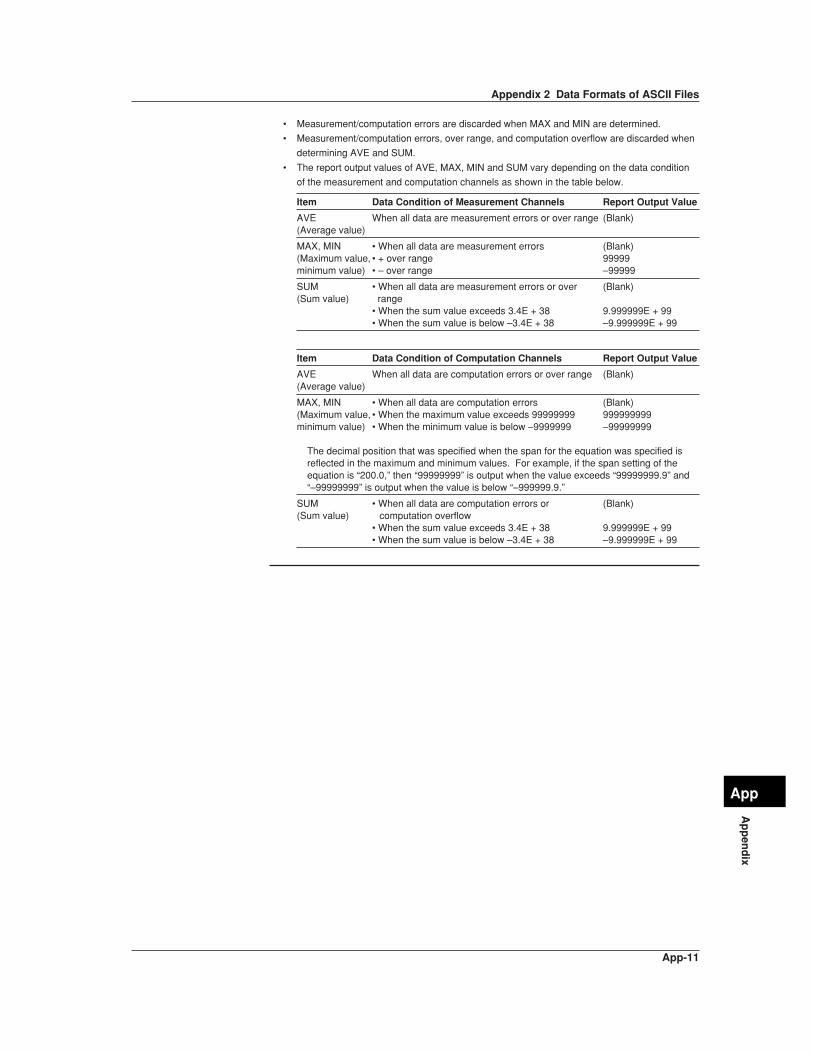
App-11
Ap
pen
dix
App
• Measurement/computation errors are discarded when MAX and MIN are determined.
• Measurement/computation errors, over range, and computation overflow are discarded when
determining AVE and SUM.
• The report output values of AVE, MAX, MIN and SUM vary depending on the data condition
of the measurement and computation channels as shown in the table below.
Item Data Condition of Measurement Channels Report Output Value
AVE When all data are measurement errors or over range (Blank)(Average value)
MAX, MIN • When all data are measurement errors (Blank)(Maximum value, • + over range 99999minimum value) • – over range –99999
SUM • When all data are measurement errors or over (Blank)(Sum value) range
• When the sum value exceeds 3.4E + 38 9.999999E + 99• When the sum value is below –3.4E + 38 –9.999999E + 99
Item Data Condition of Computation Channels Report Output Value
AVE When all data are computation errors or over range (Blank)(Average value)
MAX, MIN • When all data are computation errors (Blank)(Maximum value, • When the maximum value exceeds 99999999 999999999minimum value) • When the minimum value is below –9999999 –99999999
The decimal position that was specified when the span for the equation was specified isreflected in the maximum and minimum values. For example, if the span setting of theequation is “200.0,” then “99999999” is output when the value exceeds “99999999.9” and“–99999999” is output when the value is below “–999999.9.”
SUM • When all data are computation errors or (Blank)(Sum value) computation overflow
• When the sum value exceeds 3.4E + 38 9.999999E + 99• When the sum value is below –3.4E + 38 –9.999999E + 99
Appendix 2 Data Formats of ASCII Files

Index-1
Ind
ex
Index
Index
C
calculation expression ................................................... 11-10
calibration ........................................................................ 13-3
channels to be stored .......................................................8-22
comment .............................................................. 1-22, 10-16
common logarithm ........................................................... 11-4
communication .................................................................. 1-1
computation
communication input data ............................................. 11-2
constant ...................................................................... 11-14
data dropout ................................................................. 11-9
type ..................................................................... 1-20, 11-1
computation overflow ..................................................... App-8
Cont .................................................................................... 5-5
D
daily report .......................................................... 11-22, 11-26
data acquisition ................................................................... 8-3
data format ............................................................. 8-6, App-7
data type ..................................................................... 8-1, 8-3
date and time .................................................................... 3-23
DC current ........................................................................... 5-2
DC voltage .......................................................................... 5-1
delay lower limit alarm .............................................. 1-18, 6-7
delay upper limit alarm .............................................. 1-18, 6-7
deleting directories .................................................... 9-9, 9-12
deleting files .............................................................. 9-9, 9-12
Delta .................................................................................... 5-7
DI ........................................................................................ 5-5
difference computation ........................................................ 5-7
difference lower limit alarm ....................................... 1-18, 6-6
difference upper limit alarm ....................................... 1-18, 6-6
digital input .......................................................................... 5-5
digital screen ............................................................... 1-9, 4-5
dimentional drawings ...................................................... 14-18
directory name .................................................................. 8-20
display color ...................................................................... 7-12
display conditions of the LCD ........................................... 1-14
display data ......................................................................... 8-3
sampling interval ............................................................. 7-3
setting ........................................................................... 8-23
start/stop ....................................................................... 8-12
display function ................................................................... 1-5
displayed data ....................................................................1-7
displayed language ........................................................ 10-14
A
absolute value ................................................................... 11-4
access lamp ........................................................................ 3-2
accessories ............................................................................ v
alarm
hysteresis ..................................................................... 6-11
indication hold/non-hold ................................................ 6-10
release ............................................................................ 6-1
setting ............................................................................. 6-5
wiring .............................................................................. 2-7
Alarm ACK .......................................................................... 6-1
alarm function ................................................................... 1-17
alarm hysteresis ................................................................ 1-19
alarm output relay
AND/OR ........................................................................ 6-10
energized/de-energized ................................................ 6-10
hold/non-hold ................................................................ 6-10
reflash ........................................................................... 6-10
alarm summary ....................................................... 1-10, 4-13
AND/OR ............................................................................ 6-12
arithmetical computations ................................................. 11-4
ASCII file ........................................................................ App-7
ATA flash memory card ....................................................... 3-5
formatting ............................................................ 9-11, 9-12
auto logout ........................................................................ 10-5
auto save ................................................................ 8-10, 8-16
auto save interval .............................................................. 8-18
B
background color .............................................................. 7-23
backlight saver .................................................................. 7-25
bar graph
base position ................................................................ 7-15
display direction ............................................................ 7-23
screen ............................................................................. 4-5
bar graph screen ................................................................. 1-9
basic setting mode .............................................................. 3-7
configuration ................................................................. 3-11
initial settings ............................................................. App-4
key operation ................................................................ 3-19
menu ............................................................................. 3-17
parameters ................................................................ App-4
battery replacement ......................................................... 13-5
brightness ........................................................................ 7-25
burnout .................................................................... 1-3, 5-15

Index-2
E
E + D ................................................................................ 8-24
eject button ........................................................................ 3-2
entering characters .......................................................... 3-22
entering numbers ............................................................. 3-21
error messages ................................................................ 12-1
Ethernet port ...................................................................... 3-3
event data ...........................................................................8-4
block .............................................................................8-24
data length .................................................................. 8-24
free ...............................................................................8-13
pre-trigger ............................................................ 8-5, 8-24
rotate ........................................................................... 8-14
sampling interval ......................................................... 8-24
setting ...........................................................................8-24
start/stop ..................................................................... 8-13
trigger ........................................................ 8-5, 8-14, 8-24
external storage medium condition ................................... 4-4
F
FAIL/Memory End ............................................................. 1-26
wiring .............................................................................. 2-9
file header ......................................................................... 8-20
file name ............................................................................. 8-2
filter ........................................................................... 1-3, 5-14
Floppy disk .......................................................................... 3-5
formatting ............................................................ 9-11, 9-12
free space ........................................................................... 9-8
front panel ........................................................................... 3-1
FUNC key ........................................................................... 3-8
functional ground terminal ...................................................... ii
fuse replacement .............................................................. 13-2
G
group ................................................................................... 1-5
display .......................................................... 4-5, 4-7, 4-19
setting ............................................................................. 7-8
H
H ................................................................................. 4-9, 6-6
h .................................................................................. 4-9, 6-6
historical trend ................................................................... 1-12
from external storage medium ................................ 9-6, 9-7
screen ........................................................................... 4-18
hourly report ........................................................ 11-22, 11-26
I
information screen ............................................................ 4-13
initializing setup data ......................................................... 9-15
input terminal ...................................................................... 2-4
input type ............................................................................ 1-2
integration time ......................................................... 1-4, 5-15
internal memory
capacity .......................................................................... 8-6
clearing data ................................................................. 9-14
saving data ..................................................................... 9-5
internal memory condition ................................................... 4-3
K
key lock ......................................................... 1-24, 10-1, 10-2
key login/logout ............................................. 1-24, 10-4, 10-6
key login/logout log ........................................................... 10-9
L
L .................................................................................. 4-9, 6-6
l ................................................................................... 4-9, 6-6
LCD ..................................................................................... 1-5
LCD screen ......................................................................... 3-1
Level ................................................................................... 5-5
loading setup data
basic setting mode .......................................................... 9-4
setting mode ................................................................... 9-2
log ........................................................................... 1-25, 10-8
logical computation ........................................................... 11-5
lot number ............................................................. 1-22, 10-15
lower limit alarm ........................................................ 1-17, 6-6
lower limit on rate-of-change alarm ........................... 1-18, 6-7
M
MAC address .................................................................... 10-8
maintenance ..................................................................... 13-1
manual sample .......................................................... 8-9, 8-26
data format ................................................................ App-7
manual save ............................................................ 8-10, 8-15
memory end relay output time ........................................ 10-10
memory summary ................................................... 1-11, 4-13
message ..................................................................... 7-4, 7-7
message summary .................................................. 1-11, 4-13
model .................................................................................... iv
monthly report ..................................................... 11-22, 11-26
moving average ........................................................ 1-3, 5-14
N
NOT .................................................................................. 11-6
Index
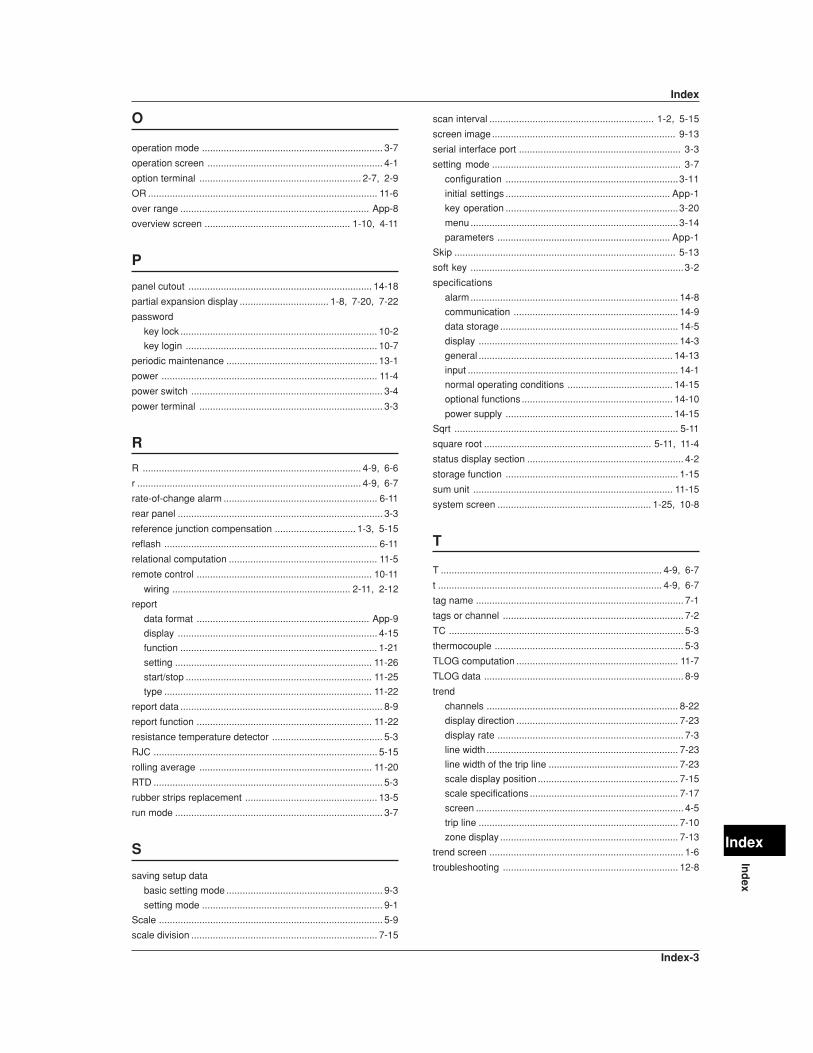
Index-3
Ind
ex
Index
O
operation mode ................................................................... 3-7
operation screen ................................................................. 4-1
option terminal ............................................................ 2-7, 2-9
OR ..................................................................................... 11-6
over range ...................................................................... App-8
overview screen ...................................................... 1-10, 4-11
P
panel cutout .................................................................... 14-18
partial expansion display ................................. 1-8, 7-20, 7-22
password
key lock ......................................................................... 10-2
key login ....................................................................... 10-7
periodic maintenance ........................................................ 13-1
power ................................................................................ 11-4
power switch ....................................................................... 3-4
power terminal .................................................................... 3-3
R
R ................................................................................. 4-9, 6-6
r ................................................................................... 4-9, 6-7
rate-of-change alarm ......................................................... 6-11
rear panel ............................................................................ 3-3
reference junction compensation .............................. 1-3, 5-15
reflash ............................................................................... 6-11
relational computation ....................................................... 11-5
remote control ................................................................. 10-11
wiring .................................................................. 2-11, 2-12
report
data format ................................................................ App-9
display .......................................................................... 4-15
function ......................................................................... 1-21
setting ......................................................................... 11-26
start/stop ..................................................................... 11-25
type ............................................................................. 11-22
report data ........................................................................... 8-9
report function ................................................................. 11-22
resistance temperature detector ......................................... 5-3
RJC ................................................................................... 5-15
rolling average ................................................................ 11-20
RTD ..................................................................................... 5-3
rubber strips replacement ................................................. 13-5
run mode ............................................................................. 3-7
S
saving setup data
basic setting mode .......................................................... 9-3
setting mode ................................................................... 9-1
Scale ................................................................................... 5-9
scale division ..................................................................... 7-15
scan interval ............................................................. 1-2, 5-15
screen image.................................................................... 9-13
serial interface port ............................................................ 3-3
setting mode ...................................................................... 3-7
configuration ................................................................3-11
initial settings ............................................................. App-1
key operation ................................................................3-20
menu .............................................................................3-14
parameters ................................................................ App-1
Skip .................................................................................. 5-13
soft key ...............................................................................3-2
specifications
alarm............................................................................. 14-8
communication ............................................................. 14-9
data storage .................................................................. 14-5
display .......................................................................... 14-3
general ........................................................................ 14-13
input .............................................................................. 14-1
normal operating conditions ....................................... 14-15
optional functions ........................................................ 14-10
power supply .............................................................. 14-15
Sqrt ................................................................................... 5-11
square root .............................................................. 5-11, 11-4
status display section .......................................................... 4-2
storage function ................................................................ 1-15
sum unit .......................................................................... 11-15
system screen ......................................................... 1-25, 10-8
T
T .................................................................................. 4-9, 6-7
t ................................................................................... 4-9, 6-7
tag name ............................................................................. 7-1
tags or channel ................................................................... 7-2
TC ....................................................................................... 5-3
thermocouple ...................................................................... 5-3
TLOG computation ............................................................ 11-7
TLOG data .......................................................................... 8-9
trend
channels ....................................................................... 8-22
display direction ............................................................ 7-23
display rate ..................................................................... 7-3
line width ....................................................................... 7-23
line width of the trip line ................................................ 7-23
scale display position .................................................... 7-15
scale specifications ....................................................... 7-17
screen ............................................................................. 4-5
trip line .......................................................................... 7-10
zone display .................................................................. 7-13
trend screen ........................................................................ 1-6
troubleshooting ................................................................. 12-8
Index

Index-4
U
unit .............................................................. 5-10, 5-12, 11-11
unsave .............................................................................. 8-21
upper limit alarm ....................................................... 1-17, 6-6
upper limit on rate-of-change alarm .......................... 1-18, 6-6
user ID .............................................................................. 10-6
user name ......................................................................... 10-7
V
Volt ...................................................................................... 5-1
volume name .................................................................... 9-11
W
weekly report ....................................................... 11-22, 11-26
wiring
alarm output .................................................................... 2-7
FAIL/Memory End ................................................. 2-9, 2-10
remote control ..................................................... 2-11, 2-12
X
XOR .................................................................................. 11-6
Z
Zip disk ................................................................................ 3-5
formatting ............................................................ 9-11, 9-12
zone display ........................................................................ 1-8
Index

WARRANTY/DISCLAIMEROMEGA ENGINEERING, INC. warrants this unit to be free of defects in materials and workmanship for aperiod of 13 months from date of purchase. OMEGA’s WARRANTY adds an additional one (1) monthgrace period to the normal one (1) year product warranty to cover handling and shipping time. Thisensures that OMEGA’s customers receive maximum coverage on each product. If the unit malfunctions, it must be returned to the factory for evaluation. OMEGA’s Customer ServiceDepartment will issue an Authorized Return (AR) number immediately upon phone or written request.Upon examination by OMEGA, if the unit is found to be defective, it will be repaired or replaced at nocharge. OMEGA’s WARRANTY does not apply to defects resulting from any action of the purchaser,including but not limited to mishandling, improper interfacing, operation outside of design limits, improper repair, or unauthorized modification. This WARRANTY is VOID if the unit shows evidence of having been tampered with or shows evidence of having been damaged as a result of excessive corrosion;or current, heat, moisture or vibration; improper specification; misapplication; misuse or other operatingconditions outside of OMEGA’s control. Components which wear are not warranted, including but not limited to contact points, fuses, and triacs.OMEGA is pleased to offer suggestions on the use of its various products. However, OMEGA neither assumes responsibility for any omissions or errors nor assumes liability for anydamages that result from the use of its products in accordance with information provided byOMEGA, either verbal or written. OMEGA warrants only that the parts manufactured by it will beas specified and free of defects. OMEGA MAKES NO OTHER WARRANTIES OR REPRESENTATIONS OF ANY KIND WHATSOEVER, EXPRESS OR IMPLIED, EXCEPT THAT OF TITLE,AND ALL IMPLIED WARRANTIES INCLUDING ANY WARRANTY OF MERCHANTABILITY AND FITNESS FOR A PARTICULAR PURPOSE ARE HEREBY DISCLAIMED. LIMITATION OF LIABILITY: The remedies of purchaser set forth herein are exclusive, and the total liability of OMEGA with respect to this order, whether based on contract, warranty, negligence, indemnification, strict liability or otherwise, shall not exceed the purchase price of the component upon which liability is based. In no event shall OMEGA be liable for consequential, incidental or special damages.CONDITIONS: Equipment sold by OMEGA is not intended to be used, nor shall it be used: (1) as a “BasicComponent” under 10 CFR 21 (NRC), used in or with any nuclear installation or activity; or (2) in medicalapplications or used on humans. Should any Product(s) be used in or with any nuclear installation oractivity, medical application, used on humans, or misused in any way, OMEGA assumes no responsibilityas set forth in our basic WARRANTY/DISCLAIMER language, and, additionally, purchaser will indemnifyOMEGA and hold OMEGA harmless from any liability or damage whatsoever arising out of the use of theProduct(s) in such a manner.
RETURN REQUESTS/INQUIRIESDirect all warranty and repair requests/inquiries to the OMEGA Customer Service Department. BEFORERETURNING ANY PRODUCT(S) TO OMEGA, PURCHASER MUST OBTAIN AN AUTHORIZED RETURN(AR) NUMBER FROM OMEGA’S CUSTOMER SERVICE DEPARTMENT (IN ORDER TO AVOIDPROCESSING DELAYS). The assigned AR number should then be marked on the outside of the returnpackage and on any correspondence.The purchaser is responsible for shipping charges, freight, insurance and proper packaging to preventbreakage in transit.
FOR WARRANTY RETURNS, please have the following information available BEFORE contacting OMEGA:1. Purchase Order number under which the product
was PURCHASED,2. Model and serial number of the product under
warranty, and3. Repair instructions and/or specific problems
relative to the product.
FOR NON-WARRANTY REPAIRS, consult OMEGAfor current repair charges. Have the followinginformation available BEFORE contacting OMEGA:1. Purchase Order number to cover the COST
of the repair,2. Model and serial number of the product, and3. Repair instructions and/or specific problems
relative to the product.
OMEGA’s policy is to make running changes, not model changes, whenever an improvement is possible. This affordsour customers the latest in technology and engineering.OMEGA is a registered trademark of OMEGA ENGINEERING, INC.© Copyright 2000 OMEGA ENGINEERING, INC. All rights reserved. This document may not be copied, photocopied,reproduced, translated, or reduced to any electronic medium or machine-readable form, in whole or in part, without theprior written consent of OMEGA ENGINEERING, INC.
M3641/1200
Where Do I Find Everything I Need for Process Measurement and Control?
OMEGA…Of Course!Shop online at www.omega.com
TEMPERATURE Thermocouple, RTD & Thermistor Probes, Connectors, Panels & Assemblies Wire: Thermocouple, RTD & Thermistor Calibrators & Ice Point References Recorders, Controllers & Process Monitors Infrared Pyrometers
PRESSURE, STRAIN AND FORCE Transducers & Strain Gages Load Cells & Pressure Gages Displacement Transducers Instrumentation & Accessories
FLOW/LEVEL Rotameters, Gas Mass Flowmeters & Flow Computers Air Velocity Indicators Turbine/Paddlewheel Systems Totalizers & Batch Controllers
pH/CONDUCTIVITY pH Electrodes, Testers & Accessories Benchtop/Laboratory Meters Controllers, Calibrators, Simulators & Pumps Industrial pH & Conductivity Equipment
DATA ACQUISITION Data Acquisition & Engineering Software Communications-Based Acquisition Systems Plug-in Cards for Apple, IBM & Compatibles Datalogging Systems Recorders, Printers & Plotters
HEATERS Heating Cable Cartridge & Strip Heaters Immersion & Band Heaters Flexible Heaters Laboratory Heaters
ENVIRONMENTALMONITORING AND CONTROL Metering & Control Instrumentation Refractometers Pumps & Tubing Air, Soil & Water Monitors Industrial Water & Wastewater Treatment pH, Conductivity & Dissolved Oxygen Instruments


