Page 1
CAREER PREPARATION: A COMPARISON OF UNIVERSITY
ATHLETES TO NON-ATHLETES
by
TaNeisha R. Page, MAOM
A dissertation submitted to the Graduate Council of
Texas State University in partial fulfillment
of the requirements for the degree of
Doctor of Philosophy
with a Major in Adult, Professional, and Community Education
August, 2015
Committee Members:
Robert F. Reardon, Chair
Joellen E. Coryell
Steve R. Furney
Jovita M. Ross-Gordon
Page 2
COPYRIGHT
by
TaNeisha R. Page
2015
Page 3
FAIR USE AND AUTHOR’S PERMISSION STATEMENT
Fair Use
This work is protected by the Copyright Laws of the United States (Public Law 94-553,
section 107). Consistent with fair use as defined in the Copyright Laws, brief quotations
from this material are allowed with proper acknowledgement. Use of this material for
financial gain without the author’s express written permission is not allowed.
Duplication Permission
As the copyright holder of this work I, TaNeisha R. Page, authorize duplication of this
work, in whole or in part, for educational or scholarly purposes only.
Page 4
DEDICATION
This Dissertation was written for every student athlete past, present, and future.
Thinking about a career after sports should not happen during your senior year but should
be constantly throughout college. Think about your future, use your resources, ask
questions, explore your options, invest in your time and most importantly set career goals
just like we do as athletes, when we are playing our respective sports.
Lastly, this Dissertation is also for the most important person in my life, My Dad.
I am grateful to him for always telling me to go for what I want and have a purpose. I
want to thank him for staying calm, listening to me even when I was panicking, standing
beside me and always telling me what I needed to hear. With your support, consistency,
patience, and optimism I have been able to accomplish the biggest goal of my life.
Nothing is more influential for a woman than to have her Dad devoted to her life
journeys. There is no bond quite like a Daddy daughter relationship.
Thank you for your unconditional love. I hope this makes you proud “Daddy
Page”!!!
Page 5
v
ACKNOWLEDGEMENTS
I would first like to acknowledge God for preparing me for this experience and
giving me strength to achieve this goal.
I appreciate the patience and mentoring shown by my Chair who stood by me
through all my emails and helped me put my best foot forward. Thanks also to my
committee for working with me with on all my tight deadlines and providing amazing
feedback. Lastly, I am grateful to everyone who kept me going through their words of
encouragement, listening to me complain, and reminding me of my strength.
To each professor, coach, athletic staff member, and all participants who helped
make this study possible, “Thank You.” Without the help and support provided by each
of you, whether it was planning, sending out the communication, showing up to
meetings, or taking the surveys, this dissertation would not have been possible.
I would also like to acknowledge my tears, struggles, fears, obstacles, confidence,
motivation, and successes because without all of these factors I would not have been able
to grow personally or as a scholar.
“Remember, I commanded you to be strong and brave. Don’t be afraid, because
the Lord your God will be with you wherever you go.” ~ Joshua 1:9 (ERV)
Page 6
vi
TABLE OF CONTENTS
Page
ACKNOWLEDGEMENTS ..............................................................................................v
LIST OF TABLES .......................................................................................................... ix
LIST OF FIGURES ........................................................................................................ xi
ABSTRACT ................................................................................................................... xii
CHAPTER
I. INTRODUCTION ....................................................................................1
The National Collegiate Athletic Association ..............................2
Being a College Student Athlete ...................................................4
Statement of the Problem ..............................................................5
Purpose of the Study .....................................................................7
Specific Research Questions .........................................................7
Research Hypotheses ....................................................................8
Significance of the Study ..............................................................9
Operational Definitions ...............................................................10
Theoretical Framework ...............................................................12
Overview of Remaining Chapters ...............................................14
II. LITERATURE REVIEW .......................................................................15
Athletic Culture ...........................................................................16
Athletic Identity ..........................................................................20
Role Conflict ...............................................................................23
Faculty Perception ......................................................................26
Athletes’ Perception of Faculty ..................................................27
Race and Faculty .........................................................................27
Feeling Disconnected ..................................................................28
Social Media and Athletes ..........................................................29
Gender and Sports .......................................................................31
To Pay or Not to Pay ...................................................................32
Paying Student Athletes ..................................................33
Not Paying Student-Athletes...........................................35
Scandals Impacting Student Roles ..............................................37
Page 7
vii
Theories Used in Writing About Athletics .................................38
College Athletes in Transition ....................................................41
Methodologies Used in Past Research on Student Athletes .......43
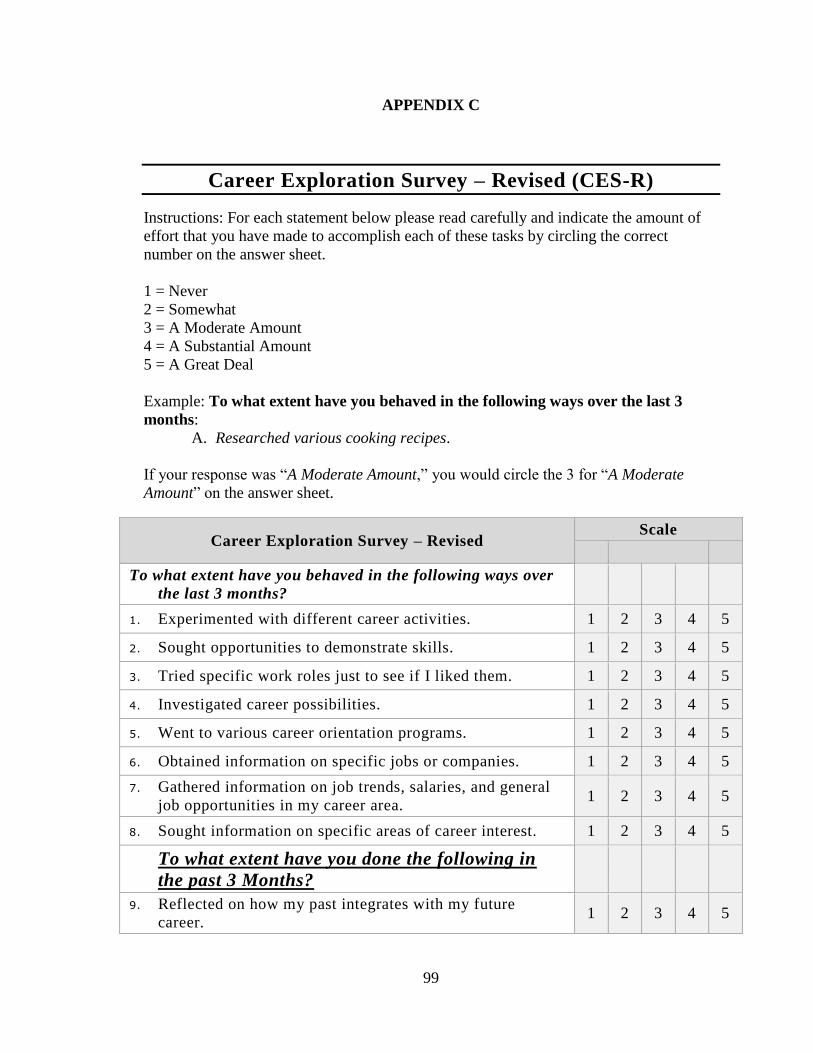
Career Exploration ......................................................................44
Personality Type .........................................................................45
Career Decision Making Self-Efficacy .......................................46
Socioeconomic Status (SES).......................................................48
Career Maturity ...........................................................................49
Conclusion ..................................................................................51
III. METHODOLOGY .................................................................................52
Analytic Method .........................................................................52
Study Design and Theoretical Basis ...........................................53
Variables in the Study .................................................................54
Instruments ..................................................................................54
Path Analysis Model Development ............................................60
Population and Sample ...............................................................61
Data Collection ...........................................................................62
Data Analysis ..............................................................................62
Summary .....................................................................................63
IV. RESULTS ...............................................................................................64
Descriptive Statistics ...................................................................64
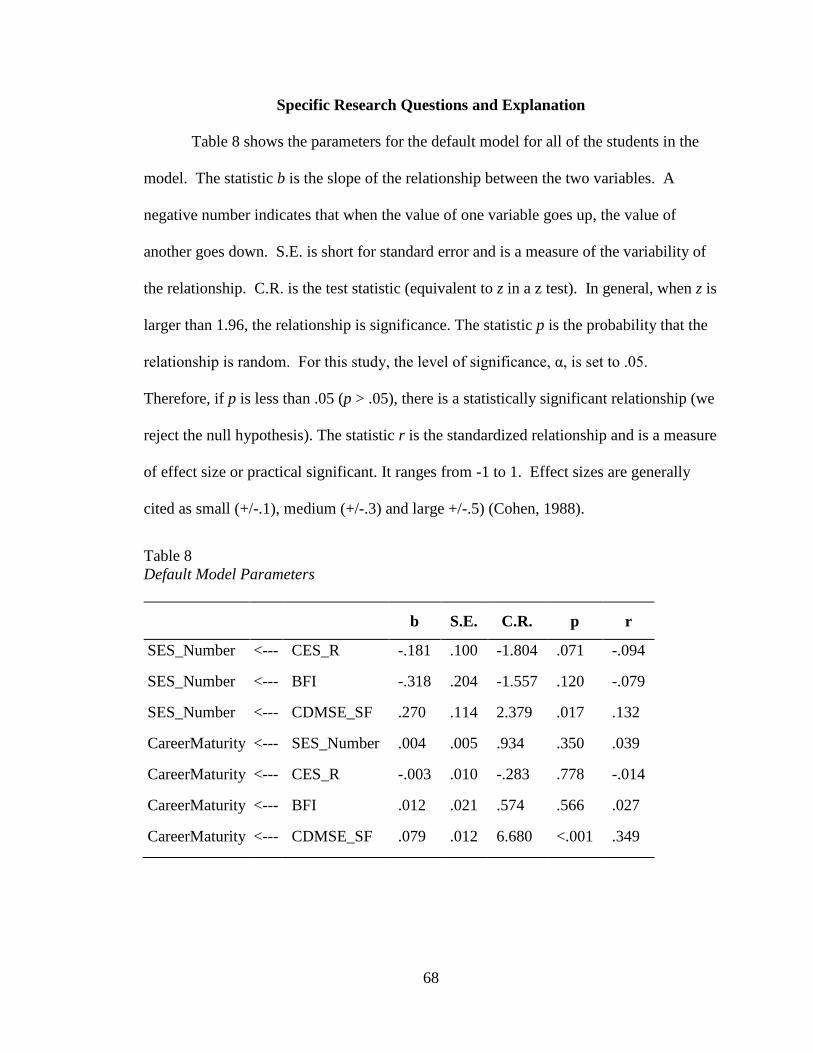
Specific Research Questions and Explanation ............................68
Overall Analysis..........................................................................80
Athletes and Non-Athletes ..............................................81
Academic Classification .................................................81
Race.................................................................................81
V. DISCUSSION AND CONCLUSIONS ..................................................82
Introduction .................................................................................82
Review of Research Study ..........................................................82
Review of Literature Findings ....................................................83
Discussion of Results ..................................................................86
Limits of the Study......................................................................92
Implications for Further Research ..............................................92
Implications for Practice and Recommendations .......................93
Summary and Conclusion ...........................................................96
Page 8
viii
APPENDIX SECTION ...................................................................................................97
REFERENCES .............................................................................................................108
Page 9
ix
LIST OF TABLES
Table Page
1. Variables Measured, Instrument Used, and Level of the Variable ............................ 59
2. Distribution of Sampled Population........................................................................... 64
3. Age ............................................................................................................................. 65
4. Gender ........................................................................................................................ 65
5. Academic Classification ............................................................................................ 65
6. Race............................................................................................................................ 66
7. Sports ......................................................................................................................... 66
8. Default Model Parameters ......................................................................................... 68
9. Non-Athletes Model Results ...................................................................................... 71
10. Athletes Model Results .............................................................................................. 71
11. Non-Athletes Compared to Athletes .......................................................................... 72
12. Female Athlete Results .............................................................................................. 73
13. Male Athlete Results .................................................................................................. 73
14. Male Athletes and Female Athletes Compared ......................................................... 74
15. Model Applied to Freshman Students........................................................................ 75
16. Model Applied to Senior Students ............................................................................. 75
17. Freshman and Senior Students Compared ................................................................. 76
18. Model Applied to White Students.............................................................................. 77
Page 10
x
19. Model Applied to Black Students .............................................................................. 77
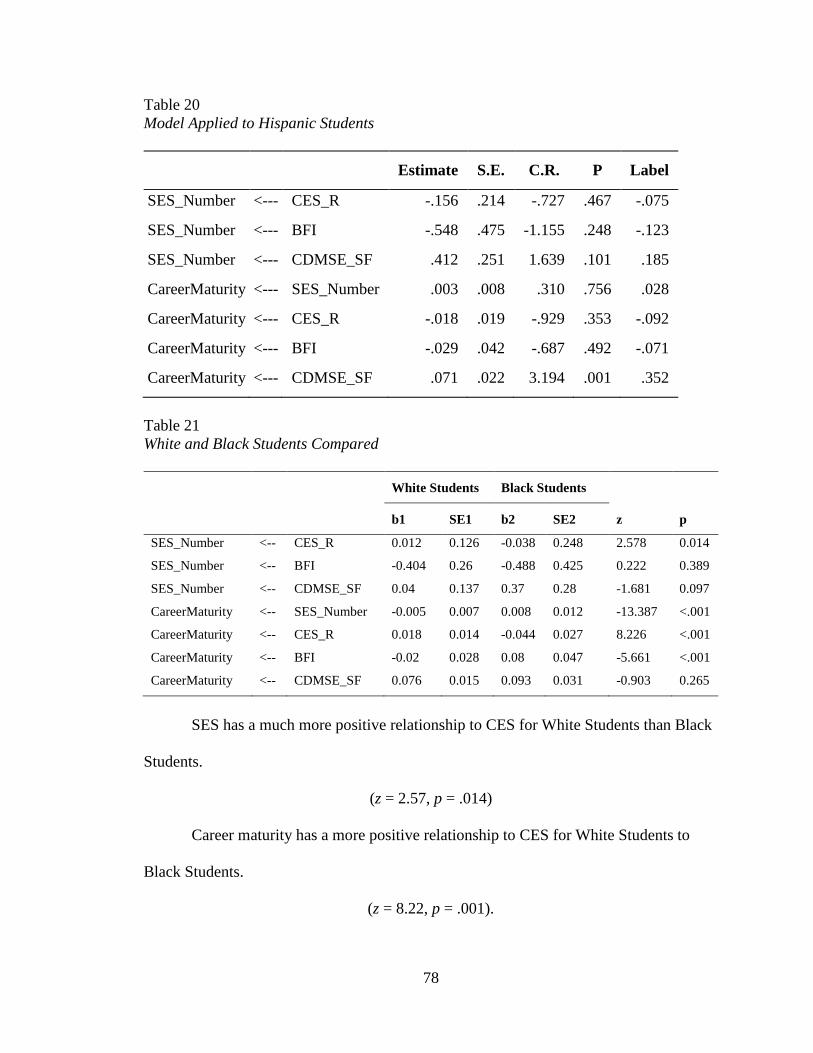
20. Model Applied to Hispanic Students ......................................................................... 78
21. White and Black Students Compared ........................................................................ 78
22. White and Hispanic Students Compared ................................................................... 79
Page 11
xi
LIST OF FIGURES
Figure Page
1. Path Analysis Model .................................................................................................. 60
2. Path Analysis Symbol Identification ......................................................................... 61
3. Research Model to Assess Measurement Significance .............................................. 67
4. Illustration of Path Model and Coefficients ............................................................... 80
Page 12
xii
ABSTRACT
Athletes, who are used to being rewarded for their athletic ability, must find a way
to develop career maturity following the conclusion of their involvement in collegiate
sports. Less than 2% of student athletes continue to play sports professionally, which
leaves 98% of student athletes to create a different professional path (Cheney-Rice,
2014). Due to these statistics, it is important that student athletes are able to transfer skills
learned as an athlete into those needed to obtain a career outside of sports in order to
improve the prospects for student athletes to enjoy successful careers outside of sports.
The three goals of this study were to determine: (a) if career exploration, personality type,
and career decision-making self-efficacy, either individually or in combination,
contribute to the prediction of career maturity levels among athletes and non-athletes; (b)
if gender, race and/or academic classification of freshmen and seniors contribute to the
prediction of career maturity; and, (c) if socioeconomic status (SES) has a mediating
impact on career maturity. A path analysis model was used to identify significant
relationships between variables. The sampled population was a total of 502 college
students from the same Division I Central Texas University. The main findings of this
study were: a) the statistical impact that career decision-making self-efficacy has on
athletes’ career maturity, b) the statistical impact of different variables on the career
maturity of Freshman as opposed to Seniors, c) how and when SES mediates career
maturity, and d) personality being more of a predictor for female athletes and Black
students compared to male athletes and White students for career maturity respectively.
Page 13
1
I. INTRODUCTION
College sports serve not only as sources of entertainment on campus, but play a
vital role in higher education by promoting student unity through participation and
support of team activities (Hyman & Jura, 2009; Schroeder, 2010). In addition, sporting
events in college are important because they generate large amounts of money from TV
network commercials and increase awareness of universities for future students. For
example, every Saturday from September through December, the major networks such as
ABC, NBC, CBS, ESPN, and a few others dominate TV programming with collegiate
games. During those games, thousands of fans fill stadiums to cheer on their teams,
others tailgate outside of the stadium, and everyone spends lots of money at the
concession stands and team retail outlets. The attention generated by sports, the revenues
generated by sports, and the demands that impact sports are behind the intricate role
played by sports in higher education. A complex co-dependency between athletics and
higher education contributes to their mutual success. For example, universities gain both
money and popularity through the success of their athletic program. An athletic program,
in turn, needs the support of its university to inform fans about sporting events so they
can engage in activities that support the program. This study investigates the intricacies
that weave all of these elements together to play their individual and corporate roles in
college athletics and higher education by analyzing the successes and challenges that
confront both student athletes and non-student-athletes in college. Understanding the
experiences and development of all college students can help impact the trajectory of
each student after college in a positive way.
Page 14
2
For decades student athletes have been torn between prioritizing the demands of
their academic and athletic responsibilities (Wilson & Pritchard, 2005). The amount of
time a student athlete spends working out, studying, and practicing for their sport is more
than their non-athlete counterpart spends studying (Fisher, 2009; Gayles & Hu, 2009).
Athletes are also mandated by the National College Athletic Association (NCAA) to
maintain a certain GPA in order to be eligible to continue to represent their institution
athletically (McPherson, 2013). Unfortunately, the demands of in-season and off-season
obligations often affect student athletes’ abilities to develop the skills necessary to
achieve professional success in areas other than athletics. Student athletes are generally
seen as individuals who are confident leaders, and to some, even invincible (Despres,
Brady & McGowan, 2008; Horton, 2011). Although that might be true, not all of the
characteristics derived from participating in sports successfully transfer outside of sports.
Many athletes have been participating in sports since they were adolescents. They are
accustomed to an environment where the ability to push harder to accomplish physical
goals is highly valued. However, after their collegiate sports careers end it is important
for athletes to have the confidence and ability to seek success through an alternative set
of skills, such as cognitive skills, that have hopefully been developed during their college
experience.
The National Collegiate Athletic Association
There are many variables can be associated with the business of the NCAA and
the structure of how the governing body operates (Polite, Waller, Trendafilova, &
Spearman, 2011). By NCAA rule, student-athletes must be actual students, while the
institution maintains control (Buer, 2009). What does this mean? The NCAA makes the
Page 15
3
rules on how many hours a week student-athletes can practice, particular behaviors that
student-athletes are not allowed to participate in, specific activities scholarships can pay
for the educational standards programs must adhere to, and serves as the catalyst for
many other facets of operations (Murty, Roebuck, & McCamey, 2014; Nite, 2012;
Osborne, 2014).
All student-athletes must comply with all NCAA rules, otherwise sanctions to a
particular player, coach, or university can be rendered. Due to the influence of the
NCAA, student-athletes are in a situation where they have to have a certain percentage of
their education completed in order to remain eligible to participate in sports. The 40-60-
80 rule indicates that by your sophomore year 40% of your major requirements has to be
complete, 60% has to be completed by your junior year, and 80% by your senior year in
order to remain eligible to participate in sports (Dryer, 2008). Unlike their counterparts,
student athletes have a certain timeframe to progress through college in order to remain
eligible to play their respective sport. Another implementation by the NCAA is the
Academic Progress Rate (APR) that serves as an accountability instrument for student-
athletes academic performance (Comeaux, Snyder, Speer & Taustine, 2004).
Under the APR, athletes earn a maximum of two points, one for maintaining
academic eligibility and another for staying in school (NCAA, 2011a). This score is
calculated to make sure universities and their athletic departments are holding themselves
and their student accountable to stay eligible and stay in school. The consequences for
insufficient APR points are loss of scholarships, reduction in practice time, or anything
else the NCAA feels is tough enough to get the student-athletes and universities on track
(Comeaux, Snyder, Speer & Taustine, 2004).
Page 16
4
Being a College Student Athlete
Historically, articles and books have been written about how athletes benefit from
playing sports. Some researchers suggest social interaction helps self-confidence
(Pearson & Petitpas, 1990; Watt & Moore, 2001) and that student athletes are able to
develop positive identity, leadership skills and strong character (Aries, McCarthy,
Salovey, & Banaji, 2004). Despres et al. (2008) talk about social challenges that are often
associated with an athletic identity. Creating an athletic identity is a normal occurrence
considering the involvement that athletes have with their sport (Brewer, Van Raalte, &
Linder, 1993). However, once this identity is formed many athletes have difficulty
forming a new identity outside of their athletic one. This has created problems for
athletes, making it difficult to successfully transition from being an athlete and adapting
to no longer being one. There have been various college athletes who have gotten in legal
trouble or have felt confused about the next phase of their life after their college careers
have ended. Some of that might be influence by the fact that they are no longer able to
identify with, or be around, a group they have been accustomed to for years. Research has
demonstrated the problems many athletes face when their sports involvement comes to an
end and they have to transition into a different role (Samuel & Tenenbaum, 2011;
Wylleman & Lavallee, 2004). The issue of transition has slowly made its way into the
literature and there have been various approaches to solving this matter. Special
counseling for student athletes is the most common way experts feel this issue can be
addressed (Despres et al., 2008; Lanning, 1982; Watt & Moore, 2001). Each of these
articles reports the most successful means of helping athletes make this transition has
Page 17
5
resulted when counselors have been provided who have specific information about
common challenges athletes face in making this difficult transition.
There has been substantial research on student athletes, their experiences,
struggles, successes, perceptions, and the culture of athletic programs from a qualitative
perspective (Killeya-Jones, 2005; Miller & Kerr, 2003; Schroeder, 2010). However, there
is a void in quantitative research that details the career maturity of student athletes in
comparison to their non-athlete counterparts. Career maturity is defined as the readiness
of an individual to make informed, age-appropriate career decisions, and cope with career
development (Savickas & Porfeli, 2011). Athletes, who are used to being rewarded for
their athletic ability, must find a way to develop career maturity following the conclusion
of their involvement in sports. There is a further gap in the literature taking the
comparison of these two groups a step further by considering the influence that gender,
race and academic status may exert on the variances. Less than 2% of student athletes
continue to play sports professionally which leaves 98% of student athletes to create a
different professional path (Cheney-Rice, 2014). Due to these statistics, it is important
than student athletes are able to transfer skills learned as an athlete into those needed to
obtain a career outside of sports is important to improve the prospects for student athletes
to enjoy successful careers outside of sports.
Statement of the Problem
College students as a whole face distinctive challenges figuring out who they are
and where they fit within society. Balancing an academic and athletic life can become an
obstacle for maturing student athletes, especially as they simultaneously begin to embrace
adulthood. Student athletes not only have to take on all of those challenges, but they also
Page 18
6
have to learn how to reach their athletic potential (Wilson & Pritchard, 2005). Given the
demands resulting from the different roles college athletes and non-athletes undertake, it
is important to make sure they are prepared for their lives beyond college (Despres et al.,
2008; Shurts & Shoffner, 2004; Stambulova, Alfermann, Statler, & Cote, 2009). For
athletes, the process of returning to a different social structure—outside of athletics—can
be a challenge, depending on the readiness of the athlete to accept the end of their athletic
career.
Various studies have suggested that student athletes have been rated lower on
career maturity than their non-athlete counterparts (Blann, 1985; McPherson, 2013).
Other past research on college athletics focused on the sudden loss of athletic identity
resulting from injuries or forced early retirement, and the effects of leaving a known,
protective environment (Pearson & Petitpas, 1990; Wooten, 1994). Current literature has
expanded its focus to include life after sports (Harrison & Lawrence, 2003),
developmental transitions for athletes (Wylleman & Lavallee, 2004), transferable skills
after athletics (McKnight et al., 2009), contextual factors in career development
(Stambulova et al., 2009), changing roles after athletics (Samuel & Tenenbaum, 2011),
and the different types of transitions that can happen to athletes physically and
emotionally (Falls & Wilson, 2012). However, there is little literature exploring the
problem of career maturity and variables that can impact career development. It is
inevitable that college sports’ careers will end, and student athletes will graduate, just as
non-athletes, and leave college to move on to the next stage of their lives. As the roles for
each group begin to change it is important to understand whether or not student athletes
are adequately prepared for career opportunities outside of sports.
Page 19
7
Purpose of the Study
The overall purpose of this study is to identify factors that can impact students’
preparedness for life after college. Providing an opportunity to initiate change, or starting
a dialogue to help universities better prepare students to excel on both personal and
professional levels would be a valuable accomplishment. One of the reasons students
attend college is to gain knowledge and experience in hopes of advancing their position
in life. This study can build the beginning of a foundation to help students achieve that
goal by understanding how these students interpret their environments. The three goals of
this study were to determine: (a) if career exploration, personality type, and career
decision self-efficacy, either individually or in combination, contribute to the prediction
of career maturity levels among athletes and non-athletes; (b) if gender, race and/or
academic classification of freshmen and seniors contribute to the prediction of career
maturity; and, (c) if socioeconomic status has a mediating impact on career maturity.
Specific Research Questions
1. To what degree is career exploration a reliable predictor of career maturity?
2. To what degree is personality type a reliable predictor of career maturity?
3. To what degree is career decision self-efficacy a reliable predictor of career
maturity?
4. To what degree do career exploration, personality type, and career decision self-
efficacy collectively predict career maturity when included in a single prediction
model?
5. In what way, if any, does socioeconomic status mediate the relationship between
career exploration and career maturity?
Page 20
8
6. In what way, if any, does socioeconomic status mediate the relationship between
personality type and career maturity?
7. In what way, if any, does socioeconomic status mediate the relationship between
career decision self-efficacy and career maturity?
8. What is the statistical difference, if any, between the athletes and non-athletes on
research questions 1-7?
9. What is the statistical difference, if any, of gender across athletes on research
questions 1-7?
10. What is the statistical difference, if any, of academic classification between
freshmen and seniors on researcher questions 1-7?
11. What is the statistical difference, if any, of race on researcher questions 1-7?
Research Hypotheses
1. It is hypothesized that career exploration will be a reliable predictor of career
maturity.
2. It is hypothesized that personality will be a reliable predictor of career maturity.
3. It is hypothesized that career decision self-efficacy will be a reliable predictor of
career maturity.
4. It is hypothesized that career exploration, personality type and career decision
self-efficacy collectively will be a predictor of career maturity.
5. It is hypothesized that socioeconomic status will mediate the relationship between
career exploration and career maturity.
6. It is hypothesized that socioeconomic status will mediate the relationship between
personality type and career maturity.
Page 21
9
7. It is hypothesized that socioeconomic status will mediate the relationship between
career decision self-efficacy and career maturity.
8. It is hypothesized that there will be a statistical difference between athletes and
non-athletes for questions 1-7.
9. It is hypothesized that there will be a statistical difference in gender between
athletes for questions 1-7.
10. It is hypothesized that there will be a statistical difference in academic
classification groups between freshmen and seniors for questions 1-7.
11. It is hypothesized that there will be a statistical difference in race groups for
questions 1-7.
Significance of the Study
Researchers fear that student-athletes place a greater priority on their sport than
their education (Despres et al., 2008; Gayles, 2009; Horton, 2011; Wylleman & Lavallee,
2004). The emphasis on sports results from the compromise that athletes make between
time preparing for a game and time they will spend preparing for academic assignments.
Others argue that student athletes are marginalized (Horton, 2011; Paule & Gilson, 2010;
Watt & Moore, 2001) and struggle with overall student engagement compared to their
non-athlete peers (Gayles, 2009). Coaches and peers potentially emphasize winning at all
costs, which can lead to stereotyping resulting from a higher degree of aggressiveness
(Watt & Moore, 2001) displayed by athletes (Despres et al., 2008; Horton 2011; Paule &
Gilson, 2010; Watt & Moore, 2001). Given such a confluence of conflicting demands
placed on student athletes, this study aims to improve our understanding of how these
forces combine to affect the career maturity of student athletes.
Page 22
10
Student athletes should prepare themselves for life after sports because this is an
inevitable transition. Based on all of the other responsibilities that student athletes have
within their sport it is important not to let their time constraints keep them from exploring
career options. The significance of this research is to highlight areas where student
athletes and non-athletes are impacted the most when it comes to career maturity and the
variables used. This will help to determine ways to develop their career maturity.
Practically, this research will provide developmental awareness that can better inform the
university about specific areas where student athletes feel confident, and other areas
where student athletes need some confidence building. Theoretically, student athletes and
non-athletes can establish a successful path for building career maturity techniques.
However, there is a gap in the literature on how personality traits, self-efficacy,
socioeconomic status, and academic classification can help or hinder college athletes.
Including non-athletes as a comparison group is a way to gauge their counterparts who
are at the same stage of their college experience. The NCAA can also benefit from
information on how athletes feel about their overall career maturity. Additionally,
universities can have a better understanding about characteristics that can impact their
students’ overall career maturity.
Operational Definitions
Academic Classification - The grade college students are currently in.
Athletic Identity - The degree to which an individual identifies with the athletic role
(Brewer et al., 1993). This is operationally defined as the total score on the Athletic
Identity Measurement Scale.
Page 23
11
Big Five Inventory (BFI - 29) - Provides a concise measure of the five basic personality
factors which are agreeableness, conscientiousness, extraversion, neuroticism and
openness. (John & Srivastava, 1999).
Career - Area or profession an individual chooses to train and prepare for in anticipation
of permanent employment.
Career Decision Making Self-Efficacy Scale - Extent to which career-related decisions
are made based on environmental and personal factors, moderated by the individual's
level of self-awareness and self-efficacy (Betz, Klein, & Taylor, 1996).
Career Development - Process of growth through various life stages that an individual
goes through in order to select an occupation that is in concert with a person’s self-
concept.
Career Exploration - Exploring and learning about different careers.
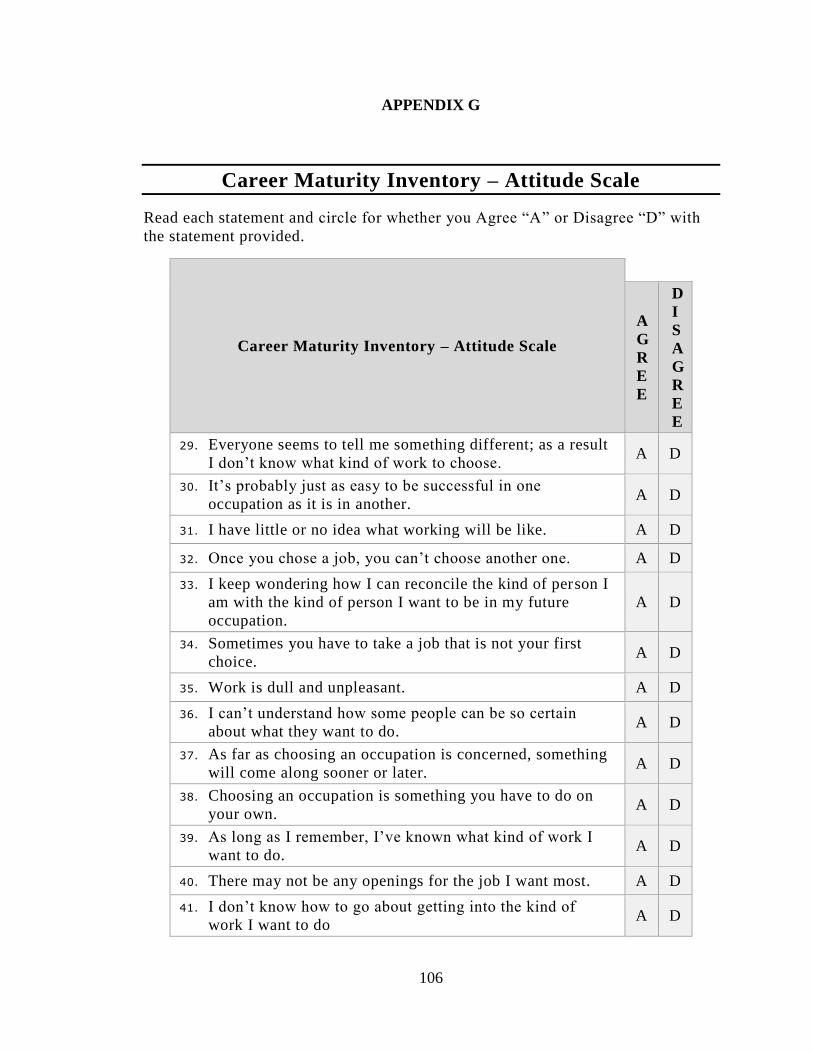
Career Maturity - Readiness of an individual to make informed, age-appropriate career
decisions and cope with career development (Savickas & Porfeli, 2011). In this study,
career maturity was assessed by the Career Maturity Inventory-Attitude Scale (CMI-AS)
Endogenous - Dependent variable
Exogenous - Independent variable
Freshman - Individual who is in their first year of athletic eligibility (student-athletes) or
has junior class standing, or has earned 1-29 credit hours for non-athletes.
Junior - Individual who is in their third year of athletic eligibility (student-athletes) or has
junior class standing, or has earned 60-89 credit hours for non-athletes.
Mediator - Variable that is in place to explain the relationship between the endogenous
and exogenous variables
Page 24
12
Non Athlete/College student - An individual who does not currently participate, or has
never participated in an organized, NCAA and selected Division I University-sponsored
sport.
Path Analysis Model - Visual representation of a model
Path Coefficients - The direct casual effects that are represented by the p coefficient
(Mertler & Vannatta, 2005).
Senior - Individual who is in their final year of athletic eligibility (student-athletes) or has
senior class standing, or has earned more than 89 credit hours for non-athletes.
Socio Economic Status - An economic and sociological combined total measure of a
person's work experience and of an individual's or family's economic and social position
in relation to others, based on income, education, and occupation (Walpole, 2003).
Sophomore – Individual who is in their second year of athletic eligibility (student-
athletes) or has junior class standing, or has earned 30-59 credit hours for non-athletes.
Student Athlete - A current undergraduate who is participating in an organized, NCAA,
Division I university-sponsored sport.
Theoretical Framework
The epistemological framework for this study is critical realism. The English
philosopher Roy Bhaskar, who is considered its founding father, developed this approach
in the 1970s (Alversson & Skoldberg, 2009, p. 39-40). Critical realism acknowledges
social phenomena are intrinsically meaningful. Hence, meaning is both externally
descriptive, constitutive, and often contains material constituents as well (Easton, 2010).
A large component of understanding the functionality of critical realism resides in
understanding the social world and the actions that create knowledge. For a realist
Page 25
13
researcher, objects of research, such as culture, exist and act quite independently from the
observer (Gray, 2013, p. 25). In other words, knowledge progresses by taking what is
already known by the individual and extending it in new events. Since critical realism is
subject to the way we perceive the world, identifying one complete truth is challenging.
Critical realism seeks to identify those deeper, underlying mechanisms to generate
empirical phenomena (Alversson & Skoldberg, 2009, p. 40). Participants provide their
personal experiences based on how they see their situation.
In understanding the social world and structure that is grounded in this theory, a
college campus is an environment that represents critical realism and provides an
appropriate foundation for the research. In critical realism, something is considered real if
the causal effect impacts behavior and makes a difference (Alvesson & Skoldberg, 2009,
p. 41). Situated in a historical, political, and social structure, critical realism allows the
individual to create his or her own knowledge based on experience. The real-science
mechanisms, actual- events that happen and empirical- experience are the three ways that
knowledge can be formed (Collier, 1994, p. 44). Another way to understand critical
realism is to consider the illusion of seeing water on the road in the distance, on a hot
summer day. The real or scientific explanation is a mirage, which produces a reflection
on the road; actually there is no water on the road, and empirically there seems to be
water on the road. Using this model, the student athletes and non-athletes each have
actual and empirical information and the questionnaires provided the real context. This
allowed the knowledge that is already presented by each individual to serve as a
foundation. The research continued to build on the knowledge that is already formed by
combining the social and theoretical environments of each participant.
Page 26
14
Critical realism is the preferred epistemology based on its ability to look at
impacts which were identified with path analysis. Culture and society are both dynamic
influences on college campuses and both played a role on this research. Student athletes
and non-athletes go through different experiences in college, so it is important to gather
information on both groups in order to better understand these experiences.
Overview of Remaining Chapters
This chapter provided an introduction to the importance of career maturity and
included a statement of the problem, purpose of the study, research questions,
hypotheses, significance, operational definitions, theoretical framework, limitations, and
delimitation for the research. In addition, Chapter I provided history about college
athletics and the attention that has been given to this area of research. Chapter II,
presents a literature review that captures how athletes form their identities, how these
identities can impact their future, and how non-athlete students compare to their athlete
counterparts. Each instrument that was used for this research is also discussed in this
chapter. Chapter III details the proposed methodology, as well as the analytic method,
study design and theoretical basis, variables in the study, instruments, path analysis
model development, path analysis symbol identification, population, sample, data
collection, and key terminology. Chapter IV is a detailed examination of the results, and
Chapter V concludes with an overview of the entire study along with implication for
further research and practice.
Page 27
15
II. LITERATURE REVIEW
There are many stages in life that may influence how individuals perceive
themselves and where they feel they fit in the world. Although these perceptions might
come during different situations and times for everyone, this is a normal part of personal
development. For college student athletes, being a part of an athletic program can be life
changing. Samuel and Tenenbaum (2011) explain certain athletes may experience
multiple changes throughout their careers while other athletes may experience only a few.
Adapting to these changes can be the difference between a positive or negative
experience. Most people attend college in hopes of learning new things and figuring out
what they want to do with the rest of their lives. When someone enters college as a
student athlete, there is an added reason for attending college, the opportunity of being a
student athlete. College student athletes are college students who are also involved in
their respective organized college sport. Not only are they responsible for maintaining
their academic standing, but they are also responsible for staying in shape physically and
performing well in their sport. College athletes on average spend 20 hours a week
practicing, working out, and studying for their sport (Gayles, 2009; Watt & Moore,
2001). This decreases the amount of time college athletes have to socialize with friends,
enjoy activities outside of school, and just be a student. Time is not the only sacrifice
athletes have to make; physically their bodies are sacrificed through practicing, playing
actual games, and working out. Athletic programs usually structure an athlete's schedule
and allocate times for training, practice, study meetings, recreation, and nearly everything
else (Lanning, 1982). Due to this structure, athletes live in a world that differs from their
non-athlete counterparts.
Page 28
16
“Athletics is embedded in our national culture and has become institutionalized at
universities and colleges, which is a powerful combination” (Fisher, 2009, p. 51). Within
the structure of this complex and powerful relationship, it is important to know these
athletes as a whole, and who they are in these athletic programs. Reviewing the literature
provides a foundation to understand the different ways and reasons athletes struggle to
balance the demands of being both an athlete and a student. There are different topics in
the literature that scholars have highlighted in regard to athletes and the diverse situations
they face. Since the literature in some topics is broadly spread out, portions of this
literature review is done in chronological order while others are reviewed collectively.
Athletic Culture
The expectations, perceptions, and habits that develop over time are a large
contributor to athletic culture. In order to understand the kind of support that student
athletes might need, this information is important for anyone who will come into contact
with former, current, or future athletes. These articles also put into perspective the
environment athletes are accustomed to and help to better understand the world they
experience.
In an interesting outlook on the organizational culture in college athletics, David
Scott (1997) likens athletics to a functioning organization. He notes that athletic
programs involve winning games, bringing attention, sponsorships, support, and
encouragement for everyone to get on board to help bring in revenue. Each of these
responsibilities is difficult to complete and can result in turnover in coaching positions.
This is an important piece of the athletic culture because coaches are the people athletes
know best and feel most comfortable around. Oftentimes, athletes base their decisions
Page 29
17
about the college they attend on the coaching staff. Maintaining solid athletic programs
and providing stability in a rapidly changing environment is imperative (Scott, 1997).
Coaches are an important part of athletic environments. They not only function as the
public face of the programs, they also keep up the day-to-day progress, and are
responsible for the student athletes. Just as coaches are an important piece of the puzzle,
athletic directors are important as well. While they are not typically seen by many people,
they are the ones making major decisions about the athletic program. Ultimately, they
make the hiring decisions for coaches, and in so doing, they select individuals whom they
believe will cultivate the culture they want for their program. This aspect of college
athletics generally goes unspoken, but is a major factor in determining the culture of each
individual program. Knowledge of culture management may provide athletic directors
and even head coaches with new or improved tools for increasing the success of the
organizations they manage (Scott, 1997).
Watt and Moore (2001) explored the question of who are athletes? Their study
suggests that where college athletics started and how athletics has transformed through
the years is an important aspect to consider in evaluating what athletics are like today.
Chronologically speaking, they begin with a discussion of the notion of athletics being
introduced into colleges and universities, and end with a discussion of the impact on
society, including the money and attention that are now bestowed on athletics. The
NCAA has contributed to not only improve graduation rates for student athletes, but it
has also impacted athletic programs across the nation in many ways. Both positive and
negative experiences among students—whether the result of scheduling, isolation from
other students, or sustaining a sense of identity—have all been areas where Watt and
Page 30
18
Moore have expanded on their research. They wrote about the modern day athlete, and
how interest in, and growth of, college sports has changed over time. Recommendations
to create the best experience possible for the athletes and programs were also reported.
This article concluded with the impact sports have on society, and how it will continue to
grow. According to these authors, issues that will continue to develop need to be
addressed and scaled.
Despres et al. (2008) focused on the culture of college student athletes. They
defined athletic culture as “that phenomenological environment in which college
students, who are athletes, live and move when they are fulfilling their roles and
responsibilities” (Despres et al., 2008, p. 200). Focusing more attention on being an
athlete versus a non-athlete is a part of the culture that goes with being labeled as a
student athlete. Because athletes generally receive more recognition for their athletic
achievements, this impacts how athletes and others begin to perceive athletics. The social
dynamics of the sports world encourage some athletes to bond together in ways that
promote and even normalize over conforming deviance (Despres et al., 2008). These
dynamics are what make the athletes feel comfortable in their environment, and in turn,
promote teamwork. This personal development is not always positive because it can
create a sense of entitlement if the people around athletes do not provide them with the
tools to help them remain humble. Accountability is what Despres et al. focus on as being
a key characteristic to maintaining this positive culture (2008). The demands on these
student athletes can be a positive or negative depending on the support and time that
athletes invest to be positive.
Page 31
19
According to Fisher (2009), a different approach to understanding what athletic
culture means can be introduced as a way to implement both athletic success and
institutional rankings. This article focuses on the influence that athletics have on the
institution’s enrollment success, and the attention that is generated by athletics. Based on
the growth in athletics through television, marketing, and social media, institutional
awareness is enhanced, and opportunities for individuals to consider attending specific
institutions are created that would not have existed otherwise. Sports provide an
opportunity for a national audience to see who the student athletes are, and allow for a
greater perception to be gained regarding athletic programs (Fisher, 2009). As a result,
athletes must know how to conduct themselves in order to support this positive outlook.
The interviews athletes give, the things they post on social media, and the successes they
have both on and off the field, are all reflective of the institution’s athletic culture. When
the university can benefit from an athletic program, it produces increased pressure on
everyone associated with the program, from athletes to coaches, and administrative staff.
Perhaps this is a different way to view what athletic culture means; however, it is still a
valuable element in understanding the social responsibility of sports and what it means
for the operational process of the world.
Lastly, Gayles (2009) touched on athletes’ experiences. This research is the most
up to date, providing current information on what student athletes experience both on
campus and in the NCAA. The NCAA has a research and education office that provides
educational and leadership opportunities for student athletes (Gayles, 2009). They are
responsible for tracking and improving graduation rates, understanding progress in
college, and social and grouping processes, among other things. With the NCAA
Page 32
20
conducting and reporting the results of these types of tests, athletic programs have an
accountability standard for their athletes. This is where the academic side of athletics
becomes an important part of the culture. If athletes do not make high enough grades,
they become ineligible to participate in their sport. Student athletes on most college
campuses today represent a special population of students with unique challenges and
needs which differ from their nonathletic peers (Gayles, 2009).
It is not a secret that student athletes go through a different experience in college
compared to non-athletes and this literature is a direct reflection of that fact. Being an
athlete can present a variety of obstacles, but if the right support systems are in place
within the program, everyone should be able to have positive outcomes. The culture of an
athletic program is foundational to helping student athletes understand how they fit into
the bigger picture. Without a consistent culture and leaders who promote the right
attitudes, athletic culture can have a negative impact for the athletes who are involved.
Athletic Identity
An essential part of being an athlete is being able to identify as one. The reason
this is so important is because it provides an identity for these college students who are
trying to figure out where they fit in in their college settings. Athletic identity can be
defined as the degree to which an individual defines herself or himself in terms of their
athletic role and their environment (Lavallee, Gordon, & Grove, 1997). The concept of
athletic identity was introduced by Brewer et al. in 1993. Their research measured
athletic identity and identified positive and negative factors associated with a strong
athletic identity. This was the first time athletic identity was given a name, and
researchers were able to measure the degree to which someone did or did not have this
Page 33
21
identity. Based on this new measurement, Martin, Eklund, & Mushett (1997) conducted a
study that focused on the potential importance of social and behavioral ramifications
regarding athletic identity. As such, they discovered the impact of athletic identity
centered on how relationships with other athletes were affected; and, how there could
also be psychological issues and concerns as well.
In 2000, Brown, Glastetter-Fender, & Shelton studied wanted to know how
athletic identity impacted career control on college student athletes. It was their belief
that athletic identity could be relevant in understanding the career decision-making
process of college athletes. However, their findings showed that for only one half of
student athletes there was a positive correlations between strong athletic identity and
lower levels of career decision making processes. Mael and Asforth (2001) focused on
athletic identity as a way for individuals to understand their purpose and benefits, as well
as risks associated with identifying in this particular way. The main issue for individuals
with a strong athletic identity was over-identifying and the resulting pressure that can
produce for an individual. Each of these articles was written over 10 years ago when the
athletic identity model for measurement originally surfaced. Over time, the research
became more in-depth and even added a few elements to the measurement during the
process.
Nasco and Webb (2006) suggested that public and private dimensions should be
applied to the measurement of athletic identity. Their idea was to understand differences
between what could publically be seen and what was privately known by the athlete. An
example of this would be a recreational athlete versus a collegiate athlete. Both might
internally perceive themselves as having an athletic identity, but publically the identity
Page 34
22
could be constructed differently. As a result, a new scale was introduced that refined the
way athletic identity was measured. The Public-Private Athletic Identity Scale (PPAIS)
was created to explore the public nature of this form of identity (Nasco & Webb, 2006).
This measurement tool proved to be valid and reliable in measuring outcomes for current
student athletes.
Chen, Snyder, and Magner (2010) researched the effects of athletic identity on
student athletes and non-athletic students. They wanted to understand how college
athletes viewed different aspect of being a student versus how non-athletes viewed being
a student. According to the study, gender and the amount of time spent in college made a
difference in determining the effects of athletic identity. Moreover, the influence in
athletic identity perception due to sports shed new light on the benefits of sports
involvement (Chen et al., 2010).
With athletic identities, the relationship between behaviors and identities becomes
circular. In order to identify as an athlete, an individual must exhibit have the behavior
that reflects one. This could include attending practices, playing in games, working out,
or anything perceived by individuals as being for their sport. Athletes develop identities
through a natural process of interacting with their environment, constructing, interpreting,
and negotiating the meanings of their social interactions (Miller, 2009). The construction
that takes place for these athletes is what makes up their athletic identity. Athletic identity
is continuously being used for research purposes, and it is vital to use this identification
process as a baseline as a way to continue to research athletes.
Page 35
23
Role Conflict
Student athletes are in a unique situation because they have to balance being an
athlete while still maintaining their grades. Settles, Sellers and Damas, Jr (2002) define
role conflict as an occurrence that happens when an individual feels one role is his/her
number one priority while another role is interfering with that priority. There are many
perspectives on the amount of time athletes should spend on their sport versus their
school work (Fisher, 2009, Gayles & Hu, 2009; Wilson & Pritchard, 2005), but the fact
remains that this is a decision that students who are not athletes do not have to make.
Different universities have various expectations of their athletes. Some require them to
live in certain places, attend study hall, and show up at certain gatherings or even avoid
particular events. Regardless of the situation, these athletes have a responsibility to also
put in the designated hours in their sport. A typical student is usually faced with
balancing their social life in the college environment, maintaining personal relationships
with friends and family, while also maintaining their grades. A student athlete is also
faced with that same struggle as non-athletes but all of the demands, expectations, and
pressures associated with their sport are added into the equation.
Since athletes spend more than 20 hours a week lifting weights, practicing, and
watching film for their perspective sport (Gayles, 2009; Watt & Moore, 2001), it is
almost inevitable that an athlete will struggle figuring out which role should have more
weight and how to handle that issues resulting from that decision. On one hand, athletes
are recruited to play sports for a particular school. On the other hand, they are at the
school to get an education and that education can determine their eligibility to play their
sport. They are called student-athletes with student being the first word but the debate
Page 36
24
over what the students’ priority should be is ongoing. However, various literature has
attempted to explain each role and why it can be hard balancing the two.
Adler and Adler were among the first authors to address role conflicts among
college athletes. Adler and Adler (1985) laid the foundation for the experiences that
college athletes were having at that time. This led to a four year longitudinal study with a
major university’s basketball team to understand their experiences with role conflict.
Their study focused on role expectations and how they impacted the student and athlete
roles. The emphasis coaches put on sports over academics combined with being isolated
in their dorms and their performance in the classroom determined how much conflict
each athlete had with their different roles (Adler & Adler, 1987). The study concluded
that it is important for athletes to identify with each role separately and commit to that
decision.
Additionally, other articles focus on understanding the need to balance different
roles (Settles et al., 2002) and the two different stages of dealing with role conflict
(Miller & Kerr, 2003). For student athletes, it is nearly impossible to avoid having to split
their attention between various aspects of being in college. There are three main
categories that athletes find themselves trying to balance: athletic, academic, and social
expectations (Miller & Kerr, 2003). If a student’s main priority is getting prepared for a
big game but they also have a test that same week, the decision about where to put more
effort creates conflict. Games and practice are often as concrete as assignments and tests.
Some adjustments can be made but in the end each of these activities are just part of
being an athlete and a student. Miller and Kerr (2003), highlight the first stage of over-
identification with the athletic role and the second stage of deferred role experimentation.
Page 37
25
Each of these stages suggests that role conflict can be a dynamic process and this is part
of being an athlete.
Identity discrepancy approach is a theory that has been written about regarding
role conflict and student athletes. This theory suggests when individuals have various
identities, each of which negatively impact the other, it can lead to conflict between the
roles (Killeya-Jones, 2005). The success of the student athletes become dependent on
how they are able to balance each role. There is no single way that each athlete can adjust
to the different roles they face because everyone goes through the experience differently.
Killeya-Jones (2005), talks about the importance of student athletes identifying separately
with each role and organizing their expectations. If students are able to follow this plan
effectively it is believed each role will not have a negative impact on each other and can
lead to greater satisfaction.
McPherson (2013) explains role conflict as multiple stages that happen with
identity and are dependent on when student athletes begin to focus more on their
academic role versus athletics. Looking at the college experience as a whole, it is not a
surprise that freshmen are usually faced with more doubt about adjusting to their
environment and making their situation work. Being a first-year college student, as well
as an athlete adds a tremendous amount of pressure before thinking about participating in
any leisure activities. As time goes by and the situation becomes easier to maintain, there
is a belief that athletes begin to find more of a balance between athletics and academics
(McPherson, 2013). Familiarity and confidence with the athletic and academic roles can
be the deciding factors that eliminate role conflict. Students, later on in their athletic
careers, begin to accept their careers could be coming to an end and they dedicate more
Page 38
26
time to their academic roles, even though their time obligation to athletics does not
change (McPherson, 2013).
Perception is the biggest determinant of role conflict because different people see
their situations differently. If these athletes step into a situation they are not comfortable
with or they feel like they cannot handle everything being thrown at them, they are more
likely to have a role conflict. Due to the fact that the majority of athletes identify with
their athletic role over their student role (Adler & Adler, 1987; Lally & Kerr, 2005;
McPherson, 2013; Miller & Kerr, 2003) it is imperative for the people who are around
athletes to help them balance out their roles. Coaches, support staff, and professors all
play an integral part in helping these students get on the right path. The amount of time
coaches spend stressing the importance of education and allowing their students the space
to excel in academics could be the difference in athletes balancing their role conflicts.
Athletes are conditioned to excel at whatever they participate in and if a coach can instill
winning with sports and academics student athletes can be more effective balancing their
roles.
Faculty Perception
Student-athletes having people who support them can not only be a determining
factor in how they perform academically, it can also impact athletic performance. Based
on the number of classes student-athletes miss because of their respective sports, faculty
becomes an important piece to their success in academics. There have been a plethora of
articles centered on faculty at various universities and the roles they play in student-
athletes’ lives. Most faculty are aware of the time constraints placed on athletes compared
to their counterparts, and the demand on their out-of-class time is understood (Lawrence,
Page 39
27
Ott & Hendricks, 2009) However, there is still considerable fuzziness about how to get
student-athletes and faculty working together more effectively.
Athletes’ Perception of Faculty
One of the ways researchers have studied student-athletes and faculty
relationships is by allowing athletes to share their experience. Simons, Bosworth, Fujita
and Jensen (2007), conducted a study based on 538 collegiate athletes perceived
treatment by facility. In this study the athletes revealed their experience of being
stereotyped as having low intelligence, little academic motivation, and being
unrecognized for benefits as well as privileges. Another study concluded that the
different positive experiences student-athletes have with faculty have an impact on
student-athletes obtaining their degrees (Bell, 2009). In this study researchers focused on
the intellectual support faculty members provide to student-athletes. Williams, Colles and
Allen (2010), were at a Division III institution and highlighted the student-athletes’
perception of interactions with the faculty. Having faculty consistently involved in these
athletes’ lives has been shown to also increase athletic performance (Williams, Colles &
Allen, 2010). More recently, athletes at a small private Division II university were
surveyed and only 12% of the participants experienced negative perceptions on the part
of faculty (Parsons, 2013). Each of these articles referred to an athletic stigma associated
with athletes regardless of their grades. And, as with any human feeling, some of those
stigmas are stronger and more persistent than others.
Race and Faculty
Race has also been a focus when exploring faculty perceptions of student-athletes.
By way of measuring faculty about their personal feelings and initial reactions to people
Page 40
28
of different races, involved in an athletic program, visual images were used in one study
to determine how faculty participants responded to a student-athlete by race (Comeaux,
2010). The finding suggested that faculty have less favorable feelings towards Black
male and female student-athletes compared to their White counterparts in their academic
and post-undergraduate success (Comeaux, 2010). Similarly a study was conducted using
464 faculty members using the Situational Attitude Scale Student-Athlete and the finding
revealed differences in the attitudes of student-athletes based on race, gender and college
affiliation (Comeaux, 2011).
Feeling Disconnected
There are other faculty members who feel like they are disconnected from the
world of athletics (Martin and Christy, 2010; Mamerow & Navarro, 2014). Due to
practice schedules, travel time, and the amount of time student-athletes do miss from
class faculty feel like they are not able to connect with these athletes. Being an integral
part of the institution for learning and not playing a heavy role in the athletic department
are some of the challenges faced by faculty (Martin and Christy, 2010).
Due to various ways that student-athletes can interact with faculty, it is important
to understand how these two sides can come together to create a supportive learning
environment. Creating a mentorship or even a social network of faculty members who
can be a part of the athletic experience would be a tremendous help in bridging this gap.
One of the hardest elements of faculty becoming more involved is the time commitment
it would require away from their work (Lawrence, Ott & Hendricks, 2009).
Page 41
29
Social Media and Athletes
Social media platforms have become integral parts of the college experience and
have created a new way of communication for a multitude of topics (Sanderson,
Browning & Schmittel, 2015). This has also opened the door for student-athletes and fans
to have a different type of relationship than was possible in the past. Currently, Facebook,
Twitter, Instagram, and Tumblr have 1.3 billion, 500 million, 300 million, and 216
million active users, respectively, across the world (Sanderson & Browning, 2015). These
staggering numbers are daunting for college athletics because athletes can reach these
millions of people with a single post. Due to this risk, the NCAA has made decisions
about student-athletes’ usage of these social media outlets. Social media training has also
become a part of many athletic programs in order to educate student-athletes on conduct
that is and is not acceptable.
Athletic programs like those at UNC, The University of Miami, and Boise State
have all dealt with issues concerning their player’s social media usage (Walsh, 2011). In
each of these cases, athletes were posting comments that not only negatively reflected on
them as players, but which were also a poor reflection on the institution. Due to these
incidents, Student Athlete Handbooks and staffing in affected colleges and universities
have been updated to include someone to monitor social media use by student-athletes.
Some researchers have argued that banning and even monitoring their athletes’ social
media accounts interferes with first amendment rights (Hernandez, 2013; Walsh, 2011),
but universities continue to make these decisions.
More and more universities are starting to use social media as a way to brand their
institution. Students who write discriminatory, negative, or controversial comments bring
Page 42
30
the wrong kind of media attention to these universities (Sanderson, 2011). For example, a
USC football player tweeted about being upset over having to spend his winter break in a
city like El Paso, Texas (Hernandez, 2013). This might not be a big deal to some, but
since the athlete was representing USC, the city of El Paso was not happy, resulting in
some tension between the city and university.
For fans, social media are ways they can have more of a connection with their
favorite programs and access to information they might not otherwise have (Hipke &
Hachtmann, 2013). They are able to defend their favorite athlete or be part of bashing an
athlete based on their sports performance or anything an athlete posts. This can create an
environment where an athlete feels he has to defend himself, which in turn could create
unwanted attention for the university (Sanderson, Browning & Schmittel, 2015).
However, the ability to be able to engage with fans or favorite players is a way of
communicating and connecting that is not going away.
Social media allows the convenience of sending out messages whenever you
want, and being able to check what people are saying about you just as easily (Sanderson,
Browning & Schmittel, 2015). With athletes so visibly in the public eye and representing
their university, it is important that they are educated about how to use these outlets
effectively and appropriately. Social media have created a way for universities to
communicate with fans in a way that is easier and more relatable than reading a
newspaper. Since social media are just now showing their impact on various
environments, this is a topic that is seeing a lot of growth and interest as more social
media sites become popular among the college demographic.
Page 43
31
Gender and Sports
Numerous scholars have directed their research to investigate gender differences
in college athletic departments. Due to social expectations, men and women generally
approach and participate in athletic departments differently. Harrison and Lynch (2005),
conducted a study about how social roles impact athletes. They highlighted how men
would prefer to be seen as athletic stars, while women would prefer to be remembered as
school leaders. Similarly, Daltry and Chester (2013), discussed how male and female
athletes can be perceived differently, just based on their visual appearance. For example,
a woman who has a more masculine appearance, perhaps seeming to be more aggressive
or more dominant creates a stereotype used to label particular female athletes. These
types of comparisons can be uncomfortable and can lead to poor treatment of female
athletes (Daltry & Chester, 2013; Diacin & Lim, 2012).
Another gender difference that is often written about is the equality of sports.
Most athletic departments have more male than female sports, resulting in an imbalance
of attention. In a study conducted by Hoeber (2008), men saw equality in athletics as
benefiting women more so than men. Likewise, Mahony, Riemer, Breeding and Hums
(2006), found that women were stronger supporters of equal disbursement and reductions
of funds and opportunities, while their male counterparts believed decisions should be
made based on the overall need for, and contribution to, the program. Since males are
usually in revenue producing sports like football and basketball, their ideas of how the
monies should be dispersed tend to be in line with their personal environment.
Other studies have compared men and women to see if they participated in sports
for the same or similar reasons. Secondly, they wanted to see if both genders derive
Page 44
32
similar gratification by playing sports. One study showed men reported higher motivation
from competition, being recognized by people socially, possessing strength, endurance,
performance ,and other ego-related factors, and being challenged when compared to
females (Kilpatrick, Hebert & Bartholomew, 2005, whereas in the same study, women
rated weight management higher than men did. Warner and Dixon (2015), reported men
and women viewed competition differently, which has an impact on their overall
experiences in their respective sport. It has been argued these differences are based in
large part on social and cultural norms that society has imposed on these gender groups
(Warner & Dixon, 2015).
Sports has been labeled as a male dominant world, and numerous sports
organizations have proven this to be true. In 1972, Title IX was a law that was introduced
to ensure that women and girls are treated fairly in athletic programs in terms of benefits
and resources. However, women do not coach men, nor do they commentate on men’s
games, nor consistently referee them. Until there is more of a balance in women's
participation in all levels of sports, women will be viewed as participating in sports for
different reasons compared to males. Work-family conflict, gender ideologies, and male
dominated networks are all justifications that have been used not have women
represented equally in athletic departments (Diacin & Lim, 2012). The literature on this
topic is growing and conversations have moved into popular sports networks, so the
literature on this topic should expand.
To Pay or Not to Pay
A popular student athlete is one of the most visual representations of a university.
For example, when an athlete does really well at a particular school, on some level, they
Page 45
33
are what people talk about when that school comes into a conversation. Johnny Manziel,
and other players who generate similar levels of attention, are staple topics of
conversation for student-athletes that creates attention and awareness for universities.
Due to the power and attention these student-athletes bring to their universities,
spectators and student-athletes themselves continue to wonder, “Why don’t student-
athletes get paid? There is not necessarily a right or wrong position on this issue,
researchers have presented valid points on both sides, it simply illustrates another way
student-athletes must deal with outside issues while attending college.
Paying Student-Athletes
There is literature that brings paying college athletes to the forefront of
conversations. One of the reasons the idea of paying athletes is so prevalent in sports
literature is because of the salaries paid to the coaching staff. Many people making the
decisions on salary feel that since coaches run multi-million-dollar organizations, they
deserve a $1- $4 million dollar salary (Weaver, 2011). Some coaches who coach bigger
programs make more than that on a yearly basis. Nick Saban, Mike Krzyzewski, and
John Calipari are head coaches who have a base salary of $7 million dollars or more
(Sanderson & Siegfried, 2015). These coaches’ salaries are determined by the revenue a
school makes on a particular sport, the overall funds that school has available, donors,
and of course by how their athletes perform (Weaver, 2011). The issue with this is,
athletes whose performances result in their coaches getting higher salaries do not gain
anything for their successes.
Another focus of the literature is universities and conferences which obtain large
TV and endorsement contracts as another source of revenue which results from athletic
Page 46
34
success. The Big Ten Network and The Longhorn Network are examples of TV channels
that focus on college sports. The total annual revenue stream for each of these networks is
$9 million (Weaver, 2011), and $15 million (Mondello et al, 2013, p. 108) respectively.
The Pacific-12 Conference signed a 12 year $3 billion contract with ESPN and Fox in
2011 (Gregory, 2013). BCS games in football as well as March Madness for college
basketball are two other special seasons where sports generate very high revenues
(Sanderson & Siegfried, 2015; Suggs, 2009; Weaver, 2011). CBS agreed to pay the
NCAA $6 billion over 11 years for March Madness and $320 million for BCS bowl
games over four years (McCormick & McCormick, 2010).
The NCAA regulates the amount of time an athlete can spend training and
practicing as a team at no more than 20 hours per week. However, athletes still have to
travel to games, play in games, and receive no additional benefit for dedicating this extra
time. Athletes usually report to school early for the start of the year (volleyball and
football), or have shorter Christmas and Spring Breaks (basketball, softball, soccer,
baseball, and track) because their sports are about to start, or are in progress. These are
more examples of extra time athletes spend on their sports with no compensation.
All of these factors, whether they involve marketing athletes via social media the
school’s website, distributing fliers about an event, or displaying names on the backs of
uniforms, are ways universities make more money, and get more publicity, at the expense
of student athletes. An athlete who has their face on the school's website or on a billboard
in town, or on the highway, is not allowed to be paid for their face and their reputation to
be on that advertisement. Further, athletes are also not allowed to make money for selling
Page 47
35
their autographs or any memorabilia they have per NCAA policy (McCormick &
McCormick, 2010).
Not Paying Student-Athletes
On the other side of the coin some scholars believe there are valid reasons for not
compensating student athletes. A very strong case is made by asking how a salary would
be determined for athletes. For example, if you look at a football team there are 11 people
on offense and just as many on defense. Do you pay certain positions more than other
positions or does everyone get the same amount of money? What about someone who is
on the team but who does not play as much as the star players? What is fair, and is pay
based on talent or another factor (Sanderson & Siegfried, 2015). Similarly, what about
various sports, do they make as much money as other sports? In most universities,
football and men's basketball generate the most revenue (Sanderson & Siegried, 2015).
Are they the only sports that should get paid? What about golf, tennis and softball?
Many scholars have argued that because many athletes receive scholarships and
other bonuses that constitutes their compensation. Since they are student-athletes they are
supposed to be in an environment where being a student is their top priority, not receiving
a check to attend school.
The literature also highlights the balancing act of different conferences and how
they impact the financial side of the NCAA by noting that not all universities are able to
acquire these large contracts. That leaves the majority of schools in a bind as far as
finances are concerned. There are the Power Five conferences (Harrison & Bukstein,
2014; Osborne, 2014), which includes the Big 12, SEC, PAC 12, ACC, and the Big Ten.
These are the conferences that get large TV deals for their sports. The other conferences
Page 48
36
do not have the luxuries of these deals. In fact some of these conferences do not make
any profit from their sports programs, and have to come up with different ways to
generate salaries for their athletic staff. If the Power Five conferences start to pay their
athletes, how do smaller schools compete?
One last reason the literature suggests it might not be a great idea to pay student-
athletes is because that would essentially make them an employee to their coaches. An
employee-boss relationship works very differently than a player-coach relationship. With
the average athlete being between the ages of 18-24 that would put them in an unique
situation where they would have to discuss contracts and make big decisions, without
much experience. That added pressure would just be another hurdle student-athletes
would have to overcome. An added expense of this negotiation would be having to have a
lawyer and an agent in order to make sure you make the best decision possible. This
alone could change the way the athletes prepare for their futures and the landscape of
college athletics.
There is not a right or a wrong answer to the question of whether student-athletes
should get paid for their contribution to college sports. In fact the literature gives
conflicting reasons for paying and not paying college athletes. These athletes bring
awareness to their respective schools and enable their coaches and universities to make
profits based on their talent. The question of student-athletes being compensated is not a
new topic in the literature, but as schools acquire bigger contracts and as the demand for
college sports grows, it is a conversation that is becoming more timely. Often, college
athletics gets just as much attention, if not more, for some sporting events, than
Page 49
37
professional sports. And, since college athletics is viewed as the front porch for
universities, this is a conversation that will not disappear any time soon (Buer, 2009).
Scandals Impacting Student Athletes
Another challenge that can impact athletes concerns getting class credit for
classes that do not actually exist, or getting credit for completing classes based on
someone else’s work. One of the earliest controversial instances happened at Southern
Methodist University (SMU). In the 1980s SMU was given the death penalty by the
NCAA for recruiting violations (Gould, 2012). The death penalty is when an entire
athletic program is shut down for one year. Over a period of time SMU was found guilty
of paying their recruits and giving them benefits they were not supposed to have, which
lead to the football program being cancelled entirely from 1987-1988. The impact on
student athletes was somewhat alleviated as all the players were allowed to transfer to
other schools. In March 1999, a story broke about the University of Minnesota being
investigated on allegations that a basketball manager had written more than 400 papers
for 20 players over a span of five years, this also resulted in a suspension for four players
(Waters, 2012). At Florida State University, in 2007, 60 athletes, involved in over nine
sports, were implicated for cheating on tests given over the internet (Glum, 2014). Other
schools such as Ohio State University, the University of Tennessee, the University of
Southern California, Auburn University, the University of Alabama, the University of
Georgia, Fresno State University, St. Bonaventure University, East Carolina, Notre
Dame, Southern University, the Naval Academy, the University of Virginia, and Harvard
represent just some of the universities that have faced sanctions, suspensions, or fines by
the NCAA for playing a role in helping their athletes get easy grades (Glum, 2014;
Page 50
38
Gould, 2012; Hamilton, 2004; Mayo, 2011; Pennington, 2012; Rishe, 2011). Recently,
the University of North Carolina (UNC) was once again in the news for a fake class
giving students fake A’s and B’s over a span of almost two decades (Beard & Dalesio,
2014).
While all of these universities had their own separate scandals with their athletic
departments, each one of these scandals has the potential to put a cloud over athletic
programs across the country. An even bigger issue is the impact on students who are
cheated out of an education that should have prepared them for their post-athletic careers.
This also creates the image of athletes not having to work hard at school and impacts the
student athlete’s ability to take school seriously. When the supporting cast of people
around the athletes, such as coaches, professors, counselors, tutors, and others
consistently do not hold them accountable to being honest when it comes to academics, it
contributes to a major role conflict, as their respect for grades diminishes.
Theories Typically Used in Writing About Athletics
Balancing identities is a normal part of being a student athlete. Three important
roles that athletes have to balance are academic, social and athletic. Demands associated
with each of these roles must be balanced in order for athletes to be successful in all
environments. The literature highlights various theories of identity that have been
researched in numerous studies concerning athletes. Self-determination theory and social
identity theory are two philosophies that continuously appear in the literature. Each of
these plays a role in how athletes perceive their responsibilities and consequently either
excel, or under-perform, within their athletic environments.
Page 51
39
Self-determination theory (SDT) focuses on motivation for the gratification that it
can produce (Readdy, Raabe & Harding, 2014). The focus in SDT is on the need for
competence, autonomy, and relatedness, which lays a foundation for humans
(Hollembeak & Amorose, 2005). Along with an intrinsic motivation element, SDT brings
into account an extrinsic motivation piece that can lead to an individual being
determined. Intrinsic motivation focuses on an individual who engages in an activity for
the specific pleasure derived from the activity (Hollembeak & Amorose, 2005). External
motivation is used when the decision to engage in an activity is based on external reasons
(Holmberg & Sheridan, 2013). When applying SDT to athletes, their ability to be
intrinsically motivated relates to being stimulated while learning a skill, engaging in a
skill, or accomplishing tasks. In practice, lifting weights, watching films, or any activity
that provides an athlete the opportunity to improve their sport, employs intrinsic
motivation. On the other end of the spectrum, making the coach happy, avoiding
punishment, seeking approval, enjoying social elevation, or any outside force, is a way
that athletes can be motivated extrinsically (Hollembeak & Amorose, 2005; Holmberg &
Sheridan, 2013). In most of the conversations about SDT, athletes are used as an example
of how this theory works and how it can influence an individual.
Social identity theory (SIT) was developed in an era of crisis, in the 1970s, as a
way to explain horrors like the holocaust, and how groups create norms (Hornsey, 2008).
Tajfel and Turner (1979), introduced SIT as a social-psychological theory that attempts to
explain cognitions and behaviors with the help of group-processes (Trepte, 2006 p. 256).
Social identity theory states that individuals make sense of the world by identifying in a
social group they feel is important (Carlson & Donavan, 2013; Killeya-Jones, 2005;
Page 52
40
Samuel & Tenenbaum, 2011; Yukhymenko-Lescroart, 2014). There are three
components of social identity theory, social comparison (individuals seeing if what they
believe in matches those in a particular group), social identity (a person’s self-concept
together with the value and emotional significance attached to the group) and self-esteem
(the confirmation of their own self-definition and acceptance) (Stets & Burke, 2000;
Trepte, 2006. Each of these three components has an impact on how, or if, an individual
can identify with a particular group. A social group is a set of individuals who are able to
share a common identification or view themselves as a part of the same social category
(Stets & Burke, 2000). Being able to identify with a social group, or characteristics of
that group, is when SIT is at its strongest. There are various categories with which a
college athlete can identify throughout their career. Being a student athlete, engaging in a
specific sport, being a scholarship recipient, experiencing an injury, being a freshman,
sophomore, junior, senior, or being male or female, and any other way a group can be
formed in athletics, are all examples of how student athletes use social identity theory.
People behave in cohesion with the group they self-identify with (Stets & Burke, 2000),
and athletes seem to have a lot of elements in common. SIT can be carried out throughout
the nation and set a standard for what athletes deem as normal. For example, a school in
Ohio can see some ways that an athletic program in California is improving their athletes
or developing a style of play that is effective. Since both of these programs fall in the
same social group they are essentially able to imitate the other in hopes of getting
positive results. The power of SIT can be a very positive tool if the social groups use it in
that manner.
Page 53
41
These two theories illustrate the environments that athletes find themselves in and
explain how an athlete can feel comfortable in their environment as well as feel like an
outcast. Self-determination theory is all about what drives an athlete to continue to not
only be prepared at every phase of their games but also what can keep them focused on
achieving their goals. Social identity theory can be used to explain how athletes can
position themselves in their environment and what they hold themselves accountable.
College Athletes in Transition
There is not a lot of literature, past or present that talks about the transitions
college athletes go through after their eligibility is finished in college. Regardless of
whether these athletes go on to play professionally or enter a different workplace, the
transition for these athletes is not always easy.
Pearson and Petitpas (1990) address commonly anticipated and unanticipated
transitions faced by athletes. They point out that not making the team, experiencing a role
change within the team, and injury retirement all function as barriers to successful
transitioning. They discuss looks at transitions as developmental incidents, and explores
how different feelings and reactions can be prevented. Although prevention is a great
coping method, it is not something that can always be done. When someone has played
their last game, they have poured their heart and soul into that effort. In the end, they still
have to deal with what it means to not have that sport occupy the same place in their life
as it once did. An individual can prepare themselves for these feelings, but how they deal
with these feelings depends on a multitude of factors.
Baillie and Danish (1992) analyzed various aspects of the career transition
process that happens with college athletes. The article examined the process of forming
Page 54
42
an athletic identity in childhood, and determined how participating in sports becomes a
way of life. While the study explored what the transition meant, ways to cope with the
drastic change were an important part of the research. Although dealing with injuries is a
common aspect in athletics, moving beyond this experience, becoming a former athlete in
the process, was also addressed. The connection to the athletes’ identities was linked to
how that impacted their transition after their athletic careers had ended.
Wylleman and Lavallee (2004) investigated how the transition of college athletes
can be an emotional experience not only for themselves, but the people that are in their
close environment—including parents, children, and friends. Having family members
who have been around, and who always associated this individual with a sport was a
piece of someone’s identity. While the element of transitioning can be related to the
athletes themselves, parents and family members should be included in the transition
process as well. While college athletes deal with their own fears and doubts about what is
next for their lives and try to create a new identity, it becomes imperative to have a
positive support system. This article also focused on the whole athlete and how that can
affect how the individual is able to transition into different journeys. Understanding how
people around the athletes behave contributes to better accommodating the athletes.
Each of these articles takes a various piece of college athletes in transition and
explains what could happen in certain transitional phases. They also highlight struggles
and situations that could arise, and the different effects they could have on individuals. It
is important to realize, for athletes, meeting both the coach’s expectations along with
teammate expectations weighs heavily on them. Although figuring out the next step in
life is an important part of transitioning out of the athletic life, self-searching and
Page 55
43
understanding the pressures and expectations to come, can be an integral part of building
up an athlete before they leave their sport. Transitioning is not something that colleges
and universities have a class for, nor is it something that is talked about very often. When
preparation becomes a piece of your everyday life, then suddenly that preparation falls
solely on one person and dealing with this can be challenging.
Methodologies Used in Past Research on Student Athletes
The main methodologies that have been used in previous research on this topic
are quantitative methods for validation of measurement tools to measure athlete’s
feelings and perceptions (Chen et al., 2010; Huffman & Cooper, 2012; Killeya-Jones,
2005; Lavallee et al., 1997; Paule & Gilson, 2010). Other researchers have used
qualitative methods such as interviews and case studies (Baillie & Danish, 1992; Lally &
Kerr, 2005; Miller & Kerr, 2003; Schroeder, 2010), to explore the experiences of athletes
and former athletes.
Each of these research techniques has advantages which have helped to solve
problems and work through identified challenges. With most college athletic research, the
goal is to understand the student athlete’s environment and gather information that can
improve the overall experience. An advantage of quantitative research is it provides
measurement tools that can obtain data to help athletic departments function better
because more people are able to participate in surveys. Qualitative research provides a
space for athletes to tell their stories and talk about specific events that have made a
positive or negative impact. Another advantage of qualitative research is the student
athletes are able to give specific information about what can help their experience and
ways to make the department be more beneficial to the athletes. For this study a
Page 56
44
quantitative approach allowed more participants to be surveyed, which helped get more
information on the overall population. Because college campuses are populated with a
diverse group of people, using this method can also capture more diversity.
Career Exploration
The expectation for athletes to spend additional time on their sport practicing,
playing in games, working out, or attending study hall comes along with the athletic
environment (Tyrance, Harris & Post, 2013). Due to these demands on time, it can be
challenging for student athletes to explore various career plans (Chen et al., 2010; Lally
& Kerr, 2005). Career exploration is a topic that is briefly mentioned in various literature
but not as much as other topics that more specifically pertain to athletes.
One of the more recent articles about career exploration focused on career
planning and attitudes among NCAA Division I student athletes (Tyrance et al., 2013). In
this study, participants were surveyed to determine their overall career adaptability,
knowledge and optimism. Each of these was compared to the individual’s identity, race,
gender, sport, and their expectation to play professional sports (Tyrance et al., 2013).
Lally and Kerr (2005) conducted a similar study but used interviews and the experiences
of athletes to determine their career planning. In both studies, the particular sport, and the
degree to which an individual identified as an athlete, impacted their overall career
exploration. Implications of both articles suggest that career counselors and the NCAA
can benefit from a better understanding of career exploration for college students in order
to help them develop their future (Lally & Kerr, 2005; Tyrance et al., 2013).
Career exploration is a process that involves at least a basic understanding of
where, how, how much, and what to investigate about careers and career opportunities
Page 57
45
(Stumpf, Colarelli & Hartman, 1983). From this definition it is important to understand
all four of these categories as it relates to each participant.
Personality Type
Personality types provide insight into the foundation of an individual’s personality
and the impact personality has on an individual determines their trajectory. In particular,
an individual’s personality can be a factor in regards to how they perceive their current
situation.
The variety of backgrounds and experiences that college students bring with them
to campus, can play an important role in shaping a campus environment (Hyman & Van
Jura, 2009). Intercollegiate student-athletes are a subgroup of students who frequently
face adverse conditions (Galli & Reel, 2012).
The personality test that was used for this study is the Reduced Big Five
Inventory - 29 (BFI - 29). The big five dimensions provide a model of personality
structure that represents the co-variation among personality traits across individuals. It
does not use single adjectives for items that need to be answered because those have
shown less consistency (John & Srivastava, 1999). The BFI uses short phrases based on
trait adjectives known to be prototypical markers of the big five. The BFI has 29
questions which are used to determine an individual’s dominant personality type. It tests
for five personality types, agreeableness, conscientiousness, extraversion, neuroticism
and openness. Each of these personalities have different traits. The specific personality of
an individual was one of the factors tested in this study to see if it predicts career
maturity. Others have written about how personality can impact sports and individuals
(Allen, Greenlees & Jones, 2011; Allen, Frings & Hunter, 2012). Each of these articles
Page 58
46
highlights the five factors that make up the BFI. Even though the BFI originated in 1999,
it is not commonly written about in the context of comparing college athletes and non-
athletes and how personality types can be used as an impactful variable.
Reiter, Liput and Nirmal (2007) conducted a study that focused on the perceived
personality types of college athletes versus their non-athlete counterparts. The study did
not yield any statistically significant differences between perceptions of athletes and non-
athletes. However, some results showed different personality types rated higher than
others (Reiter et al., 2007). Environments that athletes and non-athletes experience could
have an impact on these scores and provide more insight into how their personalities are
perceived. Myers-Briggs Type Indicator was used as a personality measurement with
results indicating that student athletes rated higher in feeling comfortable sensing their
environment and being extroverts more than their non-athlete counterparts (Reiter et al.,
2007). These results alone can be significant in determining variables that could impact
an overall perception of college athletes and non-athletes. As indicated in these studies,
personality tests can show how people see the world and can be a determinant for how
individuals make decisions. For the current study each participant took a personality
assessment to see if personality traits impact someone’s ability to develop career
maturity. Not many studies have examined the ability of psychological variables to the
predict career maturity in student-athletes (Kornspan & Etzel, 2001). This study uses
personality tests as a psychological variable and attempt to make that examination.
Career Decision Making Self-Efficacy
Bandura’s (1977) self-efficacy article presented a new way to look at behavioral
change and predict psychological changes. Self-efficacy allows for each individual to
Page 59
47
evaluate their own expectations and ability to execute a certain behavior or complete a
mission (Bandura, 1977). Building on Bandura’s model, the career decision making self-
efficacy scale (CDSMES) was created in order determine someone’s self-efficacy with
career decision making. This scale was selected from behaviors of the five career-choice
competencies (accurate self-appraisal, gathering occupational information, goal selection,
making plans for the future and problem solving) which were believed to be relative to
career decision making (Taylor & Betz, 1983).
In 2000, Brown et al. conducted a study that used CDMSE as a variable to
determine how athletes felt about their overall ability to make a decision. The mean
CDMSE score for the sample of student-athletes was less than the mean reported by Betz
et al. (1996) for their sample of college students. Conversely, Fogarty and McGregor-
Bayne (2008), conducted a study in Australia that was an exact replica of the Brown et al.
study, but their results showed athletes did not have less impact on career development
self-efficacy. In the 2000 study, there were more males who were tested as well as more
dominant sports, such as football, soccer and baseball, with football having a higher
percentage surveyed at, 31% (Brown et al., 2000). The study in Australia, used netball,
golf, swimming and triathlon, with netball contributing the highest percentage of 10%
(Fogarty & McGregor-Bayne, 2008). In these two studies the CDMSE was used to
understand how the athletes rated their own self-efficacy relative to career decision
making.
Finch (2009), conducted research among student athletes across three division-
one universities, about their roles as students and athletes and how that impacted self-
efficacy for career decision-making. This study concluded that student identity for their
Page 60
48
sample was a significant predictor of career decision-making self-efficacy (Finch, 2009).
This highlighted the importance of these athletes gaining a student identity. Each of these
studies utilized CDMSE as a measurement tool in order to show each participants
expectations. Comparing student athletes and non-athletes will provide more research in
the field, and give a more detailed outlook about the role CDMSE plays in the overall
career maturity.
Socioeconomic Status (SES)
Investigating the literature on athletes who come from low income backgrounds
compared to high income backgrounds reflects a story of disadvantage and struggle.
Coakley (2008), suggests that many people in the US see sports as a sphere in which
people from low-income and poor backgrounds can experience upward social mobility. If
athletes are coming into college with the mindset of sports changing their life financially,
this could backfire, depending on the struggles they experience during college. Loughran
and Etzel (2008), suggest the culture of collegiate athletics may inadvertently contribute
to the difficulties endured by some athletes from a lower SES background. Coming from
an environment where money is not as freely used as others can impact an athlete
tremendously on a personal level.
Not having family support through attendance, not having the proper dress attire
for game days, and not being able to visit and see family during breaks can all be ways
that an athlete can be negatively impacted by low SES. Not very much research has been
conducted on low SES students’ college experience or how attending college plays a role
in their career preparedness. However, there have been studies that focus solely on
African American student athletes’ academic performance (Reynolds, Fisher & Cavil,
Page 61
49
2012) and how specific players are impacted (Huffman & Cooper, 2012). Which may be
relevant since many African American athletes come from a low SES background, given
historic socio-demographics of the US. Low SES students are all around college
campuses and it is important to give these students a voice. Social status can have an
affect not only on a student’s confidence, but also on their behavior. And, behavioral
decisions can be costly. Although students with low SES backgrounds have been and will
be the focus of policymakers, little is known about the impact on, and outcomes of,
college for these students (Walpole, 2003).
Career Maturity
Before 2000 there were many researchers who were testing and writing about
career maturity of college athletes (Blann, 1985; Brown & Hartley, 1998; Murphy,
Petitpas, & Brewer, 1996; Smallman & Sowa, 1996). Some looked at the overall maturity
of college athletes and others looked at different variables which could impact the
athlete’s career maturity. There were comparisons between athletes and non-athletes in
college (Blann, 1985; Sowa & Gressard, 1983) as well as studies about just athletes
(Brown & Hartley, 1998; Murphy et al., 1996). These studies showed that athletes had
less career maturity than non-athletes (Blann, 1985; Sowa & Gressard, 1983), and when
there was a relationship comparison between athletic identity and career maturity, a
higher athletic identity correlated to a lower career maturity (Brown & Hartley, 1998;
Murphy et al., 1996; Smallman & Sowa, 1996).
In 2001, Kornspan and Etzel examined the relationship of athletic identity, career
self-efficacy, career locus of control and various demographic variables to test the
prediction of career maturity at a junior college. This was the first study conducted for
Page 62
50
junior college athletes to determine their overall career maturity (Kornspan & Etzel,
2001). The findings of this study revealed that career self-efficacy and career locus of
control were the two variables that had the most impact on career maturity, which refuted
the belief that athletic identity has the most significance of career maturity (Kornspan &
Etzel, 2001). The study indicated that career locus of control and career self-efficacy
were the most influential variables in the prediction of career maturity on junior college
athletes.
Linnemeyer and Brown (2010), compared career maturity and career foreclosure
to college athletes, fine arts students and general college students. The results of this
study suggested that college athletes have lower career maturity when compared to both
of these groups (Linnemeyer & Brown, 2010). The main difference between these two
studies is Kornspan and Etzel’s (2001) study was at a junior college, and they did not
compare athletes to any other populations. Based on the amount of literature, variables,
and different environments that have been studied, there is still a need for continual
research in the area of career maturity.
Given the evolution of college sports, and the increased levels of attention and
money college sports bring to a university, a variety of different learning opportunities
are being created to help bridge the gap between athletes’ career development relative to
non-athletes (Shurts & Shoffner, 2004). However, these academic support services play
an important role in empowering these individuals to make beneficial decisions
(McPherson, 2013). If career maturity is a prerequisite of the ability to make wise and
realistic occupational decisions (Busacca & Taber, 2002), it is an important tool for
college students to have.
Page 63
51
Conclusion
College can provide many unique opportunities for students as long as they are
willing to work hard and stay motivated. College athletes in particular can teach lessons
on the importance of healthy competition, work ethic, teamwork and overall personal
awareness in order to be successful (Hyman & Van Jura, 2009). One of the perceptions of
college athletes is that in order to remain eligible per NCAA rules they are able to put all
their energy towards their sport, do minimum academic work, have easy classes and
others are there to do their schoolwork (Simons, Bosworth, Fujita, & Jensen, 2007).
Athletes experience their own challenges and have to find a way to remain successful in
their environment. Gaining career maturity will play a role in college athletes leaving
college knowing the options that are available after sports. Leaving college with a high
level of confidence, direction and stability will be helpful for these student athletes.
Page 64
52
III. METHODOLOGY
The methodology section provides an overview of the analytic method, study
design, key terminology, endogenous and exogenous variables that were used to develop
a path model to determine the statistically significant variances in career maturity
between student athletes and non-athletes. This study is designed to understand statistical
significance with a set of variables that were measured against college students at a
Division I University in Central Texas. This chapter is divided into 11 sections: (a)
analytic method, (b) study design and theoretical basis, (c) variables in the study, (d)
instruments, (e) path analysis model development, (f) path analysis symbol identification,
(g) population and sample, (h) data collection, (i) data screening, (j) data analysis, and (k)
key terminology related to path analysis modeling and correlations, and a summary.
Analytic Method
Path analysis is the analytical method that was used to determine the significance
of the correlations of the endogenous and exogenous variables. This method is
appropriate for three reasons: (a) variables are explicitly specified as to how they relate to
one another, (b) it allows the researcher to break down the various factors affecting an
outcome into direct effects and indirect components (Lleras, 2005), and (c) it provides the
ability to simultaneously assess various types of relationships and compare similarities
and differences between groups in a study (Olobatuyi, 2006, p. 12). For this study,
Streiner’s (2005), path analysis concepts were used in order to effectively examine the
complexity of the model and compare the different groups (p. 115).
Page 65
53
Study Design and Theoretical Basis
This research was examined from the perspective of college students from one
Division I university in central Texas. Athletes, non-athletes, gender and academic
classification and race were the groups that were compared. Based on recent growth, and
its proximity to major cities and new organizations in surrounding areas, this university
provided a desirable study location. Having a variety of different sports and various
students on campus who are involved in a range of activities will help to have a diverse
sample.
Prior to conducting this research the athletic director and academic advisors met
with the principal investigator in order to determine the best times to survey their
athletes. Each sport was in charge of creating their own time to allow the students to
complete their surveys. Some were conducted during study hall, before and after practice.
Due to the track and field team being so spread out and not having a chance to catch them
all at the same time, they were given the same survey online. The study took place in the
Spring 2015 semester and all the students were currently enrolled at the university.
Working within a critical realist framework, this study will provide context about
how participants assess their current situation. Critical realism also produces an
explanation that identifies entities and mechanisms that connect to individuals (Easton,
2010). Each participant will have the ability to pick the connections that speak to their
world.
Page 66
54
Variables in the Study
The exogenous variables were Career Exploration (CES-R), Personality Type
(BFI - 29) and Career Decision Making Self-Efficacy (CDMSE-SF) and Socioeconomic
Status (SES). The endogenous variable is Career Maturity (CMI-AS).
Instruments
There are six instruments that were used for this research. They include: (a) a
demographic instrument which determined the classification of the participants, (b) the
Career Exploration Survey (CES-R) which measures how much the participant has
explored career options, (c) the Personality Test (BFI - 29) that determined their
personality type, (d) the Career Decision Making Self-Efficacy Scale-Short Form
(CDSME-SF) that determined their ability to make a career decision, (e) a socioeconomic
status measurement (SES) that determined the social background of each participant, and
(f) the Attitude Scale of the Career Maturity Inventory (CMI-AS) that determined the
overall career maturity of each participant. Together these instruments provided an
explanation of the impact of each variable. Each of these instruments were a part of a
packet that was passed out, by the researcher, to each participant for completion Some
participates also were able to take the survey from an online link, that was identical to the
pen and paper survey. Each of these instruments is discussed in greater detail below.
(a) Demographic Instrument. A demographic instrument was created to have the
student-athletes and non-athletes document their responses to questions about
how they identify. These questions include age, gender, academic
classification, major name the sport they participate in, if applicable, identity
as a college athlete or non-athlete and the option of identifying their ethnicity.
Page 67
55
(b) Career Exploration Survey. The Career Exploration Survey (CES) is a
measurement tool that was used to gauge career-search activities, reactions to
exploration and beliefs about exploration opportunities (Stumpf et al., 1983).
Developing the instrument over four different studies, with an undergraduate
population; a coefficient alpha of .88 was reported. An example of a sample
question is, “Obtained information on specific jobs or companies.”
This measurement tool is a self-exploration assessment that requires
individuals answer questions so their classification can be determined. There
are three dimensions that are measured in the CES instrument that are used to
determine an individual’s exploration process, reactions to exploration and
beliefs (Stumpf et al., 1983). Each one of these dimensions is determined by
answering 28 questions on a Likert scale from 1 being never to 5 being a
great deal to determine how much an individual is engaging in career
exploration. Extant research demonstrates the CES does not have any gender
biases and has the ability to predict meaningful career exploration outcomes
(Stumpf et al., 1983). CES was helpful for the study and used as a variable to
determine the impact of career maturity among all participants.
(c) Personality Test. The reduced Big Five Inventory - 29 was developed to
measure the five personality factors of: (a) agreeableness (good-natured,
unselfish, and forgiving), (b) conscientiousness (organized, punctual, and
hardworking), (c) extraversion (sociable, outgoing, and active), (d)
neuroticism (anxious, hostile, and irritable), and openness (curious, creative,
and imaginative) (John & Srivastava, 1999). The original BFI tool had a total
Page 68
56
of 44 questions, but a recent study concluded that some of the questions were
not properly worded and could lead to a discrepancy when participants were
answering questions (Leung, Wong, Chan and Lam, 2013). Due to this finding
the BFI - 29 was used to determine which personality type is ranked highest
among each participant. Participants are required to indicate on a 5-point scale
from strongly disagree to strongly agree, if the statement identifies them.
For the current study the reliability for each personality type is as follows:
Agreeableness .69, Conscientiousness .71, Extraversion .72, Neuroticism .81
and Openness to experience .77 for an average of .74. The subscale with the
highest rating determined the individual’s most dominant personality to the
lowest number being the least dominant. Identifying each student’s
personality was a substantial factor to see if it had an impact on career
maturity. This measurement also provided an opportunity to see if student
athletes are different from their non-athlete counterparts. The BFI has shown
adequate levels of validity and reliability across a range of diverse groups and
this measurement was effective for the sampled population.
(d) Career Decision Making Self-Efficacy Scale- Short Form. The career
decision-making self-efficacy scale (CSMSE-SF) was a scale that was created
in order to measure an individual’s career behaviors. The original form is 50
items and was longer than most researcher and career counselors wanted to
use (Betz et al., 1996). Developing a CDMSE-SF that was as reliable and
effectively measured self-appraisal, occupational information, goal selection,
planning and problem solving that were taken from the long form created by
Page 69
57
Taylor and Betz, in 1983, was imperative. The CDMSE-SF, was reduced to 25
questions and the total score was derived from the sum of all five scale scores
(Betz et al., 1996). The alpha value of .94 for the 25 item scales that the
subscales are sufficient and provide a highly homogeneous general construct
(Betz et al., 1996). The CDMSE-SF uses a Likert scale to gauge confidence
level, with the highest being complete confidence and the least being no
confidence at all. A sample question is, “How much confidence do you have
that you could: Determine what your ideal job would be?”
CDMSE-SF is based on social-cognitive theory and was tested exclusively
among college students (Luzzo, 1996). For the purpose of this research this
scale was assumed to produce valid and reliable information for college
students and college athletes. College sports places different demands on
student-athletes which exceed the demands that are placed on non-athletes
(Brown et al., 2000). It was important to uncover the thoughts about athletes
and non-athletes in this study. Additionally, exploring multiple sports within
the context of self-efficacy helped to eliminate potential stigmas that one sport
might have over others (Shelangoski, Hambrick, Gross & Weber, 2014).
(e) Socioeconomic Status. A socioeconomic status (SES) questionnaire was
developed in order to get a better picture of each participant’s perceived
background. What is the zip code where the participant grew up (Huffman and
Cooper, 2012), were you on reduced lunch in grade school (Dickinson &
Adelson, 2014), and highest level of education for both parents (Dickinson &
Page 70
58
Adelson, 2014; Reynolds et al., 2012; Walpole, 2003), were questions that
were used to determine each participants SES.
(f) Career Maturity Inventory - Attitude Scale. The Career Maturity Inventory
Revised (CMI-R) includes questions that are appropriate for postsecondary
adults and eliminate items that could be influenced by race, ethnicity and
gender (Busacca & Taber, 2002). The CMI-R is a 50 item instrument that is
used to determine the maturity of attitudes and realistic decision making
(Crites & Savickas, 1996). There are two parts to the instrument, that each has
25 questions, an attitude scale (AS) and competency (C) test that give a
number indicating an individual’s career maturity.
For this study, only the Attitudinal Scale of the CMI-AS was used. This
scale measures feelings, subjective reactions, and dispositions that an
individual could potentially have on making a career choice and entering the
workplace after college (Esters & Retallick, 2013). Each question has an “A”
indicating Agree and “D” indicating disagree and a sample question is, “It is
probably just as easy to be successful in one occupation as it is in another.”
At the end of the assessment an overall score of career maturity, ranging from
1 to 25 determined the overall level of career maturity, 1 being the lowest and
25 being the highest. This scale was more efficient to complete for the
participants and has been used for different research when measuring college
students (Kornspan & Etzel, 2001). Crites (1978) reported internal
consistency for the five subscales of the CMI-AS ranging from .65 to .84, with
a combined average of .74, and suggested the revised instrument should have
Page 71
59
a similar reliability and validity since the items were replicas of the older
version (Basacca & Taber, 2002; Crites & Savickas, 1996; Esters & Retallick,
2013; Kornspan & Etzel, 2001).
Table 1
Variables Measured, Instrument Used, and Level of the Variable
Variables Instrument Level of Variable
Career Exploration CES Ordinal
Personality Type BFI - 29 Interval
Career Decision Making
Self-Efficacy
CDMSE-SF Ordinal
Socioeconomic Status SES Question Ordinal
Career Maturity CMI-AS Nominal
Page 72
60
________________________________________________________________________
Figure 1: Path Analysis Model. This model was used across college athletes and non-
athletes.
Path Analysis Model Development
Model development is a tool that is used in path analysis to convey to the reader
the exogenous, endogenous and mediator variables. The placement of each variable
highlights the path of each relationship. The objective of this path analysis was to create a
model that can be supported by current research and tested for significance. The mediator
variable is in place to explain the relationship between the endogenous and exogenous
variables. A mediator variable can have a positive, negative or no impact on the outcome
of a dependent variable. In this model the mediator variable is socioeconomic status
because it is important to see if socioeconomic status impacts the relationship between
the independent variables and dependent variables alone.
Socioeconomic
Status Personality Test
Career Exploration
Career Decision
Making Self-
Efficacy
Career Maturity
Page 73
61
Symbol Definition
________________________________________________________________________
Boxes represent a measured variable that is
either an exogenous or endogenous variable.
A straight single headed arrow represents
a regression parameter between variables.
A multi-headed arrow indicates a covariance
________________________________________________________________________
Figure 2: Path Analysis Symbol Identification. Curran, P. J. & Bauer, D. J. (2007).
Building path diagrams for multilevel models, Psychological Methods, 12(3), 283-297.
Population and Sample
The population that was targeted were students at a Central Texas University and
all respondents had an option to not participate based on the consent form that was the
first page of the survey. Non-traditional students (students beyond the age of 24) were
excluded from the study because that was the maximum age of college student’s athletes
at the University. Furthermore, it was important to compare students that possibly
resemble the same stages in life as the study athletes in the study as compared to non-
traditional students who might be on their second degree, re-entering college, engaging in
different types of peer relationships or already holding a career in their chosen fields. The
sample for the student athletes was purposeful sampling because athletics is a hard
environment to gain access to. For the non-athletes, the sample was a networking sample.
Participants were a result of professors being willing to allow their classes to be surveyed
based on the researcher asking for referrals for other classes.
A total of 637 undergraduate students responded to the survey; however, 502
(78.8%) of these participants were used. The participants that were not used were
Page 74
62
screened out due to their age, only circling one response on every variable assessment
(ex. all 1’s or all 3’s), finishing the survey in less than four and a half minutes and
surveys that were incomplete were all not used for analysis. Participants ranged in age
from 18 to 24, with a mean age of 20.0. The majority of students were female (n=332,
66.1%) and White (n=273, 54.4%). The academic classification breakdown is as follows
freshman n=130 (25.9%), sophomores n=139 (27.7%), juniors n=130 (25.9%) and
seniors n=103 (20.5%). There were 287 (57.2%) non-student athletes and 215 (42.8%)
student-athletes.
Data Collection
Each packet of surveys was handed out to the participants and in the instances that
an online survey was used there was a link sent out. The surveys took about 10 minutes to
be completed online and 13 minutes to be completed with paper and pencil. Each survey
was given a unique number in order to keep track of the participant number. Students
participating in all the sports on the Central Texas University were included in the
surveys along with students from various subject areas around campus.
Data Analysis
Path analysis is a flexible and powerful statistical methodology used to examine
relationships between measured variables. The variables that are being tested can
estimate if the relationships are positive, negative or even zero to show if this model is
supported by the data (Lleras, 2005). Surveyed responses were used to determine the
statistical relationships among the variables. The output from each variable was used to
determine the significance of the relationship of all variables. Each variable produced
Page 75
63
path coefficients which are highlighted on the path diagram to explain statistical
relationships.
The sampled population data from the Central Texas University were entered into
IBM Statistical Package for the Social Sciences (SPSS version 23), in order to obtain
descriptive information for each participant's age, gender, academic classification, sport
information, major, ethnicity/race and SES data. Once all the information was into SPSS,
the Analysis of Moment Structures (AMOS, version 23.0), software was used in order to
get statistical information on each variable as well as to test each path of the variables.
Academic classification, gender, athletes, non-athletes and races were he five groups that
broken down in order to test for significance.
To better understand the statistical significance between group’s z-scores were
performed to determine if any significance difference would occur based on gender of
athletes, academic classification of freshman and seniors, athletes and non-athletes.
Summary
Conducting this research was intended to provide an insight into how two
different student environments (those of student athletes and non-athletes) feel about their
current maturity. It is the assumption of critical realism that the natural and social worlds
are combined and provide more evidence for people in various situations. Path analysis
will combined the environments and ensure that all relationships be tested and each path
was evaluated to understand the influence (Olobatuyi, 2006, p.13). Every variable in this
study is an important component of the students overall perception. Surveying students
on the same campus was intended to provide awareness that can also be very helpful to
the University.
Page 76
64
IV. RESULTS
This chapters offers the results of the statistical analysis for each investigative
path in order to test the 11 hypotheses presented in the study. This chapter is broken
down in four sections: a) descriptive statistics, b) path diagram, c) statistical evaluation of
the research questions, and d) overall analysis.
Descriptive Statistics
A total of 637 undergraduate students responded to the survey however, 502
(78.8%) of these participants were included in the analysis based on age, amount of time
to complete the survey, and the number of questions answered. The response rate among
student athletes was 67%. Participants ranged in age from 18 to 24, with a mean age of
20.0. The majority of students were female (n=332, 66.1%) and White (n=273, 54.4%).
The academic classification breakdown is as follows: freshmen n=130 (25.9%),
sophomore’s n=139 (27.7%), junior’s n=130 (25.9%) and senior’s n=103 (20.5%). There
were 287 (57.2%) non-student athletes and 215 (42.8%) student-athletes. For a completed
list of the participant’s breakdown of age, gender, academic classification and race please
see tables below.
Table 2
Distribution of Sampled Population
Age Gender
Academic
Classification Race Sport
N Valid 500 502 502 502 502
Missing 2 0 0 0 0
Mean 20.00 2.410
Minimum 18 1.0
Maximum 24 4.0
Page 77
65
Table 3
Age
Frequency Percent
Valid
Percent
Cumulative
Percent
Valid 18 75 14.9 15.0 15.0
19 130 25.9 26.0 41.0
20 132 26.3 26.4 67.4
21 80 15.9 16.0 83.4
22 58 11.6 11.6 95.0
23 18 3.6 3.6 98.6
24 7 1.4 1.4 100.0
Sub-
Total 500 99.6 100.0
Missing System 2 .4
Total 502 100.0
Table 4
Gender
Frequency Percent
Valid
Percent
Cumulative
Percent
Valid F 332 66.1 66.1 66.1
M 170 33.9 33.9 100.0
Total 502 100.0 100.0
Table 5
Academic Classification
Frequency Percent
Valid
Percent
Cumulative
Percent
Valid 1.0 130 25.9 25.9 25.9
2.0 139 27.7 27.7 53.6
3.0 130 25.9 25.9 79.5
4.0 103 20.5 20.5 100.0
Total 502 100.0 100.0
Page 78
66
Table 6
Race
Frequency Percent
Valid
Percent
Cumulative
Percent
Valid Black 89 17.7 17.7 17.7
Hispanic 112 22.3 22.3 40.0
Other 28 5.6 5.6 45.6
White 273 54.4 54.4 100.0
Total 502 100.0 100.0
Table 7
Sports
Frequency Percent
Valid
Percent
Cumulative
Percent
Valid Baseball 29 5.8 5.8 5.8
Football 40 8.0 8.0 13.7
Mens_Basketball 6 1.2 1.2 14.9
Mens_Golf 2 .4 .4 15.3
Non_Athletes 286 57.0 57.0 72.3
Soccer 23 4.6 4.6 76.9
Softball 18 3.6 3.6 80.5
Strutters 2 .4 .4 80.9
Tennis 7 1.4 1.4 82.3
Track_and_Field 60 12.0 12.0 94.2
Volleyball 16 3.2 3.2 97.4
WBB 8 1.6 1.6 99.0
Womens_Golf 5 1.0 1.0 100.0
Total 502 100.0 100.0
Page 79
67
Below is an overview of the Path Analysis Model that was used in order to assess
the significance of each measurement.
Figure 3. Research Model to Assess Measurement Significance.
Page 80
68
Specific Research Questions and Explanation
Table 8 shows the parameters for the default model for all of the students in the
model. The statistic b is the slope of the relationship between the two variables. A
negative number indicates that when the value of one variable goes up, the value of
another goes down. S.E. is short for standard error and is a measure of the variability of
the relationship. C.R. is the test statistic (equivalent to z in a z test). In general, when z is
larger than 1.96, the relationship is significance. The statistic p is the probability that the
relationship is random. For this study, the level of significance, α, is set to .05.
Therefore, if p is less than .05 (p > .05), there is a statistically significant relationship (we
reject the null hypothesis). The statistic r is the standardized relationship and is a measure
of effect size or practical significant. It ranges from -1 to 1. Effect sizes are generally
cited as small (+/-.1), medium (+/-.3) and large +/-.5) (Cohen, 1988).
Table 8
Default Model Parameters
b S.E. C.R. p r
SES_Number <--- CES_R -.181 .100 -1.804 .071 -.094
SES_Number <--- BFI -.318 .204 -1.557 .120 -.079
SES_Number <--- CDMSE_SF .270 .114 2.379 .017 .132
CareerMaturity <--- SES_Number .004 .005 .934 .350 .039
CareerMaturity <--- CES_R -.003 .010 -.283 .778 -.014
CareerMaturity <--- BFI .012 .021 .574 .566 .027
CareerMaturity <--- CDMSE_SF .079 .012 6.680 <.001 .349
Page 81
69
1. To what degree is career exploration a reliable predictor of career maturity?
The statistical analysis does not support the assertion that career maturity is
dependent on career exploration.
(C.R. = -.28, p = .78, r = -.01)
2. To what degree is personality type a reliable predictor of career maturity?
The statistical analysis does not support the assertion that career maturity is
dependent on personality type.
(C.R. =.57, p = .57, r = .03)
3. To what degree is career decision self-efficacy a reliable predictor of career
maturity?
Career maturity has a medium, statistically significant relationship with career
decision making self-efficacy.
(C.R. = 6.68, p < .01, r = .35)
4. To what degree do career exploration, personality type and career decision
self-efficacy collectively predict career maturity when included in a single
prediction model?
The model explains 13% of the variance of the outcome variable, career maturity.
5. In what way, if any, does socioeconomic status mediate the relationship
between career exploration and career maturity?
There is no statistically significant relationship between career exploration and
career maturity
(C.R. =-1.804, p = .071, r = -.094)
Page 82
70
6. In what way, if any, does socioeconomic status mediate the relationship
between personality type and career maturity?
There is no statistically significant relationship between personality type and
career maturity.
(C.R. = -1.557, p = .120, r = -.079)
7. In what way, if any, does socioeconomic status mediate the relationship
between career decision self-efficacy and career maturity?
The null hypothesis is rejected because SES is a significant mediator of the
relationship between career decision making self-efficacy and career maturity. As
SES goes up the relationship between the two other variables (career decision
making self-efficacy and career maturity) gets stronger.
(C.R. =2.379, p = .017, r = .132)
In order to answer the next set of question, the data were divided into several
paired groups of students (athletes/non-athletes), gender (male/female), academic
classification (freshmen/seniors) and race (Black /White, and Hispanic /White). The
model was then run for each group and the statistics for each group were compared using
a t-test. If the relationships are different for any of these groups this test yields a
statistically significant relationship with p < .05.
8. What is the statistical difference, if any, between the athletes and non-athlete
groups on research questions 1-7?
To answer this question, the results of athletes and non-athletes were compared.
Page 83
71
Table 9
Non-Athletes Model Results
b S.E. C.R. p r
SES_Number <--- CES_R -.103 .129 -.799 .424 -.055
SES_Number <--- BFI -.425 .278 -1.527 .127 -.104
SES_Number <--- CDMSE_SF .180 .152 1.186 .235 .086
CareerMaturity <--- SES_Number .007 .006 1.141 .254 .064
CareerMaturity <--- CES_R .015 .014 1.101 .271 .072
CareerMaturity <--- BFI .021 .030 .706 .480 .046
CareerMaturity <--- CDMSE_SF .059 .016 3.653 <.001 .253
Table 10
Athletes Model Results
b S.E. C.R. p r
SES_Number <--- CES_R -.232 .166 -1.398 .162 -.109
SES_Number <--- BFI -.199 .301 -.662 .508 -.050
SES_Number <--- CDMSE_SF .385 .171 2.247 .025 .186
CareerMaturity <--- SES_Number .001 .007 .141 .888 .009
CareerMaturity <--- CES_R -.037 .016 -2.281 .023 -.165
CareerMaturity <--- BFI .001 .029 .044 .965 .003
CareerMaturity <--- CDMSE_SF .102 .017 5.981 <.001 .462
The significant relationship for non-athletes is the same as it was for the total population.
However, for athletes, the picture changes and the relationship between career decision-
making self-efficacy and SES is significant.
(C.R. = 2.25, p = .02, r = .19).
There is also a statistically significant relationship between SES and career
maturity for athletes.
Page 84
72
(C.R. = -2.28, p = .02, r = -.16).
In order to test for statistical significance in these two models, each of the
statistics were entered into the following equation to generate a z-score:
If the relationship between two groups, athletes and non-athletes, is significant,
the z will be greater than +/- 1.96.
Table 11
Non-Athletes Compared to Athletes
Athletes Non-Athletes
b1 SE1 b2 SE2 z p
SES_Number <--- CES_R -0.232 0.166 -0.103 0.129 -1.271 0.178
SES_Number <--- BFI -0.199 0.301 -0.425 0.278 0.907 0.264
SES_Number <--- CDMSE_SF 0.385 0.171 0.180 0.152 1.178 0.199
CareerMaturity <--- SES_Number 0.001 0.007 0.007 0.006 -10.936 <.001
CareerMaturity <--- CES_R -0.037 0.016 0.015 0.014 -10.389 <.001
CareerMaturity <--- BFI 0.001 0.029 0.021 0.030 -5.493 <.001
CareerMaturity <--- CDMSE_SF 0.102 0.017 0.059 0.016 2.820 .007
For the variable career maturity, the relationship to predictor variables is
statistically different between the two groups, athletes and non-athletes.
Career decision-making self-efficacy is a stronger predictor of career maturity for
non-athletes than athletes (z = 2.82, p = .007).
However, SES (z = -10.94, p < .001), career exploration (z = -10.39, p < .001),
and personality type (z = -5.49, p < .001) are stronger predictors of career maturity for
athletes than non-athletes.
𝑧 =𝑏1 − 𝑏2
√𝑆𝐸𝑏12 + 𝑆𝐸𝑏2
2
Page 85
73
9. What is the statistical difference, if any, of gender across athletes on research
questions 1-7?
To answer this question, we will compare results of male athletes to female
athletes
Table 12
Female Athlete Results
b S.E. C.R. p
SES_Number <--- CES_R -.295 .242 -1.217 .224 -.134
SES_Number <--- BFI -.592 .422 -1.402 .161 -.139
SES_Number <--- CDMSE_SF .323 .240 1.345 .179 .154
CareerMaturity <--- SES_Number .006 .007 .756 .450 .061
CareerMaturity <--- CES_R -.040 .019 -2.122 .034 -.202
CareerMaturity <--- BFI .016 .033 .482 .630 .041
CareerMaturity <--- CDMSE_SF .113 .019 5.986 <.001 .595
Table 13
Male Athlete Results
b S.E. C.R. p r
SES_Number <--- CES_R -.176 .225 -.780 .435 -.086
SES_Number <--- BFI -.052 .465 -.112 .910 -.013
SES_Number <--- CDMSE_SF .470 .246 1.914 .056 .227
CareerMaturity <--- SES_Number -.003 .012 -.270 .787 -.026
CareerMaturity <--- CES_R -.035 .027 -1.316 .188 -.140
CareerMaturity <--- BFI -.010 .055 -.183 .855 -.020
CareerMaturity <--- CDMSE_SF .090 .030 3.055 .002 .358
Page 86
74
Table 14
Male Athletes and Female Athletes Compared
Female Athletes Male Athletes
b1 SE1 b2 SE2 z p
SES_Number <--- CES_R -0.295 0.242 -0.176 0.225 -0.711 0.310
SES_Number <--- BFI -0.592 0.422 -0.052 0.465 -1.398 0.150
SES_Number <--- CDMSE_SF 0.323 0.240 0.470 0.246 -0.522 0.348
CareerMaturity <--- SES_Number 0.006 0.007 -0.003 0.012 15.000 <.001
CareerMaturity <--- CES_R -0.040 0.019 -0.035 0.027 -0.628 0.328
CareerMaturity <--- BFI 0.016 0.033 -0.010 0.055 6.962 <.001
CareerMaturity <--- CDMSE_SF 0.113 0.019 0.090 0.030 1.044 0.231
SES is a stronger predictor of career decision-making self-efficacy for female
athletes than male athletes.
(z = 6.92, p<.001)
Likewise, personality type is a stronger predictor of career maturity for female
athletes than it is for male athletes.
(z = 6.92, p<.001)
10. What is the statistical difference in academic classification between freshman
and seniors on researcher questions 1-7?
To answer this question, the model was run for freshmen and seniors. Changes
will show as significant differences in the tables below.
Page 87
75
Table 15
Model Applied to Freshman Students
Estimate S.E. C.R. P Label
SES_Number <--- CES_R -.107 .175 -.612 .540 -.064
SES_Number <--- BFI -.685 .377 -1.818 .069 -.182
SES_Number <--- CDMSE_SF .277 .182 1.519 .129 .164
CareerMaturity <--- SES_Number .008 .009 .860 .390 .070
CareerMaturity <--- CES_R .017 .019 .910 .363 .087
CareerMaturity <--- BFI .110 .041 2.704 .007 .252
CareerMaturity <--- CDMSE_SF .035 .020 1.757 .079 .176
Table 16
Model Applied to Senior Students
Estimate S.E. C.R. P Label
SES_Number <--- CES_R .204 .219 .929 .353 .109
SES_Number <--- BFI -.510 .472 -1.079 .281 -.122
SES_Number <--- CDMSE_SF -.087 .297 -.293 .770 -.036
CareerMaturity <--- SES_Number .013 .010 1.343 .179 .120
CareerMaturity <--- CES_R -.032 .021 -1.515 .130 -.161
CareerMaturity <--- BFI -.010 .046 -.212 .832 -.022
CareerMaturity <--- CDMSE_SF .136 .029 4.709 *** .515
Page 88
76
Table 17
Freshman and Senior Students Compared
Freshmen Seniors
b1 SE1 b2 SE2 z p
SES_Number <--- CES_R -0.107 0.175 0.204 0.219 -2.950 0.005
SES_Number <--- BFI -0.685 0.377 -0.51 0.472 -0.320 0.379
SES_Number <--- CDMSE_SF 0.277 0.182 -0.087 0.297 2.859 0.007
CareerMaturity <--- SES_Number 0.008 0.009 0.013 0.01 -3.322 0.002
CareerMaturity <--- CES_R 0.017 0.019 -0.032 0.021 9.431 <.001
CareerMaturity <--- BFI 0.11 0.041 -0.01 0.046 5.363 <.001
CareerMaturity <--- CDMSE_SF 0.035 0.02 0.136 0.029 -4.265 <.001
Based on table 17, there is a large significance between freshman students and
senior students. SES has a much more positive relationship to CES for seniors than
freshmen.
(z = -2.96, p = .005)
CDMSE has a much more positive relationship to SES for freshmen than seniors.
(z = 2.89, p = .007)
CES and BFI have a more positive relationship to career maturity for freshmen
than seniors.
(z = 9.43, p < .001 and z = 5.36, p < .001).
The relationship between CDMSE and career maturity is more positive in seniors
than freshmen.
(z = -4.265, p < .001)
Page 89
77
11. What is the statistical difference in race classification on researcher questions
1-7?
To answer this question, we compared results of Blacks to Whites and Hispanics
to Whites.
Table 18
Model Applied to White Students
Estimate S.E. C.R. P Label
SES_Number <--- CES_R .012 .126 .096 .923 .007
SES_Number <--- BFI -.404 .260 -1.556 .120 -.107
SES_Number <--- CDMSE_SF .040 .137 .295 .768 .022
CareerMaturity <--- SES_Number -.005 .007 -.789 .430 -.044
CareerMaturity <--- CES_R .018 .014 1.283 .199 .087
CareerMaturity <--- BFI -.020 .028 -.726 .468 -.046
CareerMaturity <--- CDMSE_SF .076 .015 5.150 <.001 .356
Table 19
Model Applied to Black Students
Estimate S.E. C.R. P Label
SES_Number <--- CES_R -.038 .248 -.151 .880 -.020
SES_Number <--- BFI -.488 .425 -1.148 .251 -.146
SES_Number <--- CDMSE_SF .370 .280 1.319 .187 .191
CareerMaturity <--- SES_Number .008 .012 .671 .502 .065
CareerMaturity <--- CES_R -.044 .027 -1.604 .109 -.188
CareerMaturity <--- BFI .080 .047 1.698 .090 .196
CareerMaturity <--- CDMSE_SF .093 .031 2.990 .003 .394
Page 90
78
Table 20
Model Applied to Hispanic Students
Estimate S.E. C.R. P Label
SES_Number <--- CES_R -.156 .214 -.727 .467 -.075
SES_Number <--- BFI -.548 .475 -1.155 .248 -.123
SES_Number <--- CDMSE_SF .412 .251 1.639 .101 .185
CareerMaturity <--- SES_Number .003 .008 .310 .756 .028
CareerMaturity <--- CES_R -.018 .019 -.929 .353 -.092
CareerMaturity <--- BFI -.029 .042 -.687 .492 -.071
CareerMaturity <--- CDMSE_SF .071 .022 3.194 .001 .352
Table 21
White and Black Students Compared
White Students Black Students
b1 SE1 b2 SE2 z p
SES_Number <-- CES_R 0.012 0.126 -0.038 0.248 2.578 0.014
SES_Number <-- BFI -0.404 0.26 -0.488 0.425 0.222 0.389
SES_Number <-- CDMSE_SF 0.04 0.137 0.37 0.28 -1.681 0.097
CareerMaturity <-- SES_Number -0.005 0.007 0.008 0.012 -13.387 <.001
CareerMaturity <-- CES_R 0.018 0.014 -0.044 0.027 8.226 <.001
CareerMaturity <-- BFI -0.02 0.028 0.08 0.047 -5.661 <.001
CareerMaturity <-- CDMSE_SF 0.076 0.015 0.093 0.031 -0.903 0.265
SES has a much more positive relationship to CES for White Students than Black
Students.
(z = 2.57, p = .014)
Career maturity has a more positive relationship to CES for White Students to
Black Students.
(z = 8.22, p = .001).
Page 91
79
BFI to career maturity is the opposite with Black students having a more positive
relationship to personality types than White students.
(z = -5.66, p = .001)
SES to career maturity shows that Black Students have a more positive
relationship to SES than White students.
(z = -13.38, p = .001)
Table 22
White and Hispanic Students Compared
White Students Hispanic
Students
b1 SE1 b2 SE2 z p
SES_Number <-- CES_R 0.012 0.126 -0.156 0.214 2.324 0.027
SES_Number <-- BFI -0.404 0.26 -0.548 0.475 0.335 0.377
SES_Number <-- CDMSE_SF 0.04 0.137 0.412 0.251 -1.798 0.079
CareerMaturity <-- SES_Number -0.005 0.007 0.003 0.008 -16.097 <.001
CareerMaturity <-- CES_R 0.018 0.014 -0.018 0.019 11.010 <.001
CareerMaturity <-- BFI -0.02 0.028 -0.029 0.042 1.320 0.167
CareerMaturity <-- CDMSE_SF 0.076 0.015 0.071 0.022 0.356 0.374
The results show that White students have a more positive relationship from SES
to CES than Hispanic students.
(z = 2.32, p = .027)
The results also show that White students have a more positive relationship from
career maturity to CES than Hispanic students.
(z = -16.09, p = .001).
However, SES to career maturity has a more positive relationship for Hispanic
students when compared to Whites students.
(z = 11.01, p = .001
Page 92
80
Overall Analysis
The overall sampled population showed that CDMSE has a statistically significant
relationship to career maturity and that SES mediates the relationship between CDMSE
and career maturity. The overall model also explained 13% of the variance in the variable
outcome, career maturity. The diagram below shows the path model used in the study
with the path coefficients for all the participants.
Figure 4. Illustration of Path Model and Coefficients.
Page 93
81
Athletes and Non-Athletes
Non-Athletes were the same as the sampled population but for athletes the
relationship between CDMSE and SES showed significance against career maturity.
Also, SES was a significant mediator for athletes. From the z-score data CDMSE is a
stronger predictor for career maturity for non-athletes. However, SES, career exploration
and personality types are strong predictors of career maturity for athletes. Also, from the
z-score data of gender, SES is a stronger predictor of CDMSE for female athletes than
male athletes. Personality type is a stronger predictor of career maturity for female
athletes than male athletes.
Academic Classification
From the z-score data, SES has a more positive relationship to CES for seniors
than freshmen and CDMSE has a much more positive relationship to SES for freshmen
than seniors. CES and BFI also have a more positive relationship to career maturity for
freshmen than seniors. However, the relationship between CDMSE and career maturity is
more positive in seniors than freshmen.
Race
From the z-score data when compared to Black students, White students have a
more positive relationship to CES and career maturity than Black students. However, BFI
to career maturity and SES to career maturity shows Black students have more of a
positive relationship than White students.
When compared to Hispanic students, White students have a more positive
relationship to CES and career maturity than Hispanics. However SES has a positive
relationship to career maturity for Hispanics versus Whites.
Page 94
82
V. DISCUSSION AND CONCLUSIONS
Introduction
Student athletes are a population within universities that will continue to capture
attention in literature, media, and among university personnel. Understanding the college
student athletes, will help to better relate to their personal struggles as well as their
successes. Due to the demands of athletics and ever increasing expectations, it is
important for athletes to establish routines that will help with their time management.
Being able to balance all the different hats that a student athlete has to wear, can make all
the difference in their college success.
This examination originated as the starting point of dialogue about how student
athletes and non- athletes navigate through college based on their chosen paths.
Purposeful study of these two student subgroups has provided a way to predict areas that
can create challenges for college students.
Review of Research Study
The purpose of this study was to identify factors that can impact students’
preparedness for life after college. A path analysis model was established to investigate
relationships between psychological variables that the participants can control upon a
dichotomous endogenous outcome such as career maturity. A social mediator variable
was put in place to see if it would have an impact on the psychological variables. The
theoretical framework was grounded in critical realism as a way to investigate
mechanisms, not events, in an open world by constructing bodies of knowledge that have
substantial impact on the long term best interests of each individual participant.
Page 95
83
Data analyses included comparing the entire sample to the model as well as
different comparisons between sub-groups based on gender, academic classification, race,
student-athletes, and non- athletes. The data were collected from students at a central
Texas university during the spring, 2015 semester. Athletes were surveyed before
practice, after practice, during study hall, or through an online option. The non- athletes
were surveyed during their scheduled classes, and were given an online option. Each of
the sample sizes provided adequate numbers to proceed with a path analysis in order to
determine relationships. The analytic results included, descriptive statistics, path
coefficients, and directional hypothesis testing with z-testing and explained variances.
The background of the participants included age, gender, ethnicity, academic
classification, major, and a question determining if they were an athlete or not. Each of
these questions provided an open space so participants could provide full, personal
answers. Additionally, there were SES specific questions in order to gather a general idea
about each participant's level of SES. These questions included the zip code where
participant grew up, whether or not they were on reduced lunch, and mother’s and
father’s education level, all factors recognized as playing a part in SES classifications.
The sampled demographics showed 33% more females than male participants.
There were also 25% more non-athletes than athletes included in the study. Each
academic classification group had at least 100 participants with no more than 140 in each
of the four groups.
Review of Literature Findings
The literature on student athletes provides a unique perspective on the impact of
sports participation. Athletic culture focuses on the type of environment that athletes are
Page 96
84
in and the expectations that are placed on them to excel in both academics and athletics.
Coaching staff, fans, sponsors and campus experiences are different elements of the
athletic culture. Similar to athletic culture, athletic identity focuses on the degree to
which an individual identifies with his/her athletic role and environment (Lavallee,
Gordon, & Grove 1997). With this identity come social and psychological impacts for
individuals, and concerns about how they would be perceived by their peers. Athletic
culture and athletic identity are two separate topics, but most people who identity as
athletes would also be aware, or be a part, of the athletic culture that is described.
Role conflict appears in a lot of athletic literature because it is big part of being an
athlete in college. Because of the extra time that is devoted to athletics, regardless of the
sport, each individual has to find a way to uphold his/her academic expectations. The
literature highlights how role conflicts can be managed by athletes and how they can
impact their relationships outside of their athletic counterparts.
Another conversation in the literature concerns how faculty perceptions impact
athletes’ academic performance. Faculty can provide tremendous support for student-
athletes. Because of the number of classes that are missed student-athletes can be put in
situations where they feel like their back is against the wall, or feel as though no one
understands what they are going through. In those moments having the support of their
professors can provide student-athletes with a positive relationship that can help them
feel more confident (Bell, 2009; Williams, Colles & Allen, 2010). Race can also impact
faculty perceptions (Comeaux, 2010; Comeaux, 2011). Faculty feeling disconnected from
the athletic department and faculty having to take time away from time commitments for
their work, were some of the faculty perceptions addressed in the literature.
Page 97
85
Current athletic literature focuses on social media in athletics, gender in sports,
and paying or not paying athletes. Each of these topics has its own significance, and they
are the most current topics in college athletic literature. With the growth and awareness
of social media, college athletic programs, and the NCAA are trying to find ways to limit
how many times and what athletes can share. Gender in sports is gaining some attention
as of late because more women in college programs are starting to gain attention based on
their athletic success. Another current topic of debate is the difference between how men
and women view being athletes and what they would like to take away from their
experiences (Daltry & Chester, 2013; Harrison & Lynch, 2005; Kilpatrick, Hebert, &
Bartholomew, 2005; Warner & Dixon, 2015) as well equality in regard to attention and
money spent on men and women (Diacin & Lim, 2012; Mahony, Riemer, Breeding &
Hums, 2006). Paying or not paying college athletes is a topic that has started to gain more
attention because of all the money and contracts that are coming from college sports
(McCormick & McCormick, 2010; Weaver, 2011). However, there is also literature that
focuses on why these student athletes should not get paid for their participation (Osborne,
2014; Harrison & Bukstein, 2014; Sanderson & Siegfried, 2015).
Rounding out the literature are scandals that impact student athletes, including
questions about grades, recruiting violations, or other theories that are often written about
in athletics and college athletes in transition. Scandals in student athletics create a bad
image for college athletic programs, thus leading to stereotypes. Self-determination
theory (SDT) and social identity theory (SIT) are two theories that receive a lot of
attention because they concentrate on motivation for the gratification, or individuals
making sense of their world by identifying in a world they feel is important, respectively.
Page 98
86
Each of these theories has an impact on student-athletes and their environments. College
athletes in transition is an area where the literature still needs to be developed because
there are not many current pieces of literature that research and discuss this transition.
However, athletes eventually run out of eligibility to play their sport or worse, they suffer
an injury that keeps them from playing their sport again. This transition can present one
of the biggest challenges that an athlete can face because he/she must step into a world
that is unknown and that can create added pressure.
This literature helps provide information that can help the awareness of student-
athlete’s educational paths. Not all student athletes have the same path but being aware of
the possibilities can help create some understanding. Social support can go a long way
toward helping student-athletes stay on track, regardless of who is giving that support.
Discussion of Results
The discussion of results provides an overview of the demographic information as
well as a detailed explanation of key findings from the model. There were a total of 502
college students that were in this sample. Of those, 216 were student athletes and 286
were non-student athletes. The total population group showed CDMSE as a statistically
significant relationship with career maturity and that SES mediates the relationship
between CDMSE and career maturity. As students start to feel more confident about
making decisions for themselves their career maturity tends to increase. This agrees with
past research that revealed that career decision making self-efficacy has an impact on
career maturity (Houle & Kluck, 2015; Kornspan & Etzel, 2001). Since college is
considered a time of change and development (Houle & Kluck, 2015), especially for
young adults in the 18-24 age group, this result tends to be in line with student maturation
Page 99
87
The other two variables included in the model did not show a significant relationship to
career maturity, and the full model only explained 13% of the total variance in the
outcome of career maturity. While the model cannot be used for predictive purposes for
the general population, it is useful in that it allows us to compare groups. Which can help
determine how different groups fair on various variables.
When comparing athletes to non-athletes different results emerged. CDSME was
a stronger predictor for career maturity for non-athletes. However, status as a student
athlete showed to be strong predictors of SES, career exploration and personality types of
career maturity. These findings suggest that the time constraints for athletes have an
impact on their overall career maturity. Having the time to explore career options and to
fully engage in that aspect of their lives can be hard. As noted previously, the amount of
time athletes have to spend on activities other than sport is limited due to practice, travel,
working out, and other factors that come with athletics.
Although not a statistically significant difference, athletes scored slightly lower
(3.72) on personality openness compared to non-athletes (3.81). Openness is the
personality trait that deals with seeking new experiences and intellectual pursuits. That is
not to say athletes do not want to purse new experiences, but it is clear they have a lot of
factors that could limit their time to try and seek these experiences. For athletes, SES
mediates the relationship between career maturity, so as SES goes up for athletes, so does
their career maturity. This finding focuses on the notion that student- athletes who come
from wealthier backgrounds are able to develop a stronger career maturity.
For all the differences that are made between male and female athletes, this study
indicated that male and female athletes do not show as much of a statistical variation as
Page 100
88
other categories used in this study. SES is a stronger predictor for SES for female
athletes, perhaps similar to the reason for athletes in the previous group (the wealthier
environment females athletes come from the better chance they will develop a stronger
career maturity). Personality type was another stronger predictor for female athletes.
When looking at the results of female athletes, they scored higher than male athletes on
agreeableness 4.21 and neuroticism 3.04. Males scored 3.96 and 2.51 respectively.
Agreeableness is a reflection of an individual adjusting his/her behavior to suit others,
and neuroticism is an emotional personality trait.
Academic classification comparisons were made between freshmen and seniors
since they are at opposite ends of their college experiences. This comparison produced
the greatest statistical significances among the compared groups. Let’s start with the
positive relationships that seniors have versus freshmen. The results indicated seniors
have more positive relationships from CES to SES, SES to career maturity and CDMSE
to career maturity than freshmen. Seniors have had more time in college, they have taken
more classes, and they are close to entering a different phase in their lives. The fact that
career exploration goes up as SES goes up is an indication that those seniors, coming
from higher SES backgrounds, are able to explore more when it comes to careers. This
could be because of their SES position and coming from a background where being in a
higher SES class impacts someone decisions to begin exploring different career options.
SES also impacts career maturity, just like in the previous two comparisons, which can be
an indication of the SES background of the senior. CDMSE, having more of positive
relationship in seniors is an indication that seniors are more in tuned with who they are
Page 101
89
and feel like they are capable in their behaviors, that they can take the right steps to
successfully completing a task.
Interestingly enough, freshmen have positive relationships with CDMSE to SES,
CES to career maturity and personality to career maturity compared to seniors. The
relationship of CDMSE to SES remains consistent in this comparison just as it has in the
others. Freshmen have a stronger relationship with CES compared to seniors. This could
be because freshmen are in a new environment and they are more open to different ideas
on their journey than seniors. Also, freshmen are faced with so many life challenges,
deciding on a career, immediately upon entering college is not an easy decision (Morgan
& Ness, 2003).Due to the fact that seniors are close to graduating from college, the time
they spend focused on exploring career options is significantly less than freshmen. Since
freshman are just starting their college, career exploration becomes more important for
them to be able to develop their career maturity.
To understand the significance of the relationship of personality type to career
maturity, the results of these participants on their personality test were pulled to indicate
which personality areas freshmen were higher or lower than seniors. The highest
personality trait for freshmen compared to seniors was extroversion (freshmen = 3.50,
seniors = 3.30) which is the personality trait that seeks fulfillment from sources outside of
the individual or in a community. The lowest for freshmen was neuroticism which is the
personality trait of being emotional (freshmen = 2.88, seniors = 3.01). Looking at these
different averages BFI suggests that freshmen are looking for fulfilment, and that could
play a role into having a more positive relationship to career maturity than seniors. Since
Page 102
90
freshmen are lower on the emotional personality they are able to search for ways to
develop their career maturity through different environments and experiences.
The race comparison groups were Black students to White students and Hispanic
students to White students. When compared to Black students, White students have
positive relationships to CES and career maturity, which may indicate White Students use
career exploration as a way to develop career maturity. However, BFI to career maturity
and SES to career maturity shows Black students have more of a positive relationship
between these variables than White students. Black students were lower in neuroticism
(2.78 and 2.90) and conscientiousness (4.11, 4.23) but higher on openness (3.87 and 3.75)
and extraversion (3.51 and 3.44) compared to White students. Similarly, in the Freshman
and Senior comparison, Black students are open to seeking new experiences and gaining
fulfillment from outside sources and these two factors can lead to the more positive
relationship with career maturity based on personality. When Black students are in higher
SES environments they are able to increase their career maturity, similar to the other
comparison groups.
When Hispanics were compared to White students they showed similar results as
Black students but there was not a significant difference between Hispanics and White
students in regard to personality types. It is important to note that CDMSE did not show
any significance when comparing races, which is the only comparison group that did not
show any type of significance. In order for race to have a significant relationship,
environment and experiences play a greater role.
The main findings of this study were: a) the statistical impact that career decision
making self -efficacy has on athletes career maturity, b) the statistical impact of different
Page 103
91
variables on the career maturity of Freshman as opposed to Seniors, c) how and when
SES mediates career maturity, and d) personality being more of a predictor for female
athletes and Black students compared to male athletes and White students for career
maturity respectively. The model shows that student athletes need to have stronger
support in developing career decision making self -efficacy in order to gain career
maturity. Student athletes can benefit from having this support early in their college
careers. For freshmen, career exploration is an important piece of their career maturity
development. However, seniors need to have more career decision making self -efficacy
in order to have more career maturity. SES is also important for students and student
athletes because it shows that students who are in a lower socioeconomic class, could
benefit from additional support in order to gain career maturity. Some students with
lower SES use college athletics to gain access to college, so there is even more need to
add support for college exploration.
The analysis originated to identify factors that can impact students’ preparedness
for life after college. Drawing from the results of this path analysis model on career
decision making self -efficacy is a variable that predicts career maturity. Embracing
student athletes and providing them opportunities, outside of their sport, to develop the
confidence and behaviors to have a higher career decision making self-efficacy is what
will help increase student-athletes’ career maturity. Creating a platform for professional
development for anyone working with student athletes, can help to foster a supportive
community around these athletes. Traditionally, student athletes are a demographic of
students who are seen as having everything figured out and as being extremely confident.
However, this study shows that student-athletes are not confident enough to have high
Page 104
92
career maturity which can have a negative impact on their future. Being able to
implement a way to transform the student athletes experience to include an effective plan
and new learning opportunities to advance their athletic experience would help impact
their career maturity.
Limits of the Study
For the purpose of this study, the following limitations are identified:
1. Students self-reported, and may not have responded reliably to confusing
statements.
2. Only students from one university who were present at the time of the meetings
were surveyed.
3. Students might have felt obligated to respond with socially desirable responses.
4. Only 37% of football players were surveyed
5. I was not allowed to go into all classrooms, due to time constraints, to conduct
surveys, so some were taken online.
For the purpose of this study, the following delimitations are identified:
1. This study was only conducted at one school.
2. This was a point in time snapshot that was completed in the Spring semester.
Implications for Further Research
Based on the findings in this study, following are avenues for further research.
Since the instruments suggest the various factors together did not impact career maturity
greatly, only 13%, it is important to test other instruments to determine what does make a
bigger impact on career maturity in order to provide a greater degree of help for student
athletes. Also, using career decision making self-efficacy as an outcome variable versus a
Page 105
93
predictor variable would be an alternative way to determine how much each of these
variables can impact self-efficacy in hopes of finding a way to further help athletes.
Conducting a similar study from a different division I university would be
important to this research. Comparing different divisions of athletic programs to others
(division I to division II or division III to division II), could also provide more insight
about how the differences in programs can impact students. Similarly, some other
division I universities might have more sports to survey such as, lacrosse, or swimming
that could also produce additional valuable insights.
A qualitative approach to studying student athletes would provide alternative
methods for future research to uncover some underlying challenges for student-athletes. It
could also help in uncovering differences between non-athletes and student athletes.
Since college students all come from various backgrounds, they could have unique
experiences that might have an impact on their career maturity.
Implications for Practice and Recommendations
The present study investigated various relationships between three different
variables and a mediator variable on the impact of overall career maturity of student
athletes and non-athletes. Due to the amount of attention that student athletes are gaining
in literature, as well as the media, it is important to study this population in order to gain
a better understanding of their environment. The practical significance of the study is that
student affairs, the NCAA, and the coaching staffs should use this information in order to
help develop athlete’s career maturity. When student athletes enter a university as
freshmen it is important to instill in them how important their future is after college and
the steps that can be taken in order to achieve their professional goals.
Page 106
94
The theoretical significance of this study is in extending the understanding of
adults who are in an environment where they need to be encouraged to learn and develop
professional skills. Adult education can lead the way to creating professional
development for individuals who are responsible for helping student athletes with career
planning. How we treat this entire group of students can impact all of us professionally,
educationally, and socially. Through adult education these student athletes can become a
part of a community that encompasses life span learning and development.
Promoting a student athlete’s future starts with implementing programs that are in
place to help them gain career maturity, as well as opening doors for various
opportunities. Providing athletes with workshops taught by people who work in industry,
having networking events with organizations, athletic sponsored internships, and career
preparedness courses are just a few ways that athletes can gain more from their college
experience by being able to focus on their careers after college. Each sport has an
offseason where time can be dedicated to supporting these student athletes do something
other than represent their school.
Another way to help athletic programs implement helpful avenues for student
athletes is by implementing a mentorship program, so these student athletes can have a
mentor when they are going through this process. This can be something that is set up by
the athletic department to pair former student athletes that have graduated and are
currently working in an environment outside of athletics with current student athletes.
Since the graduate would be currently working outside the sports domain and should be
able to provide valuable knowledge. This would also give younger students a chance to
watch how graduates prepared themselves for their future. Since athletes are used to
Page 107
95
being accountable to their teammates and performing for each other, this could be another
way to use their skills they develop from sports to carry over into a mutually beneficial
result. This would also provide them the experience of being a mentor, gaining the
experience of what that is like, and how it can be helpful in other situations.
The culture of athletics should maintain their competitive edge but they should
also focus on the long term goals of their student-athletes. Large companies are
successful at being competitive while also giving their people opportunities for growth
and development. Athletic programs should join the movement of preparing each of their
student athletes for these opportunities as individuals. By building partnerships outside
the athletic departments, athletes, coaches, universities, the NCAA, and other
organizations could all benefit from being a part of a successful movement.
The reality of a student athlete is the classroom will never produce the applause
he or she experiences being introduced before a game, making a big play, or even more
exciting, doing something that wins the game. Those kinds of things cause the student
body to respond by jumping out of their seats and rushing down to celebrate. Another
prominent aspect of being a student athlete is having thousands of students sway back
and forth to a school song that they are fortunate to be representing. Each of these
examples are different types of attention that student athletes get. However, these
experiences are not going to help these athletes develop their career maturity. Athletic
departments need to be just as worried about their players as they are their product,
because the players are the ones who will suffer if athletic departments do not give
students every chance they can to be successful once their sport is over.
Page 108
96
Summary and Conclusion
Even though career decision making self-efficacy was the most consistently
significant relationship to career maturity, it is important for athletic departments to
understand more about self-efficacy and how they can use that for the betterment of their
student athletes. This study provided a foundation for how participating in sports can play
a role in impacting a student's overall career maturity. The results confirmed that student
athletes have a harder time obtaining career maturity. College athletics can define a
student's experience based off a big game, athletic recognition or an athletic event that
takes place that brings a lot of attention to the university. However, it is important that
more attention be paid towards a student's holistic experience and not just the sports
product.
Page 109
97
APPENDIX SECTION
APPENDIX A
CONSENT TO PARTICIPATE
Career Preparation: A Comparison of University Athletes to Non-Athletes
As a college student, you are invited to participate in a research study. The purpose of
this study is to determine a) if career exploration, personality type, and career decision
self-efficacy, either individually or in combination, contribute to the prediction of career
maturity levels among athletes and non-athletes, b) if gender and/or academic
classification contributes to the prediction of career maturity, and c) if socioeconomic
status has a mediating impact on career maturity.
INFORMATION The number of participants that will be participating in the study is at least 300 students
and student athletes at the University. Participation will be limited to a one-time response
to a questionnaire that will take approximately 15 - 20 minutes to complete with paper
and 5-12 minutes online. Hopefully the data collected will give a clearer picture of the
career maturity levels of college students and student athletes when compared to one
another. College students and student athletes are not often compared and it is hoped that
this research can provide information for the University and athletic departments that can
be used to positively impact the experience of all college students.
CONFIDENTIALITY The anonymity of the respondents will be secure since no names will appear on the
questionnaires. Data will be stored securely and will be made available only to the person
conducting the study and her doctoral committee members unless a participant
specifically gives permission in writing to do otherwise. No reference will be made in
oral or written reports that could link any participants to the study. Questionnaires will be
destroyed after a period of one year from completion of the research study.
CONTACT If you have questions at any time about the study or procedures, you may contact the
researcher, TaNeisha Page at [email protected] . If you have any questions about your
rights as a participant, contact the Research Compliance Services section of the Office of
Research at (512) 245 - 2314.
PARTICIPATION AND INFORMED CONSENT Your participation in this study is voluntary; you may decline to participate without
penalty. If you decide to participate, you may withdraw from the study at any time
without penalty. If you withdraw from the study before data collection is completed your
data will be destroyed. The return of the completed questionnaire constitutes consent to
participate.
Page 110
98
APPENDIX B
Demographic Information
1. Age:
______________
2. Gender:
M ______ F ______
3. Academic Classification:
Freshman ______ Sophomore ______ Junior _______ Senior ______
4. Are you on a intercollegiate sports team at the University:
College Athlete ________ Non-Athlete ________
5. If you are an on an intercollegiate sports team, which sport do you
participate in:
__________________
6. What is your major or intended major:
__________________
7. What ethnicity/race demographic do you self-identify with:
__________________
Page 111
99
APPENDIX C
Career Exploration Survey – Revised (CES-R)
Instructions: For each statement below please read carefully and indicate the amount of
effort that you have made to accomplish each of these tasks by circling the correct
number on the answer sheet.
1 = Never
2 = Somewhat
3 = A Moderate Amount
4 = A Substantial Amount
5 = A Great Deal
Example: To what extent have you behaved in the following ways over the last 3
months:
A. Researched various cooking recipes.
If your response was “A Moderate Amount,” you would circle the 3 for “A Moderate
Amount” on the answer sheet.
Career Exploration Survey – Revised Scale
To what extent have you behaved in the following ways over
the last 3 months?
1. Experimented with different career activities. 1 2 3 4 5
2. Sought opportunities to demonstrate skills. 1 2 3 4 5
3. Tried specific work roles just to see if I liked them. 1 2 3 4 5
4. Investigated career possibilities. 1 2 3 4 5
5. Went to various career orientation programs. 1 2 3 4 5
6. Obtained information on specific jobs or companies. 1 2 3 4 5
7. Gathered information on job trends, salaries, and general
job opportunities in my career area. 1 2 3 4 5
8. Sought information on specific areas of career interest. 1 2 3 4 5
To what extent have you done the following in
the past 3 Months?
9. Reflected on how my past integrates with my future
career. 1 2 3 4 5
Page 112
100
10. Focused on my thoughts on me as a person in relation to
my career. 1 2 3 4 5
11. Contemplated my past in relation to my career. 1 2 3 4 5
12. Been retrospective in thinking about my career. 1 2 3 4 5
13. Understood a new relevance of past behavior for my
future career. 1 2 3 4 5
14. Participated in an internship, practicum, fieldwork, or
volunteer opportunities in a career field I am interested in. 1 2 3 4 5
15. Participated in practice interviews. 1 2 3 4 5
16. Sought career advice from a teacher or Academic Advisor. 1 2 3 4 5
17. Been to the Career Resource Center on campus to obtain
career guidance and/or explore your career options. 1 2 3 4 5
18. Done online searches to obtain career information. 1 2 3 4 5
19. Sent out resumes to employers and/or posted them online. 1 2 3 4 5
20. Attended job fairs or interviewed with employers on
campus. 1 2 3 4 5
21. Written and/or sent letters of inquiry, or telephones
potential employers to make employment contacts. 1 2 3 4 5
22. Spoke to family, friends, or community about career
advice. 1 2 3 4 5
23. Gathered information regarding additional education or
training needed for your career. 1 2 3 4 5
24. Taken coursework related to a career you are interested in. 1 2 3 4 5
25. Too career test to analyze and assess your interest,
abilities and/or values. 1 2 3 4 5
26. Thought about what career would be best for me. 1 2 3 4 5
27. Thought about how my major fits with my career goals. 1 2 3 4 5
28. Established career plans for the future. 1 2 3 4 5
Page 113
101
APPENDIX D
______________________________________________________
The Big Five Inventory (BFI)
Instructions: Here a number of characteristics that may or may not apply to you. For
example, do you agree that you are someone who lies to spend time with others? Please
circle a number next to each statement to indicate the extent to which you agree or
disagree with that statement.
1 = Disagree Strongly
2 = Disagree a Little
3 = Neither agree nor Disagree
4 = Agree a Little
5 = Agree Strongly
I SEE MYSELF AS SOMEONE WHO:
Survey Item Scale
1. Is talkative 1 2 3 4 5
2. Does a thorough job 1 2 3 4 5
3. Is depressed, blue 1 2 3 4 5
4. Is original, comes up with new ideas 1 2 3 4 5
5. Is helpful and unselfish with others 1 2 3 4 5
6. Is relaxed, handles stress well 1 2 3 4 5
7. Is curious about many different things 1 2 3 4 5
8. Is full of energy 1 2 3 4 5
9. Is a reliable worker 1 2 3 4 5
10. Can be tense 1 2 3 4 5
11. Is ingenious, a deep thinker 1 2 3 4 5
12. Generates a lot of enthusiasm 1 2 3 4 5
13. Has a forgiving nature 1 2 3 4 5
14. Worries a lot 1 2 3 4 5
15. Is emotionally stable, not easily upset 1 2 3 4 5
16. Is inventive 1 2 3 4 5
Page 114
102
17. Perseveres until the task is finished 1 2 3 4 5
18. Can be moody 1 2 3 4 5
19. Is sometimes shy, inhibited 1 2 3 4 5
20. Is considerate and kind to almost everyone 1 2 3 4 5
21. Does things efficiently 1 2 3 4 5
22. Is outgoing, sociable 1 2 3 4 5
23. Makes plans and follows through with them 1 2 3 4 5
24. Gets nervous easily 1 2 3 4 5
25. Likes to reflect, play with ideas 1 2 3 4 5
26. Has an active imagination 1 2 3 4 5
27. Tends to be quiet 1 2 3 4 5
28. Is generally trusting 1 2 3 4 5
29. Likes to cooperate with others 1 2 3 4 5
Page 115
103
APPENDIX E
______________________________________________________
Career Decision Making Self-Efficacy Scale-Short Form
Instructions: For each statement below please read carefully and indicate how much
confidence you have that you could accomplish each of these tasks by circling the correct
number on the answer sheet.
1 = No Confidence at all
2 = Very Little Confidence
3 = Moderate Confidence
4 = Much Confidence
5 = Complete Confidence
Example: How much confidence do you have that you could:
A. Summarize the skills you have developed in the jobs you have held?
If your response was “Moderate Confidence,” you would circle the 3 for “Moderate
Confidence” on the answer sheet.
HOW MUCH CONFIDENCE DO YOU HAVE THAT YOU COULD:
Survey Item Scale
1. Find information in the library about occupations
you are interested in. 1 2 3 4 5
2. Select one major from a list of potential majors you
are considering. 1 2 3 4 5
3. Make a plan of your goals for the next five years. 1 2 3 4 5
4. Determine the steps to take if you are having
academic trouble with an aspect of your chosen
major.
1 2 3 4 5
5. Accurately assess your abilities. 1 2 3 4 5
6. Select one occupation from a list of potential
occupations you are considering. 1 2 3 4 5
7. Determine the steps you need to take to successfully
complete your chosen major. 1 2 3 4 5
8. Persistently work at your major or career goal even
when you get frustrated. 1 2 3 4 5
9. Determine what your ideal job would be. 1 2 3 4 5
Page 116
104
10. Find out the employment trends for an occupation
over the next 10 years. 1 2 3 4 5
11. Choose a career that will fit your lifestyle. 1 2 3 4 5
12. Prepare a good resume. 1 2 3 4 5
13. Change majors if you do not like your first choice. 1 2 3 4 5
14. Decide what you value most in an occupation. 1 2 3 4 5
15. Find out about the average yearly earnings of people
in an occupation. 1 2 3 4 5
16. Make a career decision and then not worry whether it
was right or wrong. 1 2 3 4 5
17. Change occupations if you are not satisfied with the
one you enter. 1 2 3 4 5
18. Figure out what you are and are not ready to
sacrifice to achieve your career goals 1 2 3 4 5
19. Talk with a person already employed in a field you
are interested in. 1 2 3 4 5
20. Choose a major or career that will fit your interests. 1 2 3 4 5
21. Identify employers, firms, and institutions relevant to
your career possibilities. 1 2 3 4 5
22. Define the type of lifestyle you would like to live. 1 2 3 4 5
23. Find information about graduate or professional
schools. 1 2 3 4 5
24. Successfully manage the job interview process. 1 2 3 4 5
25. Identify some reasonable major or career alternatives
if you are unable to get your first choice. 1 2 3 4 5
Page 117
105
APPENDIX F
Socioeconomic Status Information
What is the zip code where you grew up?
________
Were you on reduced lunch in grade school?
Yes _______ No _______
Highest Level of Education for your Father:
Some High School _______
High School Diploma _______
Some College ________
Undergraduate Degree ________
Graduate Degree ________
Other ________
Highest Level of Education for your Mother:
Some High School _______
High School Diploma _______
Some College ________
Undergraduate Degree ________
Graduate Degree ________
Other ________
Page 118
106
APPENDIX G
Career Maturity Inventory – Attitude Scale
Read each statement and circle for whether you Agree “A” or Disagree “D” with
the statement provided.
Career Maturity Inventory – Attitude Scale
A
G
R
E
E
D
I
S
A
G
R
E
E
29. Everyone seems to tell me something different; as a result
I don’t know what kind of work to choose. A D
30. It’s probably just as easy to be successful in one
occupation as it is in another. A D
31. I have little or no idea what working will be like. A D
32. Once you chose a job, you can’t choose another one. A D
33. I keep wondering how I can reconcile the kind of person I
am with the kind of person I want to be in my future
occupation.
A D
34. Sometimes you have to take a job that is not your first
choice. A D
35. Work is dull and unpleasant. A D
36. I can’t understand how some people can be so certain
about what they want to do. A D
37. As far as choosing an occupation is concerned, something
will come along sooner or later. A D
38. Choosing an occupation is something you have to do on
your own. A D
39. As long as I remember, I’ve known what kind of work I
want to do. A D
40. There may not be any openings for the job I want most. A D
41. I don’t know how to go about getting into the kind of
work I want to do A D
Page 119
107
42. There is no point in deciding upon a job when the future is
so uncertain. A D
43. I spend a lot of time wishing I could do work I know I can
never do. A D
44. If someone would tell me which occupation to enter, I
would feel much better. A D
45. I know very little about the requirements of the job. A D
46. When choosing an occupation, you should consider
several different ones. A D
47. There is only one occupation for each person. A D
48. The best thing to do is to try out several jobs, and then
choose the one you like best. A D
49. You get into an occupation mostly by chance. A D
50. I seldom think about the job I want to enter. A D
51. You almost always have to settle for a job that’s less than
you had hoped for. A D
52. I really can’t find any work that has much appeal to me. A D
53. I’d rather work than play. A D
Page 120
108
REFERENCES
Adler, P. & Adler, P. (1985). From idealism to pragmatic detachment: The academic
performance of student athletes. Sociology of Education, 58, 241-250.
Adler, P. & Adler, P. (1987). Role conflict and identity salience: College athletics and the
academic role. The Social Science Journal, 24(4), 443-455.
Allen, M. S., Frings, D., & Hunter, S. (2012). Personality, coping, and challenge and
threat states in athletes. International Journal of Sports and Exercise Psychology,
10(4), 264-275.
Allen, M. S., Greenlees, I., & Jones, M. (2011). An investigation of the five factor model
of personality and coping behavior in sport. Journal of Sports Science, 29(8), 841-
850.
Alvesson, M., & Skoldberg, K. (2009). Reflexive methodology: New vistas for qualitative
research (2nded). Thousand Oaks, CA: Sage Publication.
Aries, E., McCarthy, D., Salovey, P., & Banaji, M. R. (2004). A comparison of athletes
and non-athletes at highly selective colleges: Academic performance and personal
development. 45(6), 577-602.
Baillie, B. H., & Danish, S. J. (1992). Understanding the career transition of athletes. The
Sport Psychologist, 6, 77-98.
Bandura, A. (1977). Self-efficacy: Toward a unifying theory of behavioral change.
Psychological Review, 84(2), 191-215.
Beard, A., & Dalesio, E. P. (October, 2014). Massive cheating scandal at UNC involved
athletes. The Associated Press. Retrieved from http://ap.org
Page 121
109
Bell, F. L. (2009). Examining academic role-set influence on the student-athlete
experience. Journal of Issues in Intercollegiate Athletics, special issue, 19-41.
Betz, N. E., Klein, K. L., & Taylor, K. M. (1996). Evaluation of a short form of the
Career Decision-Making Self-Efficacy Scale. Journal of Career Assessment, 4,
47–57.
Blann, F. (1985). Intercollegiate athlete competition and students’ educational and career
plans. Journal of College Student Personnel, 26, 115-118.
Brewer, B. W., Van Raalte, J. L., & Linder, D. E. (1993). Athletic identity: Hercules’
muscles or Achilles’ heel? International Journal of Sport Psychology, 24, 237-
254.
Brown, C., & Hartley, D. (1998). Athletic identity and career maturity of male college
student-athletes. International Journal of Sport Psychology, 29, 17-26.
Brown, C., Glastetter-Fender, C., & Shelton, M. (2000). Psychosocial identity and career
control in college student-athletes. Journal of Vocational Behavior, 56, 53-62.
Buer, T. (2009). Organizational complexity: The athletics department and the University.
New Directions for Higher Education, 148, 109-116.
Busacca, L. A., & Taber, B. J. (2002). The career maturity inventory-revised: A
preliminary psychometric investigation, 10(4), 441-455.
Carlson, D. B., & Donavan, T. D. (2013). Human brand in sport: Athletic brand
personality and identification. Journal of Sport Management, 27, 193-206.
Chen, S., Snyder, S., & Magner, M. (2010). The effects of sport participation on student-
athletes’ and non-athlete students’ social life and identity. Journal of Issues in
Intercollegiate Athletics, 3, 176-193.
Page 122
110
Cheney-Rice, Z. (2014). Here’s what happens to the 98% of college athletes who don’t
go pro, News.Mic, Retrieved from: http://mic.com/articles/85789/here-s-what-
happens-to-the-98-of-college-athletes-who-don-t-go-pro
Coakley, J. (2008). Sports in Society: Issues and controversies (10th ed). New York, NY:
McGraw-Hill.
Cohen, J. (1988). Statistical power analysis for the behavioral sciences (2nd ed.).
Hillsdale, NJ: Lawrence Earlbaum Associates.
Collier, A. (1994). An introduction to Roy Bhaskar’s philosophy. New York, NY: Verso.
Comeaux, E. (2010). Racial differences in faculty perceptions of collegiate student-
athletes’ academic and post-undergraduate achievements. Sociology of Sport
Journal, 27, 390-412.
Comeaux, E. (2011). A study of attitudes toward college student-athletes: Implications
for faculty-athletics engagement. The Journal of Negro Education, 80(4), 521-
532.
Comeaux,E., Snyder, E., Speer, L., & Taustine, M. (2014). The roles of engagement
activities on college outcomes: A retrospective student of division I male and
female student-athletes. College Student Affairs Journal, 32(1), p 205-217.
Cowan, D. C., Hauser, M. R., Kominski, A. R., Levin, M. H., Lucas, R. S., Morgan, L.
S., . . . & Chapman, C. (2012). Improving the measurement of socioeconomic
status for the national assessment of education progress: A theoretical
foundation. Retrieved from: http://nces.ed.gov/nationsreportcard/pdf/research
Center/socioeconomicfactors.pdf
Crites, J. O. (1978). The career maturity inventory. Monterey, CA: CTB McGraw-Hill.
Page 123
111
Crites, J. O., & Savickas, M. L. (1996). Revision of the career maturity inventory,
Journal of Career Assessment, 4(2), 131-138.
Curran, C. J., & Bauer, D. J. (2007). Building path diagrams for multilevel models.
Psychological Methods, 12(3), 283-297.
Daltry, R. (2013). The impact of gender role conflict on the quality of life in female
athletes. The International Journal of Sports and Society, 3, 49-65.
Despres, J., Brady, F., & McGowan, A. S. (2008). Understanding the culture of the
student-athlete: Implication for college counselors. Journal of Humanistic
Counseling, Education and Development, 47, 200-211.
Desrochers, M. D. (2013). Academic spending versus athletic spending: Who wins? Delta
cost project at American Institutes for Research, p 1-16.
Diacin, J. M. & Lim, Y. S. (2012). Female representation within intercollegiate athletics
departments. The Journal of Sport, 15(1), 2-16.
Dickinson, R. E., & Adelson, L. J. (2014). Exploring the limitations of measures of
students’ socioeconomic status (SES). Practical Assessment, Research and
Evaluation, 19(1), 1-14.
Dryer, J., & Wang, C. (2008). Beyond dollars and cents: Examining the impact of the
move to division I on student-athletes. The SMART Journal, 4(2), 72-85.
Easton, G. (2010). Critical realism in case study research. Industrial Marketing
Management, 39, 118-128.
Esters, L. T., & Retallick, M. S. (2013). Effects of an experiential and work-based
learning program on vocational identity, career decision self-efficacy, and career
maturity. Career and Technical Education Research, 38(1), 69-83.
Page 124
112
Falls, D., & Wilson, B. (2012). Reflexive modernity and the transition experience of
university athletes. International Review for the Sociology of Sport, 48(5), 572-
593.
Finch, B. (2009). Investigating college athletes’ role identity and self-efficacy for career
decision-making. International Journal of Sports Management, 10, 427-435.
Fisher, B. (2009). Athletics success and institutional rankings. New Directions for Higher
Education, 148, 45-53.
Fogarty, G. J., & McGregor-Bayne, H. (2008). Factors that influence career decision-
making among elite athletes. Australian Journal of Career Development, 17(3),
26-38.
Galli, N., & Reel, J. J. (2012). Can good come from bad? An examination of adversarial
growth in division I NCCA athletes. Journal of Intercollegiate Sport, 5, 199-212.
Gayles, J. G. (2009). The student athlete experience. New Directions for Institutional
Research, 144, 33-41.
Gayles, J. G., & Hu, S. (2009). Athletes as students: Ensuring positive cognitive and
affective outcomes. New Directions for Higher Education, 148, 101-107.
Glum, J. (October, 2014). UNC cheating scandal: How the fake classes stack up against
other college scams. International Business Times. Retrieved from:
http://www.ibtimes.com/unc-cheating-scandal-how-fake-classes-stack-against-
other-college-scams-1712599
Gould, M. R. (2012). Cheating scandals: The legacy of college football. American
Library Association. Retrieved from: http://atyourlibrary.org/sports/cheating-
scandals-legacy-college-football
Page 125
113
Gray, D. E. (2013). Doing the research in the real world (3rded). Thousand Oaks, CA:
Sage Publication.
Gregory, S. (September, 2013). It’s time to pay college athletes, TIME Magazine.
Retrieved from: http://www.newhaven.edu/612904.pdf
Hamilton, K. (April, 2004). Creating a successful student-athlete. DiverseEducation.com.
Retrieved from: http://diverseeducation.com/article/3631/
Harrison, A. L., & Lynch, B. A. (2005). Social role theory and the perceived gender role
orientation of athletes. Sex Roles, 52(3/4), 227-236.
Harrison, C. K., & Lawrence, S.M. (2003). African American student athletes’
perceptions of career transition in sport: A qualitative and visual elicitation. Race
Ethnicity and Education, 6(4), 373-394.
Harrison, K. C., & Bukstein, S. (2014). Canaries in the goal mines: A timely analysis of
college athletics and the role of student-athletes. Journal of Intercollegiate Sport,
7, 109-119.
Hernandez, A. (2013). All quiet on the digital front: The NCAA’s wide discretion in
regulating social media. The Review of Entertainment and Sports Law, 15(1), 53-
66.
Hipke, M., & Hachtmann, F. (2014). Game-changer: A case study of social-media
strategy in big ten athletic departments. International Journal of Sport
Communication, 7, 516-532.
Hoeber, L. (2008). Gender equity for athletes: Multiple understandings of an
organizational value. Sex Roles, 58, 58-71.
Page 126
114
Hollembeak, J., & Amorose, J. A. (2005). Perceived coaching behaviors and college
athletes’ intrinsic motivation: A test of self-determination theory. Journal of
Applied Sport Psychology, 17, 20-36.
Holmberg, P. M., & Seridan, D. A. (2013). Self-determined motivation as a predictor of
burnout among college athletes. The Sport Psychologist, 27, 177-187.
Hornsey, M. J. (2008). Social identity theory and self-categorization theory: A historical
review. Social and Personality Psychology Compass, 2, 204-222.
Horton Jr., D. (2011). Developing an institutional culture toward degree attainment for
student athletes. New Direction for Community Colleges, 155, 27-33.
Houle, J. L.W. & Kluck, S. A. (2015). An examination of the relationship between
athletic identity and career maturity in student-athletes, Journal of Clinical Sport
Psychology, 9, 24-40.
Huffman, T. L., & Cooper, C. G. (2012). I’m taking my talents to… An examination of
hometown socio-economic status on the college-choice factors of football
student-athletes at a Southeastern University. Journal of Issues in Intercollegiate
Athletics, 5, 225-246.
Hyman, J., & Jura, M.V. (2009). Elite collegiate athletics and the academy: Criticisms,
benefits, and the role of student affairs. The Vermont Connection, 30, 42-52.
John, O. P., & Srivastava, S. (1999). The Big-Five trait taxonomy: History, measurement,
and theoretical perspectives. In L. A. Pervin & O. P. John (Eds.), Handbook of
personality: Theory and research (Vol. 2, pp. 102–138). New York, NY: Guilford
Press.
Page 127
115
Killeya-Jones, L. A. (2005). Identity structure, role discrepancy and psychological
adjustment in male college student-athletes. Journal of Sport Behavior, 28(2),
167-185.
Kilpatrick, M., Hebert, E., & Bartholomew, J. (2005). College student’s motivation for
physical activity: Differentiating men’s and women’s motives for sport
participation and exercise. Journal of American College Health, 54(2), 87-97.
Kornspan, A. S., & Etzel, E. F. (2001). The relationship of demographic and
psychological variables to career maturity of junior college student-athletes.
Journal of College Student Development, 42(2), 122-132.
Lally, P. S., & Kerr, G. A. (2005). The career planning, athletic identity, and student role
identity of intercollegiate student athletes. Research Quarterly for Exercise and
Sport, 76(3), 275-285.
Lanning, W. (1982). The privileged few: Special counseling needs of athletes. Journal of
Sport Psychology, 4, 19-23.
Lavallee, D., Gordon, S., & Grove, R. J. (1997). Retirement from sport and the loss of
identity. Journal of Personal and Interpersonal loss: International Perspectives
on Stress and Coping, 2(2), 129-147.
Lawrence, J. Ott, M., & Hendricks, L. (2009). Athletics reform and faculty perceptions,
New Directions for Higher Education, 148, 73-81.
Leung, D., Wong, D., Chan, S., & Lam, T. (2013). Psychometric properties of the big
five inventory in a Chinese sample of smokers receiving cessation treatment: A
validation study. Journal of Nursing Education and Practice, 3(6), 1-10.
Page 128
116
Linnemeyer, R. M., & Brown, C. (2010). Career maturity and foreclosure in student
athletes, fine arts students, and general college students. Journal of Career
Development, 37(3), 616-634.
Lleras, C. (2005). Path analysis. Encyclopedia of Social Movement, 3, 25-30.
Loughran, M. J., & Etzel, E. F. (2008). Ethical practice in a diverse world: The
challenges of working with difference in the psychological treatment of college
student-athletes. The Online Journal of Sport Psychology, 10(4), 7-14.
Luzzo, D. A. (1996). A psychometric evaluation of the career decision-making self-
efficacy scale. Journal of Counseling and Development, 74, 276-279.
Mael, F. A., & Ashforth, B. E. (2001). Identification in work, war sports and religion:
Contrasting the benefits and risks. Journal for the Theory of Social Behaviour,
31(2), 197-222.
Mahony, F. D., Riemer, A. H., Breeding, L. J., & Hums, A. M. (2006). Organizational
justice in sports organizations: Perceptions of college athletes and other college
students. Journal of Sport Management, 20, 159-188.
Mamerow, P. G. & Navarro, M. K. (2014). Put me in, coach! Making the academic
learning community an option for student-athletes. Learning Communities
Research and Practice, 2(1), 1-10.
Martin, J. J., Eklund, R. C., & Mushett, C. A. (1997). Factor structure of the athletic
identity measurement scale with athletes with disabilities. Adapted Physical
Activity Quarterly, 14, 74-82.
Page 129
117
Martin, L. K., & Christy, K. (2010). The rise and impact of high profile spectator sports
on American higher education. Journal of Issues in Intercollegiate Athletics, 3, 1-
15.
Mayo, D. (June, 2011). As cheating runs rampant in college athletics, NCAA often sits on
the sidelines. MLive Media Group. Retrieved from:
http://www.mlive.com/sports/grand-
rapids/index.ssf/2011/06/as_cheating_runs_rampant_in_co.html
McCormick, A. R., & McCormick, C. A. (2010). A trail of tears: The exploitation of the
college athlete. Florida Coastal Law Review, 11, 639-665.
McKnight, K., Bernes, K., Gunn, T., Chorney, D., Orr, D., & Bardick, A. (2009). Life
after sport: Athletic career transition and transferable skills. Journal of
Excellence, 13, 63-77.
McPherson, L. (2013). Exploring relationships between student-athletes, occupational
engagement, and vocational identity. Global Sports Business Journal, 1(1), 38-58.
Mertler, C. A., & Vannatta, R. A. (2005). Advanced and multivariate statistical methods:
Practical application and interpretation (3rd ed.). Los Angeles, CA: Pyrczak.
Miller, K. E. (2009). Sport-related identities and the “toxic jock.” Journal of Sport
Behavior. 32(1), 69-91.
Miller, P. S., & Kerr, G. A. (2003). The role experimentation of intercollegiate student
athletes. The Sport Psychologist, 17, 196-219.
Morgan, T., & Ness, D. (2003). Career decision making difficulties of first year students.
The Canadian Journal of Career Development, 2, 33-37.
Page 130
118
Murphy, G. M., Petitpas, A. J., & Brewer, B. W. (1996). Identity foreclosure, athletic
identity, and career maturity in intercollegiate athletes. The Sport Psychologist,
10, 239-246.
Murty, S. K., Roebuck, B. J. & McCamey Jr., D. J. (2014). Race and class exploitation: A
study of Black male student athletes (BSAs) on White campuses. Race, Gender
and Class, 21(3-4), 156-173.
Nasco, S. A., & Webb, W. M. (2006). Toward an expanded measure of athletic identity:
The inclusion of public and private dimensions. Journal of Sports and Exercise
Psychology, 28, 434-453.
National Collegiate Athletic Association. (2011a). NCAA academic reform. Retrieved
from http://www.ncaa.org/wps/wcm/connect/public/NCAA/Academics/
How+academic+reform+is+measured
Nite, C. (2012). Challenge for supporting student-athlete development: Perspectives from
an NCAA division II athletic department. Journal of Issues in Intercollegiate
Athletes, 5, 1-14.
Olobatuyi, M. E. (2006). A user’s guide to path analysis. Lanham, MD: University Press
of America.
Osborne, B. (2014). The myth of the exploited student-athlete, Journal of Intercollegiate
Sport, 7, 143-152.
Parsons, J. (2013). Student athlete perceptions of academic success and athlete
stereotypes on campus. Journal of Sport Behavior, 36(4), 400-416.
Paule, A. L., & Gilson, T. A. (2010). Current collegiate experience of big-time, non-
revenue, NCAA athletes. Journal of Intercollegiate Sport, 3, 333-347.
Page 131
119
Pearson, R. E., & Petitpas, A. J. (1990). Transitions of athletes: Developmental and
preventative perspectives. Journal of Counseling and Development, 69, 7-10.
Pennington, B. (September, 2012). Cheating scandal dulls pride in athletics at Harvard.
The New York Times. Retrieved from: http://www.nytimes.com/2012/09/19/
sports/ncaabasketball/Harvard-cheating-scandal-revives-debate-over-
athletics.html?_r=0
Polite, G. F., Waller, N. S., Trendafilova, A. S., & Spearman, L. (2011). Social
accountability and responsibility in sport: An examination of the national
collegiate athletic association. Sports Science Review, 20(1-2), 111-135.
Readdy, T., Raabe, J., & Harding, S. J. (2014). Student-athletes’ perceptions of an
extrinsic reward program: A mixed-methods exploration of self-determination
theory in the context of college football. Journal of Applied Sport Psychology,
26(2), 157-171.
Reiter, M. D., Liput, T., & Nirmal, R. (2007). Personality preferences of college student-
athletes. College Student Journal, 41, 34-37.
Reynolds, L., Fisher, D., & Cavil, J.K. (2012). Impact of demographic variables on
African-American student athletes’ academic performance. Educational
Foundations, 26(3), 93-111.
Rishe, P. (June, 2011). Cheating in college athletics and the prisoner’s dilemma. Forbes.
Retrieved from: http://www.forbes.com/sites/sportsmoney/2011/06/26/cheating-
in-college-athletics-and-the-prisoners-dilemma/
Page 132
120
Samuel, R. D., & Tenenbaum, G. (2011). The role of change in athletes’ careers: A
scheme of change for sport psychology practice. The Sport Psychologist, 25, 233-
252.
Sanderson, J. (2011). To tweet or not to tweet: Exploring division I athletic departments’
social-media policies. International Journal of Sports Communication, 4, 492-
513.
Sanderson, J., Browning, B., & Schmittel, A. (2015). Education on the digital terrain: A
case study exploring college athletes’ perceptions of social-media training.
International Journal of Sports Communication, 8, 103-124.
Sanderson, R. A., & Siegfried, J. J. (2015). The case for paying college athletes. Journal
of Economic Perspectives, 29(1), 115-138.
Savickas, M. L., & Porfeli, E. J. (2011). Revision of the career maturity inventory: The
adaptability form. Journal of Career Assessment, 19(4), 355-374.
Schroeder, P. J. (2010). A model for assessing organizational culture in intercollegiate
athletic departments. Journal of Issues in Intercollegiate Athletics, 3, 98-118.
Scott, D. K. (1997). Managing organizational culture in intercollegiate athletic
organizations. National Association for Physical Education in Higher Education,
49, 403-415
Settles, I. H., Sellers, R. M., & Damas Jr., A. (2002). One role or two? The function of
psychological separation in role conflict. Journal of Applied Psychology, 87(3),
574-582.
Shelangoski, B. L., Hambrick, M. E., Gross, J. P., & Weber, J. D. (2014). Self-efficacy in
intercollegiate athletes. Journal of Issues in Intercollegiate Athletics, 7, 17-42.
Page 133
121
Shurts, W. M., & Shoffner, M. F. (2004). Providing career counseling for collegiate
student-athletes: A learning theory approach. Journal of Career Development,
31(2), 95-109.
Simons, D. H. M., Bosworth, C., Fujita, S., & Jensen, M. (2007). The athlete stigma in
higher education. College Student Journal, 41, 251-273.
Simons, H. D., Bosworth, C., Fujita, S., & Jensen, M. (2007). The athlete stigma in
higher education. College Student Journal, 41(2), 251-274.
Smallman, E., & Sowa, C. (1996). Career maturity levels of male intercollegiate varsity
athletes. The Career Development Quarterly, 44, 270-277.
Sowa, C., & Gressard, C. (1983). Athletic participation and athletic roles. Sociology of
Sport Journal, 2, 210-217.
Stambulova, N., Alfermann, D., Statler, T., & Cote, J. (2009). ISSP position stand:
Career development and transitions of athletes. Career Development and
Transitions, 7, 395- 412.
Stets, J. E., & Burke, P. J. (2000). Identity theory and social identity theory. Social
Psychology Quarterly, 63(3), 224-237.
Streiner, D. L. (2005). Finding our way: An introduction to path analysis. The Canadian
Journal of Psychiatry-Research Methods in Psychiatry, 50(2), 115-122.
Stumpf, S. A., Colarelli, S. M., & Hartman, K. (1983). Development of the career
exploration survey (CES). Journal of Vocational Behavior, 22, 191-226.
Suggs, W. (2009). Old challenges and new opportunities for studying the financial
aspects of intercollegiate athletics. New Directions for Higher Education, 148, 11-
22.
Page 134
122
Tajfel, H., & Turner, J. (1979). An integrative theory of inter-group conflict. In J. A.
Williams & S. Worchel (Eds.), The social psychology of inter-group relations
(pp. 33-47). Belmont, CA: Wadsworth.
Tanaka, J. S. (1987). How big is big enough?: Sample size and goodness of fit in
structural equation models with latent variables. Child Development, 58, 134-146.
Taylor, K. M., & Betz, N. E. (1983). Applications of self-efficacy theory to the
understanding and treatment of career indecision. Journal of Vocational Behavior,
22, 63-81.
Trepte, S. (2006). Social identity theory. In J. Bryant & P. Vorderer (Eds.) Psychology of
Entertainment (pp. 255-271). Mahway, NJ: Lawrence Erlbaum Associates.
Tyrance, S. C., Harris, H. L., & Post, P. (2013). Predicting positive career planning
attitudes among NCAA division I college student-athletes. Journal of Clinical
Sports Psychology, 7, 22-40.
Walpole, M. (2003). Socioeconomic status and college: How SES affects college
experiences and outcomes. The Review of Higher Education, 27(1), 45-73.
Walsh, D. (2011). All a twitter: Social networking, college athletes, and the first
amendment. William and Mary Bill of Rights Journal, 20, 619-650.
Warner, S. & Dixon, A. M. (2015). Competition, gender and the sport experience: An
exploration among college athletes. Sports, Education and Society, 20(4), 527-
545.
Waters, P. (April, 2012). The biggest cheating fails in collegiate history. Elite Daily.
Retrieved from: http://elitedaily.com/humor/biggest-cheating-fails-collegiate-
history/
Page 135
123
Watt, S. K., & Moore, J. L. (2001). Who are student athletes? New Directions for Student
Services, 93, 7-18.
Williams, J., Colles, C. & Allen, J. K. (2010). Division III athletes: Perceptions of faculty
interactions and academic support services. Journal of Issues in Intercollegiate
Athletics, 3, 211-233.
Wilson, G., & Pritchard, M. (2005). Comparing sources of stress in college student
athletes and non-athletes. The Online Journal of Sport Psychology, 7(1), 1-8.
Wooten Jr, H. R. (1994). Cutting losses for student-athletes in transition: An integrative
transition model. Journal of Employment Counseling, 31, 2-9.
Wylleman, P., & Lavallee, D. (2004). A developmental perspective on transitions faced
by athletes. As seen in Developmental Sport and Exercise Psychology: A lifespan
perspective. p. 507-527. Morgantown, WV: Fitness Information Technology.
Yukhymenko-Lescroart, M. A. (2014). Student and athletes? Development of the
academic and athletic identity scale (AAIS). Sport, Exercise, and Performance
Psychology, 3(2), 89-101.