20
Cargills Bank Limited Interim Financial Statement 2016 For The Six Months Ended 30 June 2016
Cargills Bank Limited Interim Financial Statement 2016
For The Six Months Ended 30 June 2016


1
Car
gill
s B
ank
Lim
ited
| I
nte
rim
Fin
anci
al S
tate
men
t 20
16
Bank
For the six months ended For the quarter ended
30-Jun-16 30-Jun-15 Change 30-Jun-16 30-Jun-15 Change
Rs. ‘000 Rs. ‘000 % Rs. ‘000 Rs. ‘000 %
Interest income 563,622 213,305 164 322,358 116,466 177
Interest expenses (226,356) (73,058) (210) (128,981) (48,304) (167)
Net interest income 337,266 140,247 140 193,377 68,162 184
Fees and commission income 38,943 17,774 119 24,941 8,823 183
Fees and commission expenses (10,439) (3,857) (171) (5,825) (2,188) (166)
Net fees and commission income 28,504 13,917 105 19,116 6,635 188
Net gains / (losses) from trading (1,981) 29 (6,931) (2,619) 27 (9,800)
Net gains / (losses) from financial
instruments at fair value through profit & loss - - - - - -
Net gains / (losses) from financial investments 2,905 1,646 76 1,742 1,455 20
Other income 18,396 7,083 160 4,016 4,399 (9)
Total other income 19,320 8,758 121 3,139 5,881 (47)
Total operating income 385,090 162,922 136 215,632 80,678 167
Impairment for loans and other losses
Individual impairment (1,173) (7,691) 85 (596) (7,628) 92
Collective impairment (16,409) (7,677) (114) (7,361) (4,673) (58)
Others - - - - - -
Total impairment for loans and other losses (17,582) (15,368) (14) (7,957) (12,301) 35
Net operating income 367,508 147,554 149 207,675 68,377 204
Personnel expenses (207,838) (112,061) (85) (98,673) (60,097) (64)
Depreciation and amortisation (73,659) (61,744) (19) (36,979) (31,154) (19)
Other operating expenses (203,298) (139,638) (46) (101,717) (70,005) (45)
Total operating Expenses (484,795) (313,443) (55) (237,369) (161,256) (47)
Operating profit/ (loss) before Value Added Tax
(VAT) and Nation Building Tax (NBT) (117,287) (165,889) 29 (29,694) (92,879) 68
VAT and NBT on financial services (8,776) - - (7,211) - -
Profit/ (loss) before tax (126,063) (165,889) 24 (36,905) (92,879) 60
Tax expenses - - - - - -
Profit/(loss) for the period (126,063) (165,889) 24 (36,905) (92,879) 60
Earnings/ (loss) per share Equity shareholders
of the parent for the period:
Earnings/ (loss) per share (Rs.) (0.24) (0.38) 37 (0.06) (0.21) 70
Income Statement
2C
arg
ills
Ban
k Li
mit
ed |
In
teri
m F
inan
cial
Sta
tem
ent
2016
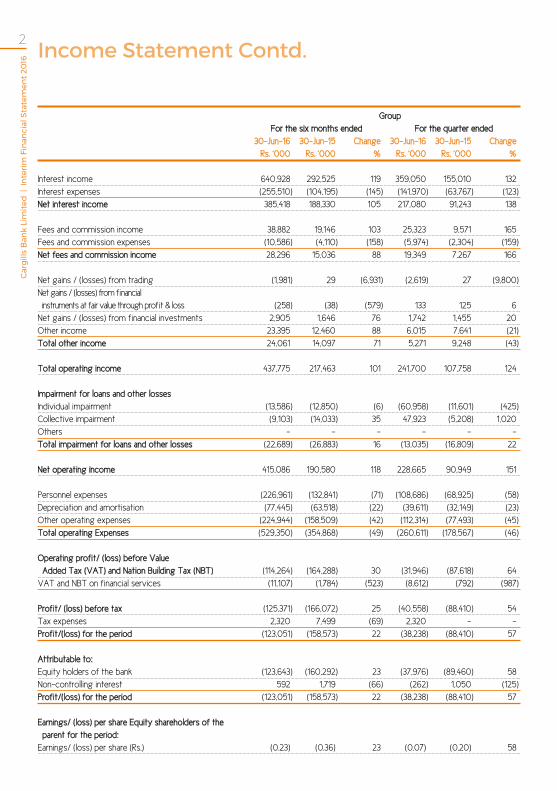
Group
For the six months ended For the quarter ended
30-Jun-16 30-Jun-15 Change 30-Jun-16 30-Jun-15 Change
Rs. ‘000 Rs. ‘000 % Rs. ‘000 Rs. ‘000 %
Interest income 640,928 292,525 119 359,050 155,010 132
Interest expenses (255,510) (104,195) (145) (141,970) (63,767) (123)
Net interest income 385,418 188,330 105 217,080 91,243 138
Fees and commission income 38,882 19,146 103 25,323 9,571 165
Fees and commission expenses (10,586) (4,110) (158) (5,974) (2,304) (159)
Net fees and commission income 28,296 15,036 88 19,349 7,267 166
Net gains / (losses) from trading (1,981) 29 (6,931) (2,619) 27 (9,800)
Net gains / (losses) from financial
instruments at fair value through profit & loss (258) (38) (579) 133 125 6
Net gains / (losses) from financial investments 2,905 1,646 76 1,742 1,455 20
Other income 23,395 12,460 88 6,015 7,641 (21)
Total other income 24,061 14,097 71 5,271 9,248 (43)
Total operating income 437,775 217,463 101 241,700 107,758 124
Impairment for loans and other losses
Individual impairment (13,586) (12,850) (6) (60,958) (11,601) (425)
Collective impairment (9,103) (14,033) 35 47,923 (5,208) 1,020
Others - - - - - -
Total impairment for loans and other losses (22,689) (26,883) 16 (13,035) (16,809) 22
Net operating income 415,086 190,580 118 228,665 90,949 151
Personnel expenses (226,961) (132,841) (71) (108,686) (68,925) (58)
Depreciation and amortisation (77,445) (63,518) (22) (39,611) (32,149) (23)
Other operating expenses (224,944) (158,509) (42) (112,314) (77,493) (45)
Total operating Expenses (529,350) (354,868) (49) (260,611) (178,567) (46)
Operating profit/ (loss) before Value
Added Tax (VAT) and Nation Building Tax (NBT) (114,264) (164,288) 30 (31,946) (87,618) 64
VAT and NBT on financial services (11,107) (1,784) (523) (8,612) (792) (987)
Profit/ (loss) before tax (125,371) (166,072) 25 (40,558) (88,410) 54
Tax expenses 2,320 7,499 (69) 2,320 - -
Profit/(loss) for the period (123,051) (158,573) 22 (38,238) (88,410) 57
Attributable to:
Equity holders of the bank (123,643) (160,292) 23 (37,976) (89,460) 58
Non-controlling interest 592 1,719 (66) (262) 1,050 (125)
Profit/(loss) for the period (123,051) (158,573) 22 (38,238) (88,410) 57
Earnings/ (loss) per share Equity shareholders of the
parent for the period:
Earnings/ (loss) per share (Rs.) (0.23) (0.36) 23 (0.07) (0.20) 58
Income Statement contd.
3
Car
gill
s B
ank
Lim
ited
| I
nte
rim
Fin
anci
al S
tate
men
t 20
16
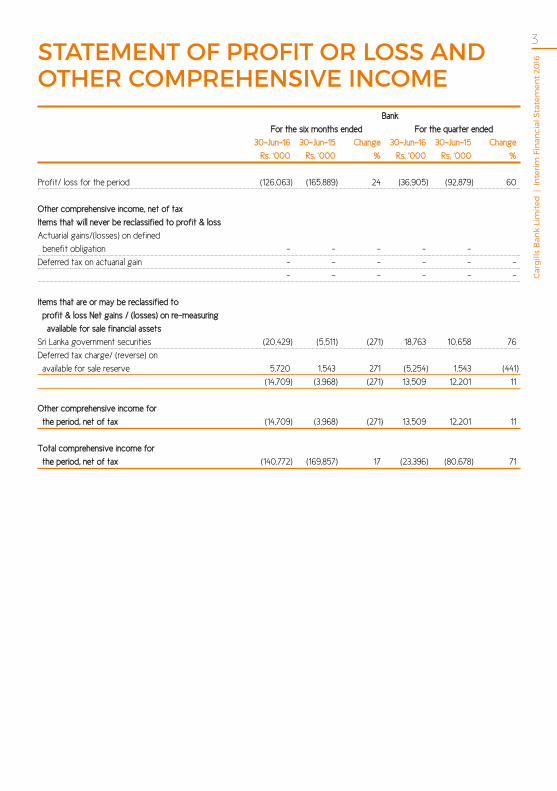
Bank
For the six months ended For the quarter ended
30-Jun-16 30-Jun-15 Change 30-Jun-16 30-Jun-15 Change
Rs. ‘000 Rs. ‘000 % Rs. ‘000 Rs. ‘000 %
Profit/ loss for the period (126,063) (165,889) 24 (36,905) (92,879) 60
Other comprehensive income, net of tax
Items that will never be reclassified to profit & loss
Actuarial gains/(losses) on defined
benefit obligation - - - - -
Deferred tax on actuarial gain - - - - - -
- - - - - -
Items that are or may be reclassified to
profit & loss Net gains / (losses) on re-measuring
available for sale financial assets
Sri Lanka government securities (20,429) (5,511) (271) 18,763 10,658 76
Deferred tax charge/ (reverse) on
available for sale reserve 5,720 1,543 271 (5,254) 1,543 (441)
(14,709) (3,968) (271) 13,509 12,201 11
Other comprehensive income for
the period, net of tax (14,709) (3,968) (271) 13,509 12,201 11
Total comprehensive income for
the period, net of tax (140,772) (169,857) 17 (23,396) (80,678) 71
Statement of ProfIt or LoSS and other comPrehenSIve Income
4C
arg
ills
Ban
k Li
mit
ed |
In
teri
m F
inan
cial
Sta
tem
ent
2016
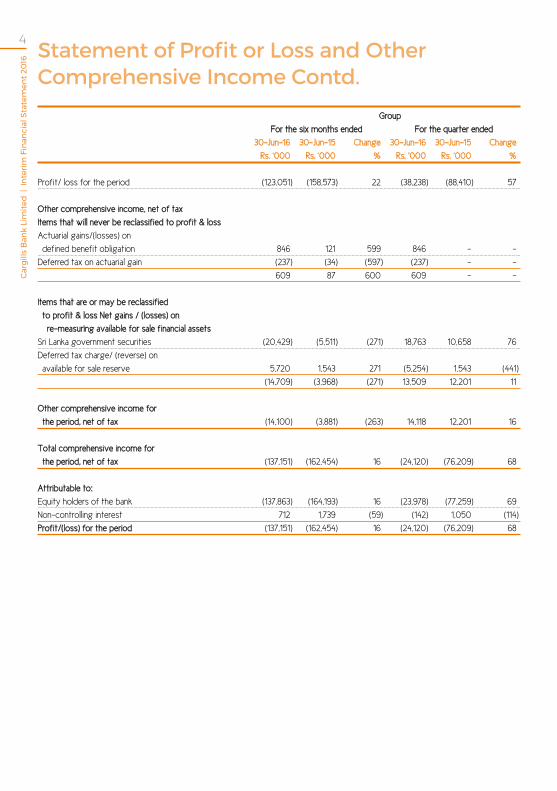
Group
For the six months ended For the quarter ended
30-Jun-16 30-Jun-15 Change 30-Jun-16 30-Jun-15 Change
Rs. ‘000 Rs. ‘000 % Rs. ‘000 Rs. ‘000 %
Profit/ loss for the period (123,051) (158,573) 22 (38,238) (88,410) 57
Other comprehensive income, net of tax
Items that will never be reclassified to profit & loss
Actuarial gains/(losses) on
defined benefit obligation 846 121 599 846 - -
Deferred tax on actuarial gain (237) (34) (597) (237) - -
609 87 600 609 - -
Items that are or may be reclassified
to profit & loss Net gains / (losses) on
re-measuring available for sale financial assets
Sri Lanka government securities (20,429) (5,511) (271) 18,763 10,658 76
Deferred tax charge/ (reverse) on
available for sale reserve 5,720 1,543 271 (5,254) 1,543 (441)
(14,709) (3,968) (271) 13,509 12,201 11
Other comprehensive income for
the period, net of tax (14,100) (3,881) (263) 14,118 12,201 16
Total comprehensive income for
the period, net of tax (137,151) (162,454) 16 (24,120) (76,209) 68
Attributable to:
Equity holders of the bank (137,863) (164,193) 16 (23,978) (77,259) 69
Non-controlling interest 712 1,739 (59) (142) 1,050 (114)
Profit/(loss) for the period (137,151) (162,454) 16 (24,120) (76,209) 68
Statement of Profit or Loss and other comprehensive Income contd.

5
Car
gill
s B
ank
Lim
ited
| I
nte
rim
Fin
anci
al S
tate
men
t 20
16
Bank Group
As at 30-Jun-16 31-Dec-15 30-Jun-16 31-Dec-15
(Audited) (Audited)
Rs. ‘000 Rs. ‘000 Rs. ‘000 Rs. ‘000
Assets
Cash and cash equivalents 190,112 174,129 204,555 196,157
Balances with Central Bank 366,006 139,342 366,006 139,342
Placements with banks 2,837,347 2,018,773 2,837,347 2,018,773
Other financial instruments held for trading - - 1,333 2,300
Loans and receivables to banks 900,000 1,000,172 922,000 1,022,172
Loans and receivables to other customers 10,162,937 7,206,375 10,812,019 8,084,912
Financial investments available for sale 2,437,771 1,604,080 2,438,117 1,604,426
Financial investments held to maturity - - 40,755 40,036
Investment in subsidiary 574,917 459,200 - -
Property, plant & equipment 229,810 242,350 280,687 296,324
Intangible assets 197,596 209,692 409,065 420,760
Deferred tax assets 126,535 120,815 134,518 124,834
Other assets 153,393 273,463 179,957 303,248
Total assets 18,176,424 13,448,391 18,626,359 14,253,284
Liabilities and equity
Due to banks 19,894 5,347 66,431 6,507
Due to other customers 6,855,307 3,870,200 7,170,158 4,587,188
Other borrowings 519,343 1,993,383 519,343 1,993,383
Deferred tax liabilities - - - -
Other liabilities 277,336 2,736,216 288,668 2,748,955
Total liabilities 7,671,880 8,605,146 8,044,600 9,336,033
Statement of fInancIaL PoSItIon
6C
arg
ills
Ban
k Li
mit
ed |
In
teri
m F
inan
cial
Sta
tem
ent
2016
Bank Group
As at 30-Jun-16 31-Dec-15 30-Jun-16 31-Dec-15
(Audited) (Audited)
Rs. ‘000 Rs. ‘000 Rs. ‘000 Rs. ‘000
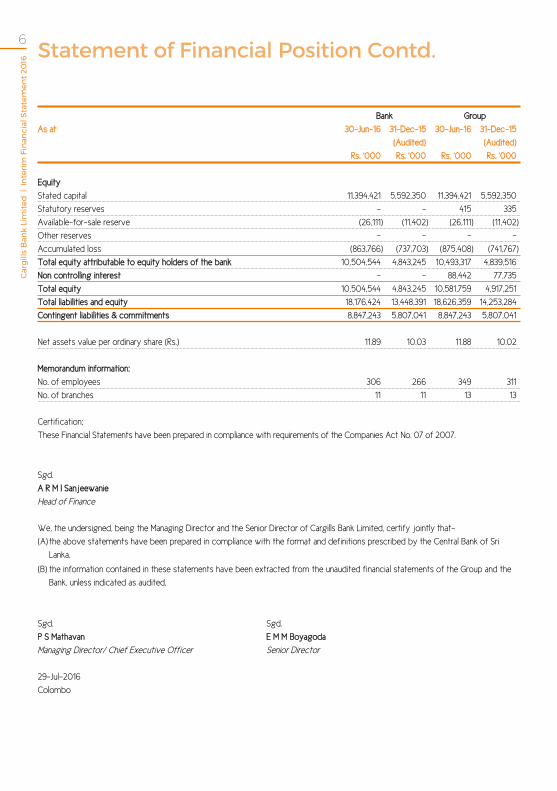
Equity
Stated capital 11,394,421 5,592,350 11,394,421 5,592,350
Statutory reserves - - 415 335
Available-for-sale reserve (26,111) (11,402) (26,111) (11,402)
Other reserves - - - -
Accumulated loss (863,766) (737,703) (875,408) (741,767)
Total equity attributable to equity holders of the bank 10,504,544 4,843,245 10,493,317 4,839,516
Non controlling interest - - 88,442 77,735
Total equity 10,504,544 4,843,245 10,581,759 4,917,251
Total liabilities and equity 18,176,424 13,448,391 18,626,359 14,253,284
Contingent liabilities & commitments 8,847,243 5,807,041 8,847,243 5,807,041
Net assets value per ordinary share (Rs.) 11.89 10.03 11.88 10.02
Memorandum information:
No. of employees 306 266 349 311
No. of branches 11 11 13 13
Certification:
These Financial Statements have been prepared in compliance with requirements of the Companies Act No. 07 of 2007.
Sgd.
A R M I Sanjeewanie
Head of Finance
We, the undersigned, being the Managing Director and the Senior Director of Cargills Bank Limited, certify jointly that-
(A) the above statements have been prepared in compliance with the format and definitions prescribed by the Central Bank of Sri
Lanka,
(B) the information contained in these statements have been extracted from the unaudited financial statements of the Group and the
Bank, unless indicated as audited.
Sgd. Sgd.
P S Mathavan E M M Boyagoda
Managing Director/ Chief Executive Officer Senior Director
29-Jul-2016
Colombo
Statement of financial Position contd.
7
Car
gill
s B
ank
Lim
ited
| I
nte
rim
Fin
anci
al S
tate
men
t 20
16
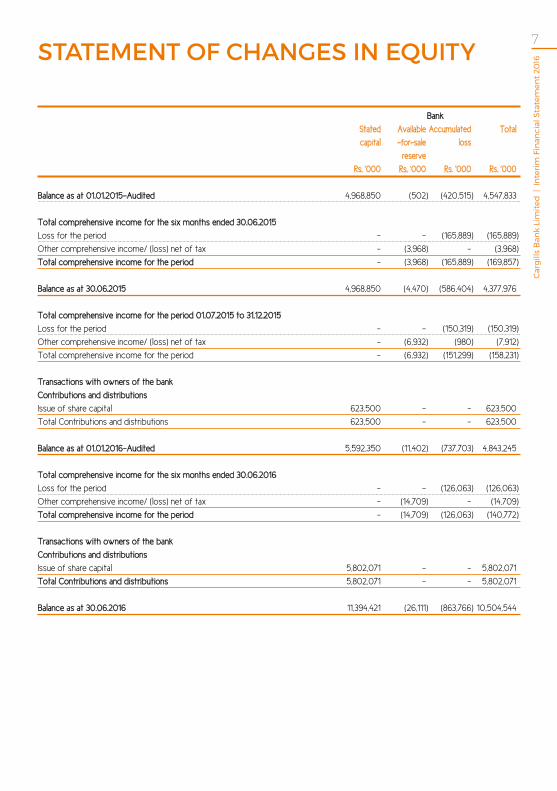
Bank
Stated Available Accumulated Total
capital -for-sale loss
reserve
Rs. ‘000 Rs. ‘000 Rs. ‘000 Rs. ‘000
Balance as at 01.01.2015-Audited 4,968,850 (502) (420,515) 4,547,833
Total comprehensive income for the six months ended 30.06.2015
Loss for the period - - (165,889) (165,889)
Other comprehensive income/ (loss) net of tax - (3,968) - (3,968)
Total comprehensive income for the period - (3,968) (165,889) (169,857)
Balance as at 30.06.2015 4,968,850 (4,470) (586,404) 4,377,976
Total comprehensive income for the period 01.07.2015 to 31.12.2015
Loss for the period - - (150,319) (150,319)
Other comprehensive income/ (loss) net of tax - (6,932) (980) (7,912)
Total comprehensive income for the period - (6,932) (151,299) (158,231)
Transactions with owners of the bank
Contributions and distributions
Issue of share capital 623,500 - - 623,500
Total Contributions and distributions 623,500 - - 623,500
Balance as at 01.01.2016-Audited 5,592,350 (11,402) (737,703) 4,843,245
Total comprehensive income for the six months ended 30.06.2016
Loss for the period - - (126,063) (126,063)
Other comprehensive income/ (loss) net of tax - (14,709) - (14,709)
Total comprehensive income for the period - (14,709) (126,063) (140,772)
Transactions with owners of the bank
Contributions and distributions
Issue of share capital 5,802,071 - - 5,802,071
Total Contributions and distributions 5,802,071 - - 5,802,071
Balance as at 30.06.2016 11,394,421 (26,111) (863,766) 10,504,544
Statement of changeS In equIty

8C
arg
ills
Ban
k Li
mit
ed |
In
teri
m F
inan
cial
Sta
tem
ent
2016
Group
Stated Statutory Available Accumulated Attributable Non Total
capital reserves -for-sale loss to owners controlling
reserve of the bank interest
Rs. ‘000 Rs. ‘000 Rs. ‘000 Rs. ‘000 Rs. ‘000 Rs. ‘000 Rs. ‘000
Balance as at 01.01.2015-Audited 4,968,850 - (502) (424,694) 4,543,654 77,597 4,621,251
Total comprehensive income for the six months ended 30.06.2015
Profit for the period - - - (160,292) (160,292) 1,719 (158,573)
Other comprehensive income/ (loss) net of tax - - (3,968) 67 (3,901) 20 (3,881)
Total comprehensive income for the period - - (3,968) (160,225) (164,193) 1,739 (162,454)
Balance as at 30.06.2015 4,968,850 - (4,470) (584,919) 4,379,461 79,336 4,458,797
Total comprehensive income for the period 01.07.2015 to 31.12.2015
Loss for the period - - - (155,533) (155,533) (1,601) (157,134)
Other comprehensive income/ (loss) net of tax - - (6,932) (980) (7,912) - (7,912)
Total comprehensive income for the period - - (6,932) (156,513) (163,445) (1,601) (165,046)
Transactions with owners of the bank
Contributions and distributions
Issue of share capital 623,500 - - - 623,500 - 623,500
Transfer to statutory reserve - 335 - (335) - - -
Total Contributions and distributions 623,500 335 - (335) 623,500 - 623,500
Balance as at 01.01.2016-Audited 5,592,350 335 (11,402) (741,767) 4,839,516 77,735 4,917,251
Total comprehensive income for the six months ended 30.06.2016
Profit for the period - - - (123,643) (123,643) 592 (123,051)
Other comprehensive income/ (loss) net of tax - - (14,709) 489 (14,220) 120 (14,100)
Total comprehensive income for the period - - (14,709) (123,154) (137,863) 712 (137,151)
Transactions with owners of the bank
Contributions and distributions
Issue of share capital 5,802,071 - - - 5,802,071 - 5,802,071
Movement due to change in shareholding - - - (9,609) (9,609) 10,190 581
Expense on right issue - - - (798) (798) (195) (993)
Transfer to statutory reserve - 80 - (80) - - -
Total Contributions and distributions 5,802,071 80 - (10,487) 5,791,664 9,995 5,801,659
Balance as at 30.06.2016 11,394,421 415 (26,111) (875,408) 10,493,317 88,442 10,581,759
Note
Cargills Bank Limited participated in the rights issue of Colombo Trust Finance PLC, whereby its holding increased from 76.51% to
80.34% as at 5 January 2016.
As per SLFRS 10 on ‘Consolidated Financial Statements’, changes in a parent’s ownership interest in a subsidiary that do not result in
the parent losing control are equity transactions and hence, recognized directly in equity.
Statement of changes in equity contd.
9
Car
gill
s B
ank
Lim
ited
| I
nte
rim
Fin
anci
al S
tate
men
t 20
16
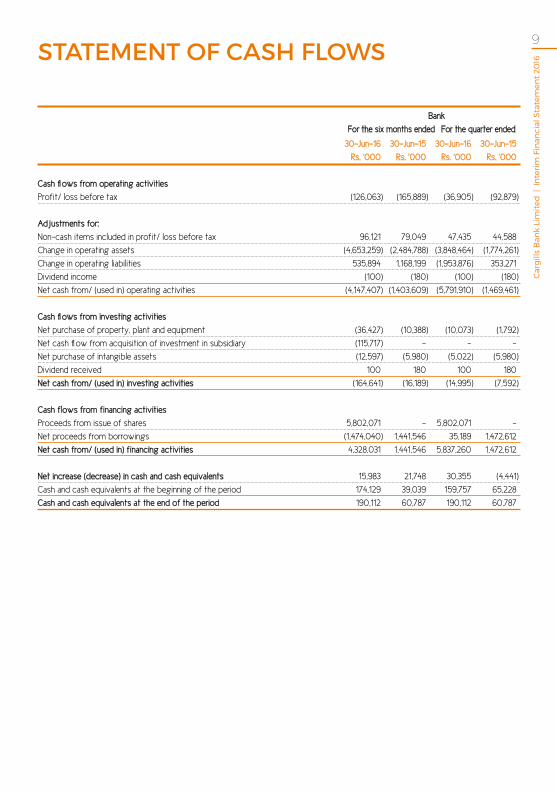
Bank
For the six months ended For the quarter ended
30-Jun-16 30-Jun-15 30-Jun-16 30-Jun-15
Rs. ‘000 Rs. ‘000 Rs. ‘000 Rs. ‘000
Cash flows from operating activities
Profit/ loss before tax (126,063) (165,889) (36,905) (92,879)
Adjustments for:
Non-cash items included in profit/ loss before tax 96,121 79,049 47,435 44,588
Change in operating assets (4,653,259) (2,484,788) (3,848,464) (1,774,261)
Change in operating liabilities 535,894 1,168,199 (1,953,876) 353,271
Dividend income (100) (180) (100) (180)
Net cash from/ (used in) operating activities (4,147,407) (1,403,609) (5,791,910) (1,469,461)
Cash flows from investing activities
Net purchase of property, plant and equipment (36,427) (10,388) (10,073) (1,792)
Net cash flow from acquisition of investment in subsidiary (115,717) - - -
Net purchase of intangible assets (12,597) (5,980) (5,022) (5,980)
Dividend received 100 180 100 180
Net cash from/ (used in) investing activities (164,641) (16,189) (14,995) (7,592)
Cash flows from financing activities
Proceeds from issue of shares 5,802,071 - 5,802,071 -
Net proceeds from borrowings (1,474,040) 1,441,546 35,189 1,472,612
Net cash from/ (used in) financing activities 4,328,031 1,441,546 5,837,260 1,472,612
Net increase (decrease) in cash and cash equivalents 15,983 21,748 30,355 (4,441)
Cash and cash equivalents at the beginning of the period 174,129 39,039 159,757 65,228
Cash and cash equivalents at the end of the period 190,112 60,787 190,112 60,787
Statement of caSh fLowS
10C
arg
ills
Ban
k Li
mit
ed |
In
teri
m F
inan
cial
Sta
tem
ent
2016
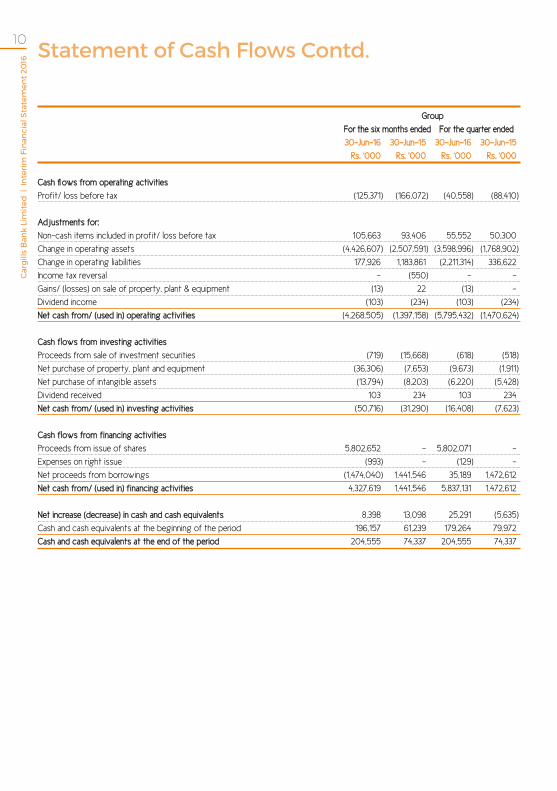
Group
For the six months ended For the quarter ended
30-Jun-16 30-Jun-15 30-Jun-16 30-Jun-15
Rs. ‘000 Rs. ‘000 Rs. ‘000 Rs. ‘000
Cash flows from operating activities
Profit/ loss before tax (125,371) (166,072) (40,558) (88,410)
Adjustments for:
Non-cash items included in profit/ loss before tax 105,663 93,406 55,552 50,300
Change in operating assets (4,426,607) (2,507,591) (3,598,996) (1,768,902)
Change in operating liabilities 177,926 1,183,861 (2,211,314) 336,622
Income tax reversal - (550) - -
Gains/ (losses) on sale of property, plant & equipment (13) 22 (13) -
Dividend income (103) (234) (103) (234)
Net cash from/ (used in) operating activities (4,268,505) (1,397,158) (5,795,432) (1,470,624)
Cash flows from investing activities
Proceeds from sale of investment securities (719) (15,668) (618) (518)
Net purchase of property, plant and equipment (36,306) (7,653) (9,673) (1,911)
Net purchase of intangible assets (13,794) (8,203) (6,220) (5,428)
Dividend received 103 234 103 234
Net cash from/ (used in) investing activities (50,716) (31,290) (16,408) (7,623)
Cash flows from financing activities
Proceeds from issue of shares 5,802,652 - 5,802,071 -
Expenses on right issue (993) - (129) -
Net proceeds from borrowings (1,474,040) 1,441,546 35,189 1,472,612
Net cash from/ (used in) financing activities 4,327,619 1,441,546 5,837,131 1,472,612
Net increase (decrease) in cash and cash equivalents 8,398 13,098 25,291 (5,635)
Cash and cash equivalents at the beginning of the period 196,157 61,239 179,264 79,972
Cash and cash equivalents at the end of the period 204,555 74,337 204,555 74,337
Statement of cash flows contd.
11
Car
gill
s B
ank
Lim
ited
| I
nte
rim
Fin
anci
al S
tate
men
t 20
16
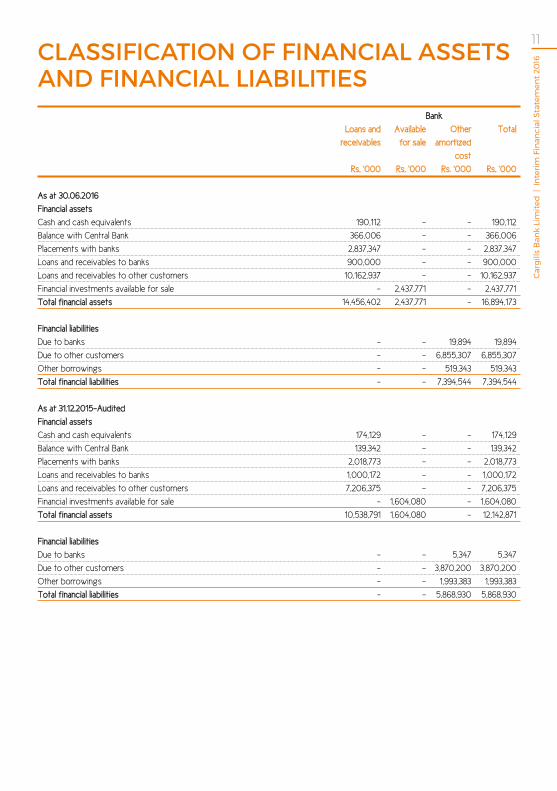
Bank
Loans and Available Other Total
receivables for sale amortized
cost
Rs. ‘000 Rs. ‘000 Rs. ‘000 Rs. ‘000
As at 30.06.2016
Financial assets
Cash and cash equivalents 190,112 - - 190,112
Balance with Central Bank 366,006 - - 366,006
Placements with banks 2,837,347 - - 2,837,347
Loans and receivables to banks 900,000 - - 900,000
Loans and receivables to other customers 10,162,937 - - 10,162,937
Financial investments available for sale - 2,437,771 - 2,437,771
Total financial assets 14,456,402 2,437,771 - 16,894,173
Financial liabilities
Due to banks - - 19,894 19,894
Due to other customers - - 6,855,307 6,855,307
Other borrowings - - 519,343 519,343
Total financial liabilities - - 7,394,544 7,394,544
As at 31.12.2015-Audited
Financial assets
Cash and cash equivalents 174,129 - - 174,129
Balance with Central Bank 139,342 - - 139,342
Placements with banks 2,018,773 - - 2,018,773
Loans and receivables to banks 1,000,172 - - 1,000,172
Loans and receivables to other customers 7,206,375 - - 7,206,375
Financial investments available for sale - 1,604,080 - 1,604,080
Total financial assets 10,538,791 1,604,080 - 12,142,871
Financial liabilities
Due to banks - - 5,347 5,347
Due to other customers - - 3,870,200 3,870,200
Other borrowings - - 1,993,383 1,993,383
Total financial liabilities - - 5,868,930 5,868,930
cLaSSIfIcatIon of fInancIaL aSSetS and fInancIaL LIabILItIeS
12C
arg
ills
Ban
k Li
mit
ed |
In
teri
m F
inan
cial
Sta
tem
ent
2016
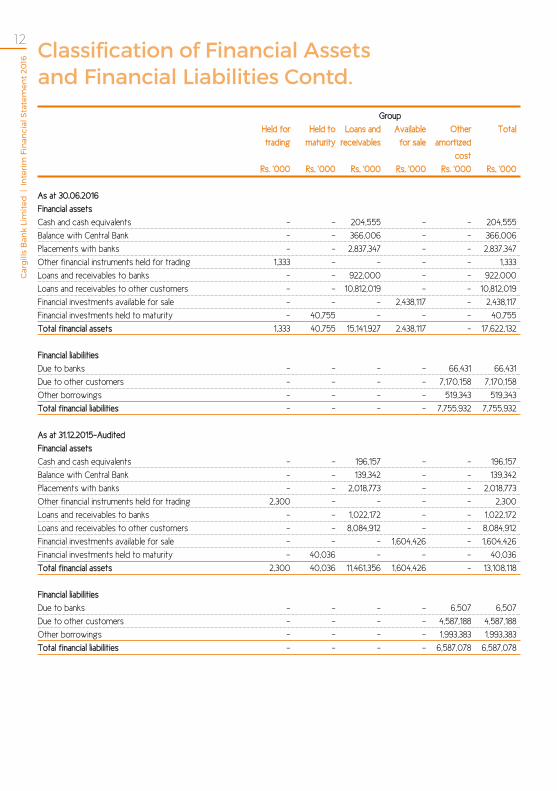
Group
Held for Held to Loans and Available Other Total
trading maturity receivables for sale amortized
cost
Rs. ‘000 Rs. ‘000 Rs. ‘000 Rs. ‘000 Rs. ‘000 Rs. ‘000
As at 30.06.2016
Financial assets
Cash and cash equivalents - - 204,555 - - 204,555
Balance with Central Bank - - 366,006 - - 366,006
Placements with banks - - 2,837,347 - - 2,837,347
Other financial instruments held for trading 1,333 - - - - 1,333
Loans and receivables to banks - - 922,000 - - 922,000
Loans and receivables to other customers - - 10,812,019 - - 10,812,019
Financial investments available for sale - - - 2,438,117 - 2,438,117
Financial investments held to maturity - 40,755 - - - 40,755
Total financial assets 1,333 40,755 15,141,927 2,438,117 - 17,622,132
Financial liabilities
Due to banks - - - - 66,431 66,431
Due to other customers - - - - 7,170,158 7,170,158
Other borrowings - - - - 519,343 519,343
Total financial liabilities - - - - 7,755,932 7,755,932
As at 31.12.2015-Audited
Financial assets
Cash and cash equivalents - - 196,157 - - 196,157
Balance with Central Bank - - 139,342 - - 139,342
Placements with banks - - 2,018,773 - - 2,018,773
Other financial instruments held for trading 2,300 - - - - 2,300
Loans and receivables to banks - - 1,022,172 - - 1,022,172
Loans and receivables to other customers - - 8,084,912 - - 8,084,912
Financial investments available for sale - - - 1,604,426 - 1,604,426
Financial investments held to maturity - 40,036 - - - 40,036
Total financial assets 2,300 40,036 11,461,356 1,604,426 - 13,108,118
Financial liabilities
Due to banks - - - - 6,507 6,507
Due to other customers - - - - 4,587,188 4,587,188
Other borrowings - - - - 1,993,383 1,993,383
Total financial liabilities - - - - 6,587,078 6,587,078
classification of financial assets and financial Liabilities contd.

13
Car
gill
s B
ank
Lim
ited
| I
nte
rim
Fin
anci
al S
tate
men
t 20
16
Bank Group
As at 30-Jun 31-Dec 30-Jun 31-Dec
-2016 -2015 -2016 -2015
Regulatory Capital Adequacy
Core Capital (Tier 1 Capital), Rs. ‘000 10,504,544 4,843,245 10,581,759 4,917,724
Total Capital Base, Rs. ‘000 9,644,516 4,076,156 10,083,609 4,408,466
Core Capital Adequacy Ratio, as % of Risk Weighted Assets 76.15% 47.62% 72.68% 43.36%
(Minimum requirement,5%)
Total Capital Adequacy Ratio, as % of Risk Weighted Assets 74.24% 45.32% 73.01% 43.72%
(Minimum requirement,10%)
Assets Quality (Quality of Loan Portfolio)
Gross non-Performing Advances Ratio,% 0.60% 1.31% 1.39% 2.40%
(net of interest in suspense)
Net non-Performing Advances Ratio,% 0.52% 1.19% 0.54% 1.28%
(net of interest in suspense and provision)
Profitability
Interest Margin,% 5.40% 3.22% 5.77% 3.83%
Return on Assets (before Tax),% (1.74%) (3.13%) (1.66%) (2.98%)
Return on Equity,% (4.57%) (5.01%) (4.47%) (6.67%)
Regulatory Liquidity
Statutory Liquid Assets, Rs. ‘000 5,018,369 3,426,372 5,106,988 3,539,051
Statutory Liquid Assets Ratio, %
(Minimum requirement,20%)
Domestic Banking Unit 53.39% 93.27% 51.10% 80.61%
Explanatory Notes1). These interim financial statements of the bank have been prepared based on the Sri Lanka Accounting Standards (SLFRS/LKAS).
There were no significant changes to the accounting policies and methods of computation since the last audited financial statements for the year 2015. Further, these interim financial statements have been prepared in compliance with the requirement of Sri Lanka Accounting Standard - LKAS 34 on ‘Interim Financial Reporting’. Previous year figures and phrases have been re-arranged wherever necessary to conform to the current presentation.
2). The total temporary differences arising from tax losses and tax credits amounted to Rs. 1,462 Mn. resulting in a deferred tax asset of Rs. 409 Mn. as at 30 June 2016. Based on the 5 years forecast prepared by the management and internal assessment carried out by the Board of directors, the recognition of deferred tax asset has been limited to Rs. 167 Mn. The unrecognized deferred tax asset as at 30 June 2016 was Rs 242 Mn.
3). All known expenses have been provided for in these Interim Financial Statements.
4). There were no pending litigation of a material nature against the bank.
5). During six months ended 30 June 2016, 400.14 Mn shares were allocated raising a capital of Rs. 5.8 Bn.
6). No circumstances have arisen since the reporting date which would require adjustment to or disclosure in the financial statements except for the following:
Repurchase agreement with Entrust Securities PLC (ES)
The Bank had entered into repo borrowing transactions with ES. The carrying value of borrowings amounted to Rs. 294.42 mn at 30 June 2016, and the market value of securities pledged to ES as collateral was Rs. 334.65 Mn at that date. ES failed to return the securities when the borrowings matured in 2016. These borrowings have been rolled forward at the request of National Savings Bank who have been appointed by CBSL to manage ES.
No provision has been made in the financial statements in respect of the potential exposure of Rs 40.23 Mn as at quarter-end, due to
insufficient clarity on the status of ES- specifically on CBSL actions to address issues with ES.
SeLected Performance IndIcatorS

14C
arg
ills
Ban
k Li
mit
ed |
In
teri
m F
inan
cial
Sta
tem
ent
2016
Bank Group
As at 30-Jun 31-Dec 30-Jun 31-Dec
- 2016 - 2015 - 2016 - 2015
Rs. ‘000 Rs. ‘000 Rs. ‘000 Rs. ‘000
1) Loans and receivables to other customers
Gross loans and receivables 10,212,326 7,238,202 10,961,626 8,211,851
(Less): Individual impairment 10,368 9,209 104,174 90,603
(Less): Collective impairment 39,021 22,618 45,433 36,336
Net loans and receivables 10,162,937 7,206,375 10,812,019 8,084,912
2) Loans and receivables to other customers - By product-
By product - Domestic Currency
Loans and advances
Overdrafts 2,595,917 1,989,501 2,578,932 1,862,917
Trade finance 1,290,185 1,375,161 1,290,185 1,375,161
Lease rentals receivable - - 314,316 320,841
Hire purchase - - 131,714 167,999
Staff Loans 82,401 30,415 82,401 30,415
Housing loans 208,090 117,570 208,090 117,570
Personal loans 920,073 509,530 920,073 509,530
Term loans 1,838,429 761,794 1,838,429 761,794
Agriculture loans 110,844 - 110,844
Vehicle loans 28,366 7,320 28,366 7,320
Money market loans 2,100,701 1,593,766 2,290,148 1,740,695
Bills receivable 4,317 3,766 81,422 72,953
Margin trading - - 104,745 194,141
Securities purchased under resale agreements 501,580 668,409 514,906 698,917
Others - - 195,632 170,628
Sub total 9,680,903 7,057,232 10,690,203 8,030,881
Others
Investments 260,000 - -
Sub total 260,000 - - -
Gross loans and receivables 9,940,903 7,057,232 10,690,203 8,030,881
By product - Foreign Currency
Trade finance 271,345 180,970 271,345 180,970
Money market loans 78 - 78 -
Sub total 271,423 180,970 271,423 180,970
Total Gross Loans & Advances 10,212,326 7,238,202 10,961,626 8,211,851
addItIonaL dIScLoSureS

15
Car
gill
s B
ank
Lim
ited
| I
nte
rim
Fin
anci
al S
tate
men
t 20
16
Bank Group
As at 30-Jun 31-Dec 30-Jun 31-Dec
- 2016 - 2015 - 2016 - 2015
Rs. ‘000 Rs. ‘000 Rs. ‘000 Rs. ‘000
3) Movement in individual and collective impairment during the period for loans and receivables
to other customers Movement in allowance for individual impairment
Opening balance 9,209 - 90,603 59,998
Charge/(Write back) to income statement 1,159 9,209 13,571 25,740
Net write-off (recoveries) during the period - - - 4,865
Closing balance 10,368 9,209 104,174 90,603
Movement in allowance for collective impairment
Opening balance 22,618 11,110 36,336 20,802
Charge/(Write back) to income statement 16,409 11,476 9,103 19,079
Exchange rate variance on foreign currency provisions (6) 32 (6) 32
Other movements - - - (3,577)
Closing balance 39,021 22,618 45,433 36,336
Total impairment 49,389 31,827 149,607 126,939
4) Due to other customers - By product By product - Domestic Currency
Current account deposits 603,271 319,009 603,271 319,009
Savings deposits 638,201 448,629 638,201 448,629
Time deposits 4,176,263 2,394,122 4,491,114 3,111,110
Certificate of deposits 605,199 380,108 605,199 380,108
Margin deposits 17,218 13,933 17,218 13,933
Sub total 6,040,152 3,555,801 6,355,003 4,272,789
By product - Foreign Currency
Current account deposits 23,389 5,488 23,389 5,488
Savings deposits 350,221 26,016 350,221 26,016
Time deposits 441,545 282,895 441,545 282,895
Sub total 815,155 314,399 815,155 314,399
Total deposits 6,855,307 3,870,200 7,170,158 4,587,188

16C
arg
ills
Ban
k Li
mit
ed |
In
teri
m F
inan
cial
Sta
tem
ent
2016 SharehoLderS’ InformatIon
Twenty three largest shareholders as at 30 June 2016
No. of shares %
1 Cargills (Ceylon) PLC 350,696,905 39.71
2 CT Holdings PLC 223,345,953 25.29
3 Monetary Board of Sri Lanka - On Behalf of EPF 44,000,000 4.98
4 Mulitex Investment Limited 30,800,000 3.49
5 MJF Foundation Investments (Pvt) Ltd 28,000,000 3.17
6 Asian Alliance Insurance PLC 26,600,000 3.01
7 MAS Capital (Private) Limited 22,000,000 2.49
8 Rosewood (Pvt) Ltd 16,000,000 1.81
9 Phoenix Ventures Limited 13,200,000 1.49
10 Aindri Holdings Pte Ltd 11,000,000 1.25
11 A I A Holdings Lanka (Pvt) Ltd 11,000,000 1.25
12 Softlogic Holdings PLC 10,000,000 1.13
13 Gardiya Lokuge Harris Premaratne 9,089,000 1.03
14 Merrill Joseph Fernando 7,800,000 0.88
15 Softlogic Finance PLC 7,400,000 0.84
16 GF Capital Global Limited 6,100,000 0.69
17 Periyasamipillai Barathakumar 4,400,000 0.50
18 Periyasamipillai Muruganandhan 4,400,000 0.50
19 Periyasamipillai Anandarajah 4,400,000 0.50
20 Periyasamipillai Devaraj 4,400,000 0.50
21 Periyasamipillai Barathamanickam 4,400,000 0.50
22 Rajah Mahinda Nanayakkara 4,400,000 0.50
23 Lalan Rubber Holdings (Pvt) Ltd 4,400,000 0.50
Sub total 847,831,858 96.00
Other Shareholders 35,311,000 4.00
Total 883,142,858 100.00
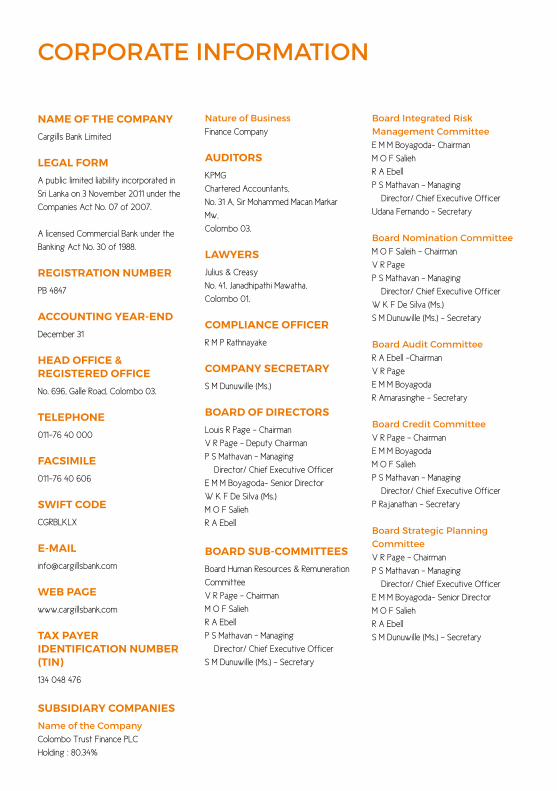
Name of the CompaNy
Cargills Bank Limited
LegaL form
A public limited liability incorporated in
Sri Lanka on 3 November 2011 under the
Companies Act No. 07 of 2007.
A licensed Commercial Bank under the
Banking Act No. 30 of 1988.
registratioN Number
PB 4847
aCCouNtiNg year-eNd
December 31
head offiCe & registered offiCe
No. 696, Galle Road, Colombo 03.
teLephoNe
011-76 40 000
faCsimiLe
011-76 40 606
sWift Code
CGRBLKLX
Web page
www.cargillsbank.com
tax payer ideNtifiCatioN Number (tiN)
134 048 476
subsidiary CompaNies
name of the companyColombo Trust Finance PLC
Holding : 80.34%
corPorate InformatIon
nature of businessFinance Company
auditors
KPMG
Chartered Accountants,
No. 31 A, Sir Mohammed Macan Markar
Mw,
Colombo 03.
LaWyers
Julius & Creasy
No. 41, Janadhipathi Mawatha,
Colombo 01.
CompLiaNCe offiCer
R M P Rathnayake
CompaNy seCretary
S M Dunuwille (Ms.)
board of direCtors
Louis R Page - Chairman
V R Page - Deputy Chairman
P S Mathavan - Managing
Director/ Chief Executive Officer
E M M Boyagoda- Senior Director
W K F De Silva (Ms.)
M O F Salieh
R A Ebell
board sub-Committees
Board Human Resources & Remuneration
Committee
V R Page - Chairman
M O F Salieh
R A Ebell
P S Mathavan - Managing
Director/ Chief Executive Officer
S M Dunuwille (Ms.) - Secretary
board Integrated risk management committeeE M M Boyagoda- Chairman
M O F Salieh
R A Ebell
P S Mathavan - Managing
Director/ Chief Executive Officer
Udana Fernando - Secretary
board nomination committeeM O F Saleih - Chairman
V R Page
P S Mathavan - Managing
Director/ Chief Executive Officer
W K F De Silva (Ms.)
S M Dunuwille (Ms.) - Secretary
board audit committeeR A Ebell -Chairman
V R Page
E M M Boyagoda
R Amarasinghe - Secretary
board credit committeeV R Page - Chairman
E M M Boyagoda
M O F Salieh
P S Mathavan - Managing
Director/ Chief Executive Officer
P Rajanathan - Secretary
board Strategic Planning committeeV R Page - Chairman
P S Mathavan - Managing
Director/ Chief Executive Officer
E M M Boyagoda- Senior Director
M O F Salieh
R A Ebell
S M Dunuwille (Ms.) - Secretary

Cargills Bank Limited
No. 696, Galle Road, Colombo 03.


