CARL Statistics | Statistiques de l’ABRC 2014-2015 Salaries | Salaires 2015-2016 Expenditures, Establishments and Collections Emerging Trends Use, Facilities and Services Dépenses, effectifs et collections Tendances nouvelles Utilisation, installations et services October 2016 | octobre 2016 Canadian Association of Research Libraries Association des bibliothèques de recherche du Canada 203-309 Cooper Ottawa, Ontario K2P 0G5 613.482-9344 [email protected]ISSN 1185 – 5851
Transcript
CARL Statistics | Statistiques de l’ABRC 2014-2015
Salaries | Salaires 2015-2016
Expenditures, Establishments and Collections
Emerging Trends
Use, Facilities and Services
Dépenses, effectifs et collections
Tendances nouvelles
Utilisation, installations et services
October 2016 | octobre 2016
Canadian Association of Research Libraries Association des bibliothèques de recherche du Canada 203-309 Cooper Ottawa, Ontario K2P 0G5 613.482-9344 [email protected]
Every effort has been made to ensure that the information in this publication is accurate. Nevertheless, limitations exist as regards the reported data. Definitions, collection and reporting methods may vary amongst institutions. Conclusions and comparisons should be made only in conjunction with other assessment methods and with due regard to different organizational structures, goals, priorities and practices.
Nous avons fait tous les efforts nécessaires pour assurer l’exactitude des renseignements dans ce document. Il existe toutefois des limites en ce qui concerne les données déclarées. Les définitions, ainsi que les méthodes de collecte et de déclaration peuvent varier selon les établissements. Pour tirer des conclusions et faire des comparaisons, il faut absolument aussi avoir recours à d’autres méthodes d’évaluation et tenir compte du fait qu’il y a des différences entre les structures, les buts, les priorités et les pratiques des établissements.
Change from previous years: All provincial, regional and national averages and ratios are now calculated by adding and dividing the values provided by each institution. In the past, these were calculated by averaging the averages or averaging calculated ratios. The same applies for calculating medians.
Changement par rapport aux années précédentes : Toutes moyennes et tous ratios provinciaux, régionaux et nationaux sont dorénavant calculés en additionnant puis en divisant les valeurs fournies par chaque établissement. Par le passé, celles-ci étaient calculées en faisant la moyenne des moyennes ou la moyenne des ratios calculés. Le même changement est en place pour calculer les médianes.
Original publication date | Date de publication originale
October 11, 2016 | 11 octobre 2016
This document is formatted for double-sided printing.
Ce document est formaté pour une impression recto verso.
Table of Contents | Table des matières
SECTION A Expenditures, Establishment and Collections Dépenses, effectifs et
Table I – Local Characteristics ............................................................................................................................................ 3 Tableau I – Caractéristiques locales
Table II – Library materials expenditures ($)............................................................................................................... 4 Tableau II – Dépenses, documents de la bibliothèque ($)
Table III – Salaries and Wages expenditures ($) ......................................................................................................... 5 Tableau III – Dépenses, masse salariale ($)
Table IV – Other expenses ($) ........................................................................................................................................... 6 Tableau IV – Dépenses, autres ($)
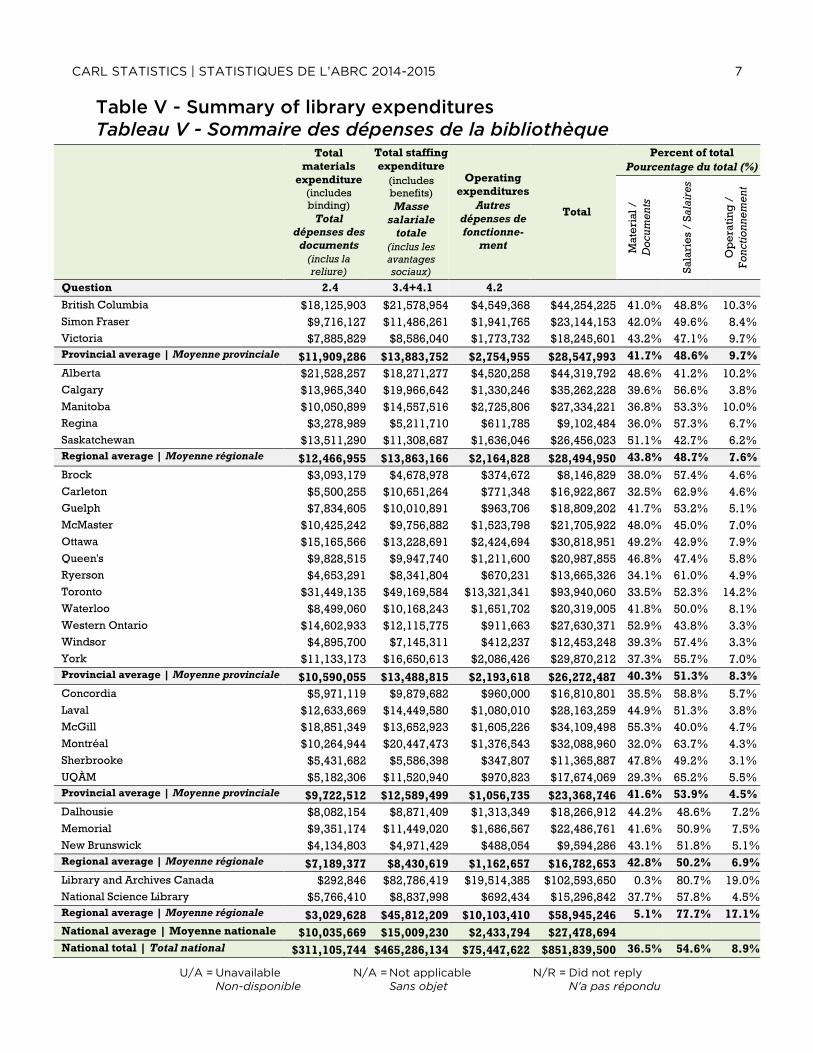
Table V - Summary of library expenditures .................................................................................................................. 7 Tableau V - Sommaire des dépenses de la bibliothèque
Table VI - Summary of library personnel (FTE) ..........................................................................................................8 Tableau VI – Sommaire du personnel de la bibliothèque (ETP)
Table VII – Enrolment (FTE) ............................................................................................................................................... 9 Tableau VII – Inscriptions (ETP)
Table VIII – Graphic summary & Trends........................................................................................................................ 10 Tableau VIII – Résumé graphique & tendances
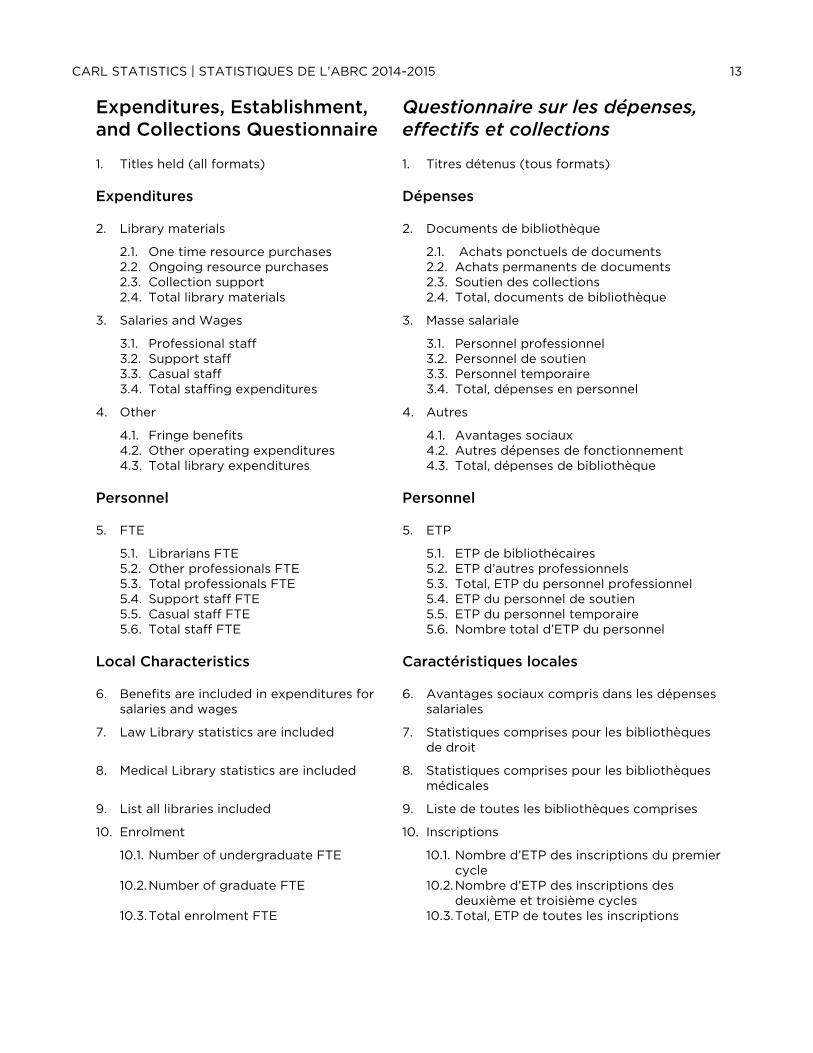
Expenditures, Establishment, and Collections Questionnaire ............................................................................. 13 Questionnaire sur les dépenses, effectifs et collections
Endnotes to Expenditures, Establishment and Collection Size Questionnaire ............................................ 14 Notes finales du questionnaire sur les dépenses, établissements, et collections
SECTION B Emerging Trends Tendances nouvelles 2014-2015 .............................................. 17
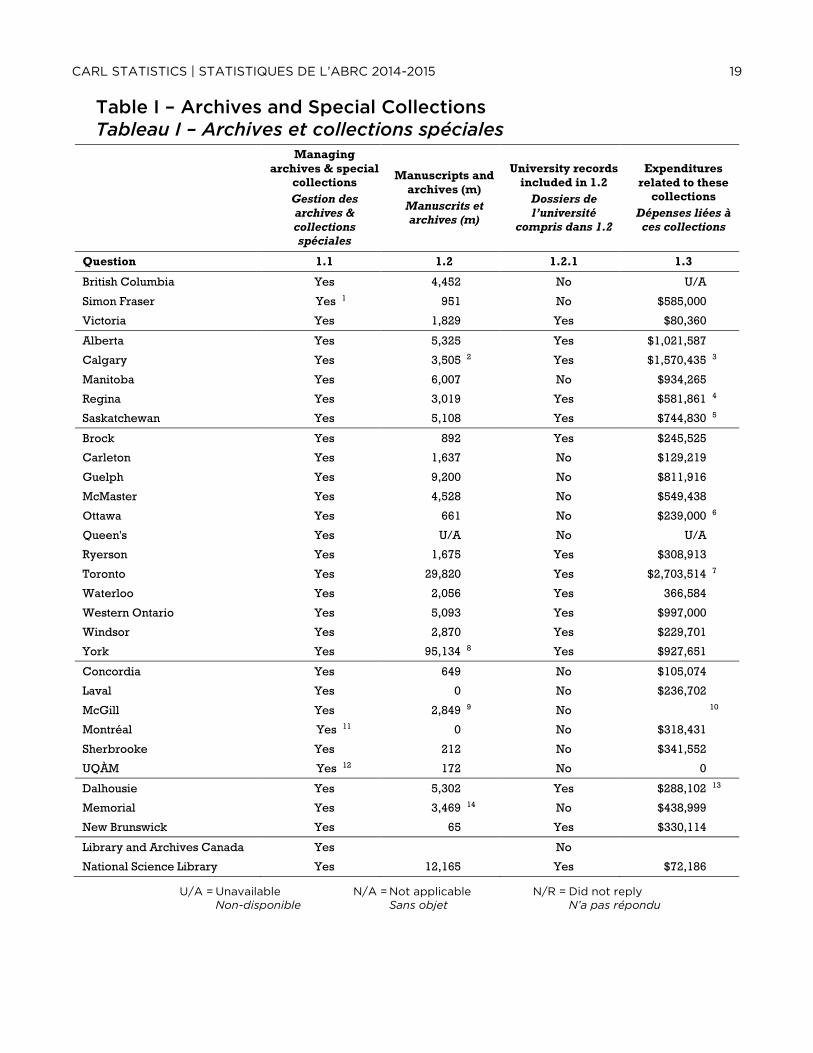
Table I – Archives and Special Collections .................................................................................................................. 19 Tableau I – Archives et collections spéciales
Table II – Digital Collections .............................................................................................................................................. 20 Tableau II – Collections numériques
Table III - E-publishing .......................................................................................................................................................... 21 Tableau III – Édition électronique
Emerging Trends Questionnaire ..................................................................................................................................... 22 Questionnaire sur les tendances nouvelles
Endnotes to Emerging Trends questionnaire ........................................................................................................... 23 Notes finales du questionnaire sur les tendances nouvelles
SECTION C Use, Facilities and Services Utilisation, installations et services 2014-2015 25
Table I – Electronic resources & Collection use ........................................................................................................ 27 Tableau I – Ressources électroniques & Utilisation des collections
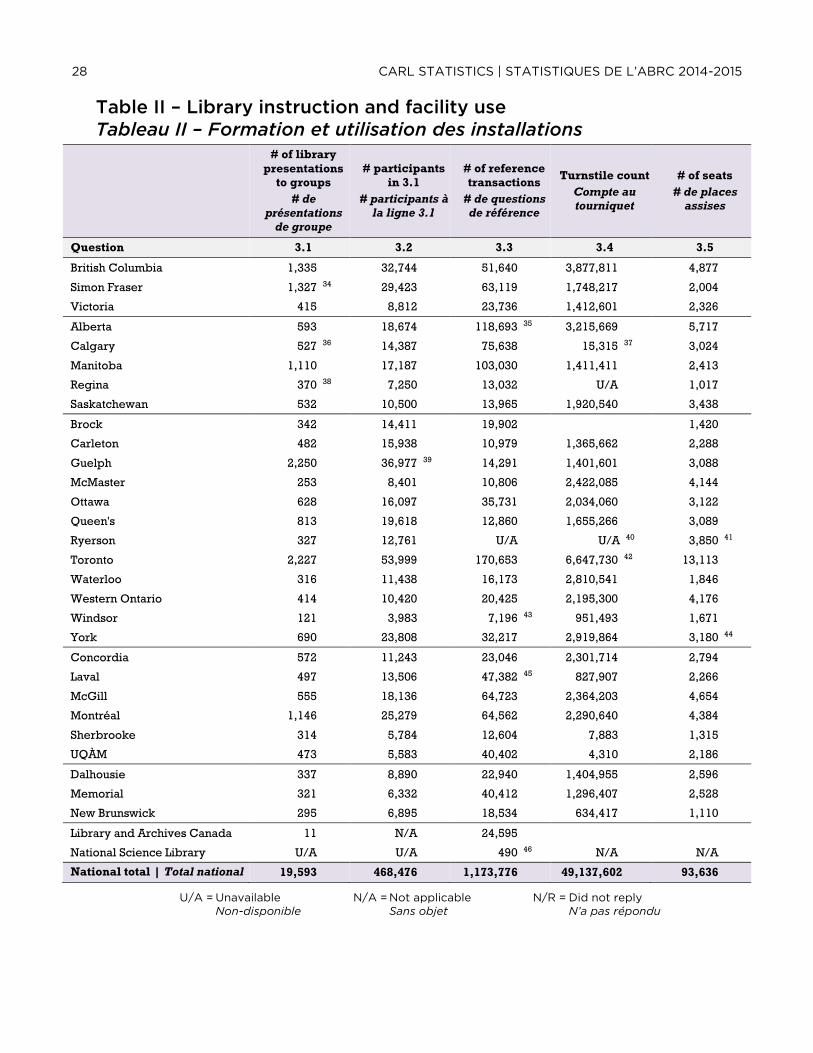
Table II – Library instruction and facility use ............................................................................................................. 28 Tableau II – Formation et utilisation des installations
Table III – Document delivery traffic ............................................................................................................................. 29 Tableau III – Traffic de livraison de documents
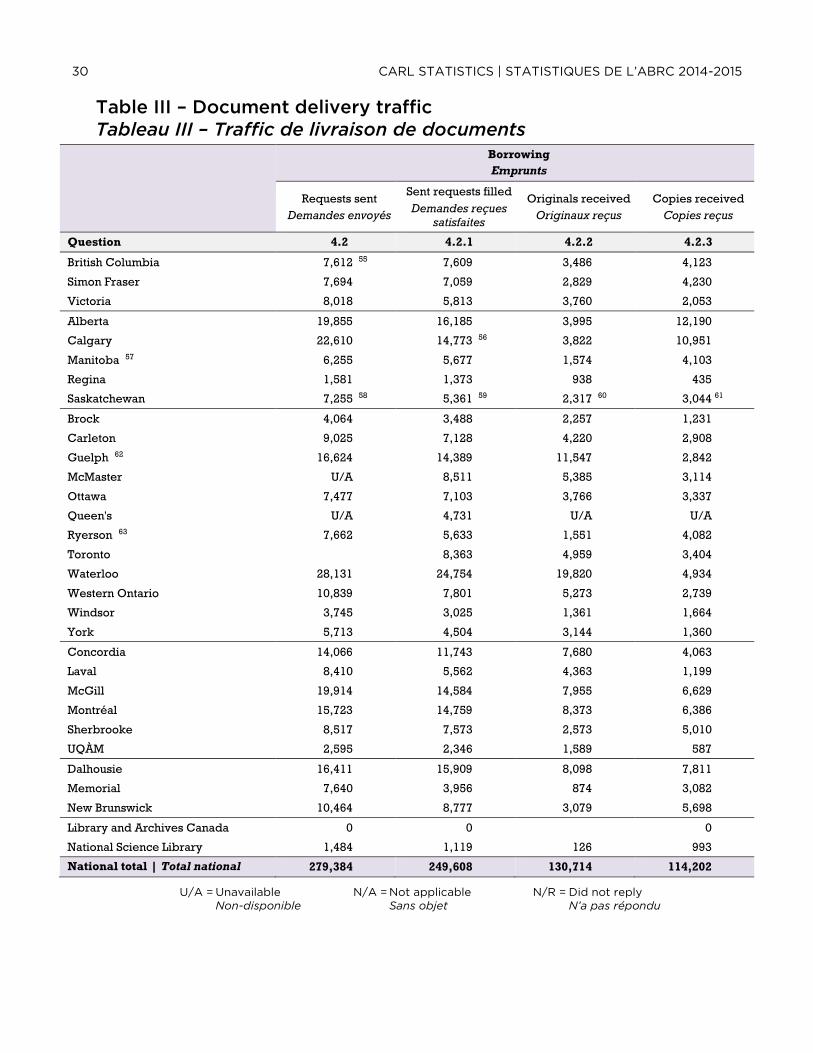
Table III – Document delivery traffic ............................................................................................................................. 30 Tableau III – Traffic de livraison de documents
Use, Facilities and Services Questionnaire .................................................................................................................. 31 Questionnaire sur l'utilisation, installations et services
Endnotes to Use, Facilities and Services Questionnaire ....................................................................................... 32 Notes finales du questionnaire sur l'utilisation, installations et services
SECTION D Salaries Salaires 2015-2016 ........................................................................................ 36
Table I - Salary data for all professionals 2015-2016 .............................................................................................. 37 Tableau I – Données salariales pour tous les professionnels, 2015-2016
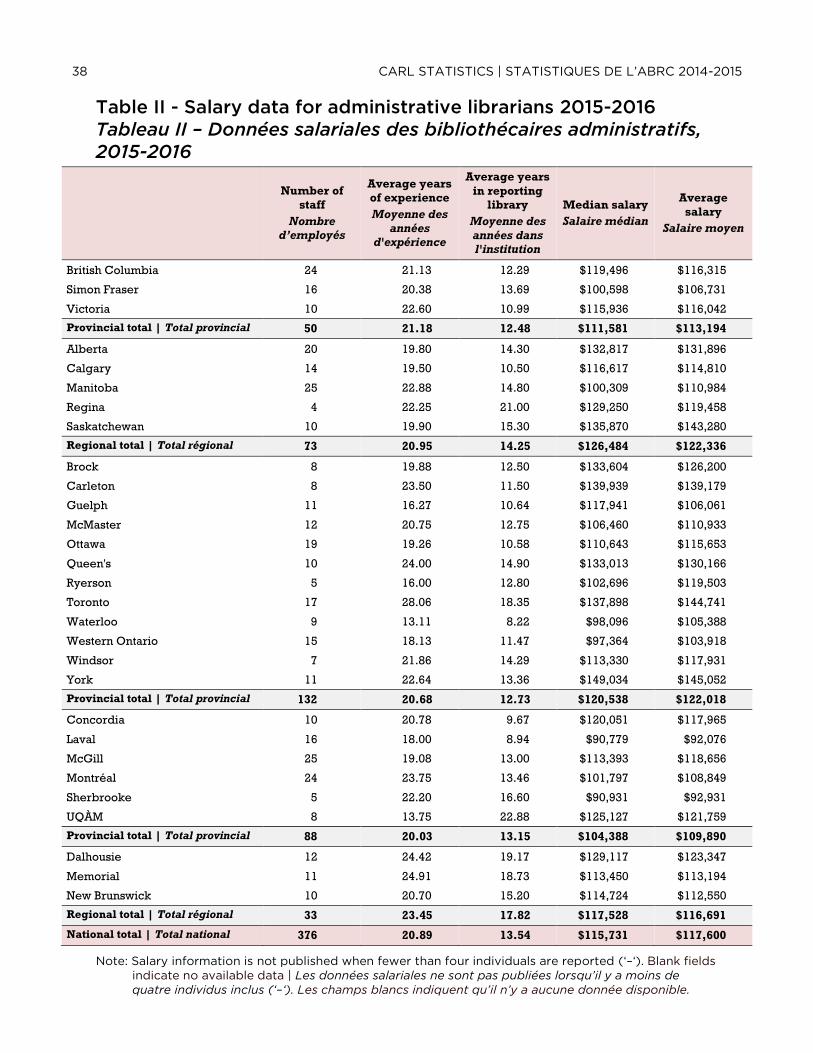
Table II - Salary data for administrative librarians 2015-2016 ............................................................................ 38 Tableau II – Données salariales des bibliothécaires administratifs, 2015-2016
Table III - Salary data for non-administrative librarians 2015-2016 ................................................................. 39 Tableau III – Données salariales des bibliothécaires non administratives, 2015-2016
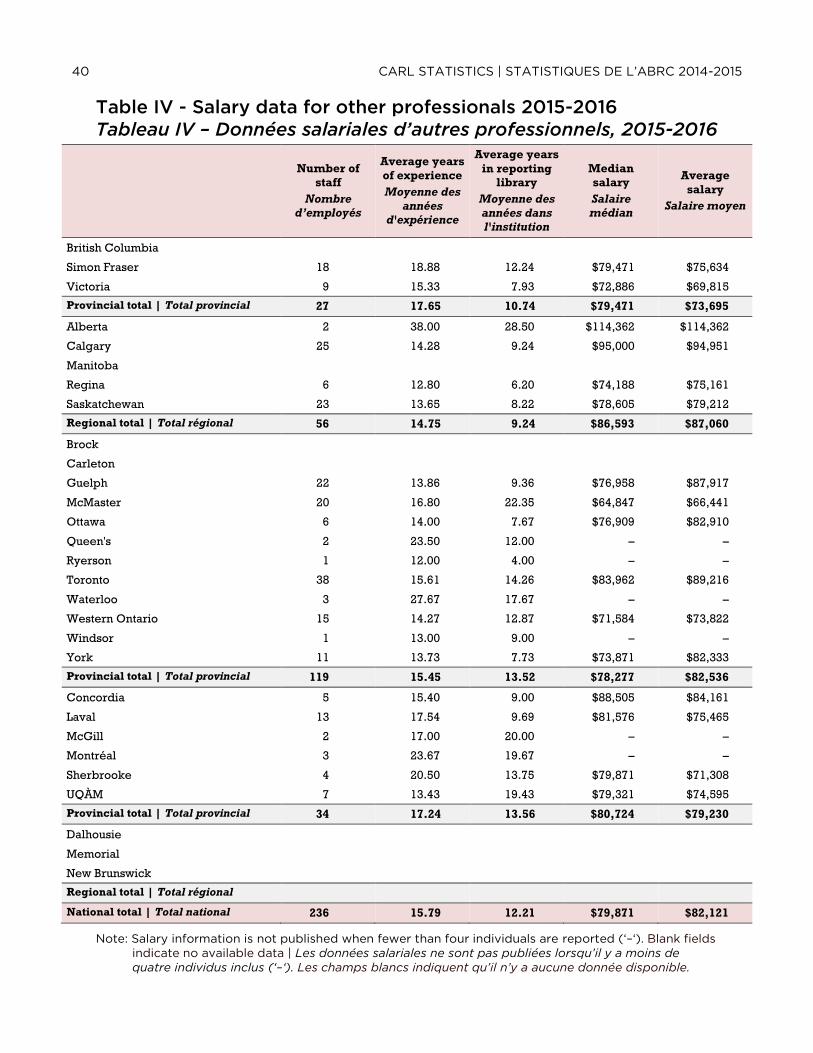
Table IV - Salary data for other professionals 2015-2016 ................................................................................... 40 Tableau IV – Données salariales d’autres professionnels, 2015-2016
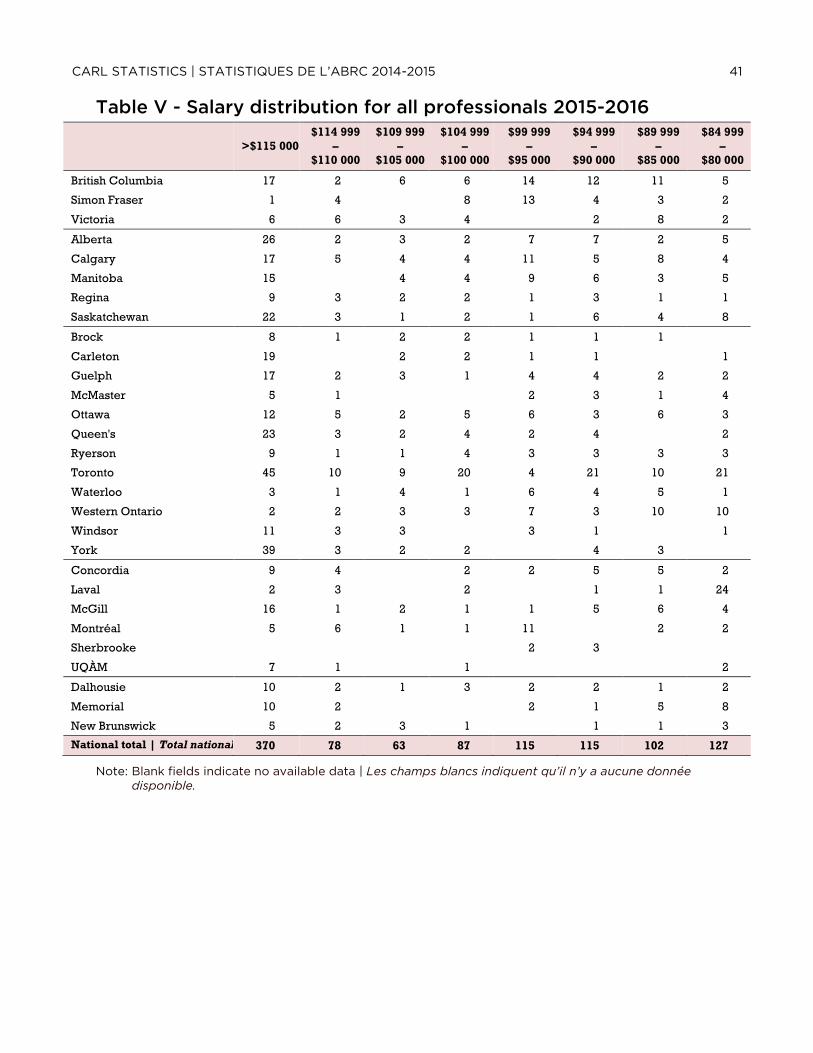
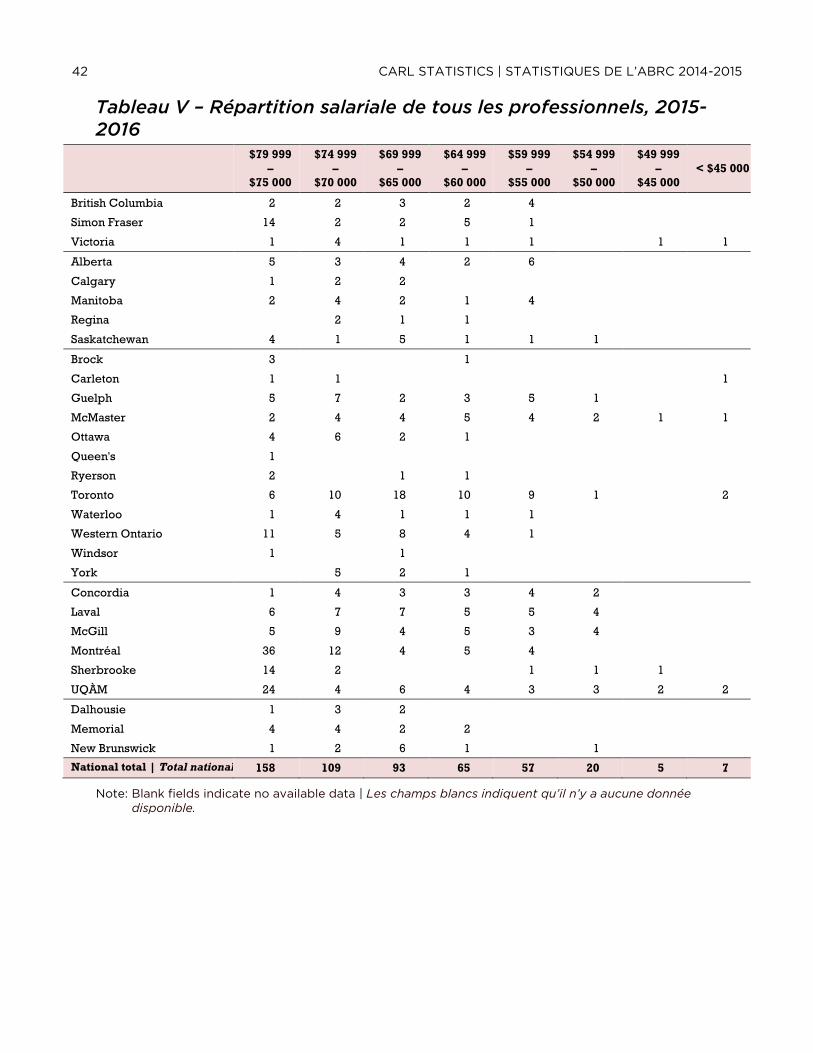
Table V - Salary distribution for all professionals 2015-2016............................................................................... 41 Tableau V – Répartition salariale de tous les professionnels, 2015-2016
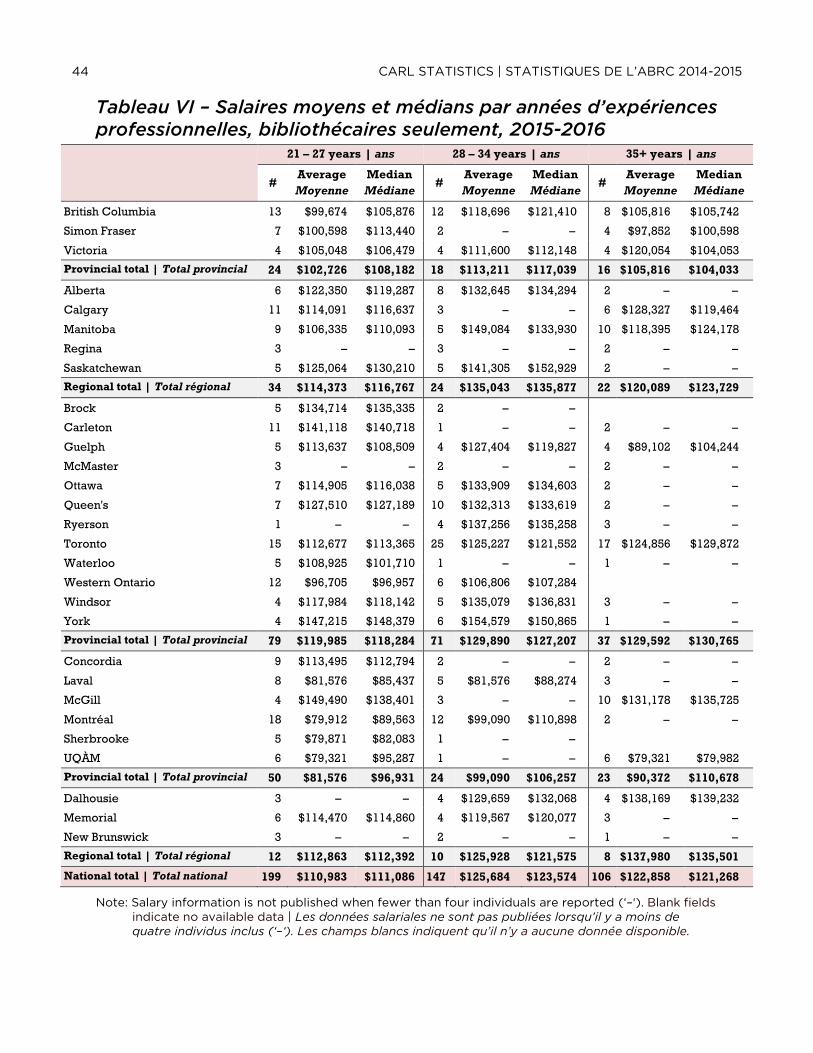
Table VI - Average and median salary per year of professional experience, Librarian positions only
2015-2016 .................................................................................................................................................................................. 43 Tableau VI – Salaires moyens et médians par années d’expériences professionnelles, bibliothécaires
seulement, 2015-2016
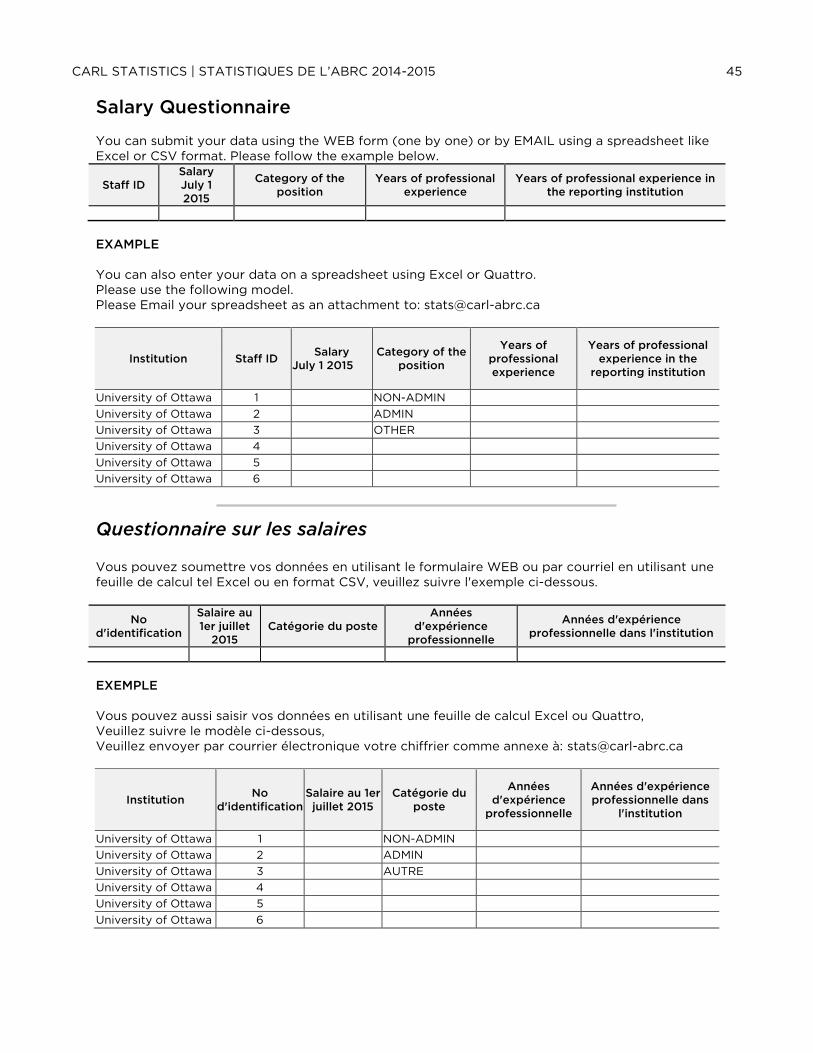
Salary Questionnaire ............................................................................................................................................................ 45 Questionnaire sur les salaires
Endnotes to Salaries Questionnaire .............................................................................................................................. 46 Notes finales du questionnaire sur les salaires
SECTION E Ratios Ratios 2014-2015 .............................................................................................. 47
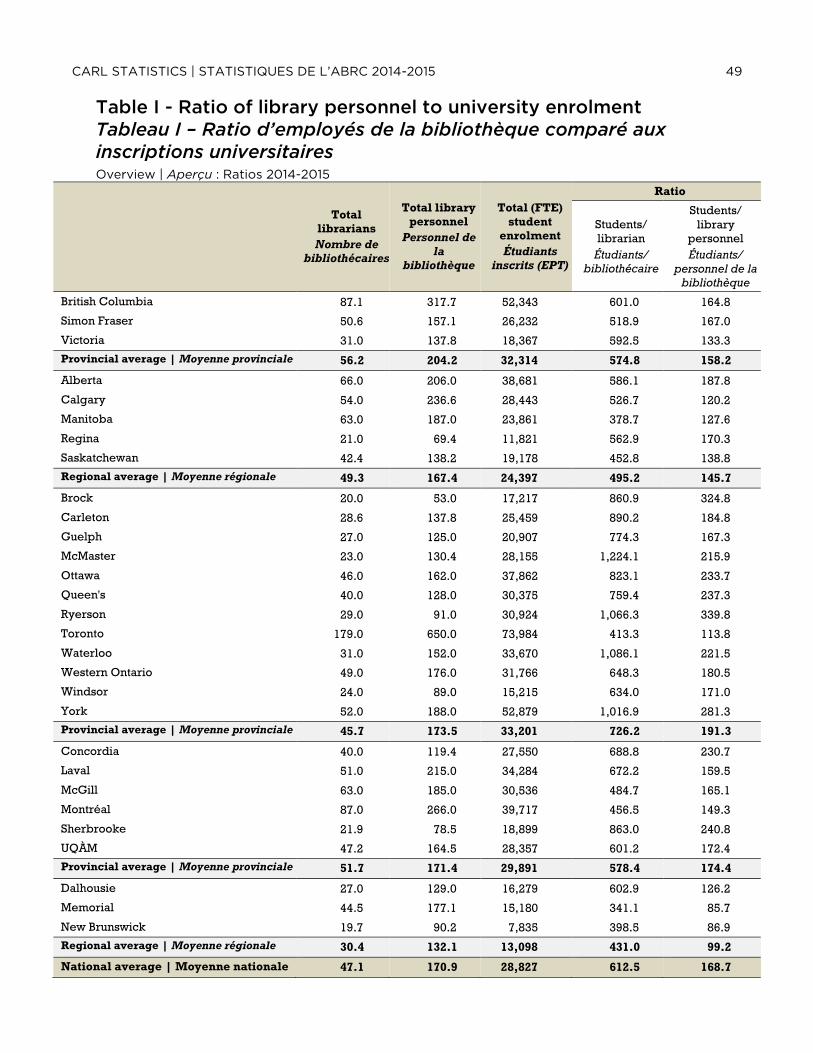
Table I - Ratio of library personnel to university enrolment ............................................................................... 49 Tableau I – Ratio d’employés de la bibliothèque comparé aux inscriptions universitaires
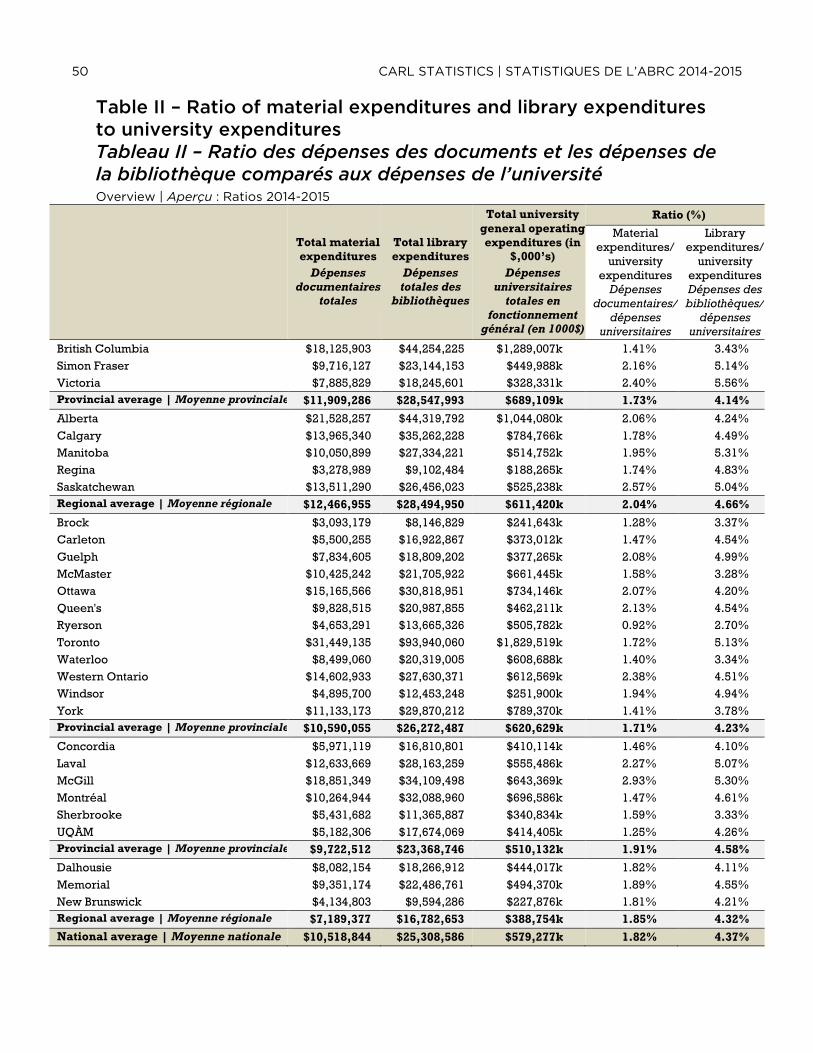
Table II – Ratio of material expenditures and library expenditures to university expenditures ......... 50 Tableau II – Ratio des dépenses des documents et les dépenses de la bibliothèque comparés aux
dépenses de l’université
Table III - Ratio of material expenditures and library holdings to university enrolment ......................... 51 Tableau III – Ratio des dépenses sur les documents et les ressources documentaires comparés aux
inscriptions universitaires
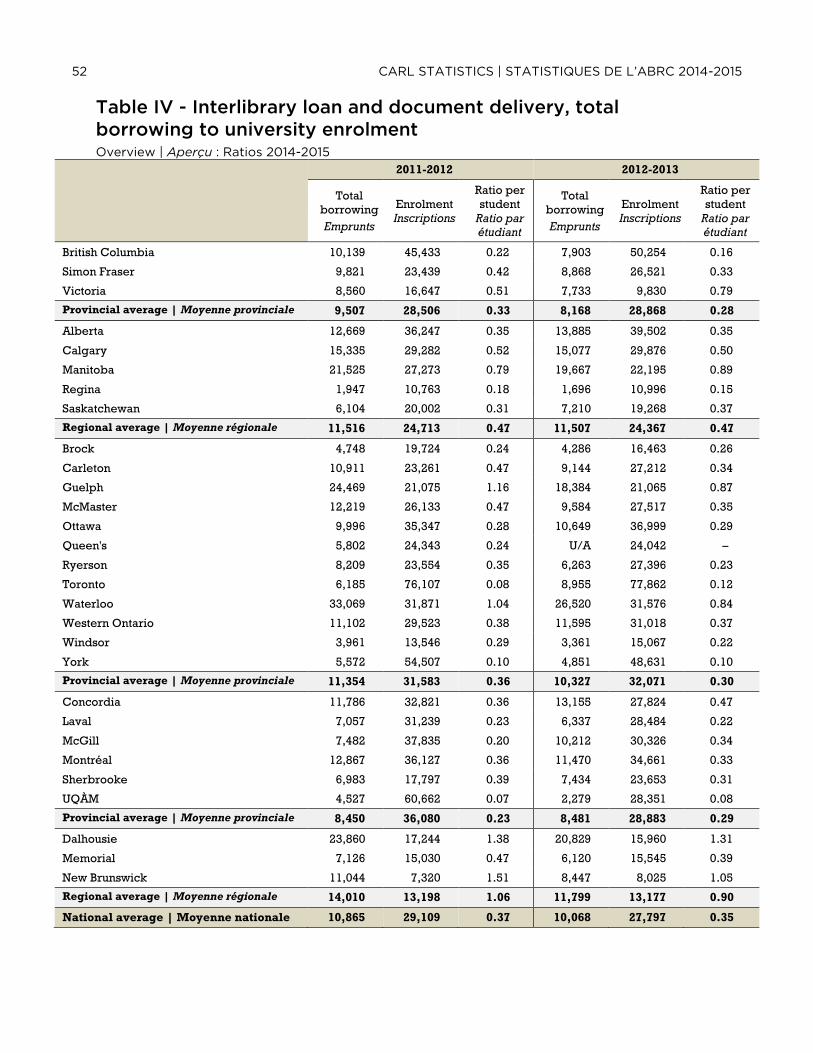
Table IV - Interlibrary loan and document delivery, total borrowing to university enrolment ............ 52 Tableau IV – Prêts entre bibliothèques et livraison des documents, total des emprunts comparés
aux inscriptions universitaires
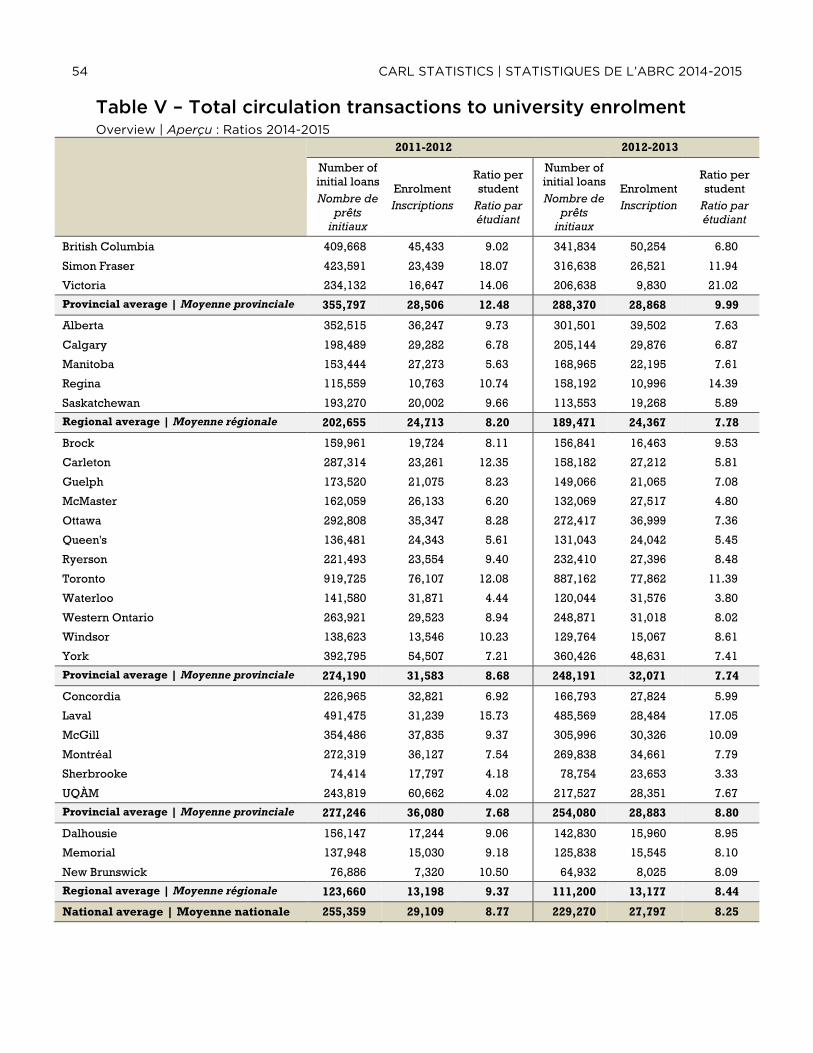
Table V – Total circulation transactions to university enrolment ..................................................................... 54 Tableau V – Total des prêts comparés aux inscriptions universitaires
Table VI – Total informational transactions to university enrolment .............................................................. 56 Tableau VI – Transactions de référence comparées aux inscriptions universitaires
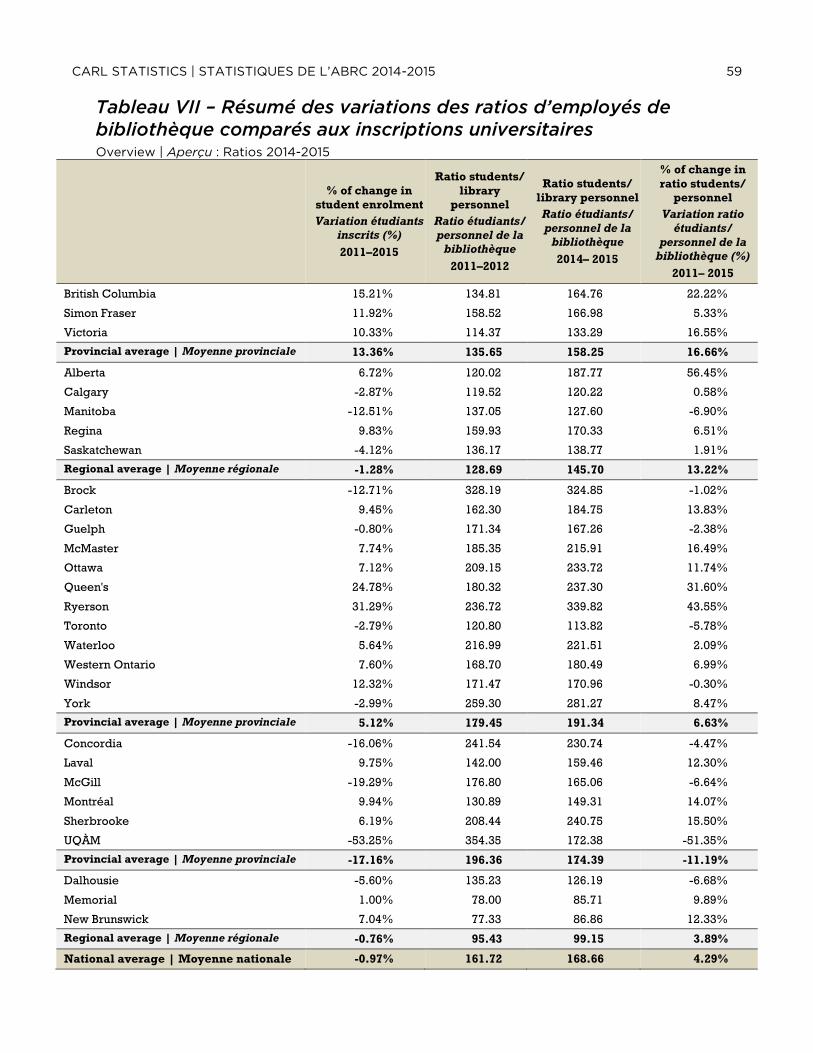
Table VII - Summary of changes in ratio of library personnel to university enrolment .......................... 57 Tableau VII – Résumé des variations des ratios d’employés de bibliothèque comparés aux
inscriptions universitaires
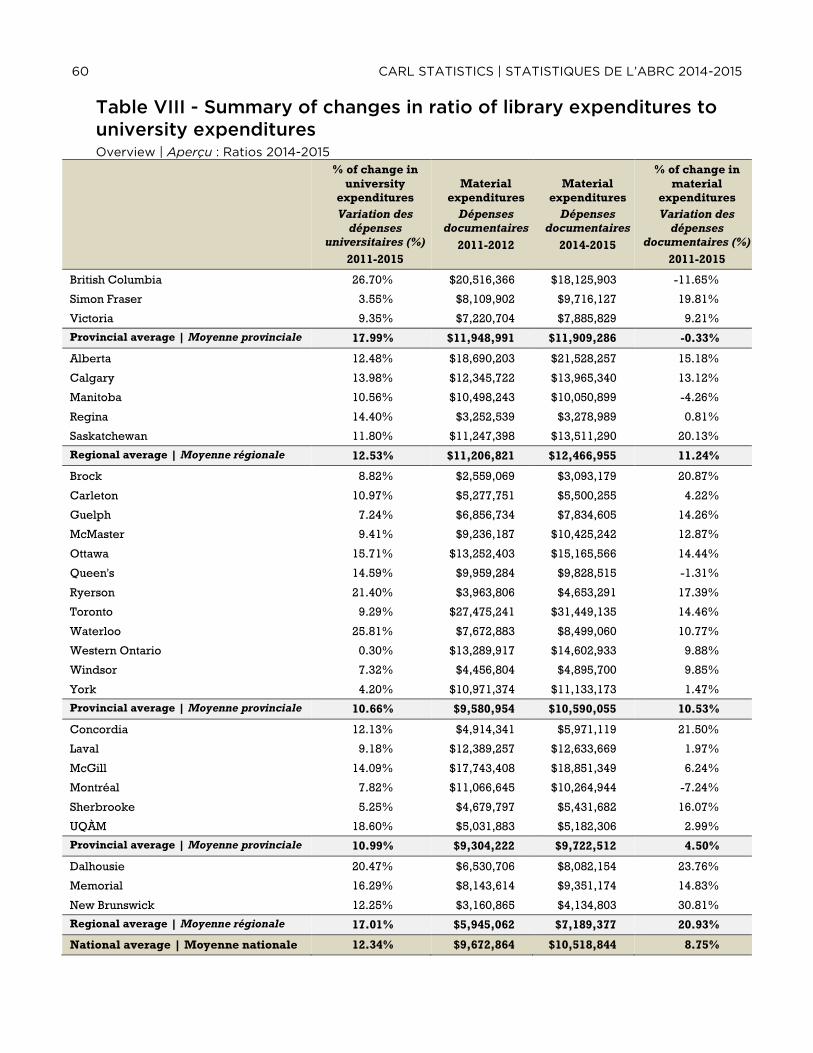
Table VIII - Summary of changes in ratio of library expenditures to university expenditures ........... 60 Tableau VIII – Résumé des variations des ratios de dépenses des bibliothèques comparés aux
dépenses universitaires
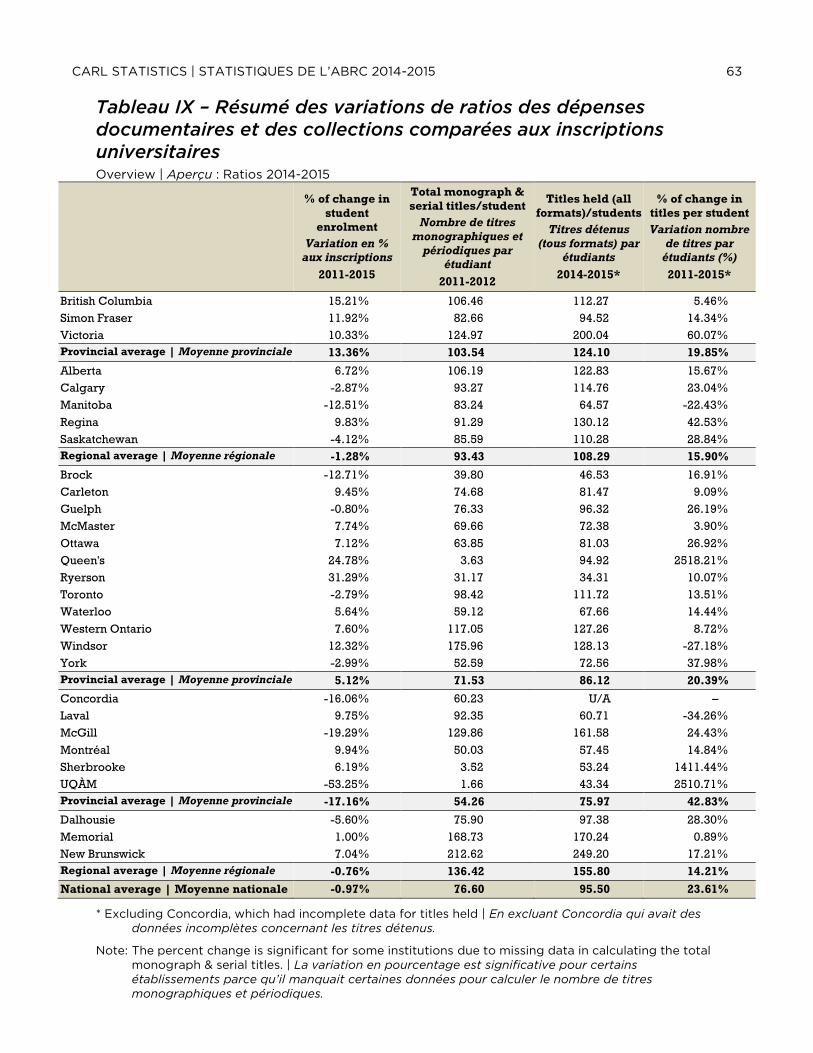
Table IX - Summary of changes in ratio of material expenditures and library holdings to university
enrolment .................................................................................................................................................................................. 62 Tableau IX – Résumé des variations de ratios des dépenses documentaires et des collections
comparées aux inscriptions universitaires
Endnotes to Ratios ............................................................................................................................................................... 63 Notes finales des ratios
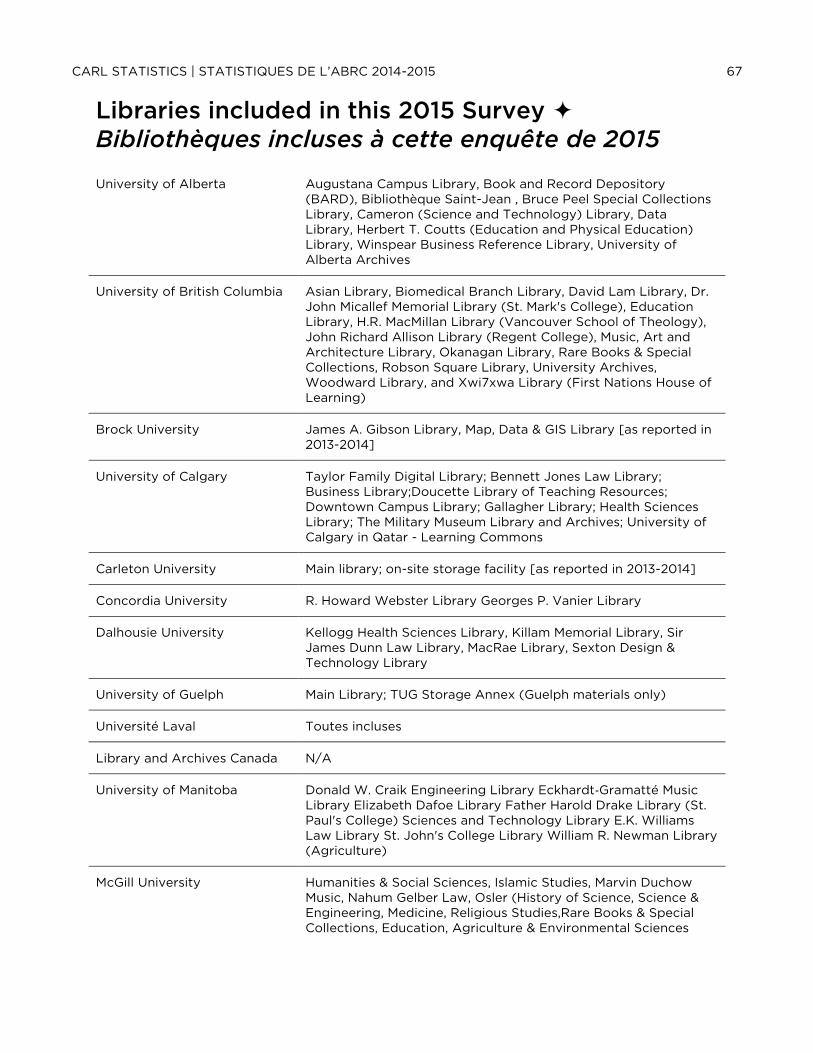
Libraries included in this 2015 Survey Bibliothèques incluses à cette enquête de 2015 ..... 67
CARL STATISTICS | STATISTIQUES DE L’ABRC 2014-2015 1
SECTION A
Expenditures, Establishment and Collections
Dépenses, effectifs et collections
2014-2015
CARL STATISTICS | STATISTIQUES DE L’ABRC 2014-2015 3
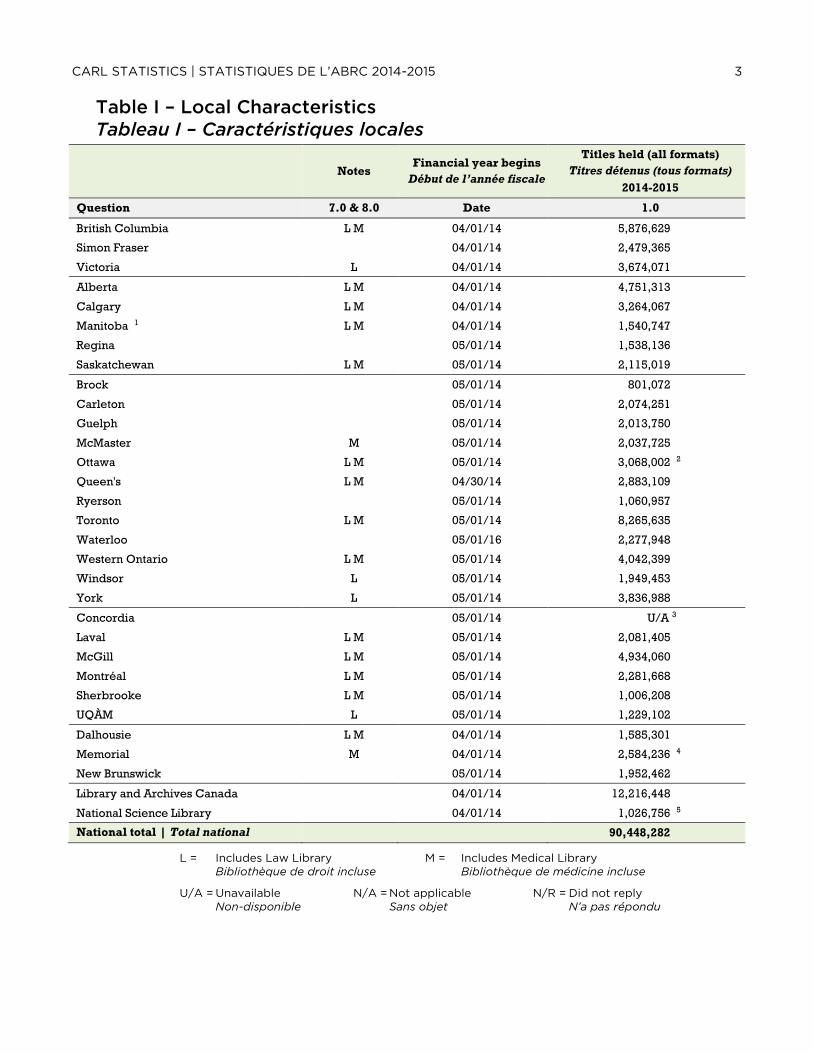
Table I – Local Characteristics Tableau I – Caractéristiques locales
Notes Financial year begins
Début de l’année fiscale
Titles held (all formats)
Titres détenus (tous formats)
2014-2015
Question 7.0 & 8.0 Date 1.0
British Columbia L M 04/01/14 5,876,629
Simon Fraser 04/01/14 2,479,365
Victoria L 04/01/14 3,674,071
Alberta L M 04/01/14 4,751,313
Calgary L M 04/01/14 3,264,067
Manitoba 1 L M 04/01/14 1,540,747
Regina 05/01/14 1,538,136
Saskatchewan L M 05/01/14 2,115,019
Brock 05/01/14 801,072
Carleton 05/01/14 2,074,251
Guelph 05/01/14 2,013,750
McMaster M 05/01/14 2,037,725
Ottawa L M 05/01/14 3,068,002 2
Queen's L M 04/30/14 2,883,109
Ryerson 05/01/14 1,060,957
Toronto L M 05/01/14 8,265,635
Waterloo 05/01/16 2,277,948
Western Ontario L M 05/01/14 4,042,399
Windsor L 05/01/14 1,949,453
York L 05/01/14 3,836,988
Concordia 05/01/14 U/A 3
Laval L M 05/01/14 2,081,405
McGill L M 05/01/14 4,934,060
Montréal L M 05/01/14 2,281,668
Sherbrooke L M 05/01/14 1,006,208
UQÀM L 05/01/14 1,229,102
Dalhousie L M 04/01/14 1,585,301
Memorial M 04/01/14 2,584,236 4
New Brunswick 05/01/14 1,952,462
Library and Archives Canada 04/01/14 12,216,448
National Science Library 04/01/14 1,026,756 5
National total | Total national 90,448,282
L = Includes Law Library M = Includes Medical Library Bibliothèque de droit incluse Bibliothèque de médicine incluse
U/A = Unavailable N/A = Not applicable N/R = Did not reply Non-disponible Sans objet N’a pas répondu
4 CARL STATISTICS | STATISTIQUES DE L’ABRC 2014-2015
Table II – Library materials expenditures ($) Tableau II – Dépenses, documents de la bibliothèque ($)
One time resource
purchases
Achats ponctuels
de documents
Ongoing resource
purchases
Achats permanents
de documents
Collection support
Soutien des
collections
Total library
materials
Total, documents
de bibliothèques
Question 2.1 2.2 2.3 2.4
British Columbia $4,161,339 $13,773,210 $191,354 $18,125,903
Simon Fraser $2,362,933 $7,086,242 $266,952 6 $9,716,127 7
Victoria $1,470,764 $5,412,851 $1,002,214 $7,885,829
Alberta $4,272,167 $15,758,089 $1,498,001 $21,528,257
National average | Moyenne nationale 46.7 31.2 76.9 98.4 19.0 193.7
National total | Total national 1,448.0 934.8 2,382.7 3,051.1 571.1 6,004.7
U/A = Unavailable N/A = Not applicable N/R = Did not reply Non-disponible Sans objet N’a pas répondu
CARL STATISTICS | STATISTIQUES DE L’ABRC 2014-2015 9
Table VII – Enrolment (FTE) Tableau VII – Inscriptions (ETP)
Full time Undergraduates
Premier cycle, temps-plein
Full Time Graduates
Cycle supérieur, temps-
plein
Total enrolment
Total d’inscriptions
Question 10.1 10.2 10.3
British Columbia 43,645 8,698 52,343
Simon Fraser 22,875 3,357 26,232
Victoria 15,381 2,986 18,367
Alberta 31,109 7,572 38,681
Calgary 22,968 5,475 28,443
Manitoba 20,819 3,042 23,861
Regina 47 10,705 1,116 11,821
Saskatchewan 15,889 48 3,289 49 19,178
Brock 15,835 1,382 17,217
Carleton 22,157 3,302 25,459
Guelph 18,756 2,151 20,907
McMaster 24,388 3,767 28,155
Ottawa 32,109 5,753 37,862
Queen's 25,997 4,378 30,375
Ryerson 28,963 1,961 30,924
Toronto 50 58,557 15,427 73,984
Waterloo 29,623 4,047 33,670
Western Ontario 25,504 6,262 31,766
Windsor 12,752 2,463 15,215
York 46,950 5,929 52,879
Concordia 24,063 3,487 27,550
Laval 26,576 7,708 34,284
McGill 23,602 6,934 30,536
Montréal 30,946 8,771 39,717
Sherbrooke 13,084 5,815 18,899
UQÀM 24,258 4,099 28,357
Dalhousie 12,953 3,325 16,279
Memorial 12,587 2,593 15,180
New Brunswick 6,404 1,431 7,835
Library and Archives Canada N/A N/A NA
National Science Library N/A N/A N/A
National total | Total national 699,455 136,520 835,976
U/A = Unavailable N/A = Not applicable N/R = Did not reply Non-disponible Sans objet N’a pas répondu
10 CARL STATISTICS | STATISTIQUES DE L’ABRC 2014-2015
Table VIII – Graphic summary & Trends Tableau VIII – Résumé graphique & tendances (a) Total Expenditures in CARL Libraries | Dépenses totales des bibliothèques de l’ABRC
Total materials expenditure (includes binding)
Total des dépenses en documents (incluant la reliure) $311,105,744 (36%)
Total staffing expenditure (includes benefits)
Masse salariale totale (incluant les avantages sociaux) $465,286,134 (55%)
Total other operating expenditure
Total des autres dépenses de fonctionnement $75,447,622 (9%)
Total expenditures
Total des dépenses $851,839,500
(Source: Table V | Tableau V) (b) Staffing in CARL Libraries (FTE) | Personnel des bibliothèques de l’ABRC (ETP)
Librarians
Bibliothécaires 1,448.0 (24%)
Other professionals
Autres professionnels 934.8 (16%)
Total professionals Total des professionnels
2,382.7
Support staff
Personnel de soutien 3,051.1 (51%)
Casual staff
Personnel temporaire 571.1 (9%)
Total staff (FTE) Total du personnel (ETP)
6,004.7
(Source: Table VI | Tableau VI)
36%
55%
9% Total materials expenditure (includes binding)Total des dépenses en documents (incluant la reliure)
Total staffing expenditure (includes benefits)Masse salariale totale (incluant les avantages sociaux)
Total other operating expenditureTotal des autres dépenses de fonctionnement
24%
16% 51%
9%
LibrariansBibliothécaires
Other professionalsAutres professionnels
Support staffPersonnel de soutien
Casual staffPersonnel temporaire
CARL STATISTICS | STATISTIQUES DE L’ABRC 2014-2015 11
(c) Proportion of total professionals amongst staff in CARL libraries | Proportion de professionnels parmi le personnel total des bibliothèques de l’ABRC
(Source: Table VI | Tableau VI)
(d) Proportion of librarians amongst professional staff in CARL libraries | Proportion de
bibliothécaires parmi le personnel professionnel des bibliothèques de l’ABRC
(Source: Table VI | Tableau VI)
40%
51%
9%
Total professionalsTotal des professionnels
Support staffPersonnel de soutien
Casual staffPersonnel temporaire
61%
39%
LibrariansBibliothécaires
Other professionalsAutres professionnels
12 CARL STATISTICS | STATISTIQUES DE L’ABRC 2014-2015
(e) Selected yearly staffing trends in CARL librairies | Sélection de tendances annuelles du personnel des bibliothèques de l’ABRC
Figure 1 : CARL 8-year Selected Staffing Trends (%)
Sélection de tendances du personnel de L’ABRC sur 8 ans (%)
(f) Enrolment trends in CARL librairies (FTE) | Tendances des inscriptions dans les bibliothèques
de l’ABRC (ETP) Figure 2 : CARL 7-year Total Enrolment Trends (FTE) (n=26-29)
Tendances des inscriptions totales de L’ABRC sur 7 ans (ETP) (n=26-29)
Graduate enrolment (FTE, linear trendline)Inscriptions du premier cycle (ETP, ligne de tendance linéaire)
Undergraduate enrolment (FTE, linear trendline)Inscriptions au cycle supérieur (ETP, ligne de tendance linéaire)
CARL STATISTICS | STATISTIQUES DE L’ABRC 2014-2015 13
Expenditures, Establishment, and Collections Questionnaire
Questionnaire sur les dépenses, effectifs et collections
1. Titles held (all formats) 1. Titres détenus (tous formats)
Expenditures Dépenses
2. Library materials 2. Documents de bibliothèque
2.1. One time resource purchases 2.1. Achats ponctuels de documents 2.2. Ongoing resource purchases 2.2. Achats permanents de documents 2.3. Collection support 2.3. Soutien des collections 2.4. Total library materials 2.4. Total, documents de bibliothèque
3. Salaries and Wages 3. Masse salariale
3.1. Professional staff 3.1. Personnel professionnel 3.2. Support staff 3.2. Personnel de soutien 3.3. Casual staff 3.3. Personnel temporaire 3.4. Total staffing expenditures 3.4. Total, dépenses en personnel
4. Other 4. Autres
4.1. Fringe benefits 4.1. Avantages sociaux 4.2. Other operating expenditures 4.2. Autres dépenses de fonctionnement 4.3. Total library expenditures 4.3. Total, dépenses de bibliothèque
Personnel Personnel
5. FTE 5. ETP
5.1. Librarians FTE 5.1. ETP de bibliothécaires 5.2. Other professionals FTE 5.2. ETP d’autres professionnels 5.3. Total professionals FTE 5.3. Total, ETP du personnel professionnel 5.4. Support staff FTE 5.4. ETP du personnel de soutien 5.5. Casual staff FTE 5.5. ETP du personnel temporaire 5.6. Total staff FTE 5.6. Nombre total d’ETP du personnel
Local Characteristics Caractéristiques locales
6. Benefits are included in expenditures for salaries and wages
6. Avantages sociaux compris dans les dépenses salariales
7. Law Library statistics are included 7. Statistiques comprises pour les bibliothèques de droit
8. Medical Library statistics are included 8. Statistiques comprises pour les bibliothèques médicales
9. List all libraries included 9. Liste de toutes les bibliothèques comprises
10. Enrolment 10. Inscriptions
10.1. Number of undergraduate FTE 10.1. Nombre d’ETP des inscriptions du premier cycle
10.2. Number of graduate FTE 10.2. Nombre d’ETP des inscriptions des deuxième et troisième cycles
10.3. Total enrolment FTE 10.3. Total, ETP de toutes les inscriptions
14 CARL STATISTICS | STATISTIQUES DE L’ABRC 2014-2015
Endnotes to Expenditures, Establishment and Collection Size Questionnaire Notes finales du questionnaire sur les dépenses, établissements, et collections 1 Collection figure changes are the result of a combination of a weak Canadian Dollar and more accurate reporting methods from our new systems. 2 Increase is due in part to the change in ARL's definition and in part to a change in our method of count. 3 A reliable figure is not available at the moment due to the change in definitions and data collection process. 4 Includes OPAC, Digital Archive Initiative, Research Repository, QEII Archives, Founder's Archives. 5 Includes item and checkin records. 6 Collection Support: ILL, binding, OA fund, Scholarly digitization fund. 7 Total Library Materials: increase due to one-time money received for e-resources, digitization and support for USD Exchange. 8 The expenditure for Collection Support includes document delivery, binding, software, metadata, shelf-ready processing, open access publishing, memberships, evaluations, digitization, charges, shipping; increase in collection support in 2014-2015 is the result of paying for software support every other year (last payment was in 2012-2013) and from the significant increases in payments for the publication of articles in Open Access publications. 9 Does not include FNUniv. 10 Does not include FNUniv. 11 Subject funds expenditures decreased mainly to offset the overspending on serials. 12 This year much of the budget's increase went towards ongoing purchases accounting for about $1M in growth and was overspent by about $300k. 13 Support costs remained relatively the same and went down slightly due to more GST rebates. 14 Increase due to purchasing more ongoing resources during the year which is detailed above. 15 Law reduced from 57342 to 12958. 16 Expenditures declined due to shifting of funds to cover subscription costs. Some of the decline can be attributed to 2013/14 miscategorization of some expenses as one time instead of continuing. 17 Expenditures increased by addition of new resources, inflation, and USD exchange rate. Some of the increase can be attributed to 2013/14 miscategorization of some expenses as one time instead of continuing. 18 Increase due to addition of MacRae Library RefWorks fees, inclusion of Relais fees, inclusion of document delivery costs. 19 Includes contract binding, offsite storage, data files, special projects. 20 A little more was allocated for monographs in 2014-15 than in the previous year. 21 We are binding less and less as the years pass and our copyright costs were down too. 22 Includes books, standards, market research reports. 23 Document delivery costs. 24 Fringe benefits are included in the Library budget, but are not broken down by type of staff so are not reported in Q3 Salaries and Wages. They have been included in 4.3 Total Library Expenditures. 25 Decrease in 2014-15 Personnel numbers reflect organizational changes made. 2014-15 salary and wages expenditures did not decrease by a corresponding percentage as they are inclusive of voluntary severance payments made. 26 Does not include FNUniv. 27 Increase in student labour to work on Architecture Project in Archives. This year only. 28 The increase is a result of several factors: a rate increase for student assistants; the transition to a new accounting system and budget model resulted in transfer credits not being received in this budget year. 29 A large number of positions were reclassified this year and moved from 'support' to the 'professional staff' category. 30 Augmentation du nombre d'heures travaillées. 31 Includes U of R and Campion College. 32 Includes U of R and Campion College.
CARL STATISTICS | STATISTIQUES DE L’ABRC 2014-2015 15
33 A large portion of this difference is due to the moving costs of the health sciences library, in the previous fiscal year, which was about $235k between moving and equipment purchases. The remainder of this difference is made up of items such as lower costs on repairs and maintenance, external services, equipment, & Software. 34 The increase in costs over the prior year is due to the growth in library acquisitions of $976k and is offset by lower salary costs of $209k and other operating costs of $335k. 35 Fringe benefits: The University's approach to charging departments for benefit costs changed effective May 1 2014. The change resulted in lower percentage costs for the departments. 36 Included was the actual benefit costs to Western Libraries. Western Libraries is charged benefits at a rate of 27.5% for all full time permanent employees. Western Libraries is charged at a rate of 13% for student assistants and contract support staff. 37 Including operating expenditures for system-wide units based in Killam Library which were not included in previous years. 38 Does not include labour and operating expenditures funded by recoveries from provision of service to partners. 39 Decrease in 2014-15 Personnel numbers reflect organizational changes made. 2014-15 salary and wages expenditures did not decrease by a corresponding percentage as they are inclusive of voluntary severance payments made. 40 Increase in student labour to work on Architecture Project in Archives. This year only. 41 Moved positions such as budget officers, marketing specialists, etc. to this category from the Support Staff category to better match definition. 42 A large number of positions were reclassified this year and moved from 'support' to the 'professional staff' category. 43 Includes 3 archivists. 44 Incudes curator. 45 L'UdeS utilise depuis plusieurs années le chiffre de "2" pour répondre à cette question. Une analyse plus fine des ETP du personnel temporaire sera faite en 15-16. 46 Does not include FTEs funded by recoveries from provision of service to partners. 47 These numbers are from the 2014 Fall term, as of the end of the fourth week of classes, as reported to AUCC National Fall Count http://www.uregina.ca/orp/statistics/student-headcount.html. FTE's from the U of R's 3 aforementioned federated colleges are included. This uses the standard FTE definition of: FT + (PT/3.5). 48 Fall census 2014. FT + PT/3.5. Does not include Non-Degree. 49 Fall census 2014. FT + PT/3.5. Includes Post Grad Clinical. 50 In previous years, the number reported represented student headcount. This year, FTE figures are reported as requested.
CARL STATISTICS | STATISTIQUES DE L’ABRC 2014-2015 17
SECTION B
Emerging Trends
Tendances nouvelles
2014-2015
CARL STATISTICS | STATISTIQUES DE L’ABRC 2014-2015 19
Table I – Archives and Special Collections Tableau I – Archives et collections spéciales
Managing
archives & special
collections
Gestion des
archives &
collections
spéciales
Manuscripts and
archives (m)
Manuscrits et
archives (m)
University records
included in 1.2
Dossiers de
l’université
compris dans 1.2
Expenditures
related to these
collections
Dépenses liées à
ces collections
Question 1.1 1.2 1.2.1 1.3
British Columbia Yes 4,452 No U/A
Simon Fraser Yes 1 951 No $585,000
Victoria Yes 1,829 Yes $80,360
Alberta Yes 5,325 Yes $1,021,587
Calgary Yes 3,505 2 Yes $1,570,435 3
Manitoba Yes 6,007 No $934,265
Regina Yes 3,019 Yes $581,861 4
Saskatchewan Yes 5,108 Yes $744,830 5
Brock Yes 892 Yes $245,525
Carleton Yes 1,637 No $129,219
Guelph Yes 9,200 No $811,916
McMaster Yes 4,528 No $549,438
Ottawa Yes 661 No $239,000 6
Queen's Yes U/A No U/A
Ryerson Yes 1,675 Yes $308,913
Toronto Yes 29,820 Yes $2,703,514 7
Waterloo Yes 2,056 Yes 366,584
Western Ontario Yes 5,093 Yes $997,000
Windsor Yes 2,870 Yes $229,701
York Yes 95,134 8 Yes $927,651
Concordia Yes 649 No $105,074
Laval Yes 0 No $236,702
McGill Yes 2,849 9 No 10
Montréal Yes 11 0 No $318,431
Sherbrooke Yes 212 No $341,552
UQÀM Yes 12 172 No 0
Dalhousie Yes 5,302 Yes $288,102 13
Memorial Yes 3,469 14 No $438,999
New Brunswick Yes 65 Yes $330,114
Library and Archives Canada Yes No
National Science Library Yes 12,165 Yes $72,186
U/A = Unavailable N/A = Not applicable N/R = Did not reply Non-disponible Sans objet N’a pas répondu
20 CARL STATISTICS | STATISTIQUES DE L’ABRC 2014-2015
Table II – Digital Collections Tableau II – Collections numériques
Total # of
digital
objects
# total
d’objets
numériques
Size of
digital files
(TB)
Taille des
objets
numériques
(To)
Total # of
items in
institutional
repository
# total
d’éléments
dans dépôt
institutionel
# articles
# d’articles
# theses and
dissertations
# thèses et de
mémoires
# other items
# d’autres
éléments
Question 2.1 2.2 2.3 2.3.1 2.3.2 2.3.3
British Columbia U/A U/A 49,732 U/A 41,135 U/A
Simon Fraser 1,363,631 20.00 15 19,012 1,818 12,907 4,287
Library and Archives Canada 20,372,395 2,727.71 342,015 32 334,241 20,709,363
National Science Library 178,191 0.29 57,393 28,819 12 28,562
U/A = Unavailable N/A = Not applicable N/R = Did not reply Non-disponible Sans objet N’a pas répondu
CARL STATISTICS | STATISTIQUES DE L’ABRC 2014-2015 21
Table III - E-publishing Tableau III – Édition électronique
Store faculty
research data
Stockage de
données de
recherche du
personnel
enseignant
Manage
Author’s Fees
fund
Gère fonds
d’honoraires
des auteurs
# Grants
awarded
# de
subventions
accordées
Total amount of
funds awarded
Montant total
des subventions
accordées
% funds
dedicated to
open access
publishing
% fonds
réservés à
l’édition en
libre accès
Question 3.1 3.2 3.2.1 3.2.2 3.2.3
British Columbia Yes No N/A N/A N/A
Simon Fraser Yes 33 Yes 80 $135,404 1.39
Victoria No No 0 0 0.00
Alberta Yes No N/A N/A N/A
Calgary No Yes 210 $364,961 N/A
Manitoba Yes Yes U/A $150,000
Regina No Yes 5 $9,609 U/A
Saskatchewan No No 34 N/A N/A 0.00
Brock No Yes 3 $4,582 0.17
Carleton No Yes 12 $19,356 0.00
Guelph Yes No N/A N/A N/A
McMaster Yes No 0 0 N/A
Ottawa No Yes 35 118 $232,239 1.53
Queen's No No U/A U/A U/A
Ryerson No Yes U/A $42,133 1.00
Toronto Yes Yes 23 $55,000 U/A
Waterloo Yes No 0 0 0.00
Western Ontario No Yes 52 $67,669 0.54 36
Windsor Yes No 0 0 0.00
York No Yes 16 $21,000 0.21
Concordia No Yes 22 $34,643 0.25
Laval No No 0 0 0.00
McGill No No 0 0 0.00
Montréal No No 0 0 0.00
Sherbrooke No No
UQÀM No No 0 0 0.00
Dalhousie Yes No 0 0 0.00
Memorial Yes Yes 101 $128,687 1.70
New Brunswick No No 0 0 0.00
Library and Archives Canada No No N/A N/A N/A
National Science Library No No N/A N/A N/A
U/A = Unavailable N/A = Not applicable N/R = Did not reply Non-disponible Sans objet N’a pas répondu
22 CARL STATISTICS | STATISTIQUES DE L’ABRC 2014-2015
Emerging Trends Questionnaire Questionnaire sur les tendances nouvelles
Research Services Services de recherche
1. Archives and Special Collections 1. Archives et collections spéciales
1.1. Are archives and special collections managed by the library (yes/no)
1.1. Les archives et les collections spéciales sont-elles gérées par la bibliothèque? (oui/non)
1.2. Manuscripts and archives 1.2. Manuscrits et archives
1.2.1. Are university records included in the collections recorded at 1.2? (yes/no)
1.2.1. Les dossiers de l’université sont-ils compris dans les collections indiquées à 1.2? (oui/non)
1.3. Expenditure related to these collections
1.3. Dépenses liées à ces collections
2. Digital Collections 2. Collections numériques
2.1. Total Number of digital objects 2.1. Nombre total d’objets numériques 2.2. Size of digital files (TB) 2.2. Taille des objets numériques 2.3. Total # of items in the Institutional
Repository 2.3. Nombre total d’éléments dans le dépôt
institutionnel
2.3.1. # of articles 2.3.1. Nombre d’articles 2.3.2. # of Theses and dissertations 2.3.2. Nombre de thèses et de mémoires 2.3.3. # of other items 2.3.3. Nombre d’autres éléments
3. E-Publishing 3. Édition électronique
3.1. Does your library store faculty research data (Yes/No)
3.1. Votre bibliothèque stocke-t-elle les données de recherche du personnel enseignant? (oui/non)
3.2. Does your library manage an Author’s Fees fund? (Yes/No)
3.2. Votre bibliothèque gère-t-elle un fonds d’honoraires des auteurs? (oui/non)
3.2.1. # of Grants awarded 3.2.1. Nombre de subventions accordées 3.2.2. Total amount of funds awarded 3.2.2. Montant total des subventions
accordées 3.2.3. % of funds dedicated to open
access publishing 3.2.3. Pourcentage des fonds réservés à
l’édition en libre accès
CARL STATISTICS | STATISTIQUES DE L’ABRC 2014-2015 23
Endnotes to Emerging Trends questionnaire Notes finales du questionnaire sur les tendances nouvelles 1 Special Collections not Archives. 2 With the implementation of a new archival management system, archival metadata from a number of sources is being consolidated into this system. 3 With university records being included in 1.2, the related staffing expenditures increased. 4 Includes all staffing, benefits and materials expenditures for this area. 5 Difference for the year relates to a sabbatical taken during the previous year and higher salary, appraisal, and acquisition costs for the current year. 6 Decrease in acquisitions. 7 Beginning in 2014-2015, statistics related to the Media Commons Library will be excluded as it was decided that their circulating audio-visual collection does not fit the definition of 'special collection'. However, data related to the activities and expenditures of the Media Commons Archive will continue to be included. Also, in the 2013-2014 period, a large special collection was acquired, resulting in an increase in the materials expenditure for that period. 8 Correction to the photographs count Manuscripts (Linear metres)4,683 University Records (Linear metres)965 Photographs (Linear metres)400 Moving Image Archives (Linear metres) 89,087. 9 Includes rare books as well as University Archives. 10 This amount excludes salaries and wages represents collections acquisitions only. 11 Seules les collections spéciales sont gérées par les bibliothèques. 12 Précision: Le oui concerne les collections spéciales car les archives sont gérées par un autre service et ce, depuis toujours. 13 Increase in grants received as well as increased time from a staff member spent on processing collection. 14 A full inventory of material resulted in a lower figure than what was previously reported. 15 Increase due to files now being saved in one centralized location. 16 This year’s increase was due largely to continuing work on Sask History Online (provincial project led and hosted by U of S) and the continuing digitization of the Courtney Milne photograph collection. 17 Archival tiffs for the institutional repository are not included due to workflow complications (theses submission process). The publicly accessible files are estimated at 25-30 GB, based on typical sizes for the digitized and born digital theses, but that number is not included in the total. There is some difficulty breaking out files sizes and numbers because of the use of digital asset management systems. The workflows require (generally) the upload of archival tiffs which are then converted to other file types. On other occasions the files are loaded at a lower resolution and stored locally. For Islandora, we have reported the totals for the "OBJ" (master) datastream. Therefore, this number does not include collections where only a derivative is available (e.g. for harvested collections). For contentDM, we have included the estimated total size of the archival masters stored offline, NOT the files uploaded. This year’s increase was due largely to continuing work on Sask History Online (provincial project led and hosted by U of S) and the continuing digitization of the Courtney Milne photograph collection. However, these numbers also do not include digitized or born digital material not yet available online – which includes considerable additional material from the Courtney Milne collection. Therefore, for the reasons outlined above, the number reported here is conservative. 18 Lower number of digital objects compared to previous year because of some data removed (Land Information Ontario (LIO)-also available through Scholars Geoportal and some through the Ontario Open Data catalogue. DMTI Spatial Satellite StreetView files were also removed because of cancelled subscription. 19 Corrected double counting of some objects, particularly ETDs, in the Atrium. 20 Atrium platform upgrade pruned unnecessary files from filesystem. 21 Further refined definition of "Institutional Repository": URLs include atrium.lib.uoguelph.ca, dataverse.scholarsportal.info/dvn/dv/ugardr, dataverse.scholarsportal.info/dvn/dv/ugrdr, UG geoportal collections (http://geo1.scholarsportal.info/). 22 The number of articles in the institutional repository shows a similar increase in number compared to the previous year (282 vs. 235). 23 The number of ETDs in the institutional repository shows a similar growth compared to the previous year (534 vs. 528).
24 CARL STATISTICS | STATISTIQUES DE L’ABRC 2014-2015
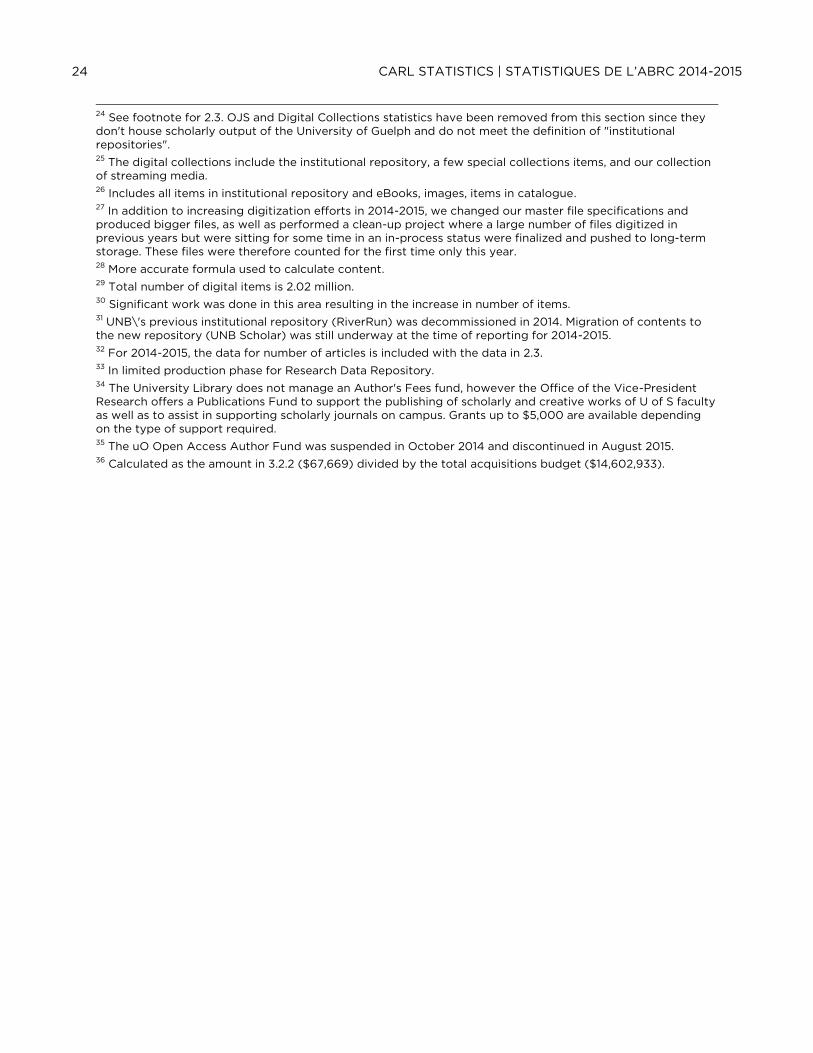
24 See footnote for 2.3. OJS and Digital Collections statistics have been removed from this section since they don't house scholarly output of the University of Guelph and do not meet the definition of "institutional repositories". 25 The digital collections include the institutional repository, a few special collections items, and our collection of streaming media. 26 Includes all items in institutional repository and eBooks, images, items in catalogue. 27 In addition to increasing digitization efforts in 2014-2015, we changed our master file specifications and produced bigger files, as well as performed a clean-up project where a large number of files digitized in previous years but were sitting for some time in an in-process status were finalized and pushed to long-term storage. These files were therefore counted for the first time only this year. 28 More accurate formula used to calculate content. 29 Total number of digital items is 2.02 million. 30 Significant work was done in this area resulting in the increase in number of items. 31 UNB\'s previous institutional repository (RiverRun) was decommissioned in 2014. Migration of contents to the new repository (UNB Scholar) was still underway at the time of reporting for 2014-2015. 32 For 2014-2015, the data for number of articles is included with the data in 2.3. 33 In limited production phase for Research Data Repository. 34 The University Library does not manage an Author's Fees fund, however the Office of the Vice-President Research offers a Publications Fund to support the publishing of scholarly and creative works of U of S faculty as well as to assist in supporting scholarly journals on campus. Grants up to $5,000 are available depending on the type of support required. 35 The uO Open Access Author Fund was suspended in October 2014 and discontinued in August 2015. 36 Calculated as the amount in 3.2.2 ($67,669) divided by the total acquisitions budget ($14,602,933).
CARL STATISTICS | STATISTIQUES DE L’ABRC 2014-2015 25
SECTION C
Use, Facilities and Services
Utilisation, installations et services
2014-2015
CARL STATISTICS / STATISTIQUES DE L’ABRC 2014-2015 27
Table I – Electronic resources & Collection use Tableau I – Ressources électroniques & Utilisation des collections
Number of
sessions (logins) to
databases or
services
Nombre
d’ouvertures de
session dans les
bases de données
ou les services
Number of
searches (queries)
in databases or
services
Nombre de
recherches
(interrogations)
dans les bases de
données ou les
services
Number of
successful full-text
article requests
Nombre de
demandes
satisfaites
d’articles intégraux
Number of initial
loans
Nombre de prêts
initiaux
Question 1.1 1.2 1.3 2.1
British Columbia U/A U/A U/A 301,627
Simon Fraser 1,687,007 1 6,547,639 3,179,058 2 334,617
Victoria 124,636 207,960 138,579 184,521
Alberta U/A U/A U/A 233,413
Calgary 3 723,329 909,328 2,835,760 166,191 4
Manitoba U/A 2,431,100 2,452,774 204,651
Regina 0 0 375,501 5 72,190
Saskatchewan N/A 6 89,844 7 1,357,759 8 93,124 9
Brock N/A 10 59,330 890,521 11 143,120
Carleton N/A 12 681,488 1,375,096 152,387
Guelph U/A 13 U/A 14 1,868,834 15 132,246
McMaster 80,757 413,463 2,877,645 92,099
Ottawa U/A 892,606 16 2,259,077 17 193,256
Queen's U/A 1,692,162 2,587,638 18 98,283
Ryerson U/A U/A U/A 140,463
Toronto U/A U/A U/A 663,318
Waterloo 392,834 19 2,718,195 2,874,110 103,835
Western Ontario U/A 20 U/A U/A 185,330
Windsor 24,988 309,235 21 1,051,307 22 62,599 23
York 593,684 1,748,269 2,195,782 280,976
Concordia U/A 1,426,469 24 1,147,138 25 128,571
Laval 134,978 3,718,003 2,158,257 276,648
McGill 2,491,095 1,175,273 U/A 225,879
Montréal 26 187,084 674,085 3,087,653 315,710
Sherbrooke 0 0 974,718 64,485
UQÀM N/D 281,815 1,095,433 242,505
Dalhousie 27 51,890 820,108 1,721,130 103,467
Memorial 853,048 28 639,590 29 1,598,128 30 100,278
New Brunswick N/A 31 274,597 557,163 42,598
Library and Archives Canada 13,700,000 14,600,000 N/A N/A
National Science Library U/A 32 202,519 33 329,563 585
National total | Total national 21,045,330 42,513,078 40,988,624 5,338,972
U/A = Unavailable N/A = Not applicable N/R = Did not reply Non-disponible Sans objet N’a pas répondu
28 CARL STATISTICS | STATISTIQUES DE L’ABRC 2014-2015
Table II – Library instruction and facility use Tableau II – Formation et utilisation des installations
# of library
presentations
to groups
# de
présentations
de groupe
# participants
in 3.1
# participants à
la ligne 3.1
# of reference
transactions
# de questions
de référence
Turnstile count
Compte au
tourniquet
# of seats
# de places
assises
Question 3.1 3.2 3.3 3.4 3.5
British Columbia 1,335 32,744 51,640 3,877,811 4,877
Simon Fraser 1,327 34 29,423 63,119 1,748,217 2,004
Victoria 415 8,812 23,736 1,412,601 2,326
Alberta 593 18,674 118,693 35 3,215,669 5,717
Calgary 527 36 14,387 75,638 15,315 37 3,024
Manitoba 1,110 17,187 103,030 1,411,411 2,413
Regina 370 38 7,250 13,032 U/A 1,017
Saskatchewan 532 10,500 13,965 1,920,540 3,438
Brock 342 14,411 19,902 1,420
Carleton 482 15,938 10,979 1,365,662 2,288
Guelph 2,250 36,977 39 14,291 1,401,601 3,088
McMaster 253 8,401 10,806 2,422,085 4,144
Ottawa 628 16,097 35,731 2,034,060 3,122
Queen's 813 19,618 12,860 1,655,266 3,089
Ryerson 327 12,761 U/A U/A 40 3,850 41
Toronto 2,227 53,999 170,653 6,647,730 42 13,113
Waterloo 316 11,438 16,173 2,810,541 1,846
Western Ontario 414 10,420 20,425 2,195,300 4,176
Windsor 121 3,983 7,196 43 951,493 1,671
York 690 23,808 32,217 2,919,864 3,180 44
Concordia 572 11,243 23,046 2,301,714 2,794
Laval 497 13,506 47,382 45 827,907 2,266
McGill 555 18,136 64,723 2,364,203 4,654
Montréal 1,146 25,279 64,562 2,290,640 4,384
Sherbrooke 314 5,784 12,604 7,883 1,315
UQÀM 473 5,583 40,402 4,310 2,186
Dalhousie 337 8,890 22,940 1,404,955 2,596
Memorial 321 6,332 40,412 1,296,407 2,528
New Brunswick 295 6,895 18,534 634,417 1,110
Library and Archives Canada 11 N/A 24,595
National Science Library U/A U/A 490 46 N/A N/A
National total | Total national 19,593 468,476 1,173,776 49,137,602 93,636
U/A = Unavailable N/A = Not applicable N/R = Did not reply Non-disponible Sans objet N’a pas répondu
CARL STATISTICS / STATISTIQUES DE L’ABRC 2014-2015 29
Table III – Document delivery traffic Tableau III – Traffic de livraison de documents
Lending
Prêts
Requests received
Demandes reçues
Received requests
filled
Demandes reçues
satisfaites
Originals sent
Originaux envoyés
Copies sent
Copies
envoyés
Question 4.1 4.1.1 4.1.2 4.1.3
British Columbia 35,885 22,115 7,909 14,206
Simon Fraser 17,753 11,028 5,632 5,396
Victoria 13,200 7,750 2,855 4,895
Alberta 51,185 34,487 13,423 21,064
Calgary 25,073 14,848 7,360 7,488
Manitoba 47 20,108 8,630 2,376 6,254
Regina 9,091 4,217 2,801 1,416
Saskatchewan 9,913 48 5,781 49 3,059 50 2,722 51
Brock 4,916 1,627 1,235 392
Carleton 9,537 4,932 3,193 1,741
Guelph 52 26,287 20,012 18,313 1,699
McMaster U/A 10,937 3,332 6,401
Ottawa 27,372 15,406 8,562 6,844
Queen's U/A 7,146 53 U/A U/A
Ryerson 11,303 2,761 1,843 918
Toronto 41,592 31,166 21,129 10,037
Waterloo 25,704 19,188 16,499 2,689
Western Ontario 20,354 10,415 4,963 5,453
Windsor 1,852 858 516 342
York 12,462 8,241 5,701 2,540
Concordia 8,064 4,599 3,161 1,438
Laval 22,420 14,747 7,809 6,938
McGill 18,649 10,616 5,714 4,902
Montréal 18,566 12,680 6,347 6,333
Sherbrooke 5,382 4,174 1,364 2,810
UQÀM 5,551 3,302 2,338 964
Dalhousie 28,505 25,402 13,425 11,977
Memorial 14,030 9,361 3,595 6,083
New Brunswick 9,640 7,287 1,318 5,969 54
Library and Archives Canada 278 28 28 0
National Science Library 55,178 52,376 585 53,161
National total | Total national 549,850 386,117 176,385 203,072
U/A = Unavailable N/A = Not applicable N/R = Did not reply Non-disponible Sans objet N’a pas répondu
30 CARL STATISTICS | STATISTIQUES DE L’ABRC 2014-2015
Table III – Document delivery traffic Tableau III – Traffic de livraison de documents
Borrowing
Emprunts
Requests sent
Demandes envoyés
Sent requests filled
Demandes reçues
satisfaites
Originals received
Originaux reçus
Copies received
Copies reçus
Question 4.2 4.2.1 4.2.2 4.2.3
British Columbia 7,612 55 7,609 3,486 4,123
Simon Fraser 7,694 7,059 2,829 4,230
Victoria 8,018 5,813 3,760 2,053
Alberta 19,855 16,185 3,995 12,190
Calgary 22,610 14,773 56 3,822 10,951
Manitoba 57 6,255 5,677 1,574 4,103
Regina 1,581 1,373 938 435
Saskatchewan 7,255 58 5,361 59 2,317 60 3,044 61
Brock 4,064 3,488 2,257 1,231
Carleton 9,025 7,128 4,220 2,908
Guelph 62 16,624 14,389 11,547 2,842
McMaster U/A 8,511 5,385 3,114
Ottawa 7,477 7,103 3,766 3,337
Queen's U/A 4,731 U/A U/A
Ryerson 63 7,662 5,633 1,551 4,082
Toronto 8,363 4,959 3,404
Waterloo 28,131 24,754 19,820 4,934
Western Ontario 10,839 7,801 5,273 2,739
Windsor 3,745 3,025 1,361 1,664
York 5,713 4,504 3,144 1,360
Concordia 14,066 11,743 7,680 4,063
Laval 8,410 5,562 4,363 1,199
McGill 19,914 14,584 7,955 6,629
Montréal 15,723 14,759 8,373 6,386
Sherbrooke 8,517 7,573 2,573 5,010
UQÀM 2,595 2,346 1,589 587
Dalhousie 16,411 15,909 8,098 7,811
Memorial 7,640 3,956 874 3,082
New Brunswick 10,464 8,777 3,079 5,698
Library and Archives Canada 0 0 0
National Science Library 1,484 1,119 126 993
National total | Total national 279,384 249,608 130,714 114,202
U/A = Unavailable N/A = Not applicable N/R = Did not reply Non-disponible Sans objet N’a pas répondu
CARL STATISTICS / STATISTIQUES DE L’ABRC 2014-2015 31
Use, Facilities and Services Questionnaire
Questionnaire sur l'utilisation, installations et services
1.1. Number of sessions (logins) to databases or services.
1.1. Nombre d’ouvertures de session dans les bases de données ou les services
1.2. Number of searches (queries) in databases or services.
1.2. Nombre de recherches ou d’interrogations dans les bases de données ou les services
1.3. Number of successful full-text article requests.
1.3. Nombre de demandes satisfaites d’articles intégraux
2. Collections Use 2. Utilisation des collections
2.1. Number of initial loans 2.1. Nombre de prêts initiaux
3. Library instruction and facilities 3. Présentations de groupe
3.1. Number of library presentations to groups
3.1. Nombre de présentations de groupe
3.2. Number of total participants in group presentations reported on line 3.1
3.2. Nombre total de participants aux présentations de groupe à la ligne 3.1
3.3. Total number of reference transactions 3.3. Nombre total de questions de référence
3.4. Turnstile count 3.4. Compte au tourniquet
3.5. Number of seats 3.5. Nombre de places assises
4. Document Delivery Traffic 4. Trafic de livraison de documents
Lending Prêts
4.1. Total number of requests received (filled and unfilled)
4.1. Nombre total de demandes reçues (satisfaites ou non)
4.1.1. Total number of requests received from other institutions filled
4.1.1. Nombre total de demandes reçues et satisfaites en provenance d’autres institutions
4.1.2. Number of originals sent 4.1.2. Nombre d’originaux envoyés
4.1.3. Number of copies sent 4.1.3. Nombre d’exemplaires envoyés
Borrowing Emprunts
4.2. Total number of requests sent (filled and unfilled)
4.2. Nombre total de demandes envoyées (satisfaites ou non)
4.2.1. Total number of requests filled by other institutions
4.2.1. Nombre total de demandes satisfaites par d’autres institutions
4.2.2. Number of originals received 4.2.2. Nombre d’originaux reçus
4.2.3. Number of copies received 4.2.3. Nombre d’exemplaires reçus
32 CARL STATISTICS | STATISTIQUES DE L’ABRC 2014-2015
Endnotes to Use, Facilities and Services Questionnaire Notes finales du questionnaire sur l'utilisation, installations et services 1 Many publishers and providers migrated to Release 4 for Counter DB1 statistics, instead of sessions. R4 D1 reports count record views and result clicks. For this statistic record views were counted. 2 Nature Publishing Group JR1 reports were unusually high, more than 4 times the total from the previous year. NPG surmises that undetected spider/robot activity was included in the 2013 report. 3 Resources include: PsycINFO, Project MUSE, Business Source Complete, Alexander Street Press, ARTstor, Web Of Science, Science Direct, Scopus, MYiLibrary, Proquest Historical Newspapers, Periodicals Archive and Periodicals Index, House of Commons Parliamentary Papers, ProQuest Historical Newspapers, MathSciNet, Cambridge Journals Online. 4 Reflects the continuing trend towards the increased use of electronic resources. 5 This is for the calendar year 2014 not the fiscal year. 1.3 Includes 8 journal packages (CKRN: Cambridge, Oxford, Elsevier, Sage, Springer, Taylor & Francis, Wiley-Blackwell and Project Muse (COPPUL). 6 This field no longer reported on COUNTER 4. 7 2014 calendar year; includes PsycInfo, Project Muse. 8 2014 calendar year; includes Project Muse, CRKN (ACS, CAIRN, Cambridge, Elsevier, Erudit, Informa Healthcare, IOP, JSTOR, NRC, Oxford, RSC, Sage, Springer, T&F, Wiley). 9 Decrease reflects emphasis on electronic material resulting in decreased circulation of physical material. Also excludes in-house circulations from Special Collections that were included in previous years (649 in-house circulations from 13 Special Collections removed in 2014/15). Although not included in the total, in 2014/15, we recorded 10,183 files/items retrieved from the archival collection (not catalogued in Sierra). Of these, approx. 54% were used by library patrons in person, based on the means of access recorded for the 950 users accessing this material. The remainder of the material was used by staff to respond to reference enquiries, including scanning or copying items for remote users. A very small portion of this total includes Special Collections material signed out to patrons without a library card (42 items). 10 This information is no longer part of standard COUNTER reporting so producing any numbers here would be misleading. 11 33% drop in 2014-15 data caused by including only CRKN content (ACS, CAIRN, Cambridge UP, Elsevier, Erudit, Informa Healthcare, IOP, JSTOR, NRC, Oxford UP, Royal Society of Chemistry, Sage, Springer, Taylor & Francis, Wiley), Project MUSE, PsycArticles, and Business Source Complete. 12 COUNTER 4 reports no longer state number of sessions. 13 Our session data cannot be reliably interpreted, so it is not included. 14 Our search data cannot be reliably interpreted, so it is not included. 15 Includes data from Project MUSE, Business Source Complete and the following CRKN resources: American Chemical Society, Cairn, Cambridge University Press, Elsevier, Erudit, Institute of Physics, NRC Research Press, Oxford University Press, Royal Society of Chemistry, Sage, Springer, Taylor & Francis and Wiley-Blackwell. 16 Counts only: CRKN, Project MUSE, PsycInfo, and Business Source Complete where COUNTER statistics are available). RESOURCES INCLUDED: Adam Matthew Digital; Alexander Street Press (includes, among other titles, Classical Music Library and Oral History Online); Ebscohost Business Source Complete; Elsevier Scopus; Gale Cengage Learning, Eighteenth Century Collections Online; Gale Cengage Learning, Times Digital Archive; InteLex Past Masters; MathSciNet (American Mathematical Society); Micromedia ProQuest, Historical Newspapers; PsycInfo; Thomson Reuters, Web of Knowledge, Derwent Innovations Index; Thomson Reuters, Web of Knowledge, Journal Citation Reports; Thomson Reuters, Web of Knowledge, Zoological Record; Thomson Reuters, Web of Science. 17 Counts only: CRKN, Project MUSE, PsycInfo, and Business Source Complete where COUNTER statistics are available). RESOURCES INCLUDED: Adam Matthew Digital; Alexander Street Press (includes, among other titles, Classical Music Library and Oral History Online); Ebscohost Business Source Complete; Elsevier Scopus; Gale Cengage Learning, Eighteenth Century Collections Online; Gale Cengage Learning, Times Digital Archive; InteLex Past Masters; MathSciNet (American Mathematical Society); Micromedia ProQuest, Historical Newspapers; PsycInfo; Thomson Reuters, Web of Knowledge, Derwent Innovations Index; Thomson Reuters, Web of Knowledge, Journal Citation Reports; Thomson Reuters, Web of Knowledge, Zoological Record; Thomson Reuters, Web of Science.
CARL STATISTICS / STATISTIQUES DE L’ABRC 2014-2015 33
18 Increase in number of databases for which we can now gather statistics through our SUSHI statistic aggregator. 19 In previous years, the 'Sessions' measure was most frequently derived from COUNTER Release 3 Database Report 1 or Database Report 3. For the calendar 2014 year, however, many vendors were already reporting using COUNTER Release 4; this release removes the 'Sessions' measure from Database Report 3 and from the equivalent Platform Report 1. The total reported figure for 'Sessions' for calendar 2014 has therefore continued to decrease, despite the fact that that the total reported figure for 'Searches' (in Question 1.2) has increased. 20 Information unavailable - Western Libraries has purchased software to assist in collecting usage data and hopes to be able to contribute this data in future surveys. 21 Number of searches (queries) in databases or services. Overall there has been a decrease in number of searches for several titles. As well, for some titles, we were unable to find figures. Also for this year for APA numbers we correctly reported for PsycInfo only, whereas last year we reported for all of PsycNet (number for 14/15 for PsycInfo was 83,340 whereas last year for PsycNet we reported 283,172). 22 Number of successful full-text article requests. The significant difference is due to much better organization and analysis of our statistics and inclusion of all CRKN products (including ebooks). 23 Number of initial loans. In previous years we were unable to separate out renewals. We moved to a new ILS system in May 2014 and were able to correctly report initial loans only for 14/15. Also our number of initial loans is reduced because of our system migration in May 2014. 24 List of resource for searches CRKN Products: Adam Matthew Digital Collection - 373 Alexander Street Press Core Collections - 6,965 Alexander Street Press Classical Scores Library - 435 Alexander Street Press , Theatre in Video - 2,785 American Chemical Society, Web Editions - 36,213 American Mathematical Society, MathSciNet - 16,002 Elsevier, Science Direct - 95,885 Elsevier, Scopus - 84,802 Gale Cengage Learning, Eighteenth Century Collections Online - 17,054 Gibson Library Connections, Canadian Publishers Collection - 19,110 JSTOR Archive, 8 Collections, 2011-2014 (Arts & Sciences 1-7 & Life Sciences) - 230,065 NRC Research Press - 2,065 ProQuest, Canada's Heritage Globe & Mail - 36,701 ProQuest, Historical Newspapers - 205,136 ProQuest, Periodicals Archive Online - 35,014 Royal Society of Chemistry, Merck Index Online - 543 Royal Society of Chemistry, RSC Electronic Journals - 6,641 Sage Publications, Premier All-Access - 6,720 Taylor & Francis, Journals Online - 24,117 The Times Digital Archive (Gale) - 1,859 Thomson Reuters, Web of Knoweldge, Biosis Citation Index - 17,166 Thomson Reuters, Web of Knoweldge, Journal Citation Reports - 1,468 Thomson Reuters, Web of Knoweldge, Web of Science - 31,886 Wiley-Blackwell Electronic Journals - 21,936 Non-CRKN: PsycInfo - 208,576 Project MUSE - 156,024 Business Source Complete - 160,928 Total: 1,426,469. 25 List of resources for full-text article downloads CRKN Products: American Chemical Society, Journals - 18,287 American Mathematical Society, MathSciNet - 451 CAIRN, Bouquet Général - 1,959 Cambridge University Press, Cambridge Journals Online - 10,634 Elsevier, Science Direct - 347,770 Érudit, Scholarly Journals Collection 8,860 Gale Cengage Learning, Eighteenth Century Collections Online - 11,745 Institute of Physics, IOP Journals - 4,766 Intelex, Intelex Past Masters - 773 JSTOR Archive, 8 Collections, 2011-2014 (Arts & Sciences 1-7 & Life Sciences) - 359,366 NRC Research Press - 9,332 Oxford University Press, Oxford Journals Online - 23,484 ProQuest, Periodicals Archive Online - 14,548 Royal Society of Chemistry, RSC Electronic Journals - 7,430 Royal Society of Chemistry, RSC Journals Archive - 560 Sage Publications, Deep Backfile - 7,337 Sage Publications, Premier All-Access - 53,082 Springer, Online Journals - 64,919 Taylor & Francis, Journals Online - 80,513 Wiley-Blackwell Electronic Journals - 94,985 Non-CRKN: Project MUSE - 26,337 Total: 1,147,138. 26 Sources comptabilisées: Elsevier/ScienceDirect; Wiley Online Library; SAGE Publications; JSTOR; Érudit; Springer; Business Source Premier (EBSCOhost, à trouver sur le rapport BD1); American Chemical Society; CAIRN (compote d'autres collections que celles du RCDR); Oxford Journals; Informa Pharmaceutical Science; Taylor&Francis; Cambridge (CJO); Project MUSE; Royal Society of Chemistry; IOP Electronic Journals; PsycInfo. 27 Data was retrieved in Summer and Fall 2015. The CRKN subscriptions included are: Academic Press Journal Collection (Elsevier); American Chemical Society, Legacy Archives; American Chemical Society, Web Editions; American Mathematical Society, MathSciNet; CAIRN Bouquet Général; Cambridge University Press, Cambridge Journals Online; Érudit, Scholarly Journals Collection; Gale Cengage Learning, 18th-Century Collections; Gale Cengage Learning, Times Digital Archive; Institute of Physics, IOP Journals; InteLex/Gibson Library Connections, InteLex Past Masters; NRC Research Press Journals; Oxford University Press, Oxford Journals Online; ProQuest, Canada\'s Heritage Globe & Mail 1844+; ProQuest, Periodicals Archive Online (Collections 1-6); Royal Society of Chemistry, RSC Electronic Journals; SAGE Publications, Premier All-Access; Springer, SpringerLink Online Journals; Taylor & Francis, Journals Online - Complete Collection; Thomson Reuters, Web of Knowledge, Journal Citation Reports; Thomson Reuters, Web of Science; and Wiley-Blackwell Electronic Journals. Former CKRN subscription to SWETS ALJC Learned Journals Collection is excluded. Informa Healthcare, Informa Healthcare Journals Online included in Taylor and Francis data. The following CRKN subscriptions were excluded because COUNTER compliant usage statistics were not available: Adam Matthew Digital Collections; Alexander Street Press, Classical Scores Library; Alexander Street Press, Theatre in Video;
34 CARL STATISTICS | STATISTIQUES DE L’ABRC 2014-2015
Alexander Street Press, Various Databases; ARTstor Digital Library; Country Reports & Viewswire (EIU); Early Canadiana Online; and Proquest, House of Commons Parliamentary Papers. COUNTER compliant session [DB1] data was available for: Thomson Reuters, Web of Knowledge, Journal Citation Reports and Thomson Reuters, Web of Science COUNTER compliant search data was available for: Academic Search Premier; American Chemical Society, Web Editions; MathSciNet; Business Source Complete; Gale Cengage Learning, 18th-Century Collections; Gale Cengage Learning, Times Digital Archive; JSTOR; NRC Research Press Journals; Project Muse; ProQuest Historical Newspapers: The Globe and Mail; ProQuest, Periodicals Archive Online (Collections 1-6); PsychInfo; Royal Society of Chemistry Journals; Taylor & Francis, Journals Online; Thomson Reuters, Journal Citation COUNTER compliant full text article data in a mix of Counter 3 and Counter 4 formats was available for: Academic Search Premier; Academic Press Journal Collection; American Chemical Society, Legacy Archives; American Chemical Society, Web Editions; CAIRN Bouquet Général; Cambridge University Press – Cambridge Journals Online ; Érudit, Scholarly Journals Collection; Informa Healthcare, Informa Healthcare Journals Online; Institute of Physics, IOP Journals; InteLex/Gibson Library Connections, InteLex Past Masters; JSTOR ; NRC Research Press Journals: Oxford University Press, Oxford Journals Online; Project Muse: Royal Society of Chemistry, RSC Electronic Journals; SAGE Publications, Premier All-Access; Springer, SpringerLink Online Journals; Taylor & Francis, Journals Online - Complete Collection; Wiley-Blackwell Electronic Journals Data for Ingram Digital E-Books has been excluded since we were not able to distinguish between items purchased through CRKN items those purchased independently. Decline in Session data reflects shift from Counter 3 DB reports to Counter 4 reports which do not include session counts. Decline in searches is likely to be related to implementation of Primo. 3.4: Due to non-functioning equipment, count does not include Law Library. 28 Session not reported by vendors using Counter4 reports; information comes from the few vendors using Counter3 reports. 29 Missing data from a few vendors. 30 Missing data from a few vendors. 31 We cannot report this item this year as the Counter standard changed & sessions are no longer recorded by those vendors who have gone to Counter 4.0. 32 Business Source Complete is used as an example: login data unavailable. 33 Business Source Complete queries are used as an example. 34 Increase due to Research Commons expansion (workshops, doubled); increased Student Learning Commons activities and under counting last year. 35 Reference tracking software was introduced within the 2013-14 fiscal year. Significant increase in reference numbers reflects better tracking due to this implementation, as well as increased requests due to electronic options such as chat, email, etc. 36 Reflects the trend towards fewer formal sessions being scheduled, more one-on-one support and more technology-related instruction. 37 Provided one day sampling (October 29, 2014) rather than total gate count for the fiscal year, since information is not compiled consistently across branches. 38 Include the Centre for Teaching and Learning which is part of the Library. 39 Decrease due to a variety of factors: consolidation of programming from single topic workshops to series programming (students counted only once as opposed to for each workshop), pilot programming developed in the library was continued outside the library, etc.. In addition, program and material development has re-focussed to on-line / ubiquitously available materials. 40 Turnstile stats are no longer kept as a result of entrance reconfiguration. 41 Number of seats increase due to opening of a new Library space, the Student Learning Centre. 42 The gate count figure represents 17 out of 44 libraries within the University of Toronto Libraries. 43 Total number of reference transactions. In 2014/2015 we were re-visioning our reference model including how we kept statistics. The lower number reflects this change. 44 Law seats reduced from 411 to 169. 45 Promotion accrue des services. 46 Competitive & Technical Intelligence deliverables over an 8-month period. 47 ILL figures have decreased due to error in previous reporting - previous reportee failed to remove internal ILL requests through docline. 48 Includes ILL activity for all branch libraries. 49 Includes ILL activity for all branch libraries. 50 Includes ILL activity for all branch libraries. 51 Includes ILL activity for all branch libraries.
CARL STATISTICS / STATISTIQUES DE L’ABRC 2014-2015 35
52 In general, we have noted a year to year decline in demand and supply of DD services. Likely due to increased local availability of e-resources. 53 Decrease in overall number of requests. 54 UNB Libraries lowered numbers of incoming requests from RAPIDILL to balance supplying/receiving numbers. 55 Some unfilled request data unavailable in 2014/15. Total reported number is lower than actual. 56 Reflects more consistent reporting across the system than in 2013-2014. 57 ILL figures have decreased due to error in previous reporting - previous reportee failed to remove internal ILL requests through docline. 58 Includes ILL activity for all branch libraries except Law Library as data is not available. 59 Includes ILL activity for all branch libraries. 60 Includes ILL activity for all branch libraries. 61 Includes ILL activity for all branch libraries. 62 In general, we have noted a year to year decline in demand and supply of DD services. Likely due to increased local availability of e-resources. 63 Does not include requests completed without trying to obtain materials from responding location.
36 CARL STATISTICS | STATISTIQUES DE L’ABRC 2014-2015
SECTION D
Salaries
Salaires
2015-2016
CARL STATISTICS | STATISTIQUES DE L’ABRC 2014-2015 37
Table I - Salary data for all professionals 2015-2016 Tableau I – Données salariales pour tous les professionnels, 2015-2016
Number of
staff
Nombre
d’employés
Average years
of experience
Moyenne des
années
d'expérience
Average years
in reporting
library
Moyenne des
années dans
l'institution
Median
salary
Salaire
médian
Average
salary
Salaire moyen
British Columbia 1 86 17.21 12.13 $95,610 $97,288
Simon Fraser 59 17.12 12.21 $90,555 $88,628
Victoria 41 18.66 10.71 $91,519 $94,961
Provincial total | Total provincial 186 17.50 11.84 $94,235 $94,028
Alberta 74 15.00 11.38 $97,336 $101,147
Calgary 63 18.70 12.17 $98,692 $103,765
Manitoba 59 19.75 13.31 $97,049 $99,289
Regina 26 16.48 12.36 $108,603 $104,313
Saskatchewan 60 15.88 11.13 $93,961 $104,795
Regional total | Total régional 282 17.15 12.00 $98,357 $102,411
Brock 20 16.10 9.75 $107,592 $109,667
Carleton 29 18.86 12.72 $132,409 $122,375
Guelph 2 58 16.50 11.07 $90,715 $96,273
McMaster 39 17.79 17.85 $72,051 $81,220
Ottawa 55 14.65 8.45 $97,586 $99,677
Queen's 41 21.37 14.37 $120,450 $116,721
Ryerson 31 16.93 12.34 $99,072 $104,079
Toronto 196 16.70 12.68 $92,756 $96,120
Waterloo 33 15.00 10.52 $94,814 $92,252
Western Ontario 69 14.94 11.30 $83,222 $85,196
Windsor 24 20.83 13.75 $112,694 $114,183
York 61 15.25 11.16 $117,731 $117,094
Provincial total | Total provincial 656 16.70 12.14 $96,997 $100,051
Concordia 46 15.14 10.19 $88,295 $90,986
Laval 67 15.34 9.46 $79,047 $77,733
McGill 66 15.47 11.73 $84,697 $94,521
Montréal 89 17.06 11.31 $79,912 $84,861
Sherbrooke 24 17.67 12.58 $79,871 $78,336
UQÀM 3 59 13.08 17.22 $79,321 $78,346
Provincial total | Total provincial 351 15.56 11.99 $79,912 $84,578
Dalhousie 29 18.03 14.62 $102,318 $105,203
Memorial 40 17.00 12.68 $85,924 $93,013
New Brunswick 27 14.30 10.85 $84,567 $92,142
Regional total | Total régional 96 16.55 12.75 $86,986 $96,451
National total | Total national 1571 16.61 12.08 $92,000 $96,085
Note: Salary information is not published when fewer than four individuals are reported. Blank fields indicate no available data | Les données salariales ne sont pas publiées lorsqu’il y a moins de quatre individus inclus. Les champs blancs indiquent qu’il n’y a aucune donnée disponible.
38 CARL STATISTICS | STATISTIQUES DE L’ABRC 2014-2015
Table II - Salary data for administrative librarians 2015-2016 Tableau II – Données salariales des bibliothécaires administratifs, 2015-2016
Number of
staff
Nombre
d’employés
Average years
of experience
Moyenne des
années
d'expérience
Average years
in reporting
library
Moyenne des
années dans
l'institution
Median salary
Salaire médian
Average
salary
Salaire moyen
British Columbia 24 21.13 12.29 $119,496 $116,315
Simon Fraser 16 20.38 13.69 $100,598 $106,731
Victoria 10 22.60 10.99 $115,936 $116,042
Provincial total | Total provincial 50 21.18 12.48 $111,581 $113,194
Alberta 20 19.80 14.30 $132,817 $131,896
Calgary 14 19.50 10.50 $116,617 $114,810
Manitoba 25 22.88 14.80 $100,309 $110,984
Regina 4 22.25 21.00 $129,250 $119,458
Saskatchewan 10 19.90 15.30 $135,870 $143,280
Regional total | Total régional 73 20.95 14.25 $126,484 $122,336
Brock 8 19.88 12.50 $133,604 $126,200
Carleton 8 23.50 11.50 $139,939 $139,179
Guelph 11 16.27 10.64 $117,941 $106,061
McMaster 12 20.75 12.75 $106,460 $110,933
Ottawa 19 19.26 10.58 $110,643 $115,653
Queen's 10 24.00 14.90 $133,013 $130,166
Ryerson 5 16.00 12.80 $102,696 $119,503
Toronto 17 28.06 18.35 $137,898 $144,741
Waterloo 9 13.11 8.22 $98,096 $105,388
Western Ontario 15 18.13 11.47 $97,364 $103,918
Windsor 7 21.86 14.29 $113,330 $117,931
York 11 22.64 13.36 $149,034 $145,052
Provincial total | Total provincial 132 20.68 12.73 $120,538 $122,018
Concordia 10 20.78 9.67 $120,051 $117,965
Laval 16 18.00 8.94 $90,779 $92,076
McGill 25 19.08 13.00 $113,393 $118,656
Montréal 24 23.75 13.46 $101,797 $108,849
Sherbrooke 5 22.20 16.60 $90,931 $92,931
UQÀM 8 13.75 22.88 $125,127 $121,759
Provincial total | Total provincial 88 20.03 13.15 $104,388 $109,890
Dalhousie 12 24.42 19.17 $129,117 $123,347
Memorial 11 24.91 18.73 $113,450 $113,194
New Brunswick 10 20.70 15.20 $114,724 $112,550
Regional total | Total régional 33 23.45 17.82 $117,528 $116,691
National total | Total national 376 20.89 13.54 $115,731 $117,600
Note: Salary information is not published when fewer than four individuals are reported (‘–‘). Blank fields indicate no available data | Les données salariales ne sont pas publiées lorsqu’il y a moins de quatre individus inclus (‘–‘). Les champs blancs indiquent qu’il n’y a aucune donnée disponible.
CARL STATISTICS | STATISTIQUES DE L’ABRC 2014-2015 39
Table III - Salary data for non-administrative librarians 2015-2016 Tableau III – Données salariales des bibliothécaires non administratives, 2015-2016
Number of
staff
Nombre
d’employés
Average years
of experience
Moyenne des
années
d'expérience
Average years
in reporting
library
Moyenne des
années dans
l'institution
Median
salary
Salaire
médian
Average
salary
Salaire moyen
British Columbia 62 15.69 12.06 $92,754 $89,922
Simon Fraser 25 13.84 11.24 $93,537 $86,399
Victoria 22 18.23 11.72 $92,541 $95,665
Provincial total | Total provincial 109 15.78 11.81 $93,183 $90,273
Alberta 52 12.27 9.60 $87,073 $88,813
Calgary 24 22.83 16.21 $106,706 $106,503
Manitoba 34 17.44 12.21 $94,691 $90,690
Regina 16 16.19 12.13 $113,006 $111,459
Saskatchewan 27 16.30 12.07 $114,463 $112,335
Regional total | Total régional 153 16.20 11.92 $97,494 $98,524
Brock 12 13.58 7.92 $95,878 $98,645
Carleton 21 17.10 13.19 $120,438 $115,973
Guelph 25 18.92 12.76 $96,053 $99,319
McMaster 7 15.57 13.71 $76,986 $72,510
Ottawa 30 11.87 7.27 $94,077 $92,913
Queen's 29 20.31 14.34 $115,090 $114,415
Ryerson 25 17.35 12.61 $94,368 $100,860
Toronto 141 15.63 11.57 $92,675 $92,118
Waterloo 21 14.00 10.48 $86,730 $86,108
Western Ontario 39 13.97 10.64 $84,133 $82,370
Windsor 16 20.88 13.81 $117,763 $113,603
York 39 13.59 11.51 $118,680 $119,012
Provincial total | Total provincial 405 15.77 11.53 $96,053 $98,037
Concordia 31 13.34 10.55 $86,021 $83,384
Laval 38 13.47 9.61 $75,408 $72,470
McGill 39 13.08 10.49 $73,262 $78,895
Montréal 62 14.15 10.08 $79,912 $75,012
Sherbrooke 15 15.40 10.93 $79,871 $75,345
UQÀM 44 12.91 15.84 $79,321 $71,049
Provincial total | Total provincial 229 13.59 11.30 $79,047 $75,645
Dalhousie 17 13.53 11.42 $85,492 $92,397
Memorial 29 14.00 10.38 $82,865 $85,358
New Brunswick 17 10.53 8.29 $76,893 $80,137
Regional total | Total régional 63 12.94 10.10 $84,028 $85,849
National total | Total national 959 15.13 11.48 $87,001 $91,085
Note: Salary information is not published when fewer than four individuals are reported (‘–‘). Blank fields indicate no available data | Les données salariales ne sont pas publiées lorsqu’il y a moins de quatre individus inclus (‘–‘). Les champs blancs indiquent qu’il n’y a aucune donnée disponible.
40 CARL STATISTICS | STATISTIQUES DE L’ABRC 2014-2015
Table IV - Salary data for other professionals 2015-2016 Tableau IV – Données salariales d’autres professionnels, 2015-2016
Number of
staff
Nombre
d’employés
Average years
of experience
Moyenne des
années
d'expérience
Average years
in reporting
library
Moyenne des
années dans
l'institution
Median
salary
Salaire
médian
Average
salary
Salaire moyen
British Columbia
Simon Fraser 18 18.88 12.24 $79,471 $75,634
Victoria 9 15.33 7.93 $72,886 $69,815
Provincial total | Total provincial 27 17.65 10.74 $79,471 $73,695
Alberta 2 38.00 28.50 $114,362 $114,362
Calgary 25 14.28 9.24 $95,000 $94,951
Manitoba
Regina 6 12.80 6.20 $74,188 $75,161
Saskatchewan 23 13.65 8.22 $78,605 $79,212
Regional total | Total régional 56 14.75 9.24 $86,593 $87,060
Brock
Carleton
Guelph 22 13.86 9.36 $76,958 $87,917
McMaster 20 16.80 22.35 $64,847 $66,441
Ottawa 6 14.00 7.67 $76,909 $82,910
Queen's 2 23.50 12.00 – –
Ryerson 1 12.00 4.00 – –
Toronto 38 15.61 14.26 $83,962 $89,216
Waterloo 3 27.67 17.67 – –
Western Ontario 15 14.27 12.87 $71,584 $73,822
Windsor 1 13.00 9.00 – –
York 11 13.73 7.73 $73,871 $82,333
Provincial total | Total provincial 119 15.45 13.52 $78,277 $82,536
Concordia 5 15.40 9.00 $88,505 $84,161
Laval 13 17.54 9.69 $81,576 $75,465
McGill 2 17.00 20.00 – –
Montréal 3 23.67 19.67 – –
Sherbrooke 4 20.50 13.75 $79,871 $71,308
UQÀM 7 13.43 19.43 $79,321 $74,595
Provincial total | Total provincial 34 17.24 13.56 $80,724 $79,230
Dalhousie
Memorial
New Brunswick
Regional total | Total régional
National total | Total national 236 15.79 12.21 $79,871 $82,121
Note: Salary information is not published when fewer than four individuals are reported (‘–‘). Blank fields indicate no available data | Les données salariales ne sont pas publiées lorsqu’il y a moins de quatre individus inclus (‘–‘). Les champs blancs indiquent qu’il n’y a aucune donnée disponible.
CARL STATISTICS | STATISTIQUES DE L’ABRC 2014-2015 41
Table V - Salary distribution for all professionals 2015-2016
>$115 000
$114 999
–
$110 000
$109 999
–
$105 000
$104 999
–
$100 000
$99 999
–
$95 000
$94 999
–
$90 000
$89 999
–
$85 000
$84 999
–
$80 000
British Columbia 17 2 6 6 14 12 11 5
Simon Fraser 1 4 8 13 4 3 2
Victoria 6 6 3 4 2 8 2
Alberta 26 2 3 2 7 7 2 5
Calgary 17 5 4 4 11 5 8 4
Manitoba 15 4 4 9 6 3 5
Regina 9 3 2 2 1 3 1 1
Saskatchewan 22 3 1 2 1 6 4 8
Brock 8 1 2 2 1 1 1
Carleton 19 2 2 1 1 1
Guelph 17 2 3 1 4 4 2 2
McMaster 5 1 2 3 1 4
Ottawa 12 5 2 5 6 3 6 3
Queen's 23 3 2 4 2 4 2
Ryerson 9 1 1 4 3 3 3 3
Toronto 45 10 9 20 4 21 10 21
Waterloo 3 1 4 1 6 4 5 1
Western Ontario 2 2 3 3 7 3 10 10
Windsor 11 3 3 3 1 1
York 39 3 2 2 4 3
Concordia 9 4 2 2 5 5 2
Laval 2 3 2 1 1 24
McGill 16 1 2 1 1 5 6 4
Montréal 5 6 1 1 11 2 2
Sherbrooke 2 3
UQÀM 7 1 1 2
Dalhousie 10 2 1 3 2 2 1 2
Memorial 10 2 2 1 5 8
New Brunswick 5 2 3 1 1 1 3
National total | Total national 370 78 63 87 115 115 102 127
Note: Blank fields indicate no available data | Les champs blancs indiquent qu’il n’y a aucune donnée disponible.
42 CARL STATISTICS | STATISTIQUES DE L’ABRC 2014-2015
Tableau V – Répartition salariale de tous les professionnels, 2015-2016
$79 999
–
$75 000
$74 999
–
$70 000
$69 999
–
$65 000
$64 999
–
$60 000
$59 999
–
$55 000
$54 999
–
$50 000
$49 999
–
$45 000
< $45 000
British Columbia 2 2 3 2 4
Simon Fraser 14 2 2 5 1
Victoria 1 4 1 1 1 1 1
Alberta 5 3 4 2 6
Calgary 1 2 2
Manitoba 2 4 2 1 4
Regina 2 1 1
Saskatchewan 4 1 5 1 1 1
Brock 3 1
Carleton 1 1 1
Guelph 5 7 2 3 5 1
McMaster 2 4 4 5 4 2 1 1
Ottawa 4 6 2 1
Queen's 1
Ryerson 2 1 1
Toronto 6 10 18 10 9 1 2
Waterloo 1 4 1 1 1
Western Ontario 11 5 8 4 1
Windsor 1 1
York 5 2 1
Concordia 1 4 3 3 4 2
Laval 6 7 7 5 5 4
McGill 5 9 4 5 3 4
Montréal 36 12 4 5 4
Sherbrooke 14 2 1 1 1
UQÀM 24 4 6 4 3 3 2 2
Dalhousie 1 3 2
Memorial 4 4 2 2
New Brunswick 1 2 6 1 1
National total | Total national 158 109 93 65 57 20 5 7
Note: Blank fields indicate no available data | Les champs blancs indiquent qu’il n’y a aucune donnée disponible.
CARL STATISTICS | STATISTIQUES DE L’ABRC 2014-2015 43
Table VI - Average and median salary per year of professional experience, Librarian positions only 2015-2016
< 7 years | ans 7 – 13 years | ans 14 – 20 years | ans
# Average
Moyenne
Median
Médiane #
Average
Moyenne
Median
Médiane #
Average
Moyenne
Median
Médiane
British Columbia 15 $65,000 $71,072 27 $91,847 $92,254 11 $102,043 $102,779
Regional total | Total régional 18 $69,938 $71,557 24 $84,625 $83,278 24 $96,330 $96,837
National total | Total national 263 $68,302 $71,870 354 $87,584 $89,859 266 $101,579 $104,250
Note: Salary information is not published when fewer than four individuals are reported (‘–‘). Blank fields indicate no available data | Les données salariales ne sont pas publiées lorsqu’il y a moins de quatre individus inclus (‘–‘). Les champs blancs indiquent qu’il n’y a aucune donnée disponible.
44 CARL STATISTICS | STATISTIQUES DE L’ABRC 2014-2015
Tableau VI – Salaires moyens et médians par années d’expériences professionnelles, bibliothécaires seulement, 2015-2016
21 – 27 years | ans 28 – 34 years | ans 35+ years | ans
# Average
Moyenne
Median
Médiane #
Average
Moyenne
Median
Médiane #
Average
Moyenne
Median
Médiane
British Columbia 13 $99,674 $105,876 12 $118,696 $121,410 8 $105,816 $105,742
Memorial 6 $114,470 $114,860 4 $119,567 $120,077 3 – –
New Brunswick 3 – – 2 – – 1 – –
Regional total | Total régional 12 $112,863 $112,392 10 $125,928 $121,575 8 $137,980 $135,501
National total | Total national 199 $110,983 $111,086 147 $125,684 $123,574 106 $122,858 $121,268
Note: Salary information is not published when fewer than four individuals are reported (‘–‘). Blank fields indicate no available data | Les données salariales ne sont pas publiées lorsqu’il y a moins de quatre individus inclus (‘–‘). Les champs blancs indiquent qu’il n’y a aucune donnée disponible.
CARL STATISTICS | STATISTIQUES DE L’ABRC 2014-2015 45
Salary Questionnaire You can submit your data using the WEB form (one by one) or by EMAIL using a spreadsheet like Excel or CSV format. Please follow the example below.
Staff ID Salary July 1 2015
Category of the position
Years of professional experience
Years of professional experience in the reporting institution
EXAMPLE You can also enter your data on a spreadsheet using Excel or Quattro. Please use the following model. Please Email your spreadsheet as an attachment to: [email protected]
Institution Staff ID Salary
July 1 2015 Category of the
position
Years of professional experience
Years of professional experience in the
reporting institution
University of Ottawa 1 NON-ADMIN
University of Ottawa 2 ADMIN
University of Ottawa 3 OTHER
University of Ottawa 4
University of Ottawa 5
University of Ottawa 6
Questionnaire sur les salaires Vous pouvez soumettre vos données en utilisant le formulaire WEB ou par courriel en utilisant une feuille de calcul tel Excel ou en format CSV, veuillez suivre l'exemple ci-dessous.
No d'identification
Salaire au 1er juillet
2015 Catégorie du poste
Années d'expérience
professionnelle
Années d'expérience professionnelle dans l'institution
EXEMPLE Vous pouvez aussi saisir vos données en utilisant une feuille de calcul Excel ou Quattro, Veuillez suivre le modèle ci-dessous, Veuillez envoyer par courrier électronique votre chiffrier comme annexe à: [email protected]
46 CARL STATISTICS | STATISTIQUES DE L’ABRC 2014-2015
Endnotes to Salaries Questionnaire Notes finales du questionnaire sur les salaires 1 Note that UBC reports librarian salaries only. 2 Notes:
a. All salaries include stipends per CARL instructions.
b. Salaries listed represent the Library specific contribution, (certain positions are shared with other Univ of Guelph cost centre and salaries have been annualized to reflect Full FTE) Actual expenditure incurred by Library is lower than total represented in this survey.
c. "Professional experience" and "experience with the reporting institution" numbers are transcribed from previous year's data files for employees recorded in previous CARL summaries. New employee data experience was collected from Human Resource documentation.
d. Four positions have individuals working a reduced workload and the salary's for those positions are reported according to the % FTE of the reduced workload. 3 Lorsque 0 est indiqué, c’est que l’employé a travaillé de façon temporaire, moins de 6 mois.
CARL STATISTICS | STATISTIQUES DE L’ABRC 2014-2015 47
SECTION E
Ratios
Ratios
2014-2015
CARL STATISTICS | STATISTIQUES DE L’ABRC 2014-2015 49
Table I - Ratio of library personnel to university enrolment Tableau I – Ratio d’employés de la bibliothèque comparé aux inscriptions universitaires Overview | Aperçu : Ratios 2014-2015
Total
librarians
Nombre de
bibliothécaires
Total library
personnel
Personnel de
la
bibliothèque
Total (FTE)
student
enrolment
Étudiants
inscrits (EPT)
Ratio
Students/
librarian
Étudiants/
bibliothécaire
Students/
library
personnel
Étudiants/
personnel de la
bibliothèque
British Columbia 87.1 317.7 52,343 601.0 164.8
Simon Fraser 50.6 157.1 26,232 518.9 167.0
Victoria 31.0 137.8 18,367 592.5 133.3
Provincial average | Moyenne provinciale 56.2 204.2 32,314 574.8 158.2
Alberta 66.0 206.0 38,681 586.1 187.8
Calgary 54.0 236.6 28,443 526.7 120.2
Manitoba 63.0 187.0 23,861 378.7 127.6
Regina 21.0 69.4 11,821 562.9 170.3
Saskatchewan 42.4 138.2 19,178 452.8 138.8
Regional average | Moyenne régionale 49.3 167.4 24,397 495.2 145.7
Brock 20.0 53.0 17,217 860.9 324.8
Carleton 28.6 137.8 25,459 890.2 184.8
Guelph 27.0 125.0 20,907 774.3 167.3
McMaster 23.0 130.4 28,155 1,224.1 215.9
Ottawa 46.0 162.0 37,862 823.1 233.7
Queen's 40.0 128.0 30,375 759.4 237.3
Ryerson 29.0 91.0 30,924 1,066.3 339.8
Toronto 179.0 650.0 73,984 413.3 113.8
Waterloo 31.0 152.0 33,670 1,086.1 221.5
Western Ontario 49.0 176.0 31,766 648.3 180.5
Windsor 24.0 89.0 15,215 634.0 171.0
York 52.0 188.0 52,879 1,016.9 281.3
Provincial average | Moyenne provinciale 45.7 173.5 33,201 726.2 191.3
Concordia 40.0 119.4 27,550 688.8 230.7
Laval 51.0 215.0 34,284 672.2 159.5
McGill 63.0 185.0 30,536 484.7 165.1
Montréal 87.0 266.0 39,717 456.5 149.3
Sherbrooke 21.9 78.5 18,899 863.0 240.8
UQÀM 47.2 164.5 28,357 601.2 172.4
Provincial average | Moyenne provinciale 51.7 171.4 29,891 578.4 174.4
Dalhousie 27.0 129.0 16,279 602.9 126.2
Memorial 44.5 177.1 15,180 341.1 85.7
New Brunswick 19.7 90.2 7,835 398.5 86.9
Regional average | Moyenne régionale 30.4 132.1 13,098 431.0 99.2
National average | Moyenne nationale 47.1 170.9 28,827 612.5 168.7
50 CARL STATISTICS | STATISTIQUES DE L’ABRC 2014-2015
Table II – Ratio of material expenditures and library expenditures to university expenditures Tableau II – Ratio des dépenses des documents et les dépenses de la bibliothèque comparés aux dépenses de l’université Overview | Aperçu : Ratios 2014-2015
Total material
expenditures
Dépenses
documentaires
totales
Total library
expenditures
Dépenses
totales des
bibliothèques
Total university
general operating
expenditures (in
$,000’s)
Dépenses
universitaires
totales en
fonctionnement
général (en 1000$)
Ratio (%)
Material
expenditures/
university
expenditures
Dépenses
documentaires/
dépenses
universitaires
Library
expenditures/
university
expenditures
Dépenses des
bibliothèques/
dépenses
universitaires
British Columbia $18,125,903 $44,254,225 $1,289,007k 1.41% 3.43%
Simon Fraser $9,716,127 $23,144,153 $449,988k 2.16% 5.14%
Victoria $7,885,829 $18,245,601 $328,331k 2.40% 5.56%
Provincial average | Moyenne provinciale $11,909,286 $28,547,993 $689,109k 1.73% 4.14%
Alberta $21,528,257 $44,319,792 $1,044,080k 2.06% 4.24%
Memorial $9,351,174 $22,486,761 $494,370k 1.89% 4.55%
New Brunswick $4,134,803 $9,594,286 $227,876k 1.81% 4.21%
Regional average | Moyenne régionale $7,189,377 $16,782,653 $388,754k 1.85% 4.32%
National average | Moyenne nationale $10,518,844 $25,308,586 $579,277k 1.82% 4.37%
CARL STATISTICS | STATISTIQUES DE L’ABRC 2014-2015 51
Table III - Ratio of material expenditures and library holdings to university enrolment Tableau III – Ratio des dépenses sur les documents et les ressources documentaires comparés aux inscriptions universitaires Overview | Aperçu : Ratios 2014-2015
Total material
expenditures
Dépenses
documentaires
totales
Titles held
(all formats)
Titres
détenus (tous
formats)
Total (FTE)
student
enrolment
Étudiants
inscrits (EPT)
Ratio
Material
expenditures/
student
Dépenses
documentaires/
étudiants
Titles held/
student
Titres détenus/
étudiant
British Columbia $18,125,903 5,876,629 52,343 $346.29 $112.27
Simon Fraser $9,716,127 2,479,365 26,232 $370.39 $94.52
Victoria $7,885,829 3,674,071 18,367 $429.35 $200.04
Provincial average | Moyenne provinciale $11,909,286 4,010,022 32,314 $368.55 $124.10
Alberta $21,528,257 4,751,313 38,681 $556.56 $122.83
National average | Moyenne nationale 10,865 29,109 0.37 10,068 27,797 0.35
CARL STATISTICS | STATISTIQUES DE L’ABRC 2014-2015 53
Tableau IV – Prêts entre bibliothèques et livraison des documents, total des emprunts comparés aux inscriptions universitaires Overview | Aperçu : Ratios 2014-2015
2013-2014 2014-2015
Total
borrowing
Emprunts
Enrolment
Inscriptions
Ratio per
student
Ratio par
étudiant
Total
borrowing
Emprunts
Enrolment
Inscriptions
Ratio per
student
Ratio par
étudiant
British Columbia 7,898 50,808 0.16 7,609 52,343 0.15
National average | Moyenne nationale 40,748 28,909 1.41 41,025 28,752 1.43
* Excluding Ryerson, which had incomplete data for informational transactions | En excluant Ryerson qui avait des données incomplètes concernant les transactions de référence.
58 CARL STATISTICS | STATISTIQUES DE L’ABRC 2014-2015
Table VII - Summary of changes in ratio of library personnel to university enrolment Overview | Aperçu : Ratios 2014-2015
% of change in
student enrolment
Variation étudiants
inscrits (%)
2011-2015
Ratio students/
librarian
Ratio étudiants/
bibliothécaires
2011-2012
Ratio students/
librarian
Ratio étudiants/
bibliothécaires
2014-2015
% of change in
ratio students/
librarian
Variation du ratio
étudiants/
bibliothécaires (%)
2011-2015
British Columbia 15.21% 476.54 600.95 26.11%
Simon Fraser 11.92% 523.89 518.93 -0.95%
Victoria 10.33% 520.22 592.48 13.89%
Provincial average | Moyenne provinciale 13.36% 496.97 574.81 15.66%
Alberta 6.72% 421.48 586.08 39.05%
Calgary -2.87% 552.49 526.72 -4.66%
Manitoba -12.51% 478.47 378.75 -20.84%
Regina 9.83% 572.50 562.90 -1.68%
Saskatchewan -4.12% 470.41 452.85 -3.73%
Regional average | Moyenne régionale -1.28% 480.21 495.17 3.11%
Brock -12.71% 939.24 860.85 -8.35%
Carleton 9.45% 942.89 890.17 -5.59%
Guelph -0.80% 726.72 774.33 6.55%
McMaster 7.74% 1,077.65 1,224.13 13.59%
Ottawa 7.12% 785.49 823.09 4.79%
Queen's 24.78% 640.61 759.38 18.54%
Ryerson 31.29% 774.80 1,066.34 37.63%
Toronto -2.79% 461.25 413.32 -10.39%
Waterloo 5.64% 1,138.25 1,086.13 -4.58%
Western Ontario 7.60% 536.78 648.29 20.77%
Windsor 12.32% 588.96 633.96 7.64%
York -2.99% 991.04 1,016.90 2.61%
Provincial average | Moyenne provinciale 5.12% 704.03 726.24 3.15%
Concordia -16.06% 887.05 688.75 -22.36%
Laval 9.75% 589.42 672.24 14.05%
McGill -19.29% 591.17 484.70 -18.01%
Montréal 9.94% 415.25 456.52 9.94%
Sherbrooke 6.19% 808.95 862.97 6.68%
UQÀM -53.25% 1,348.04 601.17 -55.40%
Provincial average | Moyenne provinciale -17.16% 702.86 578.40 -17.71%
Dalhousie -5.60% 638.67 602.91 -5.60%
Memorial 1.00% 341.59 341.12 -0.14%
New Brunswick 7.04% 385.26 398.52 3.44%
Regional average | Moyenne régionale -0.76% 439.93 431.04 -2.02%
National average | Moyenne nationale -0.97% 618.10 612.51 -0.90%
CARL STATISTICS | STATISTIQUES DE L’ABRC 2014-2015 59
Tableau VII – Résumé des variations des ratios d’employés de bibliothèque comparés aux inscriptions universitaires Overview | Aperçu : Ratios 2014-2015
% of change in
student enrolment
Variation étudiants
inscrits (%)
2011–2015
Ratio students/
library
personnel
Ratio étudiants/
personnel de la
bibliothèque
2011–2012
Ratio students/
library personnel
Ratio étudiants/
personnel de la
bibliothèque
2014– 2015
% of change in
ratio students/
personnel
Variation ratio
étudiants/
personnel de la
bibliothèque (%)
2011– 2015
British Columbia 15.21% 134.81 164.76 22.22%
Simon Fraser 11.92% 158.52 166.98 5.33%
Victoria 10.33% 114.37 133.29 16.55%
Provincial average | Moyenne provinciale 13.36% 135.65 158.25 16.66%
Alberta 6.72% 120.02 187.77 56.45%
Calgary -2.87% 119.52 120.22 0.58%
Manitoba -12.51% 137.05 127.60 -6.90%
Regina 9.83% 159.93 170.33 6.51%
Saskatchewan -4.12% 136.17 138.77 1.91%
Regional average | Moyenne régionale -1.28% 128.69 145.70 13.22%
Brock -12.71% 328.19 324.85 -1.02%
Carleton 9.45% 162.30 184.75 13.83%
Guelph -0.80% 171.34 167.26 -2.38%
McMaster 7.74% 185.35 215.91 16.49%
Ottawa 7.12% 209.15 233.72 11.74%
Queen's 24.78% 180.32 237.30 31.60%
Ryerson 31.29% 236.72 339.82 43.55%
Toronto -2.79% 120.80 113.82 -5.78%
Waterloo 5.64% 216.99 221.51 2.09%
Western Ontario 7.60% 168.70 180.49 6.99%
Windsor 12.32% 171.47 170.96 -0.30%
York -2.99% 259.30 281.27 8.47%
Provincial average | Moyenne provinciale 5.12% 179.45 191.34 6.63%
Concordia -16.06% 241.54 230.74 -4.47%
Laval 9.75% 142.00 159.46 12.30%
McGill -19.29% 176.80 165.06 -6.64%
Montréal 9.94% 130.89 149.31 14.07%
Sherbrooke 6.19% 208.44 240.75 15.50%
UQÀM -53.25% 354.35 172.38 -51.35%
Provincial average | Moyenne provinciale -17.16% 196.36 174.39 -11.19%
Dalhousie -5.60% 135.23 126.19 -6.68%
Memorial 1.00% 78.00 85.71 9.89%
New Brunswick 7.04% 77.33 86.86 12.33%
Regional average | Moyenne régionale -0.76% 95.43 99.15 3.89%
National average | Moyenne nationale -0.97% 161.72 168.66 4.29%
60 CARL STATISTICS | STATISTIQUES DE L’ABRC 2014-2015
Table VIII - Summary of changes in ratio of library expenditures to university expenditures Overview | Aperçu : Ratios 2014-2015
% of change in
university
expenditures
Variation des
dépenses
universitaires (%)
2011-2015
Material
expenditures
Dépenses
documentaires
2011-2012
Material
expenditures
Dépenses
documentaires
2014-2015
% of change in
material
expenditures
Variation des
dépenses
documentaires (%)
2011-2015
British Columbia 26.70% $20,516,366 $18,125,903 -11.65%
Simon Fraser 3.55% $8,109,902 $9,716,127 19.81%
Victoria 9.35% $7,220,704 $7,885,829 9.21%
Provincial average | Moyenne provinciale 17.99% $11,948,991 $11,909,286 -0.33%
Regional average | Moyenne régionale 12.53% $11,206,821 $12,466,955 11.24%
Brock 8.82% $2,559,069 $3,093,179 20.87%
Carleton 10.97% $5,277,751 $5,500,255 4.22%
Guelph 7.24% $6,856,734 $7,834,605 14.26%
McMaster 9.41% $9,236,187 $10,425,242 12.87%
Ottawa 15.71% $13,252,403 $15,165,566 14.44%
Queen's 14.59% $9,959,284 $9,828,515 -1.31%
Ryerson 21.40% $3,963,806 $4,653,291 17.39%
Toronto 9.29% $27,475,241 $31,449,135 14.46%
Waterloo 25.81% $7,672,883 $8,499,060 10.77%
Western Ontario 0.30% $13,289,917 $14,602,933 9.88%
Windsor 7.32% $4,456,804 $4,895,700 9.85%
York 4.20% $10,971,374 $11,133,173 1.47%
Provincial average | Moyenne provinciale 10.66% $9,580,954 $10,590,055 10.53%
Concordia 12.13% $4,914,341 $5,971,119 21.50%
Laval 9.18% $12,389,257 $12,633,669 1.97%
McGill 14.09% $17,743,408 $18,851,349 6.24%
Montréal 7.82% $11,066,645 $10,264,944 -7.24%
Sherbrooke 5.25% $4,679,797 $5,431,682 16.07%
UQÀM 18.60% $5,031,883 $5,182,306 2.99%
Provincial average | Moyenne provinciale 10.99% $9,304,222 $9,722,512 4.50%
Dalhousie 20.47% $6,530,706 $8,082,154 23.76%
Memorial 16.29% $8,143,614 $9,351,174 14.83%
New Brunswick 12.25% $3,160,865 $4,134,803 30.81%
Regional average | Moyenne régionale 17.01% $5,945,062 $7,189,377 20.93%
National average | Moyenne nationale 12.34% $9,672,864 $10,518,844 8.75%
CARL STATISTICS | STATISTIQUES DE L’ABRC 2014-2015 61
Tableau VIII – Résumé des variations des ratios de dépenses des bibliothèques comparés aux dépenses universitaires Overview | Aperçu : Ratios 2014-2015
% of change in
university
expenditures
Variation des
dépenses
universitaires (%)
2011-2015
Library
expenditures
Dépenses des
bibliothèques
2011-2012
Library
expenditures
Dépenses des
bibliothèques
2014-2015
% of change in
library expenditures
Variation des
dépenses des
bibliothèques (%)
2014-2015
British Columbia 26.70% $44,091,763 $44,254,225 0.37%
Simon Fraser 3.55% $19,179,416 $23,144,153 20.67%
Victoria 9.35% $16,479,931 $18,245,601 10.71%
Provincial average | Moyenne provinciale 17.99% $26,583,703 $28,547,993 7.39%
Regional average | Moyenne régionale 12.53% $25,572,107 $28,494,950 11.43%
Brock 8.82% $7,075,026 $8,146,829 15.15%
Carleton 10.97% $14,794,853 $16,922,867 14.38%
Guelph 7.24% $14,668,989 $18,809,202 28.22%
McMaster 9.41% $19,057,865 $21,705,922 13.89%
Ottawa 15.71% $24,387,066 $30,818,951 26.37%
Queen's 14.59% $19,157,480 $20,987,855 9.55%
Ryerson 21.40% $11,237,508 $13,665,326 21.60%
Toronto 9.29% $68,280,260 $93,940,060 37.58%
Waterloo 25.81% $16,473,344 $20,319,005 23.34%
Western Ontario 0.30% $23,020,039 $27,630,371 20.03%
Windsor 7.32% $10,054,208 $12,453,248 23.86%
York 4.20% $26,413,760 $29,870,212 13.09%
Provincial average | Moyenne provinciale 10.66% $21,218,367 $26,272,487 23.82%
Concordia 12.13% $13,768,363 $16,810,801 22.10%
Laval 9.18% $24,127,646 $28,163,259 16.73%
McGill 14.09% $32,288,903 $34,109,498 5.64%
Montréal 7.82% $28,868,133 $32,088,960 11.16%
Sherbrooke 5.25% $8,776,129 $11,365,887 29.51%
UQÀM 18.60% $14,718,963 $17,674,069 20.08%
Provincial average | Moyenne provinciale 10.99% $20,424,690 $23,368,746 14.41%
Dalhousie 20.47% $14,447,236 $18,266,912 26.44%
Memorial 16.29% $20,829,614 $22,486,761 7.96%
New Brunswick 12.25% $8,636,318 $9,594,286 11.09%
Regional average | Moyenne régionale 17.01% $14,637,723 $16,782,653 14.65%
National average | Moyenne nationale 12.34% $21,679,081 $25,308,586 16.74%
62 CARL STATISTICS | STATISTIQUES DE L’ABRC 2014-2015
Table IX - Summary of changes in ratio of material expenditures and library holdings to university enrolment Overview | Aperçu : Ratios 2014-2015
% of change in
student enrolment
Variation en % aux
inscriptions
2011-2015
Material
expenditures/
student
Dépenses
documentaires
par étudiant
2011-2012
Material
expenditures/
student
Dépenses
documentaires
par étudiant
2014-2015
% of change in
material
expenditures/
student
Variation dépenses
documentaires par
étudiant (%)
2011-2015
British Columbia 15.21% 451.57 346.29 -23.31%
Simon Fraser 11.92% 346.00 370.39 7.05%
Victoria 10.33% 433.75 429.35 -1.02%
Provincial average | Moyenne provinciale 13.36% 419.17 368.55 -12.08%
Alberta 6.72% 515.63 556.56 7.94%
Calgary -2.87% 421.61 490.99 16.46%
Manitoba -12.51% 384.93 421.23 9.43%
Regina 9.83% 302.20 277.39 -8.21%
Saskatchewan -4.12% 562.31 704.52 25.29%
Regional average | Moyenne régionale -1.28% 453.47 511.01 12.69%
Brock -12.71% 129.74 179.66 38.47%
Carleton 9.45% 226.89 216.04 -4.78%
Guelph -0.80% 325.35 374.74 15.18%
McMaster 7.74% 353.43 370.28 4.77%
Ottawa 7.12% 374.92 400.55 6.83%
Queen's 24.78% 409.12 323.57 -20.91%
Ryerson 31.29% 168.29 150.48 -10.58%
Toronto -2.79% 361.01 425.08 17.75%
Waterloo 5.64% 240.75 252.42 4.85%
Western Ontario 7.60% 450.15 459.70 2.12%
Windsor 12.32% 329.01 321.77 -2.20%
York -2.99% 201.28 210.54 4.60%
Provincial average | Moyenne provinciale 5.12% 303.36 318.97 5.14%
Concordia -16.06% 149.73 216.74 44.75%
Laval 9.75% 396.60 368.50 -7.08%
McGill -19.29% 468.97 617.35 31.64%
Montréal 9.94% 306.33 258.45 -15.63%
Sherbrooke 6.19% 262.95 287.41 9.30%
UQÀM -53.25% 82.95 182.75 120.32%
Provincial average | Moyenne provinciale -17.16% 257.88 325.27 26.13%
Dalhousie -5.60% 378.72 496.49 31.09%
Memorial 1.00% 541.82 616.02 13.69%
New Brunswick 7.04% 431.81 527.73 22.21%
Regional average | Moyenne régionale -0.76% 450.45 548.90 21.85%
National average | Moyenne nationale -0.97% 332.30 364.90 9.81%
CARL STATISTICS | STATISTIQUES DE L’ABRC 2014-2015 63
Tableau IX – Résumé des variations de ratios des dépenses documentaires et des collections comparées aux inscriptions universitaires Overview | Aperçu : Ratios 2014-2015
% of change in
student
enrolment
Variation en %
aux inscriptions
2011-2015
Total monograph &
serial titles/student
Nombre de titres
monographiques et
périodiques par
étudiant
2011-2012
Titles held (all
formats)/students
Titres détenus
(tous formats) par
étudiants
2014-2015*
% of change in
titles per student
Variation nombre
de titres par
étudiants (%)
2011-2015*
British Columbia 15.21% 106.46 112.27 5.46%
Simon Fraser 11.92% 82.66 94.52 14.34%
Victoria 10.33% 124.97 200.04 60.07%
Provincial average | Moyenne provinciale 13.36% 103.54 124.10 19.85%
Alberta 6.72% 106.19 122.83 15.67%
Calgary -2.87% 93.27 114.76 23.04%
Manitoba -12.51% 83.24 64.57 -22.43%
Regina 9.83% 91.29 130.12 42.53%
Saskatchewan -4.12% 85.59 110.28 28.84%
Regional average | Moyenne régionale -1.28% 93.43 108.29 15.90%
Brock -12.71% 39.80 46.53 16.91%
Carleton 9.45% 74.68 81.47 9.09%
Guelph -0.80% 76.33 96.32 26.19%
McMaster 7.74% 69.66 72.38 3.90%
Ottawa 7.12% 63.85 81.03 26.92%
Queen's 24.78% 3.63 94.92 2518.21%
Ryerson 31.29% 31.17 34.31 10.07%
Toronto -2.79% 98.42 111.72 13.51%
Waterloo 5.64% 59.12 67.66 14.44%
Western Ontario 7.60% 117.05 127.26 8.72%
Windsor 12.32% 175.96 128.13 -27.18%
York -2.99% 52.59 72.56 37.98%
Provincial average | Moyenne provinciale 5.12% 71.53 86.12 20.39%
Concordia -16.06% 60.23 U/A –
Laval 9.75% 92.35 60.71 -34.26%
McGill -19.29% 129.86 161.58 24.43%
Montréal 9.94% 50.03 57.45 14.84%
Sherbrooke 6.19% 3.52 53.24 1411.44%
UQÀM -53.25% 1.66 43.34 2510.71%
Provincial average | Moyenne provinciale -17.16% 54.26 75.97 42.83%
Dalhousie -5.60% 75.90 97.38 28.30%
Memorial 1.00% 168.73 170.24 0.89%
New Brunswick 7.04% 212.62 249.20 17.21%
Regional average | Moyenne régionale -0.76% 136.42 155.80 14.21%
National average | Moyenne nationale -0.97% 76.60 95.50 23.61%
* Excluding Concordia, which had incomplete data for titles held | En excluant Concordia qui avait des données incomplètes concernant les titres détenus.
Note: The percent change is significant for some institutions due to missing data in calculating the total monograph & serial titles. | La variation en pourcentage est significative pour certains établissements parce qu’il manquait certaines données pour calculer le nombre de titres monographiques et périodiques.
64 CARL STATISTICS | STATISTIQUES DE L’ABRC 2014-2015
Endnotes to Ratios Notes finales des ratios Enrolment data | Données d’inscriptions
2010-2011: CARL Statistical Survey of Canadian University Libraries | Enquête statistique des bibliothèques universitaires canadiennes
2011-2012: CARL Statistical Survey of Canadian University Libraries | Enquête statistique des bibliothèques universitaires canadiennes
2012-2013: CARL Statistical Survey of Canadian University Libraries | Enquête statistique des bibliothèques universitaires canadiennes
2014-2015: CARL Statistical Survey of Canadian University Libraries | Enquête statistique des bibliothèques universitaires canadiennes
Financial data | Données financières
2010-2011: CAUBO - Financial Statistics of Universities and Colleges, Table 2.2C - Expenditures by Fund: by Province and by University (in $’000 and in %) | ACPAU Information financière des universités et collèges 2010-2011, Tableau 2.2C Dépenses par fonds: par province et par université (en 000 $ et en %)
2014-2015 : CAUBO - Financial Statistics of Universities and Colleges 2013 - 2014, Table 2.2C - Expenditures by Fund: by Province and by University, (in $’000 and in %) | ACPAU Information financière des universités et collèges 2014-2015, Tableau 2.2C Dépenses par fonds: par province et par université (en 000 $ et en %)
Library data | Données des bibliothèques
CARL Statistics | Statistiques de l’ABRC
2010–2011
Expenditures and Collection Size, Table VIII - Summary of library personnel (FTE) | Dépenses et les collections, Tableau VIII - Sommaire du personnel de la bibliothèque (EPT)
Expenditures and Collection Size, Table VII - Summary of library expenditures, | Dépenses et les collections, Tableau VII -Sommaire de dépenses de la bibliothèque
Use, Facilities, and Services, Table I – Collections use and facilities | Utilisation, Installations et Services, Tableau I - Documentation et installations.
Use, Facilities, and Services, Table II – Document Delivery Traffic | Utilisation, Installations et Services, Tableau II – Livraison des documents : achalandage
2011-2012
Expenditures and Collection Size, Table VIII - Summary of library personnel (FTE) | Dépenses et les collections, Tableau VIII - Sommaire du personnel de la bibliothèque (EPT)
Expenditures and Collection Size, Table VII - Summary of library expenditures, | Dépenses et les collections, Tableau VII -Sommaire de dépenses de la bibliothèque
Use, Facilities, and Services, Table I – Collections use and facilities | Utilisation, Installations et Services, Tableau I - Documentation et installations.
Use, Facilities, and Services, Table II – Document Delivery Traffic | Utilisation, Installations et Services, Tableau II – Livraison des documents : achalandage
CARL STATISTICS | STATISTIQUES DE L’ABRC 2014-2015 65
2012-2013
Expenditures and Collection Size, Table I – Local Characteristics | Tableau I – Caractéristiques locales
Expenditures and Collection Size, Table V - Summary of library expenditures | Tableau V - Sommaire des dépenses de la bibliothèque
Expenditures and Collection Size, Table VI - Summary of library personnel (FTE) | Tableau VI – Sommaire du personnel de la bibliothèque (ETP)
Expenditures and Collection Size, Table VII – Enrolment | Tableau VII – Inscriptions
Use, Facilities, and Services, Table I – Electronic resources & Collection use | Tableau I – Ressources électroniques & Utilisation des collections
Use, Facilities, and Services, Table II – Library instruction and facility use | Tableau II – Formation et utilisation des installations
Use, Facilities, and Services, Table III – Document delivery traffic | Tableau III – Traffic de livraison de documents
2014-2015
Expenditures and Collection Size, Table I – Local Characteristics | Tableau I – Caractéristiques locales
Expenditures and Collection Size, Table V - Summary of library expenditures | Tableau V - Sommaire des dépenses de la bibliothèque
Expenditures and Collection Size, Table VI - Summary of library personnel (FTE) | Tableau VI – Sommaire du personnel de la bibliothèque (ETP)
Expenditures and Collection Size, Table VII – Enrolment | Tableau VII – Inscriptions
Use, Facilities, and Services, Table I – Electronic resources & Collection use | Tableau I – Ressources électroniques & Utilisation des collections
Use, Facilities, and Services, Table II – Library instruction and facility use | Tableau II – Formation et utilisation des installations
Use, Facilities, and Services, Table III – Document delivery traffic | Tableau III – Traffic de livraison de documents
CARL STATISTICS | STATISTIQUES DE L’ABRC 2014-2015 67
Libraries included in this 2015 Survey Bibliothèques incluses à cette enquête de 2015
University of Alberta Augustana Campus Library, Book and Record Depository (BARD), Bibliothèque Saint-Jean , Bruce Peel Special Collections Library, Cameron (Science and Technology) Library, Data Library, Herbert T. Coutts (Education and Physical Education) Library, Winspear Business Reference Library, University of Alberta Archives
University of British Columbia Asian Library, Biomedical Branch Library, David Lam Library, Dr. John Micallef Memorial Library (St. Mark's College), Education Library, H.R. MacMillan Library (Vancouver School of Theology), John Richard Allison Library (Regent College), Music, Art and Architecture Library, Okanagan Library, Rare Books & Special Collections, Robson Square Library, University Archives, Woodward Library, and Xwi7xwa Library (First Nations House of Learning)
Brock University James A. Gibson Library, Map, Data & GIS Library [as reported in 2013-2014]
University of Calgary Taylor Family Digital Library; Bennett Jones Law Library; Business Library;Doucette Library of Teaching Resources; Downtown Campus Library; Gallagher Library; Health Sciences Library; The Military Museum Library and Archives; University of Calgary in Qatar - Learning Commons
Carleton University Main library; on-site storage facility [as reported in 2013-2014]
Concordia University R. Howard Webster Library Georges P. Vanier Library
Dalhousie University Kellogg Health Sciences Library, Killam Memorial Library, Sir James Dunn Law Library, MacRae Library, Sexton Design & Technology Library
University of Guelph Main Library; TUG Storage Annex (Guelph materials only)
Université Laval Toutes incluses
Library and Archives Canada N/A
University of Manitoba Donald W. Craik Engineering Library Eckhardt‐Gramatté Music Library Elizabeth Dafoe Library Father Harold Drake Library (St. Paul's College) Sciences and Technology Library E.K. Williams Law Library St. John's College Library William R. Newman Library (Agriculture)
McGill University Humanities & Social Sciences, Islamic Studies, Marvin Duchow Music, Nahum Gelber Law, Osler (History of Science, Science & Engineering, Medicine, Religious Studies,Rare Books & Special Collections, Education, Agriculture & Environmental Sciences
68 CARL STATISTICS | STATISTIQUES DE L’ABRC 2014-2015
McMaster University Mills Memorial Library H.G. Thode Library of Science & Engineering Innis (Business) Library Health Sciences Library
Memorial University of Newfoundland
Dr. C. R. Barrett Library Ferriss Hodgett Library Health Sciences Library Queen Elizabeth II Library
Université de Montréal Aménagement Botanique Campus de Laval Cartothèque Chimie Didacthèque Droit ÉPC-Biologie Géographie Kinésiologie Lettres et sciences humaines Livres rares et collections spéciales Mathématiques et informatique Médecine vétérinaire Musique Optométrie Paramédicale Physique Santé
National Science Library Main (Ottawa) NRC Archives (Ottawa) Penticton Victoria
Université d'Ottawa Arts & Science (Morisset); Law (Fauteux): Health Sciences (Roger Guindon); Education Resource Centre (partial); Management; Music; Social Sciences; Berkman
Note: Arrangement with the Montfort Hospital Library was discontinued at the end of 2013.
Queen's University Stauffer Humanities and Social Science Douglas Engineering and Science Bracken Health Science WD Jordan Special Collections Lederman Law Education
University of Regina University of Regina Library Campion College Library Luther College Library First Nations University of Canada Library (Regina campus, Saskatoon campus and Prince Albert campus)
Ryerson University Ryerson University Library and Archives [as reported in 2012-2013]
University of Saskatchewan All 7 library branches including Education & Music, Engineering, Health Sciences, Law, Murray (Arts, Humanities, Social Sciences, and Business), Science, and Veterinary Medicine.
Université de Sherbrooke Roger-Maltais, Frère-Théode, Droit et publications gouvernementales, Musique, sciences de la santé, carrefour de l'information à Longueuil, cartothèque.
Simon Fraser University Bennett, Belzberg and Surrey(Fraser)
University of Toronto All 44 libraries within the University of Toronto Library System.
Université du Québec à Montréal (UQÀM)
Bibliothèque centrale Bibliothèque des arts Bibliothèque de musique Bibliothèque des sciences Bibliothèque des sciences de l'éducation Bibliothèque des sciences juridiques et politiques
University of Victoria McPherson Library / Mearns Centre for Learning Curriculum Library Diana M. Priestly Law Library
University of Waterloo Dana Porter Library Davis Centre Library Musagetes Architecture Library Optometry Learning Resource Centre Pharmacy Library
CARL STATISTICS | STATISTIQUES DE L’ABRC 2014-2015 69
University of Western Ontario Archives and Research Collections Centre (ARCC); C.B. "Bud" Johnston Library (Business); Education Library; John & Dotsa Bitove Family Law Library; Music Library; Allyn & Betty Taylor Library; The D.B. Weldon Library; Map & Data Centre
University of Windsor Leddy Library & Paul Martin Law Library
York University Peter F. Bronfman Library Leslie Frost Library Scott Library Steacie Science and Engineering Library