Valuentum Retail Equity Research Ratings as of 1-Aug-2021 Data as of 30-Jul-2021 Buying Index™ 6 Value Rating Economic Castle Neutral Investment Considerations DCF Valuation Relative Valuation Stock Chart (weekly) ValueCreation™ ValueRisk™ ValueTrend™ Cash Flow Generation Financial Leverage Growth Technical Evaluation Relative Strength Money Flow Index (MFI) Upside/Downside Volume (U/D) Near-term Technical Support, 10-week MA DCF = Discounted Cash Flow; MFI, U/D = Please see glossary. MA = Moving Average Business Quality ValueCreation™ ValueRisk™ Very Poor Poor Good Excellent Company Vitals Investment Highlights Market Cap (USD) $11,123 Avg Weekly Vol (30 wks) 1,456 30-week Range (USD) 143.52 - 203.22 Valuentum Sector Materials 5-week Return 5.9% 13-week Return 4.8% 30-week Return 31.8% Dividend Yield % 1.0% Firms that generate economic profits with little operating variability score near the top right of the matrix. Dividends per Share 2.10 Relative Valuation Forward P/E PEG Price / FV Forward Dividend Payout Ratio 23.5% Air Products & Chemicals 31.8 1.9 115.0% Est. Normal Diluted EPS 11.01 BHP Billiton 21.9 1.9 119.0% P/E on Est. Normal Diluted EPS 18.4 DuPont 19.8 NMF 107.2% Est. Normal EBITDA 1,077 Sherwin-Williams 30.5 3.0 118.8% Forward EV/EBITDA 13.1 Peer Median 26.2 1.9 116.9% EV/Est. Normal EBITDA 11.4 Carlisle Companies 22.7 2.2 101.6% Forward Revenue Growth (5-yr) 4.9% Price / FV = Current Stock Price divided by Estimated Fair Value Forward EPS Growth (5-yr) 15.5% Financial Summary Projected NMF = Not Meaningful; Est. = Estimated; FY = Fiscal Year Fiscal Year End: Dec-19 Dec-20 Dec-21 Returns Summary 3-year Historical Average Revenue 4,812 4,245 4,389 Return on Equity 14.9% Revenue, YoY% 7.4% -11.8% 3.4% Return on Assets 7.1% Operating Income 654 484 713 ROIC, with goodwill 10.3% Operating Margin % 13.6% 11.4% 16.3% ROIC, without goodwill 16.9% Net Income 474 324 484 ROIC = Return on Invested Capital; NMF = Not Meaningful Net Income Margin % 9.9% 7.6% 11.0% Leverage, Coverage, and Liquidity Diluted EPS 8.24 5.89 8.93 In Millions of USD Diluted EPS, YoY % 39.5% -28.5% 51.6% Total Debt 2,081 Free Cash Flow (CFO-capex) 614 601 577 Net Debt 1,179 Free Cash Flow Margin % 12.8% 14.2% 13.1% Total Debt/EBITDA 2.9 In Millions of USD (except for per share items) Net Debt/EBITDA 1.7 LARGE-C EBITDA/Interest 9.2 Structure of the Building Materials Industry POOR Current Ratio 3.4 Quick Ratio 2.5 Carlisle Companies CSL FAIRLY VALUED Low High • Carlisle Companies is a diversified manufacturing company. It operates in five segments: Construction Materials, Interconnect Technologies, Fluid Technologies, Brake & Friction, and FoodService Products. Carlisle generates four-fifths of its sales in the US. It traces its roots back to 1917 and is headquartered in Scottsdale, Arizona. EXCELLENT MEDIUM WEAK NEUTRAL $149.00 - $249.00 Estimated Fair Value Sector MODEST Very High The information and data contained in this report is not represented or warranted to be timely, complete, accurate, or correct. This report is for informational purposes only and should not be considered a solicitation to buy or sell a security. Before acting on any information in this report, you should consider whether the information is suitable for your particular circumstances and, if necessary, seek professional advice. Assumptions, opinions, and estimates are based on our judgment as of the date of the report and are subject to change without notice. Valuentum is not responsible for any errors or omissions or for results obtained from the use of this report. Redistribution is prohibited without written permission. To license Valuentum research, contact us at [email protected]. Fair Value Range We raised our fair value estimate for Carlisle Companies as its promising cash flow growth outlook is underpinned by expected cost structure improvements and the company's pricing power. Investment Style Industry $199.00 NEUTRAL LARGE-CAP CORE Materials Mining & Chemicals FAIRLY VALUED STRONG POSITIVE MEDIUM The building materials industry is made up of firms that produce a wide range of materials for use in new/remodeled housing and commercial/industrial construction projects. Demand for and the prices of building materials are very cyclical/volatile and are tied to general economic conditions, including the level of housing starts, existing home sales, and floor-space growth, all of which are beyond the control of industry participants. As a result of the housing bust, significant production overcapacity still exists for some materials, resulting in ongoing pricing pressures. We don’t like the structure of the group. BULLISH Medium • Carlisle views the growth runway of its Carlisle Construction Materials segment quite favorably. It sees this segment catering to a $10+ billion market opportunity in Europe in addition to its core market opportunities in the US and is scaling up its operations and manufacturing capabilities accordingly. • Carlisle's Vision 2025 plan involves the company boosting its EPS to $15 by 2025 through a combination of organic sales growth, M&A activity, cost structure improvements, pricing power, and strong expected growth in the various markets Carlisle caters to. Its Carlisle Operating System is expected to drive continuous efficiency improvements going forward. ----- Actual ----- • Carlisle intends to grow the presence of its Carlisle Construction Materials segment in the realm of spray foam insulation and architectural metals over the coming years, and M&A activity has been cited as a way to scale up in these areas. The week with the highest trading volume out of the last 30 weeks was a week of heavy selling, or distribution (red bar). NMF = Not Meaningful BULLISH 1 • In July 2021, Carlisle announced it was acquiring Henry Company, which makes systems that control water, vapor, air, and energy flows to optimize building sustainability, for ~$1.575 billion in cash. Material cost and cross-selling synergies are expected. 193.00 Visit us at www.valuentum.com 122.00 132.00 142.00 152.00 162.00 172.00 182.00 192.00 202.00 212.00 0 2,000,000 4,000,000 6,000,000 8,000,000 10,000,000 12,000,000 Page 1
Transcript
Valuentum Retail Equity Research Ratings as of 1-Aug-2021 Data as of 30-Jul-2021
Stock Chart (weekly) ValueCreation™ValueRisk™ValueTrend™Cash Flow GenerationFinancial LeverageGrowthTechnical EvaluationRelative StrengthMoney Flow Index (MFI)Upside/Downside Volume (U/D)Near-term Technical Support, 10-week MADCF = Discounted Cash Flow; MFI, U/D = Please see glossary. MA = Moving Average
Business Quality ValueCreation™
ValueRisk™ Very Poor Poor Good ExcellentCompany Vitals Investment HighlightsMarket Cap (USD) $11,123Avg Weekly Vol (30 wks) 1,45630-week Range (USD) 143.52 - 203.22Valuentum Sector Materials5-week Return 5.9%13-week Return 4.8%30-week Return 31.8%Dividend Yield % 1.0% Firms that generate economic profits with little operating variability score near the top right of the matrix.
Forward Dividend Payout Ratio 23.5% Air Products & Chemicals 31.8 1.9 115.0%Est. Normal Diluted EPS 11.01 BHP Billiton 21.9 1.9 119.0%P/E on Est. Normal Diluted EPS 18.4 DuPont 19.8 NMF 107.2%Est. Normal EBITDA 1,077 Sherwin-Williams 30.5 3.0 118.8%Forward EV/EBITDA 13.1 Peer Median 26.2 1.9 116.9%EV/Est. Normal EBITDA 11.4 Carlisle Companies 22.7 2.2 101.6%Forward Revenue Growth (5-yr) 4.9% Price / FV = Current Stock Price divided by Estimated Fair Value
Forward EPS Growth (5-yr) 15.5% Financial Summary ProjectedNMF = Not Meaningful; Est. = Estimated; FY = Fiscal Year
Fiscal Year End: Dec-19 Dec-20 Dec-21
Returns Summary 3-year Historical Average Revenue 4,812 4,245 4,389Return on Equity 14.9% Revenue, YoY% 7.4% -11.8% 3.4%Return on Assets 7.1% Operating Income 654 484 713ROIC, with goodwill 10.3% Operating Margin % 13.6% 11.4% 16.3%ROIC, without goodwill 16.9% Net Income 474 324 484ROIC = Return on Invested Capital; NMF = Not Meaningful Net Income Margin % 9.9% 7.6% 11.0%Leverage, Coverage, and Liquidity Diluted EPS 8.24 5.89 8.93In Millions of USD Diluted EPS, YoY % 39.5% -28.5% 51.6%Total Debt 2,081 Free Cash Flow (CFO-capex) 614 601 577Net Debt 1,179 Free Cash Flow Margin % 12.8% 14.2% 13.1%Total Debt/EBITDA 2.9 In Millions of USD (except for per share items)
Net Debt/EBITDA 1.7 LARGE-CEBITDA/Interest 9.2 Structure of the Building Materials Industry POORCurrent Ratio 3.4Quick Ratio 2.5
Carlisle Companies CSL FAIRLY VALUED
Low
High
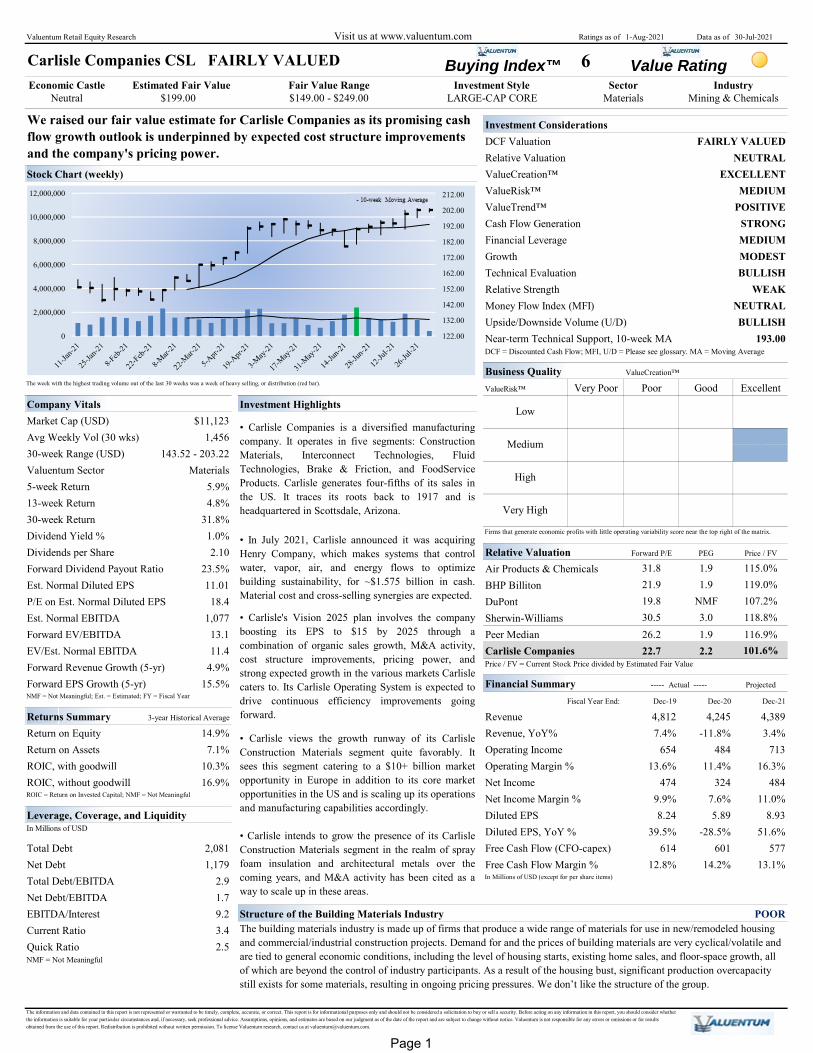
• Carlisle Companies is a diversified manufacturingcompany. It operates in five segments: ConstructionMaterials, Interconnect Technologies, FluidTechnologies, Brake & Friction, and FoodServiceProducts. Carlisle generates four-fifths of its sales inthe US. It traces its roots back to 1917 and isheadquartered in Scottsdale, Arizona.
EXCELLENTMEDIUM
WEAKNEUTRAL
$149.00 - $249.00 Estimated Fair Value Sector
MODEST
Very High
The information and data contained in this report is not represented or warranted to be timely, complete, accurate, or correct. This report is for informational purposes only and should not be considered a solicitation to buy or sell a security. Before acting on any information in this report, you should consider whether the information is suitable for your particular circumstances and, if necessary, seek professional advice. Assumptions, opinions, and estimates are based on our judgment as of the date of the report and are subject to change without notice. Valuentum is not responsible for any errors or omissions or for results obtained from the use of this report. Redistribution is prohibited without written permission. To license Valuentum research, contact us at [email protected].
Fair Value Range
We raised our fair value estimate for Carlisle Companies as its promising cash flow growth outlook is underpinned by expected cost structure improvements and the company's pricing power.
Investment Style Industry $199.00
NEUTRAL
LARGE-CAP CORE Materials Mining & Chemicals
FAIRLY VALUED
STRONGPOSITIVE
MEDIUM
The building materials industry is made up of firms that produce a wide range of materials for use in new/remodeled housing and commercial/industrial construction projects. Demand for and the prices of building materials are very cyclical/volatile and are tied to general economic conditions, including the level of housing starts, existing home sales, and floor-space growth, all of which are beyond the control of industry participants. As a result of the housing bust, significant production overcapacity still exists for some materials, resulting in ongoing pricing pressures. We don’t like the structure of the group.
BULLISH
Medium
• Carlisle views the growth runway of its CarlisleConstruction Materials segment quite favorably. Itsees this segment catering to a $10+ billion marketopportunity in Europe in addition to its core marketopportunities in the US and is scaling up its operationsand manufacturing capabilities accordingly.
• Carlisle's Vision 2025 plan involves the companyboosting its EPS to $15 by 2025 through acombination of organic sales growth, M&A activity,cost structure improvements, pricing power, andstrong expected growth in the various markets Carlislecaters to. Its Carlisle Operating System is expected todrive continuous efficiency improvements goingforward.
----- Actual -----
• Carlisle intends to grow the presence of its CarlisleConstruction Materials segment in the realm of sprayfoam insulation and architectural metals over thecoming years, and M&A activity has been cited as away to scale up in these areas.
The week with the highest trading volume out of the last 30 weeks was a week of heavy selling, or distribution (red bar).
NMF = Not Meaningful
BULLISH
1• In July 2021, Carlisle announced it was acquiringHenry Company, which makes systems that controlwater, vapor, air, and energy flows to optimizebuilding sustainability, for ~$1.575 billion in cash.Material cost and cross-selling synergies are expected.
193.00
Visit us at www.valuentum.com
122.00
132.00
142.00
152.00
162.00
172.00
182.00
192.00
202.00
212.00
0
2,000,000
4,000,000
6,000,000
8,000,000
10,000,000
12,000,000
Page 1
Valuentum Retail Equity Research (10=best) Data as of 30-Jul-2021
Buying Index™ 6 Value RatingEconomic Castle
Neutral
Economic Profit Analysis
ValueCreation™ EXCELLENT Return on Invested Capital (ROIC)
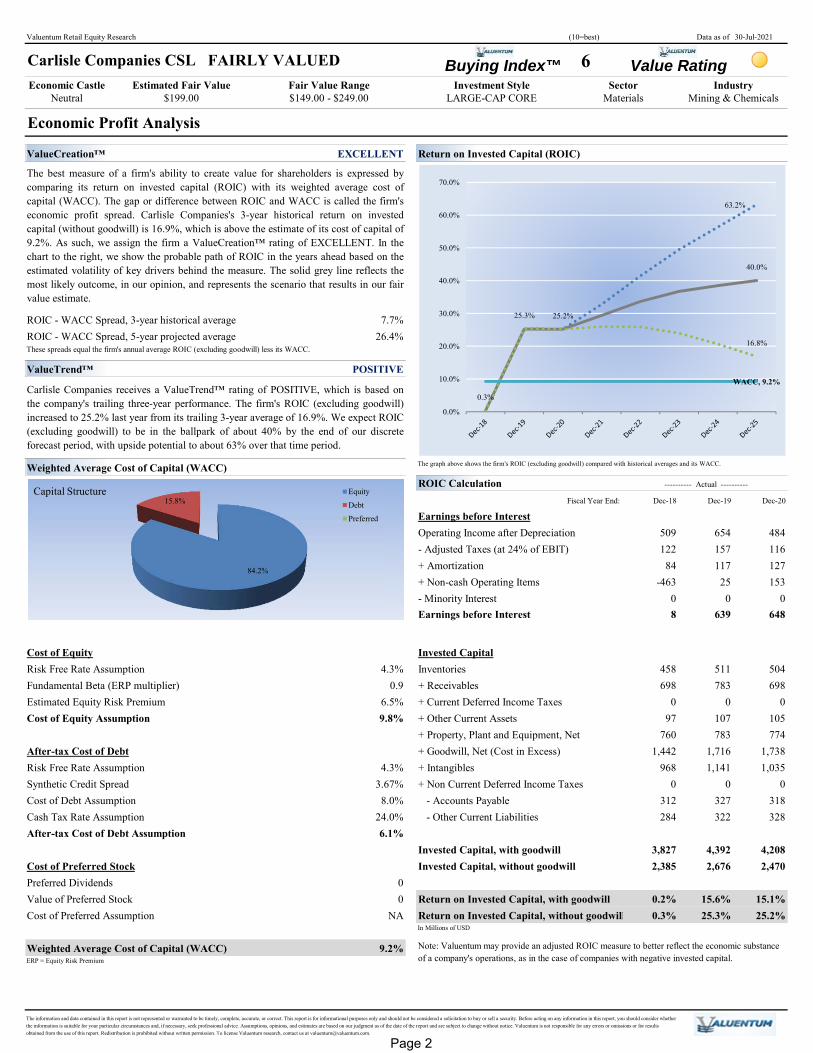
ROIC - WACC Spread, 3-year historical average 7.7%ROIC - WACC Spread, 5-year projected average 26.4%These spreads equal the firm's annual average ROIC (excluding goodwill) less its WACC.
ValueTrend™ POSITIVE
Weighted Average Cost of Capital (WACC) The graph above shows the firm's ROIC (excluding goodwill) compared with historical averages and its WACC.
ROIC CalculationFiscal Year End: Dec-18 Dec-19 Dec-20
Earnings before InterestOperating Income after Depreciation 509 654 484- Adjusted Taxes (at 24% of EBIT) 122 157 116+ Amortization 84 117 127+ Non-cash Operating Items -463 25 153- Minority Interest 0 0 0Earnings before Interest 8 639 648
Cost of Equity Invested CapitalRisk Free Rate Assumption Inventories 458 511 504Fundamental Beta (ERP multiplier) + Receivables 698 783 698Estimated Equity Risk Premium + Current Deferred Income Taxes 0 0 0Cost of Equity Assumption + Other Current Assets 97 107 105
+ Property, Plant and Equipment, Net 760 783 774After-tax Cost of Debt + Goodwill, Net (Cost in Excess) 1,442 1,716 1,738Risk Free Rate Assumption + Intangibles 968 1,141 1,035Synthetic Credit Spread + Non Current Deferred Income Taxes 0 0 0Cost of Debt Assumption - Accounts Payable 312 327 318Cash Tax Rate Assumption - Other Current Liabilities 284 322 328After-tax Cost of Debt Assumption
Invested Capital, with goodwill 3,827 4,392 4,208Cost of Preferred Stock Invested Capital, without goodwill 2,385 2,676 2,470Preferred DividendsValue of Preferred Stock Return on Invested Capital, with goodwill 0.2% 15.6% 15.1%Cost of Preferred Assumption Return on Invested Capital, without goodwill 0.3% 25.3% 25.2%
In Millions of USD
Weighted Average Cost of Capital (WACC)ERP = Equity Risk Premium
Carlisle Companies CSL FAIRLY VALUED
0
8.0%24.0%
0NA
9.2%
The information and data contained in this report is not represented or warranted to be timely, complete, accurate, or correct. This report is for informational purposes only and should not be considered a solicitation to buy or sell a security. Before acting on any information in this report, you should consider whether the information is suitable for your particular circumstances and, if necessary, seek professional advice. Assumptions, opinions, and estimates are based on our judgment as of the date of the report and are subject to change without notice. Valuentum is not responsible for any errors or omissions or for results obtained from the use of this report. Redistribution is prohibited without written permission. To license Valuentum research, contact us at [email protected].
6.1%
4.3%
9.8%
$199.00 $149.00 - $249.00 LARGE-CAP CORE
Carlisle Companies receives a ValueTrend™ rating of POSITIVE, which is based onthe company's trailing three-year performance. The firm's ROIC (excluding goodwill)increased to 25.2% last year from its trailing 3-year average of 16.9%. We expect ROIC(excluding goodwill) to be in the ballpark of about 40% by the end of our discreteforecast period, with upside potential to about 63% over that time period.
The best measure of a firm's ability to create value for shareholders is expressed bycomparing its return on invested capital (ROIC) with its weighted average cost ofcapital (WACC). The gap or difference between ROIC and WACC is called the firm'seconomic profit spread. Carlisle Companies's 3-year historical return on investedcapital (without goodwill) is 16.9%, which is above the estimate of its cost of capital of9.2%. As such, we assign the firm a ValueCreation™ rating of EXCELLENT. In thechart to the right, we show the probable path of ROIC in the years ahead based on theestimated volatility of key drivers behind the measure. The solid grey line reflects themost likely outcome, in our opinion, and represents the scenario that results in our fairvalue estimate.
Materials Mining & Chemicals Estimated Fair Value Fair Value Range Investment Style Sector Industry
4.3%3.67%
---------- Actual ----------
0.96.5%
Note: Valuentum may provide an adjusted ROIC measure to better reflect the economic substance of a company's operations, as in the case of companies with negative invested capital.
63.2%
40.0%
0.3%
25.3% 25.2%
16.8%
WACC, 9.2%
0.0%
10.0%
20.0%
30.0%
40.0%
50.0%
60.0%
70.0%
84.2%
15.8%Equity
Debt
Preferred
Capital Structure
Page 2
Valuentum Retail Equity Research (10=best) Data as of 30-Jul-2021
Buying Index™ 6 Value RatingEconomic Castle
Neutral
Growth Analysis
Revenue Growth MODEST Projected Revenue (in millions of USD) Source: Company Filings, Valuentum Projections
Last Fiscal Year
Revenue3-year Historical
CAGR5-year Projected
CAGRCarlisle Companies USD 4,245 1.2% 4.9%
Air Products & Chemical USD 8,856 2.6% 9.1%
BHP Billiton USD 42,931 6.3% 12.9%
DuPont USD 20,397 -31.1% -1.6%
Sherwin-Williams USD 18,362 7.0% 5.4%
Peer Median 4.5% 7.3%
Industry Median 1.3% 6.7%
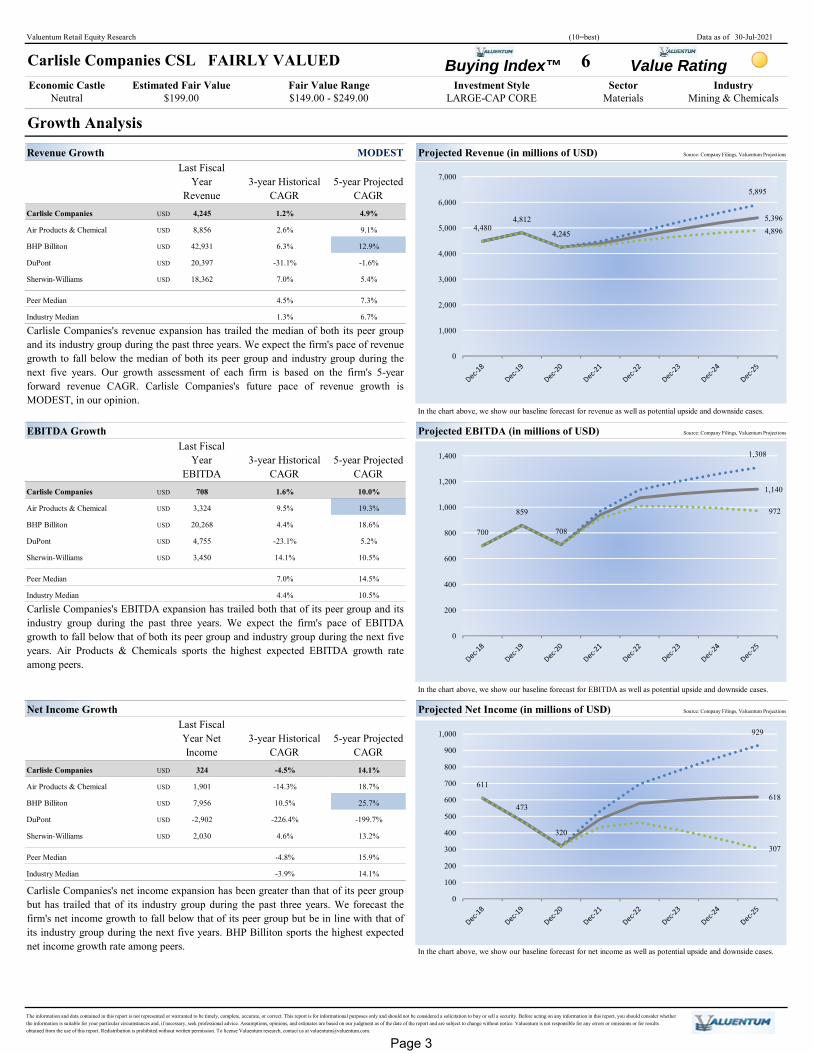
In the chart above, we show our baseline forecast for revenue as well as potential upside and downside cases.
EBITDA Growth Projected EBITDA (in millions of USD) Source: Company Filings, Valuentum Projections
Last Fiscal Year
EBITDA3-year Historical
CAGR5-year Projected
CAGRCarlisle Companies USD 708 1.6% 10.0%
Air Products & Chemical USD 3,324 9.5% 19.3%
BHP Billiton USD 20,268 4.4% 18.6%
DuPont USD 4,755 -23.1% 5.2%
Sherwin-Williams USD 3,450 14.1% 10.5%
Peer Median 7.0% 14.5%
Industry Median 4.4% 10.5%
In the chart above, we show our baseline forecast for EBITDA as well as potential upside and downside cases.
Net Income Growth Projected Net Income (in millions of USD) Source: Company Filings, Valuentum Projections
Last Fiscal Year Net Income
3-year Historical CAGR
5-year Projected CAGR
Carlisle Companies USD 324 -4.5% 14.1%
Air Products & Chemical USD 1,901 -14.3% 18.7%
BHP Billiton USD 7,956 10.5% 25.7%
DuPont USD -2,902 -226.4% -199.7%
Sherwin-Williams USD 2,030 4.6% 13.2%
Peer Median -4.8% 15.9%
Industry Median -3.9% 14.1%
In the chart above, we show our baseline forecast for net income as well as potential upside and downside cases.
Carlisle Companies CSL FAIRLY VALUED
Carlisle Companies's revenue expansion has trailed the median of both its peer groupand its industry group during the past three years. We expect the firm's pace of revenuegrowth to fall below the median of both its peer group and industry group during thenext five years. Our growth assessment of each firm is based on the firm's 5-yearforward revenue CAGR. Carlisle Companies's future pace of revenue growth isMODEST, in our opinion.
Carlisle Companies's EBITDA expansion has trailed both that of its peer group and itsindustry group during the past three years. We expect the firm's pace of EBITDAgrowth to fall below that of both its peer group and industry group during the next fiveyears. Air Products & Chemicals sports the highest expected EBITDA growth rateamong peers.
Carlisle Companies's net income expansion has been greater than that of its peer groupbut has trailed that of its industry group during the past three years. We forecast thefirm's net income growth to fall below that of its peer group but be in line with that ofits industry group during the next five years. BHP Billiton sports the highest expectednet income growth rate among peers.
$199.00
The information and data contained in this report is not represented or warranted to be timely, complete, accurate, or correct. This report is for informational purposes only and should not be considered a solicitation to buy or sell a security. Before acting on any information in this report, you should consider whether the information is suitable for your particular circumstances and, if necessary, seek professional advice. Assumptions, opinions, and estimates are based on our judgment as of the date of the report and are subject to change without notice. Valuentum is not responsible for any errors or omissions or for results obtained from the use of this report. Redistribution is prohibited without written permission. To license Valuentum research, contact us at [email protected].
$149.00 - $249.00 LARGE-CAP CORE Materials Mining & Chemicals Estimated Fair Value Fair Value Range Investment Style Sector Industry
4,4804,812
4,245
5,895
5,3964,896
0
1,000
2,000
3,000
4,000
5,000
6,000
7,000
700
859
708
1,308
1,140
972
0
200
400
600
800
1,000
1,200
1,400
611
473
320
929
618
307
0
100
200
300
400
500
600
700
800
900
1,000
Page 3
Valuentum Retail Equity Research (10=best) Data as of 30-Jul-2021
Buying Index™ 6 Value RatingEconomic Castle
Neutral
Cash Flow and Financial Leverage AnalysisCash Flow Generation STRONG Financial Leverage MEDIUM
The bars above show the firms operating cash flow, capital expenditures, and free cash flow, respectively. The bars above show the firm's annual debt-to-EBITDA. The red line shows the firm's normalized measure.
Cash Flow from Operations Projected Operating Cash Flow (in millions of USD) Source: Company Filings, Valuentum Projections
Last Fiscal Year CFO
3-year Historical CAGR
5-year Projected CAGR
Carlisle Companies USD 697 15.0% 7.2%
Air Products & Chemical USD 3,265 8.9% 16.0%
BHP Billiton USD 15,706 -2.2% 19.9%
DuPont USD 4,095 -22.2% 1.1%
Sherwin-Williams USD 3,409 21.9% 9.5%
Peer Median 3.3% 12.7%
Industry Median 10.8% 10.3%
In the chart above, we show our baseline forecast for CFO as well as potential upside and downside cases.
Free Cash Flow (CFO-capital expenditures) Projected Free Cash Flow (in millions of USD) Source: Company Filings, Valuentum Projections
Last Fiscal Year FCF
3-year Historical CAGR
5-year Projected CAGR Source: Company Filings, Valuentum Projections
Carlisle Companies USD 601 26.2% 5.3%
Air Products & Chemical USD 756 -20.2% 28.6%
BHP Billiton USD 8,066 -12.7% 24.3%
DuPont USD 2,901 -16.6% 3.2%
Sherwin-Williams USD 3,105 23.2% 9.2%
Peer Median -14.7% 16.7%
Industry Median 14.8% 11.7%
In the chart above, we show our baseline forecast for free cash flow as well as potential upside and downside cases.
Carlisle Companies CSL FAIRLY VALUED
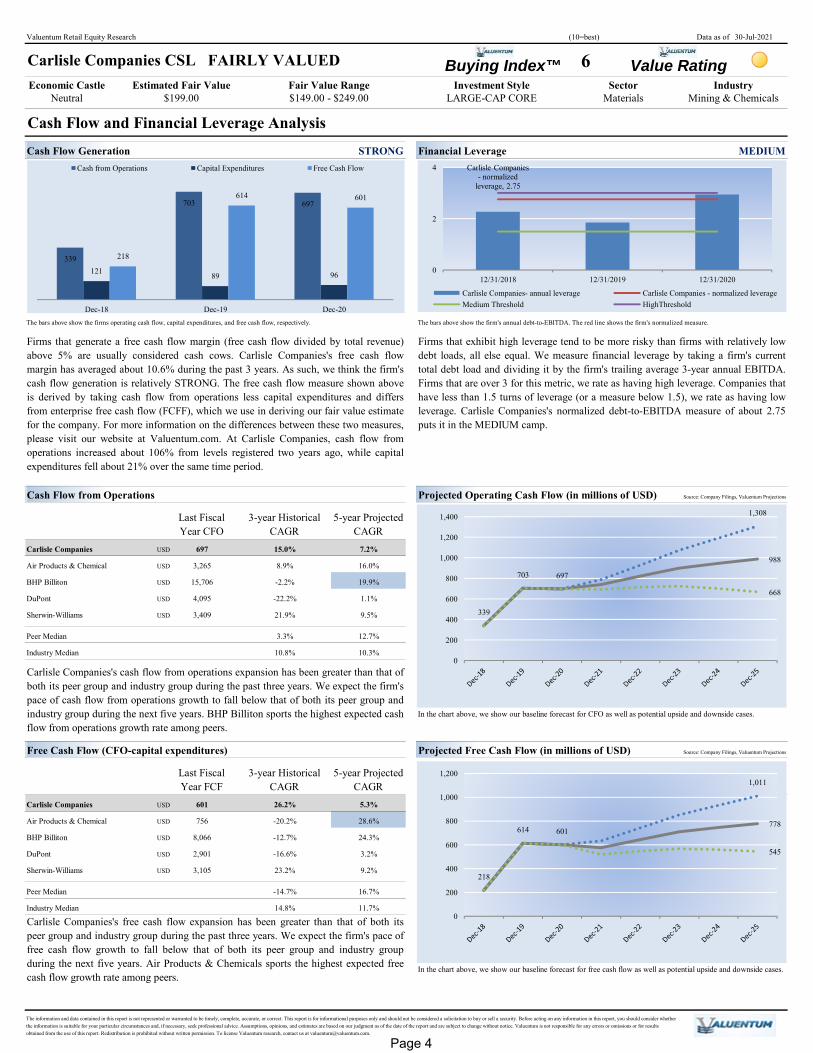
Firms that generate a free cash flow margin (free cash flow divided by total revenue)above 5% are usually considered cash cows. Carlisle Companies's free cash flowmargin has averaged about 10.6% during the past 3 years. As such, we think the firm'scash flow generation is relatively STRONG. The free cash flow measure shown aboveis derived by taking cash flow from operations less capital expenditures and differsfrom enterprise free cash flow (FCFF), which we use in deriving our fair value estimatefor the company. For more information on the differences between these two measures,please visit our website at Valuentum.com. At Carlisle Companies, cash flow fromoperations increased about 106% from levels registered two years ago, while capitalexpenditures fell about 21% over the same time period.
LARGE-CAP CORE Materials Estimated Fair Value
$199.00
Carlisle Companies's cash flow from operations expansion has been greater than that ofboth its peer group and industry group during the past three years. We expect the firm'space of cash flow from operations growth to fall below that of both its peer group andindustry group during the next five years. BHP Billiton sports the highest expected cashflow from operations growth rate among peers.
Carlisle Companies's free cash flow expansion has been greater than that of both itspeer group and industry group during the past three years. We expect the firm's pace offree cash flow growth to fall below that of both its peer group and industry groupduring the next five years. Air Products & Chemicals sports the highest expected freecash flow growth rate among peers.
Fair Value RangeMining & Chemicals $149.00 - $249.00
Firms that exhibit high leverage tend to be more risky than firms with relatively lowdebt loads, all else equal. We measure financial leverage by taking a firm's currenttotal debt load and dividing it by the firm's trailing average 3-year annual EBITDA.Firms that are over 3 for this metric, we rate as having high leverage. Companies thathave less than 1.5 turns of leverage (or a measure below 1.5), we rate as having lowleverage. Carlisle Companies's normalized debt-to-EBITDA measure of about 2.75puts it in the MEDIUM camp.
The information and data contained in this report is not represented or warranted to be timely, complete, accurate, or correct. This report is for informational purposes only and should not be considered a solicitation to buy or sell a security. Before acting on any information in this report, you should consider whether the information is suitable for your particular circumstances and, if necessary, seek professional advice. Assumptions, opinions, and estimates are based on our judgment as of the date of the report and are subject to change without notice. Valuentum is not responsible for any errors or omissions or for results obtained from the use of this report. Redistribution is prohibited without written permission. To license Valuentum research, contact us at [email protected].
Sector IndustryInvestment Style
339
703 697
121 89 96
218
614 601
Dec-18 Dec-19 Dec-20
Cash from Operations Capital Expenditures Free Cash Flow Carlisle Companies - normalized
Valuentum Retail Equity Research (10=best) Data as of 30-Jul-2021
Buying Index™ 6 Value RatingEconomic Castle
Neutral
Valuation Analysis
Valuation Assumptions Valuation BreakdownIn Millions of USD (except for per share items)
Revenue CAGR %Avg. EBIT Margin %Avg. Cash Tax Rate %Earnings Before Interest CAGR %Earnings Per Share CAGR %Free Cash Flow to the Firm CAGR %Earnings before interest = Net operating profits less adjusted taxes
Phase II --> III FCFF CAGR % 3.4% (II) 3% (III)Cost of Equity %After-tax Cost of Debt %Discount Rate (WACC) %Synthetic credit spread = 3.667%
Phase I Present ValuePhase II Present ValuePhase III Present ValueTotal Firm Value
Net Balance Sheet Impact
Total Equity ValueDiluted Shares OutstandingFair Value per Share
Peer Median 4.5 26.2 1.9 10.5 15.6% 14.8% 1.7% 116.9%
Industry Median 5.0 20.8 2.3 10.4 15.5% 15.1% 1.4% 110.6%
-1,179
Earnings before Interest
10,966
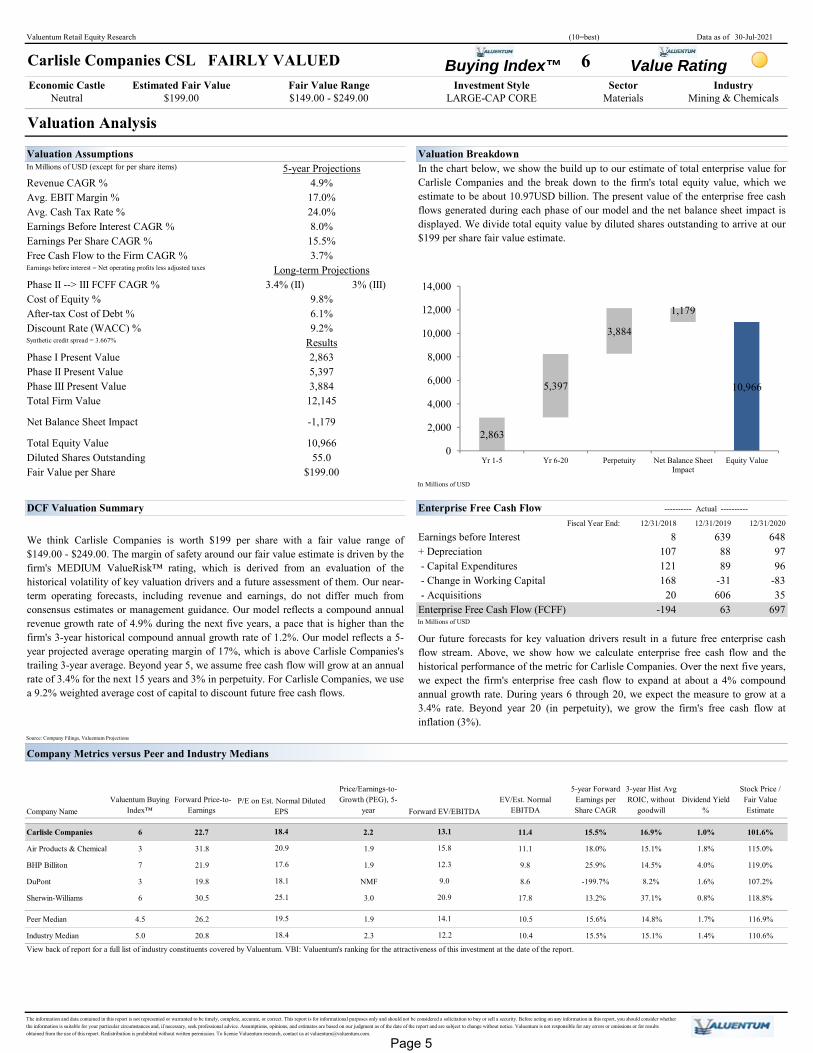
We think Carlisle Companies is worth $199 per share with a fair value range of$149.00 - $249.00. The margin of safety around our fair value estimate is driven by thefirm's MEDIUM ValueRisk™ rating, which is derived from an evaluation of thehistorical volatility of key valuation drivers and a future assessment of them. Our near-term operating forecasts, including revenue and earnings, do not differ much fromconsensus estimates or management guidance. Our model reflects a compound annualrevenue growth rate of 4.9% during the next five years, a pace that is higher than thefirm's 3-year historical compound annual growth rate of 1.2%. Our model reflects a 5-year projected average operating margin of 17%, which is above Carlisle Companies'strailing 3-year average. Beyond year 5, we assume free cash flow will grow at an annualrate of 3.4% for the next 15 years and 3% in perpetuity. For Carlisle Companies, we usea 9.2% weighted average cost of capital to discount future free cash flows.
In Millions of USD
Fair Value Range
The information and data contained in this report is not represented or warranted to be timely, complete, accurate, or correct. This report is for informational purposes only and should not be considered a solicitation to buy or sell a security. Before acting on any information in this report, you should consider whether the information is suitable for your particular circumstances and, if necessary, seek professional advice. Assumptions, opinions, and estimates are based on our judgment as of the date of the report and are subject to change without notice. Valuentum is not responsible for any errors or omissions or for results obtained from the use of this report. Redistribution is prohibited without written permission. To license Valuentum research, contact us at [email protected].
15.5%
---------- Actual ----------
20.9
17.6
25.1
18.4
18.4
P/E on Est. Normal Diluted EPS
12.2
Carlisle Companies CSL FAIRLY VALUED
2,8635,397
View back of report for a full list of industry constituents covered by Valuentum. VBI: Valuentum's ranking for the attractiveness of this investment at the date of the report.
IndustryInvestment Style Sector
- Capital Expenditures
Estimated Fair Value
Results
Long-term Projections
9.8%
14.1
9.2%
In the chart below, we show the build up to our estimate of total enterprise value forCarlisle Companies and the break down to the firm's total equity value, which weestimate to be about 10.97USD billion. The present value of the enterprise free cashflows generated during each phase of our model and the net balance sheet impact isdisplayed. We divide total equity value by diluted shares outstanding to arrive at our$199 per share fair value estimate.
12,145
15.8
12.3
9.0
20.9
5-year Projections
Forward EV/EBITDA
- Change in Working Capital
Enterprise Free Cash Flow (FCFF)
Our future forecasts for key valuation drivers result in a future free enterprise cashflow stream. Above, we show how we calculate enterprise free cash flow and thehistorical performance of the metric for Carlisle Companies. Over the next five years,we expect the firm's enterprise free cash flow to expand at about a 4% compoundannual growth rate. During years 6 through 20, we expect the measure to grow at a3.4% rate. Beyond year 20 (in perpetuity), we grow the firm's free cash flow atinflation (3%).
Valuentum Retail Equity Research (10=best) Data as of 30-Jul-2021
Buying Index™ 6 Value RatingEconomic Castle
Neutral
Margin of Safety Analysis
Range of Potential Outcomes ValueRisk™ MEDIUM
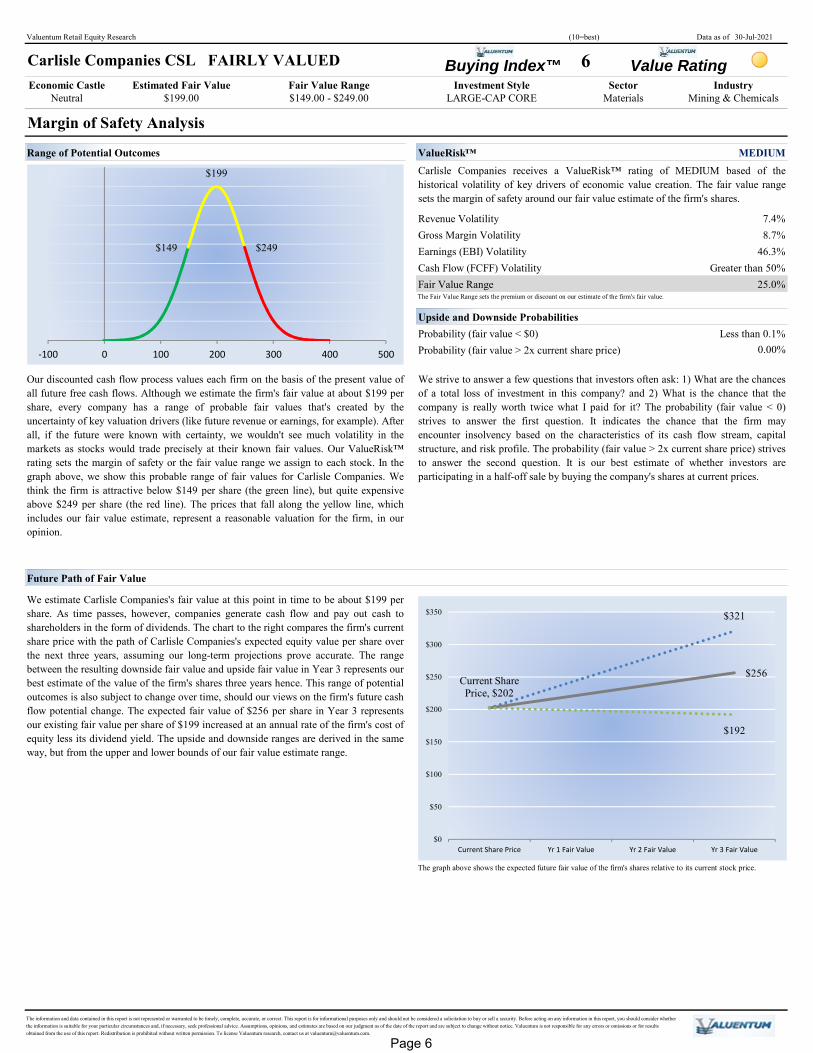
Revenue Volatility 7.4%Gross Margin Volatility 8.7%Earnings (EBI) Volatility 46.3%Cash Flow (FCFF) Volatility Greater than 50%Fair Value Range 25.0%The Fair Value Range sets the premium or discount on our estimate of the firm's fair value.
Upside and Downside ProbabilitiesProbability (fair value < $0) Less than 0.1%Probability (fair value > 2x current share price) 0.00%
Future Path of Fair Value
The graph above shows the expected future fair value of the firm's shares relative to its current stock price.
LARGE-CAP CORE Estimated Fair Value
$199.00 $149.00 - $249.00Sector Fair Value Range Investment Style
Carlisle Companies CSL FAIRLY VALUED
Our discounted cash flow process values each firm on the basis of the present value ofall future free cash flows. Although we estimate the firm's fair value at about $199 pershare, every company has a range of probable fair values that's created by theuncertainty of key valuation drivers (like future revenue or earnings, for example). After all, if the future were known with certainty, we wouldn't see much volatility in themarkets as stocks would trade precisely at their known fair values. Our ValueRisk™rating sets the margin of safety or the fair value range we assign to each stock. In thegraph above, we show this probable range of fair values for Carlisle Companies. Wethink the firm is attractive below $149 per share (the green line), but quite expensiveabove $249 per share (the red line). The prices that fall along the yellow line, whichincludes our fair value estimate, represent a reasonable valuation for the firm, in ouropinion.
The information and data contained in this report is not represented or warranted to be timely, complete, accurate, or correct. This report is for informational purposes only and should not be considered a solicitation to buy or sell a security. Before acting on any information in this report, you should consider whether the information is suitable for your particular circumstances and, if necessary, seek professional advice. Assumptions, opinions, and estimates are based on our judgment as of the date of the report and are subject to change without notice. Valuentum is not responsible for any errors or omissions or for results obtained from the use of this report. Redistribution is prohibited without written permission. To license Valuentum research, contact us at [email protected].
We strive to answer a few questions that investors often ask: 1) What are the chancesof a total loss of investment in this company? and 2) What is the chance that thecompany is really worth twice what I paid for it? The probability (fair value < 0)strives to answer the first question. It indicates the chance that the firm mayencounter insolvency based on the characteristics of its cash flow stream, capitalstructure, and risk profile. The probability (fair value > 2x current share price) strivesto answer the second question. It is our best estimate of whether investors areparticipating in a half-off sale by buying the company's shares at current prices.
We estimate Carlisle Companies's fair value at this point in time to be about $199 pershare. As time passes, however, companies generate cash flow and pay out cash toshareholders in the form of dividends. The chart to the right compares the firm's currentshare price with the path of Carlisle Companies's expected equity value per share overthe next three years, assuming our long-term projections prove accurate. The rangebetween the resulting downside fair value and upside fair value in Year 3 represents ourbest estimate of the value of the firm's shares three years hence. This range of potentialoutcomes is also subject to change over time, should our views on the firm's future cashflow potential change. The expected fair value of $256 per share in Year 3 representsour existing fair value per share of $199 increased at an annual rate of the firm's cost ofequity less its dividend yield. The upside and downside ranges are derived in the sameway, but from the upper and lower bounds of our fair value estimate range.
IndustryMining & Chemicals
Carlisle Companies receives a ValueRisk™ rating of MEDIUM based of thehistorical volatility of key drivers of economic value creation. The fair value rangesets the margin of safety around our fair value estimate of the firm's shares.
Materials
$149
$199
$249
-100 0 100 200 300 400 500
$321
$256Current Share Price, $202
$192
$0
$50
$100
$150
$200
$250
$300
$350
Current Share Price Yr 1 Fair Value Yr 2 Fair Value Yr 3 Fair Value
Page 6
Valuentum Retail Equity Research (10=best) Data as of 30-Jul-2021
Buying Index™ 6 Value RatingEconomic Castle
Neutral
Technical Analysis
Technical Evaluation BULLISH Money Flow Index (MFI) NEUTRAL
30-week Price and Volume Chart (weekly)Relative Price Strength WEAK
5-week Company Performance 5.9%5-week Market Benchmark Performance 2.6%5-week Relative Performance vs. Market Benchmark 3.3%13-week Company Performance 4.8%13-week Market Benchmark Performance 7.5%13-week Relative Performance vs. Market Benchmark -2.7%30-week Company Performance 31.8%30-week Market Benchmark Performance 17.5%30-week Relative Performance vs. Market Benchmark 14.3%
Firms that are undervalued and currently showing near-term pricing strength score near the top right of the matrix.
Carlisle Companies CSL FAIRLY VALUED
Neutral
Estimated Fair Value Fair Value Range
Strong
Overvalued
Industry $199.00
UndervaluedFairly Valued
Investment Style
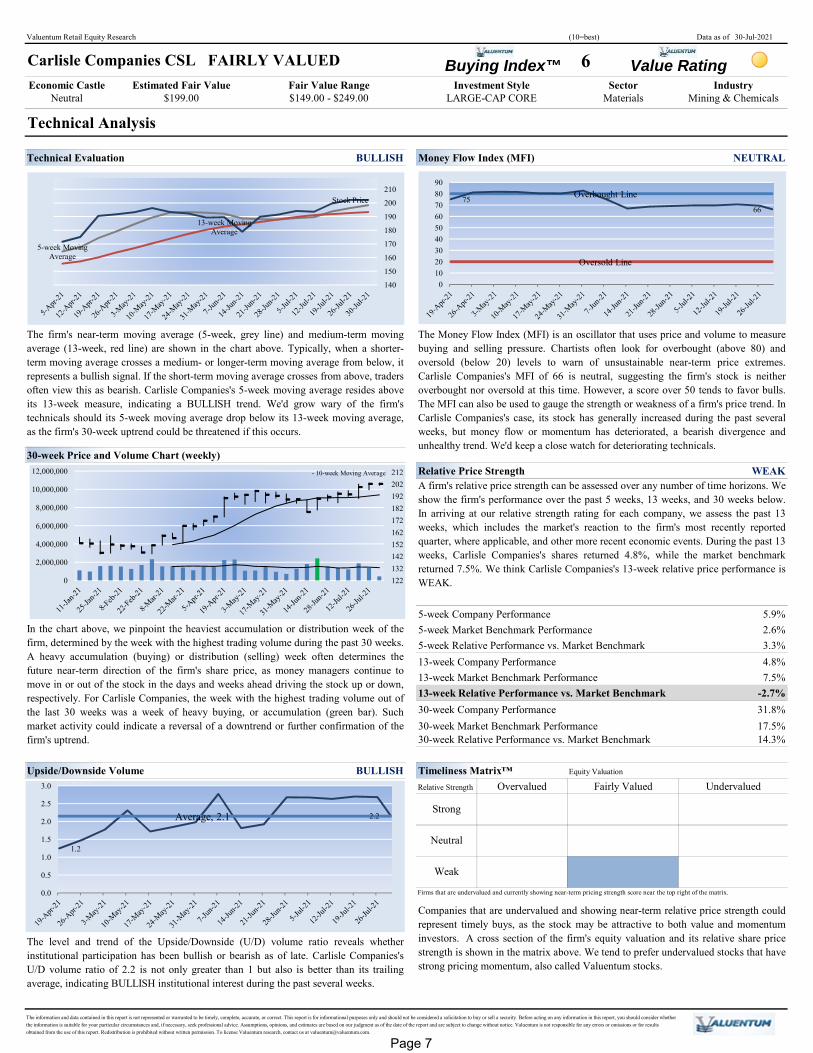
The Money Flow Index (MFI) is an oscillator that uses price and volume to measurebuying and selling pressure. Chartists often look for overbought (above 80) andoversold (below 20) levels to warn of unsustainable near-term price extremes.Carlisle Companies's MFI of 66 is neutral, suggesting the firm's stock is neitheroverbought nor oversold at this time. However, a score over 50 tends to favor bulls.The MFI can also be used to gauge the strength or weakness of a firm's price trend. InCarlisle Companies's case, its stock has generally increased during the past severalweeks, but money flow or momentum has deteriorated, a bearish divergence andunhealthy trend. We'd keep a close watch for deteriorating technicals.
The firm's near-term moving average (5-week, grey line) and medium-term movingaverage (13-week, red line) are shown in the chart above. Typically, when a shorter-term moving average crosses a medium- or longer-term moving average from below, itrepresents a bullish signal. If the short-term moving average crosses from above, tradersoften view this as bearish. Carlisle Companies's 5-week moving average resides aboveits 13-week measure, indicating a BULLISH trend. We'd grow wary of the firm'stechnicals should its 5-week moving average drop below its 13-week moving average,as the firm's 30-week uptrend could be threatened if this occurs.
1
The information and data contained in this report is not represented or warranted to be timely, complete, accurate, or correct. This report is for informational purposes only and should not be considered a solicitation to buy or sell a security. Before acting on any information in this report, you should consider whether the information is suitable for your particular circumstances and, if necessary, seek professional advice. Assumptions, opinions, and estimates are based on our judgment as of the date of the report and are subject to change without notice. Valuentum is not responsible for any errors or omissions or for results obtained from the use of this report. Redistribution is prohibited without written permission. To license Valuentum research, contact us at [email protected].
Weak
The level and trend of the Upside/Downside (U/D) volume ratio reveals whetherinstitutional participation has been bullish or bearish as of late. Carlisle Companies'sU/D volume ratio of 2.2 is not only greater than 1 but also is better than its trailingaverage, indicating BULLISH institutional interest during the past several weeks.
SectorMaterials
In the chart above, we pinpoint the heaviest accumulation or distribution week of thefirm, determined by the week with the highest trading volume during the past 30 weeks.A heavy accumulation (buying) or distribution (selling) week often determines thefuture near-term direction of the firm's share price, as money managers continue tomove in or out of the stock in the days and weeks ahead driving the stock up or down,respectively. For Carlisle Companies, the week with the highest trading volume out ofthe last 30 weeks was a week of heavy buying, or accumulation (green bar). Suchmarket activity could indicate a reversal of a downtrend or further confirmation of thefirm's uptrend.
A firm's relative price strength can be assessed over any number of time horizons. Weshow the firm's performance over the past 5 weeks, 13 weeks, and 30 weeks below.In arriving at our relative strength rating for each company, we assess the past 13weeks, which includes the market's reaction to the firm's most recently reportedquarter, where applicable, and other more recent economic events. During the past 13weeks, Carlisle Companies's shares returned 4.8%, while the market benchmarkreturned 7.5%. We think Carlisle Companies's 13-week relative price performance isWEAK.
Companies that are undervalued and showing near-term relative price strength couldrepresent timely buys, as the stock may be attractive to both value and momentuminvestors. A cross section of the firm's equity valuation and its relative share pricestrength is shown in the matrix above. We tend to prefer undervalued stocks that have strong pricing momentum, also called Valuentum stocks.
122132142152162172182192202212
0
2,000,000
4,000,000
6,000,000
8,000,000
10,000,000
12,000,000
5-week Moving Average
13-week Moving Average
Stock Price
140
150
160
170
180
190
200
210 Overbought Line
Oversold Line
7566
0102030405060708090
1.2
2.2Average, 2.1
0.0
0.5
1.0
1.5
2.0
2.5
3.0
- 10-week Moving Average
Page 7
Valuentum Retail Equity Research (10=best) Data as of 30-Jul-2021
Buying Index™ 6 Value RatingEconomic Castle
Neutral
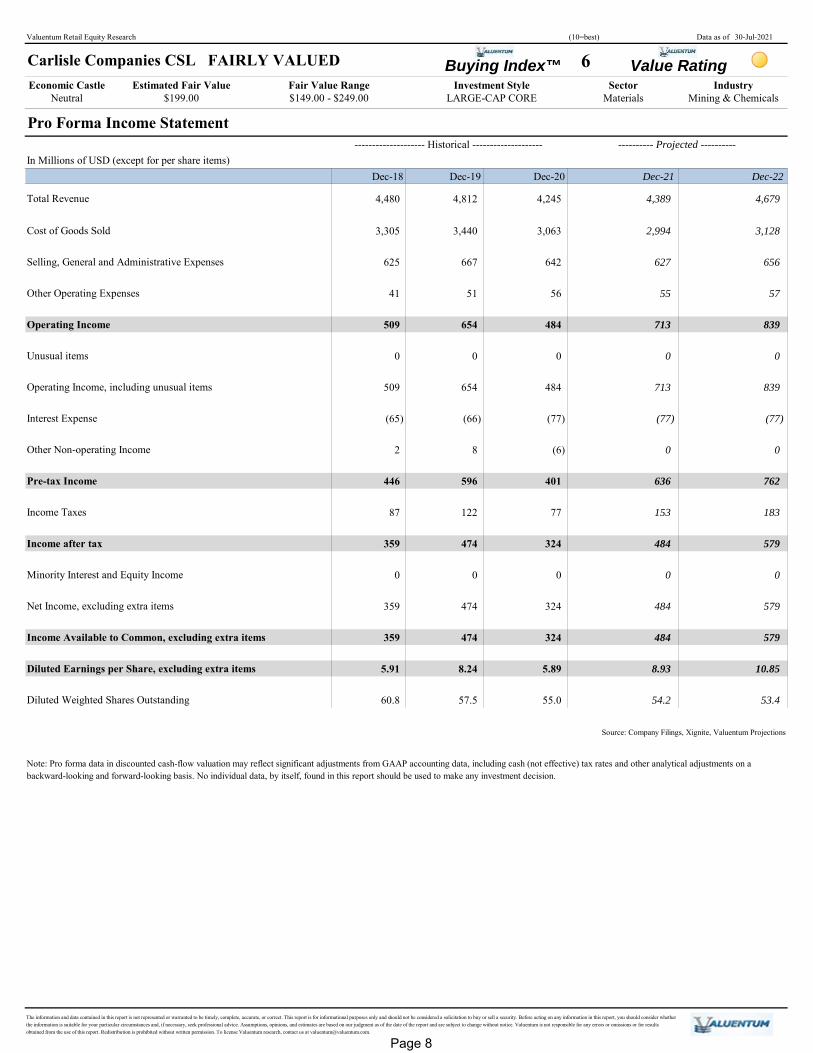
Pro Forma Income Statement -------------------- Historical --------------------
In Millions of USD (except for per share items)Dec-18 Dec-20
Total Revenue 4,480 4,245
Cost of Goods Sold 3,305 3,063
Selling, General and Administrative Expenses 625 642
Other Operating Expenses 41 56
Operating Income 509 484
Unusual items 0 0
Operating Income, including unusual items 509 484
Interest Expense (65) (77)
Other Non-operating Income 2 (6)
Pre-tax Income 446 401
Income Taxes 87 77
Income after tax 359 324
Minority Interest and Equity Income 0 0
Net Income, excluding extra items 359 324
Income Available to Common, excluding extra items 359 324
Diluted Earnings per Share, excluding extra items 5.91 5.89
Diluted Weighted Shares Outstanding 60.8 55.0
Source: Company Filings, Xignite, Valuentum Projections
Carlisle Companies CSL FAIRLY VALUED
579
10.85
Fair Value Range Investment Style
8
4,812
55
627
2,994
654
474
Materials Mining & Chemicals
654
4,389
(66)
Dec-21
0
713 839
0
0
484
Dec-22
8.24
484
53.454.2
8.93
57.5
The information and data contained in this report is not represented or warranted to be timely, complete, accurate, or correct. This report is for informational purposes only and should not be considered a solicitation to buy or sell a security. Before acting on any information in this report, you should consider whether the information is suitable for your particular circumstances and, if necessary, seek professional advice. Assumptions, opinions, and estimates are based on our judgment as of the date of the report and are subject to change without notice. Valuentum is not responsible for any errors or omissions or for results obtained from the use of this report. Redistribution is prohibited without written permission. To license Valuentum research, contact us at [email protected].
579
Estimated Fair ValueLARGE-CAP CORE
Sector Industry $199.00 $149.00 - $249.00
474
474
596
484
0 0 0
579
Dec-19
3,440
667
51
122
4,679
0
3,128
656
762
183
636
0
713
57
153
(77)
839
(77)
---------- Projected ----------
Note: Pro forma data in discounted cash-flow valuation may reflect significant adjustments from GAAP accounting data, including cash (not effective) tax rates and other analytical adjustments on a backward-looking and forward-looking basis. No individual data, by itself, found in this report should be used to make any investment decision.
Page 8
Valuentum Retail Equity Research (10=best) Data as of 30-Jul-2021
Buying Index™ 6 Value RatingEconomic Castle
Neutral
Pro Forma Balance Sheet -------------------- Historical --------------------
In Millions of USD (except for per share items)Dec-18 Dec-20
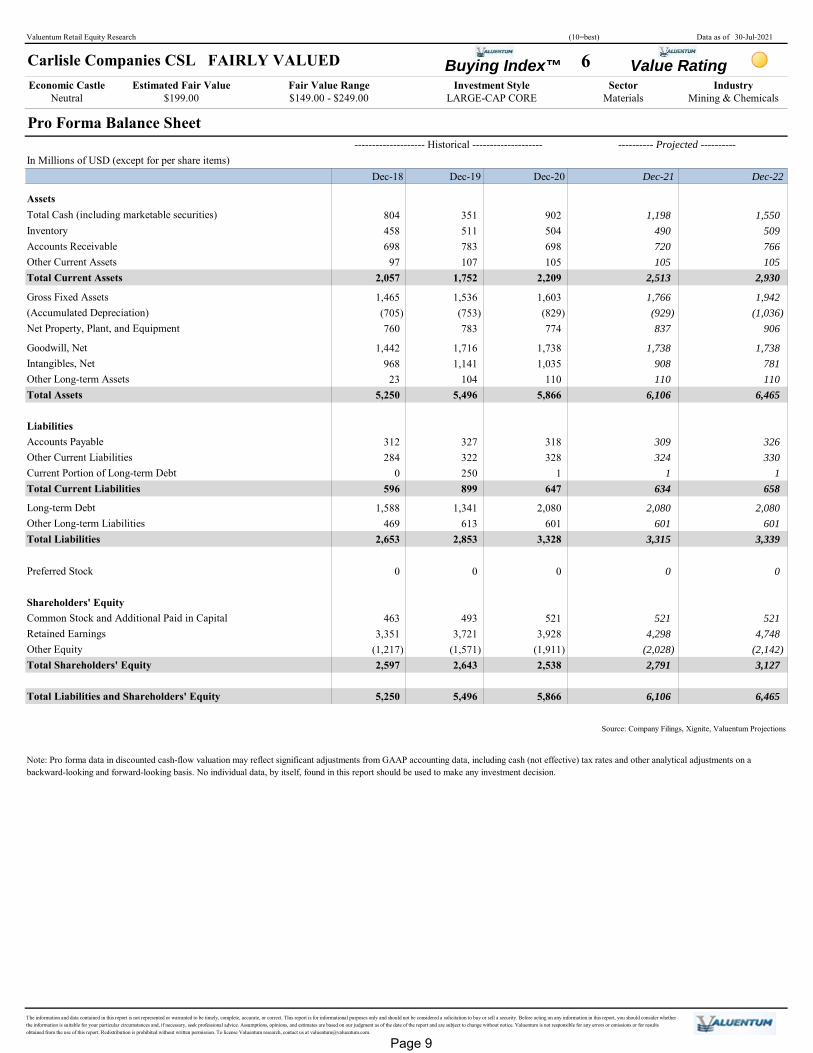
AssetsTotal Cash (including marketable securities) 804 902Inventory 458 504Accounts Receivable 698 698Other Current Assets 97 105Total Current Assets 2,057 2,209
Shareholders' EquityCommon Stock and Additional Paid in Capital 463 521Retained Earnings 3,351 3,928Other Equity (1,217) (1,911)Total Shareholders' Equity 2,597 2,538
Total Liabilities and Shareholders' Equity 5,250 5,866
1,198 1,550
107 105 105
$149.00 - $249.00Industry
LARGE-CAP CORE
Carlisle Companies CSL FAIRLY VALUED
$199.00Investment Style
Materials
509
Sector
6,106
899 634 658
5,496
511
Mining & Chemicals
Dec-19
Estimated Fair Value Fair Value Range
351
6,465
490
1 1322 324 330
Dec-21 Dec-22
327 309 326
250
1,766 1,942(753)
1,536
493 521 5213,721 4,298 4,748
(1,571) (2,028) (2,142)2,643 2,791 3,127
0 0
1,341 2,080 2,080613 601 601
2,853 3,315 3,339
0
5,496 6,465
720 766
2,9302,5131,752
104 110 110
1,716 1,738 1,7381,141 908 781
783
(929) (1,036)783
The information and data contained in this report is not represented or warranted to be timely, complete, accurate, or correct. This report is for informational purposes only and should not be considered a solicitation to buy or sell a security. Before acting on any information in this report, you should consider whether the information is suitable for your particular circumstances and, if necessary, seek professional advice. Assumptions, opinions, and estimates are based on our judgment as of the date of the report and are subject to change without notice. Valuentum is not responsible for any errors or omissions or for results obtained from the use of this report. Redistribution is prohibited without written permission. To license Valuentum research, contact us at [email protected].
Source: Company Filings, Xignite, Valuentum Projections
---------- Projected ----------
837 906
6,106
Note: Pro forma data in discounted cash-flow valuation may reflect significant adjustments from GAAP accounting data, including cash (not effective) tax rates and other analytical adjustments on a backward-looking and forward-looking basis. No individual data, by itself, found in this report should be used to make any investment decision.
Page 9
Valuentum Retail Equity Research (10=best) Data as of 30-Jul-2021
Buying Index™ 6 Value RatingEconomic Castle
Neutral
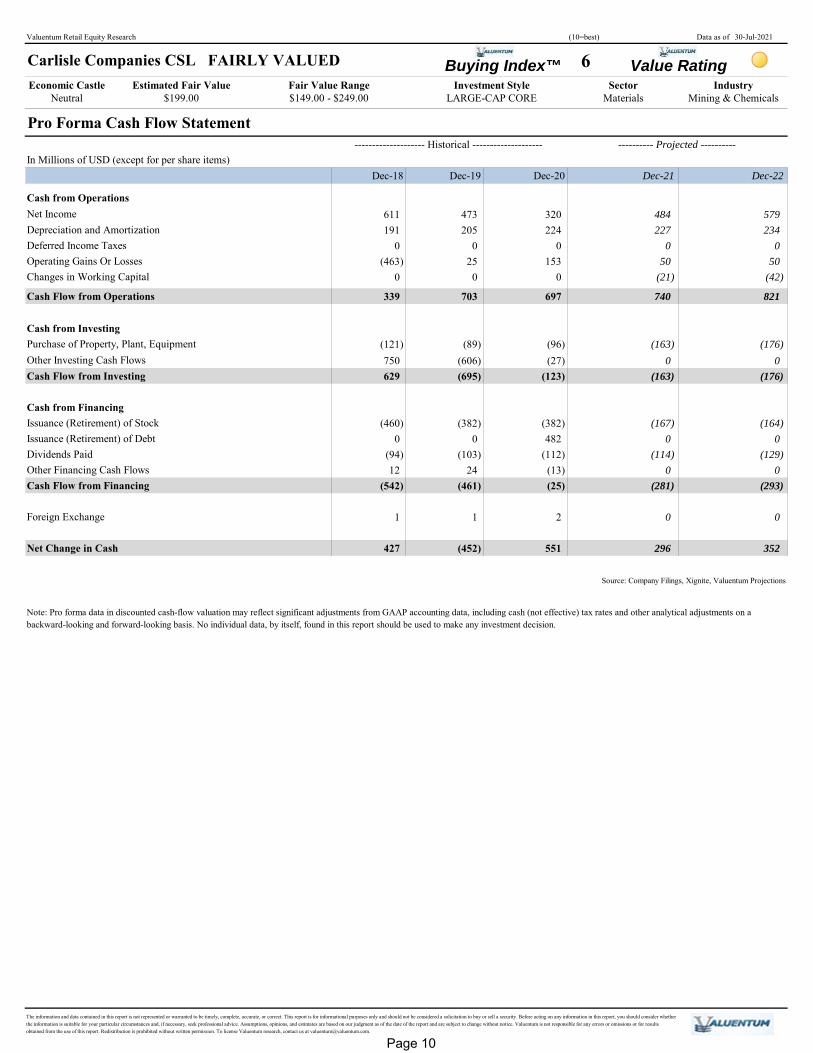
Pro Forma Cash Flow Statement -------------------- Historical --------------------
In Millions of USD (except for per share items)Dec-18 Dec-20
Cash from OperationsNet Income 611 320Depreciation and Amortization 191 224Deferred Income Taxes 0 0Operating Gains Or Losses (463) 153Changes in Working Capital 0 0
Cash Flow from Operations 339 697
Cash from InvestingPurchase of Property, Plant, Equipment (121) (96)Other Investing Cash Flows 750 (27)Cash Flow from Investing 629 (123)
Cash from FinancingIssuance (Retirement) of Stock (460) (382)Issuance (Retirement) of Debt 0 482Dividends Paid (94) (112)Other Financing Cash Flows 12 (13)Cash Flow from Financing (542) (25)
Foreign Exchange 1 2
Net Change in Cash 427 551
Dec-19 Dec-21 Dec-22
Carlisle Companies CSL FAIRLY VALUED Estimated Fair Value Fair Value Range Investment Style Sector Industry
The information and data contained in this report is not represented or warranted to be timely, complete, accurate, or correct. This report is for informational purposes only and should not be considered a solicitation to buy or sell a security. Before acting on any information in this report, you should consider whether the information is suitable for your particular circumstances and, if necessary, seek professional advice. Assumptions, opinions, and estimates are based on our judgment as of the date of the report and are subject to change without notice. Valuentum is not responsible for any errors or omissions or for results obtained from the use of this report. Redistribution is prohibited without written permission. To license Valuentum research, contact us at [email protected].
(293)(281)(461)
(452)
Source: Company Filings, Xignite, Valuentum Projections
Note: Pro forma data in discounted cash-flow valuation may reflect significant adjustments from GAAP accounting data, including cash (not effective) tax rates and other analytical adjustments on a backward-looking and forward-looking basis. No individual data, by itself, found in this report should be used to make any investment decision.
Page 10
Valuentum Retail Equity Research (10=best) Data as of 30-Jul-2021
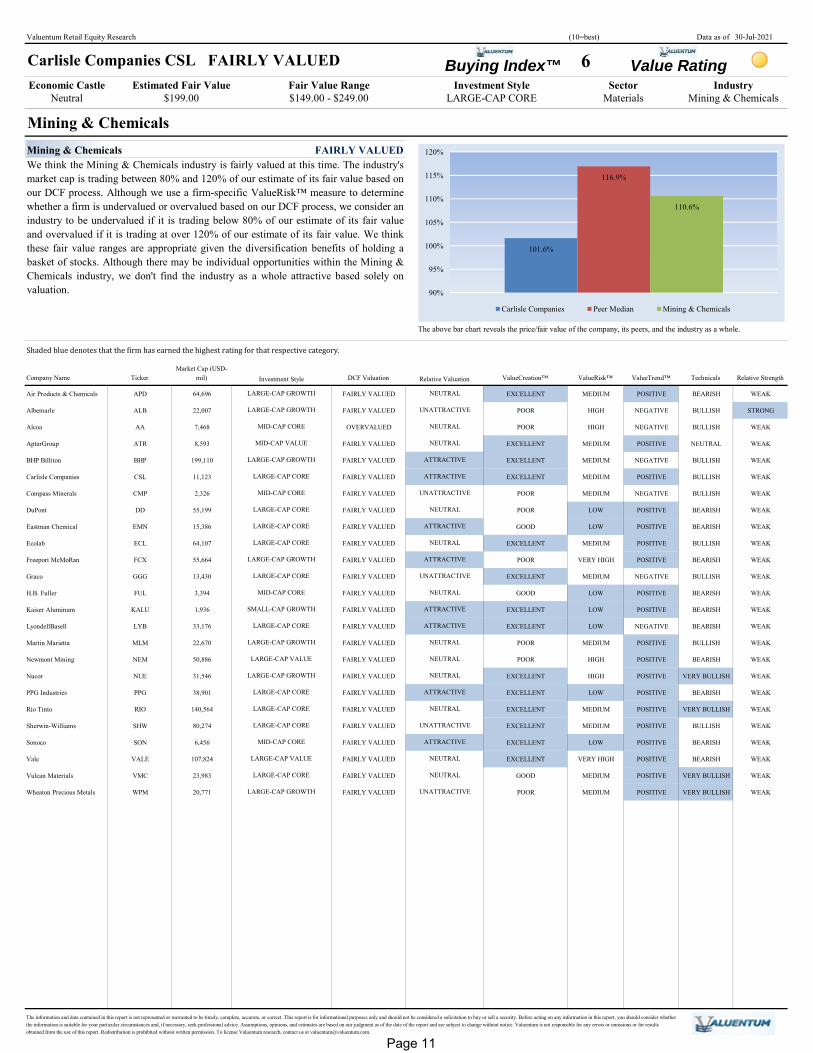
The above bar chart reveals the price/fair value of the company, its peers, and the industry as a whole.
We think the Mining & Chemicals industry is fairly valued at this time. The industry'smarket cap is trading between 80% and 120% of our estimate of its fair value based onour DCF process. Although we use a firm-specific ValueRisk™ measure to determinewhether a firm is undervalued or overvalued based on our DCF process, we consider anindustry to be undervalued if it is trading below 80% of our estimate of its fair valueand overvalued if it is trading at over 120% of our estimate of its fair value. We thinkthese fair value ranges are appropriate given the diversification benefits of holding abasket of stocks. Although there may be individual opportunities within the Mining &Chemicals industry, we don't find the industry as a whole attractive based solely onvaluation.
Shaded blue denotes that the firm has earned the highest rating for that respective category.Investment Style
LARGE-CAP GROWTH
LARGE-CAP GROWTH
MID-CAP CORE
MID-CAP VALUE
LARGE-CAP GROWTH
LARGE-CAP CORE
LARGE-CAP CORE
LARGE-CAP CORE
ATTRACTIVE
LARGE-CAP CORE
LARGE-CAP VALUE
LARGE-CAP CORE
LARGE-CAP CORE
ATTRACTIVE
NEUTRAL
NEUTRAL
NEUTRAL
ATTRACTIVE
LARGE-CAP GROWTH
LARGE-CAP CORE
UNATTRACTIVE
ATTRACTIVE
NEUTRAL
NEUTRAL
UNATTRACTIVE
The information and data contained in this report is not represented or warranted to be timely, complete, accurate, or correct. This report is for informational purposes only and should not be considered a solicitation to buy or sell a security. Before acting on any information in this report, you should consider whether the information is suitable for your particular circumstances and, if necessary, seek professional advice. Assumptions, opinions, and estimates are based on our judgment as of the date of the report and are subject to change without notice. Valuentum is not responsible for any errors or omissions or for results obtained from the use of this report. Redistribution is prohibited without written permission. To license Valuentum research, contact us at [email protected].
MID-CAP CORE
SMALL-CAP GROWTH
LARGE-CAP CORE
LARGE-CAP CORE
NEUTRAL
NEUTRAL
ATTRACTIVE
101.6%
116.9%
110.6%
90%
95%
100%
105%
110%
115%
120%
Carlisle Companies Peer Median Mining & Chemicals
Page 11
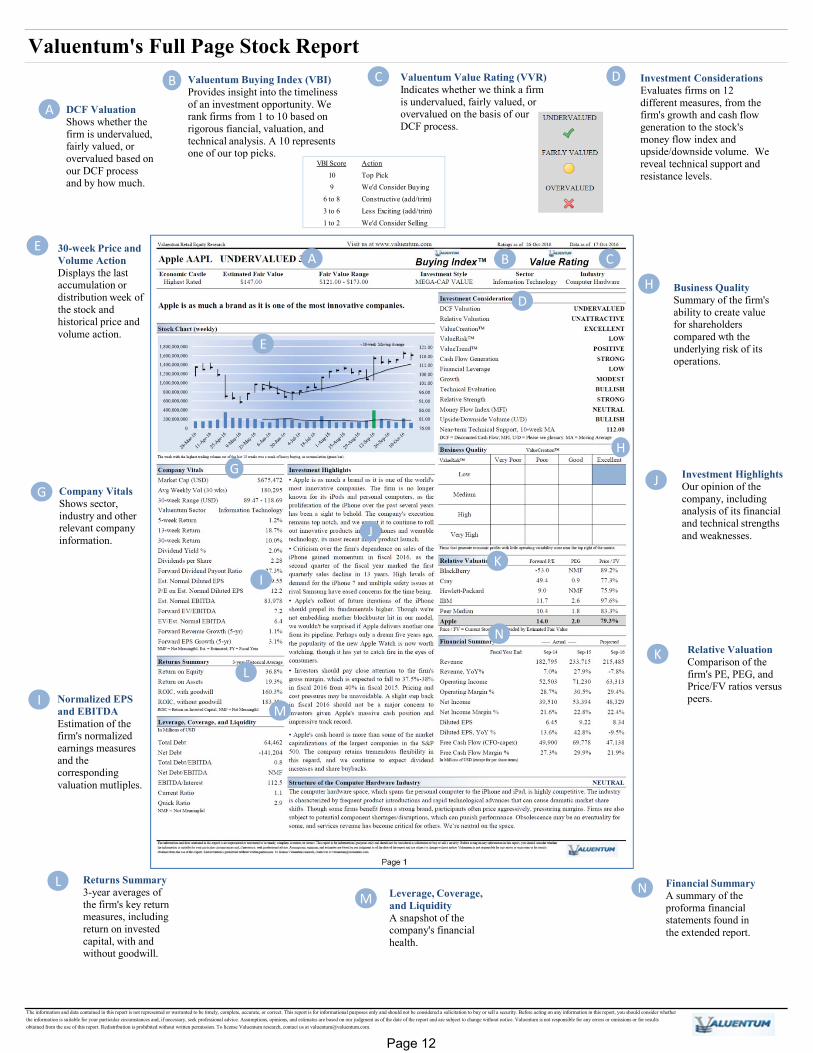
Valuentum's Full Page Stock Report
The information and data contained in this report is not represented or warranted to be timely, complete, accurate, or correct. This report is for informational purposes only and should not be considered a solicitation to buy or sell a security. Before acting on any information in this report, you should consider whether the information is suitable for your particular circumstances and, if necessary, seek professional advice. Assumptions, opinions, and estimates are based on our judgment as of the date of the report and are subject to change without notice. Valuentum is not responsible for any errors or omissions or for results obtained from the use of this report. Redistribution is prohibited without written permission. To license Valuentum research, contact us at [email protected].
BA
G
I
N
C
J
D
M
H
E
L
K
A DCF ValuationShows whether the firm is undervalued, fairly valued, or overvalued based on our DCF process and by how much.
B Valuentum Buying Index (VBI)Provides insight into the timeliness of an investment opportunity. We rank firms from 1 to 10 based on rigorous fiancial, valuation, and technical analysis. A 10 represents one of our top picks.
C Valuentum Value Rating (VVR) Indicates whether we think a firm is undervalued, fairly valued, or overvalued on the basis of our DCF process.
D Investment ConsiderationsEvaluates firms on 12 different measures, from the firm's growth and cash flow generation to the stock's money flow index and upside/downside volume. We reveal technical support and resistance levels.
E 30-week Price and Volume ActionDisplays the last accumulation or distribution week of the stock and historical price and volume action.
G Company VitalsShows sector,industry and other relevant company information.
H Business QualitySummary of the firm's ability to create value for shareholders compared wth the underlying risk of its operations.
I Normalized EPS and EBITDAEstimation of the firm's normalized earnings measures and the corresponding valuation mutliples.
J Investment HighlightsOur opinion of the company, including analysis of its financial and technical strengths and weaknesses.
K Relative ValuationComparison of the firm's PE, PEG, and Price/FV ratios versus peers.
L Returns Summary3-year averages of the firm's key return measures, including return on invested capital, with and without goodwill.
M Leverage, Coverage, and LiquidityA snapshot of the company's financial health.
N Financial SummaryA summary of the proforma financial statements found in the extended report.
VBI Score Action10 Top Pick9 We'd Consider Buying
6 to 8 Constructive (add/trim)3 to 6 Less Exciting (add/trim)1 to 2 We'd Consider Selling
Page 12
UNDERVALUED
FAIRLY VALUED
OVERVALUED
• Revenue Volatility • Margin Volatility • Earnings Volatility • Cash Flow VolatilityThe information and data contained in this report is not represented or warranted to be timely, complete, accurate, or correct. This report is for informational purposes only and should not be considered a solicitation to buy or sell a security. Before acting on any information in this report, you should consider whether the information is suitable for your particular circumstances and, if necessary, seek professional advice. Assumptions, opinions, and estimates are based on our judgment as of the date of the report and are subject to change without notice. Valuentum is not responsible for any errors or omissions or for results obtained from the use of this report. Redistribution is prohibited without written permission. To license Valuentum research, contact us at [email protected].
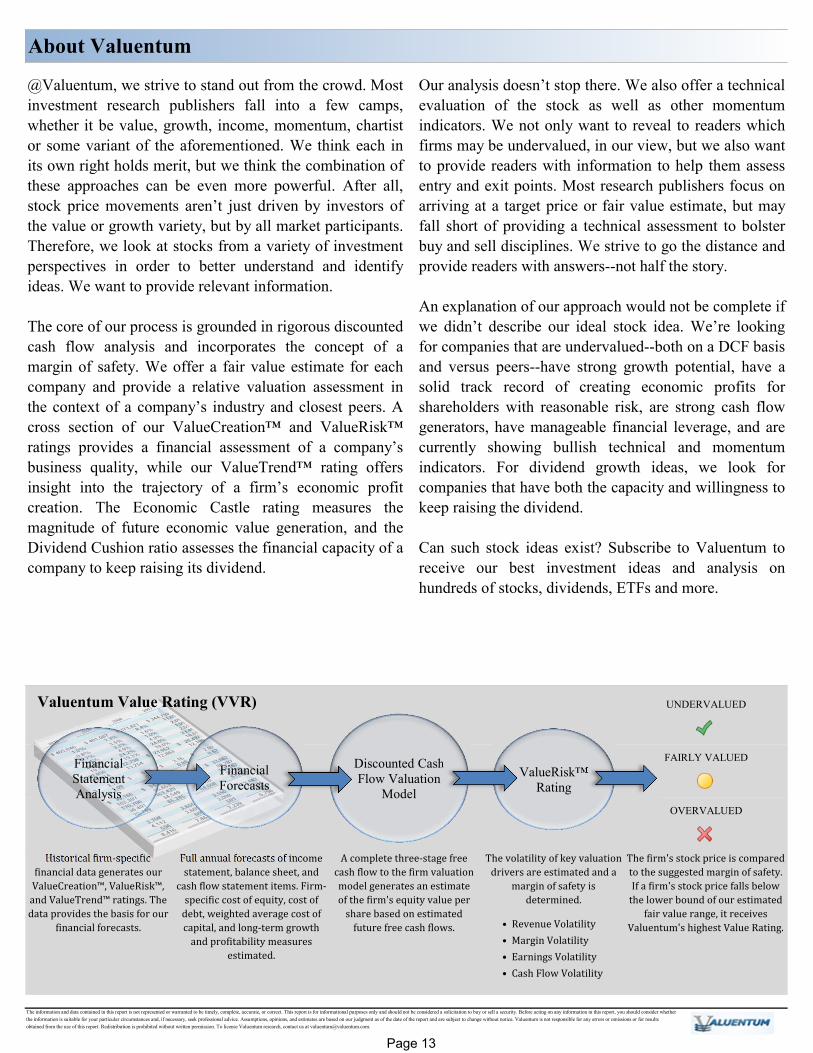
Historical firm-specific financial data generates our ValueCreation™, ValueRisk™, and ValueTrend™ ratings. The data provides the basis for our financial forecasts. Full annual forecasts of income statement, balance sheet, and cash flow statement items. Firm-specific cost of equity, cost of debt, weighted average cost of capital, and long-term growth and profitability measures estimated.
A complete three-stage free cash flow to the firm valuation model generates an estimate of the firm's equity value per share based on estimated future free cash flows.
@Valuentum, we strive to stand out from the crowd. Mostinvestment research publishers fall into a few camps,whether it be value, growth, income, momentum, chartistor some variant of the aforementioned. We think each inits own right holds merit, but we think the combination ofthese approaches can be even more powerful. After all,stock price movements aren’t just driven by investors ofthe value or growth variety, but by all market participants.Therefore, we look at stocks from a variety of investmentperspectives in order to better understand and identifyideas. We want to provide relevant information.
The core of our process is grounded in rigorous discountedcash flow analysis and incorporates the concept of amargin of safety. We offer a fair value estimate for eachcompany and provide a relative valuation assessment inthe context of a company’s industry and closest peers. Across section of our ValueCreation™ and ValueRisk™ratings provides a financial assessment of a company’sbusiness quality, while our ValueTrend™ rating offersinsight into the trajectory of a firm’s economic profitcreation. The Economic Castle rating measures themagnitude of future economic value generation, and theDividend Cushion ratio assesses the financial capacity of acompany to keep raising its dividend.
Our analysis doesn’t stop there. We also offer a technicalevaluation of the stock as well as other momentumindicators. We not only want to reveal to readers whichfirms may be undervalued, in our view, but we also wantto provide readers with information to help them assessentry and exit points. Most research publishers focus onarriving at a target price or fair value estimate, but mayfall short of providing a technical assessment to bolsterbuy and sell disciplines. We strive to go the distance andprovide readers with answers--not half the story.
An explanation of our approach would not be complete ifwe didn’t describe our ideal stock idea. We’re lookingfor companies that are undervalued--both on a DCF basisand versus peers--have strong growth potential, have asolid track record of creating economic profits forshareholders with reasonable risk, are strong cash flowgenerators, have manageable financial leverage, and arecurrently showing bullish technical and momentumindicators. For dividend growth ideas, we look forcompanies that have both the capacity and willingness tokeep raising the dividend.
Can such stock ideas exist? Subscribe to Valuentum toreceive our best investment ideas and analysis onhundreds of stocks, dividends, ETFs and more.
About Valuentum
The firm's stock price is compared to the suggested margin of safety. If a firm's stock price falls below the lower bound of our estimated fair value range, it receives Valuentum's highest Value Rating.The volatility of key valuation drivers are estimated and a margin of safety is determined.
Financial Forecasts
Financial Statement Analysis
Discounted Cash Flow Valuation
ModelValueRisk™
Rating
Valuentum Value Rating (VVR)
Page 13
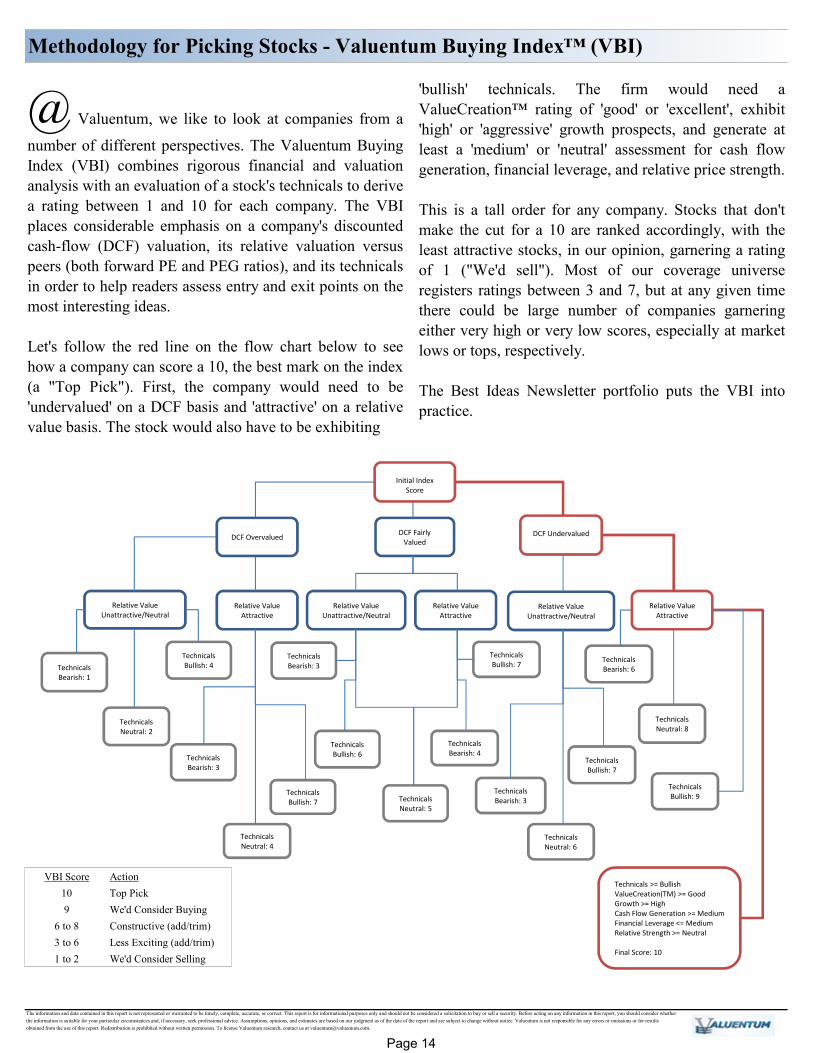
VBI Score Action10 Top Pick9 We'd Consider Buying
6 to 8 Constructive (add/trim)3 to 6 Less Exciting (add/trim)1 to 2 We'd Consider Selling
Methodology for Picking Stocks - Valuentum Buying Index™ (VBI)
The information and data contained in this report is not represented or warranted to be timely, complete, accurate, or correct. This report is for informational purposes only and should not be considered a solicitation to buy or sell a security. Before acting on any information in this report, you should consider whether the information is suitable for your particular circumstances and, if necessary, seek professional advice. Assumptions, opinions, and estimates are based on our judgment as of the date of the report and are subject to change without notice. Valuentum is not responsible for any errors or omissions or for results obtained from the use of this report. Redistribution is prohibited without written permission. To license Valuentum research, contact us at [email protected].
@ Valuentum, we like to look at companies from anumber of different perspectives. The Valuentum BuyingIndex (VBI) combines rigorous financial and valuationanalysis with an evaluation of a stock's technicals to derivea rating between 1 and 10 for each company. The VBIplaces considerable emphasis on a company's discountedcash-flow (DCF) valuation, its relative valuation versuspeers (both forward PE and PEG ratios), and its technicalsin order to help readers assess entry and exit points on themost interesting ideas.
Let's follow the red line on the flow chart below to seehow a company can score a 10, the best mark on the index(a "Top Pick"). First, the company would need to be'undervalued' on a DCF basis and 'attractive' on a relativevalue basis. The stock would also have to be exhibiting
'bullish' technicals. The firm would need aValueCreation™ rating of 'good' or 'excellent', exhibit'high' or 'aggressive' growth prospects, and generate atleast a 'medium' or 'neutral' assessment for cash flowgeneration, financial leverage, and relative price strength.
This is a tall order for any company. Stocks that don'tmake the cut for a 10 are ranked accordingly, with theleast attractive stocks, in our opinion, garnering a ratingof 1 ("We'd sell"). Most of our coverage universeregisters ratings between 3 and 7, but at any given timethere could be large number of companies garneringeither very high or very low scores, especially at marketlows or tops, respectively.
The Best Ideas Newsletter portfolio puts the VBI intopractice.
The information and data contained in this report is not represented or warranted to be timely, complete, accurate, or correct. This report is for informational purposes only and should not be considered a solicitation to buy or sell a security. Before acting on any information in this report, you should consider whether the information is suitable for your particular circumstances and, if necessary, seek professional advice. Assumptions, opinions, and estimates are based on our judgment as of the date of the report and are subject to change without notice. Valuentum is not responsible for any errors or omissions or for results obtained from the use of this report. Redistribution is prohibited without written permission. To license Valuentum research, contact us at [email protected].
Estimated Fair Value. This measure is our opinion of the fair equity value per share ofthe company. If our forecasts prove accurate, which may not always be the case, wemay expect a firm's stock price to converge to this value within the next 3 years.
Fair Value Range. The fair value range represents an upper bound and lower bound,between which we would consider the firm to be fairly valued. The range considers ourestimate of the firm's fair value and the margin of safety suggested by the volatility ofkey valuation drivers, including revenue, gross margin, earnings before interest, andenterprise free cash flow (the determinants behind our ValueRisk™ rating).
ValueCreation™. This is a proprietary Valuentum measure. ValueCreation™indicates the firm's historical track record in creating economic value for shareholders,taking the average difference between ROIC (without goodwill) and the firm'sestimated WACC during the past three years. The firm's performance is measured alongthe scale of EXCELLENT, GOOD, POOR, and VERY POOR. Those firms withEXCELLENT ratings have a demonstrated track record of creating economic value,while those that register a VERY POOR mark have been destroying economic value.
ValueRisk™. This is a proprietary Valuentum measure. ValueRisk™ indicates thehistorical volatility of key valuation drivers, including revenue, gross margin, earningsbefore interest, and enterprise free cash flow. The standard deviation of each measure iscalculated and scaled against last year's measure to arrive at a percentage deviation foreach item. These percentage deviations are weighted equally to arrive at thecorresponding fair value range for each stock, measured in percentage terms. The firm'sperformance is measured along the scale of LOW, MEDIUM, HIGH, and VERY HIGH.The ValueRisk™ rating for each firm also determines the fundamental beta of eachfirm along the following scale: LOW (0.85), MEDIUM (1), HIGH (1.15), VERY HIGH(1.3).
ValueTrend™. This is a proprietary Valuentum measure. ValueTrend™ indicates thetrajectory of the firm's return on invested capital (ROIC). Firms that earned an ROIClast year that was greater than the 3-year average of the measure earn a POSITIVErating. Firms that earned an ROIC last year that was less than the 3-year average of themeasure earn a NEGATIVE rating.
Business Quality Matrix. We compare the firm's ValueCreation™ and ValueRisk™ratings. The box is an easy way for investors to quickly assess the business quality ofa company. Firms that generate economic profits with little operating variabilityscore near the top right of the matrix.
Return on Invested Capital. At Valuentum, we place considerable emphasis onreturn on invested capital (both with and without goodwill). The measure focuses onthe return (earnings) the company is generating on its operating assets and is superiorto return on equity and return on assets, which can be skewed by a firm's leverage orexcess cash balance, respectively.
Range of Potential Outcomes. The firm's margin of safety is shown in the graphicof a normal distribution. We consider a firm to be undervalued if its stock price fallsalong the green line and overvalued if the stock price falls along the red line. Weconsider the firm to be fairly valued if its stock price falls along the yellow line.
Money Flow Index (MFI). The MFI is a technical indicator that measures buyingand selling pressure based on both price and volume. Traders typically use thismeasure to identify potential reversals with overbought and oversold levels. We use a14-week measure to rank firms along the following scale: EXTREMELYOVERBOUGHT (>90), OVERBOUGHT (80-90), NEUTRAL (20-80), OVERSOLD(10-20), EXTREMELY OVERSOLD (0-10).
Upside/Downside Volume. Heavy volume on up days and lower volume on down days suggests that institutions are heavily participating in a stock's upward advance. We use the trailing 14-week average of upside and downside volume to calculate an informative ratio. We rank each firm's U/D volume ratio along the following scale: BULLISH, IMPROVING, DETERIORATING, and BEARISH.
Relative Value. We compare the firm's forward price-to earnings (PE) ratio and itsprice/earnings-to-growth (PEG) ratio to that of its peers. If both measures fall below thepeer median, the firm receives an ATTRACTIVE rating. If both are above the peermedian, the firm receives an UNATTRACTIVE rating. Any other combination resultsin a NEUTRAL rating.
Cash Flow Generation. Firms' cash flow generation capacity are measured along thescale of STRONG, MEDIUM, and WEAK. A firm with a 3-year historical free cashflow margin (free cash flow divided by sales) greater than 5% receives a STRONGrating, while firms earning less than 1% of sales as free cash flow receive a WEAKrating.
Financial Leverage. Based on the firm's normalized debt-to-EBITDA metric, we rank firms on the following scale: LOW, MEDIUM, and HIGH. Companies with a normalized debt-to-EBITDA ratio below 1.5 receive a LOW score, while those with a measure above 3 receive a HIGH score.
Timeliness Matrix. We compare the company's recent stock performance relative tothe market benchmark with our assessment of its valuation. Firms that areexperiencing near-term stock price outperformance and are undervalued by ourestimate may represent timely buys.
Stock Price Relative Strength. We assess the perfomance of the company's stockduring the past quarter, 13 weeks, relative to an ETF that mirrors the aggregateperformance of constituents of the stock market. Firms are measured along the scaleof STRONG, NEUTRAL, and WEAK. Companies that have outperformed themarket index by more than 2.5% during this 13-week period receive a STRONGrating, while firms that trailed the market index by more than 2.5% during this 13-week period receive a WEAK rating.
Glossary
Technical Evaluation. We evaluate a firm's near-term and medium-term movingaverages and money flow index (MFI) to assign each firm a rating along thefollowing scale: VERY BULLISH, BULLISH, NEUTRAL, BEARISH, and VERYBEARISH.
DCF Valuation. We opine on the firm's valuation based on our DCF process. Firmsthat are trading with an appropriate discount to our fair value estimate receive anUNDERVALUED rating. Firms that are trading within our fair value range receive aFAIRLY VALUED rating, while firms that are trading above the upper bound of ourfair value range receive an OVERVALUED rating.
Investment Style. Valuentum uses its own proprietary stock-classification system.Nano-cap: Less than $50 million; Micro-cap: Between $50 million and $200 million;Small-cap: Between $200 million and $2 billion; Mid-cap: Between $2 billion and$10 billion; Large-cap: Between $10 billion and $200 billion; Mega-cap: Over $200billion. Blend: Firm's that we think are undervalued and exhibit high growthprospects (growth in excess of three times the rate of assumed inflation). Value:Firm's that we believe are undervalued, but do not exhibit high growth prospects.Growth: Firms that are not undervalued, in our opinion, but exhibit high growthprospects. Core: Firms that are neither undervalued nor exhibit high growthprospects.
Company Vitals. In this section, we list key financial information and the sector andindustry that Valuentum assigns to the stock. The P/E-Growth (5-yr), or PEG ratio,divides the current share price by last year's earnings (EPS) and then divides thatquotient by our estimate of the firm's 5-year EPS growth rate. The estimatednormalized diluted EPS and estimated normalized EBITDA represent the five-yearforward average of these measures used in our discounted cash flow model. The P/Eon estimated normalized EPS divides the current share price by estimated normalizeddiluted EPS. The EV/estimated normalized EBITDA considers the current enterprisevalue of the company and divides it by estimated normalized EBITDA. EV is definedas the firm's market capitalization plus total debt, minority interest, preferred stockless cash and cash equivalents.
Copyright (c) 2017 by Valuentum, Inc. All rights reserved.No part of this publication may be reproduced in any form or by any means.The information contained in this report is not represented or warranted to be accurate, correct,complete, or timely. This report is for informational purposes only and should not be considered asolicitation to buy or sell any security. No warranty or guarantee may be created or extended bysales or promotional materials, whether by email or in any other format. The securities or strategiesmentioned herein may not be suitable for all types of investors. The information contained in thisreport does not constitute any advice, especially on the tax consequences of making any particularinvestment decision. This material is not intended for any specific type of investor and does nottake into account an investor's particular investment objectives, financial situation or needs. Thisreport is not intended as a recommendation of the security highlighted or any particular investmentstrategy. Before acting on any information found in this report, readers should consider whethersuch an investment is suitable for their particular circumstances, perform their own due-diligence,and if necessary, seek professional advice. The sources of the data used in this report are believed by Valuentum to be reliable, but the data’saccuracy, completeness or interpretation cannot be guaranteed. Assumptions, opinions, andestimates are based on our judgment as of the date of the report and are subject to change withoutnotice. Valuentum is not responsible for any errors or omissions or for results obtained from the useof this report and accepts no liability for how readers may choose to utilize the content. In no eventshall Valuentum be liable to any party for any direct, indirect, incidental, exemplary, compensatory,punitive, special or consequential damages, costs, expenses, legal fees, or losses (including, withoutlimitation, lost income or lost profits and opportunity costs) in connection with any use of theinformation contained in this document. Investors should consider this report as only a single factorin making their investment decision. Valuentum is not a money manager, is not a registered investment advisor, and does not offerbrokerage or investment banking services. Valuentum has not received any compensation from thecompany or companies highlighted in this report. Valuentum, its employees, independentcontractors and affiliates may have long, short or derivative positions in the securities mentionedherein. Information and data in Valuentum’s valuation models and analysis may not capture allsubjective, qualitative influences such as changes in management, business and political trends, orlegal and regulatory developments. Redistribution is prohibited without written permission. Readersshould be aware that information in this work may have changed between when this work waswritten or created and when it is read. There is risk of substantial loss associated with investing infinancial instruments. Valuentum's company-specific forecasts used in its discounted cash flow model are rules-based.These rules reflect the experience and opinions of Valuentum's analyst team. Historical data used inour valuation model is provided by Xignite and from other publicly available sources includingannual and quarterly regulatory filings. Stock price and volume data is provided by Xignite. Nowarranty is made regarding the accuracy of any data or any opinions. Valuentum's valuation modelis based on sound academic principles, and other forecasts in the model such as inflation and theequity risk premium are based on long-term averages. The Valuentum proprietary automated text-generation system creates text that will vary by company and may often change for the samecompany upon subsequent updates. Valuentum uses its own proprietary stock investment style and industry classification systems. Peercompanies are selected based on the opinions of the Valuentum analyst team. Research reports anddata are updated periodically, though Valuentum assumes no obligation to update its reports,opinions, or data following publication in any form or format. Performance assessment ofValuentum metrics, including the Valuentum Buying Index, is ongoing, and we intend to updateinvestors periodically, though Valuentum assumes no obligation to do so. Not all information isavailable on all companies. There may be a lag before reports and data are updated for stock splitsand stock dividends. Past simulated performance, whether backtested or walk-forward or other, is not a guarantee offuture results. For general information about Valuentum's products and services, please contact usat [email protected] or visit our website at www.valuentum.com.
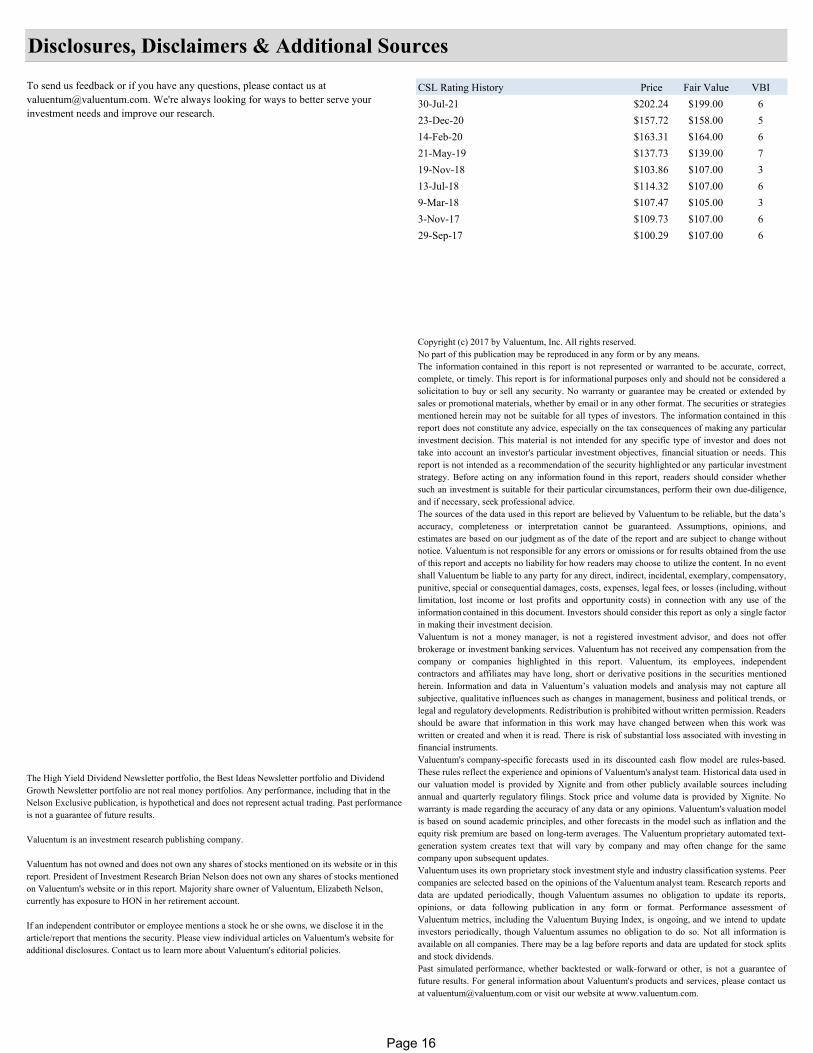
To send us feedback or if you have any questions, please contact us at [email protected]. We're always looking for ways to better serve your investment needs and improve our research.
Disclosures, Disclaimers & Additional Sources
The High Yield Dividend Newsletter portfolio, the Best Ideas Newsletter portfolio and Dividend Growth Newsletter portfolio are not real money portfolios. Any performance, including that in the Nelson Exclusive publication, is hypothetical and does not represent actual trading. Past performance is not a guarantee of future results.
Valuentum is an investment research publishing company.
Valuentum has not owned and does not own any shares of stocks mentioned on its website or in this report. President of Investment Research Brian Nelson does not own any shares of stocks mentioned on Valuentum's website or in this report. Majority share owner of Valuentum, Elizabeth Nelson, currently has exposure to HON in her retirement account.
If an independent contributor or employee mentions a stock he or she owns, we disclose it in the article/report that mentions the security. Please view individual articles on Valuentum's website for additional disclosures. Contact us to learn more about Valuentum's editorial policies.