14
Silica Under Pressure: From DFT to QMC Carnegie Institute, August 22-24, 2006 K. P. Driver Department of Physics The Ohio State University

Silica Under Pressure: From DFT to QMC
Carnegie Institute,August 22-24, 2006
K. P. DriverDepartment of Physics
The Ohio State University

Outline
Motivation: Physics Inside the Earth
• High pressure phases of silica are important in science and technology
• Silica exhibits a rich phase diagram and is ideal testing ground
Methodology: DFT and QMC
• DFT and and the quality of functionals for silica
• QMC will potentially provide the highest accuracy for silica phases
Results: DFT of Silica and What We’ve Learned From Silicon
• Silica energetics differ in the LDA, PW91, and PBE approximations
• In silicon, ladder of functionals shows new hybrid HSE functional promising
Challenges Ahead in QMC for Silica
• Finite-size and fixed-node errors may be significant in silica
• Methods of correcting finite-size errors are to be implemented

Minerals Under Pressure: Silica
AtmosphereCrustMantleOuter CoreInner Core
Pressure (Mbar)Temperature (C)Depth (km)
720043002700
0 0
~3.5~3.0~1
63004300
870−37000
• High pressure phases of minerals, such as silica, exist inside the Earthand during meteor collisions.
• Silica is ubiquitous in rock-forming minerals and in modern technology.
• Knowing high pressure behavior of silica is important to understand the interior of Earth.
• Accurate computational methods allow us to explore phases of silica that are difficult tomeasure directly.
• Silica is found to exist in a rich variety of crystal phases.

Silica Phase Diagram
10 20 30 40 50 60 70 80 90 100
300
600
900
Pressure (kbar)
1200
1500
1800
00
Tem
pera
ture
( C
)o
High−quartz
Coesite
Stishovite
Low−quartz
• Low pressure phases: SiO4 tetrahedra; High pressure phases: SiO6 octahedra.

DFT Calculations: Functional Ladder
HDFT = T + VHartree + VXC[n, ...]
GGAmeta−
density + density gradient + orbital kinetic energy (TPSS)
charge density
.
.
.Experiment
(QMC)Monte CarloQuantum
LDA
GGA
Vxc dependence
Hybrid
density + density gradient (PW91, PBE)
Heaven ofChemicalAccuracy
density + density gradient + some exact exchange (HSE)(mixture of PBE and HF) [2]
Many−body wavefunction
[1] J. P. Perdew et al. “Climbing the Density Functional Ladder.” Phys. Rev. Lett. 91, 146401 (2003).
[2] J. Heyd and G. Scuseria, J. Chem. Phys. 120, 7274 (2004).
• Get started with DFT to produce orbitals for QMC.
• Determine which functionals work best for silica.
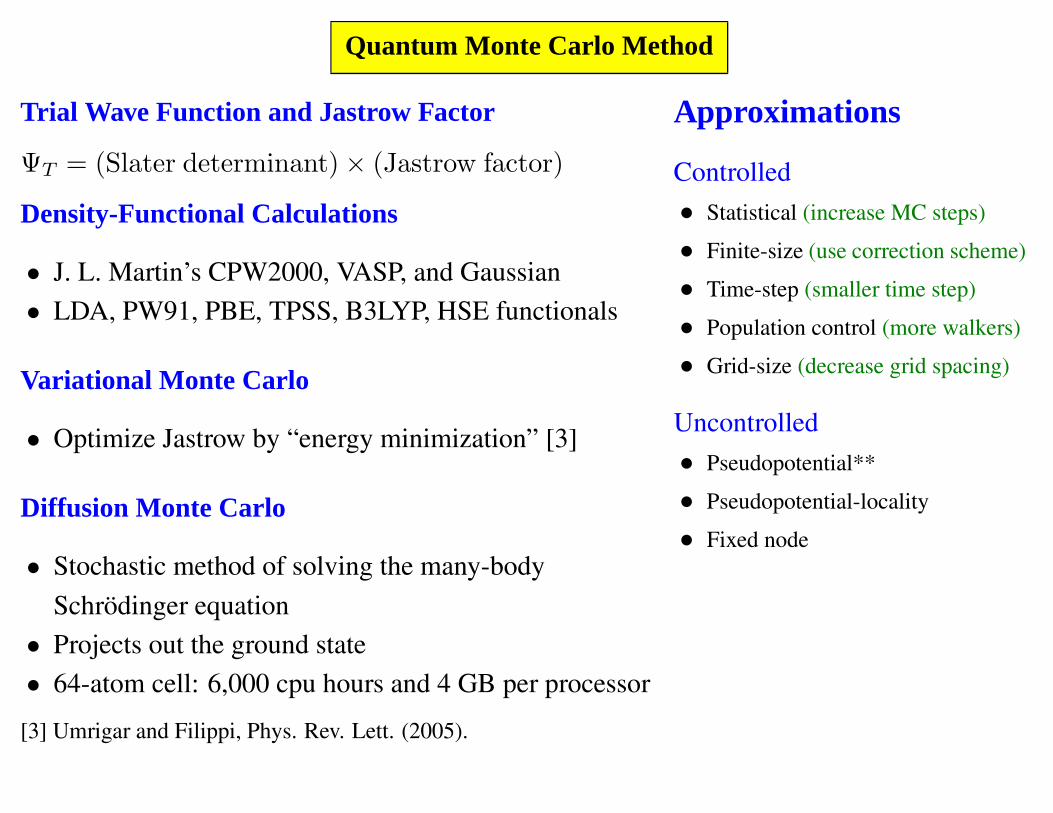
Quantum Monte Carlo Method
Trial Wave Function and Jastrow Factor
ΨT = (Slater determinant) × (Jastrow factor)
Density-Functional Calculations
• J. L. Martin’s CPW2000, VASP, and Gaussian• LDA, PW91, PBE, TPSS, B3LYP, HSE functionals
Variational Monte Carlo
• Optimize Jastrow by “energy minimization” [3]
Diffusion Monte Carlo
• Stochastic method of solving the many-bodySchrodinger equation
• Projects out the ground state• 64-atom cell: 6,000 cpu hours and 4 GB per processor
[3] Umrigar and Filippi, Phys. Rev. Lett. (2005).
Approximations
Controlled• Statistical (increase MC steps)• Finite-size (use correction scheme)• Time-step (smaller time step)• Population control (more walkers)• Grid-size (decrease grid spacing)
Uncontrolled• Pseudopotential**• Pseudopotential-locality• Fixed node

Phases of Silica: Energy vs. Volume in the LDA
20 30 40 50
Volume (Å3/SiO2)
-26.0
-25.8
-25.6
Ener
gy (e
V/S
iO2)
PAW Potential, LDA Functional
Low Quartz
CoesiteStishovite
Transition Pressures (GPa) LDA PBE PW91 ExperimentLow Quartz to Coesite 0.5 4.1 4.4 1.8
Low Quartz to Stishovite -2.2 7.0 6.7 7.2Coesite to Stishovite -0.2 6.6 6.6 7.2
Energy Difference (eV/SiO2)
Coesite - Low Quartz 0.01 0.09 0.09 0.04Stishovite - Low Quartz -0.02 0.56 0.55 0.45

Phases of Silica: Energy vs. Volume using PBE-GGA
20 30 40 50 60
Volume (Å3/SiO2)
-24.0
-23.8
-23.6
-23.4
-23.2
-23.0
-22.8
-22.6
Ener
gy (e
V/S
iO2)
PAW Potential, PBE Functional
Low Quartz
Coesite
Stishovite
Transition Pressures (GPa) LDA PBE PW91 ExperimentLow Quartz to Coesite 0.5 4.1 4.4 1.8
Low Quartz to Stishovite -2.2 7.0 6.7 7.2Coesite to Stishovite -0.2 6.6 6.6 7.2
Energy Difference (eV/SiO2)
Coesite - Low Quartz 0.01 0.09 0.09 0.04Stishovite - Low Quartz -0.02 0.56 0.55 0.45

Phases of Silica: Energy vs. Volume using PW91-GGA
20 30 40 50 60
Volume (Å3/SiO2)
-24.0
-23.8
-23.6
-23.4
-23.2
-23.0
-22.8
-22.6
Ener
gy (e
V/S
iO2)
PAW Potential, PW91 Functional
Low Quartz
High Quartz
CoesiteStishovite
Transition Pressures (GPa) LDA PBE PW91 ExperimentLow Quartz to Coesite 0.5 4.1 4.4 1.8
Low Quartz to Stishovite -2.2 7.0 6.7 7.2Coesite to Stishovite -0.2 6.6 6.6 7.2
Energy Difference (eV/SiO2)
Coesite - Low Quartz 0.01 0.09 0.09 0.04Stishovite - Low Quartz -0.02 0.56 0.55 0.5

Phases of Silica: Summary of Functional Data
• LDA substantially underestimates transition pressures and phase energy differences.
• GGAs give a more realistic description for high-pressure phases.
• GGAs tend to slightly underestimate transition pressuresand overestimate energy differences.
• Both LDA and GGA fail to describe the low quartz to coesite transition.
Opportunities to improve accuracy:-Meta-GGA and Hybrid functionals-QMC

Past Experience: Silicon Diamond to Beta-tin Transition
Approximation LDA PW91 PBE TPSS HSE DMC[4,5] Exp.
∆E [meV] 213 321 284 301 471 440(20)p [GPa] 6 10 8 7 14 14(1), 16.5(5) 10-13
[4] R. Hennig, [5] D. Alfe, PRB, v70, 2004
• Hybrid HSE functional agrees best with DMC.• Other functionals underestimate the phase energy difference.• DMC pressure may be too high from finite size and fixed node errors.

Accuracy of Functionals for Silicon Interstitials
X H T0.0
1.0
2.0
3.0
4.0
5.0
Form
atio
n en
ergy
[eV
]
LDA
QM
C
GG
A
HSE
LDA
GG
A
HSE
QM
C
LDA
GG
A
HSE
QM
C
6.0
mG
GA
mG
GA
mG
GA
.
.
.
LDA
GGA
Hybrid
QMC
GGAmeta−
Neutral Defects16−atom cells
• Single interstitial results agree with earlier QMC by Leung et al [5].• Observe systematic improvement of density functionals, and HSE is accurate.
[5] W. K. Leung, R. J. Needs, G. Rajagopal, S. Itoh and S.Ihara, Phys. Rev. Lett. 83, 2351 (1999).

Finite Size Errors in Silicon
8 16 32 54 64Natoms
2
3
4
5
6
Efo
rm (e
V)
DMC
LDA
GGA
VMC
Neutral, X Defect
• Finite Size errors are fictitious correlations introduced by PBCs.
• Finite size errors in silicon defects disappear in the subtraction.
• When comparing different phases, such cancellation isn’t expected.
• For silica, finite-size correction is needed for accuracy in QMC.
Finite size correction schemes to be implemented in Umrigar code:1) Fraser “Model Periodic Coulomb” correction (PRB, v53, p1814 (1996))2) Chiesa “Structure Factor” correction (PRL, v97, p076404-1 (2006))

Summary of Progress and Future Goals
• In Preparation for QMC, several high pressure of phases of silica have been studied withinDFT (LDA, PW91, and PBE) - and more phases/functionals to come.
• Continued exploration of the DFT functional ladder for silica may prove useful forcalculations outside of the (size/time) scope of QMC.
• Implementing finite size correction methods into Umrigar code is important for accuracyand will improve efficiency (allow use of smaller systems).
• Try QMC to achieve highly accurate silica phase energies andtransition pressures.


