33
CARPE DIEM Centre for Water Resources Research NUID-UCD Contribution to Area-3 Dusseldorf meeting 26th to 28th May 2003
| Date post: | 25-Dec-2015 |
| Category: |
Documents |
| Upload: | percival-bruce |
| View: | 218 times |
| Download: | 1 times |

CARPE DIEM
Centre for Water Resources Research
NUID-UCD
Contribution to Area-3
Dusseldorf meeting
26th to 28th May 2003
AREA-3
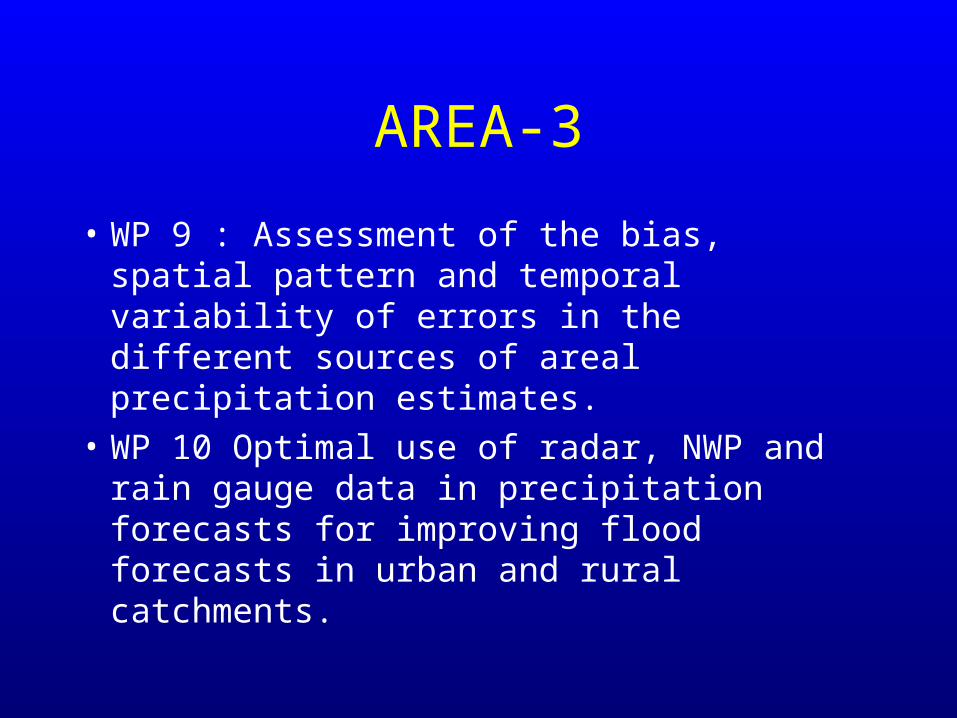
• WP 9 : Assessment of the bias, spatial pattern and temporal variability of errors in the different sources of areal precipitation estimates.
• WP 10 Optimal use of radar, NWP and rain gauge data in precipitation forecasts for improving flood forecasts in urban and rural catchments.
WP 9 : Assessment of the bias, spatial pattern and temporal variability of errors
in the different sources of areal precipitation estimates
• New/ongoing 1: SMHI
• New/ongoing 2 : CWRR-NUID

Swedish catchment
0 m
5 0 m
1 0 0 m
1 5 0 m
2 0 0 m
2 5 0 m
3 0 0 m
3 5 0 m
4 0 0 m
4 5 0 m
5 0 0 m
5 5 0 m
6 0 0 m
6 5 0 m
7 0 0 m
7 5 0 m
0 10 20 30 40 50 60 70 80 90 100 k m
Catchment area: 4295 km2
MAP: ~700 mm
Location of rainfall stations

Precipitation estimates• Interpolated station observations (PTHBV)
– Based on all available stations, corrected for observation losses.
– Optimal interpolation.
– Frequencies of wind direction and wind speed included in the description of the topographic influence.
– Spatial resolution 4x4km2. Temporal resolution 24 hours.
– Period with data 1961-2002.
• Radar estimates– Spatial resolution 2x2 km2. Temporal resolution 3 hours.
– Evaluation so far only made for accumulated 24 hour precipitation.
– Period with data 2000-2002.
• Hirlam forecasts– Spatial resolution 22x22 km2. Temporal resolution 6 hours.
– Evaluation so far only made for accumulated 24 hour precipitation (6-30hours).
– Period with data 2002.

Results-1• Comparison of radar and interpolated
station data 2000-2002– Higher spatial resolution and realistic spatial variability
for single days in radar data
– Technical problems cause non-realistic local spatial gradients in radar data.
– Systematic deviations both spatially and temporally - could be explained by technical problems and/or physiographic factors.
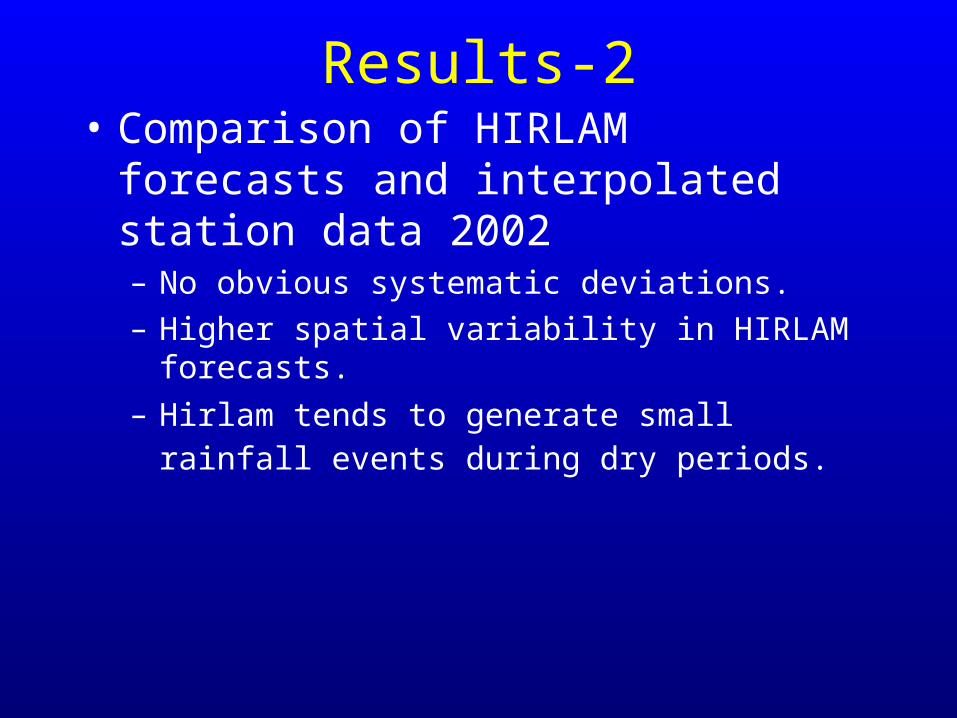
Results-2• Comparison of HIRLAM forecasts and
interpolated station data 2002– No obvious systematic deviations.
– Higher spatial variability in HIRLAM forecasts.
– Hirlam tends to generate small rainfall events during dry periods.
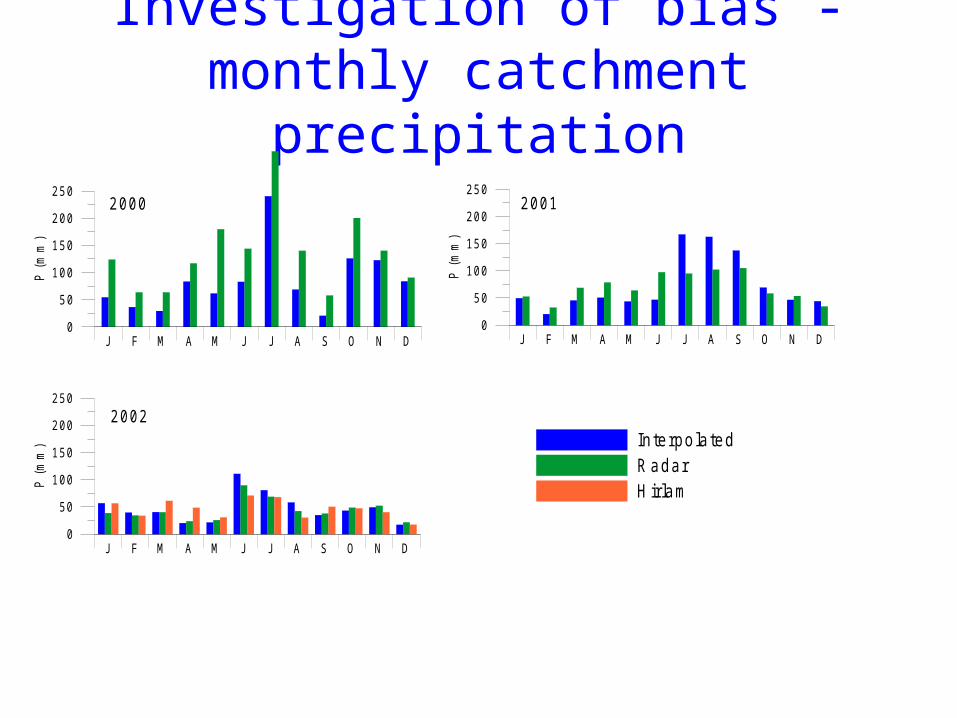
Investigation of bias - monthly catchment precipitation
0
50
100
150
200
250
P (
mm
)
J F M A M J J A S O N D
2000
0
50
100
150
200
250
P (
mm
)
J F M A M J J A S O N D
2001
0
50
100
150
200
250
P (
mm
)
J F M A M J J A S O N D
2002In terpolatedRadarH irlam

Investigation of bias - spatial distributionAnnual precipitation 2002
562
621
549
633
484
574 644582
660
635
529
597
350 m m
400 m m
450 m m
500 m m
550 m m
600 m m
650 m m
700 m m
Interpolated Radar
Hirlam
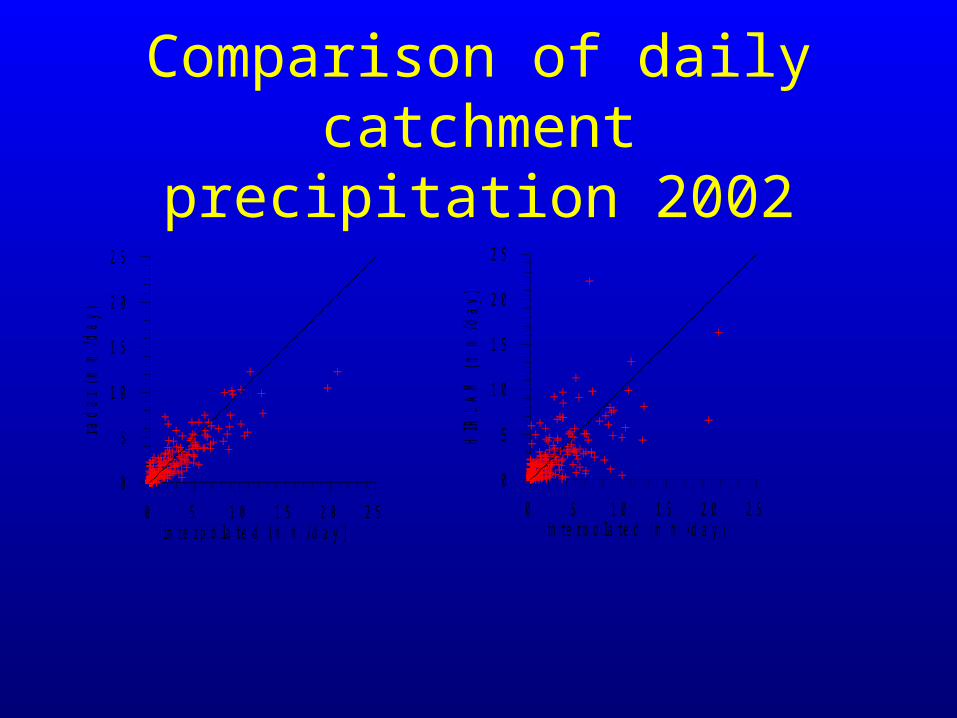
Comparison of daily catchment precipitation 2002
0 5 10 15 20 25interpolated (m m /day)
0
5
10
15
20
25
HIR
LA
M (
mm
/da
y)
0 5 10 15 20 25in te rpo la ted (m m /day)
0
5
10
15
20
25
rad
ar
(mm
/da
y)
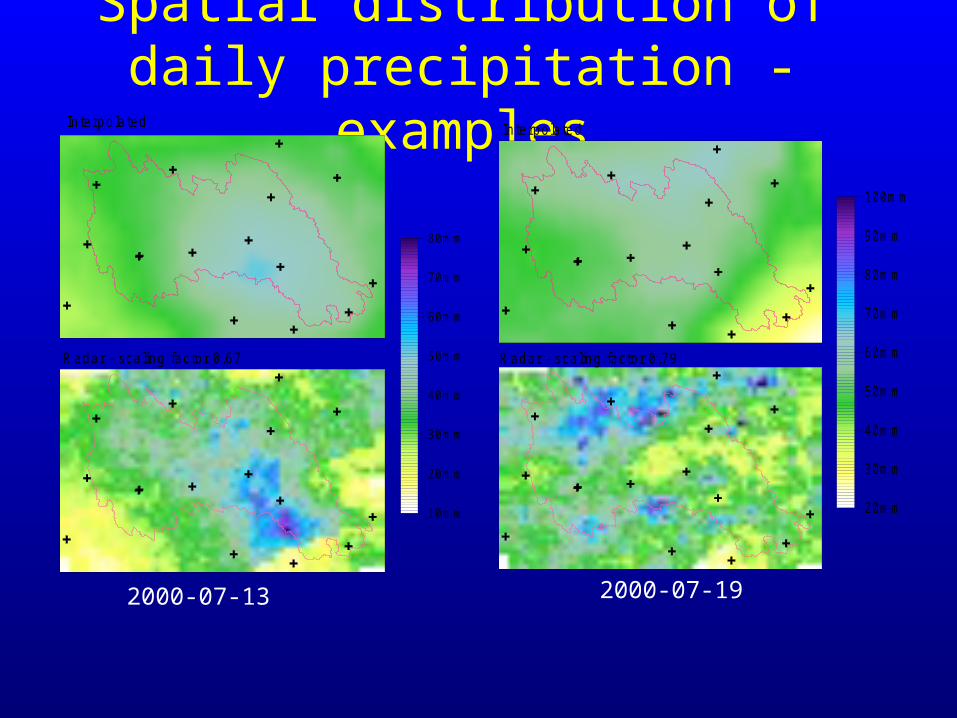
Spatial distribution of daily precipitation - examples
20m m
30m m
40m m
50m m
60m m
70m m
80m m
90m m
100m m
Interpo la ted
R adar - sca ling factor 0 .79
10m m
20m m
30m m
40m m
50m m
60m m
70m m
80m m
In terpo la ted
R adar - sca ling factor 0 .67
2000-07-13 2000-07-19

Grid by grid comparison of radar and interpolated data
-0.4
-0.3
-0.2
-0.1
0
0.1
0.2
0.3
0.4
100 200 300 400 500
Grid node altitude (m.a.s.l.)
Mea
n d
aily
dif
fere
nce
(m
m)
-1
-0.5
0
0.5
1
J F M A M J J A S O N D
Month
Mea
n d
aily
dif
fere
nce
(m
m)
Deviations versus altitude
data edinterpolationprecipitat radar
Daily ratios
Deviations versus season
computed for each grid and then
classified by altitude and month respectively. Values from 2002.
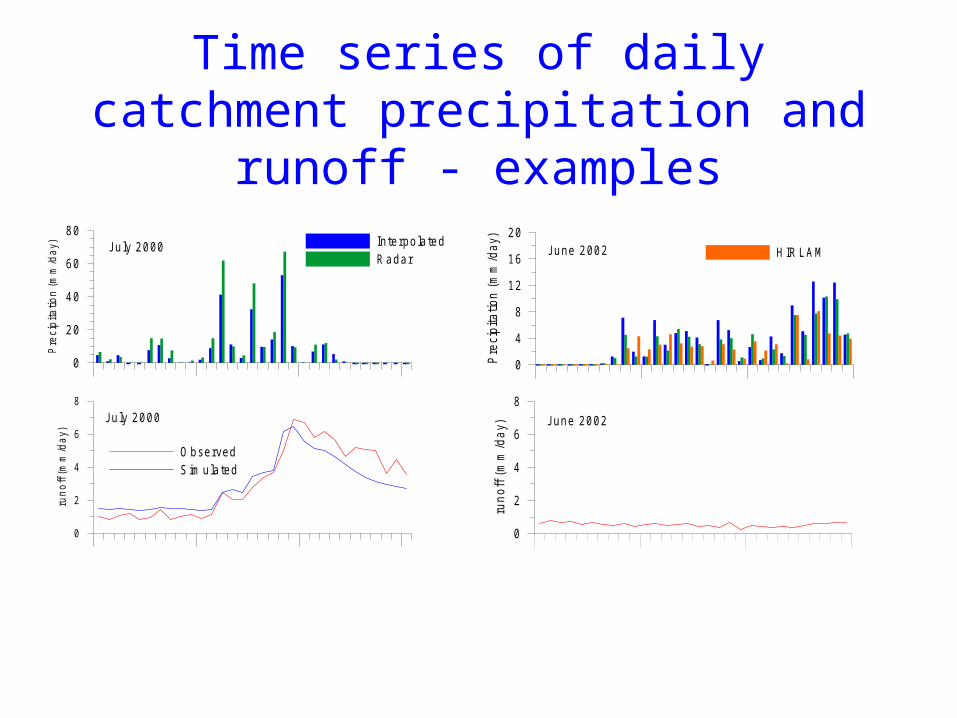
Time series of daily catchment precipitation and runoff - examples
0
20
40
60
80
Pre
cip
itatio
n (
mm
/da
y) In terpolatedRadar
0
2
4
6
8
run
off
(mm
/da
y)
O bservedS im ulated
July 2000
July 2000
0
4
8
12
16
20
Pre
cipi
tatio
n (m
m/d
ay)
H IR LAM
0
2
4
6
8
run
off
(m
m/d
ay)
June 2002
June 2002

Future work-1
• Further analysis of deviations between radar and interpolated station data
• Runoff simulations with different precipitation estimates – analysis of the effects of the higher temporal and spatial
variability of radar data

Future work-2
• Development of methods for combining radar and point observations in an optimal way– Evaluation of methods for handling the uncertainty in
radar data (caused by technical problems)

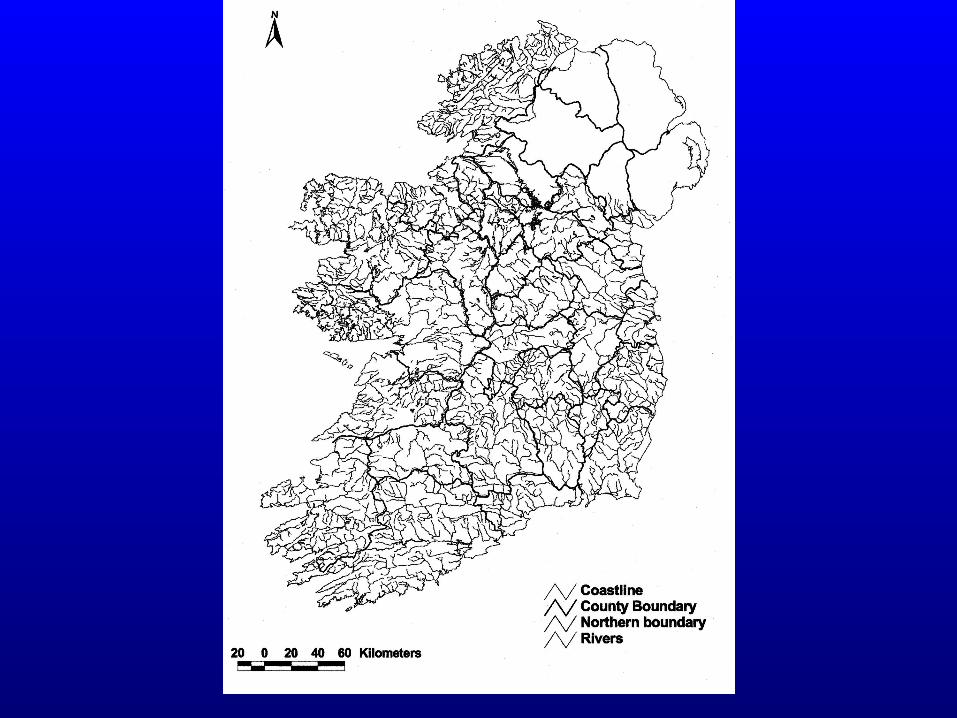
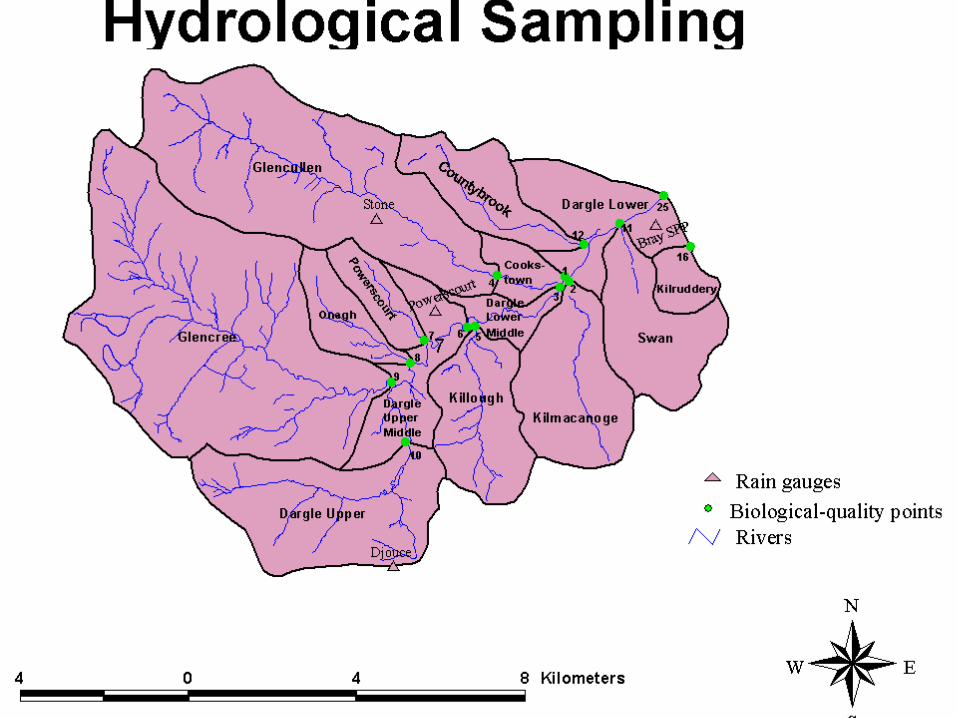
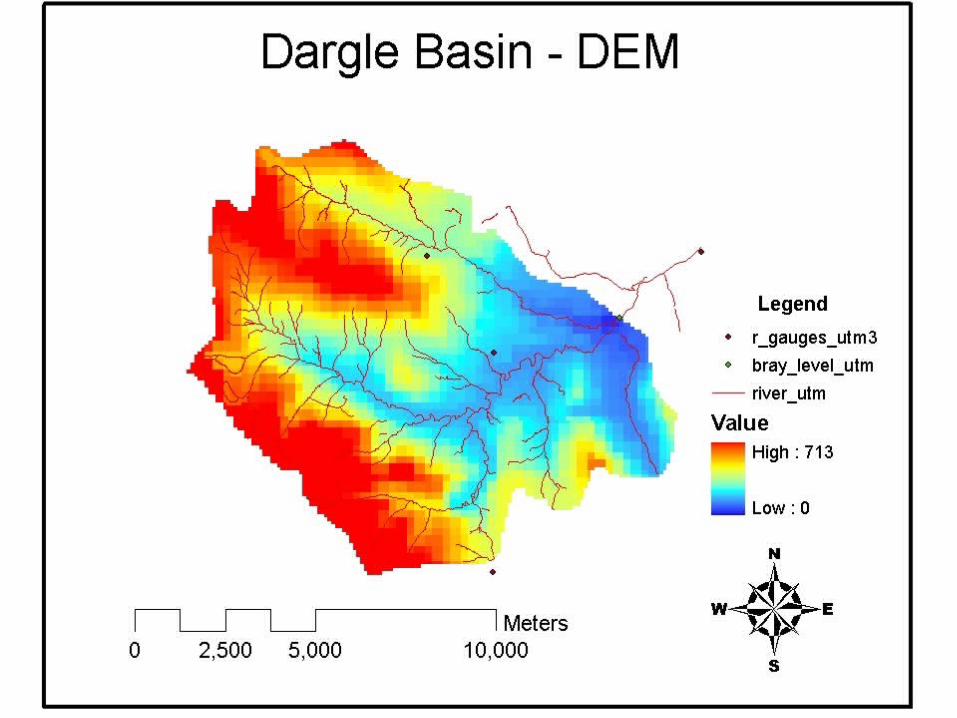
CWRR-NUID Catchment
• Dargle river catchment (100 km2)
• East coast of Ireland
• Mainly rural

CWRR-NUID Planned Activities
• Data collection for Case Study (Dargle catchment)
• Implementation of TOPKAPI Model for Dargle catchment ( together with PROGEA/Prof. Todini)
• Sensitivity studies
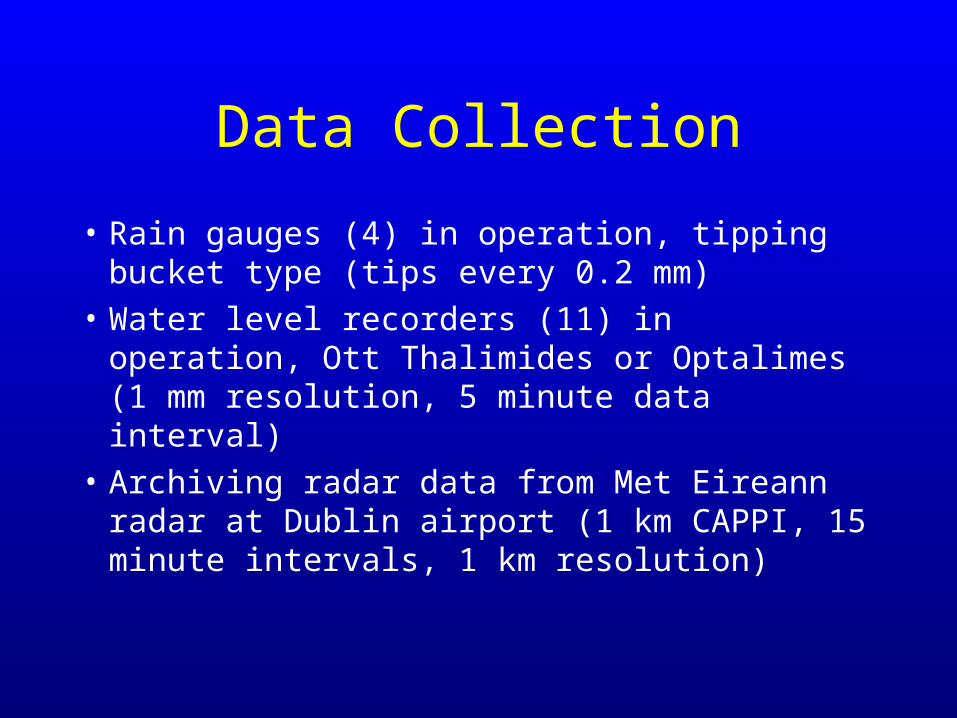
Data Collection
• Rain gauges (4) in operation, tipping bucket type (tips every 0.2 mm)
• Water level recorders (11) in operation, Ott Thalimides or Optalimes (1 mm resolution, 5 minute data interval)
• Archiving radar data from Met Eireann radar at Dublin airport (1 km CAPPI, 15 minute intervals, 1 km resolution)

TOPKAPI Model Structure


Comments
• Dry summer
• Wet winter with many significant storms, at least 10 significant events in period September to December alone.
• Good possibilities for hydrological model evaluation.

Implementing Topkapi: to dos from Colchester
• To do : Add baseflow component and calibrate model. (completed)
• To do : Do sensitivity analysis and evaluations (adding data from 2003)
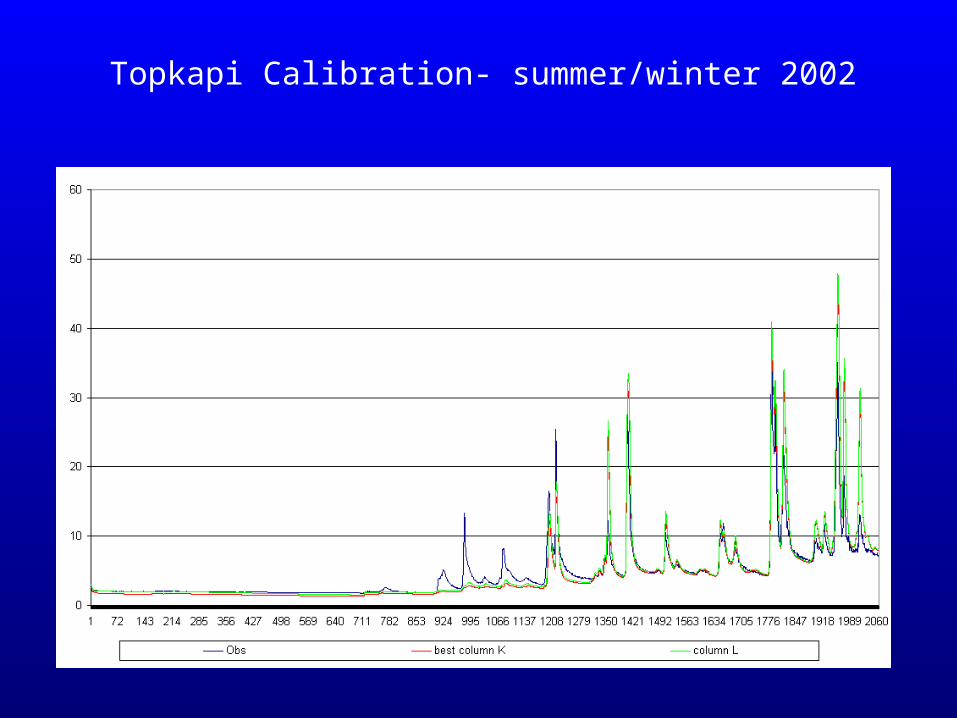
Topkapi Calibration- summer/winter 2002

Topkapi Calibration- detail

Additional work• Analysis and integration of archived radar
data. (commenced)
• Inclusion of HIRLAM output. (to be commenced when storms to be analysed are chosen)
• Refining rating equations for catchment gauges (on-going)

WP 10 Optimal use of radar, NWP and rain gauge data in precipitation forecasts for improving flood forecasts in urban
and rural catchments.
• Commenced January 2003
• Builds on results and data from WP9


