113
Carplus Annual Survey of Car Clubs 2012/13 london Prepared for Carplus by Steer Davies Gleave
| Date post: | 24-Mar-2016 |
| Category: |
Documents |
| Upload: | amy-clancy |
| View: | 213 times |
| Download: | 0 times |

Carplus Annual Survey of Car Clubs 2012/13london
Prepared for Carplus by Steer Davies Gleave


Carplus Annual Survey 2012/13
Results for London
Report
June 2013
Prepared for: Prepared by:
Carplus
First Floor
Leeds Bridge House
Hunslet Road
Leeds, LS10 1JN
Steer Davies Gleave
West Riding House
67 Albion Street
Leeds, LS1 5AA
Cover photo courtesy of Zipcar
+44 (0)113 389 6400
www.steerdaviesgleave.com


Results for London
Contents
CONTENTS
FOREWORD ........................................................................................... I
Background ............................................................................................ i
The Carplus Annual Survey 2012/13 ............................................................. ii
1 EXECUTIVE SUMMARY ............................................................................. 1
Member and Joiners Survey ........................................................................ 1
Corporate Member Survey .......................................................................... 2
Corporate Administrator Survey ................................................................... 3
Operators Survey ..................................................................................... 3
Emissions and Air Quality ........................................................................... 4
2 INTRODUCTION ..................................................................................... 5
About Carplus ......................................................................................... 5
The Carplus Annual Surveys ........................................................................ 5
3 RESULTS OF THE MEMBERS AND JOINERS SURVEYS ....................................... 11
4 RESULTS OF THE PEER-TO-PEER MEMBER SURVEY ......................................... 27
5 RESULTS OF THE CORPORATE MEMBER SURVEY ............................................ 39
6 RESULTS OF THE CORPORATE ADMINISTRATOR SURVEY ................................. 45
7 RESULTS OF THE OPERATOR SURVEY AND EMISSIONS ANALYSIS AND PROFILING ... 55
Operator Survey .................................................................................... 55
Emissions Analysis and Profiling ................................................................. 59
8 SUMMARY OF THE RESULTS ..................................................................... 69
Members and Joiners Survey ..................................................................... 69
Peer-to-Peer Member Survey .................................................................... 70
Corporate Member Survey ........................................................................ 71
Corporate Administrator Survey ................................................................. 71
Operator Survey .................................................................................... 72
Emissions Analysis and Profiling ................................................................. 73
FIGURES
Figure 3.1 Map of responses by Local Authority area ............................. 12
Figure 3.2 Member satisfaction with the current service ........................ 13
Figure 3.3 Joiner satisfaction with the current service ........................... 13
Figure 3.4 Joiner satisfaction with information .................................... 14

Results for London
Contents
Figure 3.5 Car ownership before and after joining a car club ................... 14
Figure 3.6 Annual mileage driven using a car club car (members) ............. 15
Figure 3.7 Annual mileage driven using a household car (members) ........... 16
Figure 3.8 Annual mileage driven in any car (joiners) ............................ 16
Figure 3.9 Influence of car club membership on car ownership (members) .. 18
Figure 3.10 Influence of car club membership on annual mileage travelled ... 18
Figure 3.11 Change in member mileage .............................................. 19
Figure 3.12 Influence of car club membership on car purchase .................. 20
Figure 3.13 Likelihood of purchasing a car in future ............................... 20
Figure 3.14 Frequency of use of other modes (members) ......................... 21
Figure 3.15 Frequency of use of other modes before & after joining ........... 23
Figure 3.16 Reasons for joining a car club ............................................ 24
Figure 3.17 Changes in personal circumstances at time of joining .............. 25
Figure 4.1 Location of members ...................................................... 28
Figure 4.2 Age of Whipcar respondents .............................................. 28
Figure 4.3 Number of rentals .......................................................... 29
Figure 4.4 Satisfaction with Whipcar’s service ..................................... 29
Figure 4.5 Number of cars owned prior to joining Whipcar ...................... 30
Figure 4.6 Numbers of cars owned at time of survey ............................. 30
Figure 4.7 Car sold or disposed and effect of Whipcar ........................... 31
Figure 4.8 Mileage during the last year - Whipcar ................................. 32
Figure 4.9 Mileage during the last year – any car .................................. 32
Figure 4.10 Change in household annual mileage since joining Whipcar ....... 33
Figure 4.11 Propensity for household to buy a private car ........................ 33
Figure 4.12 Likelihood that household will buy a car in the next few years ... 34
Figure 4.13 Frequency of use of other modes ....................................... 35
Figure 4.14 Reason for joining Whipcar ............................................... 36
Figure 4.15 Significant life-events at the time of joining Whipcar .............. 37
Figure 5.1 Satisfaction with car clubs ............................................... 40
Figure 5.2 Frequency of car club use ................................................ 40
Figure 5.3 Modes used for business travel before and after joining a car club
................................................................................ 41
Figure 5.4 Influence of car club membership on travel behaviour ............. 42
Figure 5.5 Influence of car club membership on business travel arrangements
................................................................................ 43

Results for London
Contents
Figure 6.1 Organisation sector ........................................................ 45
Figure 6.2 Number of employees in organisation .................................. 46
Figure 6.3 Number of employees in car club ....................................... 46
Figure 6.4 Satisfaction with car club service ....................................... 47
Figure 6.5 Perceived benefits of joining a car club ............................... 48
Figure 6.6 Proportion of business mileage travelled using car club cars ...... 49
Figure 6.7 Mileage information collected ........................................... 50
Figure 6.8 Travel plans and policies .................................................. 50
Figure 6.9 Changes to travel policies since joining the car club ................ 52
Figure 6.10 Travel options ............................................................... 53
Figure 7.1 Gender profile of members (2010-2012) ............................... 56
Figure 7.2 Age profile of members (2010-2012) .................................... 57
Figure 7.3 Number of hires per member per year ................................. 58
Figure 7.4 Miles travelled per hire ................................................... 59
Figure 7.5 Profile of the London car club and British national fleets .......... 62
Figure 7.6 London car club fleet carbon emissions profile ....................... 63
Figure 7.7 London car club fleet Euro emissions profile .......................... 66
Figure 7.8 London car club fleet Euro emissions profile by car club ........... 66
TABLES
Table 2.1 The Carplus surveys .......................................................... 6
Table 2.2 Survey response and reporting region .................................... 9
Table 3.1 Average annual mileage travelled by car club members ............ 17
Table 3.2 Comparing member travel behaviour with general population .... 22
Table 5.1 Use of cars and vans ....................................................... 42
Table 6.1 Travel policy measures .................................................... 51
Table 7.1 Members by location ....................................................... 55
Table 7.2 Vehicle usage ............................................................... 58
Table 7.3 Profile of car club cars in London by VED emission band ........... 61
Table 7.4 Carbon emissions of car club cars and the British national fleet .. 63
Table 7.5 Car club fuel types and emissions ....................................... 64
Table 7.6 Emissions by Euro standard ............................................... 65
Table 7.7 Car club fuel types and air quality emissions ......................... 67
Table 7.8 Maximum permitted emissions for vans by Euro standard .......... 68

Results for London
Contents
APPENDICES
A SURVEY QUESTIONNAIRES
B CAR CLUB EMISSIONS SUMMARY TABLE

Results for London
Foreword
Foreword
Background
London is the largest market in Europe for traditional car clubs (known as car
sharing outside of the United Kingdom) and the second largest globally. Over the
past five years, there has been sustained growth in both car club membership and
the geographical coverage of car clubs across London. Despite a difficult economic
environment for growth, during 2012 further progress has been made in terms of
member numbers, network coverage and sector innovation1. Member numbers
grew to 122,300 using a network of approximately 2,270 cars2 across the capital.
The coverage of the concept also extended with cars reaching from Enfield in the
north to Sutton in the south and from Abbey Wood in the east to Hounslow in the
west. A significant proportion of Londoners now have access to a car club car
within five minutes’ walk of where they live. Several boroughs are considering
ways to open up the market to allow for more than one operator, notably
Hackney.
Transport for London’s 2008 Car Club Strategy provided the framework for much of
the progress achieved to date. Carplus, operators, Transport for London (TfL) and
City Hall are now working collaboratively to ensure that, five years on, car clubs
are given the renewed strategic direction and support that will allow their
identified potential to be realised. Forward thinking policies by City Hall, TfL and
Boroughs mixed with ambition and entrepreneurship of private sector operators
has given London a leadership position in the global car club market. Importantly,
car clubs continue to make a unique and significant contribution to the
achievement of TfL’s objectives on carbon reduction, improving air quality and
reducing private car dependence as part of promoting a broad range of sustainable
transport measures. Car clubs should no longer be seen as an ‘alternative’ option,
but rather a common sense approach to getting from A to B that sit comfortably
alongside active travel and public transport.
In terms of innovation, the past year has seen an acceleration of the roll out of
electric and hybrid electric vehicles across London with the launch of electric
vehicle only E-Car club3, the trial of Vauxhall Ampere’s by Zipcar and the
continued expansion of City Car Club’s hybrid fleet. Whilst financial and
operational barriers do still exist to widespread adoption of electric and hybrid
vehicles as part of the car club fleet, the market is committed to their adoption
and progress has continued towards this goal4. The average carbon emissions of the
1 The difficult economic climate has sadly resulted in Greenwheels closing down their London operations and peer
to peer operator Whipcar also closing its doors after three years of operation.
2 Member and vehicle numbers as at May 2013.
3 With vehicles in Tower Hamlets to be launched shortly. Initial operations have been in three locations outside
London with an operations centre in SE1.
4 For further information see the Carplus guidance document – Electric Vehicles in Car Clubs (available to members
only).

Results for London
ii
car club fleets in London in 2012/13 are 31% lower than the national average car
and 15% lower than the car club fleet average reported in 2011/12.
Whilst progress to date has been rapid (it is easy to forget that this market place
had not existed to any real degree before 2005), the most exciting part of the car
club story is what is still to be achieved. Market observers such as Frost and
Sullivan predict a further 10-fold rise in car club membership by 2020, and the rise
of the sharing economy as well as evidence from countries such as Germany,
Austria and Switzerland, indicate significant untapped potential of car clubs to
reduce the impacts of car traffic, support active travel and facilitate modal
integration.
The Carplus Annual Survey 2012/13
The Carplus Annual Surveys further reinforce the important role that car clubs play
in improving air quality, reducing private car ownership and congestion whilst also
providing access to a car as a transport option when a journey cannot be made by
other modes.
The Survey is the most comprehensive dataset collected across the car club sector
on an annual basis since 2007. This year’s survey represents a considerable
expansion of the scope of data collected in the previous five years and includes
the results of business user and administrator surveys, together with a survey of
Whipcar peer to peer users. For the first time, this report also includes a
comprehensive and detailed profile of emissions of car club operators fleets.
Chas Ball, Chief Executive, June 2013

Results for London
1
1 Executive Summary
Member and Joiners Survey
1.1 The results of the Carplus annual members and joiners survey reported in this
document provide information about the travel behaviour of car club members in
London. In 2012, 2,741 car club members based in London responded to the
members and joiners survey.
Changes to car ownership
1.2 Car club membership reduces car ownership. For existing members, car ownership
levels have halved after joining a car club. Before joining a car club 45% of existing
members owned a car. After joining a car club just under a fifth still own a car.
For each car club vehicle in London, 6 private cars are taken off the road5.
Therefore, 13,620 private cars are not on London’s roads as a consequence of the
presence of 2,270 car club cars in the capital.
1.3 Car club membership also reduces the number of private cars purchased. Nearly a
third of car club members state they would have bought a car if they hadn’t joined
a car club. For each car club vehicle in London the purchase of up to 14 cars is
deferred. Therefore, the purchase of up to 31,780 private cars has been deferred
as a consequence of the presence of 2,270 car club cars in the capital.
Changes to car use
1.4 Car club membership reduces car travel. The average mileage travelled by car club
members in London, using car club cars and household cars, is 4,195 miles; 50%
lower than the National Travel Survey average of 8,430 miles6.
Travel behaviour by car club members
1.5 Compared to London averages from the London Travel Demand Survey7, car club
members in London cycle and use public transport more. Travel by Underground,
bicycle and train are more than twice the London average; levels of bus use are
slightly higher.
1.6 After joining a car club, on average, members drive less often and walk and use
public transport more often. One third of members in London cycle at least once a
week, compared with the London average of 13%.
5 The operator survey (see Section 7) provides the average number of car club members per car club car (48). By
applying the proportion of respondents in London who stated that they had sold or disposed of a car in the last 12
months to the number of car club members per car, we can estimate how many private cars are removed from the
road. This assumes that the sale of a car by a car club member results in a car eventually being removed from
circulation at the end of the chain. See page 17, para 3.11 for a detailed explanation of the methodology
6 Department for Transport (2011) National Travel Survey Table NTS0901. Last accessed online 4th June 2013 at:
https://www.gov.uk/government/statistical-data-sets
7 London Travel Demand Survey 2009/10, Transport for London.

Results for London
2
Satisfaction with car club services
1.7 Satisfaction with the service they receive from car club operators amongst both
existing members and recent joiners remains high with nine out of ten members
rating the service they receive as “Very Good” or “Good”.
1.8 Nine out of ten recent joiners rate information received before and during early
bookings as “Very Good” or “Good”.
Reasons for joining a car club
1.9 Individuals often consider the way that they travel at key points of change in their
lives, i.e. moving house or starting a new job. 31% of recent car club joiners had
just moved to the area, while 13% had either recently changed jobs or retired.
These findings highlight an opportunity to promote car club membership to
potential members when there is a significant change in their lifestyle and they
are likely to be changing or considering how they travel.
Survey coverage
1.10 Member responses reflected the locations where car clubs are established and the
car club market is most mature with highest numbers of responses in the Inner
London boroughs of Camden and Wandsworth.
Corporate Member Survey
Satisfaction with car club services
1.11 Corporate members are generally satisfied with car club services with nine out of
ten corporate members rating services as either very good or good.
Use of car clubs
1.12 Around half of corporate members use cars clubs once a month or more. One in
five corporate car club members use car clubs once a week or more.
Travel behaviour by corporate car club members
1.13 After joining a car club, use of private cars for work-related trips are reduced from
46% to 7%. 16% of corporate car club members drove to work less suggesting that
they are either using alternative travel modes to commute or they are adjusting
their working pattern to reduce the frequency of their commute e.g. working from
home. 15% of corporate car club members also use car club vehicles for non-work
trips.
1.14 After joining a car club, corporate car club members reduced the use of their own
car for business travel. They also made the following changes to their car travel
options for work related trips:
I Used pool cars less;
I Used car rental less; and
I Used car clubs more.
After joining the car club, corporate car club users also used public transport
slightly less than they did before they joined but walked slightly more. Cycling
levels remained the same.

Results for London
3
Changes to corporate travel policies
1.15 A minority of corporate respondents noted changes in company policies regarding
car use since their organisation joined a car club. 16% noted changes to
discourage use of private cars for business use while 14% noted that pool cars had
been replaced by car club vehicles.
Corporate Administrator Survey
1.16 The majority of organisations (76%) that responded to the survey were in the
private sector and most (72%) employ fewer than 10 individuals. Car club
membership may appeal to smaller companies, particularly in central locations,
whose staff do not travel by car frequently on business journeys or do not have
resources to manage a car fleet. In the larger organisations, car club membership
was a relatively small minority of employees (less than 10% in most cases).
Car club membership
1.17 Most corporate members joined a car club recently. Almost half of all
organisations joined a car club in the last year with over 80% joining in the last
three years.
Satisfaction with car club services
1.18 Administrators were generally happy with car club services, with eight out of ten
rating services as very good or good.
Membership benefits
1.19 Almost a third of corporate administrators cited cost savings as a benefit of car
clubs. One in five respondents noted reduced administration, with 15% mentioning
improved employee satisfaction.
Use of car club cars
1.20 Car club use represents a relatively small proportion of business mileage for
businesses which are car club members. For half of all businesses less than 10% of
their business mileage used car club cars, likely to be shorter journeys. This
illustrates that corporate car club membership is used as part of a wider staff
travel offer that may include other modes and other types of car travel. There are
some businesses which are more reliant on car club vehicles. One in ten
respondents estimated that between 80% and 90% of business mileage made use of
car club cars while a quarter of respondents estimated that at least half of all
business travel made use of car club vehicles.
Operators Survey
1.21 For the operator survey each car club operator has provided details of their vehicle
fleet, membership numbers and characteristics of members and data regarding use
of car clubs by their members such as mileage travelled. The data is reported on a
national basis, (i.e. for England and Wales, London and Scotland).

Results for London
4
1.22 A significant proportion (84%) of car club members are based in London. A higher
proportion of car club members are male (61%8), compared to the British national
average (54%). There has over time however been an small increase in the
proportion of female members of car clubs. The age profile of car club members
typically reflects the locations where car clubs are most popular with a high
proportion of members aged 25 to 44 (72%), this compares to 35% of British
national licence holders.
1.23 Compared to last year, the average annual number of car club rentals has
increased from 6.7 hires in 2011/12 to 8.2 hires in 2012/13. In 2012/13 average
rental duration was 6.7 hours, similar to the 6.8 hour reported in 2011/12.
1.24 Average annual car club mileage per member has increased to 305 miles in
2012/13 from 237 miles in 2011/12. It should be noted that this these numbers
are considerably lower than the self-reported mileage recorded in the annual
member surveys, which may indicate that individuals find it hard to accurately
estimate their mileage travelled.
Emissions and Air Quality
1.25 The emissions analysis and profiling report showed that overall the car club fleets
in London offer members vehicles that are low carbon and meet the current (Euro
5) air quality standards.
1.26 Almost all club cars are in the lowest three VED emission Bands A to C with most
club cars in Band C. In the British car fleet most vehicles are in Band G (151-165
g/km).
1.27 The average carbon emissions of the car club fleets in London in 2012/13 are 31%
lower than the national average car and 15% lower than the British car club fleet
average reported in 2011/12.
1.28 Car clubs with the most petrol and petrol-electric hybrid vehicles achieved the
lowest average published carbon emissions.
1.29 The car club fleet in London is almost 100% Euro 5 compliant (up from 80% in
2011).
1.30 When selecting new vehicles for use in London, there is a need to balance climate
change (low carbon, fuel efficient), public health (low toxic emissions; notably
nitrogen oxides and particulates) and whole life costs (depreciation or lease,
insurance, maintenance and repairs).
8 Operator survey figures include 7% of members where gender is not known, therefore a comparable male
percentage for all operators is likely to be slightly higher than reported.

Results for London
5
2 Introduction
2.1 The Carplus Annual Survey is the only comprehensive and independently verified
dataset collected on the car club sector in the UK. The Carplus Annual Survey has
collected data on car club operations, membership profiles and the impact of car
club membership on travel choices and the environment since 2007.
2.2 This is the sixth edition of the Carplus Annual Survey and covers the period 2012-
13. It has been administered by consultants Steer Davies Gleave on behalf of
Carplus.
2.3 The data collected from the Carplus Annual Survey is compiled into 3 regional
reports that reflect the principal geographical areas of operation of car clubs in
Great Britain:
I England and Wales (excluding London)
I London
I Scotland
2.4 This report provides the results of the 2012/13 Carplus Annual Survey for London.
All three regional versions of the Carplus Annual Survey are available on the
Carplus website: www.carplus.org.uk.
About Carplus
2.5 Carplus is a not-for-profit, environmental transport NGO that promotes accessible,
affordable and low-carbon alternatives to traditional car use in the UK. While
recognising the benefits that cars can bring to society, Carplus believes that a new
approach to car use and ownership is needed in order to mitigate the financial,
environmental, social and health costs of motoring today.
2.6 Carplus is the national accreditation body for car clubs in the UK and co-ordinates
annual data collection and research for the sector.
The Carplus Annual Surveys
2.7 Carplus is committed to a standardised data collection system to assess the
impacts of car clubs and inform development of car clubs in the UK. Since 2007,
Carplus has worked with car clubs to collect a range of data from car club
members and recent joiners about their travel habits and use of car clubs. The
data collected by Carplus continues to grow: in 2012, additional surveys of
corporate members and peer-to-peer car club users were conducted to
complement the established survey of members and joiners. The results of these
surveys are presented in this report. Table 2.1 summarises the five surveys that
were undertaken.

Results for London
6
TABLE 2.1 THE CARPLUS SURVEYS
Survey Name Respondents
Members and Joiners Survey Individual, private members and recent joiners of
traditional ‘back-to-base’ car clubs
Peer-to-Peer Survey Individual, private members of peer-to-peer car
clubs
Corporate User Survey Individual car club members whose membership is
provided through their employer
Corporate Administrator Survey Employees responsible for administrating car club
corporate accounts
Operator Survey (including
emissions profiling and analysis)
Car club operators
2.8 All of the main back-to-base car club operators in Great Britain that are accredited
by Carplus are required to take part in the survey. The 2012 surveys were co-
ordinated in conjunction with:
I City Car Club;
I Co-wheels;
I Enterprise CarShare;
I Greenwheels9;
I Hertz on Demand; and
I Zipcar.
2.9 This year the UK’s primary peer-to-peer car club Whipcar10 was also invited to
participate in the survey in order to provide an insight into this new model of car
club to the UK market.
2.10 A number of community car clubs also participated on a voluntary basis (although
none of these were operational in London).
2.11 The surveys were conducted using online forms and each operator was responsible
for communicating the surveys to their members and offering incentives for
completion. The survey period was 29th October 2012 – 14th December 2012. Upon
completion of the surveys, Carplus provided each operator with a file containing
the responses from their members.
2.12 The surveys issued to car club members in 2012 are described below.
9 Whilst Greenwheels participated in the Annual Survey, by the time of publication they had closed down their
operations in London.
10 At the time of the survey, Whipcar was the primary operator of peer to peer car sharing in the UK. However, on
12th March 2013, prior to the publication of this report, Whipcar closed its operations.

Results for London
7
Car club members and joiners survey
2.13 The survey of car club members and joiners was largely unchanged from the
surveys that have been conducted since 2007. It contained questions on the
following topics:
I Satisfaction with car clubs;
I Car mileage travelled using car club cars and private cars;
I Influence of car clubs on car ownership choices and miles travelled; and
I Use of other modes of transport.
2.14 The 2012 survey contained additional questions regarding:
I Reasons for joining a car club; and
I Personal circumstances when joining a car club.
2.15 In this report, members who had joined the car club in the three months prior to
completing the survey are referred to as “joiners”. Respondents who had joined
before this time are referred to as “members”.
2.16 Joiners were asked specific questions regarding satisfaction with the joining
process and the information and guidance received during early bookings.
Additionally, they were asked to describe their travel habits before and after
joining the car club in order to identify any immediate changes in travel behaviour
that may be related to car club membership.
Peer-to-Peer car club member survey
2.17 A new survey was issued in 2012 to members of the UK's primary peer-to-peer car
club in operation at the time, Whipcar. In a peer to peer car club, the vehicles are
owned by the members, rather than a car club operator. Members are able to rent
out their personal vehicle for money when they are not using it. As a business
model, it is closely aligned to traditional 'back-to-base' car clubs. However, in
contrast to traditional car clubs, the peer to peer vehicle fleet is 'virtual' i.e. it
fluctuates according to the number of participating car owners. The survey
contained similar questions to the member survey regarding mileage consumption
and vehicle ownership.
2.18 At the time of the survey, Whipcar was the sole peer-to-peer car club in operation.
Since the survey was issued, Whipcar closed in March 2013 citing "barriers to
widespread adoption of peer-to-peer car rental". However, the results of their
survey have still been included within this report as they provide a valuable insight
into an alternative model of car club that may well re-appear on the UK market in
the future.
Operator survey
2.19 Each of the main back-to-base car club operators provided details of their vehicle
fleet, membership numbers and characteristics of members and data regarding use
of car clubs by their members such as mileage travelled. The questions issued to
operators were the same as for previous years, with the exception of the removal
of questions requesting NOx and PM10 data for car club fleets. This information
has been collected separately as explained below. Some not-for-profit, community
car clubs also participated in the operator survey. Whipcar did not participate.

Results for London
8
2.20 In a development from previous years, emissions data has been independently
verified by Gfleet Services Ltd using vehicle registration marks (VRM) and
published datasets from DVLA (Driver and Licensing Vehicle Agency), VCA (Vehicle
Certification Agency) and vehicle manufacturers which enables the production of
fuller and more accurate emissions profiling (including nitrogen oxides and
particulates). The profiles are based on the vehicles each participating operator
had on-fleet at 1st April 201311.
2.21 To protect the confidentiality of operators, company names are not quoted in any
data. Instead, where reference to individual operators is necessary, each operator
has been allocated a code name e.g. 'Car Club 1'. These code names have been
applied consistently across all 3 regional versions of the Annual Survey reports.
Where region specific data is reported, only operators that are operational in that
region are included. For example, in London, Car Club 4 is not operational in this
region and therefore no data is reported in this report.
Corporate member survey
2.22 This year, a new questionnaire survey was issued to car club corporate members.
This group primarily comprises members who use car clubs for work-related trips
and whose membership is paid for by their employer. Corporate members were
asked to complete a short survey which included questions regarding:
I Satisfaction with their car club;
I Frequency of car club use;
I Modes of travel used for work-related trips before and after joining a car club;
I Types of car club vehicles used;
I Impacts of joining a car club on work-related travel behaviour; and
I Changes in policies or business travel arrangements.
Corporate administrator survey
2.23 A separate, more detailed survey was issued to workplace contacts who are
responsible for administering the corporate membership. This included questions
about:
I Business sector and number of employees;
I Number of car club members in the organisation;
I Year joined;
I Satisfaction with service from the car club operator;
I Perceived benefits of joining a car club;
I Business mileage travelled using car club cars;
I Travel-related data collected by the organisation (e.g. staff travel surveys);
I Whether travel plans or other green travel policies were in place;
I Types of travel policies and any changes since joining the car club; and
I Other travel plan measures in place.
11 Whipcar and Greenwheels did not participate in this part of the survey as they had both closed operations before
1st April 2013

Results for London
9
Survey response
2.24 The number of responses to each survey and the reporting region are shown in
Table 2.2.
TABLE 2.2 SURVEY RESPONSE AND REPORTING REGION
Survey
England and
Wales
(excluding
London)
Scotland London TOTAL
Members and
Joiners Survey 828 401 2,741 3,970
Corporate
Members Survey 476* 112 173* 761
Corporate
Administrators
Survey
50 21 88 159
Peer-to-Peer
Survey 66 3 207 276
TOTAL 1,420 537 3,209 5,166
*It is possible that some respondents based in London stated their location as
“England”.
Structure of this report
2.25 Following this introduction, the report is structured as follows:
I Section 3 contains the results of the member and joiner surveys for individual, private members in London;
I Section 4 contains results of the peer-to-peer member survey for the whole of the UK;
I Sections 5 and 6 contain the results of the corporate member and corporate administrator surveys for Great Britain;
I Section 7 contains the results of the operator survey for Great Britain and the emissions analysis and profiling for the London car club fleet.
I Section 8 contains a summary discussion of the results of all surveys.
2.26 The results of the peer-to-peer, corporate member, corporate administrator and
operator surveys are not disaggregated by reporting region; the results represent
the responses of the UK or Great Britain sample12.
12 This is because the regional sample sizes for these surveys were not large enough to enable conclusive analysis on
a regional basis.


Results for London
11
3 Results of the Members and Joiners Surveys
Introduction
3.1 This section provides the results of the surveys completed by 2,741 individual,
private members and recent joiners of car clubs in London. Separate reports are
available containing the results of the surveys completed by members and joiners
in England and Wales (excluding London) and Scotland from the Carplus website at
(www.carplus.org.uk).
Respondent profile
3.2 Figure 3.1 shows the distribution of responses to the survey across the London
boroughs. The majority of respondents in London were from Inner London
boroughs, in particular Camden, Wandsworth, Lambeth and Tower Hamlets - areas
where most trips can be made using public transport, walking or cycling with car
travel as a secondary mode thus representing the core market for car clubs. A
smaller proportion of responses came from respondents based in Outer London
boroughs. The map provides an indication of the distribution of car clubs across
London.

Results for London
12
FIGURE 3.1 MAP OF RESPONSES BY LOCAL AUTHORITY AREA

Results for London
13
Satisfaction with car clubs and their processes
3.3 The majority of car club members in London remain satisfied with the service
provided by their car club operator. 88% rate their car club’s service as “Very
Good” or “Good”: a 5 percentage point increase on 2011/12 (Figure 3.2). In 2012,
13% of members rated the service they received as “Average” or “Poor”.
FIGURE 3.2 MEMBER SATISFACTION WITH THE CURRENT SERVICE
3.4 Joiner satisfaction was similarly high with 89% stating that the service they receive
is “Very Good” or “Good” (Figure 3.3). This is a 5 percentage point increase on the
proportion of individuals rating their car club’s service in the top two categories in
2011/12.
FIGURE 3.3 JOINER SATISFACTION WITH THE CURRENT SERVICE
3.5 As shown in Figure 3.4, the majority of joiners (89%) state that the information
they received from their car club operator both before and during early booking
was either “Very Good” or “Good”.
39%
44%
14%
3% 1%
41%
47%
10%
2% 1%0%
10%
20%
30%
40%
50%
60%
Very Good Good Average Poor Very Poor
Proportion of respondents
2011/12 2012/13
46%
38%
9%5%
3%
53%
36%
8%
1% 1%0%
10%
20%
30%
40%
50%
60%
Very Good Good Average Poor Very Poor
Proportion of respondents
2011/12 2012/13

Results for London
14
FIGURE 3.4 JOINER SATISFACTION WITH INFORMATION
Car ownership and use before and after joining a car club
3.6 Members and joiners were asked about their car ownership before and after
joining the car club. As shown in Figure 3.5, 45% of members owned at least one
car before joining, falling to just 20% after joining. Car ownership before joining
was at a similar level for joiners (46% owning at least one car), but car ownership
after joining was higher than amongst members with 31% of joiners owning at least
one car.
FIGURE 3.5 CAR OWNERSHIP BEFORE AND AFTER JOINING A CAR CLUB
45%42%
9%
1% 3%
48%
41%
8%
1% 1%0%
10%
20%
30%
40%
50%
60%
Very Good Good Average Poor Very Poor
Proportion of respondents
2011/12 2012/13
55%
36%
8%
1%
54%
33%
9%
2% 1% 1%0%
10%
20%
30%
40%
50%
60%
70%
80%
90%
100%
0 1 2 3 4 5 or more
Proportion of respondents
Number of cars owned before joining car club
Members Joiners

Results for London
15
Mileage travelled in car club cars
3.7 Car club vehicle mileage travelled by London car club members remains low with
half of all members travelling less than 500 miles in the 12 months prior to
completing the survey (Figure 3.6) This is considerably lower than the national
average car mileage of 8,430 miles as reported in the National Travel Survey.
FIGURE 3.6 ANNUAL MILEAGE DRIVEN USING A CAR CLUB CAR (MEMBERS)
Mileage travelled in household cars
3.8 Members were then asked to state their approximate annual mileage driven in any
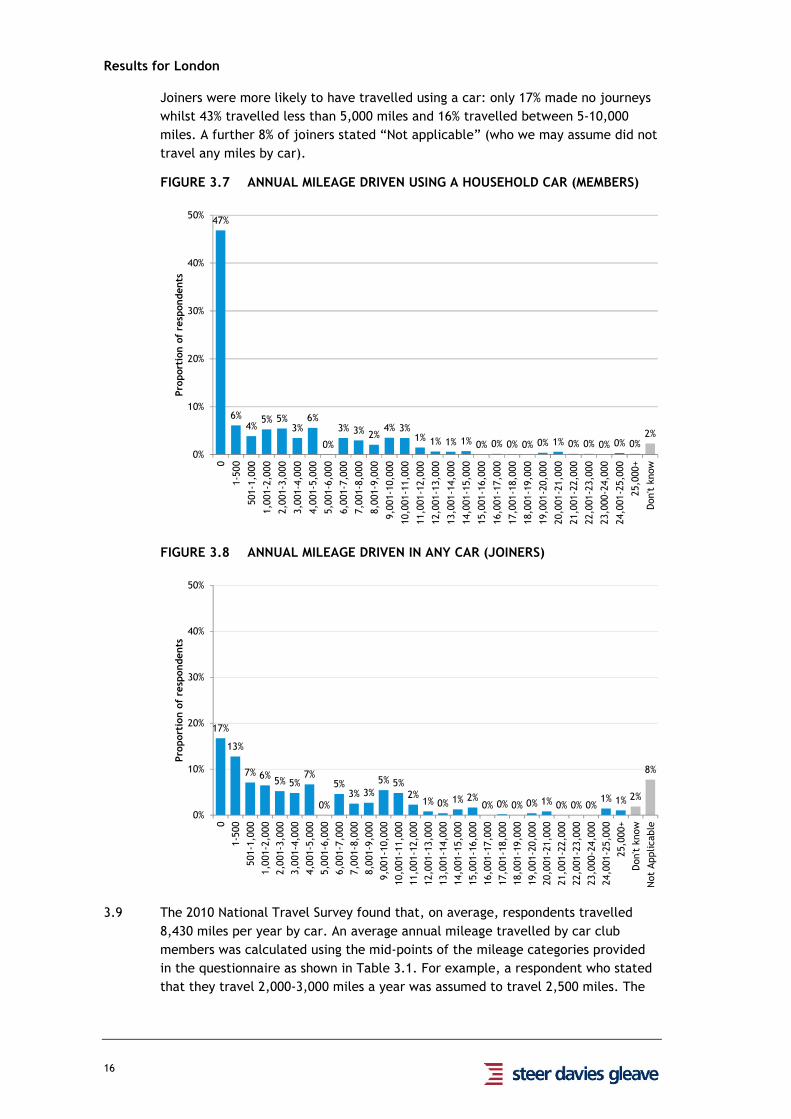
household cars in the last 12 months. The results are shown in Figure 3.7. The
chart shows that just under half of the London members did not travel any
distance in household cars in the 12 months prior to taking the survey (over half
did not own a car). 29% travelled less than 5,000 miles and 12% travelled between
5-10,000 miles. Figures for joiners’ mileage in any car are shown in Figure 3.8.
81%
16%
3% 1%
69%
26%
4%1%
0%
10%
20%
30%
40%
50%
60%
70%
80%
90%
100%
0 1 2 3 4 5 or more
Proportion of respondents
Number of cars owned after joining car club
Members Joiners
5%
45%
23%
11%
4%2% 2%
0% 1% 0% 1% 1% 1% 0% 0% 0% 0% 0% 0% 0% 0% 0% 0% 0% 0% 0% 0% 0%2%
0%
10%
20%
30%
40%
50%
0
1-500
501-1,000
1,001-2,000
2,001-3,000
3,001-4,000
4,001-5,000
5,001-6,000
6,001-7,000
7,001-8,000
8,001-9,000
9,001-10,000
10,001-11,000
11,001-12,000
12,001-13,000
13,001-14,000
14,001-15,000
15,001-16,000
16,001-17,000
17,001-18,000
18,001-19,000
19,001-20,000
20,001-21,000
21,001-22,000
22,001-23,000
23,001-24,000
24,001-25,000
25,000+
Don't know
Proportion of respondents
Results for London
16
Joiners were more likely to have travelled using a car: only 17% made no journeys
whilst 43% travelled less than 5,000 miles and 16% travelled between 5-10,000
miles. A further 8% of joiners stated “Not applicable” (who we may assume did not
travel any miles by car).
FIGURE 3.7 ANNUAL MILEAGE DRIVEN USING A HOUSEHOLD CAR (MEMBERS)
FIGURE 3.8 ANNUAL MILEAGE DRIVEN IN ANY CAR (JOINERS)
3.9 The 2010 National Travel Survey found that, on average, respondents travelled
8,430 miles per year by car. An average annual mileage travelled by car club
members was calculated using the mid-points of the mileage categories provided
in the questionnaire as shown in Table 3.1. For example, a respondent who stated
that they travel 2,000-3,000 miles a year was assumed to travel 2,500 miles. The
47%
6%4%
5% 5%3%
6%
0%
3% 3% 2%4% 3%
1% 1% 1% 1% 0% 0% 0% 0% 0% 1% 0% 0% 0% 0% 0%2%
0%
10%
20%
30%
40%
50%0
1-500
501-1,000
1,001-2,000
2,001-3,000
3,001-4,000
4,001-5,000
5,001-6,000
6,001-7,000
7,001-8,000
8,001-9,000
9,001-10,000
10,001-11,000
11,001-12,000
12,001-13,000
13,001-14,000
14,001-15,000
15,001-16,000
16,001-17,000
17,001-18,000
18,001-19,000
19,001-20,000
20,001-21,000
21,001-22,000
22,001-23,000
23,000-24,000
24,001-25,000
25,000+
Don't know
Proportion of respondents
17%
13%
7% 6%5% 5%
7%
0%
5%3% 3%
5% 5%2%
1% 0% 1%2%
0% 0% 0% 0% 1% 0% 0% 0%1% 1% 2%
8%
0%
10%
20%
30%
40%
50%
0
1-500
501-1,000
1,001-2,000
2,001-3,000
3,001-4,000
4,001-5,000
5,001-6,000
6,001-7,000
7,001-8,000
8,001-9,000
9,001-10,000
10,001-11,000
11,001-12,000
12,001-13,000
13,001-14,000
14,001-15,000
15,001-16,000
16,001-17,000
17,001-18,000
18,001-19,000
19,001-20,000
20,001-21,000
21,001-22,000
22,001-23,000
23,000-24,000
24,001-25,000
25,000+
Don't know
Not Applicable
Proportion of respondents

Results for London
17
average mileage travelled by car club members, using car club cars and household
cars, is 4,195 miles; 50% lower than the NTS average.
TABLE 3.1 AVERAGE ANNUAL MILEAGE TRAVELLED BY CAR CLUB MEMBERS
Type of travel Average annual car mileage travelled
Car club members using car club car 1,336 miles
Car club members using household car 2,859 miles
Car club member total mileage 4,195 miles
Respondents to National Travel Survey
(2010) – all cars
8,430 miles
Influence of car club membership on car ownership and use
3.10 Members were asked to state whether they had sold or disposed of a car in the 12
months prior to completing the survey and 13% of members stated that they had.
Of these 57% had travelled fewer than 5,000 miles, 23% had travelled 5-10,000
miles, highlighting that car clubs tend to attract those who already use their cars
less.
3.11 Using this finding, it is possible to estimate the impact of car clubs on removing
private cars from circulation. The operator survey (see section 7) provides the
average number of car club members per car club car (48). By applying the
proportion of respondents in London who stated that they had sold or disposed of a
car in the last 12 months to the number of car club members per car, we can
estimate that, for each car club car in operation, approximately 6 private cars are
removed from the road.
3.12 This assumes that the sale of a car by a car club member results in a car
eventually being removed from circulation at the end of the chain. As a result of
the 2,270 car club cars in London we have calculated that there are almost 14,000
fewer private cars on the capital’s roads.
3.13 Those members who had sold or disposed of a car in the last 12 months were asked
to state the extent to which the car club was a reason for this decision. 11% stated
that it was the main reason, 31% stated it was a major factor, 18% a minor factor
and 35% stated that it was not a factor (Figure 3.9).
Calculation of cars removed from the road
48 (members per car club car)
X
13% (proportion of respondents who sold/disposed of car in last 12 months)
= 6.2 cars removed from road by each car club car

Results for London
18
FIGURE 3.9 INFLUENCE OF CAR CLUB MEMBERSHIP ON CAR OWNERSHIP
(MEMBERS)
3.14 Figure 3.10 shows the impact of joining a car club on the annual car driver mileage
travelled by members. 29% of members report a decrease in their annual car driver
mileage compared with 21% of members reporting an increase - a reduction on
2011/12 levels13. 36% state that their annual mileage has not changed. The
average increase in annual mileage is 984 miles whilst the average decrease is
3,033 miles.
FIGURE 3.10 INFLUENCE OF CAR CLUB MEMBERSHIP ON ANNUAL MILEAGE
TRAVELLED
13 Removing “Don’t know” and “No response” figures from the calculation (as per the 2011/2012 report), the
proportion of respondents reporting an increase in mileage is 24%, in comparison to 30% in 2011/12.
Did not sell/dispose of
car87%
Car club was: Main reason 11%
Major factor 31%
Minor factor 18%
Not a factor 35%
Don't know 4%
Sold/Disposed of car13%
6%
8%
29%
36%
21%
0%
10%
20%
30%
40%
50%
60%
70%
80%
90%
100%
Proportion of respondents
Increased
No change
Decreased
Don't know
No response

Results for London
19
3.15 Those who stated that their mileage had changed were asked to state how many
miles it had increased or decreased by. 57% of the 470 respondents who stated
that their mileage had increased stated that it had increased by less than 500
miles. Of the 653 respondents who stated a decrease in mileage, only 15% stated
that it was a decrease of less than 500 miles with a greater proportion stating that
the decrease was between 1 and 5,000 miles (41%). In addition, 5% of respondents
stated that the decrease in their annual mileage was more than 10,000 miles
(Figure 3.11).
FIGURE 3.11 CHANGE IN MEMBER MILEAGE
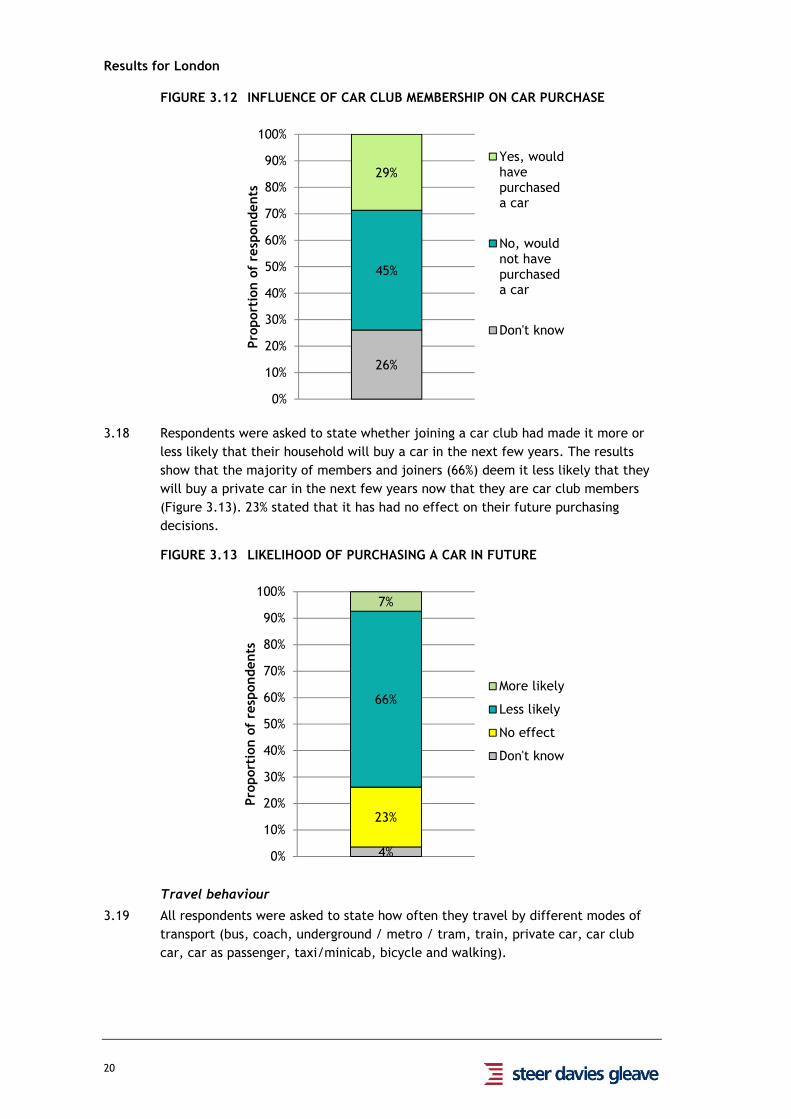
3.16 Respondents were asked to state whether their household would have bought a
private car if they had not joined the car club. The results show that 29% of
respondents (both members and joiners) would have bought a private car if they
had not joined a car club (Figure 3.12). The remaining respondents were split
between those who would not have bought a car (45%) and those who were unsure
(26%). The purchase of up to 31,780 private cars has been deferred as a
consequence of the presence of car club cars (2,270) in the capital.
3.17 Similar to car club members in England and Wales, car club members in London
view car club membership as an addition to their mobility options, rather than a
direct replacement for car ownership.
4%
57%
17%
9%
4%1% 1% 1% 1% 0% 0% 1%
5%2%
6%
15%17%
13%11%
7%10%
3% 2% 3% 3%5%
0%
10%
20%
30%
40%
50%
60%
70%
80%
90%
100%
No change
1-500
501-1,000
1,001-2,000
2,001-3,000
3,001-4,000
4,001-5,000
6,001-7,000
7,001-8,000
8,001-9,000
9,001-10,000
More than 10,000
Don't know
Not Applicable
Proportion of respondents
Mileage
Increased Decreased
Results for London
20
FIGURE 3.12 INFLUENCE OF CAR CLUB MEMBERSHIP ON CAR PURCHASE
3.18 Respondents were asked to state whether joining a car club had made it more or
less likely that their household will buy a car in the next few years. The results
show that the majority of members and joiners (66%) deem it less likely that they
will buy a private car in the next few years now that they are car club members
(Figure 3.13). 23% stated that it has had no effect on their future purchasing
decisions.
FIGURE 3.13 LIKELIHOOD OF PURCHASING A CAR IN FUTURE
Travel behaviour
3.19 All respondents were asked to state how often they travel by different modes of
transport (bus, coach, underground / metro / tram, train, private car, car club
car, car as passenger, taxi/minicab, bicycle and walking).
26%
45%
29%
0%
10%
20%
30%
40%
50%
60%
70%
80%
90%
100%
Proportion of respondents
Yes, wouldhavepurchaseda car
No, wouldnot havepurchaseda car
Don't know
4%
23%
66%
7%
0%
10%
20%
30%
40%
50%
60%
70%
80%
90%
100%
Proportion of respondents
More likely
Less likely
No effect
Don't know

Results for London
21
3.20 Car club members in London frequently walk for 20 minutes or more: 57% stated
that they make such journeys 3 or more times a week and 25% at least once a
week as shown in Figure 3.14.
3.21 Car club members in London make frequent use of public transport:
I 50% travel by bus more than 3 times a week
I 58% travel by Underground / tram more than 3 times a week
I 23% travel by train more than 3 times a week.
3.22 Over a third of London car club members are regular cyclists (33% cycling at least
once a week).
FIGURE 3.14 FREQUENCY OF USE OF OTHER MODES (MEMBERS)
3.23 Table 3.2 compares travel behaviour by car club members with the general London
population, using information from the London Travel Demand Survey and National
Travel Survey14. The table shows that more car club members and joiners use
sustainable travel modes at least once a week compared to the general population
surveyed in the London Travel Demand Survey15.
14 Department for Transport (2011) National Travel Survey Tables NTS0312 and NTS0313. Last accessed online 4th
June 2013 at: https://www.gov.uk/government/statistical-data-sets/nts03-modal-comparisons
15 London Travel Demand Survey 2009/10, Transport for London
57%
50%
58%
23%
9%
5%
5%
24%
25%
21%
20%
15%
6%
9%
9%
11%
9%
12%
19%
16%
35%
9%
44%
36%
37%
10%
5%
19%
17%
16%
37%
24%
29%
10%
76%
9%
59%
7%
23%
17%
46%
0% 20% 40% 60% 80% 100%
Walking
Bus
Coach
Underground
Train
Car driver (private car)
Car driver (club car)
Car passenger(private or club car)
Taxi
Bicycle
Proportion of respondents
3 + a week 1-2 a week At least once a month At least once a year No trips Don't know

Results for London
22
TABLE 3.2 COMPARING MEMBER TRAVEL BEHAVIOUR WITH GENERAL
POPULATION
Mode Car club
members
Car club
joiners
National Travel
Survey
London
Travel
Demand
Survey
% of respondents using mode at least once a week
Bicycle 33% 27% 15% 13%
Taxi 16% 19% 8% 4%
Train 38% 44% 7% 16%
Underground 78% 77% N/A 35%
Coach 1% 2% 1% -
Bus 71% 72% 29% 61%
Walking* 82% 80% 64% 95%*
*The NTS asks respondents to state how often they walk for 20 minutes or more. The
LTDS does not specifically ask this question.
3.24 Joiners were asked to state how often they used each of the modes in Table 3.2
before and after they joined the car club, in order to identify whether joining a
car club had an immediate impact on travel behaviour (Figure 3.15). The charts
show that the most significant changes were:
I A reduction in the frequency of trips made using private cars: 34% of joiners
stated that they travelled by car as driver at least once a week before joining
the car club, which fell to 24% after joining.
I There was little change in frequency of cycling (which remained high) and only
a small increase in walking frequency.

Results for London
23
FIGURE 3.15 FREQUENCY OF USE OF OTHER MODES BEFORE & AFTER JOINING
8% 7%4% 4%
16% 17%
21% 24%
50% 48%
0%
10%
20%
30%
40%
50%
60%
70%
80%
90%
100%
Before After
Bus
3 or moretimes a week
1-2 times aweek
At least oncea month
At least oncea year
No trips made
Don't know 3% 3%
68% 70%
19% 22%
6% 4%
0%
10%
20%
30%
40%
50%
60%
70%
80%
90%
100%
Before After
Coach
3 or moretimes a week
1-2 times aweek
At least oncea month
At least oncea year
No trips made
Don't know
3% 2%4% 4%
16% 17%
22% 22%
53% 55%
0%
10%
20%
30%
40%
50%
60%
70%
80%
90%
100%
Before After
Underground
3 or moretimes a week
1-2 times aweek
At least oncea month
At least oncea year
No trips made
Don't know10% 10%
17% 19%
25% 27%
15% 14%
32% 30%
0%
10%
20%
30%
40%
50%
60%
70%
80%
90%
100%
Before After
Train
3 or moretimes a week
1-2 times aweek
At least oncea month
At least oncea year
Don't know
No trips made
2%
39%48%
11%
14%15%
14%12%
11%22%
13%
0%
10%
20%
30%
40%
50%
60%
70%
80%
90%
100%
Before After
Car driver -private car
3 or moretimes a week
1-2 times aweek
At least oncea month
At least oncea year
No trips made
Don't know 3% 2%
64%
14%
12%
21%
15%
45%
4%14%
3%
0%
10%
20%
30%
40%
50%
60%
70%
80%
90%
100%
Before After
Car driver -club car
3 or moretimes a week
1-2 times aweek
At least oncea month
At least oncea year
No trips made
Don't know
2% 2%
25% 24%
19% 17%
33% 36%
12% 13%
10% 8%
0%
10%
20%
30%
40%
50%
60%
70%
80%
90%
100%
Before After
Car passenger -private or club car
3 or moretimes a week
1-2 times aweek
At least oncea month
At least oncea year
No trips made
Don't know 2% 2%
22% 20%
21% 23%
36% 36%
12% 13%
9% 6%
0%
10%
20%
30%
40%
50%
60%
70%
80%
90%
100%
Before After
Taxi
3 or moretimes a week
1-2 times aweek
At least oncea month
At least oncea year
No trips made
Don't know
2%
53% 53%
9% 9%
10% 10%
5% 6%
20% 20%
0%
10%
20%
30%
40%
50%
60%
70%
80%
90%
100%
Before After
Bicycle
3 or moretimes a week
1-2 times aweek
At least oncea month
At least oncea year
No trips made
Don't know 9% 7%
2% 2%
10% 10%
21% 23%
56% 57%
0%
10%
20%
30%
40%
50%
60%
70%
80%
90%
100%
Before After
Walking
3 or moretimes a week
1-2 times aweek
At least oncea month
At least oncea year
No trips made
Don't know

Results for London
24
Reasons for joining a car club
3.25 Two additional questions were included in the 2012 survey which aimed to
understand members’ motivations for joining a car club and their personal
circumstances at the time.
3.26 Figure 3.16 shows that the most popular reason stated by respondents was hiring
on a short term basis (78% of members and 79% of joiners) followed by the ability
to make trips that cannot be made using other modes (62% of members and 59% of
joiners). Almost 1 in 4 individuals joined a car club because it was recommended
to them, highlighting the importance of word-of-mouth and the need for car clubs
to maintain a good reputation.
FIGURE 3.16 REASONS FOR JOINING A CAR CLUB
3.27 Figure 3.17 shows that approximately a third of members and joiners had moved to
a new area, while 13% had changed jobs or retired at the time of joining a car
club. This appears to suggest that car clubs may be most appropriately marketed
to potential members at particular ‘life events’, times in life when a change in
personal circumstances may require review of personal travel options, most likely
in conjunction with reviewing other lifestyle choices.
3%
8%
14%
24%
10%
21%
23%
59%
79%
2%
13%
13%
14%
16%
26%
31%
62%
78%
0% 20% 40% 60% 80% 100%
None of the above
Parking problems
Had to sell/dispose of car
Recommended to me
Reduce car use
Reduce amount spent on travel
Be environmentally friendly
To make trips I can't by other modes
Hire on short term basis
Proportion of respondents
Members
Joiners

Results for London
25
FIGURE 3.17 CHANGES IN PERSONAL CIRCUMSTANCES AT TIME OF JOINING
53%
1%
1%
1%
6%
10%
13%
31%
55%
1%
1%
1%
7%
9%
13%
30%
0% 20% 40% 60% 80% 100%
None of the above
Children started at new school
Left home for first time
Children left home
Change in financial circumstance
Change in family circumstance
Changed jobs/retired
Moved to new area
Proportion of respondents
Members
Joiners


Results for London
27
4 Results of the peer-to-peer member survey
What is a peer to peer car club?
4.1 In relation to car clubs, the term peer to peer refers to the ability of car owners to
rent out their personal vehicle for money when they are not using it. As a business
model, it is closely aligned to traditional ‘back-to-base’ car clubs. However, in
contrast to back-to-base car clubs, the peer to peer vehicle fleet is ‘virtual’ i.e. it
fluctuates according to the number of participating car owners.
4.2 Benefits of peer to peer rental in comparison to back-to-base car hire can include:
I Reduced rental costs;
I Increased choice of models available for rent; and
I Increased proximity of pick-up point to renters’ homes.
4.3 At the time of the survey, Whipcar was the primary operator of peer to peer car
sharing in Great Britain. However, on 12th March 2013, prior to the publication of
this survey, Whipcar closed its operations.
Survey results
4.4 The 2012 peer-to-peer operator survey was issued to Whipcar members only16.
These members consisted of a mix of those that rented out their vehicle and those
that rented vehicles from other members. 276 members responded and the results
are reported below. Although comparisons are provided with the results of similar
questions from the London member surveys, it should be noted that the Whipcar
survey was open to all its members, most of whom were based in London.
Location of members
4.5 The majority of respondents (99%) live in England with 75% residing in London
where Whipcar’s activities were concentrated and most strongly marketed (Figure
4.1).
16 These members consisted of a mix of those that rented out their vehicle and those that rented vehicles from
other members.

Results for London
28
FIGURE 4.1 LOCATION OF MEMBERS
4.6 As shown in Figure 4.2, the greatest number of respondents (48%) are aged 25-34
years. The second largest age bracket is 35-44 years (24%).
FIGURE 4.2 AGE OF WHIPCAR RESPONDENTS
4.7 The majority of respondents (68%) joined Whipcar in 2012.
4.8 Members were asked how many times they had rented a car from Whipcar. The
greatest number of respondents (38%) have rented once. The second largest
proportion have never rented a Whipcar vehicle (22%) (Figure 4.3). It is likely that
some of these members joined Whipcar in order to rent out their own vehicle,
rather than rent cars from other members. The majority of members, however, do
not own their own vehicle (Figure 4.6).
London, 75%
England, 24%
Scotland, 1%
Wales, 0.4%
11%
48%
24%
10%7%
0%
10%
20%
30%
40%
50%
60%
Under 25 25-34 35-44 45-54 55 or older
Proportion of respondents

Results for London
29
FIGURE 4.3 NUMBER OF RENTALS
Member satisfaction
4.9 75% of members describe the service they receive from Whipcar as “Good” or
“Very Good”. Just, 5% of members describe Whipcar’s service as “Poor” or “Very
Poor” (Figure 4.4).
FIGURE 4.4 SATISFACTION WITH WHIPCAR’S SERVICE
Car ownership
4.10 As shown in Figure 4.5, the majority of respondents (58%) did not own a car prior
to joining Whipcar, which suggests that many members use the car club cars as
substitutes for privately owned vehicles. Comparing Figure 4.5 with Figure 4.6,
which details the number of cars owned by respondents at the time of the survey,
it can be seen that the proportion of people owning 1 or 2 cars has decreased
(from 38% to 25%) whilst the proportion of people without a car has increased
(from 58% to 69%).
22%
38%
16%
11%
6%7%
0%
5%
10%
15%
20%
25%
30%
35%
40%
0 1 2 3 4 5 or more
Proportion of respondents
46%
29%
9%
3%2%
11%
0%
5%
10%
15%
20%
25%
30%
35%
40%
45%
50%
Very Good Good Average Poor Very Poor NotApplicable
Proportion of respondents

Results for London
30
FIGURE 4.5 NUMBER OF CARS OWNED PRIOR TO JOINING WHIPCAR
FIGURE 4.6 NUMBERS OF CARS OWNED AT TIME OF SURVEY
Cars sold and their usage
4.11 Respondents were asked whether they had sold or otherwise disposed of a car
during the 12 months prior to completing the survey. 78% said that they had not
(Figure 4.7). The 20% of respondents (54 in total) who had sold their car were also
asked whether being a member of Whipcar had an effect on their decision (Figure
4.7). The majority (65% - 35 respondents) stated that joining Whipcar had no
effect on their decision.
4.12 Of the 54 respondents who had sold a car within the last 12 months, 19 had not
driven it in the last year and all others had driven less than 5,000 miles (35%). Lack
of use could have been a decisive factor in these respondents’ decision to
sell/dispose of their car.
58%
26%
12%
3%0% 1%
0%
10%
20%
30%
40%
50%
60%
70%
80%
0 1 2 3 4 5 or more
Proportion of respondents
69%
18%
7%3%
0.4% 0.4%3%
0%
10%
20%
30%
40%
50%
60%
70%
80%
0 1 2 3 4 5 or more Noresponse
Proportion of respondents

Results for London
31
FIGURE 4.7 CAR SOLD OR DISPOSED AND EFFECT OF WHIPCAR
Household mileage
4.13 Respondents were asked how far they or their household have driven during the
last year in both a Whipcar (Figure 4.8) and any other car (Figure 4.9). The
majority of respondents (26%) had not driven anywhere in a Whipcar in the last
year, which corresponds with the high proportion of individuals who had not yet
rented a Whipcar. Figure 4.8 shows a negative trend in proportion of respondents
by miles travelled i.e. the majority of users did not drive many miles in a Whipcar
vehicle over the course of a year.
No78%
No response2%
Major factor 4%
Minor factor 24%
No effect 65%
Don't know 7%
Yes20%

Results for London
32
FIGURE 4.8 MILEAGE DURING THE LAST YEAR - WHIPCAR
4.14 Respondents were then asked how many miles they had driven in private vehicles
in the 12 months prior to the survey. As Figure 4.9 shows, 33% of respondents had
not driven a private vehicle within the last year. The second largest group of
respondents (17%) drove approximately 501-1000 miles in a private vehicle within
the last year, representing a much lower annual mileage than the national average
of 8,430 miles for car drivers.
FIGURE 4.9 MILEAGE DURING THE LAST YEAR – ANY CAR
4.15 Figure 4.10 shows that the majority of respondents (68%) stated that their
household annual mileage had not changed since joining Whipcar. No respondents
stated that their annual mileage has decreased whilst 29% stated that it had
increased. It is possible that peer-to-peer car clubs increase car mileage
consumption by making car travel available to people who previously did not travel
by car, though, as noted above, users are generally low mileage drivers.
3%
0.4%
1%
1%
0%
0.4%
1%
12%
16%
18%
21%
26%
0% 5% 10% 15% 20% 25% 30% 35%
No response
6000+
5001-6000
4001-5000
3001-4000
2001-3000
1001-2000
501-1000
251-500
101-250
1-100
0
Proportion of respondents
3%
0%
0%
3%
1%
5%
10%
17%
12%
8%
8%
33%
0% 5% 10% 15% 20% 25% 30% 35%
No response
6000+
5001-6000
4001-5000
3001-4000
2001-3000
1001-2000
501-1000
251-500
101-250
1-100
0
Proportion of respondents

Results for London
33
FIGURE 4.10 CHANGE IN HOUSEHOLD ANNUAL MILEAGE SINCE JOINING
WHIPCAR
Retrospective and future car ownership
4.16 13% of respondents stated that they would have purchased a car if they had not
joined Whipcar (see Figure 4.11).
FIGURE 4.11 PROPENSITY FOR HOUSEHOLD TO BUY A PRIVATE CAR
4.17 Respondents were asked whether joining Whipcar had made it more or less likely
that their household will buy a car (or another car) in the next few years. As Figure
4.12 shows, 47% felt that joining Whipcar had made it less likely that they will
purchase a car in the next few years. 9% stated it had made it more likely whilst
32% considered that it had no effect.
0%
68%
29%
3%
0%
10%
20%
30%
40%
50%
60%
70%
80%
Decreased No change Increased No response
Proportion of respondents
No65%
Yes13%
Don't know 19%
No response 3%

Results for London
34
FIGURE 4.12 LIKELIHOOD THAT HOUSEHOLD WILL BUY A CAR IN THE NEXT FEW
YEARS
Transport mode preferences
4.18 Respondents were asked to state how often they made trips by the transport
modes listed in Figure 4.13. They key results were as follows:
� 50% walked (for 20 minutes or more without stopping) 3 or more times per
week;
� 33% travel by bicycle at least once a week;
� 63% used the bus more than once a week;
� 24% made a trip by coach at least once per year;
� 60% used the underground/metro/tram at least once a week (highlighting
the high proportion of London-based respondents in the sample);
� 65% used the train at least once per month;
� 38% made no trips by private car over the course of a year;
� 30% used a car club at least once per year;
� 30% travelled as a car passenger at least once per month; and
� 35% used a taxi at least once per month.
47%
9%
32%
7% 6%
0%
5%
10%
15%
20%
25%
30%
35%
40%
45%
50%
Less likely More likely No effect Don't know No response
Proportion of respondents

Results for London
35
FIGURE 4.13 FREQUENCY OF USE OF OTHER MODES
Why Whipcar?
4.19 Respondents were asked why they chose to join Whipcar. Respondents could
choose as many options as they wished. The majority (83%) stated that it was so
they could hire cars on a short term basis. Other popular answers include making
trips that they are unable to do by other modes (51%) and instead of
purchasing/replacing a car (24%) (Figure 4.14).
11% 11% 8%14%
10% 11% 12% 12% 13% 12%
3%2%
2% 4% 3%4%
36%
8%
54%
6% 7%
38%32%
21%
14%
9%
7%
24%
7%
16%
14%30%
17%
27%
13%
9%
14%
5%
16%
26%
10%
16%
30%35%
20%
7%
21% 17%
18%
8%
4%
9%
9%
50%
26%
42% 43%
21%16%
2%6%
0%
10%
20%
30%
40%
50%
60%
70%
80%
90%
100%
Walking Bicycle Bus Coach Underground/ Metro /Tram
Train Private Car Car Club CarPassenger
Taxi
Proportion of respondents
3 + per week
1-2 per week
At least once per month
At least once per year
No trips made
Don't know
No response

Results for London
36
FIGURE 4.14 REASON FOR JOINING WHIPCAR
4.20 10% of respondents answered, “Other”. These individuals were asked to provide
more details. Stated reasons for choosing Whipcar included:
� It is a cheaper alternative to more conventional car clubs;
� It is more convenient as cars can be hired locally;
� There is less paperwork involved than with conventional car clubs;
� To experience driving different makes and models of car;
� It allows me to hire a bigger vehicle (7-seater/MPV); and
� To support local residents and the wider community rather than rental
companies.
Recent member experiences
4.21 Respondents were asked whether they had experienced any of the life-events
listed in Figure 4.15 at the time of joining Whipcar. The majority (61%) had not
experienced any significant changes in their lives. However, 25% had moved to a
new area, 14% had changed job or retired and 7% had faced a change in financial
circumstances. Respondents could choose as many options as they wished, so some
may have had more than one life-event at the time of joining. Overall, 61% stated
that had not experienced any of the listed events below.
3%
5%
8%
10%
15%
19%
19%
24%
51%
83%
0% 20% 40% 60% 80% 100%
None of the above
Problems parking locally
Reduce car use
Other
Recommended to me
Be environmentally friendly
Reduce time spent on travel
Instead ofpurchasing/replacing a car
To make trips I cannot do byother modes
Hire on a short term basis
Proportion of respondents

Results for London
37
FIGURE 4.15 SIGNIFICANT LIFE-EVENTS AT THE TIME OF JOINING WHIPCAR
0%
0.4%
1%
5%
7%
14%
25%
0% 5% 10% 15% 20% 25% 30%
My children started at a newschool
I left home for the first time
My children left home
I had a change in familycircumstances
I had a change in financialcircumstances
I changed jobs/retired
I moved to a new area
Proportion of respondents


Results for London
39
5 Results of the corporate member survey
Introduction
5.1 The corporate member survey was completed by 754 respondents who are
members of a car club through their employer. Often the membership is paid for
by the employer and the car club cars are used as pool cars for work-related
journeys during the working day. As such, they are a different user group from
individual, private members so a new, bespoke survey was issued to these
members (although some respondents may also hold an individual, private
membership). Car club operators were responsible for identifying corporate
members and ensuring the survey was sent to the appropriate respondents.
5.2 Corporate membership is not available to all members (it is only offered by
operators in certain locations) and is provided to members, and usually paid for,
by their employer. Adoption of sustainable travel policies may have an influence
on take-up of corporate car club membership. The survey is therefore not
representative of all businesses, only those who are corporate car club members.
5.3 This section contains the results of the corporate member survey for the whole of
the Great Britain sample including England and Wales, Scotland and London17.
Satisfaction with car clubs
5.4 Business users were asked to state their overall satisfaction with the level of
service provided by their car club operator. The majority of users state high levels
of satisfaction with 91% rating their car club’s service as “Good” or “Very Good”
(Figure 5.1). Just 8% rate the service they have received as “Average” or “Poor”.
5.5 With 91% of business users stating that their car club service is “Good” or “Very
Good”, satisfaction is similar to individual members in London (88%).
17 The results have not been disaggregated as the sample size for the survey is not sufficient to enable conclusive
analysis on a regional basis.

Results for London
40
FIGURE 5.1 SATISFACTION WITH CAR CLUBS
5.6 Figure 5.2 shows that the majority of respondents (51%) use a car club car at least
once a month.
FIGURE 5.2 FREQUENCY OF CAR CLUB USE
5.7 To identify any changes made to travel behaviour as a consequence of joining a car
a club, respondents were asked what mode of transport they primarily used for
work-related trips before and after gaining membership. Figure 5.3 shows a large
increase in respondents’ car club use after joining a club and a corresponding
reduction in the proportion of those using their own car for work-related trips
(from 46% to 7%). In addition, a smaller proportion of respondents use pool cars or
50%
41%
7%
1%0.1% 0.3%
0%
10%
20%
30%
40%
50%
60%
Very good Good Average Poor Very poor No response
Pro
po
rtio
n o
f re
spo
nd
en
ts
0.3%
26%
22%
30%
21%
0% 5% 10% 15% 20% 25% 30% 35%
No response
Less than once every two
months but at least once per year
Less than once a month but at
least once every two months
Once a month or more
Once a week or more
Proportion of respondents

Results for London
41
traditional car rentals after joining their car club. The proportion of respondents
using public transport and taxis both decreased by 5 percentage points, walking
increases by 1 percentage point and cycling remains the same at 3%.
FIGURE 5.3 MODES USED FOR BUSINESS TRAVEL BEFORE AND AFTER JOINING
A CAR CLUB
5.8 Although public transport use by corporate members for business travel appears to
decrease after joining a car club, corporate car club membership facilitates the
use of public transport for the commute to work by removing the need for an
employee to bring his/her car to work in order to use it during the working day. As
shown in Figure 5.4, 16% of respondents stated that they travel to work by car less
often – many of these journeys are likely to be public transport journeys.
5.9 Figure 5.4 also shows the most common change is travelling to work less often
(chosen by 16% of respondents), and using a car club car for non-work-related
journeys (15%). 12% of respondents state that they make more work-related trips
as a result of joining the car club, compared to 5% who make fewer trips. For most
respondents (56%), there is no impact on travel behaviour.
46%
7%
3%
2%
13%
4%
66%
5%
1%20%
15%1%
2%
3%
3%
6%
1%4%
0%
10%
20%
30%
40%
50%
60%
70%
80%
90%
100%
Before After
Pro
po
rtio
n o
f re
spo
nd
en
ts
Other
Taxi
Cycle
Walk
Public transport
Traditional car rental
Used a car club car
Used a pool car owned
by my employer
Used a company car
Used my own car

Results for London
42
FIGURE 5.4 INFLUENCE OF CAR CLUB MEMBERSHIP ON TRAVEL BEHAVIOUR
5.10 Corporate members were asked which type of car club vehicle they use most
often: car or van. Table 5.1 shows that 94% of respondents use a car more often
than a van.
TABLE 5.1 USE OF CARS AND VANS
Vehicle Type Proportion of respondents
Car 94%
Van 6%
5.11 Finally, respondents were asked whether their organisation had made any changes
to its business travel arrangements or policies since joining the car club. The most
common change was discouraging employees from using their own cars to make
work-related trips (16%) closely followed by car pool cars being replaced with car
club cars (14%) (Figure 5.5). Many respondents either did not know about any
changes (25%) or stated that no changes had been made to their business’s travel
policy (23%).
5%
7%
12%
15%
16%
0% 2% 4% 6% 8% 10% 12% 14% 16% 18%
I make fewer work-related trips
I have sold or disposed of my car
I make more work-related trips
I now use a club car for private (non-work-
related) trips
I travel to work by car less often
Proportion of respondents

Results for London
43
FIGURE 5.5 INFLUENCE OF CAR CLUB MEMBERSHIP ON BUSINESS TRAVEL
ARRANGEMENTS
23%
25%
3%
4%
4%
10%
14%
16%
0% 5% 10% 15% 20% 25% 30%
No changes to travel policies
Don't know
The number of company
cars has been reduced
Car mileage allowance
rates have been reduced
Other changes made to
travel policies
No response
Pool cars have been replaced
by car club cars
Employees are actively
discouraged from using their own cars
Proportion of respondents

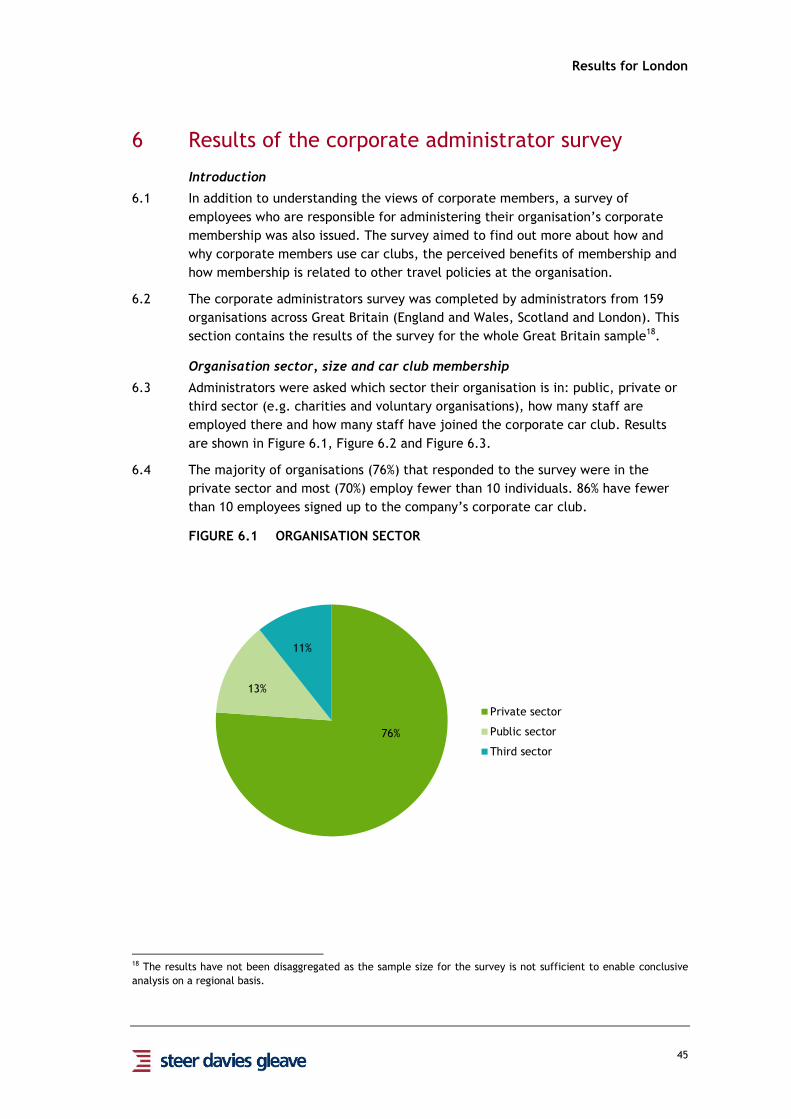
Results for London
45
6 Results of the corporate administrator survey
Introduction
6.1 In addition to understanding the views of corporate members, a survey of
employees who are responsible for administering their organisation’s corporate
membership was also issued. The survey aimed to find out more about how and
why corporate members use car clubs, the perceived benefits of membership and
how membership is related to other travel policies at the organisation.
6.2 The corporate administrators survey was completed by administrators from 159
organisations across Great Britain (England and Wales, Scotland and London). This
section contains the results of the survey for the whole Great Britain sample18.
Organisation sector, size and car club membership
6.3 Administrators were asked which sector their organisation is in: public, private or
third sector (e.g. charities and voluntary organisations), how many staff are
employed there and how many staff have joined the corporate car club. Results
are shown in Figure 6.1, Figure 6.2 and Figure 6.3.
6.4 The majority of organisations (76%) that responded to the survey were in the
private sector and most (70%) employ fewer than 10 individuals. 86% have fewer
than 10 employees signed up to the company’s corporate car club.
FIGURE 6.1 ORGANISATION SECTOR
18 The results have not been disaggregated as the sample size for the survey is not sufficient to enable conclusive
analysis on a regional basis.
76%
13%
11%
Private sector
Public sector
Third sector

Results for London
46
FIGURE 6.2 NUMBER OF EMPLOYEES IN ORGANISATION
FIGURE 6.3 NUMBER OF EMPLOYEES IN CAR CLUB
Administrator satisfaction
6.5 Administrators were asked to state their overall satisfaction with the service
provided by their car club operator. The majority of administrators stated high
levels of satisfaction with 82% rating their car club’s service as “Good” or “Very
Good” (Figure 6.4). Just 2% rate their car club’s service as “Average” or “Poor”.
70%
18%
4%
1%
6%
1%
0%
0%
1%
0% 20% 40% 60% 80% 100%
less than 10
10-30
31-70
71-100
101-500
501-750
751-1000
1001-1500
1,501-2,000
Proportion of respondents
Number of employees
86%
5%
3%
2%
4%
0% 20% 40% 60% 80% 100%
less than 10
10-30
31-70
71-100
101-500
Proportion of respondents
Number of employees in car club

Results for London
47
FIGURE 6.4 SATISFACTION WITH CAR CLUB SERVICE
Perceived benefits
6.6 Respondents were asked to choose perceived benefits of joining a car club from
the options shown in Figure 6.5. They could choose as many benefits as they
wished. The most popular benefit selected was financial savings (chosen by 29%)
followed by reduced administration (19%) and increased employee satisfaction
(15%).
6.7 Financial savings may come in various forms. There are likely to be productivity
gains from corporate car club membership, particularly through the ability of
employees to make multi-destination trips by car club cars as part of the working
day. Such trips are often difficult by public transport, particularly outside of
London. Further financial benefits may be derived from reduced administration of
employee mileage claims and provision of on-site parking to accommodate
employees own cars for business travel use.
6.8 Only 13% of respondents highlighted reduced CO2 emissions arising from corporate
car club membership, perhaps highlighting that financial motivations are stronger
than environmental ones for administrators of corporate car club accounts. The
environmental benefits of car clubs to an organisation include the following:
I Car club fleets are, on the whole, comprised of modern, efficient and
frequently maintained vehicles (see section 7). A “grey fleet” of employees’
own cars is also likely to contain a variety of vehicles of varying fuel efficiency
and safety.
I Corporate members are able to obtain full details of the efficiency of the
vehicles provided by the car club. In contrast, employers who rely on the use of
employees’ own vehicles for business travel are unlikely to have access to such
information about the nature of the grey fleet.
47%
35%
1% 1%
16%
0%
5%
10%
15%
20%
25%
30%
35%
40%
45%
50%
Very good Good Average Poor No response
Proportion of respondents

Results for London
48
FIGURE 6.5 PERCEIVED BENEFITS OF JOINING A CAR CLUB
Business mileage travelled using car club cars
6.9 Respondents were asked to estimate the proportion of car mileage travelled by
their organisation using car club cars for work-related journeys. As discussed later,
53% of the respondents stated that their organisation did not collect information
about mileage travelled using car club cars on business travel so many respondents
would have been estimating their response, rather than providing accurate figures
from company records.
6.10 23% of respondents stated that their organisation uses car club cars for over half of
their business mileage. Half of the respondents indicated that less than 10% of
their business mileage is undertaken using car club cars (Figure 6.6). As most
respondents stated that a small proportion of their business mileage was travelled
in car club cars, this highlights the role of a corporate car club as a complement to
other modes, rather than a single solution to an employer’s travel needs. The
survey did not ask for the proportion of business mileage travelled using other
modes or other car travel options such as pool cars.
4%
9%
11%
13%
15%
19%
29%
0% 5% 10% 15% 20% 25% 30% 35%
None of the Above
Reduced Business Mileage
Reduced Parking Needed
Reduced CO2 Emissions
Employee Satisfaction
Reduced Admin
Financial Savings
Proportion of respondents

Results for London
49
FIGURE 6.6 PROPORTION OF BUSINESS MILEAGE TRAVELLED USING CAR CLUB
CARS
Data collected by organisation
6.11 Respondents were asked whether their organisation collected data on staff travel
(for business journeys, for example through a staff travel survey). Just 16% said
that they do, with the majority of respondents (65%) stating that they do not. The
rest were unsure (4%) or did not answer the question (16%). However, as noted
above, many of the responding organisations employed fewer than 10 staff: such
organisations may not have the need or resource to conduct travel surveys and are
less likely to prioritise this type of data collection.
6.12 Respondents were also asked whether their organisation collected information
about car mileage travelled by employees on work-related trips (Figure 6.7). The
majority of organisations (53%) do not collect data on work-related car mileage.
However, some organisations collect data for work-related miles completed in a
car club car (21%), a grey fleet vehicle (15%) or a pool car (3%).
50%
11%
8%
4%
4%
7%
3%
4%
9%
0% 10% 20% 30% 40% 50% 60%
less than 10%
11-20%
21-30%
31-40%
41-50%
51-60%
61-70%
71-80%
81-90%
Proportion of respondents

Results for London
50
FIGURE 6.7 MILEAGE INFORMATION COLLECTED
Travel Plans and policies
6.13 Figure 6.8 shows responses to two questions:
i) Does your organisation have a Travel Plan (sometimes known as a Transport
Strategy / Green Transport Plan)?; and
ii) Does your organisation have a travel policy for work-related travel during
the working day?
6.14 A higher proportion of respondents stated that their organisation has a travel
policy (25%) than a Travel Plan (17%), though most had neither. The predominance
of smaller employers in the sample is, again, likely to explain this result.
FIGURE 6.8 TRAVEL PLANS AND POLICIES
9%
53%
3%
15%
21%
0% 10% 20% 30% 40% 50% 60%
Don't know
None of these
Pool car(owned by your organisation)
Grey fleet (employees’ own cars)
Car club car
Proportion of respondents
Mileage information collected
16% 16%
3% 4%
17%25%
64%55%
0%
10%
20%
30%
40%
50%
60%
70%
80%
90%
100%
Travel Plan Travel Policy
Proportion of respondents
No
Yes
Don't know
No response

Results for London
51
Travel policy details
6.15 The respondents (25% of total) who stated that their organisation has a travel
policy for work-related travel were asked to answer the questions in Table 6.1.
6.16 As shown, the majority of travel policies (22) prioritise travel by sustainable modes
for any trip. Only 9 policies require employees to use a car club car to make work-
related car trips for any trip but 21 have this requirement for some trips (the
survey did not ask how this is managed). Only four respondents stated that
employees are not permitted to use their own vehicles for work-related trips and
only four respondents stated that their policy prevents employees from claiming a
private vehicle mileage allowance. 16 organisations did restrict claims for some
trips.
TABLE 6.1 TRAVEL POLICY MEASURES
Travel Policy Question Yes, for any
trip
Yes, but only
for some trips No
Does the travel policy prioritise travel
by public transport, walking and cycling
for work-related trips?
22 17 4
Does the travel policy require
employees to use a car club car if
making work-related car trips?
9 21 11
Are employees permitted to use their
own vehicle for work-related travel
during the working day?
14 23 4
Are employees permitted to claim a
private vehicle mileage allowance for
work-related travel?
21 16 4
Changes to travel policies
6.17 Administrators were asked whether their organisation had made any changes to its
business travel arrangements or policies since joining a car club. Figure 6.9 shows
that 46% of organisations made no changes to their travel policy. The most
common change involved organisations actively discouraging employees from using
their own cars to travel (13%).

Results for London
52
FIGURE 6.9 CHANGES TO TRAVEL POLICIES SINCE JOINING THE CAR CLUB
6.18 The 7% of respondents who stated that there were other changes to travel their
travel policies were asked to provide more detail in a free text box. The responses
included:
� “Employees take fewer taxis”;
� “We use fewer full day hire cars”;
� “Bicycles are encouraged”;
� “We have reduced on-site parking”;
� “Staff are encouraged to use a specific car club”; and
� “Long distance travel must be booked through travel hubs (booking
centres)”.
Travel options and provisions
6.19 The survey included a question about other travel options provided in addition to
car club membership. Respondents could choose as many of the options shown in
Figure 6.10 as they liked. The chart shows that the most popular provision when
making work-related trips was a pre-paid public transport ticket (chosen by 61% of
respondents) followed by pool cars (28%) and pool bikes (23%). It should be noted
that 48 respondents (30%) did not answer this question which may suggest that
their organisations provide no work-related travel options for their employees.
16%
1%
5%
6%
6%
7%
13%
46%
0% 5% 10% 15% 20% 25% 30% 35% 40% 45% 50%
No response
Car mileage allowance rates have been reduced
The number of company cars has been reduced
Pool cars have been replaced by car club cars
Don't know
Other changes to travel policies
Employees are actively discouraged from using theirown cars
No changes to travel policies
Proportion of respondents

Results for London
53
FIGURE 6.10 TRAVEL OPTIONS
30%
4%
14%
20%
23%
28%
61%
0% 10% 20% 30% 40% 50% 60% 70%
No response
Salary Sacrifice Cars
Company Cars
Leased Cars
Pool Bikes
Pool Cars
Pre-Paid Public Transport Ticket
Proportion of respondents


Results for London
55
7 Results of the operator survey and emissions
analysis and profiling
Operator Survey
Introduction
7.1 This section contains the information provided by car club operators about their
service. Each car club operator provided details of their vehicle fleet, membership
numbers and characteristics of members and data regarding use of car clubs by
their members such as mileage travelled. The data collected was on a GB wide
basis (i.e. for England, Wales, Scotland and London) and was mainly the same as
for previous operator surveys19. Fourteen car clubs provided data, including the
larger commercial car club operators and a number of not-for-profit community
car clubs.
7.2 This year, more detailed analysis of car club vehicle emissions has been
undertaken and is reported in this chapter.
Characteristics of car club members
7.3 Operators were asked to state how many of their members live in London, England
and Wales (excluding London), and Scotland. As shown in Table 7.1, the majority
of car club members in Great Britain live in London (84%) which is the primary
market for car clubs.
TABLE 7.1 MEMBERS BY LOCATION
Region Proportion
London 84%
England and Wales 12%
Scotland 4%
7.4 Of all the operators’ members, 82% have individual membership whilst 18% hold
corporate membership.
7.5 Operators were asked to provide information on the gender split of their car club
members. In 2012, 61% of car club members were male and 32% were female. This
compares with a split of 54% male and 46% female amongst national licence
holders in 201220. The proportion of members whose gender was not recorded by
19 Questions requesting data on NOx and PM10 emissions of car club fleets were omitted from this year’s operator
survey owing to difficulties in supplying this data accurately in previous surveys. Instead this data was obtained
through the new emissions analysis and profiling process reported later in this section.
20 FOIR 3008 Annex A - Full and Provisional Category B licence holders in Great Britain, www.dft.gov.uk

Results for London
56
the operator increased from 2% in 2011 to 7% in 201221 but there appears to be
little change in the gender split since 2010 (Figure 7.1).
FIGURE 7.1 GENDER PROFILE OF MEMBERS (2010-2012)
7.6 In addition to gender, operators were asked to provide information about the age
split of car club members. Figure 7.2 shows the high proportion of members aged
25-44. This trend has remained relatively consistent since 2010 when operators
were first asked to gather data on members’ age. In contrast to national licence
holders, there are notably fewer car club members aged 50+ years old, showing
that the market for car clubs is predominantly in the 24-44 year old age group.
Also, younger age groups may be more likely to adopt new technologies such as the
personal mobile devices which are frequently used to book car club cars.
21 One operator who participated in the survey did not collect data on the gender of their members.
69% 67%61%
54%
31% 31%32% 46%
2%7%
0%
10%
20%
30%
40%
50%
60%
70%
80%
90%
100%
2010 2011 2012 Nationallicenceholders
Unknown
Female
Male

Results for London
57
FIGURE 7.2 AGE PROFILE OF MEMBERS (2010-2012)
How car clubs are used
7.7 In order to understand how many members were actively using their car club
membership, operators were asked to state how many of their registered members
had hired a vehicle in the 12 months period from 1st December 2011 to 30th
November 2012. On this basis, 80% of car club members can be classified as active.
7.8 Each operator provided the mean average distance travelled per hire (in miles),
the average length of hire period (in hours) and the average number of hires per
member per year (for those who have hired a car in the last 12 months).
7.9 Table 7.2 provides weighted data on typical use of car club vehicles by members.
The average number of hires per active member has increased since 2011, from
6.7 hires to 8.2 hires, whilst the average duration of hire has remained stable at
6.7 hours (6.8 hours in 2011). Average distance per hire shows a slight increase on
2011, up from 34.5 miles to 37.8 miles. The average annual mileage per member
has increased since 2011, from 237 miles to 305 miles, though this still represents
very low vehicle mileage compared to the general population.
2% 1% 3%
6% 6%6%
5%
19%16% 18%
7%
23%
22% 24%
8%
28%
29%30%
20%
8%9%
9%
11%
4%6%
6%
10%
3% 4%4%
9%
3% 4%4%
27%
3% 3%
0%
10%
20%
30%
40%
50%
60%
70%
80%
90%
100%
2010 2011 2012 Nationallicenceholders
None recorded
60+
55-59
50-54
45-49
35-44
30-34
25-29
21-24
Under 21

Results for London
58
TABLE 7.2 VEHICLE USAGE
Measure Average
Average distance per hire 37.8 miles
Average number of hires per active
member per year 8.2 hires
Average duration of hire 6.7 hours
Implied miles per member per year 305 miles
7.10 Operators also provided information on the distribution of hires and miles travelled
per hire. As shown in Figure 7.3, the majority of members use car club vehicles
less than once a month (84%).
FIGURE 7.3 NUMBER OF HIRES PER MEMBER PER YEAR
7.11 Figure 7.4 shows that the majority of trips (66%) made in car club vehicles were
less than 25 miles in distance, with 34% of trips over 25 miles.
22%
49%
13%
6%3%
2%4%
1% 0.4%0%
10%
20%
30%
40%
50%
60%
None 1-5 6-10 11-15 16-20 21-25 26-50 51-100 100+
Number of hires
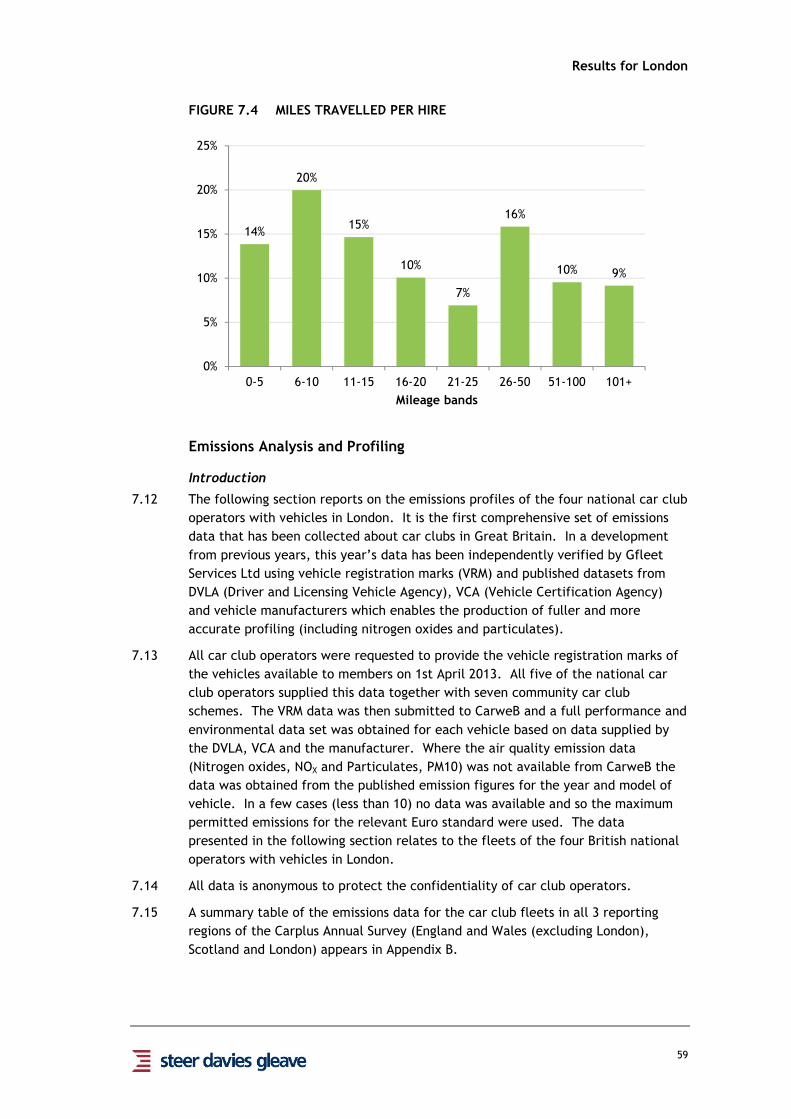
Results for London
59
FIGURE 7.4 MILES TRAVELLED PER HIRE
Emissions Analysis and Profiling
Introduction
7.12 The following section reports on the emissions profiles of the four national car club
operators with vehicles in London. It is the first comprehensive set of emissions
data that has been collected about car clubs in Great Britain. In a development
from previous years, this year’s data has been independently verified by Gfleet
Services Ltd using vehicle registration marks (VRM) and published datasets from
DVLA (Driver and Licensing Vehicle Agency), VCA (Vehicle Certification Agency)
and vehicle manufacturers which enables the production of fuller and more
accurate profiling (including nitrogen oxides and particulates).
7.13 All car club operators were requested to provide the vehicle registration marks of
the vehicles available to members on 1st April 2013. All five of the national car
club operators supplied this data together with seven community car club
schemes. The VRM data was then submitted to CarweB and a full performance and
environmental data set was obtained for each vehicle based on data supplied by
the DVLA, VCA and the manufacturer. Where the air quality emission data
(Nitrogen oxides, NOX and Particulates, PM10) was not available from CarweB the
data was obtained from the published emission figures for the year and model of
vehicle. In a few cases (less than 10) no data was available and so the maximum
permitted emissions for the relevant Euro standard were used. The data
presented in the following section relates to the fleets of the four British national
operators with vehicles in London.
7.14 All data is anonymous to protect the confidentiality of car club operators.
7.15 A summary table of the emissions data for the car club fleets in all 3 reporting
regions of the Carplus Annual Survey (England and Wales (excluding London),
Scotland and London) appears in Appendix B.
14%
20%
15%
10%
7%
16%
10% 9%
0%
5%
10%
15%
20%
25%
0-5 6-10 11-15 16-20 21-25 26-50 51-100 101+
Mileage bands

Results for London
60
Carbon Emissions Profile - Cars
7.16 When a car is registered with the DVLA its carbon emissions measured in grams of
carbon dioxide per kilometre (gCO2/km or g/km) must be submitted. The data is
supplied by the manufacturer and may vary within a model range depending on the
additional equipment fitted such as air conditioning. Since 2001 the carbon
emission data has been used to determine the Vehicle Excise Duty (VED – the tax
disk) payable on a car. For that purpose the emissions have been broken down
into 13 bands from Band A (<= 100 g/km) to Band M (over 255 g/km). No tax is
currently payable on a Band A car while on a Band M car it is £490/annum.
7.17 Cars with carbon emissions under 100 g/km are currently exempt from the London
Congestion Charge but this threshold may change to 75 g/km in July 2013. In
2012/13 there were 573 London car club cars under 100g/km but only four under
75 g/km (Vauxhall Ampera plug-in petrol/electric series hybrid with published
emissions of 27 g/km) and three EVs which are zero emission at the point of use.
There are no vehicles on the on-line VCA national database (May 2013) with
emissions below 75 g/km; the lowest is the Toyota Yaris petrol/electric parallel
hybrid at 79 g/km (24 on fleet in London). The Chevrolet Volt has published
emissions of 27 g/km, the same as the Vauxhall Ampera, but it too does not appear
on the May 2013 VCA database.
7.18 To achieve a reduction in UK transport carbon dioxide emissions, car fleet
operators are encouraged to select vehicles under 120 g/km (Band C) and, where
practical, under 100 g/km (Band A). There are some vehicle types such as large
people carriers which are not yet available under 120 g/km and where a case can
be made for their deployment it is good practice to seek out the lowest carbon
vehicle that meets the requirement. The table which follows shows the number
and proportion of car club cars in London in each VED emission band.

Results for London
61
TABLE 7.3 PROFILE OF CAR CLUB CARS IN LONDON BY VED EMISSION BAND
CO2 Emission Band (gCO2/km) Number %
Band A <=100 573 34.6%
Band B 101-110 199 12.0%
Band C 111-120 784 47.4%
Band D 121-130 7 0.4%
Band E 131-140 85 5.1%
Band F 141-150 5 0.3%
Band G 151-165 1 0.1%
Band H 166-175
Band I 176-185
Band J 186-200
Band K 201-225
Band L 226-255
Band M 256+
Total 1,654 100%
7.19 Figure 7.5 shows the profile of the London Car Club fleet in relation to the British
national fleet data22. Clearly many more London club cars are in the lowest three
emission Bands A to C with most club cars in Band C. In the British national fleet
most vehicles are in Band G (151-165 g/km).
22 DfT Statistics: Table VEH0206. Licensed cars by CO2 emission band, Great Britain, annually: 2001 to 2012.

Results for London
62
FIGURE 7.5 PROFILE OF THE LONDON CAR CLUB AND BRITISH NATIONAL
FLEETS
Note: Some car clubs have a policy of renewing fleet vehicles after a fixed
number of years. Because new car carbon emissions are improving by about 4
g/km/annum23 a regular replacement cycle should result in a better carbon
profile. It will also result in more rapid adoption of new Euro standards which
regulate air quality emissions.
7.20 The distribution is reflected in the car club fleet average carbon emission which is
shown below. Car club cars are on average 31% lower than the British national
average car and 15% lower than the London car club average reported in 2011/12.
23 New Car CO2 Report 2013, SMMT.

Results for London
63
TABLE 7.4 CARBON EMISSIONS OF CAR CLUB CARS AND THE BRITISH
NATIONAL FLEET
Carbon emissions
(gCO2/km) Car Club Cars 2011 Car Club Cars 2012
British National
Fleet
Average – All
Vehicles 129.6 110.1* 160.1
*excludes “zero emission” electric vehicles.
7.21 There is some variation in the carbon profiles of the four clubs operating in London
as can be seen in the bar graph below. At the request of the operators, the data
has been anonymised.
FIGURE 7.6 LONDON CAR CLUB FLEET CARBON EMISSIONS PROFILE
7.22 None of the fleet cars exceeded 150 g/km and in all cases the vehicles in the
higher bands (131-140 g/km and 141-150 g/km) were 5+2 seat people carriers (e.g.
VW Touran); this reflects the differing needs of club members. Only Club 5 had a
fleet under 100 g/km but it was also a very small fleet and all the vehicles were
the same year, make and model.
7.23 In terms of the fuels used clubs in London also show different strategies. While
some have a diesel led approach others are prepared to consider a wide range of
fuel/energy types including electric only.
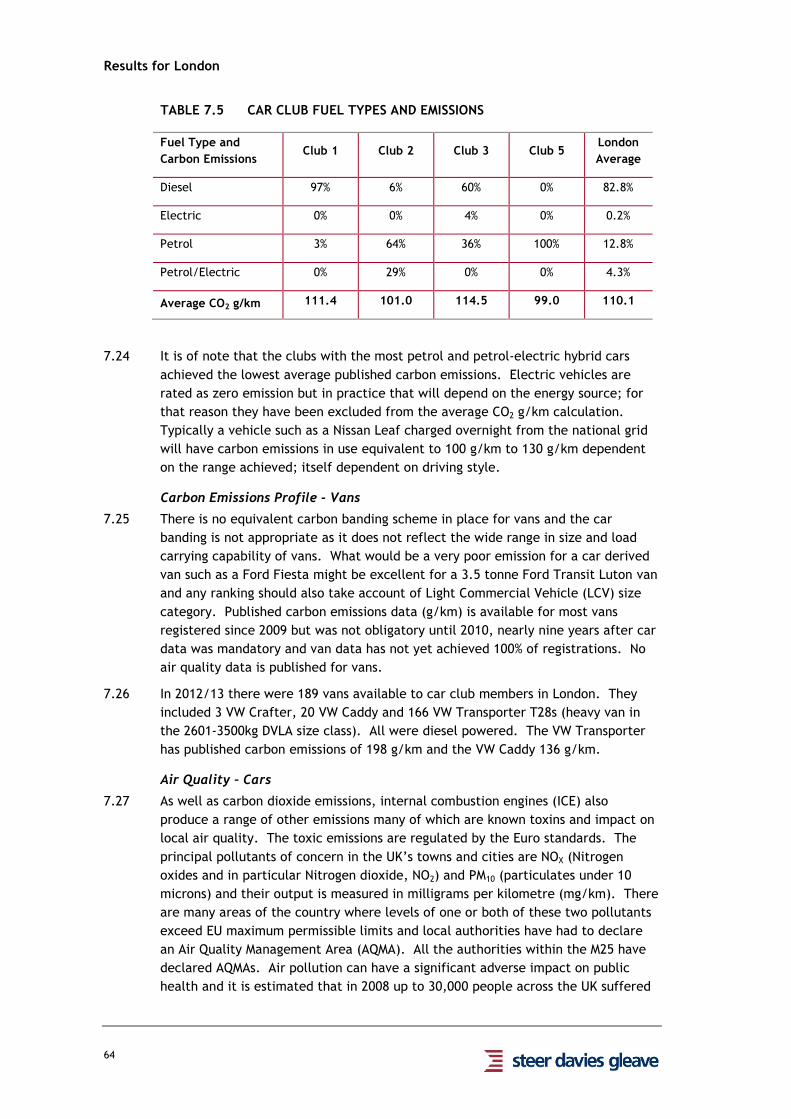
Results for London
64
TABLE 7.5 CAR CLUB FUEL TYPES AND EMISSIONS
Fuel Type and
Carbon Emissions Club 1 Club 2 Club 3 Club 5
London
Average
Diesel 97% 6% 60% 0% 82.8%
Electric 0% 0% 4% 0% 0.2%
Petrol 3% 64% 36% 100% 12.8%
Petrol/Electric 0% 29% 0% 0% 4.3%
Average CO2 g/km 111.4 101.0 114.5 99.0 110.1
7.24 It is of note that the clubs with the most petrol and petrol-electric hybrid cars
achieved the lowest average published carbon emissions. Electric vehicles are
rated as zero emission but in practice that will depend on the energy source; for
that reason they have been excluded from the average CO2 g/km calculation.
Typically a vehicle such as a Nissan Leaf charged overnight from the national grid
will have carbon emissions in use equivalent to 100 g/km to 130 g/km dependent
on the range achieved; itself dependent on driving style.
Carbon Emissions Profile - Vans
7.25 There is no equivalent carbon banding scheme in place for vans and the car
banding is not appropriate as it does not reflect the wide range in size and load
carrying capability of vans. What would be a very poor emission for a car derived
van such as a Ford Fiesta might be excellent for a 3.5 tonne Ford Transit Luton van
and any ranking should also take account of Light Commercial Vehicle (LCV) size
category. Published carbon emissions data (g/km) is available for most vans
registered since 2009 but was not obligatory until 2010, nearly nine years after car
data was mandatory and van data has not yet achieved 100% of registrations. No
air quality data is published for vans.
7.26 In 2012/13 there were 189 vans available to car club members in London. They
included 3 VW Crafter, 20 VW Caddy and 166 VW Transporter T28s (heavy van in
the 2601-3500kg DVLA size class). All were diesel powered. The VW Transporter
has published carbon emissions of 198 g/km and the VW Caddy 136 g/km.
Air Quality – Cars
7.27 As well as carbon dioxide emissions, internal combustion engines (ICE) also
produce a range of other emissions many of which are known toxins and impact on
local air quality. The toxic emissions are regulated by the Euro standards. The
principal pollutants of concern in the UK’s towns and cities are NOX (Nitrogen
oxides and in particular Nitrogen dioxide, NO2) and PM10 (particulates under 10
microns) and their output is measured in milligrams per kilometre (mg/km). There
are many areas of the country where levels of one or both of these two pollutants
exceed EU maximum permissible limits and local authorities have had to declare
an Air Quality Management Area (AQMA). All the authorities within the M25 have
declared AQMAs. Air pollution can have a significant adverse impact on public
health and it is estimated that in 2008 up to 30,000 people across the UK suffered

Results for London
65
premature deaths due at least in part to poor air quality24. This is clearly many
more premature deaths than the number that occur as a direct result of road
traffic collisions. A study25 commissioned by the London Mayor’s Office on the
impact of fine particulate emissions (PM2.5 - under 2.5 microns) suggested that in
London 4,300 deaths/annum could be partially attributed to poor air quality.
7.28 The Euro emissions standards for diesel and petrol cars are shown in the table
below. What is immediately apparent is that for any given standard the diesel
vehicle is permitted to be more polluting; e.g. it is not until 2014 that a Euro 6
diesel car must meet the 2005 Euro 4 standard for NOX emissions for a petrol car.
Most petrol cars have very low particulate emissions, initially (in 1993) this was
considered too low for available technology to measure, but a minimum standard
was introduced in 2009 to ensure new types of petrol engine did not produce
particulates. Concern over the large number of very small (under 2.5 microns) but
low mass particles being produced by modern diesel engines has led to the
introduction in 2011 of a limit to the number of particles (PN) per kilometre (see
Euro 5b in Table 7.6).
TABLE 7.6 EMISSIONS BY EURO STANDARD
Standard Implementation CO HC HC+NOX NOX PM10 PN
DIESEL
Euro 4 January 2005 500 300 250 25
Euro 5a September 2009 500 230 180 5
Euro 5b September 2011 500 230 180 5 6.0 x 10¹¹
Euro 6 September 2014 500 170 80 5 6.0 x 10¹¹
PETROL
Euro 4 January 2005 1000 100 80
Euro 5 September 2009 1000 100 60 5
Euro 6 September 2014 1000 100 60 5 6.0 x 10¹¹
CO = Carbon monoxide (mg/km). HC = Hydrocarbons (mg/km). NOX = Nitrogen Oxides
(mg/km). PM10 = Particles under 10 microns in diameter (mg/km), PN = Particle number
(number/km).
7.29 The car club fleet in London is 99.9% Euro 5 compliant (up from 80.3% in 2011)
with the remaining 0.1% (1 vehicle) meeting the acceptable Euro 4 standard.
24 Air quality: A follow up report - Environmental Audit Committee, October 2011.
25 Report on estimation of mortality impacts of particulate air pollution in London, June 2010

Results for London
66
FIGURE 7.7 LONDON CAR CLUB FLEET EURO EMISSIONS PROFILE
7.30 Clubs 1, 3 and 5 are 100% Euro 5 compliant while Club 2 is almost 100% Euro 5 (one
Euro 4 vehicle) compliant.
FIGURE 7.8 LONDON CAR CLUB FLEET EURO EMISSIONS PROFILE BY CAR CLUB
7.31 Table 7.7 shows the impact on air quality emissions of fuel choice and Euro
standards. Club 2 has a predominantly petrol or petrol-electric hybrid fleet so its
NOX emissions are low. Petrol-electric hybrids in particular have very low NOX
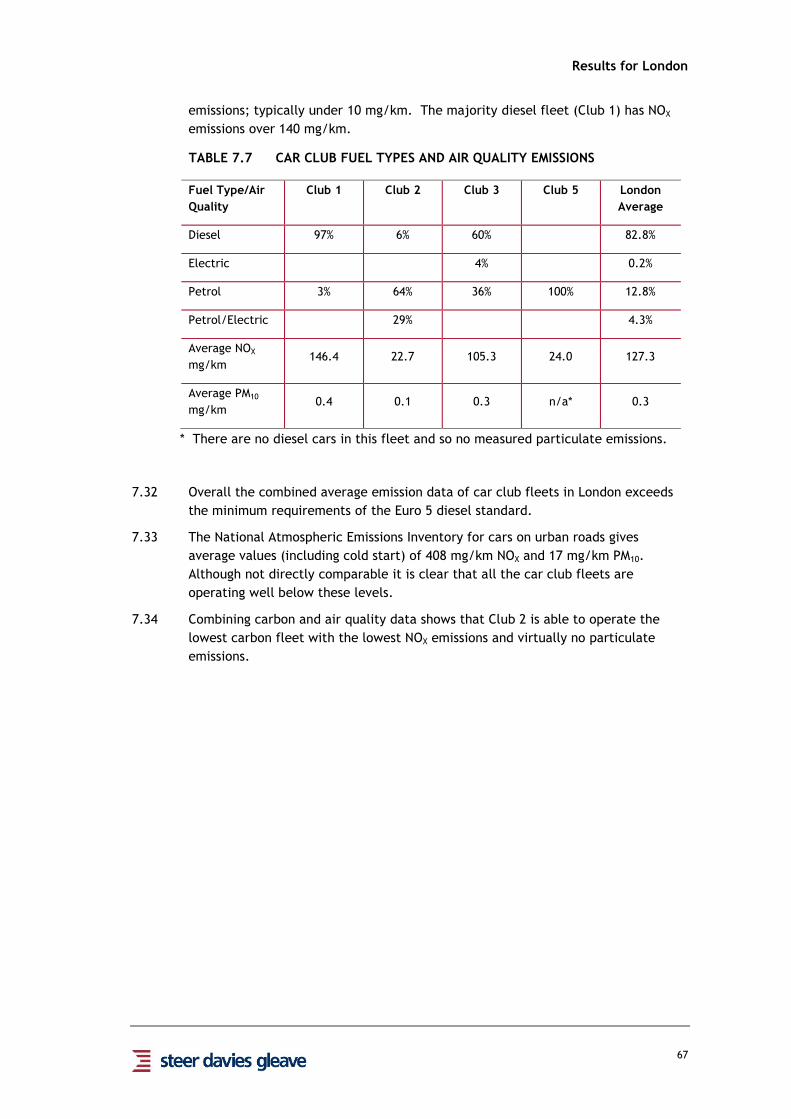
Results for London
67
emissions; typically under 10 mg/km. The majority diesel fleet (Club 1) has NOX
emissions over 140 mg/km.
TABLE 7.7 CAR CLUB FUEL TYPES AND AIR QUALITY EMISSIONS
Fuel Type/Air
Quality
Club 1 Club 2 Club 3 Club 5 London
Average
Diesel 97% 6% 60% 82.8%
Electric 4% 0.2%
Petrol 3% 64% 36% 100% 12.8%
Petrol/Electric 29% 4.3%
Average NOX
mg/km 146.4 22.7 105.3 24.0 127.3
Average PM10
mg/km 0.4 0.1 0.3 n/a* 0.3
* There are no diesel cars in this fleet and so no measured particulate emissions.
7.32 Overall the combined average emission data of car club fleets in London exceeds
the minimum requirements of the Euro 5 diesel standard.
7.33 The National Atmospheric Emissions Inventory for cars on urban roads gives
average values (including cold start) of 408 mg/km NOX and 17 mg/km PM10.
Although not directly comparable it is clear that all the car club fleets are
operating well below these levels.
7.34 Combining carbon and air quality data shows that Club 2 is able to operate the
lowest carbon fleet with the lowest NOX emissions and virtually no particulate
emissions.

Results for London
68
Air Quality - Vans
7.35 All the car club vans available in London met the current Euro 5 air quality
emission standard (up from 68.8% Euro 5 in 2011). The table below shows the
maximum permitted emissions for a Class III (over 1760 kg) diesel van.
TABLE 7.8 MAXIMUM PERMITTED EMISSIONS FOR VANS BY EURO STANDARD
Standard Implementation CO HC+ NOX NOX PM10 PN
Euro 4 January 2006 740 460 390 60
Euro 5a September 2010 740 350 280 5
Euro 5b September 2011 740 350 280 5 6.0 x 10¹¹
Euro 6 September 2015 740 215 125 5 6.0 x 10¹¹
CO = Carbon monoxide (mg/km). HC = Hydrocarbons (mg/km). NOX = Nitrogen Oxides
(mg/km). PM10 = Particles under 10 microns in diameter (mg/km), PN = Particle number
(number/km).
7.36 As yet, manufacturers have not been obliged to publish van air quality emission
data (NOX and PM10) so all that is available are the maximum permitted values
relating to the relevant Euro emission standard. It is therefore not possible to
compare the air quality emissions of different makes and models.
7.37 With no published vehicle specific data no further analysis of van emissions can be
carried out. Therefore it is only possible to comment that the current fleet of
vans available to club members in London meets the highest commercially
available standard for air quality emissions.

Results for London
69
8 Summary of the results
8.1 This section provides a discussion of the results for each of the surveys and some
analysis of the implications of the findings for car clubs in Great Britain.
Members and Joiners Survey
8.2 Ratings of customer service by members remain high, with 88% of members and
89% of joiners rating their car club’s service as “Good” or “Very Good”. The
member result represents a 4% point increase on 2011/12, though customer service
ratings have been consistently high for both members and joiners since the surveys
began in 2007. Joiners are satisfied with the process of joining a car club: 89% of
joiners found the information they received from their car club operator both
before and during early booking to be either ‘Good’ or ‘Very Good’.
Car ownership and use
8.3 Car clubs are primarily used by people who do not own a car with 81% of members
and 69% of joiners stating that they did do not have a private car in their
household. 32% of members and 23% of joiners reduced the number of cars owned
by their household since joining a car club. Of members who sold or disposed of a
car, 42% report that joining the car club was the main reason or a major factor,
whilst 35% report that it had no effect. Overall then, for the majority of car club
joiners, car club membership is an addition to their mobility options and, once
they have joined, they are more likely to reduce the number of cars they own.
8.4 The survey provides an indication that car club membership also helps to defer car
purchase with 29% of members stating that they would have bought a car if they
had not joined a car club and 66% reporting that, as a result of joining a car club,
they are less likely to purchase a private car within the next few years.
8.5 The majority of car club members in London belong to low mileage households
with 67% reporting that their household drives 3,000 miles or less per year.
Overall, the average annual mileage for car club members using household cars is
2,859 miles, significantly lower than the national average of 8,430 annual miles. In
comparison, annual mileage travelled members by car club cars is much lower at
1,336 miles. This average was inflated by a handful of respondents who stated a
very high mileage consumption in car club cars - for most members, this figure is
likely to be much lower. The combined average annual mileage driven by car club
members in household and car club cars (4,195 miles) is 50% lower than the
National Travel Survey average.
Use of other modes
8.6 Car club members make much more use of other modes of transport than the
general population. Respondents to the survey reported frequent use of other
modes of transport including 82% who made walking trips of 20 minutes or more at
least once per week, 33% of members who cycle at least once per week and 71%
who travel by bus at least once per week. Frequency of public transport and
cycling use by car club members is higher than the general population (when
compared with the National Travel Survey and London Travel Demand Survey),

Results for London
70
with frequency of cycling notably higher at 42% of members cycling at least once a
week compared to just 15% of the national population and 13% of Londoners.
Reasons for joining
8.7 The most popular reason for joining a car club stated by members (78%) and
joiners (79%) was the ability to hire cars on a short term basis. This was followed
by the ability to make trips that they are unable to do by other modes (62% of
members and 59% of joiners)26.
8.8 31% of joiners and 30% of members had moved to a new area at the time of joining
a car club, and 13% of both members and joiners had changed jobs or retired. This
appears to suggest that car clubs may be most appropriately marketed to potential
members at “points of churn”. These are times in life when a change in personal
circumstances may require review of personal travel options, most likely in
conjunction with reviewing other lifestyle choices. However, no analysis was
undertaken to compare frequency of these life events amongst the general
population.
Peer-to-Peer Member Survey
8.9 Members of peer-to-peer clubs were satisfied with their car club’s service but not
to the same extent as members of back-to-base car clubs: 75% of Whipcar
members rated service as “Good” or “Very Good” compared to 88% of members of
back-to-base car clubs in London.
8.10 69% of Whipcar members did not own a car, the same figure as London joiners but
lower than London members (81%) of back-to-base car clubs. It appears that
membership of Whipcar had little impact on the decision to sell or dispose of a
car. The majority (35) of the 54 respondents who reported that they had sold or
disposed of a car stated that their membership had no effect on their decision.
13% of Whipcar members would have bought a car if they had not joined a car
club: less than half as many as back-to-base car club members in London (29%).
8.11 There was some indication that peer-to-peer car club membership may influence
car ownership as 47% of Whipcar members stated that, as a result of joining a car
club, they are less likely to purchase a private car within the next few years. This
is lower than for back-to-base car club members in London, 66% of whom stated
they are less likely to purchase a car in future.
8.12 Similar to back-to-base car club members, the majority of Whipcar members
belong to low mileage households; 93% report that their household drives 3,000
miles or less per year. The average annual mileage for Whipcar members using
household cars is 665 miles – substantially lower than the average for back-to-base
car club members in London (2,859 miles). The average annual mileage for
Whipcar members using Whipcar cars is 333 miles. Again, this is substantially lower
than the average for back-to-base car club members in London (1,336 miles). The
combined average annual mileage for Whipcar members using household and car
club cars (998 miles) is 88% lower than the National Travel Survey average.
26 Figures sum to greater than 100% because respondents were able to pick more than one answer

Results for London
71
8.13 Most (68%) stated that their household annual mileage had not changed since
joining Whipcar. No respondents stated that their annual mileage has decreased
whilst 29% stated that it had increased. It is possible that peer-to-peer car clubs
increase car mileage consumption by making car travel available to people who
previously did not travel by car, though, as noted above, users are generally low
mileage consumers.
8.14 Similarly to back-to-base car club members, Whipcar members report making
frequent use of other modes of transport including 70% who complete walking trips
of 20 minutes or more at least once per week, 63% who travel by bus at least once
per week and 33% who cycle at least once per week.
Corporate Member Survey
8.15 The corporate member survey shows a high level of satisfaction with using a car
club for business travel; 91% of business users rate their car club’s service as
“Good” or “Very Good”. Corporate car club membership appears to benefit
employees who need access to a car on an occasional basis, rather than for regular
(e.g. daily) trips with 30% of business users stating that they use a club car at least
once a month and 21% once a week. Most of this travel is made by car club cars
(94%) rather than vans (6%).
8.16 The survey found that use of car clubs for business travel is a replacement for the
use of grey fleet (employees’ own cars) for many. 46% of respondents stated that
they used their own car for business travel before joining the car club but just 7%
stated that they travelled this way after joining. A reduction in the use of public
transport was also observed after joining a car club (from 20% of respondents
choosing this option before to 15% after). However, it is also likely that public
transport use increased amongst the 16% of respondents who stated that they
travel to work by car less often since joining the car club - many of these journeys
are likely to be public transport journeys. Corporate car club membership can
facilitate the use of public transport for the commute to work by removing the
need for an employee to bring his/her car to work in order to use it during the
working day.
8.17 Although most respondents were either unaware of any changes to their
employer’s travel policies since joining the car club or stated that there had been
none, 16% stated that employees were now actively discouraged from using their
own cars and 14% stated that pool cars had been replaced by car club cars. The
following section contains further discussion of employer travel policies.
Corporate Administrator Survey
8.18 The corporate administrator survey provided information about the use of
corporate car club accounts from a sample of 159 administrators employed by
mostly smaller organisations with a majority of responses from the private sector.
The majority of respondents (82%) found the service provided by their car club
operator to be “Good” or “Very Good” and the key benefit cited was the financial
savings that car clubs bring. The survey did not establish these financial savings in
any more detail but they are likely come in various forms, including productivity

Results for London
72
gains, reduced administration of employee mileage claims and management of
pool or company cars.
8.19 Most respondents stated that a small proportion of their business mileage was
travelled in car club cars; this highlights the role of a corporate car club as a
complement to other modes, rather than a single solution to an employer’s travel
needs.
8.20 With a large proportion of small organisations responding to the survey (86% had
fewer than 10 employees), many of the questions about corporate policies on staff
travel were not particularly relevant, as small organisations are less likely to have
detailed travel policies or travel plans. Only a minority of administrators
responding to the survey stated that their organisation collected information about
staff travel habits (16%) or mileage consumption by car club cars (21%), a grey
fleet vehicle (15%) or a pool car (3%) but this may reflect the predominance of
smaller organisations responding to the survey. Only a small proportion had a
travel plan (17%) or travel policy (25%).
8.21 There was limited evidence to suggest that car club corporate membership was
linked to changes in corporate travel policies with 32% of respondents stating that
there had been a change to corporate travel policies since joining the car club.
The most common change involved organisations actively discouraging employees
from using their own cars to travel (13%). Most respondents (61%) stated their
organisation also had a pre-paid public transport ticket for use by staff, and 28%
had pool cars and 23% pool bikes. This may suggest that corporate car club
membership is used alongside other staff travel initiatives, rather than as a sole
solution.
Operator Survey
8.22 The survey of car club operators found that the majority of car club members in
Great Britain live in London (84%) which is the primary market for car clubs. Most
members (82%) have individual membership with 18% holding a corporate
membership. 61% of car club members were male and 32% were female. This
compares with a split of 54% male and 46% female amongst national licence
holders in 2012. The proportion of members who are male has reduced from 69% in
2010 to 61% in 2012, though this is still higher than nationally where 54% of licence
holders are male. A high proportion (72%) of car club members are aged 25-44,
compared to 33% of all licence holders in Great Britain, highlighting the relatively
young market for car club membership.
8.23 Compared to previous operator surveys, the average number of hires per active
member has increased since 2011, from 6.7 hires to 8.2 hires, whilst the average
duration of hire has remained stable at 6.7 hours (6.8 hours in 2011). Average
distance per hire shows a slight increase on 2011, up from 34.5 miles to 37.8 miles.
The average annual mileage per member has increased since 2011, from 237 miles
to 305 miles, though this still represents a very low vehicle mileage consumption
compared to the general population.

Results for London
73
Emissions Analysis and Profiling
8.24 The emissions analysis and profiling report showed that overall the car club fleets
in London offer members vehicles that are low carbon and meet the current (Euro
5) air quality standards. Key findings include:
I Almost all club cars are in the lowest three VED emission Bands A to C with
most club cars in Band C. In the British national car fleet most vehicles are in
Band G (151-165 g/km);
I The average carbon emissions of the car club fleets in London in 2012/13 are
31% lower than the British national average car and 15% lower than the British
car club fleet average reported in 2011/12;
I Car clubs with the most petrol and petrol-electric hybrid vehicles achieved the
lowest average published carbon emissions; and
I The car club fleet in London is almost 100% Euro 5 compliant (up from 80% in
2011).
8.25 When selecting new vehicles for use in London, there is a need to balance climate
change (low carbon, fuel efficient), public health (low toxic emissions; notably
nitrogen oxides and particulates) and whole life costs (depreciation or lease,
insurance, maintenance and repairs).
8.26 A summary table of the emissions data for the car club fleets in all 3 reporting
regions of the Carplus Annual Survey (England and Wales (excluding London),
Scotland and London) appears in Appendix B.


Results for London
Appendix A
APPENDIX
A
SURVEY QUESTIONNAIRES


Results for London
Appendix A
A1 MEMBERS AND JOINERS SURVEY
It would be great if you could take a few minutes to answer the following
questions. This information will help Carplus – the national organisation for shared
mobility - and our funding partners, Transport for London and Transport Scotland,
to gain a better understanding of how car clubs influence travel patterns, and may
help in gaining support for putting more car club cars on the street in the future.
In return for completing the survey, you will be entered into a prize draw, with
the winner receiving £100 in driving credit (you must enter your membership
number if you want to enter the prize draw). The survey closes on 14th December
2012.
Survey responses will be kept confidential to each individual’s car club operator,
Carplus and our survey partners, Steer Davies Gleave. The survey results will be
used for research purposes only, as authorised by Carplus.
For further information, contact Justine Hart, Carplus on 0113 234 9299.
Many thanks.
1. What is your car club membership number?
2. Where do you live? (list of boroughs)
3. Which year did you join the car club?
4. If response is 2012 - ask which month in 2012? Any respondents who stated that they had joined within 3 months of completing the survey were
directed to the joiners questions.
5. What is your overall satisfaction with the current service?
Very Good
Good
Average
Poor
Very Poor
6. How many cars did your household own before joining the car club?
(please include lease cars or company cars where appropriate)
0 1 2 3 4 5 or more
7. How many cars does your household own now?
(please include lease cars or company cars where appropriate)
0 1 2 3 4 5 or more
8. What was the approximate mileage driven by your household in car club vehicles in the past 12 months?

Results for London
Appendix A
Zero
1-500
501-1,000
1,001-2,000
2,001-3,000
3,001-4,000
4,001-5,000
5,001-6,000
6,001-7,000
7,001-8,000
8,001-9,000
9,001-10,000
10,001-11,000
11,001-12,000
12,001-13,000
13,001-14,000
14,001-15,000
15,001-16,000
16,001-17,000
17,001-18,000
18,001-19,000
19,001-20,000
20,001-21,000
21,001-22,000
22,001-23,000
23,001-24,000
24,001-25,000
25,000+
(Please specify)
Don't know

Results for London
Appendix A
9. For your car club use, and your household car, what was the approximate mileage travelled in the last 12 months? (Same mileage categories as above. Respondents
could enter data for up to 4 household cars)
10. If you have entered 25,000+ in any of the boxes above, please can you give an estimate of the total mileage your household has driven in the last 12 months.
FREE TEXT BOX
11. Have you sold or otherwise disposed of a car in the past 12 months?
Yes (go to 12 and 13)
No (go to 14)
12. Please tell us how many miles you drove in that car in the past 12 months, before you sold / disposed of it?
13. When you sold / disposed of your car, was the car club:
Main reason
Major factor
Minor factor
Not a factor
Don’t know
14. How has your household's annual car driver mileage changed since joining the car club?
Increased
No change
Decreased
Don’t know
15. If your household’s annual car driver mileage has changed since joining the club, please provide an estimate of the CHANGE in mileage (i.e. the amount of increase or
decrease). (Same mileage categories as above)
16. If you hadn’t joined the car club, would your household have bought a private car?
Yes
No
Don't know
17. Do you think that joining the car club has made it more or less likely that your household will buy a car (or another car) in the next few years?
More likely
Less likely
No effect

Results for London
Appendix A
Don't know
18. Did you make any trips as a car driver in the last MONTH?
Yes
No
Don't know
19. Typically, how often do you make a trip by each of these types of transport?
(please count a return journey as 2 trips)
3 or more
times per
week
1-2 times per
week
Less than
that but at
least 1 per
month
Less than
that but at
least 1 per
year
No trips
made
Don't Know
Bus
Coach
Train
Underground,
metro or
other tram
Car driver
(private car)
Car driver
(car club car)
Car
passenger
(either
private or car
club vehicle)
Taxi or
minicab
Bicycle
Walking (for
20 minutes or
more without
stopping)
20. Why did you join a car club? (Tick all that apply)
To reduce the amount I spend on travel
To hire cars on a short term basis
To reduce my car use
To be environmentally friendly

Results for London
Appendix A
I had to sell / dispose of my own car
I had problems parking my own car where I live
To make trips that I cannot make using other modes
Somebody recommended it to me
None of the above
Other
FREE TEXT BOX
21. At the time of joining the car club, had you recently experienced any of the following? (Tick all that apply)
I moved to a new area
I changed jobs / retired
I had a change in family circumstances (e.g. I had children / got divorced)
I left home for the first time (e.g. to start University)
My children left home
My children started at a new school
I had a change in financial circumstances (e.g. redundancy)
None of the above
22. What is your home postcode?
FREE TEXT BOX
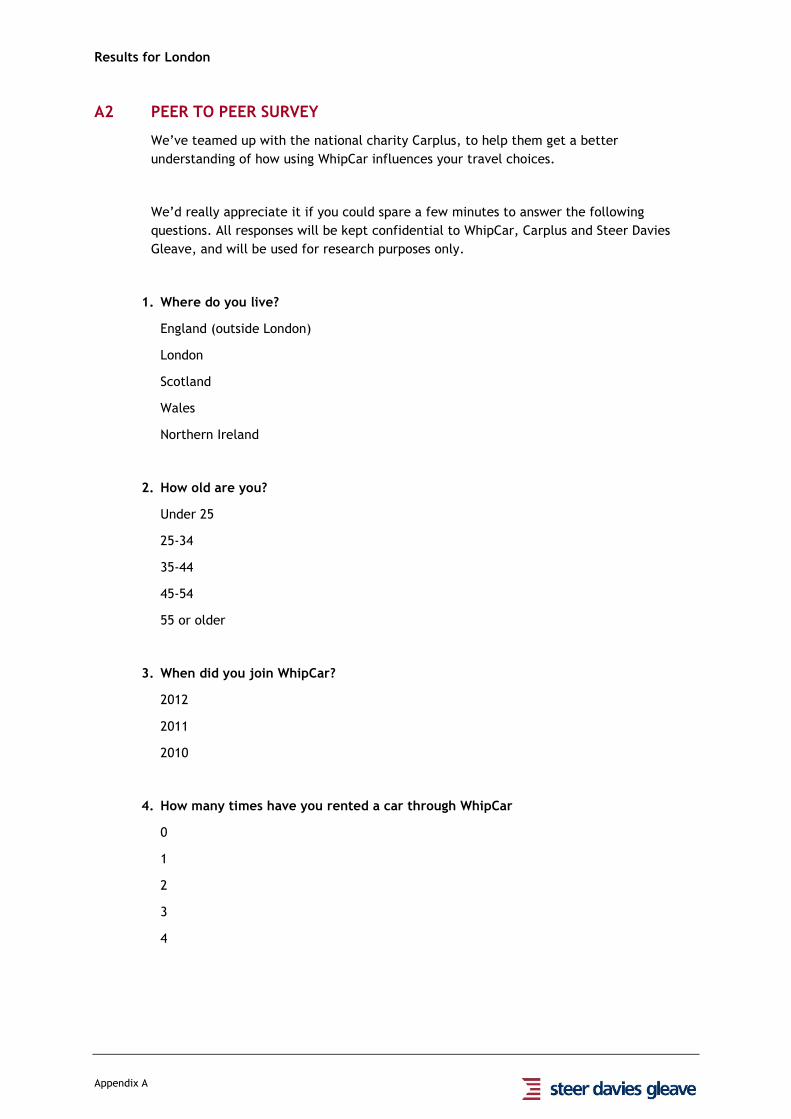
Results for London
Appendix A
A2 PEER TO PEER SURVEY
We’ve teamed up with the national charity Carplus, to help them get a better
understanding of how using WhipCar influences your travel choices.
We’d really appreciate it if you could spare a few minutes to answer the following
questions. All responses will be kept confidential to WhipCar, Carplus and Steer Davies
Gleave, and will be used for research purposes only.
1. Where do you live?
England (outside London)
London
Scotland
Wales
Northern Ireland
2. How old are you?
Under 25
25-34
35-44
45-54
55 or older
3. When did you join WhipCar?
2012
2011
2010
4. How many times have you rented a car through WhipCar
0
1
2
3
4

Results for London
Appendix A
5 or more
5. What is your overall satisfaction with the current service?
Very Good
Good
Average
Poor
Very Poor
6. How many cars did your household own before joining WhipCar?
(please include lease cars or company cars where appropriate)
0
1
2
3
4
5 or more
7. How many cars does your household own now?
(please include lease cars or company cars where appropriate)
0
1
2
3
4
5 or more
8. What was the approximate mileage driven by you or your household during WhipCar rentals during the last year?
Miles
Zero
1-100
100-250

Results for London
Appendix A
250-500
501-1,000
1,001-2,000
2,001-3,000
3,001-4,000
4,001-5,000
5,001-6,000
6,000+
9. What was your approximate total mileage driven in any car during the last year?
Miles
Zero
1-100
100-250
250-500
501-1,000
1,001-2,000
2,001-3,000
3,001-4,000
4,001-5,000
5,001-6,000
6,000+
10. If your household has sold or otherwise disposed of a car in the past year, please tell us how many miles you drove in that car in the last year, before you sold /
disposed of it?
Miles
Zero
1-100
100-250
250-500
501-1,000
1,001-2,000

Results for London
Appendix A
2,001-3,000
3,001-4,000
4,001-5,000
5,001-6,000
6,000+
11. If your household sold / disposed of a car since joining WhipCar, was WhipCar:
Main reason
Major factor
Minor factor
No effect
Don’t know
OR
Not applicable, as did not get rid of a car
12. How has your household's annual car driver mileage changed since joining WhipCar?
Increased
No change
Decreased
Don’t know
13. If you hadn’t joined WhipCar, would your household have bought a private car?
Yes
No
Don't know
14. Do you think that joining WhipCar has made it more or less likely that your household will buy a car (or another car) in the next few years?
More likely
Less likely
No effect
Don't know

Results for London
Appendix A
15. Did you make any trips as a car driver in the last MONTH?
Yes
No
Don't know
16. Typically, how often do you make a trip by each of these types of transport?
(please count a return journey as 2 trips)
3 or more
times per
week
1-2 times
per week
Less than
that but at
least 1 per
month
Less than
that but at
least 1 per
year
No trips
made
Don't Know
Bus
Coach
Train
Underground,
metro or
other tram
Car driver
(private car )
Car driver
(car club car)
Car
passenger
(either
private or car
club vehicle)
Taxi or
minicab
Bicycle
Walking (for
20 minutes or
more without
stopping)
17. Why did you choose to join Whipcar ?
To reduce the amount I spend on travel
To hire cars on a short term basis
To reduce my car use
To be environmentally friendly

Results for London
Appendix A
Instead of purchasing a car/replacing an existing car
I had problems parking my own car where I live
To make trips that I cannot make using other transport
Somebody recommended it to me
None of the above
18. At the time of joining the car club, had you recently experienced any of the following? (Tick all that apply)
I moved to a new area
I changed jobs / retired
I had a change in family circumstances (e.g. I had children / got divorced)
I left home for the first time (e.g. to start University)
My children left home
My children started at a new school
I had a change in financial circumstances (e.g. redundancy)
None of the above
19. What is your home postcode?
FREE TEXT BOX
Thank you for your time and help with this survey.

Results for London
Appendix A
A3 CORPORATE MEMBER SURVEY
Please take a few minutes to answer the following questions In return for completing the
survey, you will be entered into a prize draw, with the winner receiving a Google Nexus 7
(you must enter your membership number if you want to enter the prize draw). The survey
closes on 14th December 2012.
This information will help Carplus – the national organisation for shared mobility - and our
funding partners, Transport for London and Transport Scotland, to gain a better
understanding of how car clubs influence travel patterns, and may help in gaining support
for putting more car club cars on the street in the future.
Survey responses will be kept confidential to each individual’s car club operator, Carplus
and our survey partners, Steer Davies Gleave. The survey results will be used for research
purposes only, as authorised by Carplus.
For further information, contact Justine Hart, Carplus on 0113 234 9299.
1. In which location do you primarily use the car club service?
England (outside London)
LAs
London
Boroughs
Scotland
LAs
Wales
LAs
2. What is your overall satisfaction level with the car club you use for work-related travel? (Choose one)
Very Good
Good
Average
Poor
Very Poor
3. On average, how often do you use a car club vehicle for work-related trips? (Choose one)
Once a week or more
Once a month or more
Less than that but at least once every two months
Less than that but at least once per year

Results for London
Appendix A
4. Please tell us your usual form of transport for work-related trips before and after joining the car club?
Before joining the car club After joining the car club
Used my own car
Used a company car
Used a pool car owned by my
employer
Traditional car rental
Public transport
Walk
Cycle
Taxi
Other (please specify)
5. What type of car club vehicle do you use most often?
Car
Van
6. Has joining the car club changed your own habits in any of the following ways? (Tick all that apply)
I travel to work by car less often
I make more work-related trips
I make fewer work-related trips
I now use a car club for private (non work-related) trips
I have sold or disposed of my own car
None of the above
7. Has your organisation made any changes to its business travel arrangements or policies since joining the car club?
Yes, pool cars have been replaced by car club cars
Yes, the number of company cars has been reduced
Yes, car mileage allowance rates have been reduced
Yes, employees are actively discouraged from using their own cars

Results for London
Appendix A
No changes to travel policies
Yes, other changes to travel policies (please state)
Don’t know
To enter the prize for a chance to win a Google Nexus 7, enter your car club
membership number here (FREE TEXT BOX)

Results for London
Appendix A
A4 CORPORATE ADMINISTRATOR SURVEY
Please take a few minutes to answer the following questions. In return for completing the
survey, you will be entered into a prize draw, with the winner receiving a Google Nexus 7.
This information will help Carplus – the national organisation for shared mobility - and our
funding partners, Transport for London and Transport Scotland, to gain a better
understanding of how organisations use car clubs.
Survey responses will be kept confidential to each individual’s car club operator, Carplus
and our survey partners, Steer Davies Gleave. The survey results will be used for research
purposes only, as authorised by Carplus.
For further information, contact Justine Hart, Carplus on 0113 234 9299. The survey closes
on 14th December 2012.
Note: If your organisation has multiple sites, please answer only for the main location
where car club cars are available to employees.
1. Where is your organisation based?
England (outside London)
LAs
London
Boroughs
Scotland
LAs
Wales
LAs
2. Which sector is your organisation in?
Private sector
Public sector
Third sector
3. How many staff are employed at your organisation? (at the location where car club cars are available to employees)
Less than 10
10-30
30-70
70-100
100-500
500- 750
750- 1000
1000 – 1500
1500 – 2000
2000+

Results for London
Appendix A
4. How many employees have joined the car club at your organisation?
Less than 10
10-30
30-70
70-100
100-500
500- 750
750- 1000
1000 – 1500
1500 – 2000
2000+
5. Which car club does your organisation have corporate membership of?
FREE TEXT BOX
6. In which year did your organisation become a corporate member?
2012
2011
2010
2009
2008
2007
2006
2005
2004
2003
2002
2001
2000
7. Please indicate whether your organisation collects the following information about car mileage travelled by employees on work-related trips?
Grey fleet (employees’ own cars) mileage
Car club car mileage
Pool car (owned by your organisation) mileage
None of these
Don’t know
8. Approximately what proportion of car mileage consumed by your organisation for work-related journeys is undertaken using car club cars?
Less than 10%
11-20%
21-30%
31-40%
41-50%
51-60%
61-70%
71-80%
81-90%
91-100%

Results for London
Appendix A
9. Do you collect any data on staff travel patterns (for business journeys)?
Yes
No
Don’t know
10. If yes, would you be prepared to share this data with Carplus?
Yes
No
11. Does your organisation have a Travel Plan (sometimes known as a Transport Strategy / Green Transport Plan?)
Yes
No
Don’t know
12. Does your organisation have a travel policy for work-related travel during the working day?
Yes (go to Q13)
No (Go to Q14)
Don’t know (Go to Q14)
13. If yes,
Yes, for
any trip
Yes, but
only for
some trips
No
a. Does the travel policy prioritise travel
by public transport, walking and cycling
for work-related trips?
b. Does the travel policy require employees
to use a car club car if making work-
related car trips?
c. Are employees permitted to use their
own vehicle for work-related travel
during the working day?
d. Are employees permitted to claim a
private vehicle mileage allowance for
work-related travel?
Other

Results for London
Appendix A
14. Does your organisation provide any of the following for employees to use when making work-related trips? (please tick all that apply):
Pool cars
Company cars
Leased Cars
Salary Sacrifice Cars
Pool bikes
Pre-paid public transport ticket (e.g. Oyster card)
15. Has your organisation made any changes to its business travel arrangements or policies since joining the car club?
Yes, pool cars have been replaced by car club cars
Yes, the number of company cars has been reduced
Yes, car mileage allowance rates have been reduced
Yes, employees are actively discouraged from using their own cars
No changes to travel policies
Yes, other changes to travel policies (please state)
Don’t know
16. What is your overall satisfaction with the current service provided by your car club operator?
Very Good
Good
Average
Poor
Very Poor
17. What have been the key benefits of joining the car club for your organisation (tick all that apply)?
Financial savings
Reduced CO2 emissions
Reduced administrative burden
A reduction in the number of parking spaces required
Reduced levels of business mileage
Improved employee satisfaction
Other (please state)

Results for London
Appendix A
We would like to understand more about any cost savings to your organisation
as a result of joining the car club. If you would be prepared to share this
information with us on an anonymous basis, please provide your email address.
To enter the prize draw for the chance to win a Google Nexus 7, please enter
your car club membership number.

Results for London
Appendix A
A5 OPERATOR SURVEY
1. How many members do you have as at end November 2012?
Members Number of members
Individual
Corporate
Total
2. How many members hired a car in the previous 12 months as at end of November 2012?
Number of members
Members who hired a car in last year
3. Where do car club members live?
Member location Number of members
London
England and Wales (outside London)
Scotland
Total
4. What is the gender split of members?
Gender Number of members
Male
Female
Total
5. How many members are there in each age band, as at end of November 2012?
Age Number of members
Under 21
21 to 24
25 to 29
30 to 34
35 to 44
45 to 49

Results for London
Appendix A
50 to 54
55 to 59
60 or over
Total
6. What is the mean average distance travelled per hire (in miles)?
Distance in miles (to 2 decimal places)
Mean average distance travelled per hire
7. What is the average length of hire period (in hours)?
Time in hours (to 2 decimal places)
Average length of hire
8. What is the average number of hires per member per year (for those who have hired a
car in the last 12 months)?
Number of hires (to 2 decimal places)
Average hires per ‘active’ member
9. What is the distribution of number of hires per member per year (last year to end
November 2012)?
Hires in last 12 months Number of members
None
1 to 5
6 to 10
11 to 15
16 to 20
21 to 25
26 to 50
51 to 100
Total

Results for London
Appendix A
10. What is the distribution of mileage travelled per hire (last year to end November 2012)
Hires in last 12 months Number of hires in last year
0 to 5
6 to 10
11 to 15
16 to 20
21 to 25
26 to 50
51 to 100
100+
Total
11. How many car club vehicles do you have in each CO2 emission range (as at end of
November 2012)?
gCO2/km Number of cars Number of vans
Less than 100
101 to 110
111 to 120
121 to 130
131 to 140
141 to 150
151 to 165
166 to 175
176 to 185
186 to 200
201 to 225
226 to 255
Over 255
Total

Results for London
Appendix A
12. What are the average emissions, in gCO2/km for your car club cars and vans (as at end
November 2012)?
Average emissions Cars Vans
gCO2/km
13. How many car club vehicles do you have in each EURO standard (as at end of November 2012)?
EURO standard Cars Vans
EURO 1
EURO 2
EURO 3
EURO 4
EURO 5
Total


Results for London
Appendix B
APPENDIX
B
CAR CLUB EMISSIONS SUMMARY TABLE

Results for London
Appendix B
Region
England and
Wales
(excluding
London)
London Scotland
Summary
(All Car
Club
Fleet)
Summary (British
National Fleet*)
Car Fleet Size 471 1,654 161 2,286 28,722,453
Band A 181 573 63 817 297,576
% Band A 38% 35% 39% 36% 1%
Bands B & C 211 983 34 1,228 2,555,646
% Bands B & C 45% 59% 21% 54% 9%
Av CO2 (g/km) 108.8 110.1 113.9 110.1 160.1
Av NOX (mg/km) 75.2 127.3 47.0 111.4 No Data
Av PM10 (mg/km) 1.383 0.334 1.417 0.600 No Data
Euro 5+ 406 1,653 149 2,208 No Data
% Euro 5+ 86% 100% 93% 97% No Data
Diesel 167 1,369 31 1,567 9,392,242
% Diesel 35.5% 82.8% 19.3% 68.5% 32.7%
Petrol 253 211 115 579 19,157,876
% Petrol 53.7% 12.8% 71.4% 25.3% 66.7%
Petrol-Electric Hybrid 35 71 15 121 114,890
% PE Hybrid 7.4% 4.3% 9.3% 5.3% 0.4%
Electric 14 3 0 17 0
% Electric 3.0% 0.2% 0.0% 0.7% 0.0%
Av Age Cars (years) 1.68 1.05 2.01 1.25 7.70
Van Fleet Size 15 189 4 208 3,280,600
* Table VEH0206. Licensed cars by CO2 emission band, Great Britain, annually: 2001 to
2012, DfT, April 2013.
Table VEH0203. Cars licensed by propulsion / fuel type, Great Britain, annually: 1994 to
2012, DfT, April 2013.
Table VEH0407. Licensed light goods vehicles by years since first registration - grouped
years, annually: 1994 to 2012, DfT, April 2013.

U:\Leeds\PROJECTS\225\1\92\01\Work\05 Analysis\130610 Carplus annual survey London 2012_13 - CP comments 10-6-2013.docx
Control Sheet
CONTROL SHEET
Project/Proposal Name Carplus Annual Survey 2012/13
Document Title Results for London
Client Contract/Project No.
SDG Project/Proposal No. 22519201
ISSUE HISTORY
Issue No. Date Details
1 22 May 2013 First draft to Carplus
2 24 May 2013 Issue for operator comment
3 11 June 2013 Final report
REVIEW
Originator Ian Bewick
Other Contributors Jennie Rothera, Matthew Clark
Review by: Print Matthew Clark
Sign
DISTRIBUTION
Client: Carplus
Steer Davies Gleave:


