1 For Immediate Release Carrier Reports First Quarter 2021 Results Raises Full-Year Outlook for Sales, Adjusted EPS and Free Cash Flow • Sales of $4.7 billion, up 21% compared to 2020 including 17% organic growth • GAAP EPS of $0.43 and adjusted EPS of $0.48 • Net cash flow from operating activities of $184 million and free cash flow of $131 million • Increases full-year 2021 sales growth outlook to 7% to 10%, 5% to 8% organic* • Increases full-year 2021 adjusted EPS range to $1.95 to $2.05, and free cash flow of about $1.7 billion* PALM BEACH GARDENS, Fla., April 29, 2021 – Carrier Global Corporation (NYSE:CARR) today reported financial results for the first quarter of 2021 and updated its full year outlook. Carrier is the leading global provider of healthy, safe and sustainable building and cold chain solutions. “Carrier delivered strong first quarter results as all three segments contributed to our 21% year-over-year sales growth. We exceeded our expectations through continued strength in North American residential HVAC and improving order trends across the rest of the portfolio. I’m also pleased with the strong margin expansion and free cash flow performance in the quarter. We remain focused on executing our strategic growth initiatives and advancing on our Carrier 700 cost containment actions,” said Carrier Chairman & CEO Dave Gitlin. “We continue to lead the industry through innovation. I am especially excited about the launch of Abound, a cloud-native platform designed to give people confidence in the health and safety of their indoor spaces. We also look forward to closing on our acquisition of Guangdong Giwee Group and its subsidiaries, which will expand Carrier’s offerings in the attractive and growing variable refrigerant flow (VRF) and light commercial markets. Overall, we are encouraged by our strong start to the year, order
Transcript
1
For Immediate Release
Carrier Reports First Quarter 2021 Results
Raises Full-Year Outlook for Sales, Adjusted EPS and Free Cash Flow
• Sales of $4.7 billion, up 21% compared to 2020 including 17% organic growth
• GAAP EPS of $0.43 and adjusted EPS of $0.48
• Net cash flow from operating activities of $184 million and free cash flow of $131 million
• Increases full-year 2021 sales growth outlook to 7% to 10%, 5% to 8% organic*
• Increases full-year 2021 adjusted EPS range to $1.95 to $2.05, and free cash flow of about $1.7 billion*
PALM BEACH GARDENS, Fla., April 29, 2021 – Carrier Global Corporation (NYSE:CARR)
today reported financial results for the first quarter of 2021 and updated its full year outlook.
Carrier is the leading global provider of healthy, safe and sustainable building and cold chain
solutions.
“Carrier delivered strong first quarter results as all three segments contributed to our 21%
year-over-year sales growth. We exceeded our expectations through continued strength in North
American residential HVAC and improving order trends across the rest of the portfolio. I’m also
pleased with the strong margin expansion and free cash flow performance in the quarter. We
remain focused on executing our strategic growth initiatives and advancing on our Carrier 700
cost containment actions,” said Carrier Chairman & CEO Dave Gitlin. “We continue to lead the
industry through innovation. I am especially excited about the launch of Abound, a cloud-native
platform designed to give people confidence in the health and safety of their indoor spaces. We
also look forward to closing on our acquisition of Guangdong Giwee Group and its subsidiaries,
which will expand Carrier’s offerings in the attractive and growing variable refrigerant flow (VRF)
and light commercial markets. Overall, we are encouraged by our strong start to the year, order
trends and market outlooks, and the momentum across our Healthy Building and Cold Chain
offerings, which provide us with confidence to update our full-year expectations.”
First Quarter 2021 Results
Carrier’s first quarter sales of $4.7 billion were up 21% compared to the prior year and
organic sales were up 17% over the same period. The sales performance was largely driven by
continued strong demand in North American residential HVAC, which was up 48% compared to
the prior year, growth in transport refrigeration and commercial HVAC, and sequential
improvement across the portfolio. GAAP operating profit in the quarter of $571 million was up
82% from last year and adjusted operating profit of $608 million was up 39%. These results
benefitted from higher volume and productivity.
Net income of $384 million included the impact of restructuring, separation costs and
charges resulting from the prepayment of $500 million of debt. Adjusted net income was $427
million. GAAP EPS was $0.43 while adjusted EPS was $0.48. Net cash flows provided by
operating activities were $184 million and capital expenditures were $53 million, resulting in free
cash flow of $131 million.
Updated Full-Year 2021 Outlook*
Carrier is announcing the following updated outlook for 2021:
• Sales growth of 7% to 10%, up from 6% to 8%
o Organic sales growth of 5% to 8%, up from 4% to 6%
o Currency translation to add approximately 2%
• Adjusted operating margin of about 13.5%
• Adjusted EPS of $1.95 to $2.05, up from $1.85 to $1.95
• Free cash flow of about $1.7 billion, up from about $1.6 billion
3
*Note: When the company provides expectations for organic sales, adjusted operating profit, adjusted operating margin, incremental margins / earnings conversion, adjusted EPS and free cash flow on a forward-looking basis, a reconciliation of the differences between the non-GAAP expectations and the corresponding GAAP measures generally is not available without unreasonable effort. See “Use and Definitions of Non-GAAP Financial Measures” below for additional information.
Conference Call
Carrier will host a webcast of its earnings conference call today, Thursday, April 29, 2021,
at 9:00 a.m. ET. To access the webcast, visit the Events & Presentations section of the Carrier
Investor Relations site at ir.carrier.com/news-and-events/events-and-presentations or to listen to
the earnings call by phone, dial (877) 742-9091.
About Carrier As the leading global provider of healthy, safe and sustainable building and cold chain solutions, Carrier Global Corporation is committed to making the world safer, sustainable and more comfortable for generations to come. From the beginning, we've led in inventing new technologies and entirely new industries. Today, we continue to lead because we have a world-class, diverse workforce that puts the customer at the center of everything we do. For more information, visit www.corporate.carrier.com or follow Carrier on social media at @Carrier. Use and Definitions of Non-GAAP Financial Measures Carrier Global Corporation (“Carrier”) reports its financial results in accordance with accounting principles generally accepted in the United States ("GAAP"). We supplement the reporting of our financial information determined under GAAP with certain non-GAAP financial information. The non-GAAP information presented provides investors with additional useful information, but should not be considered in isolation or as substitutes for the related GAAP measures. Moreover, other companies may define non-GAAP measures differently, which limits the usefulness of these measures for comparisons with such other companies. We encourage investors to review our financial statements and publicly filed reports in their entirety and not to rely on any single financial measure. A reconciliation of the non-GAAP measures to the corresponding amounts prepared in accordance with GAAP appears in the tables attached to this release. The tables provide additional information as to the items and amounts that have been excluded from the adjusted measures. Organic sales, adjusted operating profit, adjusted operating margin, incremental margins / earnings conversion, earnings before interest, taxes and depreciation and amortization (“EBITDA”), adjusted EBITDA, adjusted net income, adjusted earnings per share (“EPS”), the adjusted effective tax rate, and net debt are non-GAAP financial measures. Organic sales represents consolidated net sales (a GAAP measure), excluding the impact of foreign currency translation, acquisitions and divestitures completed in the preceding twelve months and other significant items of a nonoperational nature (hereinafter referred to as “other significant items”).
Adjusted operating profit represents operating profit (a GAAP measure), excluding restructuring costs and other significant items. Adjusted operating margin represents adjusted operating profit as a percentage of net sales (a GAAP measure). Incremental margins / earnings conversion represents the year-over-year change in adjusted operating profit divided by the year-over-year change in net sales. EBITDA represents net income attributable to common shareholders (a GAAP measure), adjusted for interest income and expense, income tax expense, and depreciation and amortization. Adjusted EBITDA represents EBITDA, as calculated above, excluding non-service pension benefit, non-controlling interest in subsidiaries’ earnings from operations, restructuring costs and other significant items. Adjusted net income represents net income attributable to common shareowners (a GAAP measure), excluding restructuring costs and other significant items. Adjusted EPS represents diluted earnings per share (a GAAP measure), excluding restructuring costs and other significant items. The adjusted effective tax rate represents the effective tax rate (a GAAP measure), excluding restructuring costs and other significant items. Net debt represents long-term debt (a GAAP measure) less cash and cash equivalents. For the business segments, when applicable, adjustments of operating profit and operating margins represent operating profit, excluding restructuring and other significant items. Free cash flow is a non-GAAP financial measure that represents net cash flows provided by operating activities (a GAAP measure) less capital expenditures. Management believes free cash flow is a useful measure of liquidity and an additional basis for assessing Carrier’s ability to fund its activities, including the financing of acquisitions, debt service, repurchases of Carrier's common stock and distribution of earnings to shareowners. When we provide our expectations for organic sales, adjusted operating profit, adjusted operating margin, incremental margins / earnings conversion, adjusted EPS, and free cash flow on a forward-looking basis, a reconciliation of the differences between the non-GAAP expectations and the corresponding GAAP measures (expected net sales, operating profit, operating margin, incremental operating margin, diluted EPS and net cash flows provided by operating activities) generally is not available without unreasonable effort due to potentially high variability, complexity and low visibility as to the items that would be excluded from the GAAP measure in the relevant future period, such as unusual gains and losses, the ultimate outcome of pending litigation, fluctuations in foreign currency exchange rates, the impact and timing of potential acquisitions and divestitures, future restructuring costs, and other structural changes or their probable significance. The variability of the excluded items may have a significant, and potentially unpredictable, impact on our future GAAP results. Cautionary Statement This communication contains statements which, to the extent they are not statements of historical or present fact, constitute “forward-looking statements” under the securities laws. From time to time, oral or written forward-looking statements may also be included in other information released to the public. These forward-looking statements are intended to provide management’s current expectations or plans for our future operating and financial performance, based on assumptions currently believed to be valid. Forward-looking statements can be identified by the use of words such as “believe,” “expect,” “expectations,” “plans,” “strategy,” “prospects,” “estimate,” “project,” “target,” “anticipate,” “will,” “should,” “see,” “guidance,” “outlook,” “confident,” “scenario” and other words of similar meaning in connection with a discussion of future operating or financial performance or the separation and distribution from United Technologies Corporation (the “Separation” and the “Distribution”), since renamed Raytheon Technologies Corporation. Forward-looking statements may include, among other things, statements relating to future sales, earnings, cash flow, results of operations, uses of cash, share repurchases, tax rates and other
5
measures of financial performance or potential future plans, strategies or transactions of Carrier, the estimated costs associated with the Separation, Carrier’s plans with respect to our indebtedness and other statements that are not historical facts. All forward-looking statements involve risks, uncertainties and other factors that may cause actual results to differ materially from those expressed or implied in the forward-looking statements. For those statements, we claim the protection of the safe harbor for forward-looking statements contained in the U.S. Private Securities Litigation Reform Act of 1995. Such risks, uncertainties and other factors include, without limitation: (1) the effect of economic conditions in the industries and markets in which Carrier and our businesses operate in the U.S. and globally and any changes therein, including financial market conditions, fluctuations in commodity prices, interest rates and foreign currency exchange rates, levels of end market demand in construction, the impact of weather conditions, pandemic health issues (including COVID-19 and its effects, among other things, on production and on global supply, demand and distribution as the outbreak continues and results in a prolonged period of travel, commercial and other restrictions and limitations), natural disasters and the financial condition of our customers and suppliers; (2) challenges in the development, production, delivery, support, performance and realization of the anticipated benefits of advanced technologies and new products and services; (3) future levels of indebtedness, capital spending and research and development spending; (4) future availability of credit and factors that may affect such availability, including credit market conditions and Carrier’s capital structure and credit ratings; (5) the timing and scope of future repurchases of Carrier’s common stock, including market conditions and the level of other investing activities and uses of cash; (6) delays and disruption in the delivery of materials and services from suppliers; (7) cost reduction efforts and restructuring costs and savings and other consequences thereof; (8) new business and investment opportunities; (9) risks resulting from being a smaller, less diversified company than prior to the Separation; (10) the outcome of legal proceedings, investigations and other contingencies; (11) the impact of pension plan assumptions on future cash contributions and earnings; (12) the impact of the negotiation of collective bargaining agreements and labor disputes; (13) the effect of changes in political conditions in the U.S. (including in connection with the new administration in Washington, D.C.) and other countries in which Carrier and our businesses operate, including the effect of changes in U.S. trade policies or the United Kingdom’s withdrawal from the European Union, on general market conditions, global trade policies and currency exchange rates in the near term and beyond; (14) the effect of changes (including potentially as a result of the new administration in Washington, D.C.) in tax, environmental, regulatory (including among other things import/export) and other laws and regulations in the U.S. and other countries in which we and our businesses operate; (15) the ability of Carrier to retain and hire key personnel; (16) the scope, nature, impact or timing of acquisition and divestiture activity, including among other things integration of acquired businesses into existing businesses and realization of synergies and opportunities for growth and innovation and incurrence of related costs; (17) the expected benefits of the Separation; (18) a determination by the U.S. Internal Revenue Service and other tax authorities that the Distribution or certain related transactions should be treated as taxable transactions; (19) risks associated with indebtedness, including that incurred as a result of financing transactions undertaken in connection with the Separation, as well as our ability to reduce indebtedness and the timing thereof; (20) the risk that dis-synergy costs, costs of restructuring transactions and other costs incurred in connection with the separation will exceed Carrier’s estimates; and (21) the impact of the Separation on Carrier’s business and Carrier’s resources, systems, procedures and controls, diversion of management’s attention and the impact on relationships with customers, suppliers, employees and other business counterparties. The above list of factors is not exhaustive or necessarily in order of importance. For additional information on identifying factors that may cause actual results to vary materially from those
6
stated in forward-looking statements, see Carrier’s reports on Forms 10-K, 10-Q and 8-K filed with or furnished to the SEC from time to time. Any forward-looking statement speaks only as of the date on which it is made, and Carrier assumes no obligation to update or revise such statement, whether as a result of new information, future events or otherwise, except as required by applicable law. Contact: Media Inquiries
Danielle Canzanella 561-365-1101 [email protected] Investor Relations Sam Pearlstein
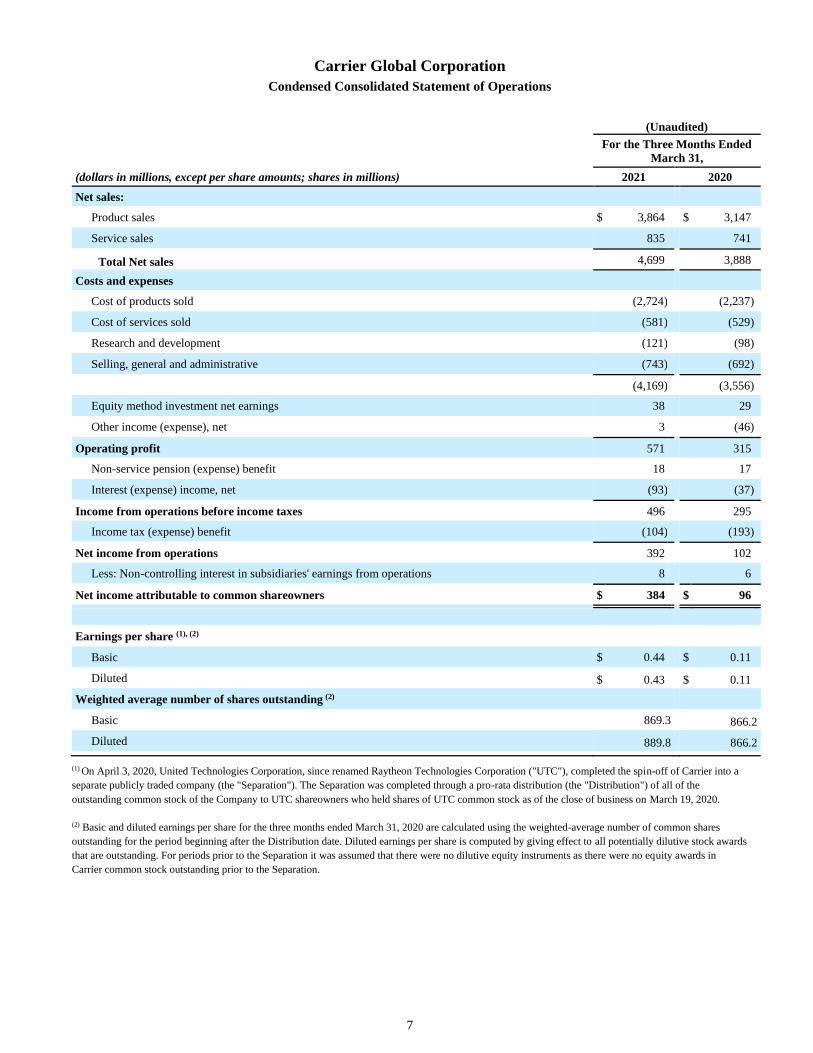
(dollars in millions, except per share amounts; shares in millions) 2021 2020
Net sales:
Product sales $ 3,864 $ 3,147
Service sales 835 741
Total Net sales 4,699 3,888
Costs and expenses
Cost of products sold (2,724) (2,237)
Cost of services sold (581) (529)
Research and development (121) (98)
Selling, general and administrative (743) (692)
(4,169) (3,556)
Equity method investment net earnings 38 29
Other income (expense), net 3 (46)
Operating profit 571 315
Non-service pension (expense) benefit 18 17
Interest (expense) income, net (93) (37)
Income from operations before income taxes 496 295
Income tax (expense) benefit (104) (193)
Net income from operations 392 102
Less: Non-controlling interest in subsidiaries' earnings from operations 8 6
Net income attributable to common shareowners $ 384 $ 96
Earnings per share (1), (2)
Basic $ 0.44 $ 0.11
Diluted $ 0.43 $ 0.11
Weighted average number of shares outstanding (2)
Basic 869.3 866.2
Diluted 889.8 866.2
(1) On April 3, 2020, United Technologies Corporation, since renamed Raytheon Technologies Corporation ("UTC"), completed the spin-off of Carrier into a
separate publicly traded company (the "Separation"). The Separation was completed through a pro-rata distribution (the "Distribution") of all of the
outstanding common stock of the Company to UTC shareowners who held shares of UTC common stock as of the close of business on March 19, 2020.
(2) Basic and diluted earnings per share for the three months ended March 31, 2020 are calculated using the weighted-average number of common shares
outstanding for the period beginning after the Distribution date. Diluted earnings per share is computed by giving effect to all potentially dilutive stock awards
that are outstanding. For periods prior to the Separation it was assumed that there were no dilutive equity instruments as there were no equity awards in
Carrier common stock outstanding prior to the Separation.
8
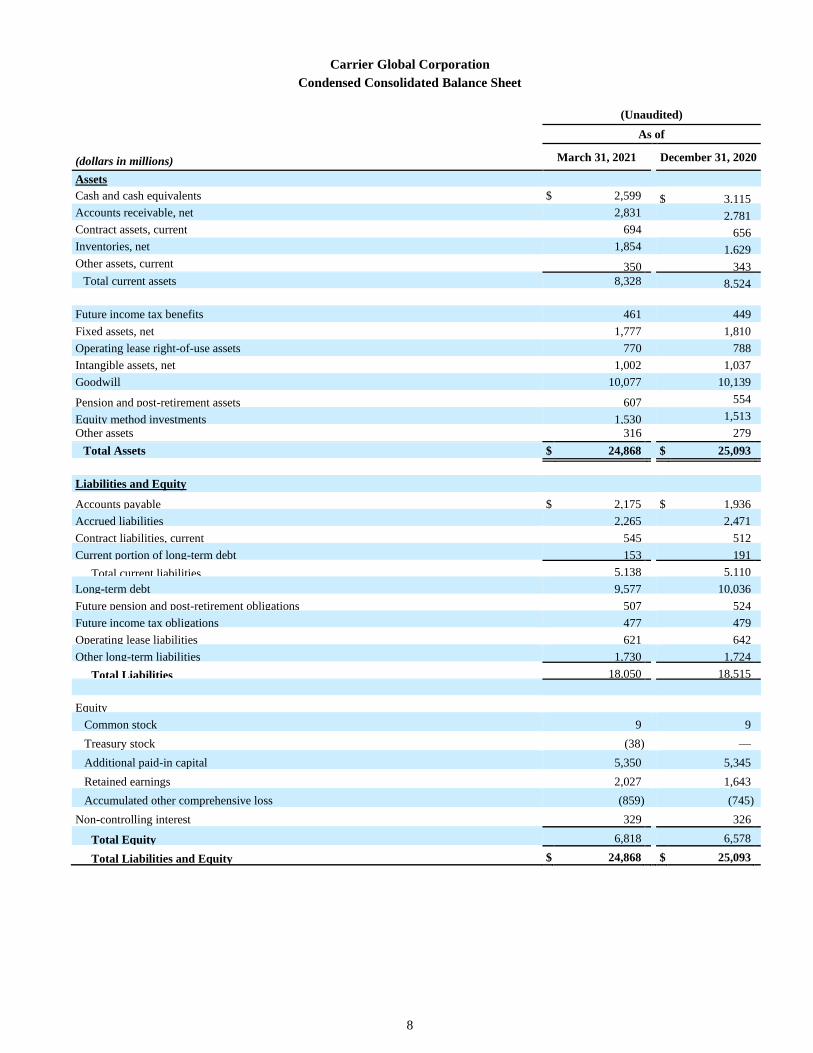
Carrier Global Corporation
Condensed Consolidated Balance Sheet
(Unaudited)
As of
(dollars in millions) March 31, 2021 December 31, 2020
Assets
Cash and cash equivalents $ 2,599 $ 3,115
Accounts receivable, net 2,831 2,781
Contract assets, current 694 656
Inventories, net 1,854 1,629
Other assets, current 350 343
Total current assets 8,328 8,524
Future income tax benefits 461 449
Fixed assets, net 1,777 1,810
Operating lease right-of-use assets 770 788
Intangible assets, net 1,002 1,037
Goodwill 10,077 10,139
Pension and post-retirement assets 607 554
Equity method investments 1,530 1,513
Other assets 316 279
Total Assets $ 24,868 $ 25,093
Liabilities and Equity
Accounts payable $ 2,175 $ 1,936
Accrued liabilities 2,265 2,471
Contract liabilities, current 545 512
Current portion of long-term debt 153 191
Total current liabilities 5,138 5,110
Long-term debt 9,577 10,036
Future pension and post-retirement obligations 507 524
Future income tax obligations 477 479
Operating lease liabilities 621 642
Other long-term liabilities 1,730 1,724
Total Liabilities 18,050 18,515
Equity
Common stock 9 9
Treasury stock (38) —
Additional paid-in capital 5,350 5,345
Retained earnings 2,027 1,643
Accumulated other comprehensive loss (859) (745)
Non-controlling interest 329 326
Total Equity 6,818 6,578
Total Liabilities and Equity $ 24,868 $ 25,093
9
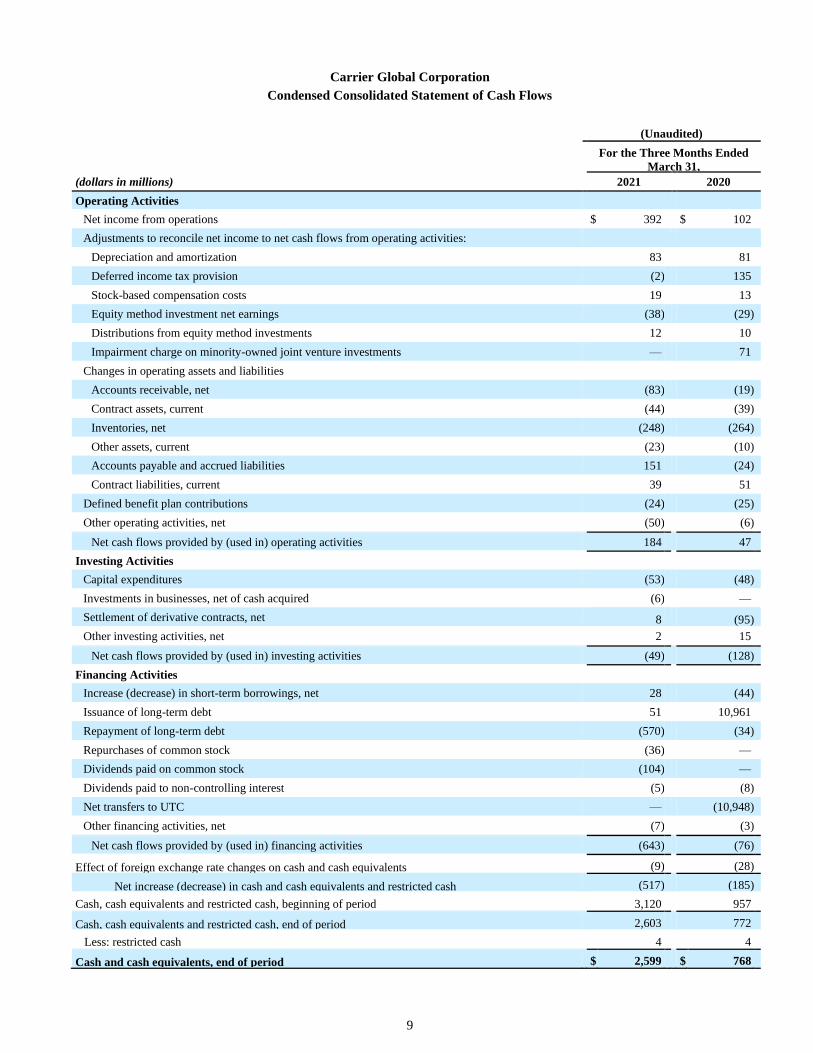
Carrier Global Corporation
Condensed Consolidated Statement of Cash Flows
(Unaudited)
For the Three Months Ended
March 31,
(dollars in millions) 2021 2020
Operating Activities
Net income from operations $ 392 $ 102
Adjustments to reconcile net income to net cash flows from operating activities:
Depreciation and amortization 83 81
Deferred income tax provision (2) 135
Stock-based compensation costs 19 13
Equity method investment net earnings (38) (29)
Distributions from equity method investments 12 10
Impairment charge on minority-owned joint venture investments — 71
Changes in operating assets and liabilities
Accounts receivable, net (83) (19)
Contract assets, current (44) (39)
Inventories, net (248) (264)
Other assets, current (23) (10)
Accounts payable and accrued liabilities 151 (24)
Contract liabilities, current 39 51
Defined benefit plan contributions (24) (25)
Other operating activities, net (50) (6)
Net cash flows provided by (used in) operating activities 184 47
Investing Activities
Capital expenditures (53) (48)
Investments in businesses, net of cash acquired (6) —
Settlement of derivative contracts, net 8 (95)
Other investing activities, net 2 15
Net cash flows provided by (used in) investing activities (49) (128)
Financing Activities
Increase (decrease) in short-term borrowings, net 28 (44)
Issuance of long-term debt 51 10,961
Repayment of long-term debt (570) (34)
Repurchases of common stock (36) —
Dividends paid on common stock (104) —
Dividends paid to non-controlling interest (5) (8)
Net transfers to UTC — (10,948)
Other financing activities, net (7) (3)
Net cash flows provided by (used in) financing activities (643) (76)
Effect of foreign exchange rate changes on cash and cash equivalents (9) (28)
Net increase (decrease) in cash and cash equivalents and restricted cash (517) (185)
Cash, cash equivalents and restricted cash, beginning of period 3,120 957
Cash, cash equivalents and restricted cash, end of period 2,603 772
Less: restricted cash 4 4
Cash and cash equivalents, end of period $ 2,599 $ 768
10
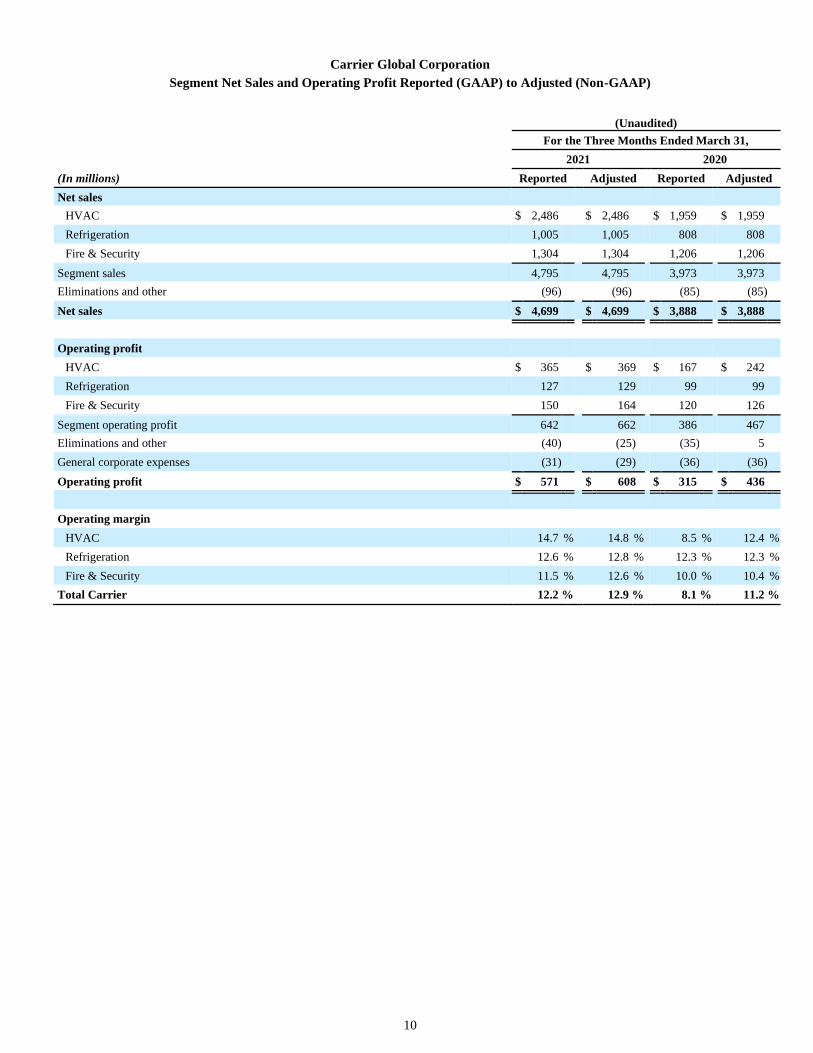
Carrier Global Corporation
Segment Net Sales and Operating Profit Reported (GAAP) to Adjusted (Non-GAAP)
(Unaudited)
For the Three Months Ended March 31,
2021 2020
(In millions) Reported Adjusted Reported Adjusted
Net sales
HVAC $ 2,486 $ 2,486 $ 1,959 $ 1,959
Refrigeration 1,005 1,005 808 808
Fire & Security 1,304 1,304 1,206 1,206
Segment sales 4,795 4,795 3,973 3,973
Eliminations and other (96) (96) (85) (85)
Net sales $ 4,699 $ 4,699 $ 3,888 $ 3,888
Operating profit
HVAC $ 365 $ 369 $ 167 $ 242
Refrigeration 127 129 99 99
Fire & Security 150 164 120 126
Segment operating profit 642 662 386 467
Eliminations and other (40) (25) (35) 5
General corporate expenses (31) (29) (36) (36)
Operating profit $ 571 $ 608 $ 315 $ 436
Operating margin
HVAC 14.7 % 14.8 % 8.5 % 12.4 %
Refrigeration 12.6 % 12.8 % 12.3 % 12.3 %
Fire & Security 11.5 % 12.6 % 10.0 % 10.4 %
Total Carrier 12.2 % 12.9 % 8.1 % 11.2 %
11
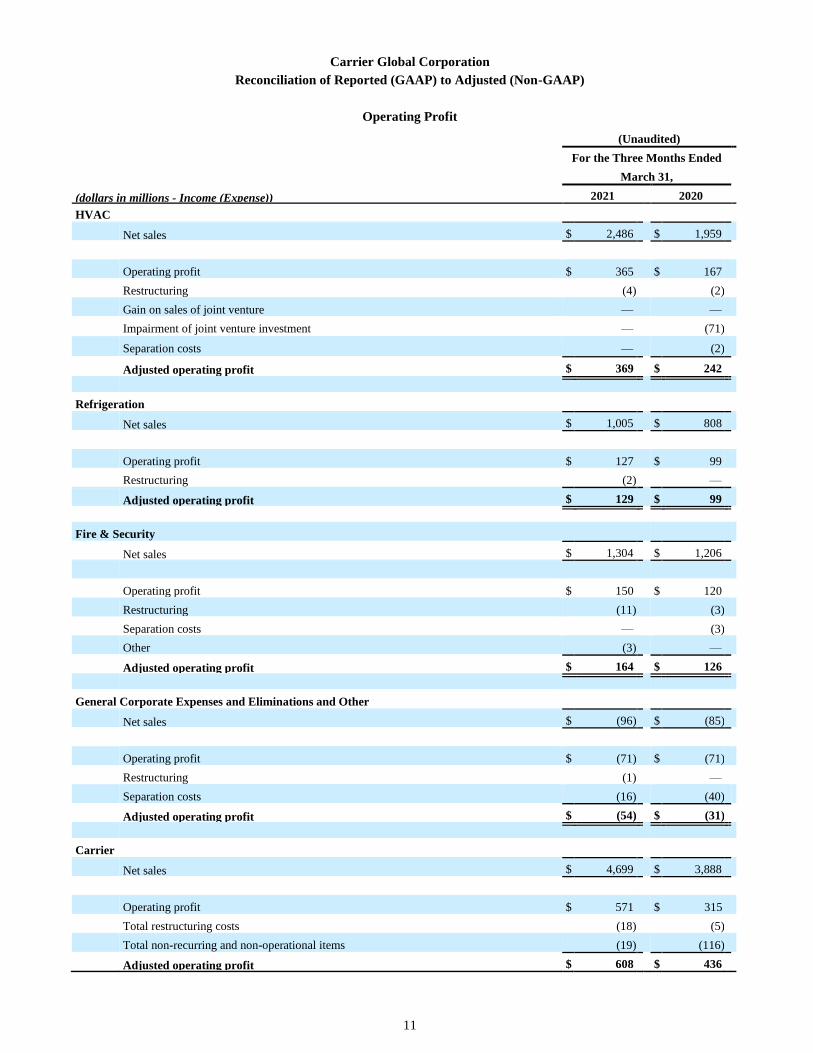
Carrier Global Corporation
Reconciliation of Reported (GAAP) to Adjusted (Non-GAAP)
Operating Profit
(Unaudited)
For the Three Months Ended
March 31,
(dollars in millions - Income (Expense)) 2021 2020
HVAC
Net sales $ 2,486 $ 1,959
Operating profit $ 365 $ 167
Restructuring (4) (2)
Gain on sales of joint venture — —
Impairment of joint venture investment — (71)
Separation costs — (2)
Adjusted operating profit $ 369 $ 242
Refrigeration
Net sales $ 1,005 $ 808
Operating profit $ 127 $ 99
Restructuring (2) —
Adjusted operating profit $ 129 $ 99
Fire & Security
Net sales $ 1,304 $ 1,206
Operating profit $ 150 $ 120
Restructuring (11) (3)
Separation costs — (3)
Other (3) —
Adjusted operating profit $ 164 $ 126
General Corporate Expenses and Eliminations and Other
Net sales $ (96) $ (85)
Operating profit $ (71) $ (71)
Restructuring (1) —
Separation costs (16) (40)
Adjusted operating profit $ (54) $ (31)
Carrier
Net sales $ 4,699 $ 3,888
Operating profit $ 571 $ 315
Total restructuring costs (18) (5)
Total non-recurring and non-operational items (19) (116)
Adjusted operating profit $ 608 $ 436
12
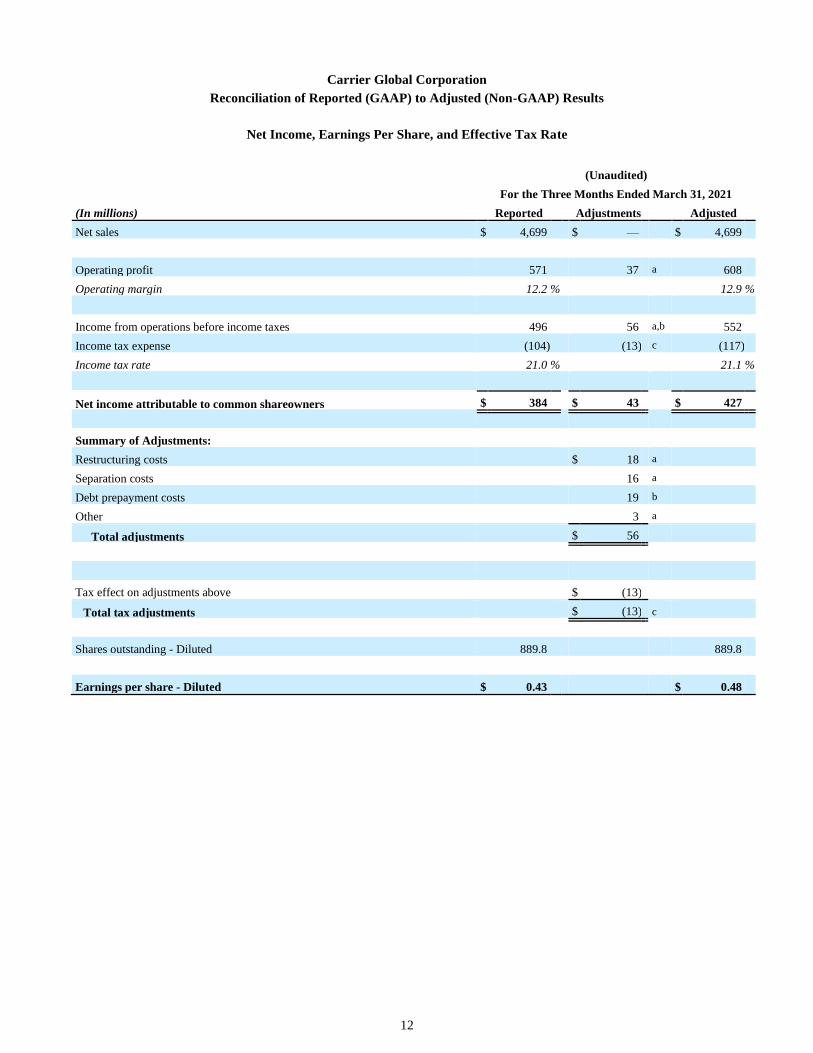
Carrier Global Corporation
Reconciliation of Reported (GAAP) to Adjusted (Non-GAAP) Results
Net Income, Earnings Per Share, and Effective Tax Rate
(Unaudited)
For the Three Months Ended March 31, 2021
(In millions) Reported Adjustments Adjusted
Net sales $ 4,699 $ — $ 4,699
Operating profit 571 37 a 608
Operating margin 12.2 % 12.9 %
Income from operations before income taxes 496 56 a,b 552
Income tax expense (104) (13) c (117)
Income tax rate 21.0 % 21.1 %
Net income attributable to common shareowners $ 384 $ 43 $ 427
Summary of Adjustments:
Restructuring costs $ 18 a
Separation costs 16 a
Debt prepayment costs 19 b
Other 3 a
Total adjustments $ 56
Tax effect on adjustments above $ (13)
Total tax adjustments $ (13) c
Shares outstanding - Diluted 889.8 889.8
Earnings per share - Diluted $ 0.43 $ 0.48
13
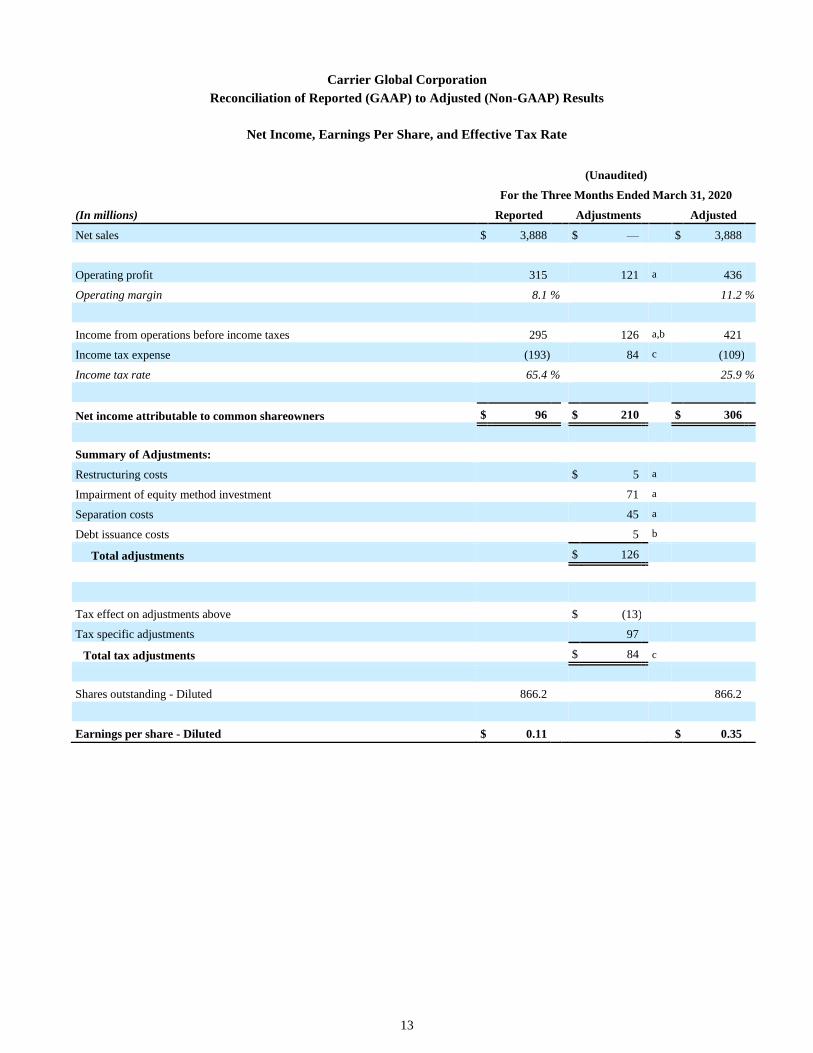
Carrier Global Corporation
Reconciliation of Reported (GAAP) to Adjusted (Non-GAAP) Results
Net Income, Earnings Per Share, and Effective Tax Rate
(Unaudited)
For the Three Months Ended March 31, 2020
(In millions) Reported Adjustments Adjusted
Net sales $ 3,888 $ — $ 3,888
Operating profit 315 121 a 436
Operating margin 8.1 % 11.2 %
Income from operations before income taxes 295 126 a,b 421
Income tax expense (193) 84 c (109)
Income tax rate 65.4 % 25.9 %
Net income attributable to common shareowners $ 96 $ 210 $ 306
Summary of Adjustments:
Restructuring costs $ 5 a
Impairment of equity method investment 71 a
Separation costs 45 a
Debt issuance costs 5 b
Total adjustments $ 126
Tax effect on adjustments above $ (13)
Tax specific adjustments 97
Total tax adjustments $ 84 c
Shares outstanding - Diluted 866.2 866.2
Earnings per share - Diluted $ 0.11 $ 0.35
14
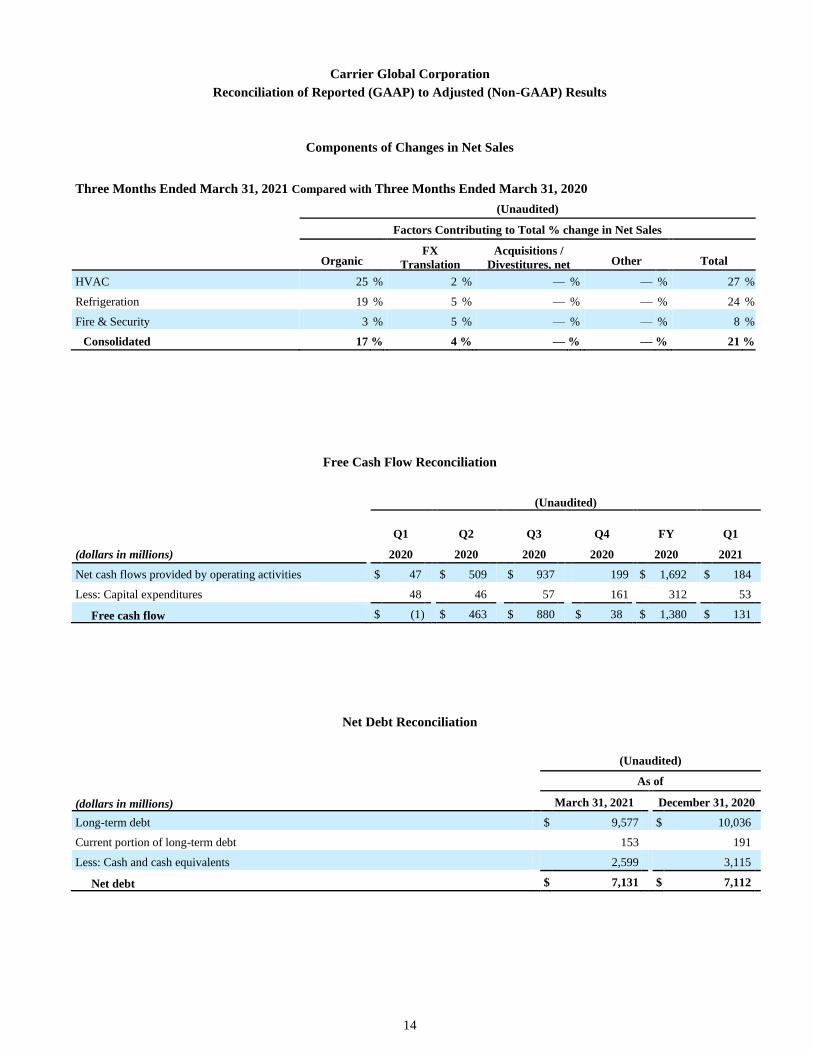
Carrier Global Corporation
Reconciliation of Reported (GAAP) to Adjusted (Non-GAAP) Results
Components of Changes in Net Sales
Three Months Ended March 31, 2021 Compared with Three Months Ended March 31, 2020
(Unaudited)
Factors Contributing to Total % change in Net Sales
Organic FX
Translation Acquisitions /
Divestitures, net Other Total
HVAC 25 % 2 % — % — % 27 %
Refrigeration 19 % 5 % — % — % 24 %
Fire & Security 3 % 5 % — % — % 8 %
Consolidated 17 % 4 % — % — % 21 %
Free Cash Flow Reconciliation
(Unaudited)
Q1 Q2 Q3 Q4 FY Q1
(dollars in millions) 2020 2020 2020 2020 2020 2021
Net cash flows provided by operating activities $ 47 $ 509 $ 937 199 $ 1,692 $ 184