Page 1
Carstairs Scores for Scottish PostcodeSectors from the 1991 Census
Pu
blic
He
alth
Re
sea
rch
Un
it Philip McLoone
Public Health Research Unit
First Published May 1994Republished Nov 2000
Public Health Research Unit,University of Glasgow,4 Lilybank Gardens,Glasgow, G 12 8RZ.Tel: 0141 357 3949http://www.msoc-mrc.gla.ac.uk/
Page 2
Carstairs Scores for Scottish Postcode Sectors from the 1991 Census
Philip McLoone
Public Health Research Unit,University of Glasgow
First Published May 1994Republished Nov 2000
The tables in this report are based on data provided by the Census Branch of the GeneralRegister Office for Scotland, the Vital Statistics Branch of the General Register Office forScotland and the Information and Statistics Division of the NHS Common Services Agency.Census data were provided as part of the ESRC purchase of data from the 1991 Census.The Public Health Research Unit acknowledges their Assistance in the provision and analy-sis of the data.
We wish to thank Vera Carstairs for her helpful comments on an earlier draft of this report.
This version of the report has been made available from the MRC Social & Public HealthSciences Unit, University of Glasgow WWW.MSOC-MRC.GLA.AC.UK.
About PHRUOn the 1st October 1998 the Public Health Research Unit and the MRC Medical SociologyUnit were merged to form the MRC Social & Public Health Sciences Unit.
Page 3
MRC Social and Public Health Sciences Unit
Page i - Carstairs Scores for Scottish Postcode Sectors from the 1991 Census
Public Health Research Unit, University of Glasgow
Carstairs Scores for Scottish Postcode Sectors from the 1991 Census
Table of Contents
Page
INTRODUCTION 1
The Carstairs Score 1 Variables used in Constructing the Scores 1
Creating the score 2 Defining Postcode Sectors 3
The DEPCAT variable 3
METHODOLOGICAL ISSUES 5
Problems of categorising small area populations 5
What do deprivation scores identify? 6
Robustness 7
Problems with interpreting changes between Censuses 10
An alternative formulation of the Carstairs score 11
Comparing 1991 scores with those for 1981 12
ASSOCIATIONS WITH MORTALITY & MORBIDITY 14
Mortality 14
Morbidity 16
CONCLUSION 17
REFERENCES 18
APPENDICES 19
Appendix I 20
Appendix II 21
Appendix III 68
Appendix IV 71
Appendix V 72
Page 4
Page 1 - Carstairs Scores for Scottish Postcode Sectors from the 1991 Census
Public Health Research Unit, University of Glasgow
INTRODUCTION
The Carstairs Score Carstairs scores are derived by combining variables taken from small area Census data and are described as a measure which reflects access to those material resources which provide access to "those goods and services, resources and amenities and of a physical environment which are customary in society" (Carstairs and Morris, 1991). The scores are not a measure of the extent of material well-being or relative disadvantage experienced by individuals but are rather a summary measure applied to populations contained within small geographic localities. The scores have generally been applied to the populations of postcode sectors, and are derived by manipulating selected Census variables in order to create a composite score. They are thus a method of quantifying levels of relative deprivation or affluence in different localities.
Variables used in Constructing the Scores The scores have been calculated from the combination of four variables derived from the Small Area Statistics Tables of the 1991 Census using SASPAC (SASPAC manual, 1992). As nearly as possible, the variables used were the same as those employed in the creation of scores for postcode sectors based on the 1981 Census by Carstairs and Morris and were defined as:
Overcrowding: the proportion of all persons living in private households with a density of more than one person per room. Male unemployment: the proportion of economically active males seeking or waiting to start work Low social class: the proportion of all persons in private households with an economically active head with head of household in social class 4 or 5. No car: the proportion of all persons in private households which do not own a car.
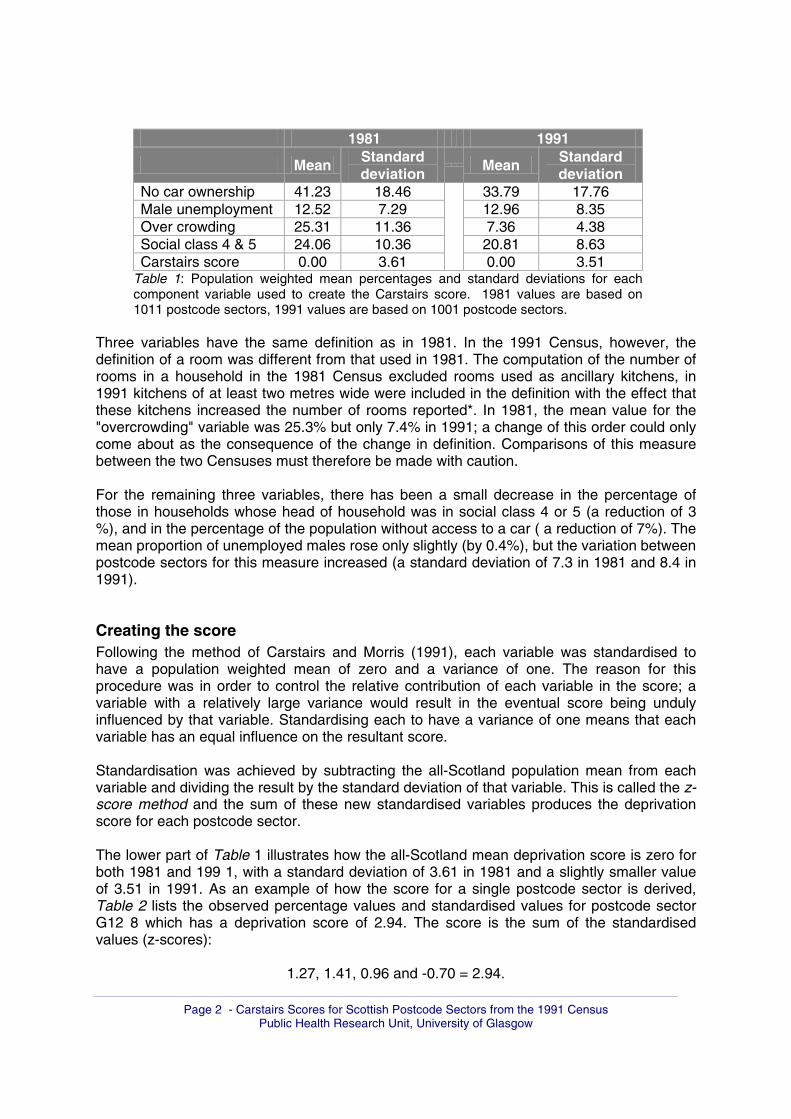
The cells of the Small Area Statistics Tables for 1991 used to create these variables are listed in Appendix I and are the equivalents of those used in creating the 1981 scores. Table 1 compares the 1981 and 1991 population weighted means and standard deviations for each variable.
Page 5
Page 2 - Carstairs Scores for Scottish Postcode Sectors from the 1991 Census
Public Health Research Unit, University of Glasgow
1981 1991
Mean Standard deviation
Mean Standard deviation
No car ownership 41.23 18.46 33.79 17.76 Male unemployment 12.52 7.29 12.96 8.35 Over crowding 25.31 11.36 7.36 4.38 Social class 4 & 5 24.06 10.36 20.81 8.63 Carstairs score 0.00 3.61 0.00 3.51
Table 1: Population weighted mean percentages and standard deviations for each component variable used to create the Carstairs score. 1981 values are based on 1011 postcode sectors, 1991 values are based on 1001 postcode sectors.
Three variables have the same definition as in 1981. In the 1991 Census, however, the definition of a room was different from that used in 1981. The computation of the number of rooms in a household in the 1981 Census excluded rooms used as ancillary kitchens, in 1991 kitchens of at least two metres wide were included in the definition with the effect that these kitchens increased the number of rooms reported*. In 1981, the mean value for the "overcrowding" variable was 25.3% but only 7.4% in 1991; a change of this order could only come about as the consequence of the change in definition. Comparisons of this measure between the two Censuses must therefore be made with caution. For the remaining three variables, there has been a small decrease in the percentage of those in households whose head of household was in social class 4 or 5 (a reduction of 3 %), and in the percentage of the population without access to a car ( a reduction of 7%). The mean proportion of unemployed males rose only slightly (by 0.4%), but the variation between postcode sectors for this measure increased (a standard deviation of 7.3 in 1981 and 8.4 in 1991).
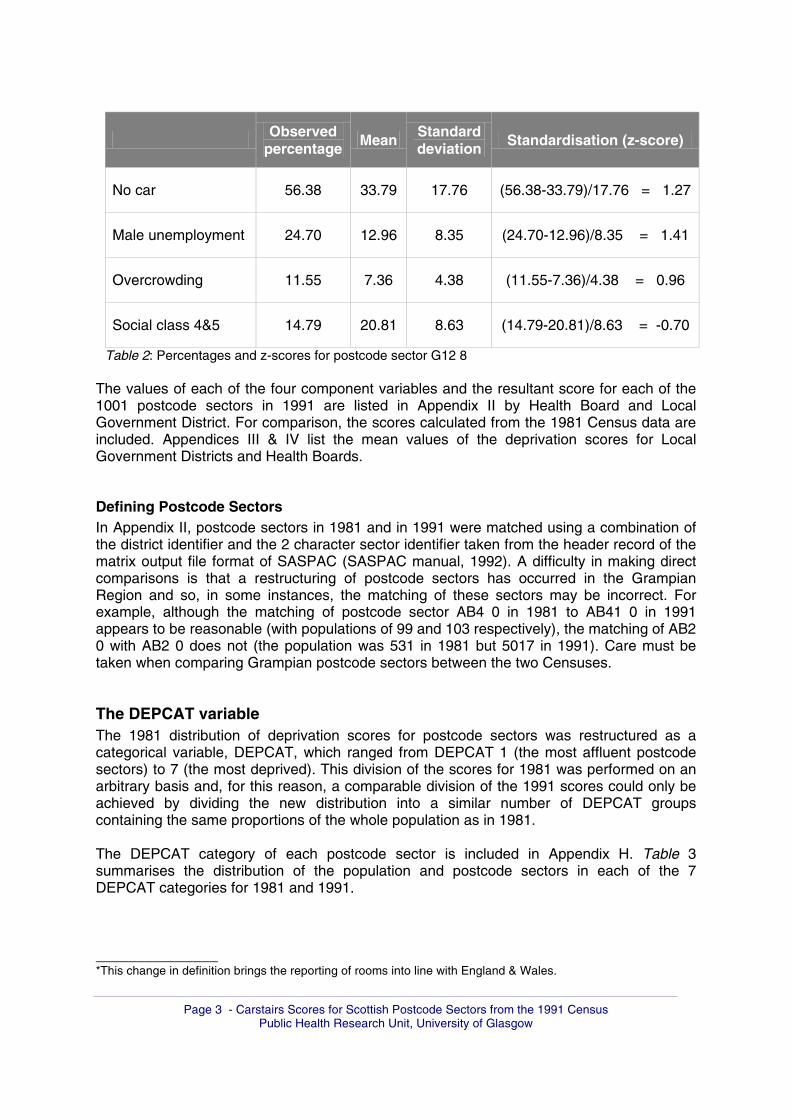
Creating the score Following the method of Carstairs and Morris (1991), each variable was standardised to have a population weighted mean of zero and a variance of one. The reason for this procedure was in order to control the relative contribution of each variable in the score; a variable with a relatively large variance would result in the eventual score being unduly influenced by that variable. Standardising each to have a variance of one means that each variable has an equal influence on the resultant score. Standardisation was achieved by subtracting the all-Scotland population mean from each variable and dividing the result by the standard deviation of that variable. This is called the z-score method and the sum of these new standardised variables produces the deprivation score for each postcode sector. The lower part of Table 1 illustrates how the all-Scotland mean deprivation score is zero for both 1981 and 199 1, with a standard deviation of 3.61 in 1981 and a slightly smaller value of 3.51 in 1991. As an example of how the score for a single postcode sector is derived, Table 2 lists the observed percentage values and standardised values for postcode sector G12 8 which has a deprivation score of 2.94. The score is the sum of the standardised values (z-scores):
1.27, 1.41, 0.96 and -0.70 = 2.94.
Page 6
Page 3 - Carstairs Scores for Scottish Postcode Sectors from the 1991 Census
Public Health Research Unit, University of Glasgow
Observed
percentage Mean Standard deviation Standardisation (z-score)
No car 56.38 33.79 17.76 (56.38-33.79)/17.76 = 1.27
Male unemployment 24.70 12.96 8.35 (24.70-12.96)/8.35 = 1.41
Overcrowding 11.55 7.36 4.38 (11.55-7.36)/4.38 = 0.96
Social class 4&5 14.79 20.81 8.63 (14.79-20.81)/8.63 = -0.70
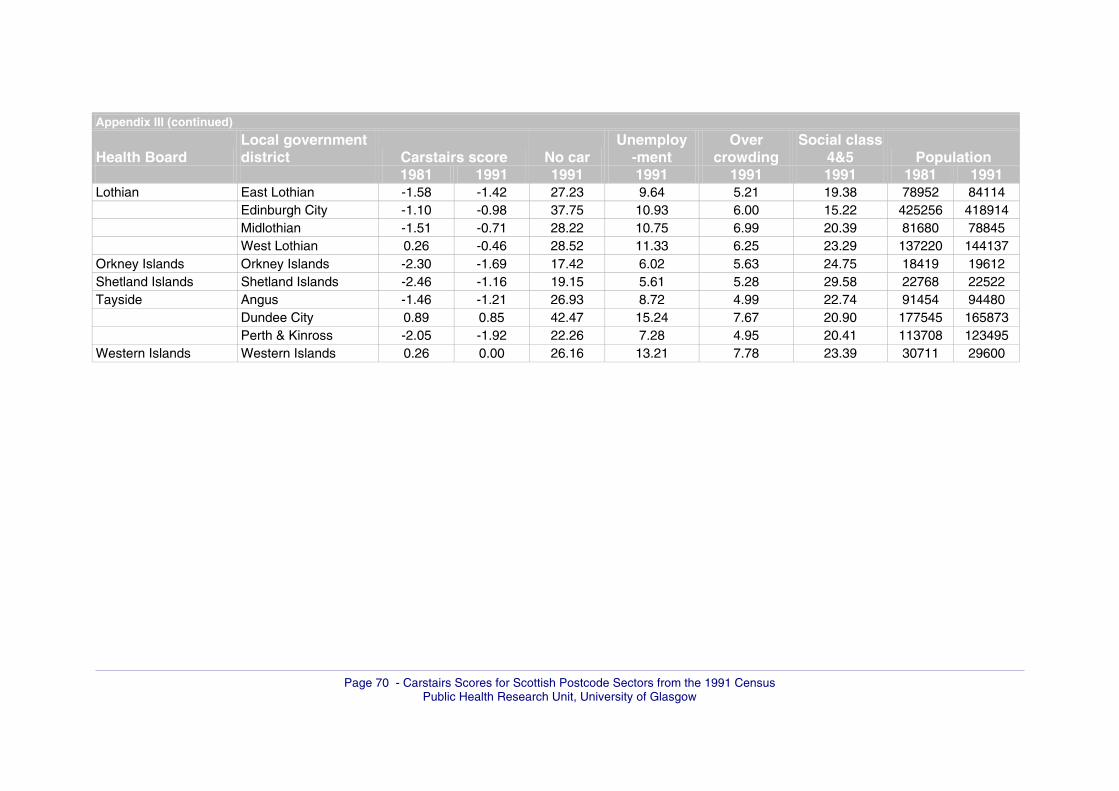
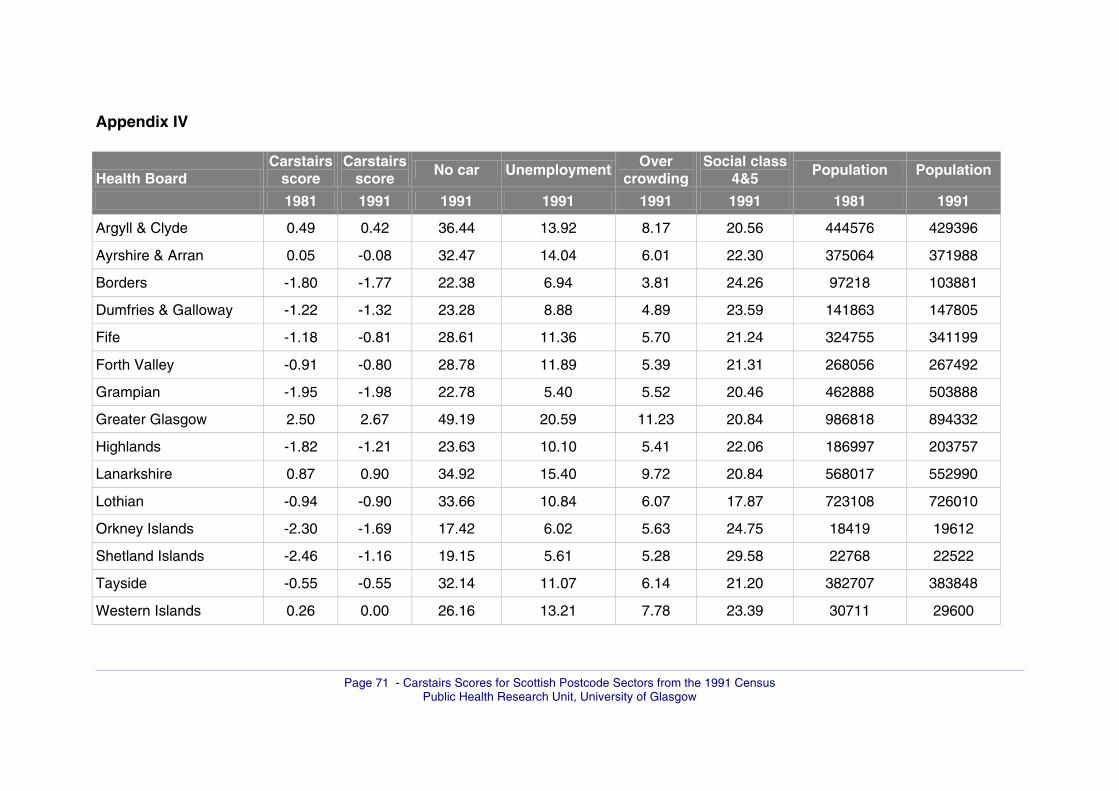
Table 2: Percentages and z-scores for postcode sector G12 8 The values of each of the four component variables and the resultant score for each of the 1001 postcode sectors in 1991 are listed in Appendix II by Health Board and Local Government District. For comparison, the scores calculated from the 1981 Census data are included. Appendices III & IV list the mean values of the deprivation scores for Local Government Districts and Health Boards.
Defining Postcode Sectors In Appendix II, postcode sectors in 1981 and in 1991 were matched using a combination of the district identifier and the 2 character sector identifier taken from the header record of the matrix output file format of SASPAC (SASPAC manual, 1992). A difficulty in making direct comparisons is that a restructuring of postcode sectors has occurred in the Grampian Region and so, in some instances, the matching of these sectors may be incorrect. For example, although the matching of postcode sector AB4 0 in 1981 to AB41 0 in 1991 appears to be reasonable (with populations of 99 and 103 respectively), the matching of AB2 0 with AB2 0 does not (the population was 531 in 1981 but 5017 in 1991). Care must be taken when comparing Grampian postcode sectors between the two Censuses.
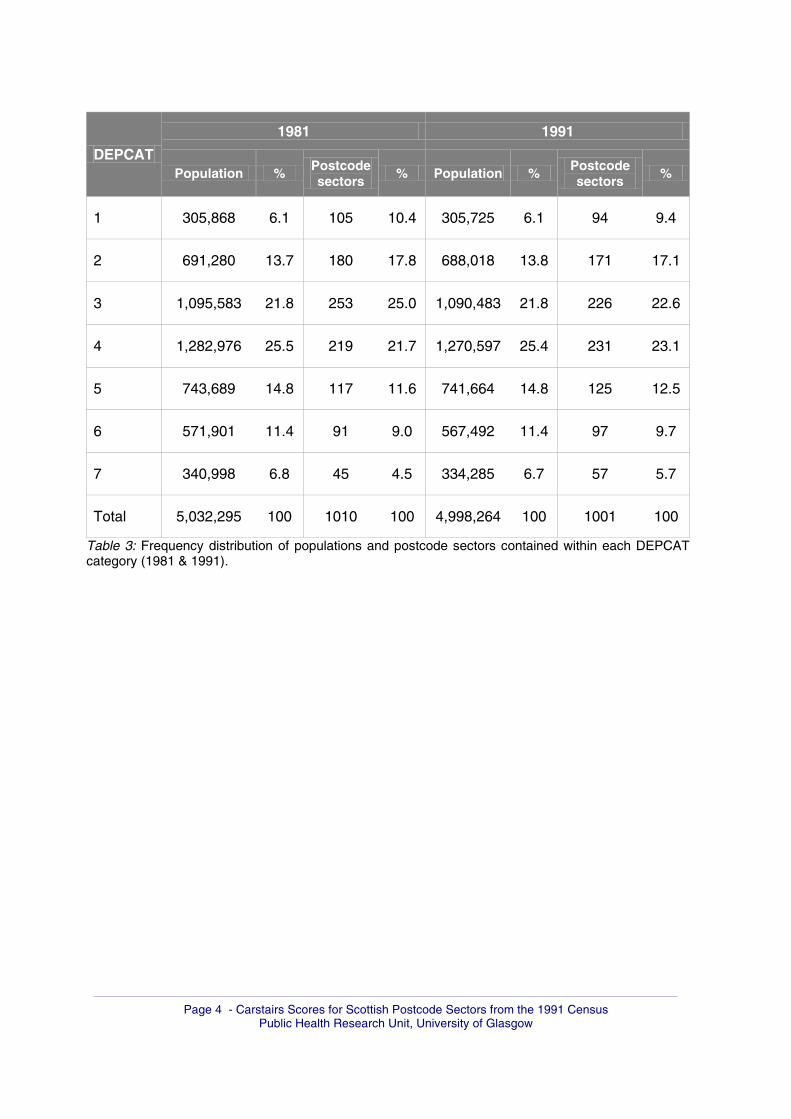
The DEPCAT variable The 1981 distribution of deprivation scores for postcode sectors was restructured as a categorical variable, DEPCAT, which ranged from DEPCAT 1 (the most affluent postcode sectors) to 7 (the most deprived). This division of the scores for 1981 was performed on an arbitrary basis and, for this reason, a comparable division of the 1991 scores could only be achieved by dividing the new distribution into a similar number of DEPCAT groups containing the same proportions of the whole population as in 1981. The DEPCAT category of each postcode sector is included in Appendix H. Table 3 summarises the distribution of the population and postcode sectors in each of the 7 DEPCAT categories for 1981 and 1991. _______________ *This change in definition brings the reporting of rooms into line with England & Wales.
Page 7
Page 4 - Carstairs Scores for Scottish Postcode Sectors from the 1991 Census
Public Health Research Unit, University of Glasgow
1981 1991
DEPCAT Population % Postcode
sectors % Population % Postcode
sectors %
1 305,868 6.1 105 10.4 305,725 6.1 94 9.4
2 691,280 13.7 180 17.8 688,018 13.8 171 17.1
3 1,095,583 21.8 253 25.0 1,090,483 21.8 226 22.6
4 1,282,976 25.5 219 21.7 1,270,597 25.4 231 23.1
5 743,689 14.8 117 11.6 741,664 14.8 125 12.5
6 571,901 11.4 91 9.0 567,492 11.4 97 9.7
7 340,998 6.8 45 4.5 334,285 6.7 57 5.7
Total 5,032,295 100 1010 100 4,998,264 100 1001 100
Table 3: Frequency distribution of populations and postcode sectors contained within each DEPCAT category (1981 & 1991).
Page 8
Page 5 - Carstairs Scores for Scottish Postcode Sectors from the 1991 Census
Public Health Research Unit, University of Glasgow
METHODOLOGICAL ISSUES
Problems of categorising small area populations Several interrelated problems suggest that a measure of area deprivation derived from Census variables in this way should be used cautiously. They include:
the way in which variables are chosen and the reasons for choosing some and not others; technical problems in creating the scores; in particular the way in which the selected variables interact, and the consistency of these interactions across the whole range of different population sub-groups; the a priori assumption that, within the selected or available data, there exists a simple univariate level of deprivation that allows localities and their populations to be quantified in these terms.
The choice of variables used in the Carstairs score has been justified on the basis of theoretical assumptions about their relationship to unmeasured or unmeasurable concepts such as wealth, or poor access to material resources (see Carstairs and Morris, 1991; pp.4-11). This means that the derived census variables become empirical indicators of a poorly defined concept. Such assumptions are difficult to refute or validate and the chosen variables could also be associated with other variables that differentiate areas, for example, their demography. This comment introduces the problem of knowing whether, in different types of localities, the chosen variables consistently reflect the concepts with which they have been associated. Car ownership, for example is associated with population density, and varies with level of urbanisation after controlling for household income (Bates et al, 1981). These observations cast doubt on the assumption that lack of a car can be equated with low income in simple or direct ways. The variables used in the Carstairs index are more strongly associated with socio-economic circumstances than, for example, demographic variables such as those describing age groups or family structures which may also vary between localities. However, other variables available from the Census - such as housing tenure - are also strongly associated with the socio-economic characteristics of small areas. There is no valid statistical method for choosing some Census variables in preference to others as a measure of the relative affluence or deprivation of small areas. However, statistical methods such as principle components analysis or factor analysis are useful in allowing the relationships between sub-groups of variables to be explored. These methods make it possible to identify different dimensions by which areas vary while still taking account of the multivariate nature of the Census data. Principle components analysis of the 1981 Census identified five such dimensions, of which one could be described as a "socio-economic component" with similarities to the Carstairs scores (McLoone and Boddy, 1992). A second principal component was associated with population density, transport to work, and types of housing typically found in rural areas (such as tied cottages); a third with young families and children; a fourth with older people and pensioners living alone and a fifth with
Page 9
Page 6 - Carstairs Scores for Scottish Postcode Sectors from the 1991 Census
Public Health Research Unit, University of Glasgow
larger families, female unemployment and overcrowded housing. The socio-economic dimension on which the Carstairs index ranks areas is thus only one of several ways in which localities differ and which may have important implications for the planning of health services and the provision of health care. There is a tautological danger in selecting variables which best predict outcomes since these chosen variables may not necessarily reflect the relationship between outcomes and what the derived index is believed to represent.
What do deprivation scores identify? Deprivation indices (such as the Carstairs scores) rank small geographical areas along a univariate dimension by using aggregated information about the individuals living in these areas expressed as a proportion of individuals with one or other attribute. Figure 1 represents three hypothetical localities (the three polygons) ranked on a deprivation scale. Within each, the circles represent households with/without one of the variables employed in constructing the score. In the left and right polygons - the extremes of the scores - the proportion of households with or without this attribute is greater; that is, their internal populations are increasingly homogeneous. In the centre of the scale, the mix of characteristics is relatively heterogeneous and it is this heterogeneity that locates the score in the middle of the scale. An important feature of scales derived in this way, therefore, is that areas need to be internally homogeneous - at least for some variables - for that area's score to be extreme, and thus identified as being affluent or deprived.
Figure 1: Illustration of three areas ranked on a deprivation scale. Circles represent the presence or absence of an indicator of deprivation within households. Scores at the middle of the scale result from the mix of household types contained within these areas and define the majority of postcode sectors; 62% of the Scottish population live in areas designated as DEPCAT3, 4 or 5. As Figure 1 suggests, however, these areas contain deprived households and, because the population of postcode sectors varies
Page 10
considerably, it could be that these "middle" areas contain more deprived households than some of the sectors identified at the deprived extreme. This problem of heterogeneity arises as a result of the way in which postcode sectors are defined. Postcodes boundaries are devised to enable the Post Office to deliver mail; the problem of their heterogeneity is a consequence of three factors; their geographical size, the size of their populations and the spatial location of postcode sectors within Scotland. For these reasons, the Carstairs scores are likely to provide a better account of affluence or deprivation in urban rather than rural areas. The former are geographically smaller and socially more homogeneous; the latter are geographically larger and include populations with much more heterogeneous socio-economic characteristics. It might be argued that if smaller geographical units - such as Census enumeration districts - were used, more internally homogeneous areas would be result. However, the boundaries of enumeration districts are not defined by the characteristics of the populations which they include and there is no reason to assume that greater homogeneity would result from their use.
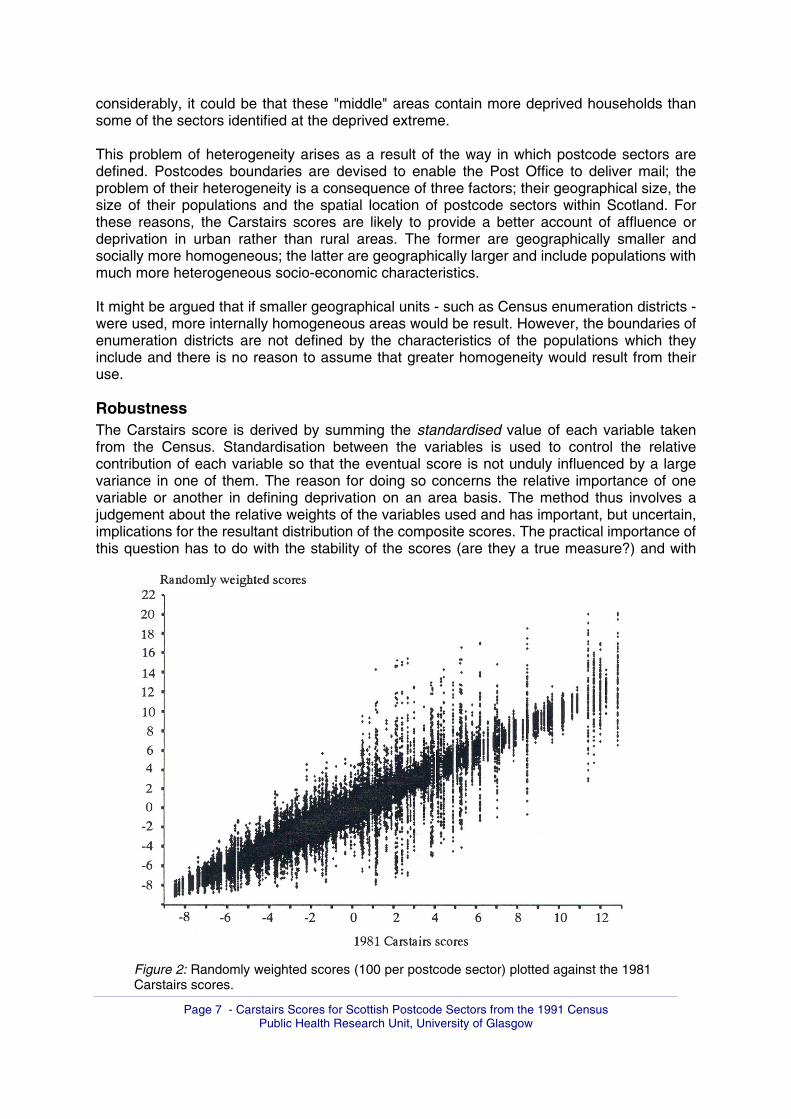
Robustness The Carstairs score is derived by summing the standardised value of each variable taken from the Census. Standardisation between the variables is used to control the relative contribution of each variable so that the eventual score is not unduly influenced by a large variance in one of them. The reason for doing so concerns the relative importance of one variable or another in defining deprivation on an area basis. The method thus involves a judgement about the relative weights of the variables used and has important, but uncertain, implications for the resultant distribution of the composite scores. The practical importance of this question has to do with the stability of the scores (are they a true measure?) and with
Figure 2: Randomly weighted scores (100 per postcode sector) plotted against the 1981 Carstairs scores.
Page 7 - Carstairs Scores for Scottish Postcode Sectors from the 1991 Census Public Health Research Unit, University of Glasgow
Page 11
Page 8 - Carstairs Scores for Scottish Postcode Sectors from the 1991 Census
Public Health Research Unit, University of Glasgow
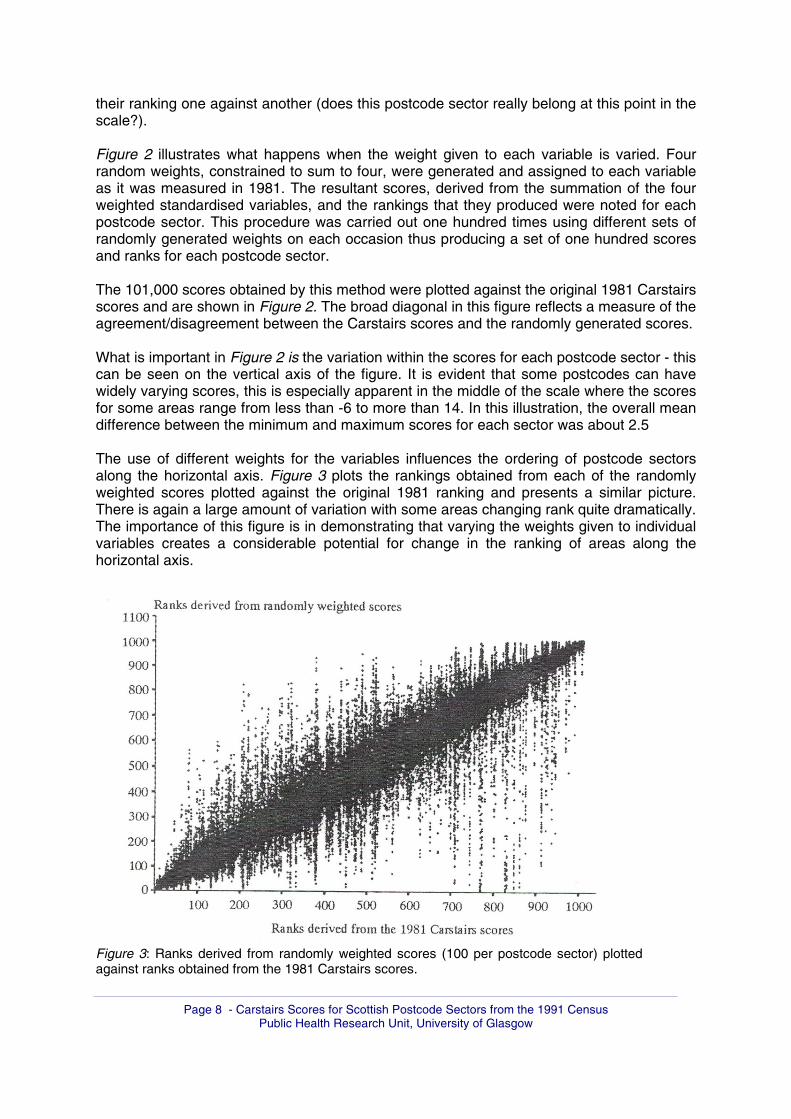
their ranking one against another (does this postcode sector really belong at this point in the scale?). Figure 2 illustrates what happens when the weight given to each variable is varied. Four random weights, constrained to sum to four, were generated and assigned to each variable as it was measured in 1981. The resultant scores, derived from the summation of the four weighted standardised variables, and the rankings that they produced were noted for each postcode sector. This procedure was carried out one hundred times using different sets of randomly generated weights on each occasion thus producing a set of one hundred scores and ranks for each postcode sector. The 101,000 scores obtained by this method were plotted against the original 1981 Carstairs scores and are shown in Figure 2. The broad diagonal in this figure reflects a measure of the agreement/disagreement between the Carstairs scores and the randomly generated scores. What is important in Figure 2 is the variation within the scores for each postcode sector - this can be seen on the vertical axis of the figure. It is evident that some postcodes can have widely varying scores, this is especially apparent in the middle of the scale where the scores for some areas range from less than -6 to more than 14. In this illustration, the overall mean difference between the minimum and maximum scores for each sector was about 2.5 The use of different weights for the variables influences the ordering of postcode sectors along the horizontal axis. Figure 3 plots the rankings obtained from each of the randomly weighted scores plotted against the original 1981 ranking and presents a similar picture. There is again a large amount of variation with some areas changing rank quite dramatically. The importance of this figure is in demonstrating that varying the weights given to individual variables creates a considerable potential for change in the ranking of areas along the horizontal axis.
Figure 3: Ranks derived from randomly weighted scores (100 per postcode sector) plotted against ranks obtained from the 1981 Carstairs scores.
Page 12
Page 9 - Carstairs Scores for Scottish Postcode Sectors from the 1991 Census
Public Health Research Unit, University of Glasgow
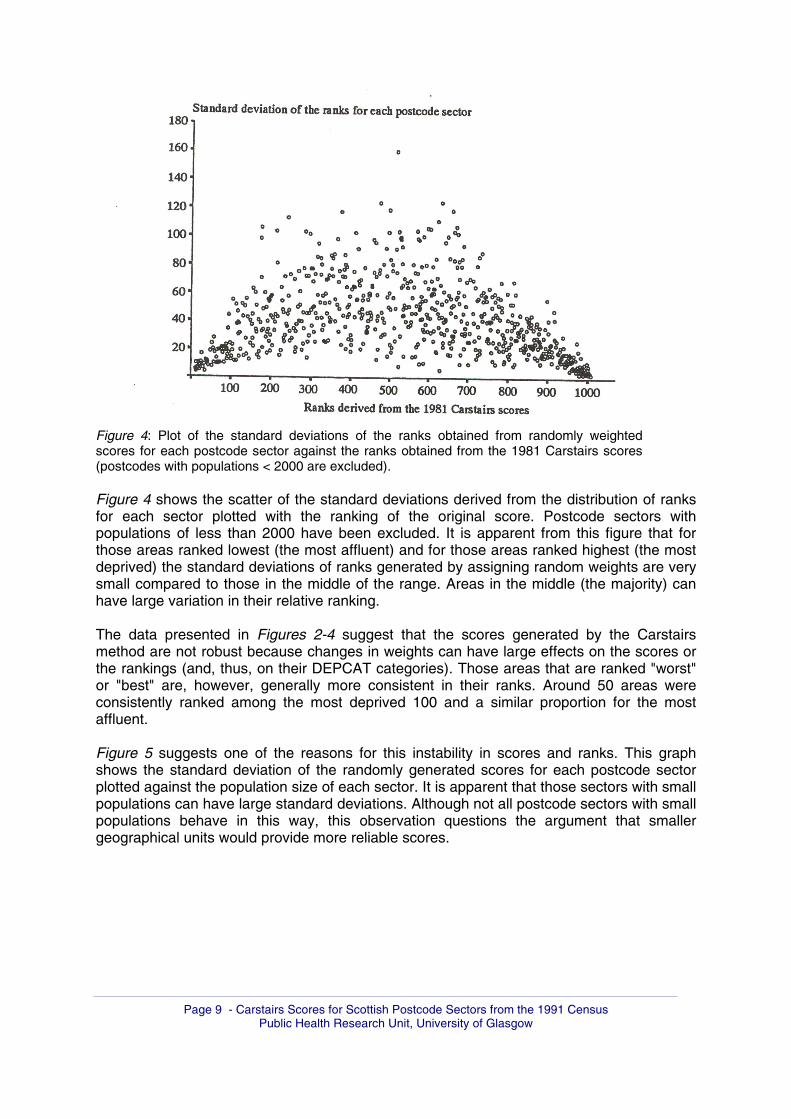
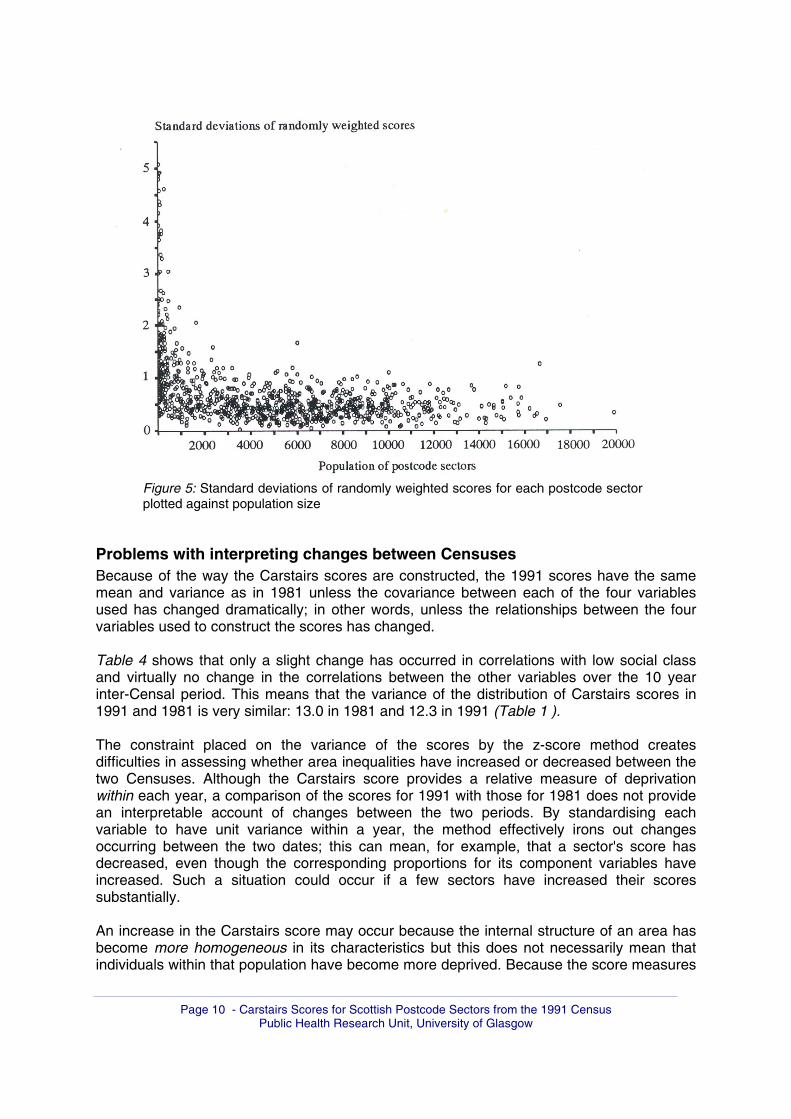
Figure 4: Plot of the standard deviations of the ranks obtained from randomly weighted scores for each postcode sector against the ranks obtained from the 1981 Carstairs scores (postcodes with populations < 2000 are excluded). Figure 4 shows the scatter of the standard deviations derived from the distribution of ranks for each sector plotted with the ranking of the original score. Postcode sectors with populations of less than 2000 have been excluded. It is apparent from this figure that for those areas ranked lowest (the most affluent) and for those areas ranked highest (the most deprived) the standard deviations of ranks generated by assigning random weights are very small compared to those in the middle of the range. Areas in the middle (the majority) can have large variation in their relative ranking. The data presented in Figures 2-4 suggest that the scores generated by the Carstairs method are not robust because changes in weights can have large effects on the scores or the rankings (and, thus, on their DEPCAT categories). Those areas that are ranked "worst" or "best" are, however, generally more consistent in their ranks. Around 50 areas were consistently ranked among the most deprived 100 and a similar proportion for the most affluent. Figure 5 suggests one of the reasons for this instability in scores and ranks. This graph shows the standard deviation of the randomly generated scores for each postcode sector plotted against the population size of each sector. It is apparent that those sectors with small populations can have large standard deviations. Although not all postcode sectors with small populations behave in this way, this observation questions the argument that smaller geographical units would provide more reliable scores.
Page 13
Page 10 - Carstairs Scores for Scottish Postcode Sectors from the 1991 Census
Public Health Research Unit, University of Glasgow
Figure 5: Standard deviations of randomly weighted scores for each postcode sector plotted against population size
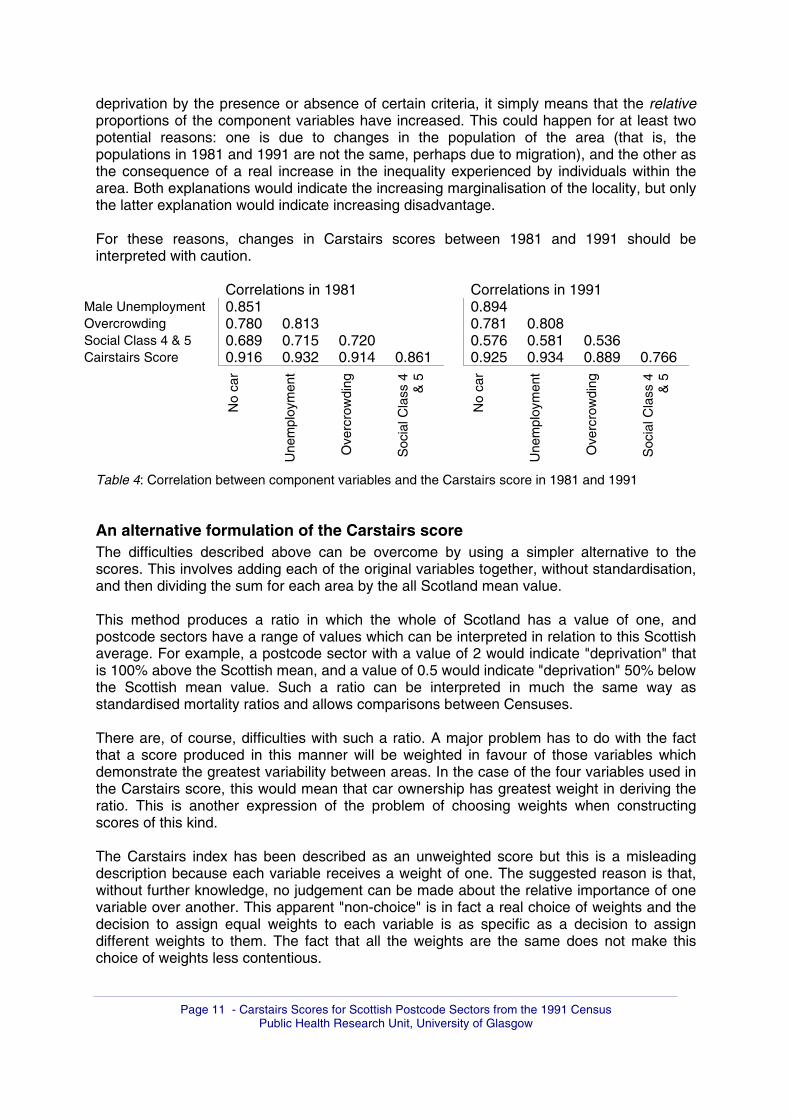
Problems with interpreting changes between Censuses Because of the way the Carstairs scores are constructed, the 1991 scores have the same mean and variance as in 1981 unless the covariance between each of the four variables used has changed dramatically; in other words, unless the relationships between the four variables used to construct the scores has changed. Table 4 shows that only a slight change has occurred in correlations with low social class and virtually no change in the correlations between the other variables over the 10 year inter-Censal period. This means that the variance of the distribution of Carstairs scores in 1991 and 1981 is very similar: 13.0 in 1981 and 12.3 in 1991 (Table 1 ). The constraint placed on the variance of the scores by the z-score method creates difficulties in assessing whether area inequalities have increased or decreased between the two Censuses. Although the Carstairs score provides a relative measure of deprivation within each year, a comparison of the scores for 1991 with those for 1981 does not provide an interpretable account of changes between the two periods. By standardising each variable to have unit variance within a year, the method effectively irons out changes occurring between the two dates; this can mean, for example, that a sector's score has decreased, even though the corresponding proportions for its component variables have increased. Such a situation could occur if a few sectors have increased their scores substantially. An increase in the Carstairs score may occur because the internal structure of an area has become more homogeneous in its characteristics but this does not necessarily mean that individuals within that population have become more deprived. Because the score measures
Page 14
Page 11 - Carstairs Scores for Scottish Postcode Sectors from the 1991 Census
Public Health Research Unit, University of Glasgow
deprivation by the presence or absence of certain criteria, it simply means that the relative proportions of the component variables have increased. This could happen for at least two potential reasons: one is due to changes in the population of the area (that is, the populations in 1981 and 1991 are not the same, perhaps due to migration), and the other as the consequence of a real increase in the inequality experienced by individuals within the area. Both explanations would indicate the increasing marginalisation of the locality, but only the latter explanation would indicate increasing disadvantage. For these reasons, changes in Carstairs scores between 1981 and 1991 should be interpreted with caution.
Correlations in 1981 Correlations in 1991 Male Unemployment 0.851 0.894 Overcrowding 0.780 0.813 0.781 0.808 Social Class 4 & 5 0.689 0.715 0.720 0.576 0.581 0.536 Cairstairs Score 0.916 0.932 0.914 0.861 0.925 0.934 0.889 0.766
No
car
Une
mpl
oym
ent
Ove
rcro
wdi
ng
Soc
ial C
lass
4
& 5
No
car
Une
mpl
oym
ent
Ove
rcro
wdi
ng
Soc
ial C
lass
4
& 5
Table 4: Correlation between component variables and the Carstairs score in 1981 and 1991
An alternative formulation of the Carstairs score The difficulties described above can be overcome by using a simpler alternative to the scores. This involves adding each of the original variables together, without standardisation, and then dividing the sum for each area by the all Scotland mean value. This method produces a ratio in which the whole of Scotland has a value of one, and postcode sectors have a range of values which can be interpreted in relation to this Scottish average. For example, a postcode sector with a value of 2 would indicate "deprivation" that is 100% above the Scottish mean, and a value of 0.5 would indicate "deprivation" 50% below the Scottish mean value. Such a ratio can be interpreted in much the same way as standardised mortality ratios and allows comparisons between Censuses. There are, of course, difficulties with such a ratio. A major problem has to do with the fact that a score produced in this manner will be weighted in favour of those variables which demonstrate the greatest variability between areas. In the case of the four variables used in the Carstairs score, this would mean that car ownership has greatest weight in deriving the ratio. This is another expression of the problem of choosing weights when constructing scores of this kind. The Carstairs index has been described as an unweighted score but this is a misleading description because each variable receives a weight of one. The suggested reason is that, without further knowledge, no judgement can be made about the relative importance of one variable over another. This apparent "non-choice" is in fact a real choice of weights and the decision to assign equal weights to each variable is as specific as a decision to assign different weights to them. The fact that all the weights are the same does not make this choice of weights less contentious.
Page 15
Page 12 - Carstairs Scores for Scottish Postcode Sectors from the 1991 Census
Public Health Research Unit, University of Glasgow
By simply adding each variable together, without standardisation, a decision about weighting does not have to be made. The resultant score simply weights itself in favour of those variables which demonstrate greatest variability between areas. In the case of the four variables used in the Carstairs score, each probably does relate to a measure of the socio-economic status of localities. It follows from this argument that the variables which show greatest variability are those which should receive greatest weight. Setting these considerations aside, the ratio created in the above manner has a correlation of 0.992 and 0.997 with the respective Carstairs scores from the 1991 and 1981 Censuses. This ratio provides a simple and readily interpretable alternative to the Carstairs score
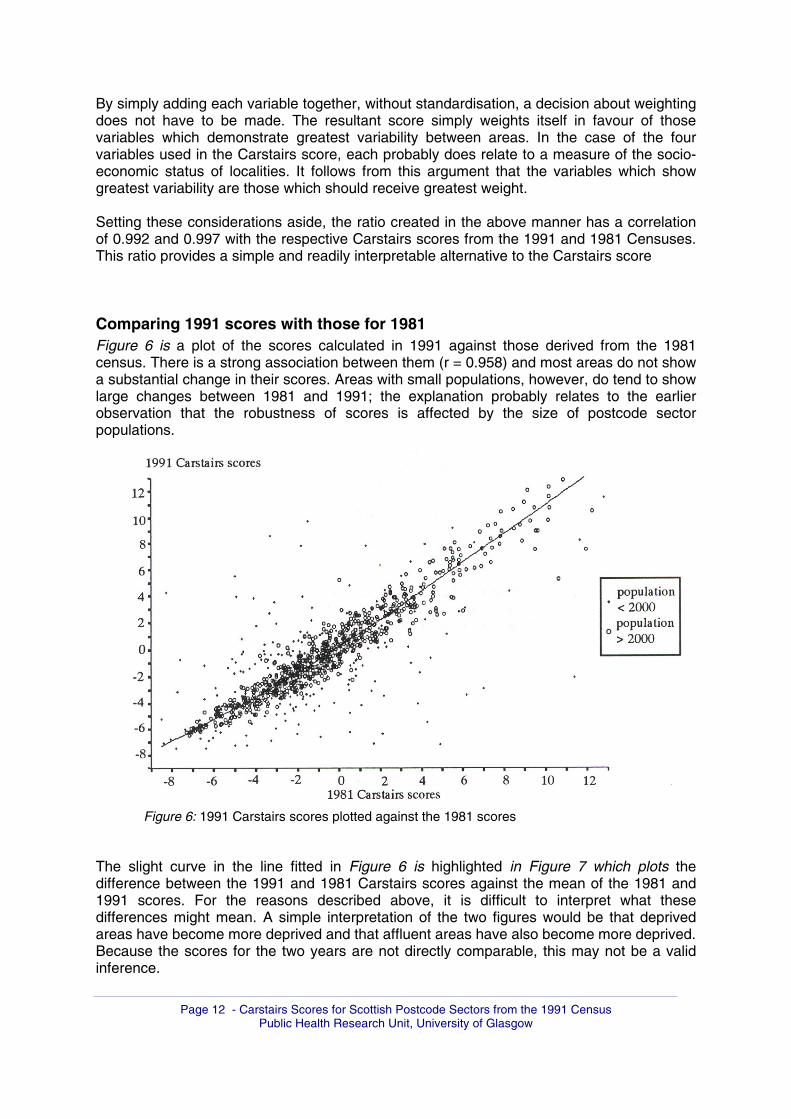
Comparing 1991 scores with those for 1981 Figure 6 is a plot of the scores calculated in 1991 against those derived from the 1981 census. There is a strong association between them (r = 0.958) and most areas do not show a substantial change in their scores. Areas with small populations, however, do tend to show large changes between 1981 and 1991; the explanation probably relates to the earlier observation that the robustness of scores is affected by the size of postcode sector populations.
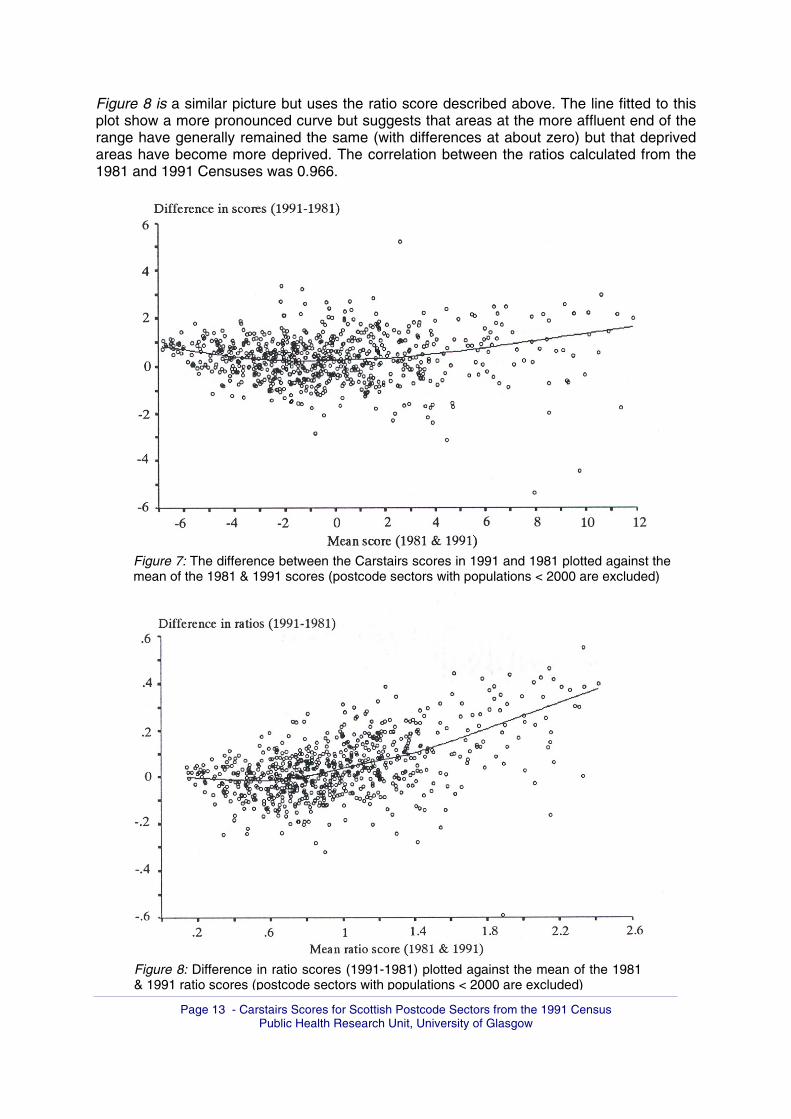
Figure 6: 1991 Carstairs scores plotted against the 1981 scores The slight curve in the line fitted in Figure 6 is highlighted in Figure 7 which plots the difference between the 1991 and 1981 Carstairs scores against the mean of the 1981 and 1991 scores. For the reasons described above, it is difficult to interpret what these differences might mean. A simple interpretation of the two figures would be that deprived areas have become more deprived and that affluent areas have also become more deprived. Because the scores for the two years are not directly comparable, this may not be a valid inference.
Page 16
Figure 8 is a similar picture but uses the ratio score described above. The line fitted to this plot show a more pronounced curve but suggests that areas at the more affluent end of the range have generally remained the same (with differences at about zero) but that deprived areas have become more deprived. The correlation between the ratios calculated from the 1981 and 1991 Censuses was 0.966.
Figure 7: The difference between the Carstairs scores in 1991 and 1981 plotted against the mean of the 1981 & 1991 scores (postcode sectors with populations < 2000 are excluded)
Figure 8: Difference in ratio scores (1991-1981) plotted against the mean of the 1981 & 1991 ratio scores (postcode sectors with populations < 2000 are excluded)
Page 13 - Carstairs Scores for Scottish Postcode Sectors from the 1991 Census Public Health Research Unit, University of Glasgow
Page 17
Page 14 - Carstairs Scores for Scottish Postcode Sectors from the 1991 Census
Public Health Research Unit, University of Glasgow
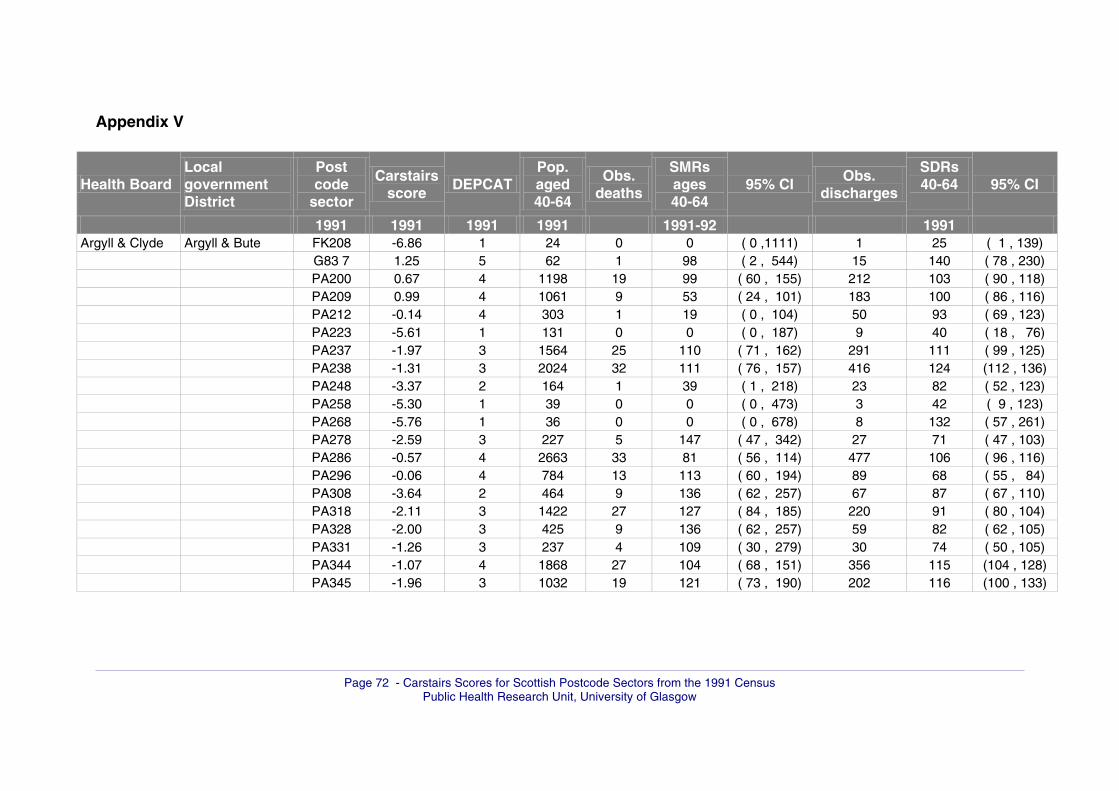
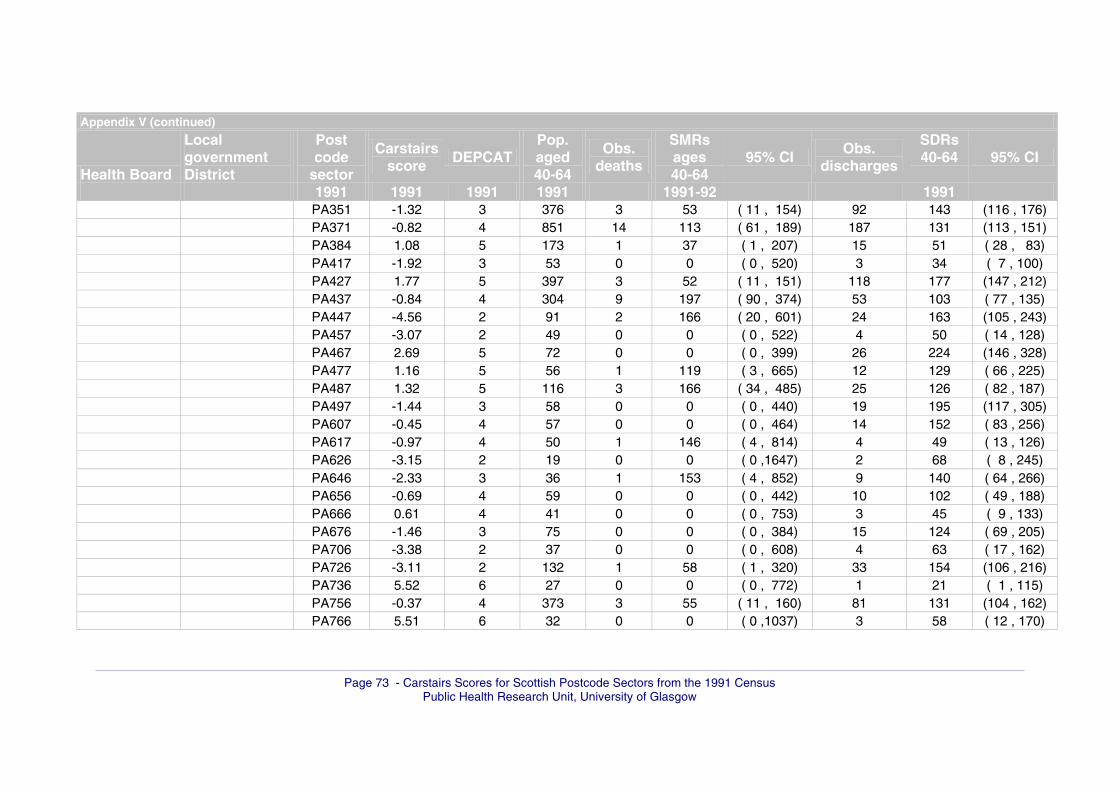
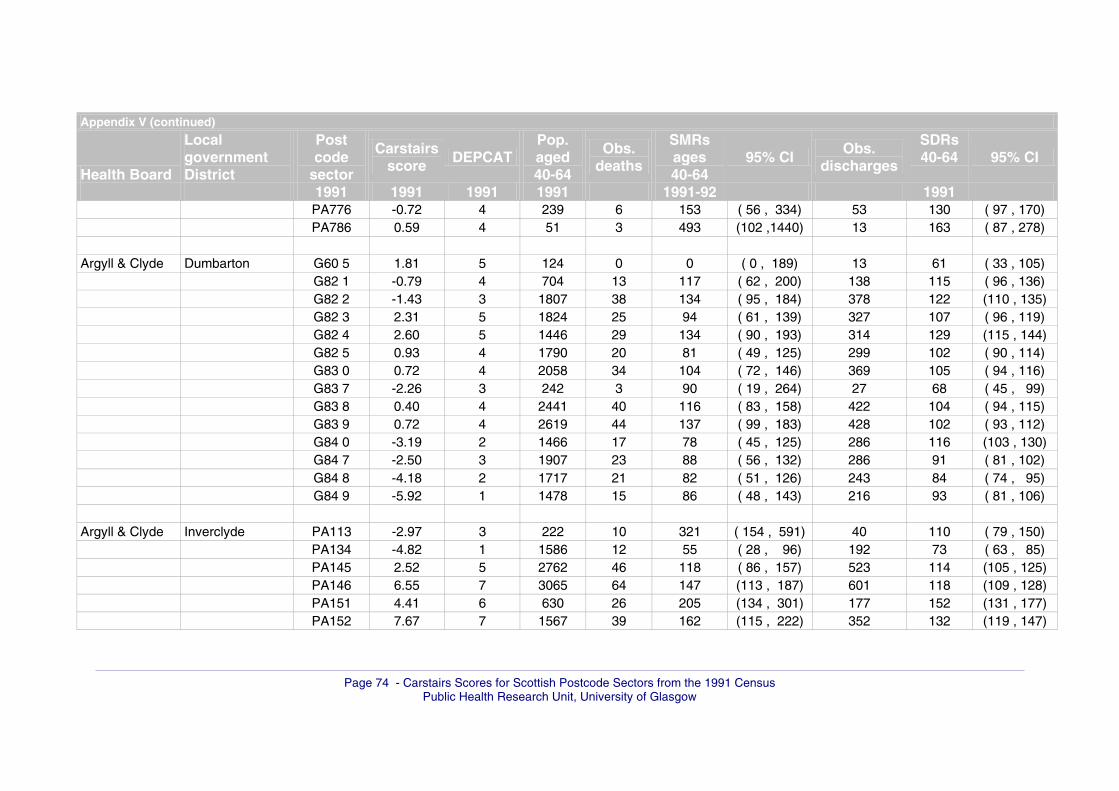
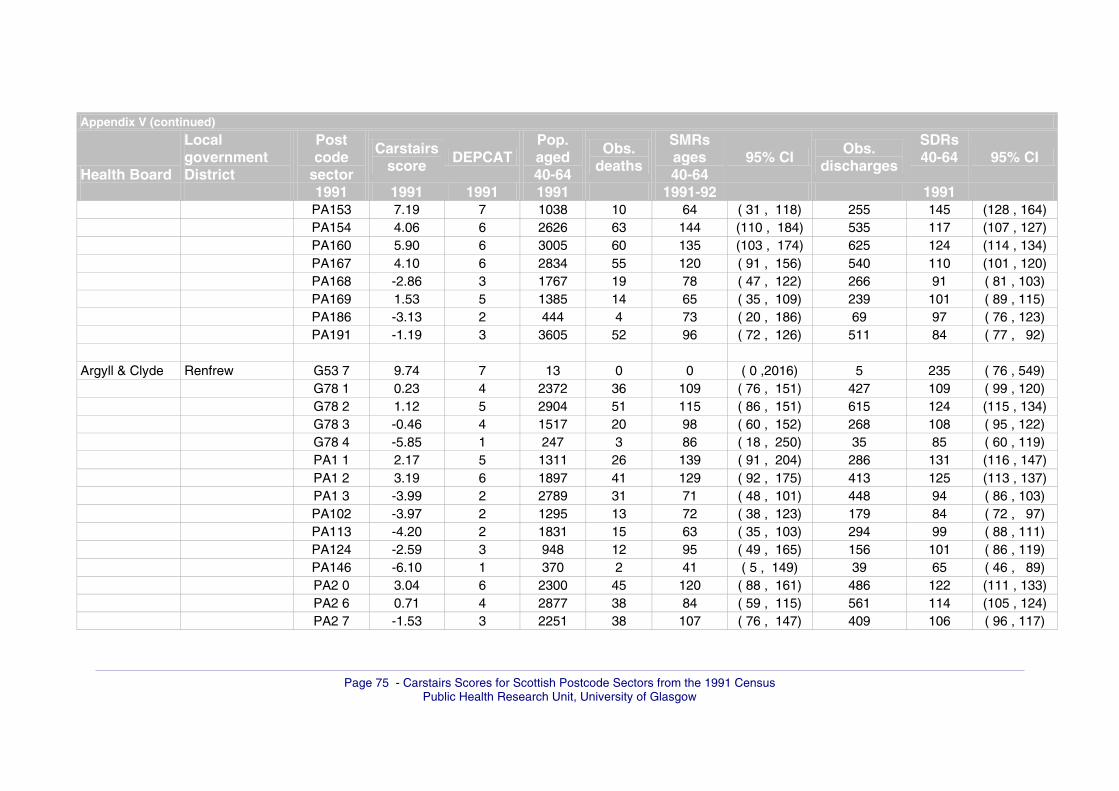
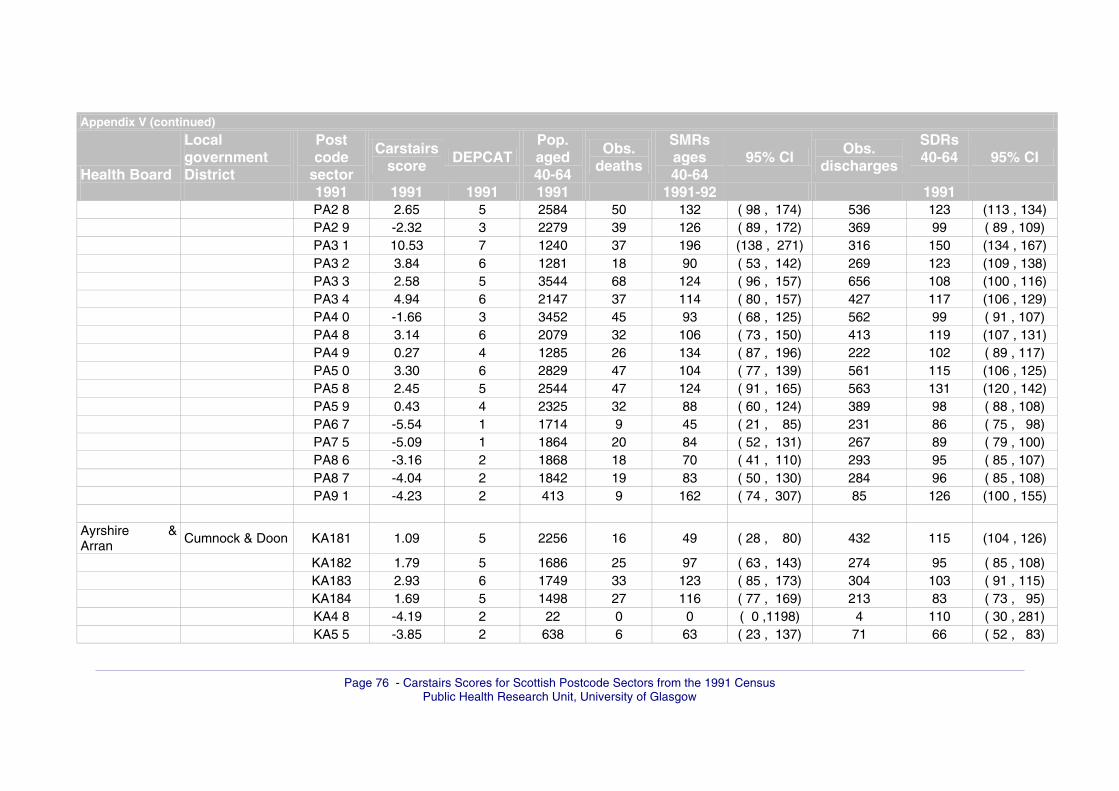
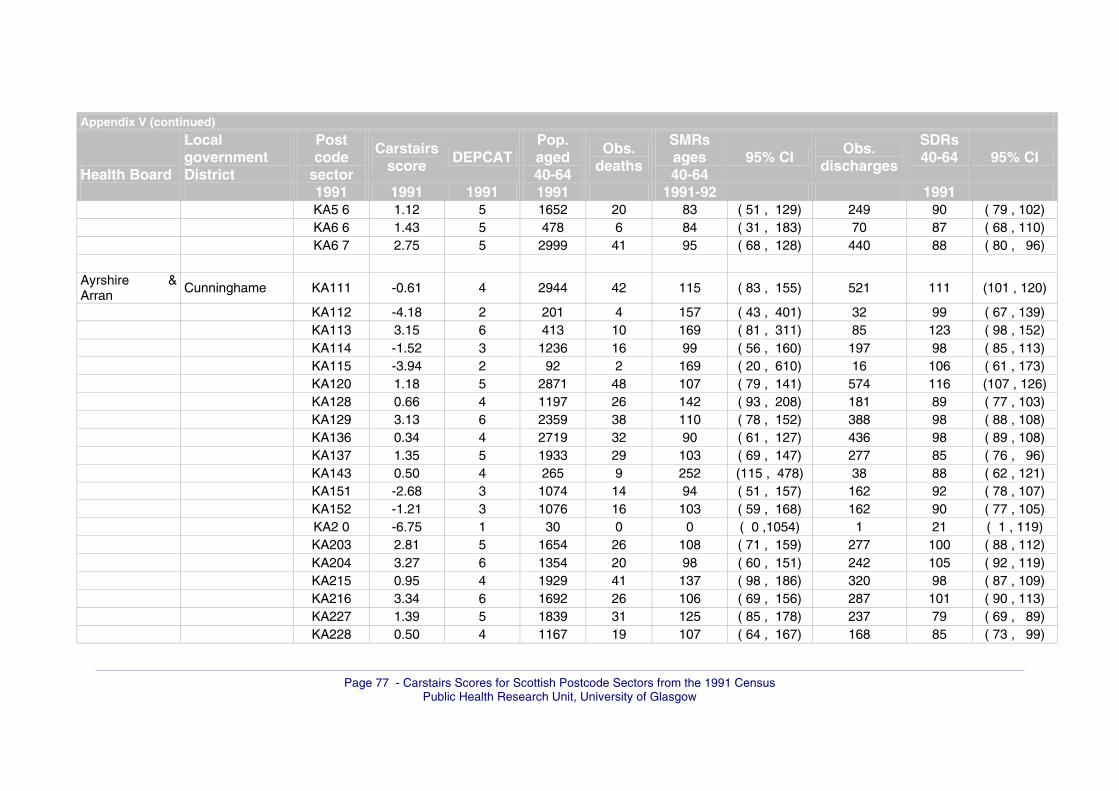
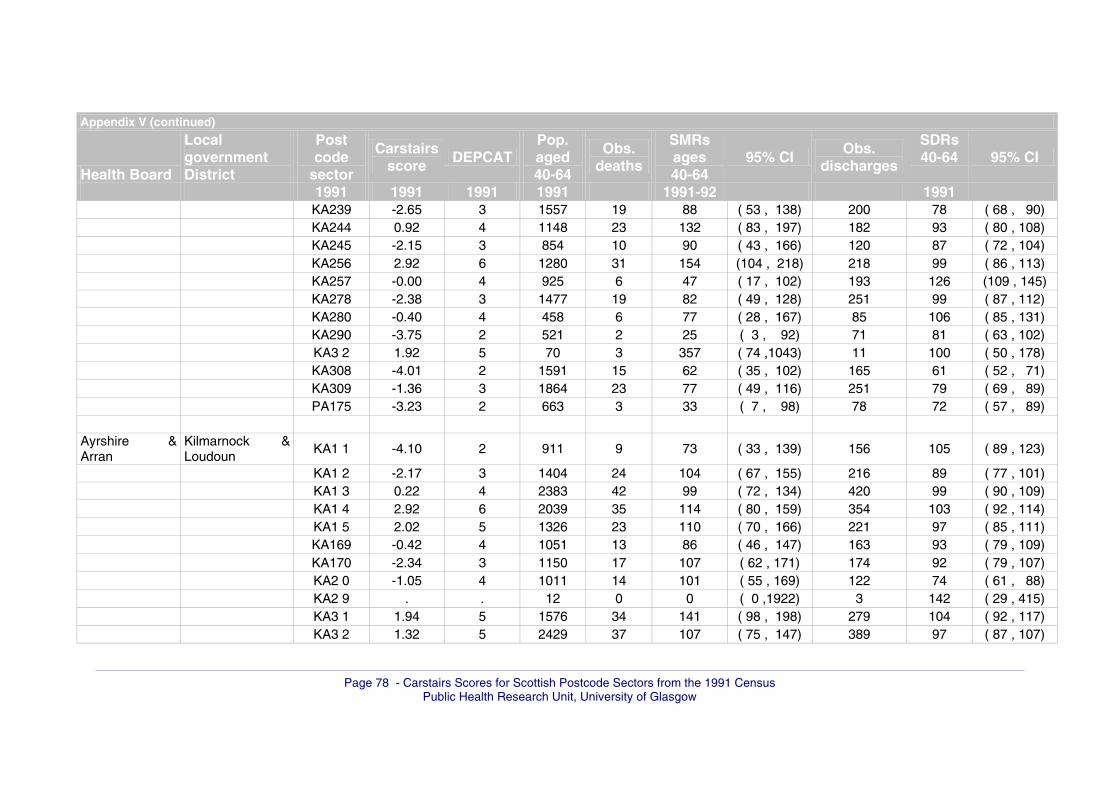
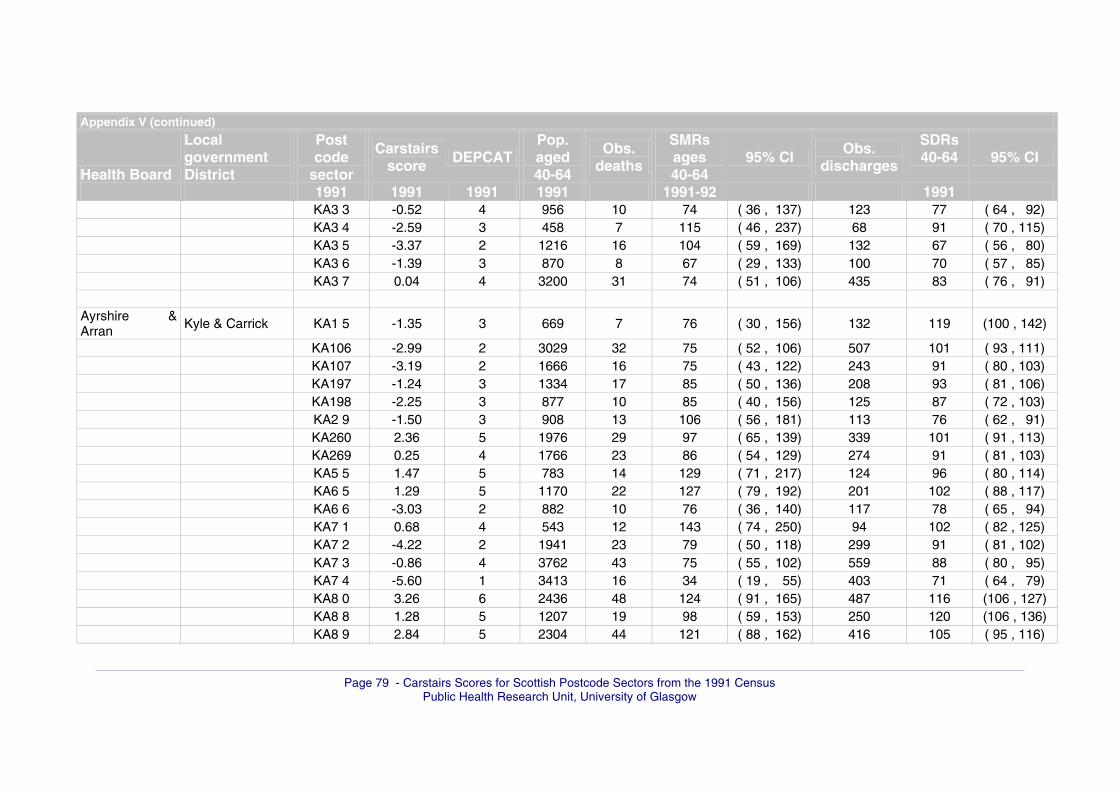
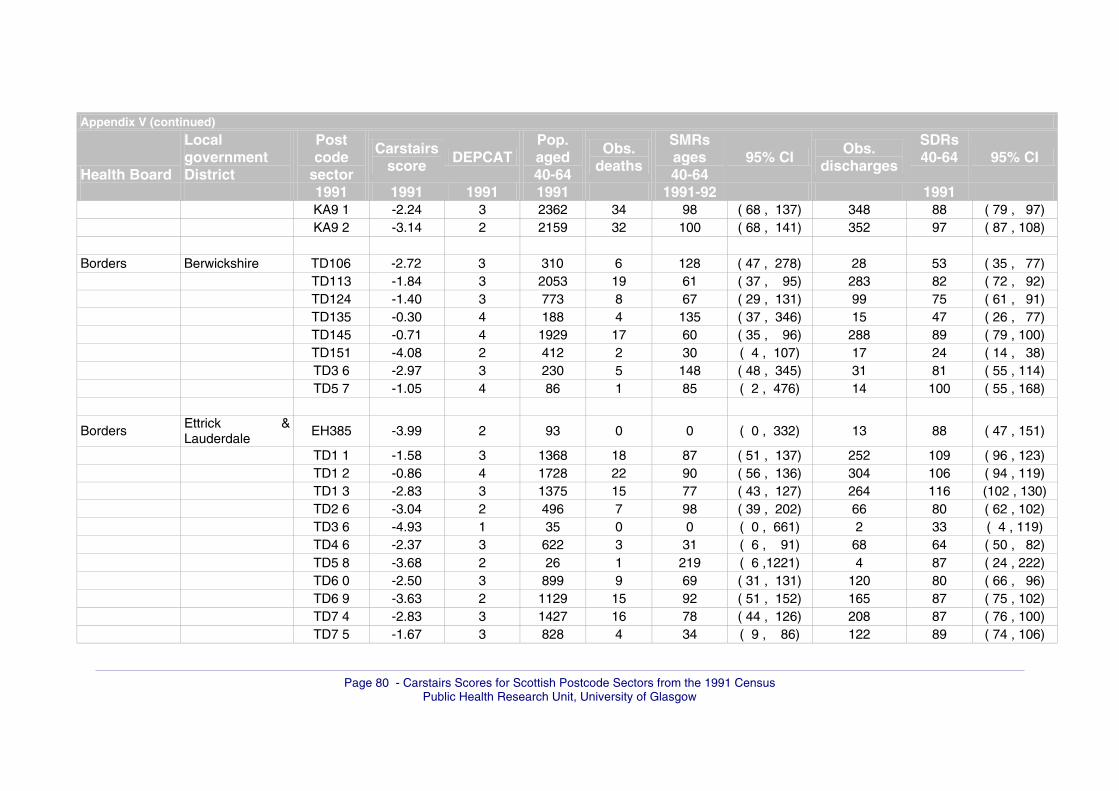
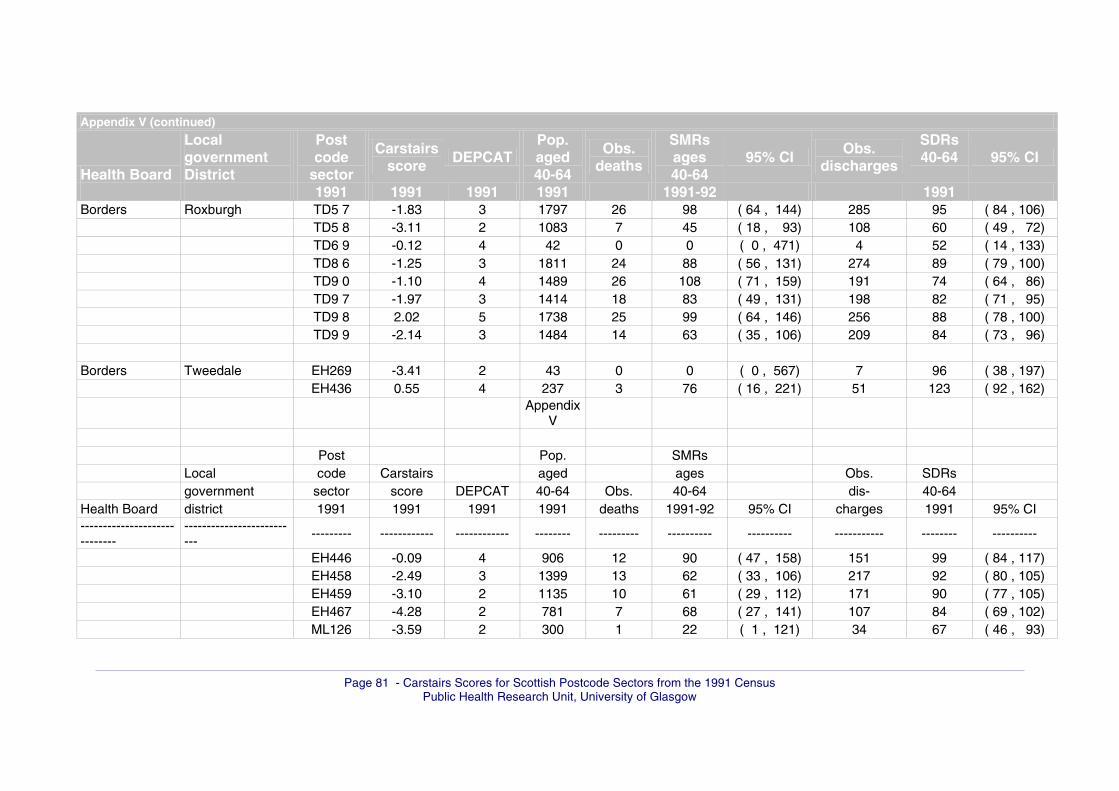
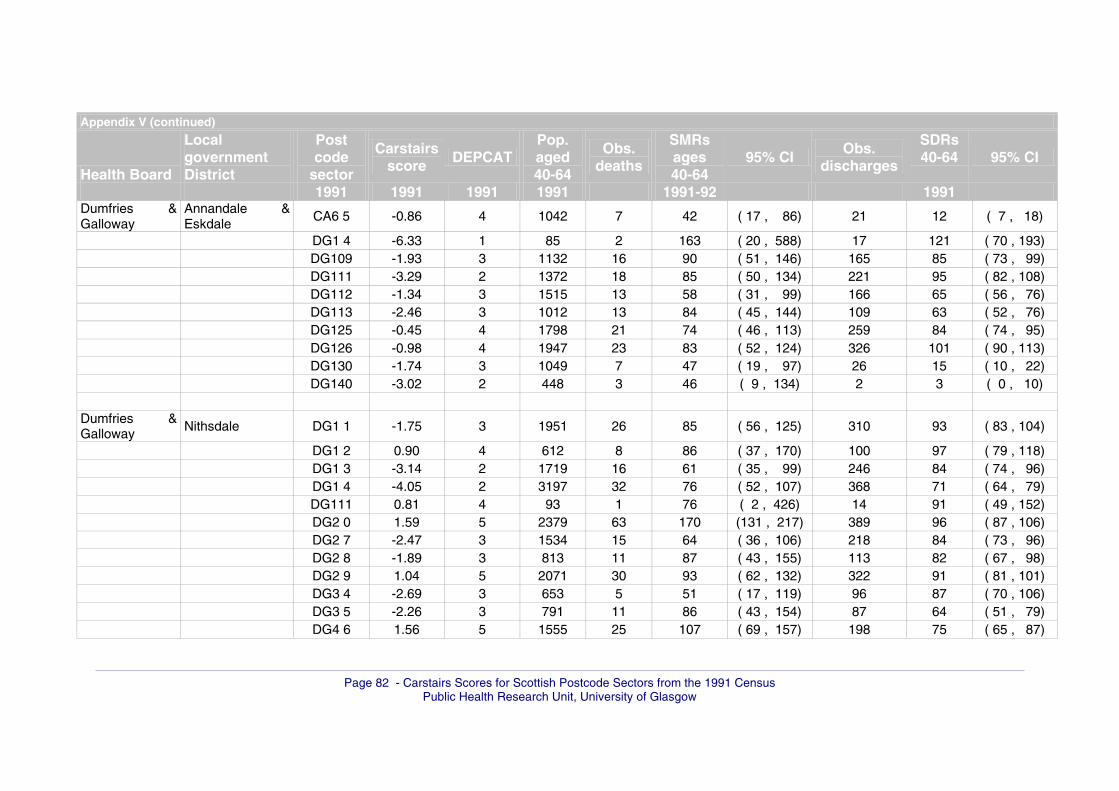
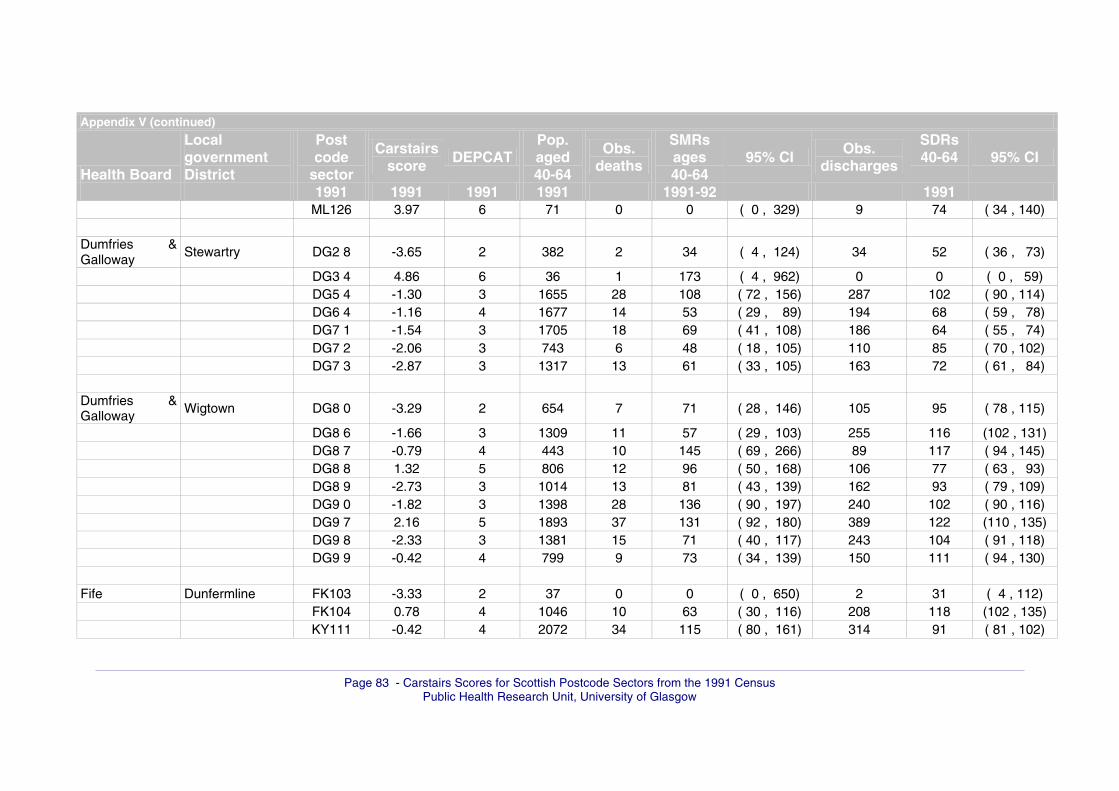
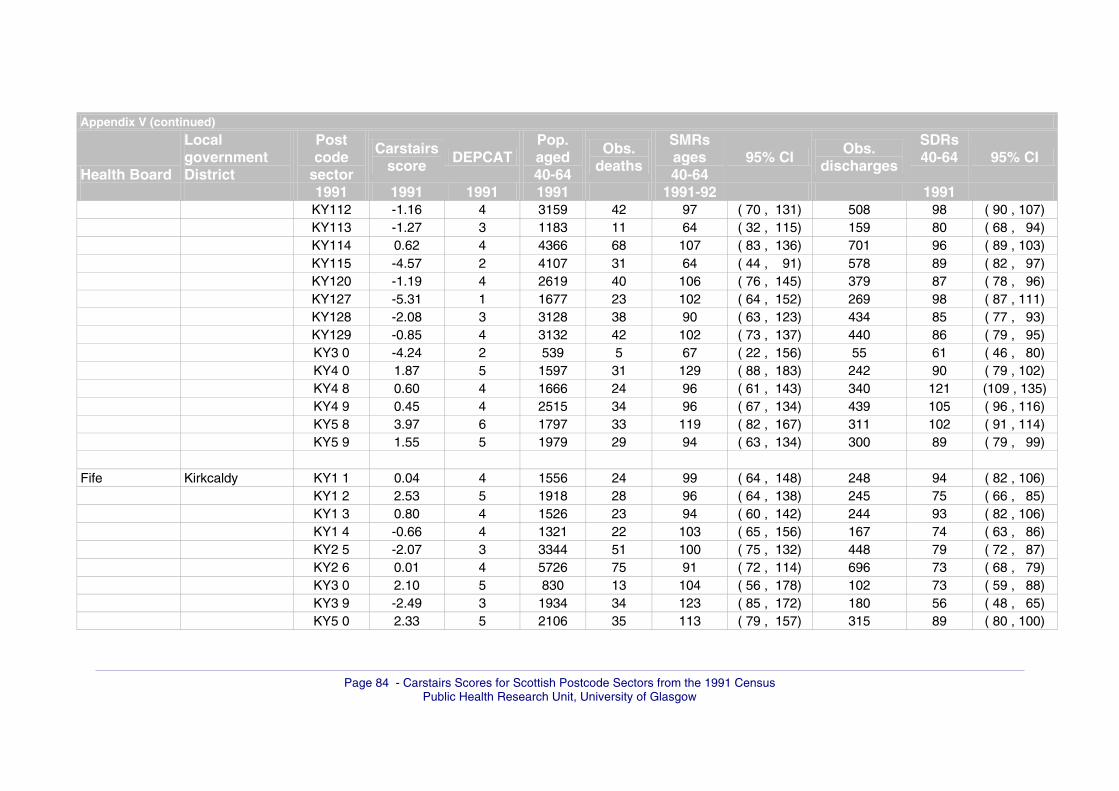
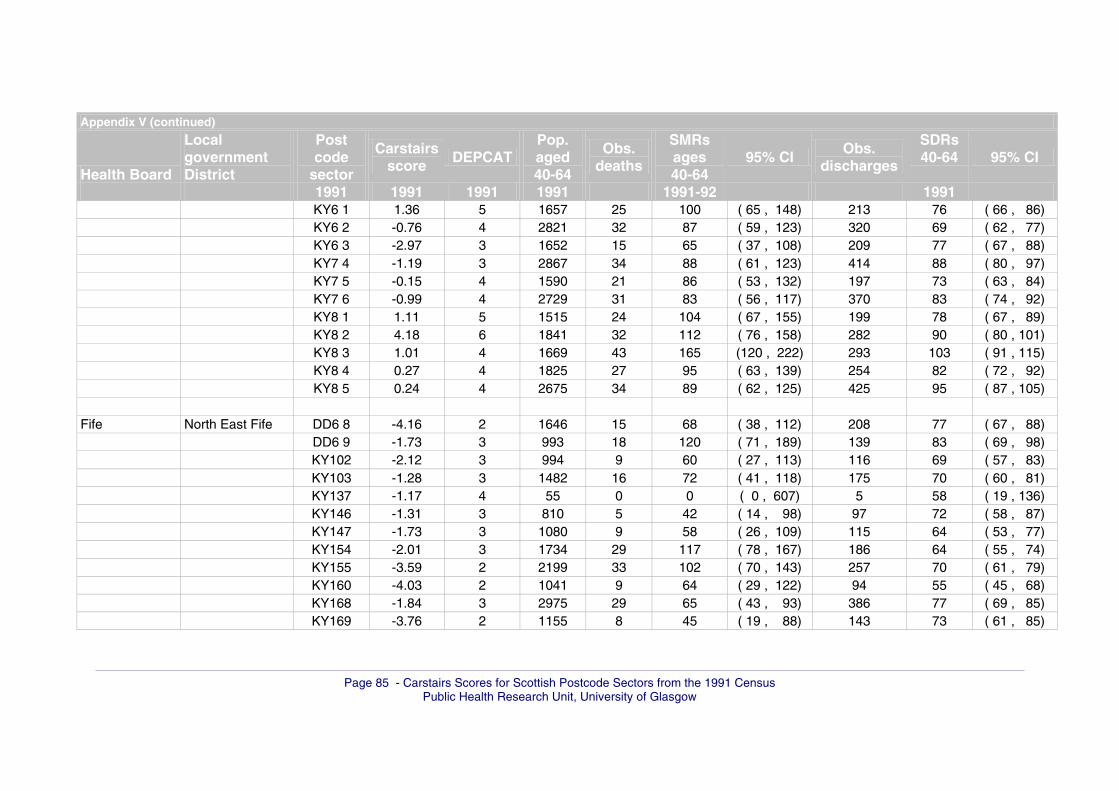
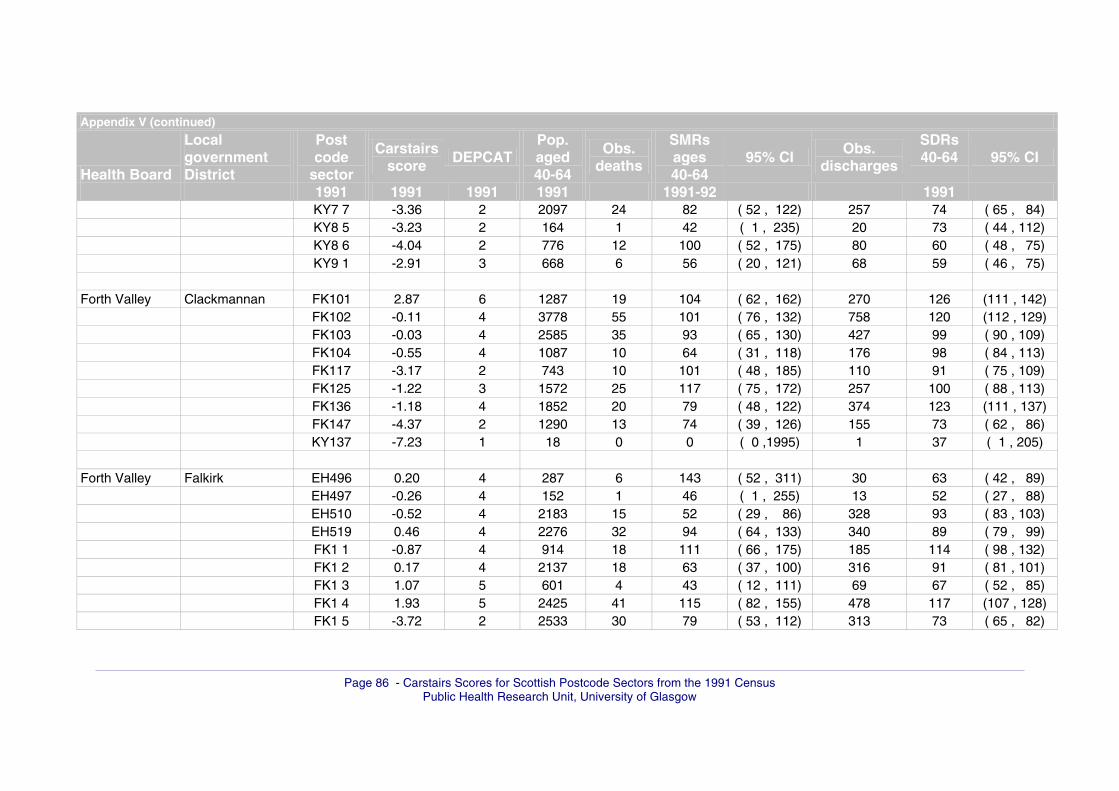
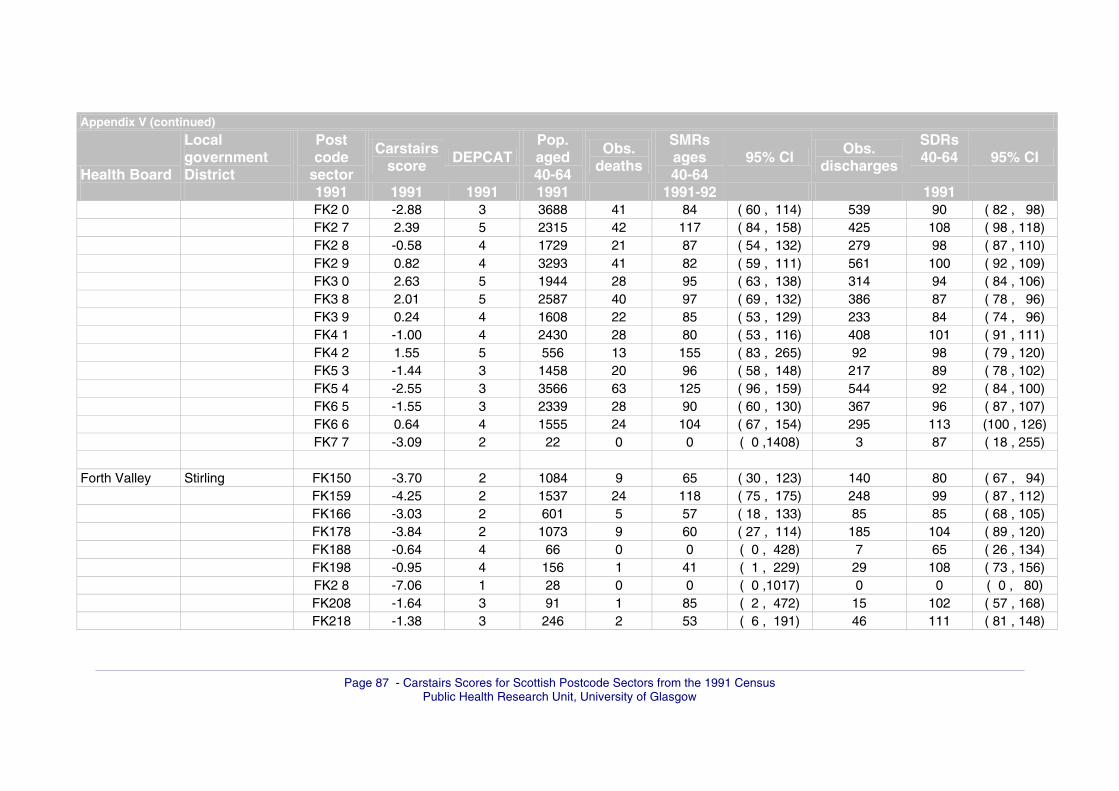
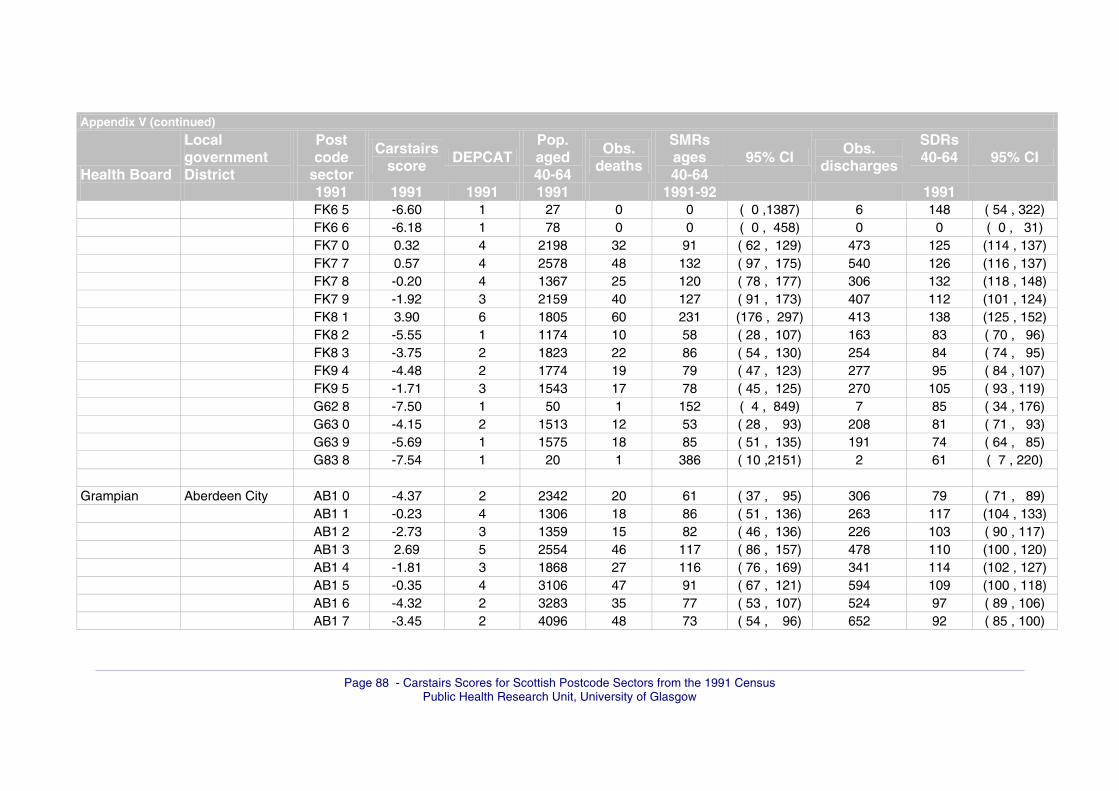
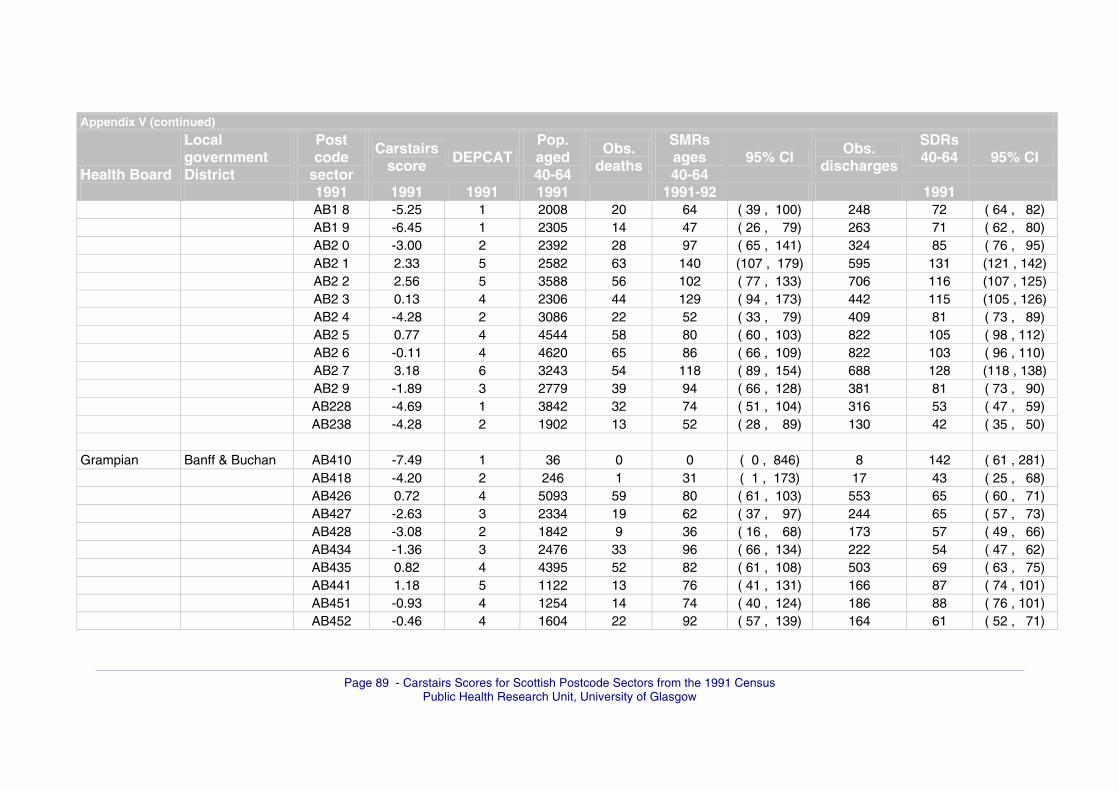
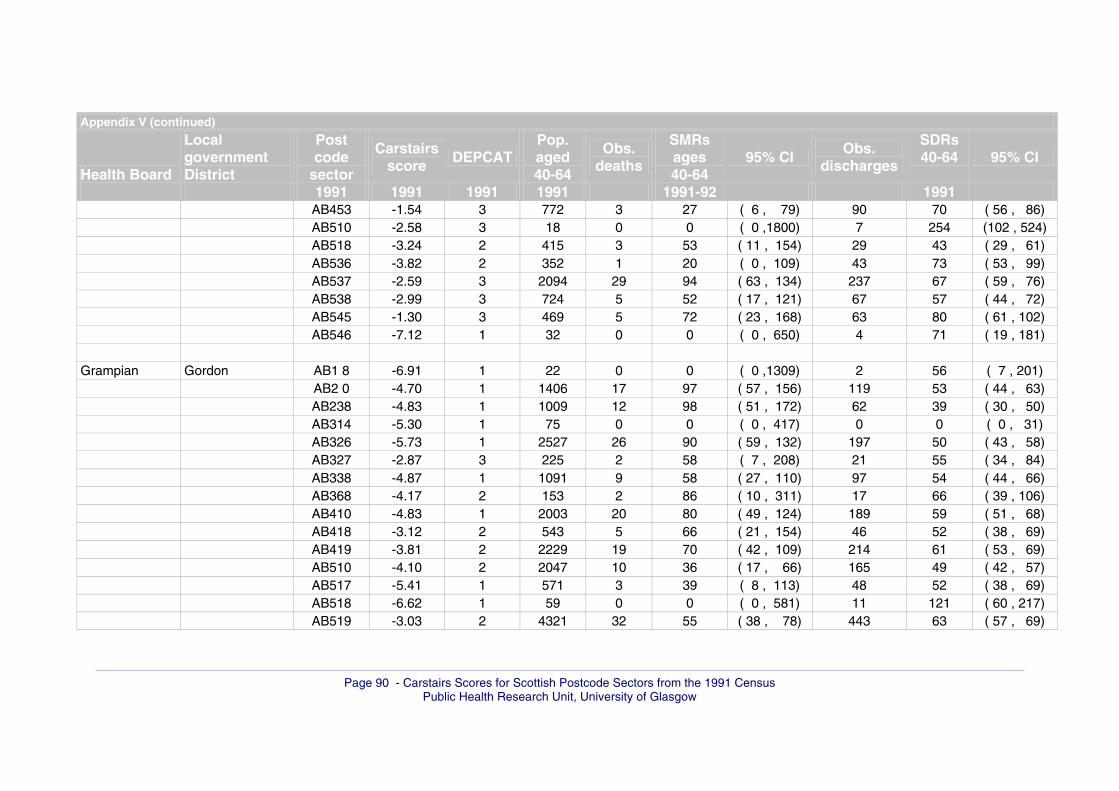
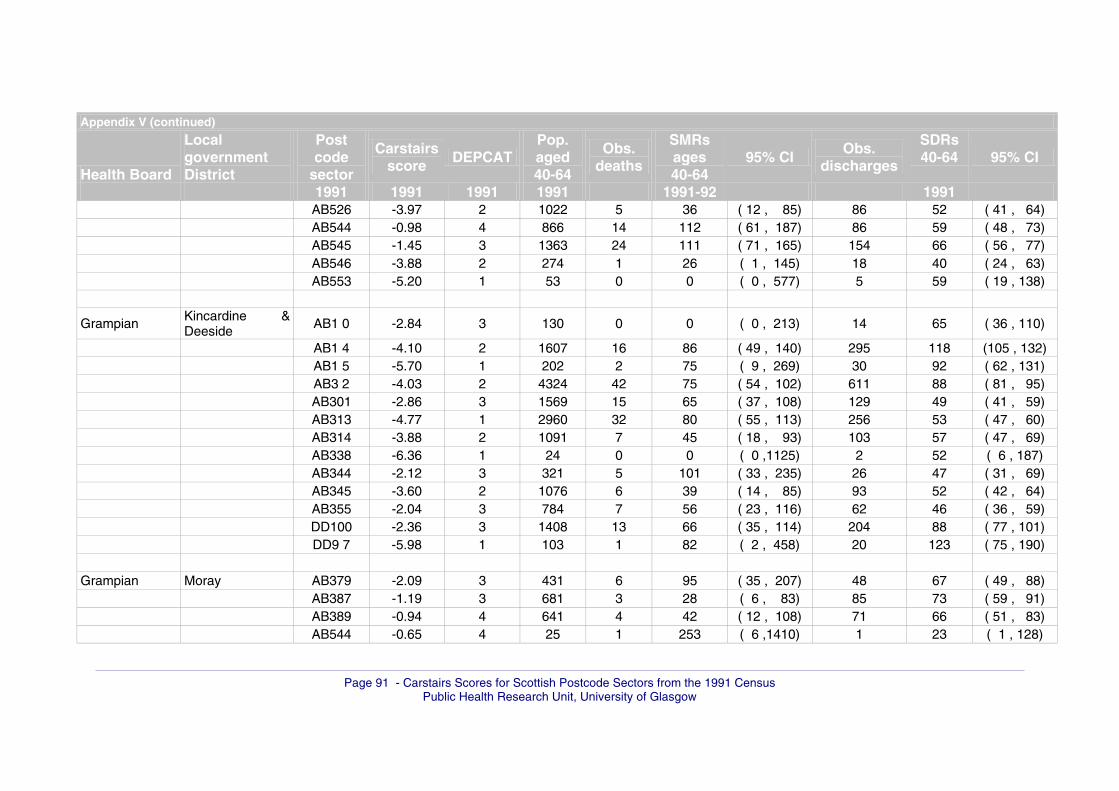
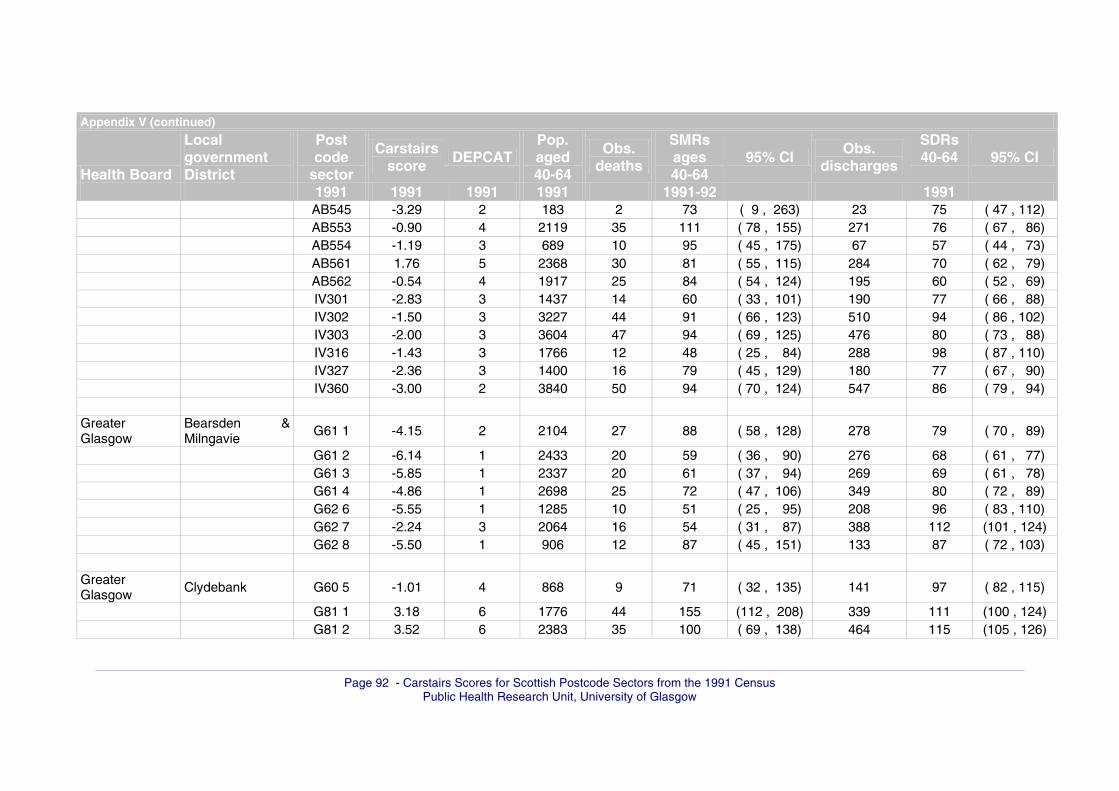
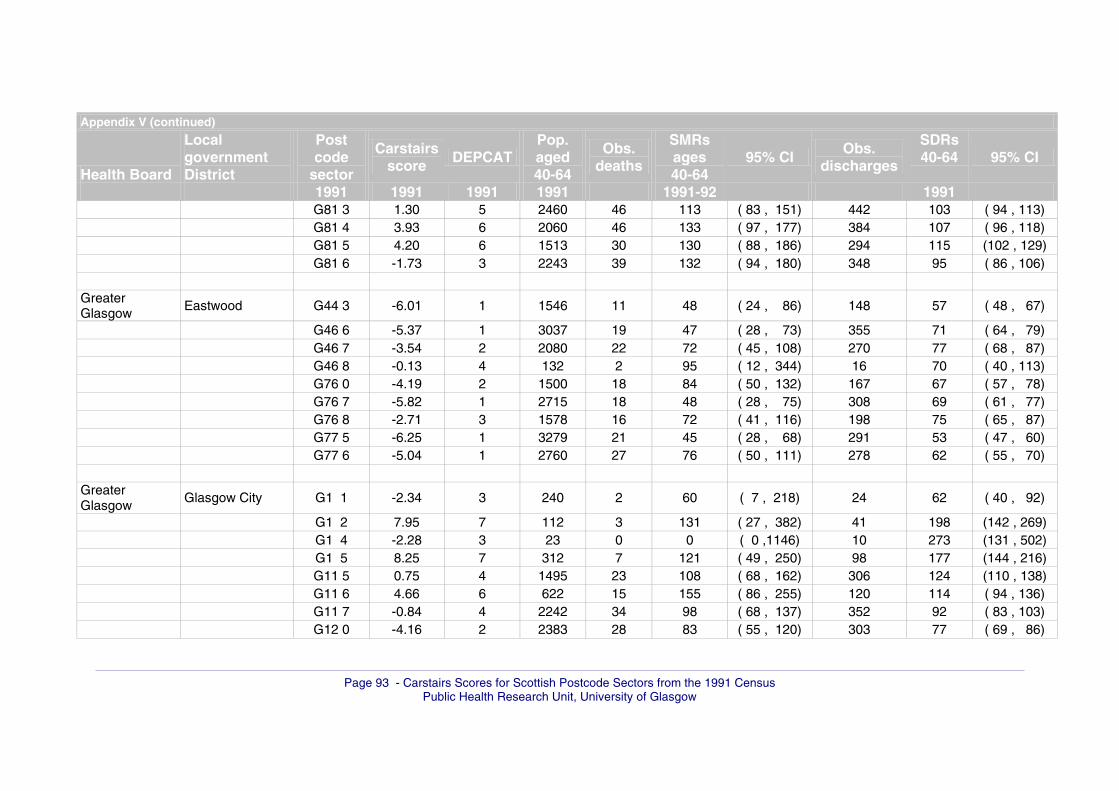
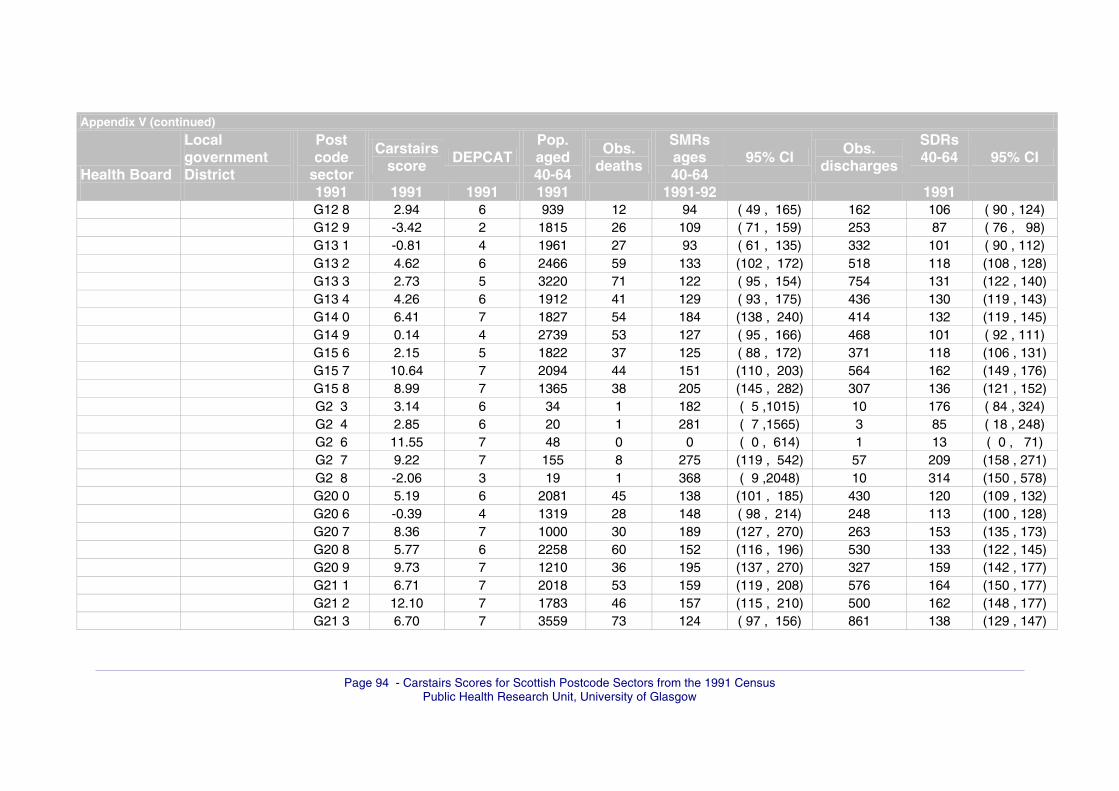
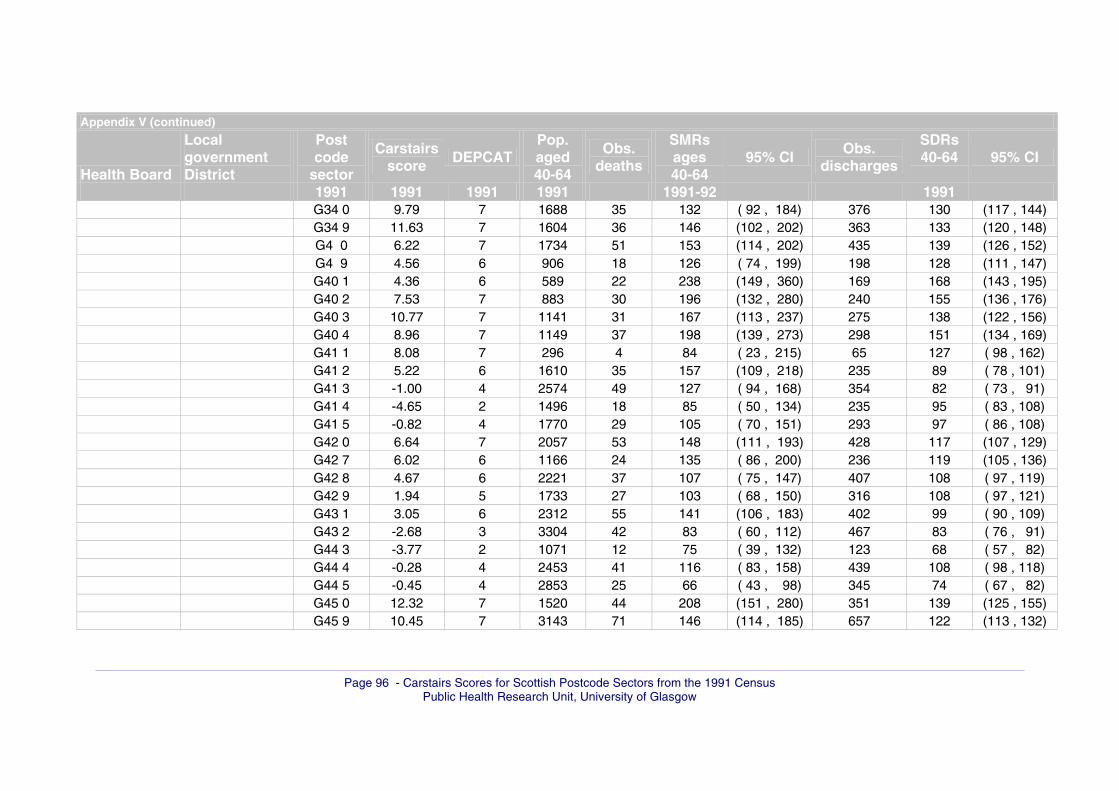
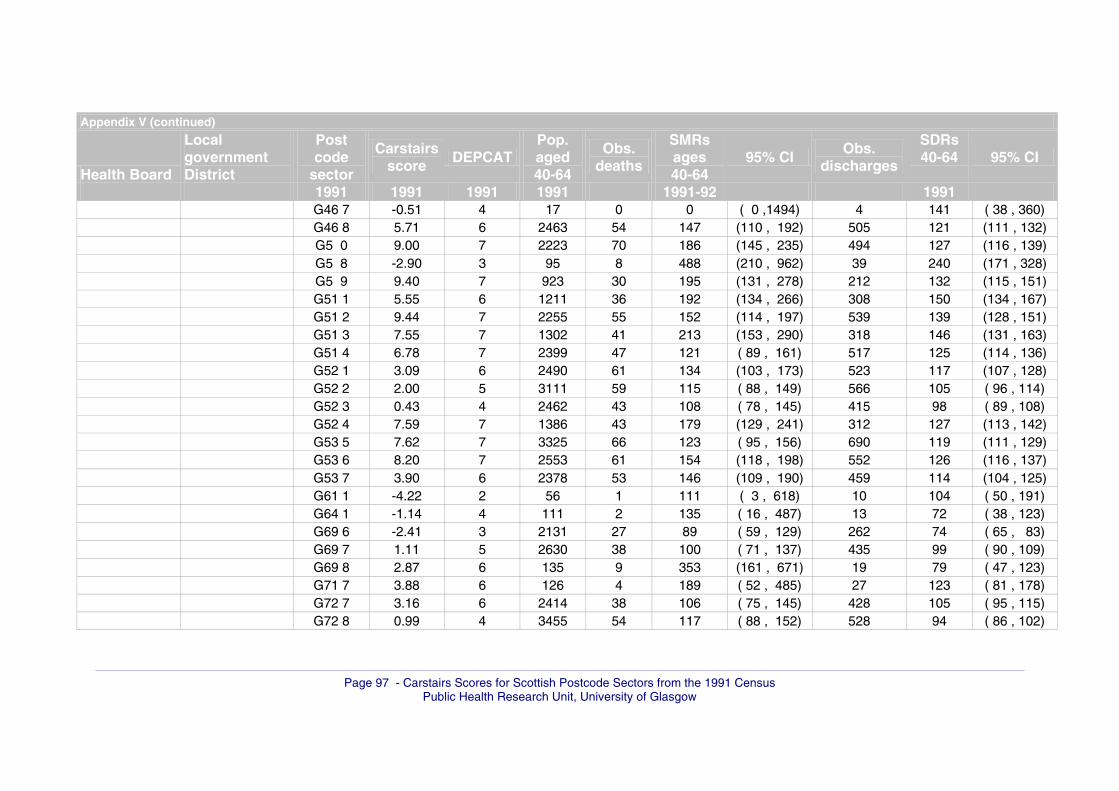
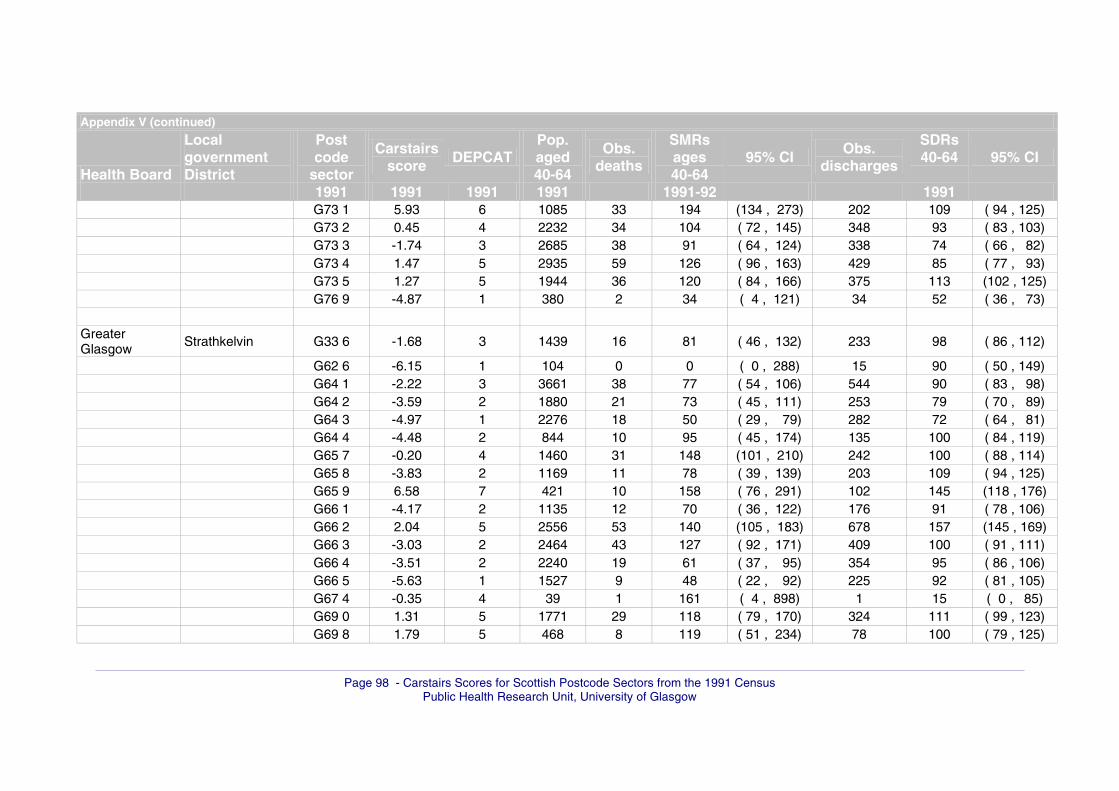
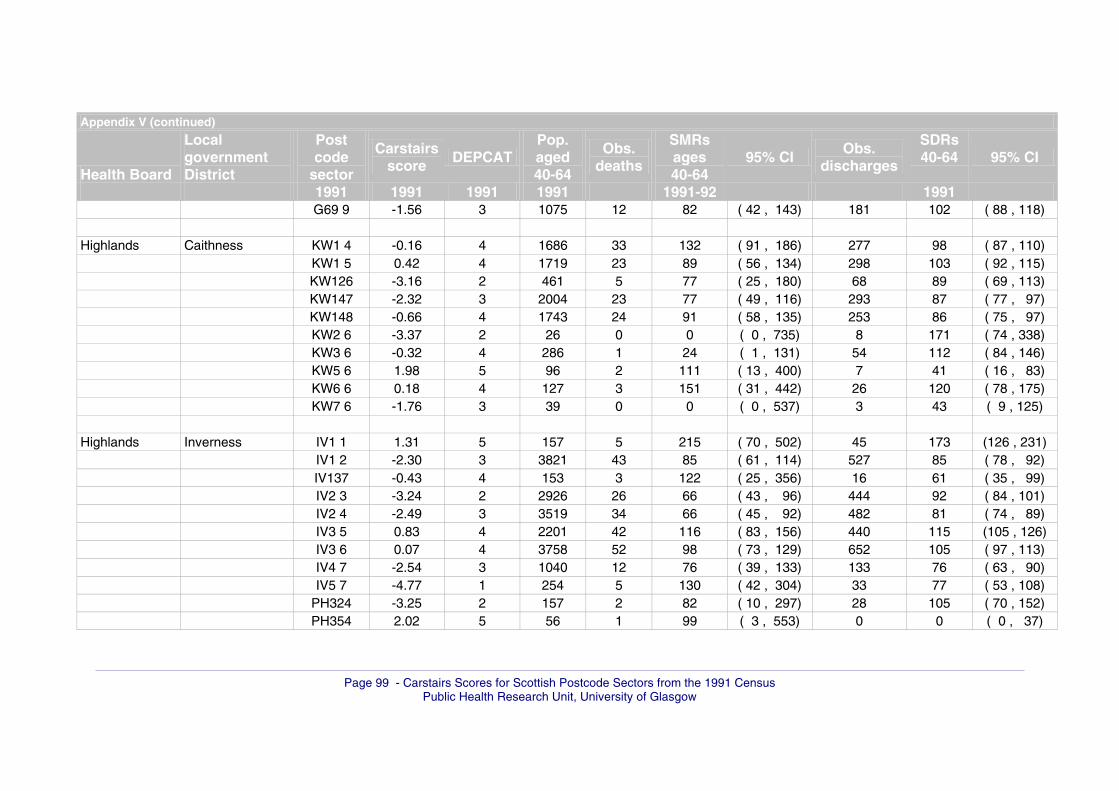
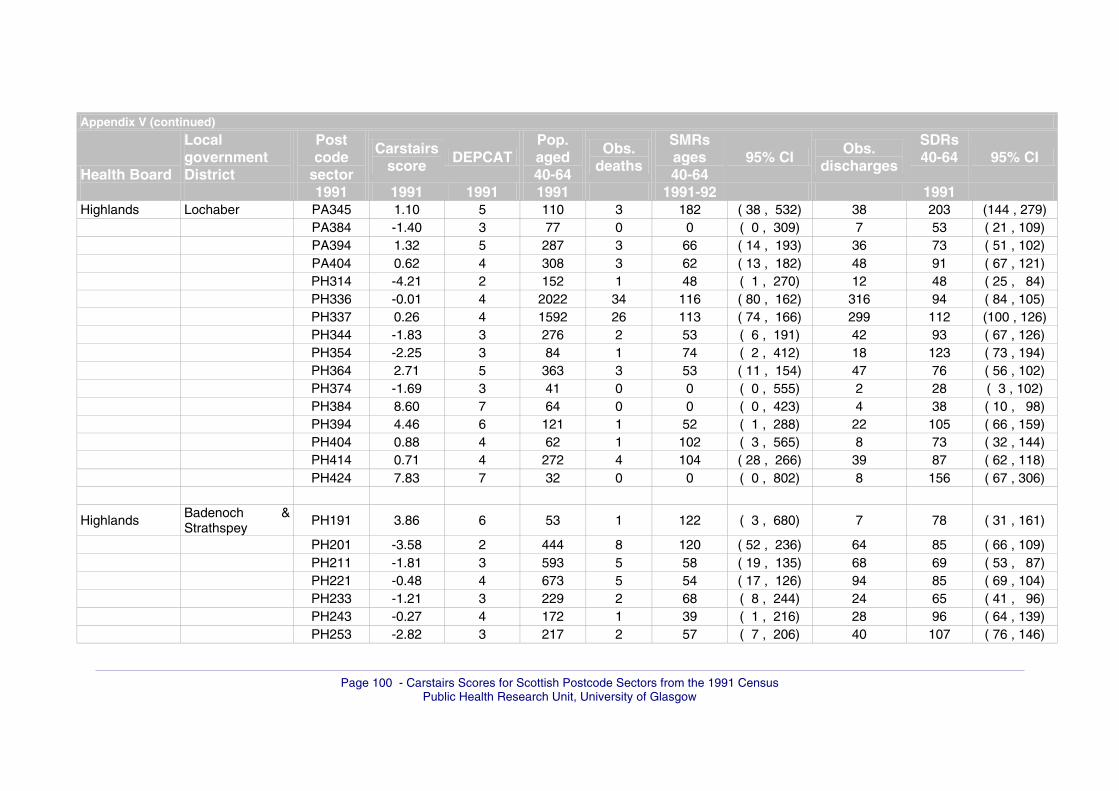
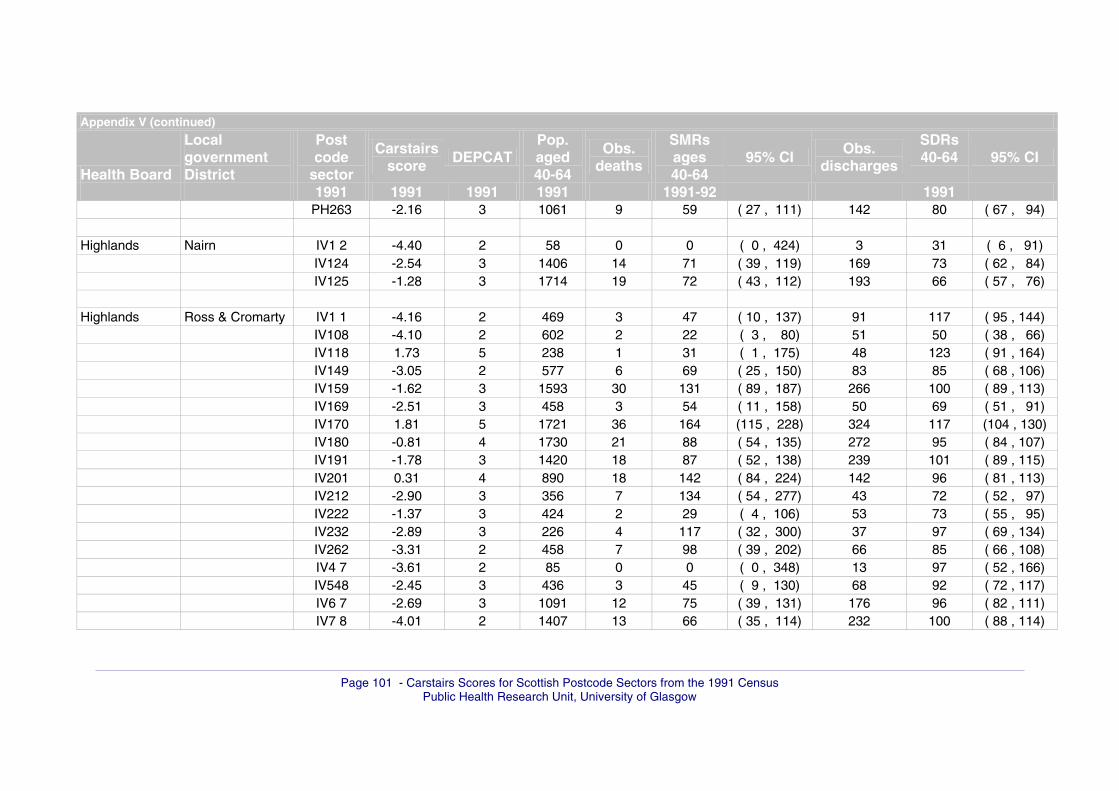
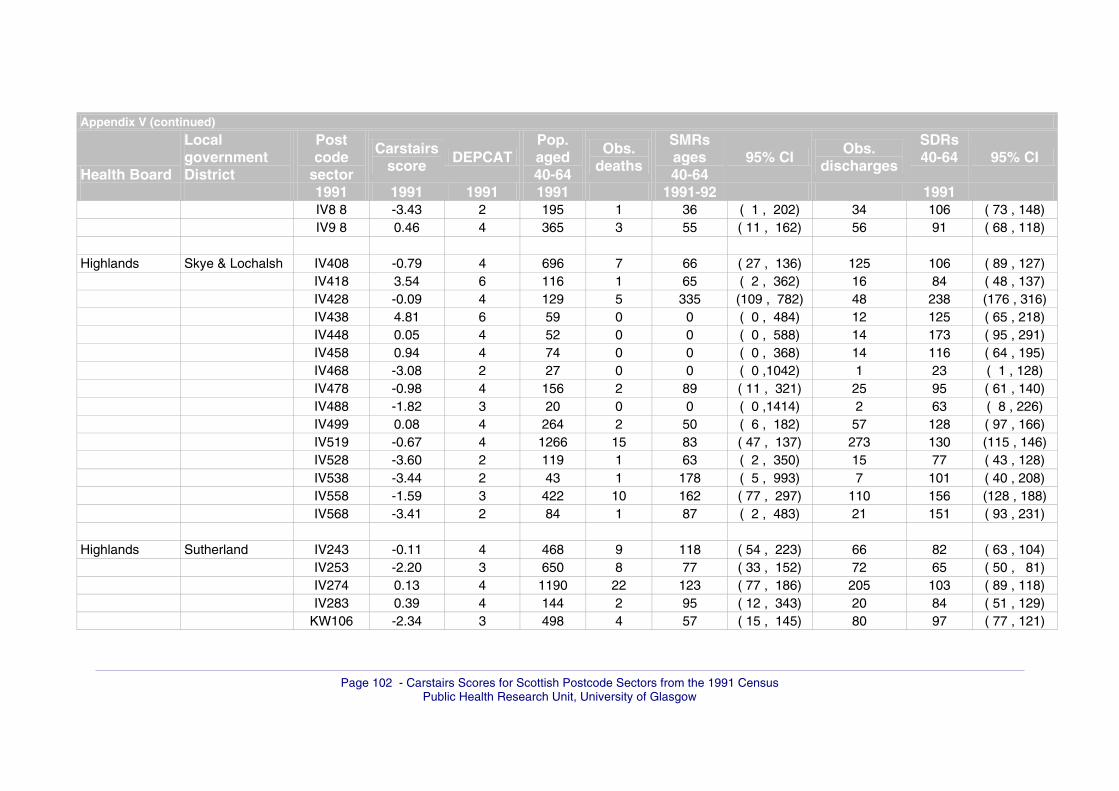
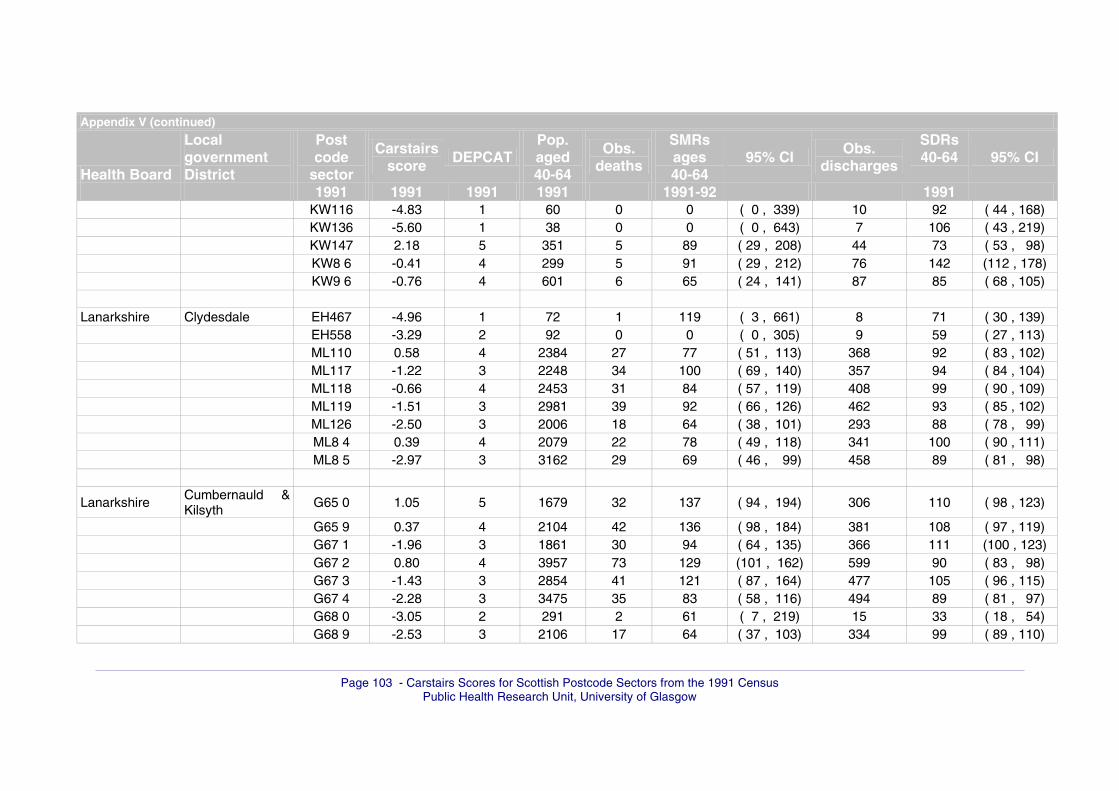
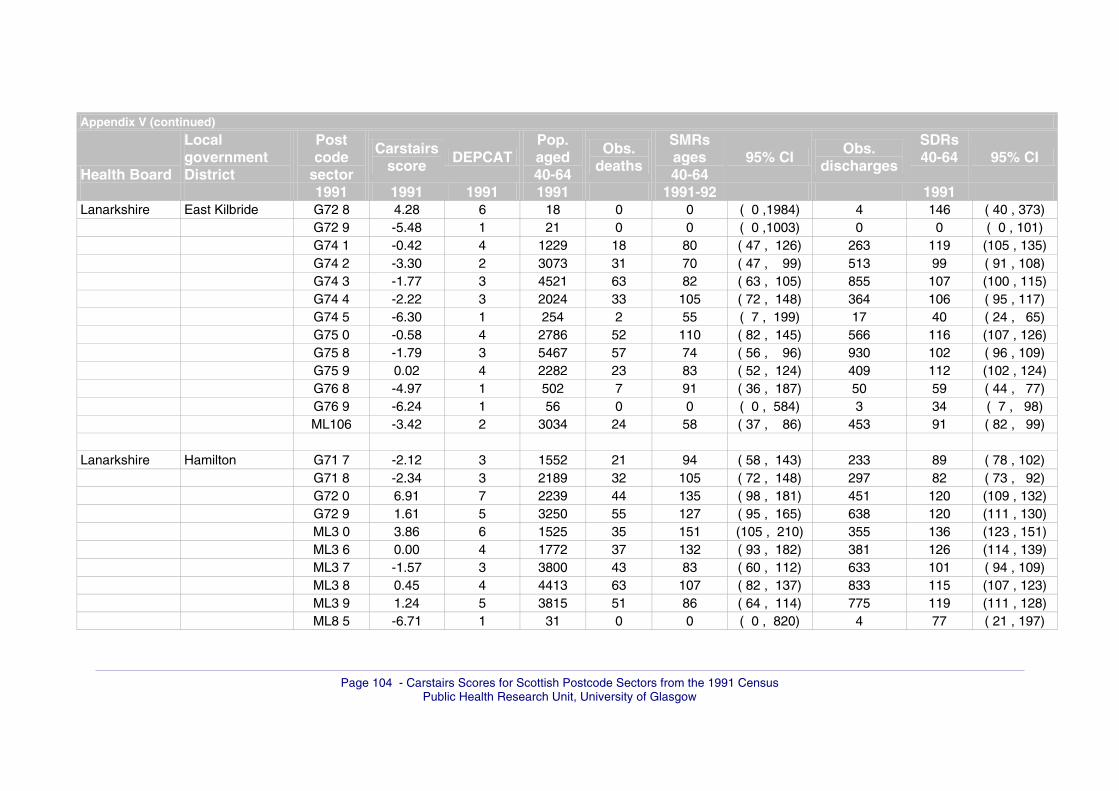
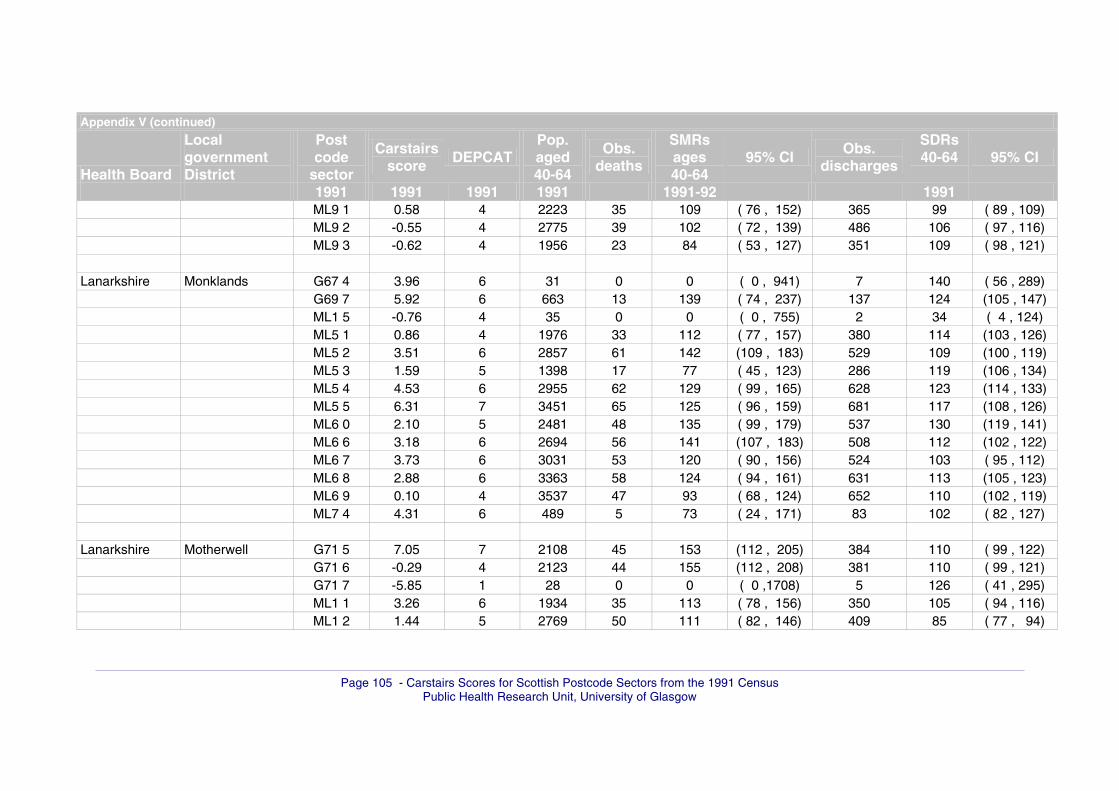
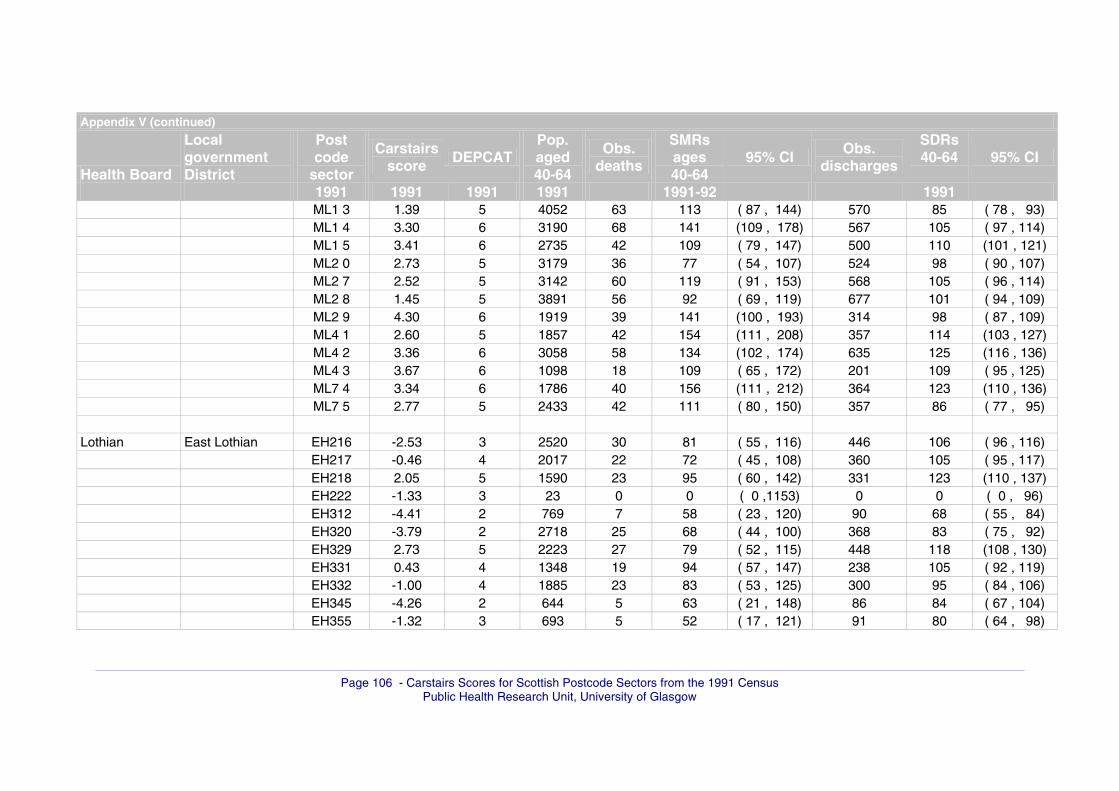
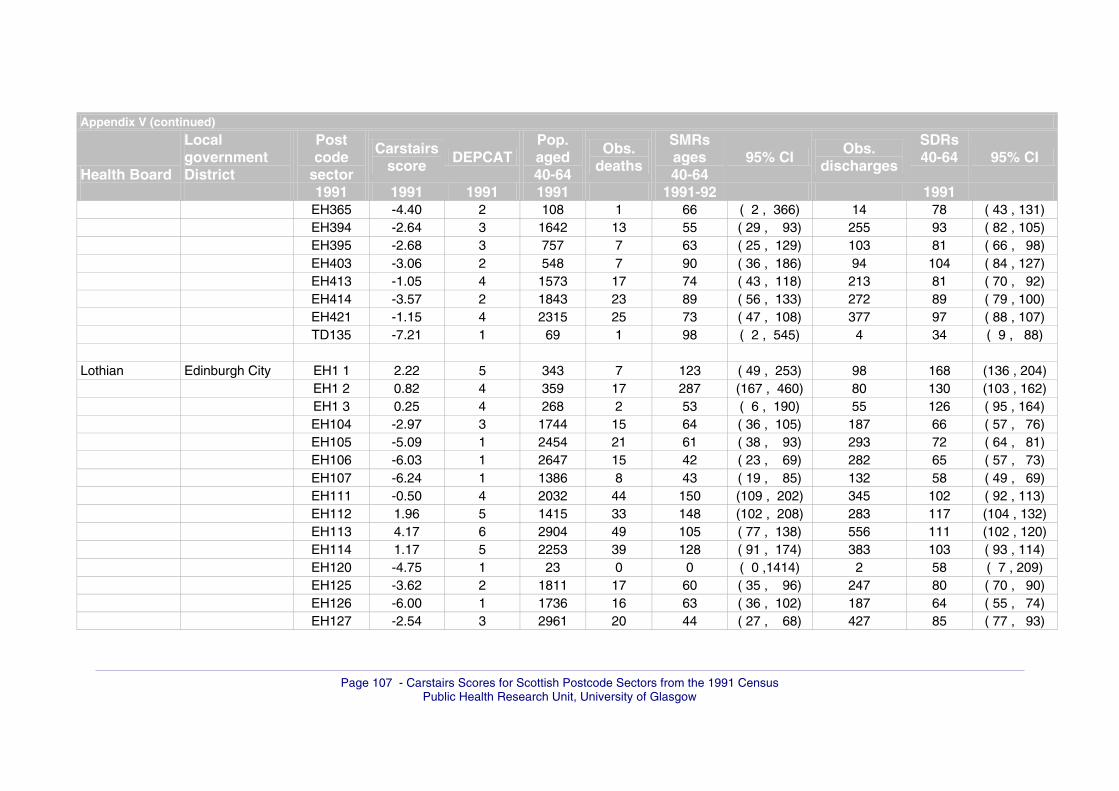
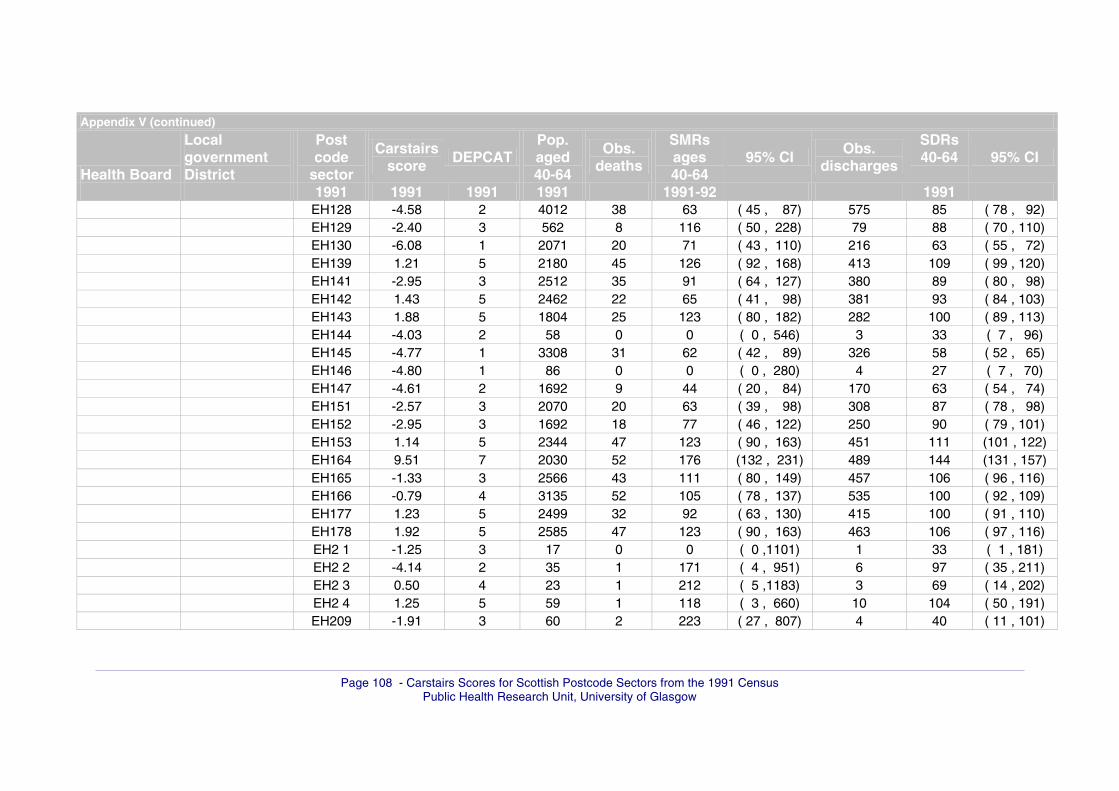
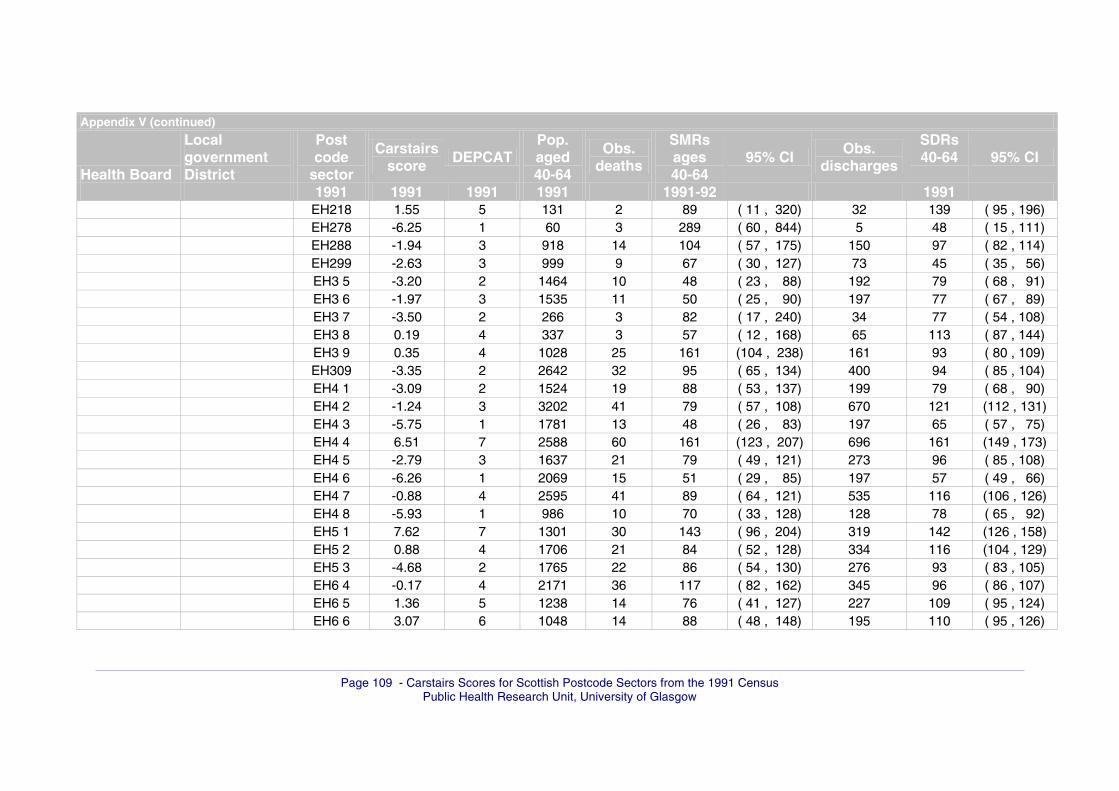
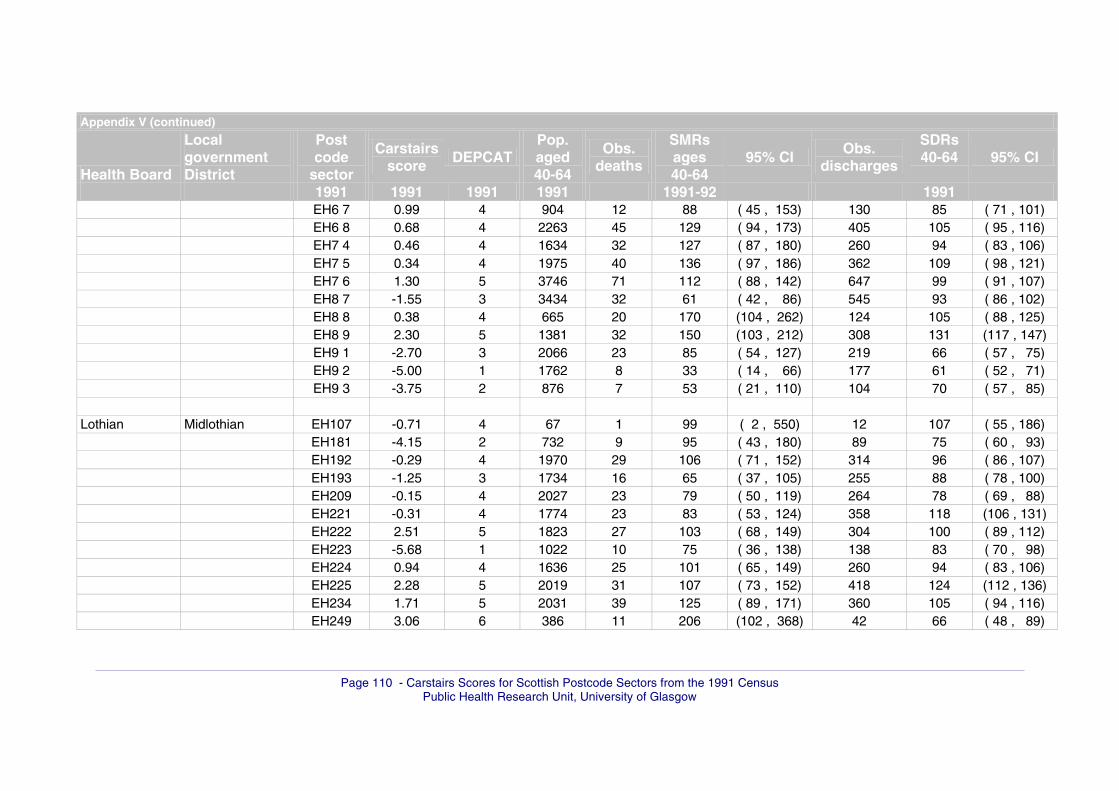
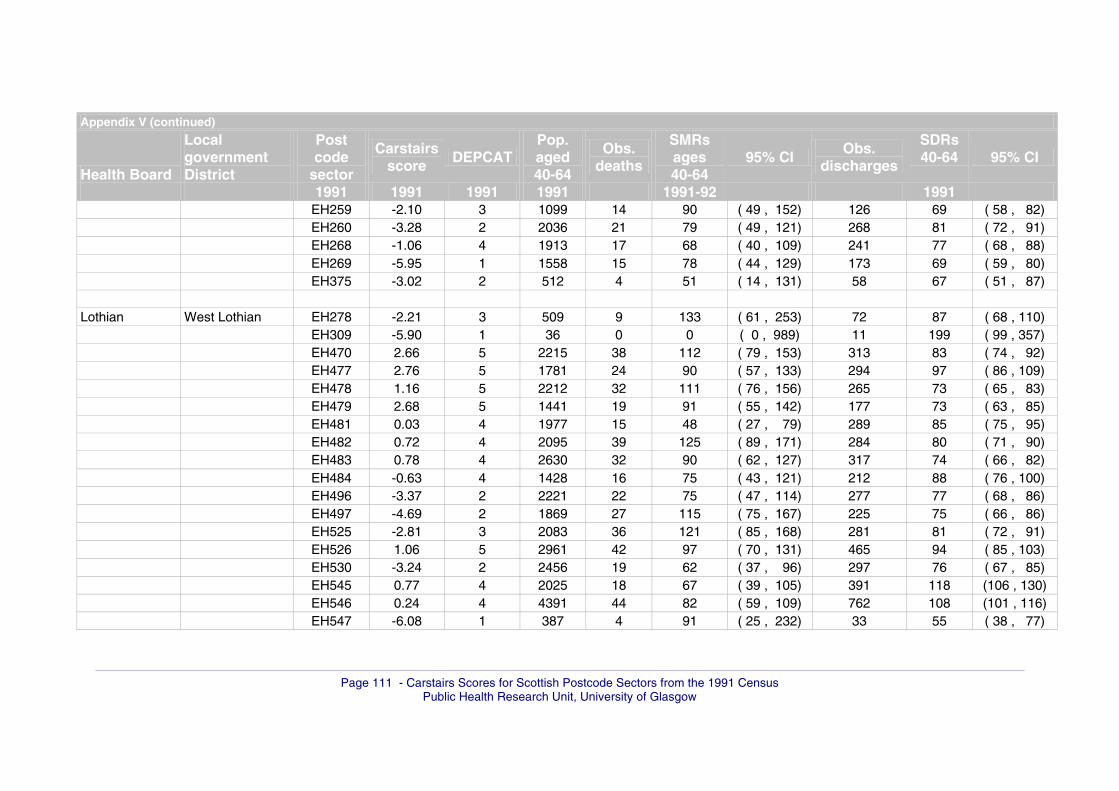
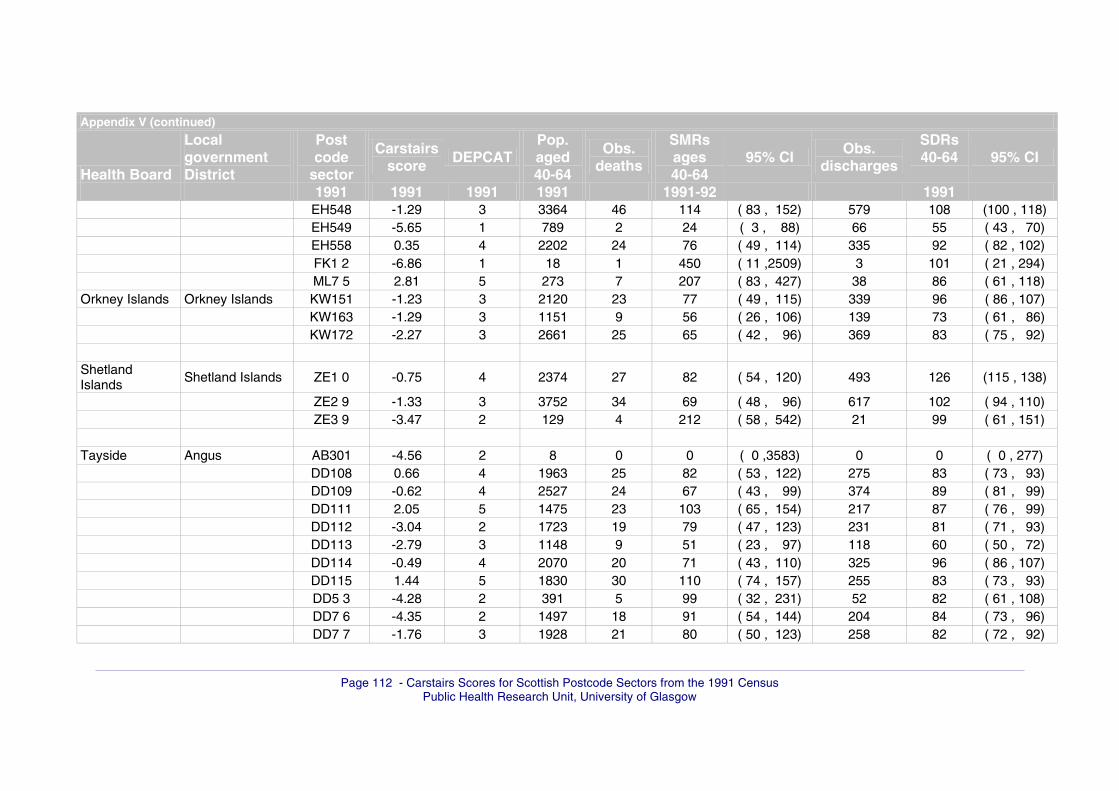
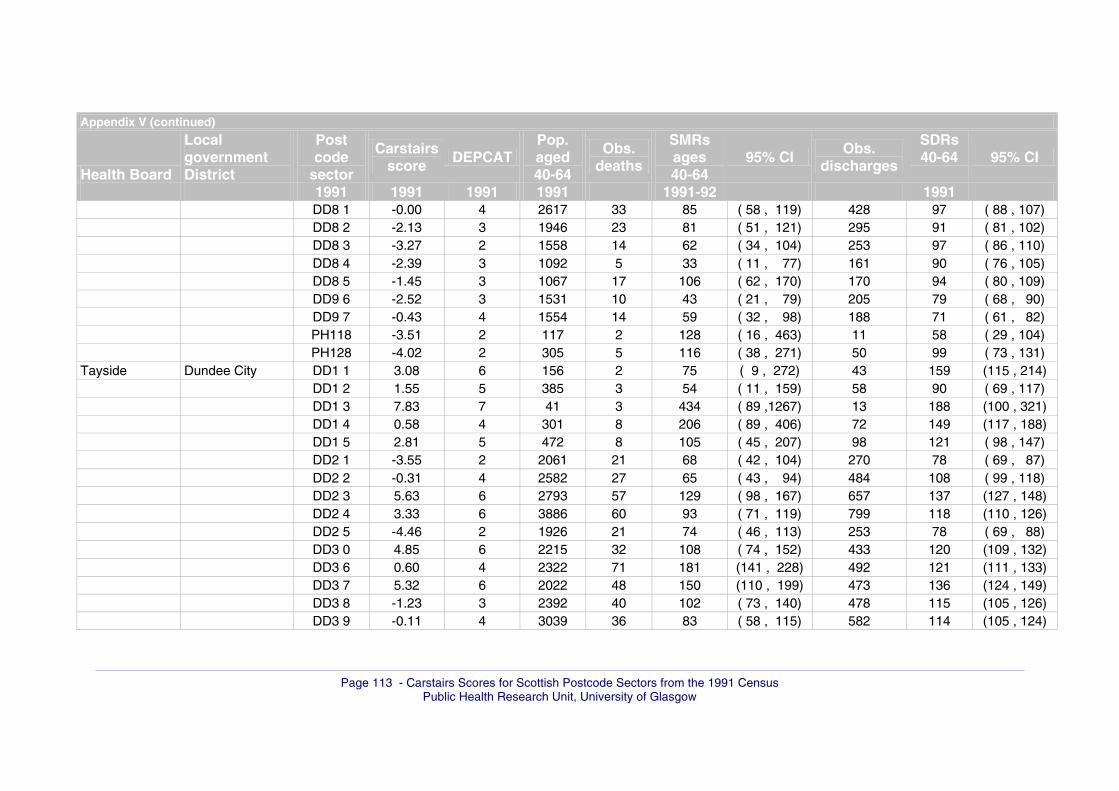
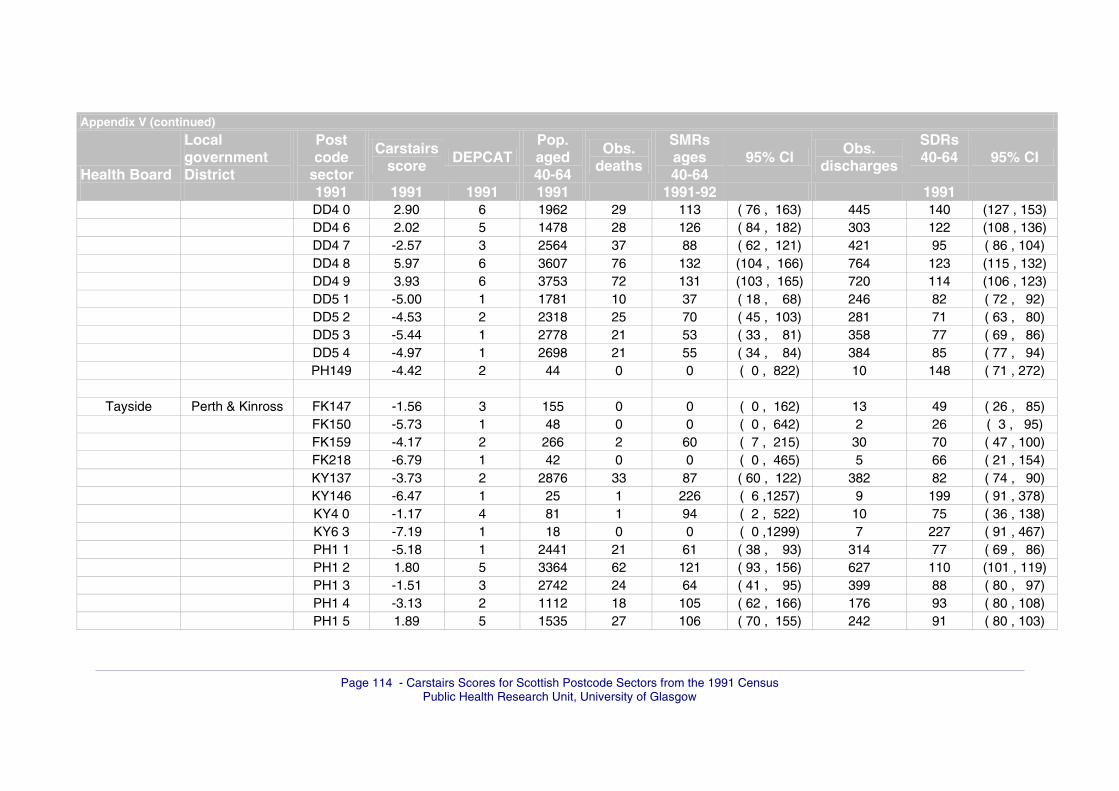
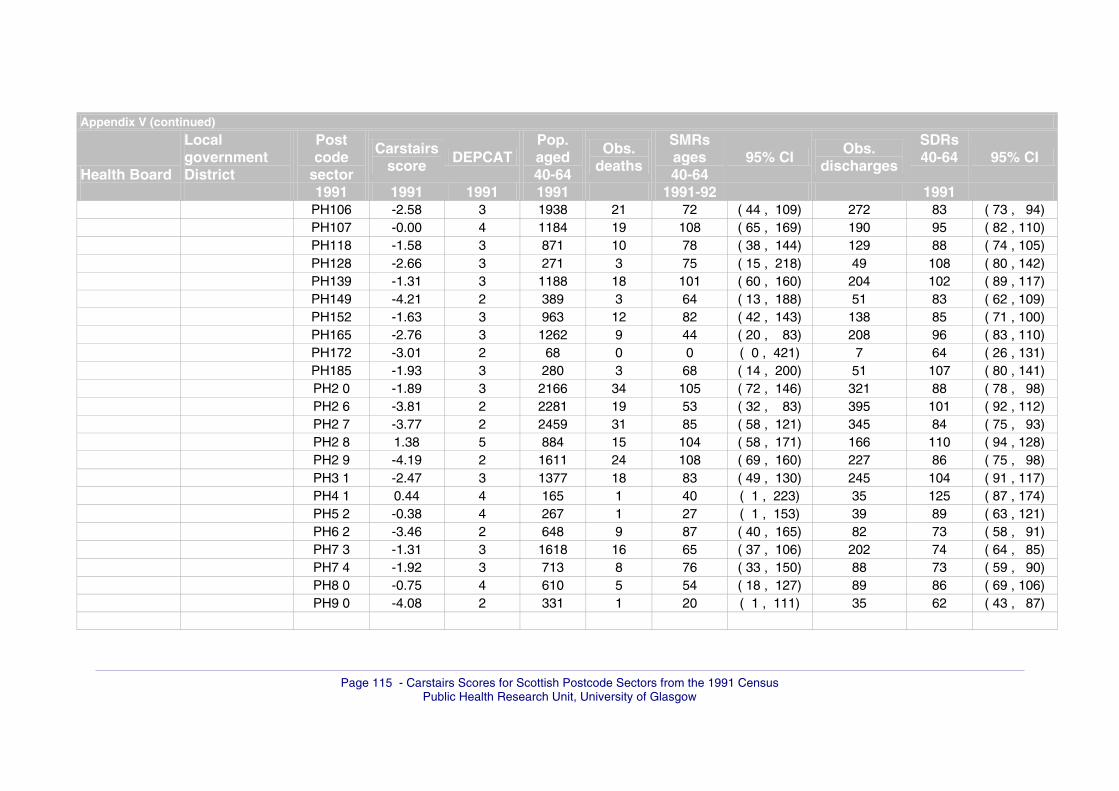
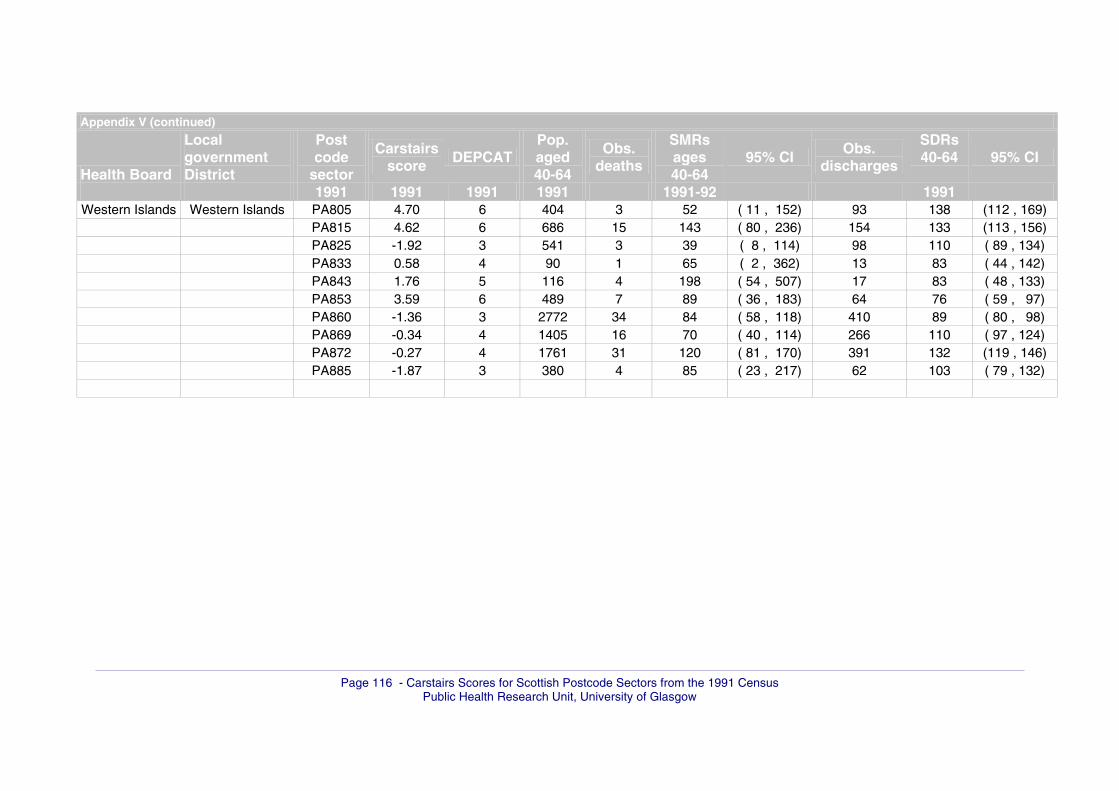
ASSOCIATIONS WITH MORTALITY & MORBIDITY All-cause standardised mortality ratios (SMRs) and all-cause standardised hospital discharge ratios (SDRs) for postcode sectors divided by Health Board and Local Government District, together with their 1991 Carstairs score and DEPCAT category, are listed in Appendix V.
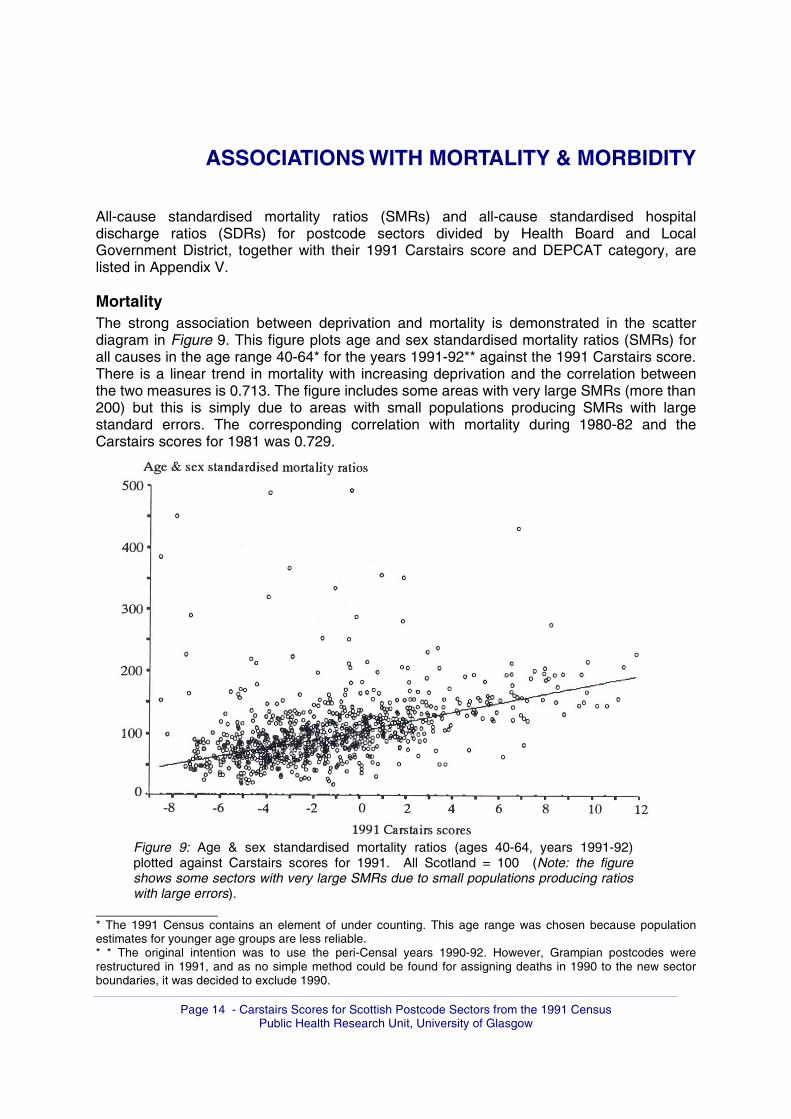
Mortality The strong association between deprivation and mortality is demonstrated in the scatter diagram in Figure 9. This figure plots age and sex standardised mortality ratios (SMRs) for all causes in the age range 40-64* for the years 1991-92** against the 1991 Carstairs score. There is a linear trend in mortality with increasing deprivation and the correlation between the two measures is 0.713. The figure includes some areas with very large SMRs (more than 200) but this is simply due to areas with small populations producing SMRs with large standard errors. The corresponding correlation with mortality during 1980-82 and the Carstairs scores for 1981 was 0.729.
Figure 9: Age & sex standardised mortality ratios (ages 40-64, years 1991-92) plotted against Carstairs scores for 1991. All Scotland = 100 (Note: the figure shows some sectors with very large SMRs due to small populations producing ratios with large errors).
_______________ * The 1991 Census contains an element of under counting. This age range was chosen because population estimates for younger age groups are less reliable. * * The original intention was to use the peri-Censal years 1990-92. However, Grampian postcodes were restructured in 1991, and as no simple method could be found for assigning deaths in 1990 to the new sector boundaries, it was decided to exclude 1990.
Page 18
Page 15 - Carstairs Scores for Scottish Postcode Sectors from the 1991 Census
Public Health Research Unit, University of Glasgow
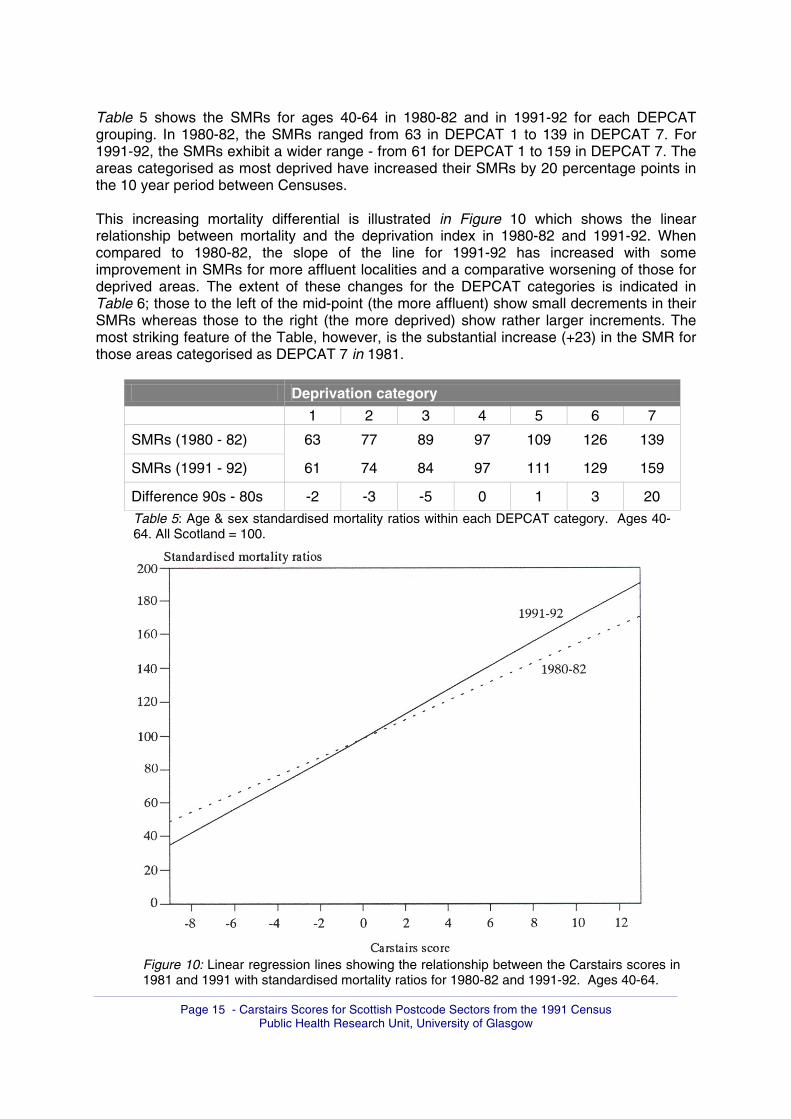
Table 5 shows the SMRs for ages 40-64 in 1980-82 and in 1991-92 for each DEPCAT grouping. In 1980-82, the SMRs ranged from 63 in DEPCAT 1 to 139 in DEPCAT 7. For 1991-92, the SMRs exhibit a wider range - from 61 for DEPCAT 1 to 159 in DEPCAT 7. The areas categorised as most deprived have increased their SMRs by 20 percentage points in the 10 year period between Censuses. This increasing mortality differential is illustrated in Figure 10 which shows the linear relationship between mortality and the deprivation index in 1980-82 and 1991-92. When compared to 1980-82, the slope of the line for 1991-92 has increased with some improvement in SMRs for more affluent localities and a comparative worsening of those for deprived areas. The extent of these changes for the DEPCAT categories is indicated in Table 6; those to the left of the mid-point (the more affluent) show small decrements in their SMRs whereas those to the right (the more deprived) show rather larger increments. The most striking feature of the Table, however, is the substantial increase (+23) in the SMR for those areas categorised as DEPCAT 7 in 1981.
Deprivation category
1 2 3 4 5 6 7
SMRs (1980 - 82) 63 77 89 97 109 126 139
SMRs (1991 - 92) 61 74 84 97 111 129 159
Difference 90s - 80s -2 -3 -5 0 1 3 20
Table 5: Age & sex standardised mortality ratios within each DEPCAT category. Ages 40-64. All Scotland = 100.
Figure 10: Linear regression lines showing the relationship between the Carstairs scores in 1981 and 1991 with standardised mortality ratios for 1980-82 and 1991-92. Ages 40-64.
Page 19
Page 16 - Carstairs Scores for Scottish Postcode Sectors from the 1991 Census
Public Health Research Unit, University of Glasgow
Deprivation category in 1981
1 2 3 4 5 6 7
Difference in SMRs (1990s-1980s) -1 -2 -3 1 6 8 23
Table 6: Difference in age & sex standardised mortality ratios (1991-92 minus 1980-82) within each DEPCAT grouping as classified in 1981 for ages 40-64.
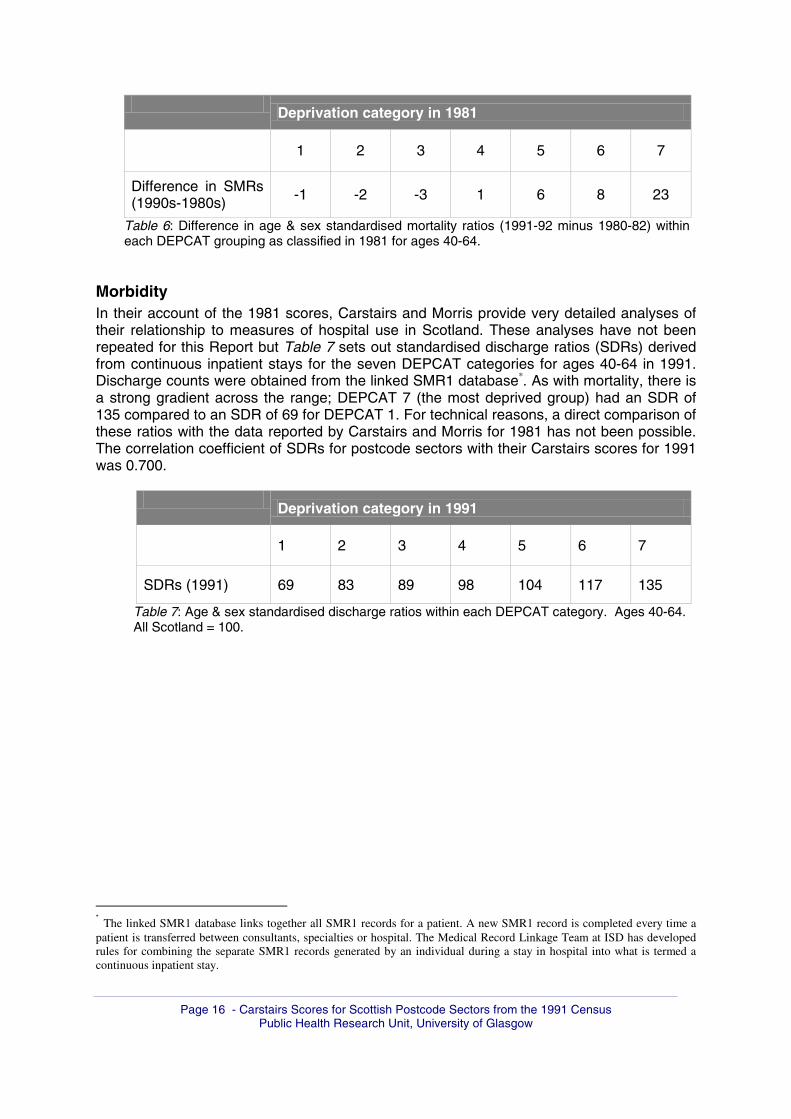
Morbidity In their account of the 1981 scores, Carstairs and Morris provide very detailed analyses of their relationship to measures of hospital use in Scotland. These analyses have not been repeated for this Report but Table 7 sets out standardised discharge ratios (SDRs) derived from continuous inpatient stays for the seven DEPCAT categories for ages 40-64 in 1991. Discharge counts were obtained from the linked SMR1 database*. As with mortality, there is a strong gradient across the range; DEPCAT 7 (the most deprived group) had an SDR of 135 compared to an SDR of 69 for DEPCAT 1. For technical reasons, a direct comparison of these ratios with the data reported by Carstairs and Morris for 1981 has not been possible. The correlation coefficient of SDRs for postcode sectors with their Carstairs scores for 1991 was 0.700.
Deprivation category in 1991
1 2 3 4 5 6 7
SDRs (1991) 69 83 89 98 104 117 135
Table 7: Age & sex standardised discharge ratios within each DEPCAT category. Ages 40-64. All Scotland = 100.
* The linked SMR1 database links together all SMR1 records for a patient. A new SMR1 record is completed every time a patient is transferred between consultants, specialties or hospital. The Medical Record Linkage Team at ISD has developed rules for combining the separate SMR1 records generated by an individual during a stay in hospital into what is termed a continuous inpatient stay.
Page 20
Page 17 - Carstairs Scores for Scottish Postcode Sectors from the 1991 Census
Public Health Research Unit, University of Glasgow
CONCLUSION The Carstairs scores in this Report provide a relative measure of deprivation or affluence when this is judged on the basis of a combination of selected Census variables standardised to their mean for Scotland. The score for a particular postcode sector is thus a summary measure of its socio-economic status relative to the average for Scotland as a whole. It is important to appreciate that they refer to the populations of the postcode sectors and that they are based on the proportions of individuals within them who have reported a particular attribute at the time of the Census. Scores based on the 1991 Census are essentially the same as the scores from the 1981 Census. However, the relative ranking they produce has changed and this has resulted in some postcode sectors changing DEPCAT category. This is partly due to the poor robustness of the scores. The scores have been constructed in the same way as the 1981 scores and, as in 1981, there is a good measure of correlation between the component variables. Although the definition of overcrowding changed between the two Censuses, the correlation between this variable and the other variables remains high. A difference between the two years, however, is that the correlation between the proportions in social classes 4 and 5 with other variables is less in 1991 than in 1981. This change could reflect the changing validity of this occupational classification as a measure of socio-economic status. Any classification of this kind depends on the nature of the data from which it is constructed. In the case of the Carstairs scores, it is important to keep in mind that, although they reflect the socio-economic characteristics of localities, there are other features of small areas - such as their demography and urban/rural differences - that are also important for health planning. Because the scores employ the proportions of people with a particular attribute within a population, the question of the heterogeneity or homogeneity of these populations is an important one. Urban localities are probably more homogeneous than rural areas and so the fact that rural postcode sectors are more likely to have middle-range scores does not necessarily mean that their populations can be regarded simply as "average". The size of postcode sectors varies considerably and, as Figure 5 demonstrates, the scores for those with small populations can have large standard deviations; this observation has implications for their rankings. Simple interpretations of the change in scores between 1981 and 1991 are not possible because of the way they are constructed. Comparisons of an alternative method of ranking, however, suggests that the socio-economic circumstances of localities at the "affluent" end of the range remained much the same when compared to the Scottish average and that there has been a deterioration of the relative circumstances of the most deprived areas in the decade between 1981 and 1991 (Figure 8). A similar worsening of standardised mortality ratios is observed, especially in DEPCAT7 where the SMR at ages 40-64 for those areas categorised as DEPCAT7 in 1981 has increased from 139 to 162. The linear regression lines in Figure 10 illustrate this increasing divergence across the range of postcode sectors.
Page 21
Page 18 - Carstairs Scores for Scottish Postcode Sectors from the 1991 Census
Public Health Research Unit, University of Glasgow
REFERENCES Bates J, Roberts M, Lowe S, Richards P. The factors affecting household car ownership. Gower Publishing Company Limited, London, 1981. Carstairs V, Morris R. Deprivation and health in Scotland. Aberdeen University Press, Aberdeen, 1991. McLoone P, Boddy FA. Categorising small geographical areas. Public Health Research Unit, 1992. SASPAC Manual vv. 1-2, London Research Centre and Local Government Management Board, London, 1992.
Page 22
Page 19 - Carstairs Scores for Scottish Postcode Sectors from the 1991 Census
Public Health Research Unit, University of Glasgow
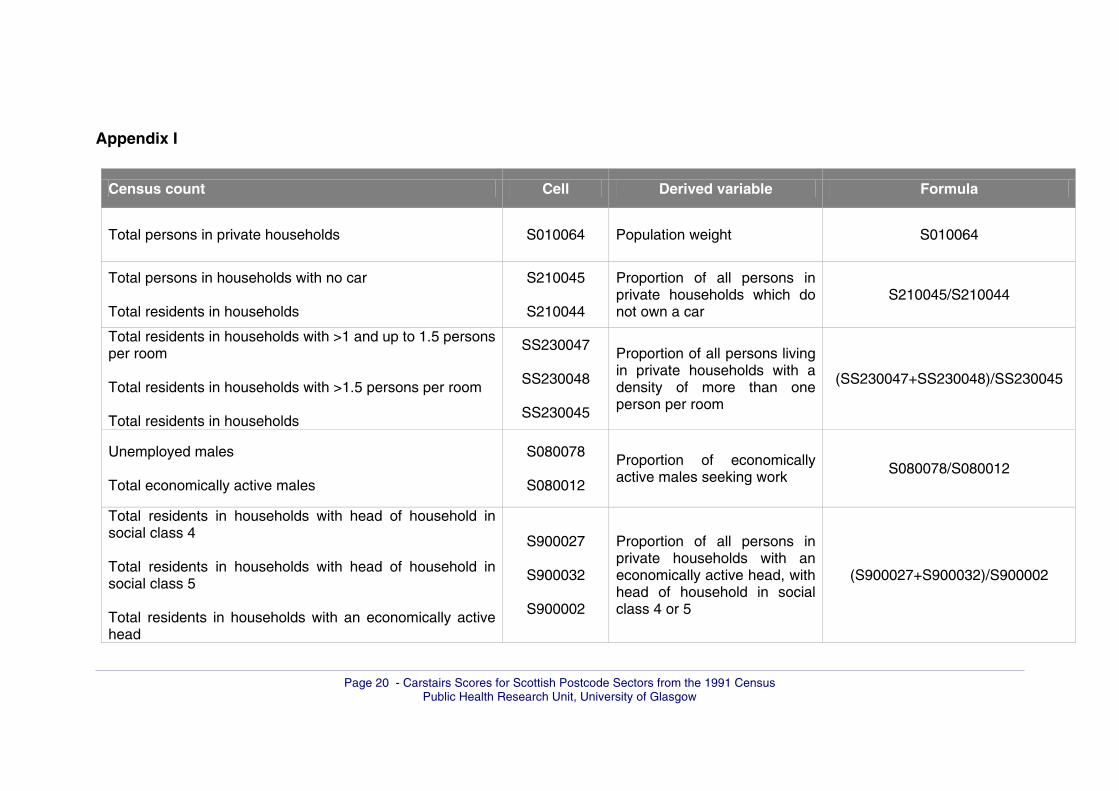
APPENDICES I Cells taken from the 1991 Small Area Statistics Tables to create the component17
variables used in the construction of the Carstairs score. II Values of each of the four component variables used to construct the 199118
Carstairs score, the derived scores, DEPCAT values and population counts for 1981 & 1991 for each postcode sector, indicating Local Government District and Health Board.
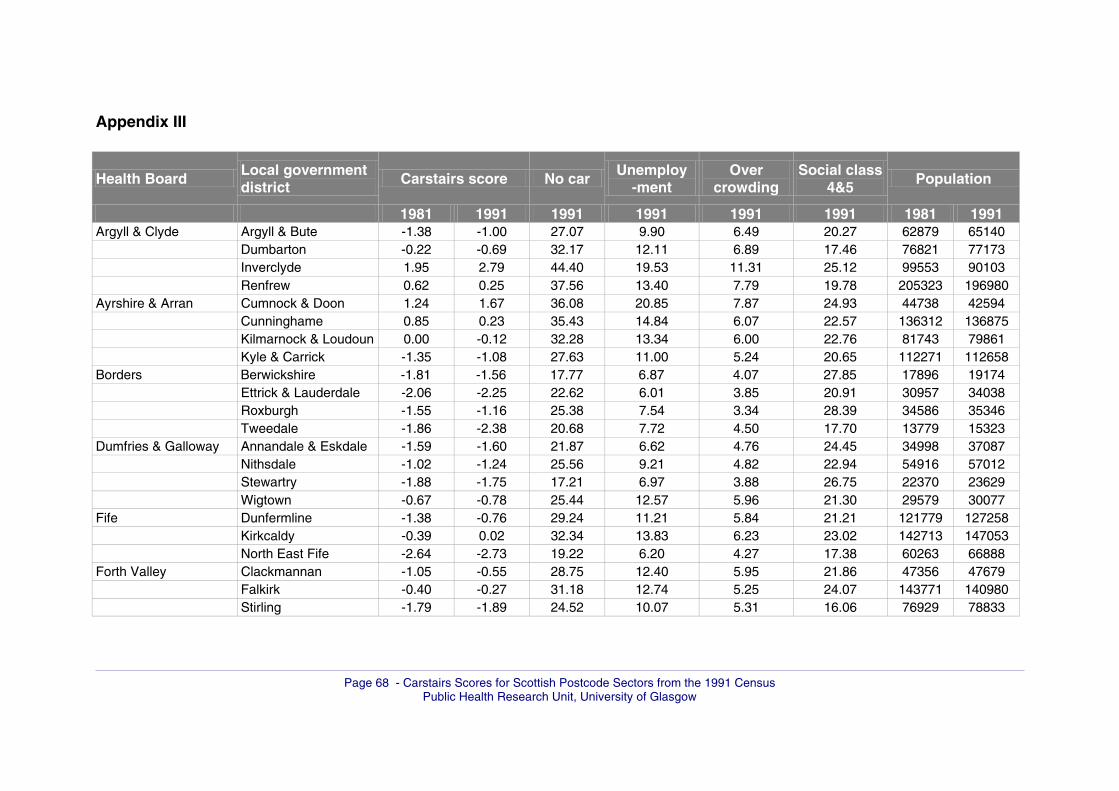
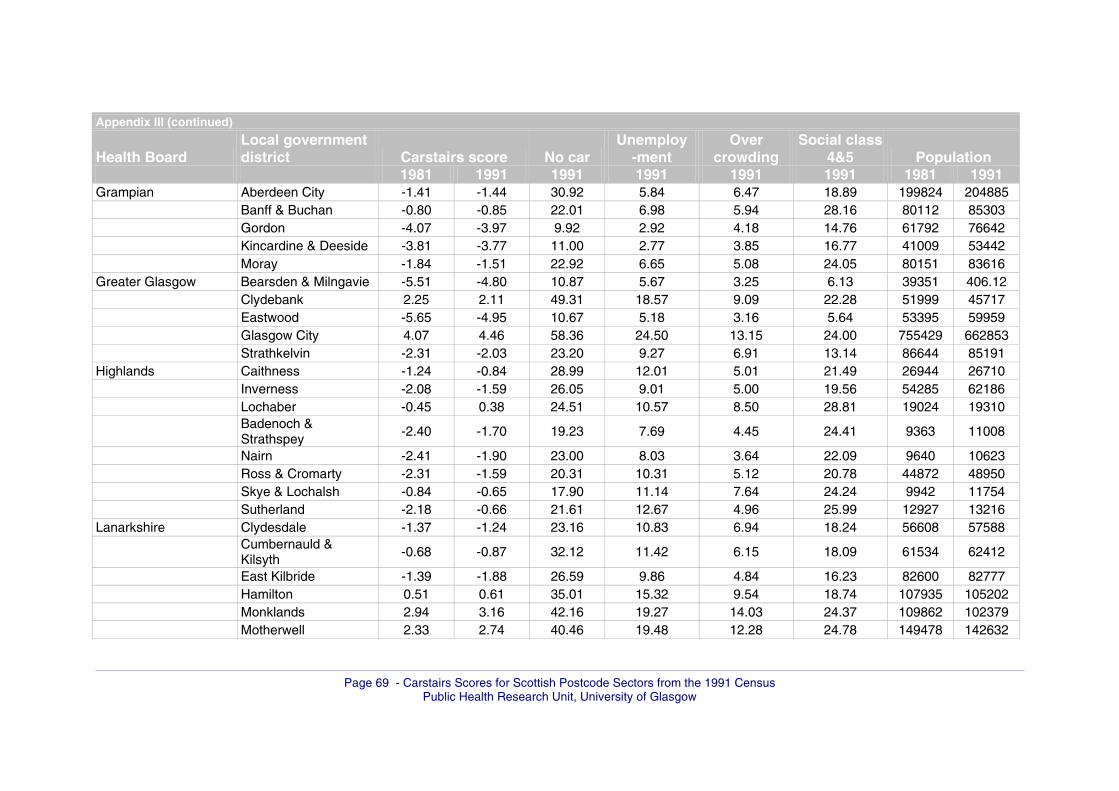
III Mean values of each of the four component variables used to construct the 1991 55
Carstairs score, mean deprivation scores and population counts for 1981 & 1991 for each Local Government District, indicating Health Board.
IV Mean values of each of the four component variables used to construct the 1991 57
Carstairs score, mean deprivation scores and population counts for 1981 & 1991 for each Health Board.
V 1991 Carstairs scores, DEPCAT values, observed deaths (1991-92) & hospital 58
discharges (1991) with standardised mortality & hospital discharge ratios showing 95% confidence intervals for each postcode sector, indicating Local Government District and Health Board.
Page 23
Page 20 - Carstairs Scores for Scottish Postcode Sectors from the 1991 Census
Public Health Research Unit, University of Glasgow
Appendix I
Census count Cell Derived variable Formula
Total persons in private households S010064 Population weight S010064
Total persons in households with no car Total residents in households
S210045
S210044
Proportion of all persons in private households which do not own a car
S210045/S210044
Total residents in households with >1 and up to 1.5 persons per room Total residents in households with >1.5 persons per room Total residents in households
SS230047
SS230048
SS230045
Proportion of all persons living in private households with a density of more than one person per room
(SS230047+SS230048)/SS230045
Unemployed males Total economically active males
S080078
S080012
Proportion of economically active males seeking work S080078/S080012
Total residents in households with head of household in social class 4 Total residents in households with head of household in social class 5 Total residents in households with an economically active head
S900027
S900032
S900002
Proportion of all persons in private households with an economically active head, with head of household in social class 4 or 5
(S900027+S900032)/S900002
Page 24
Page 21 - Carstairs Scores for Scottish Postcode Sectors from the 1991 Census
Public Health Research Unit, University of Glasgow
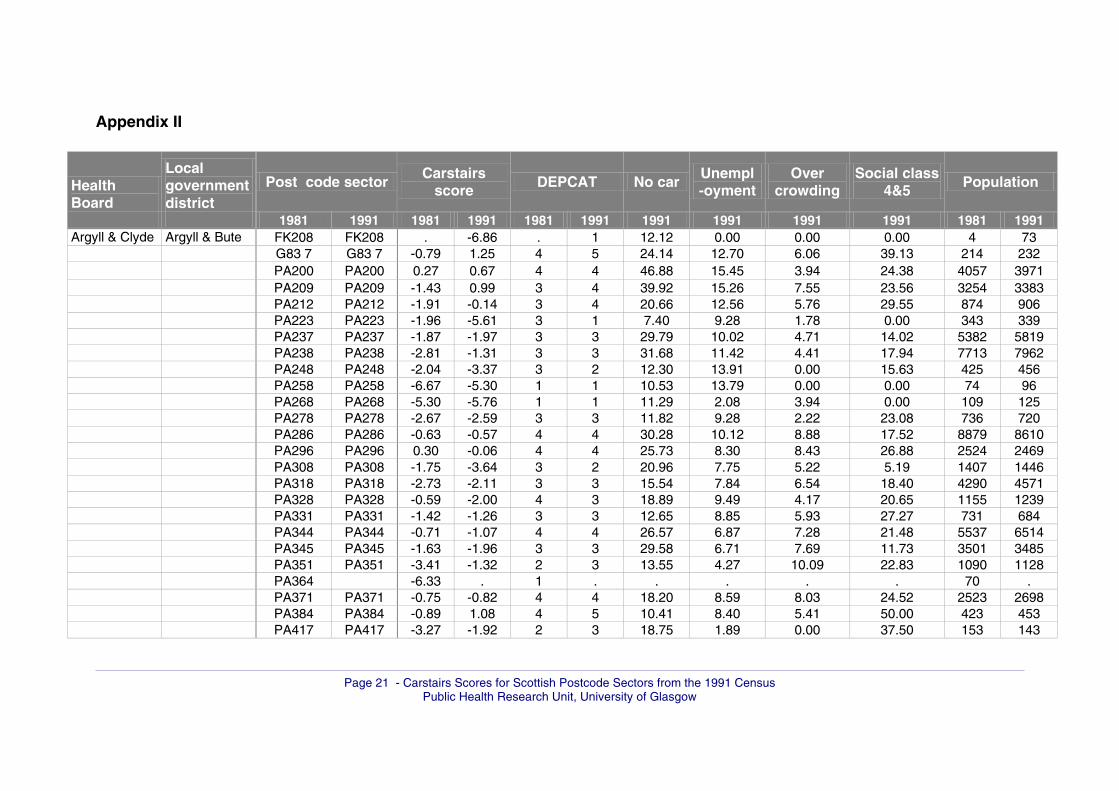
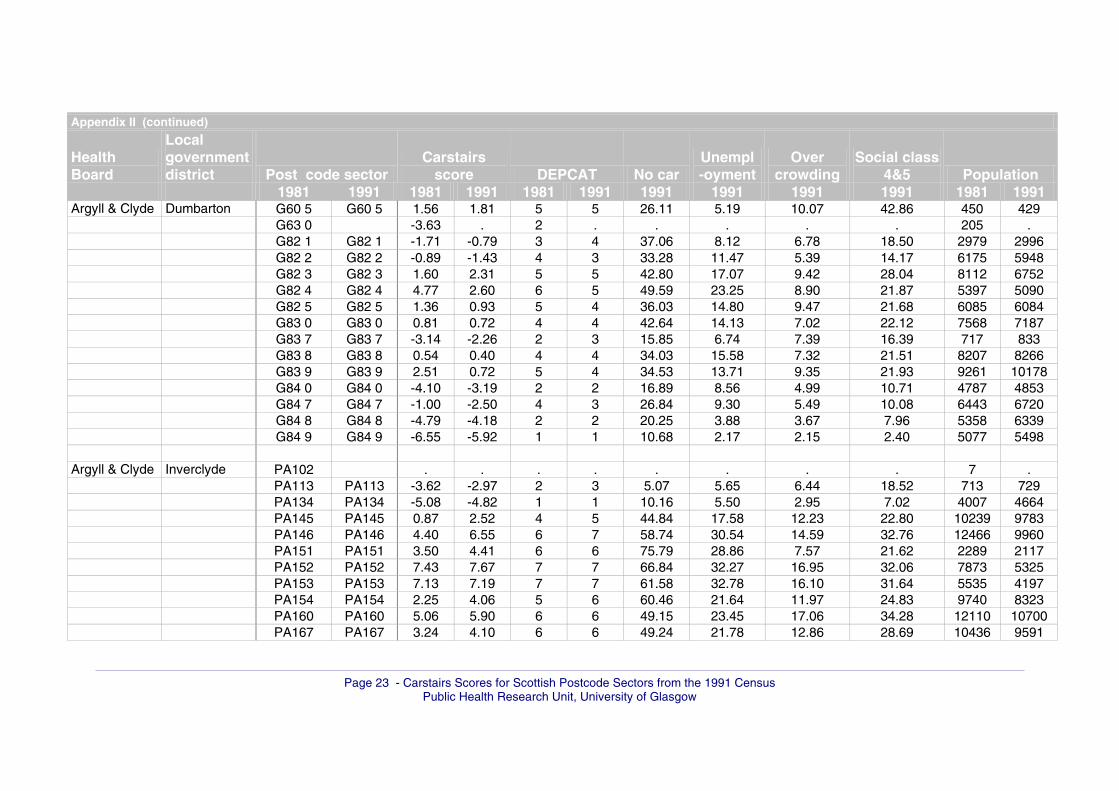
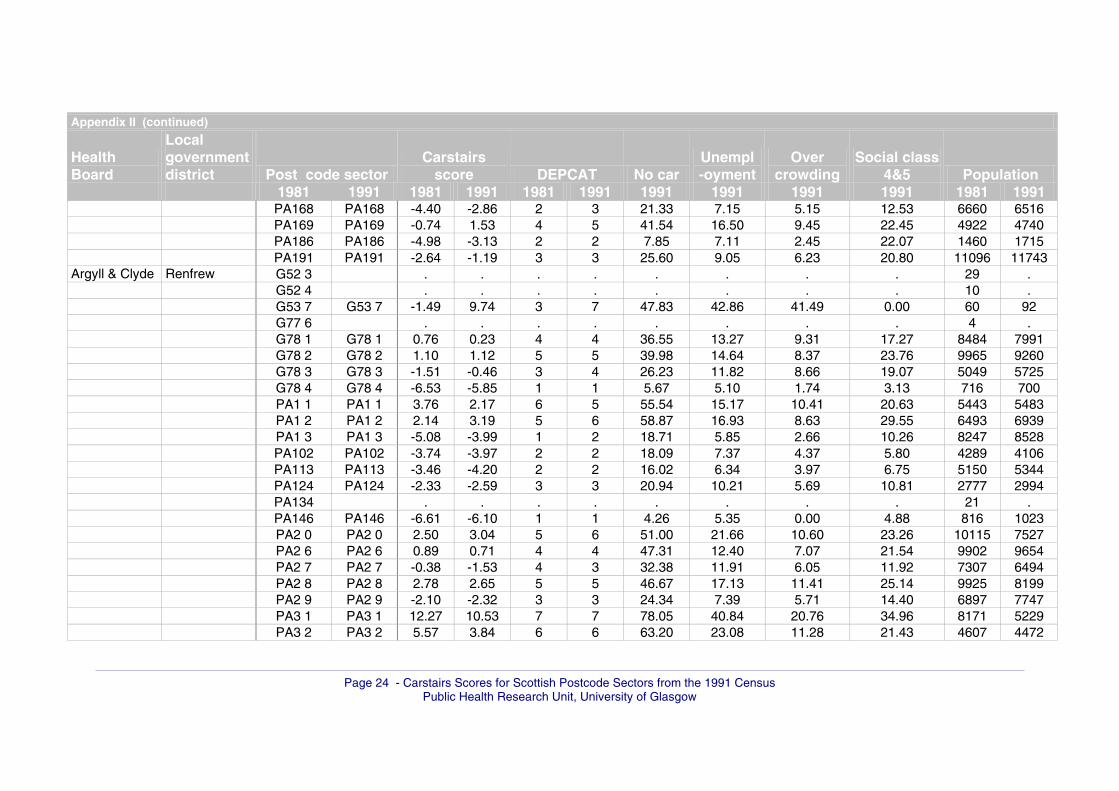
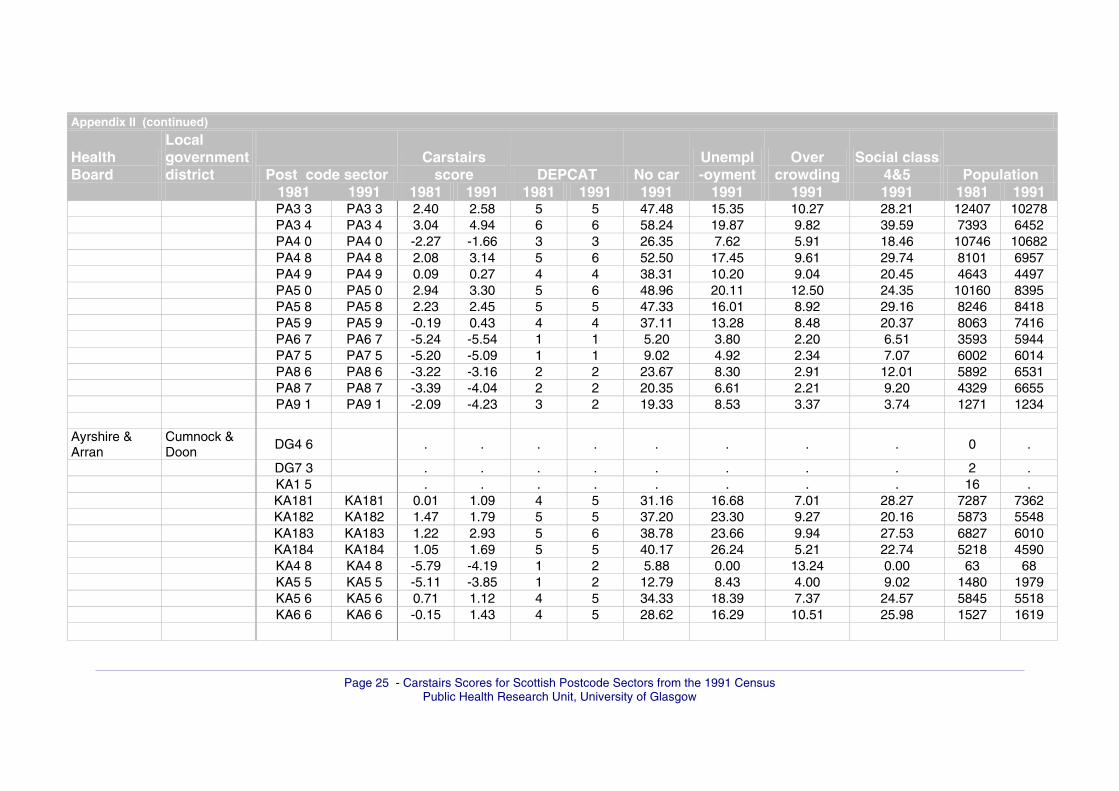
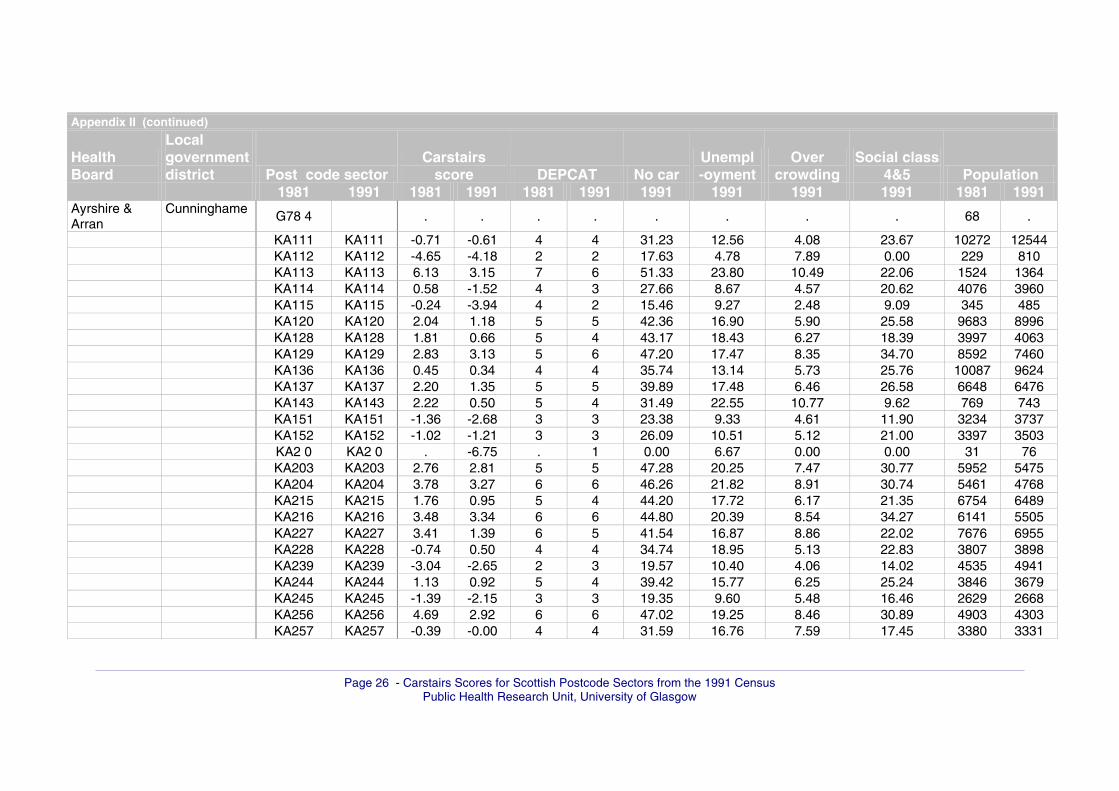
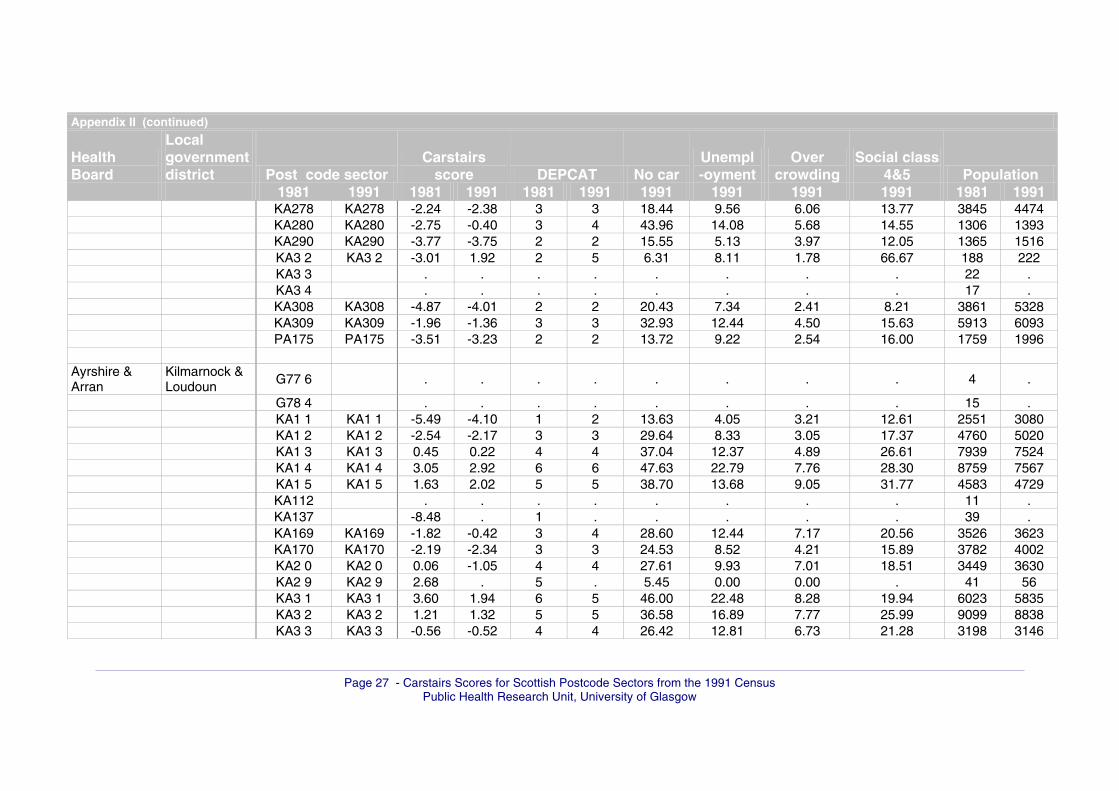
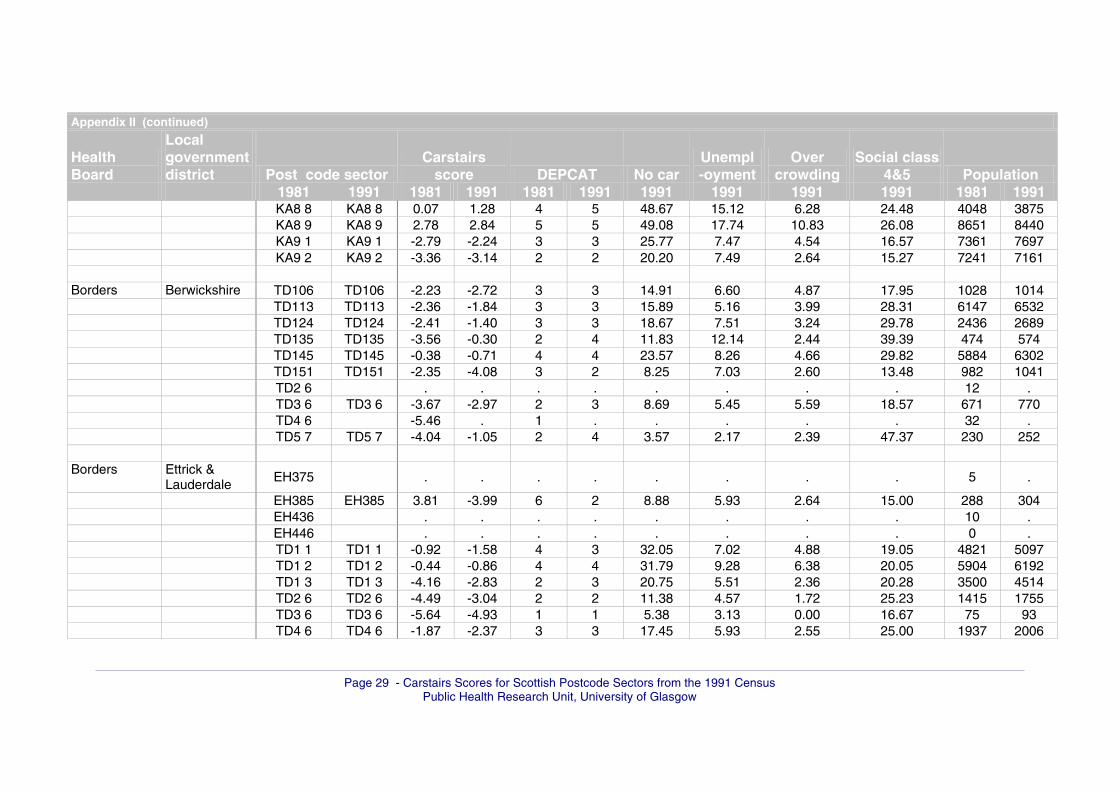
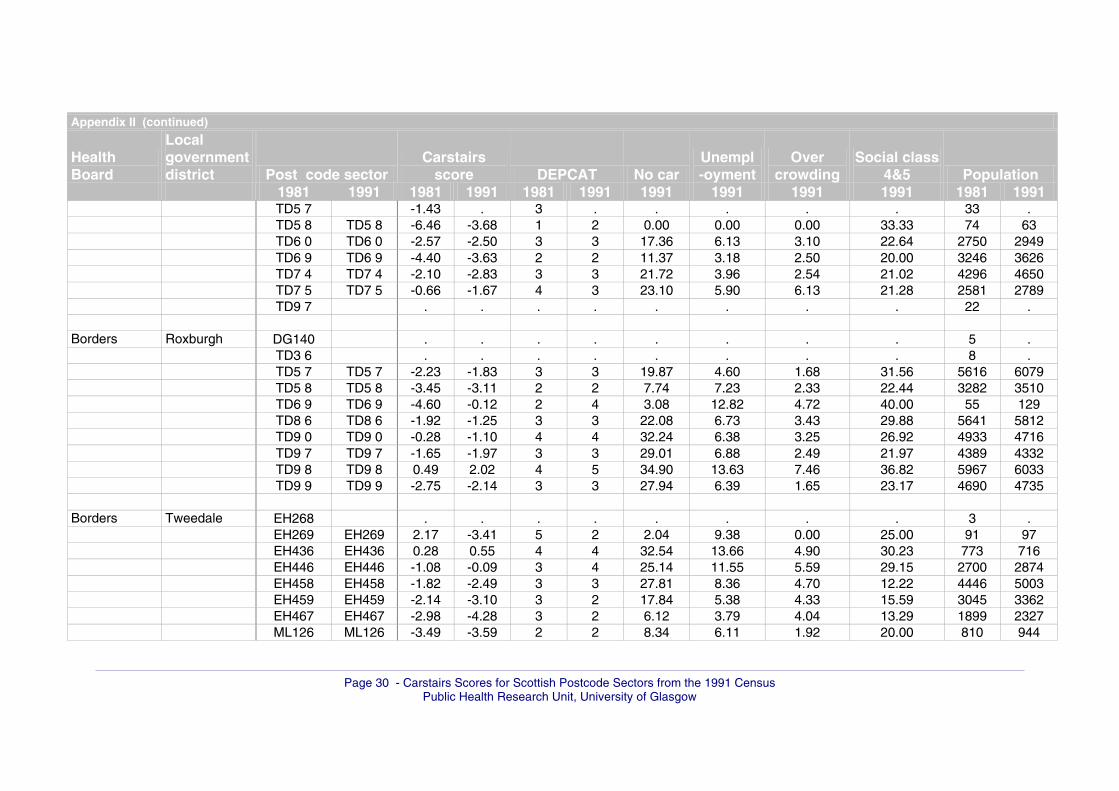
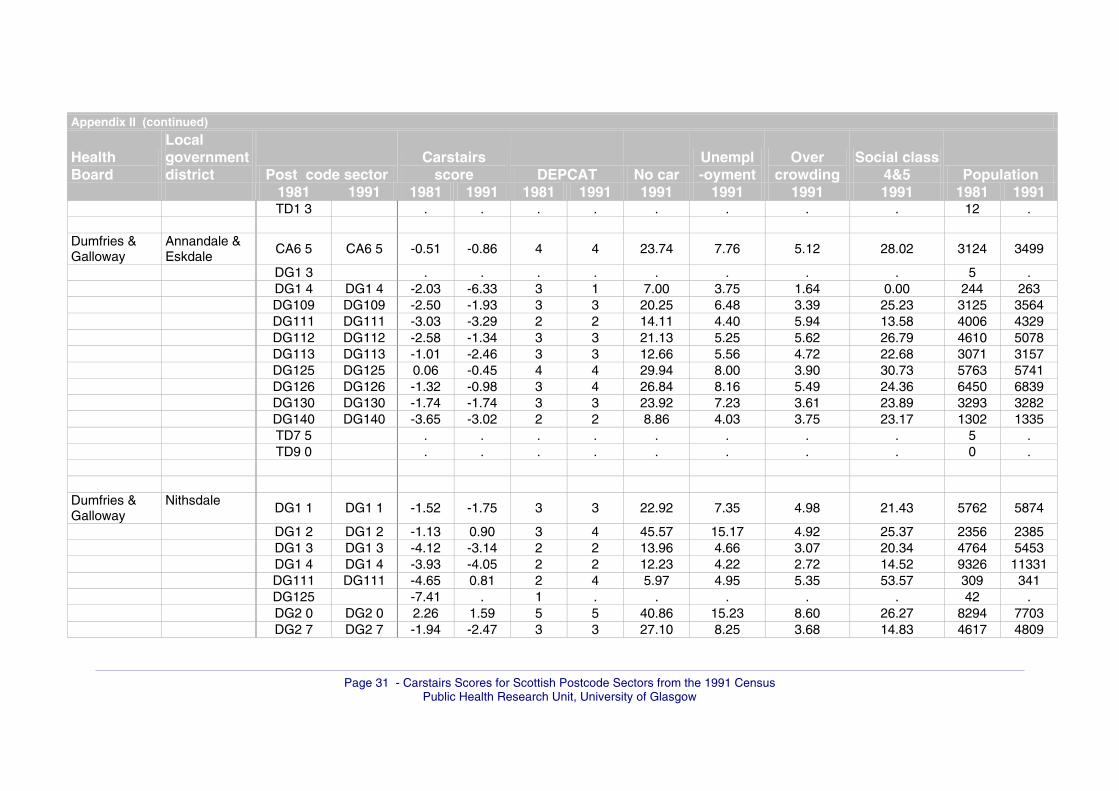
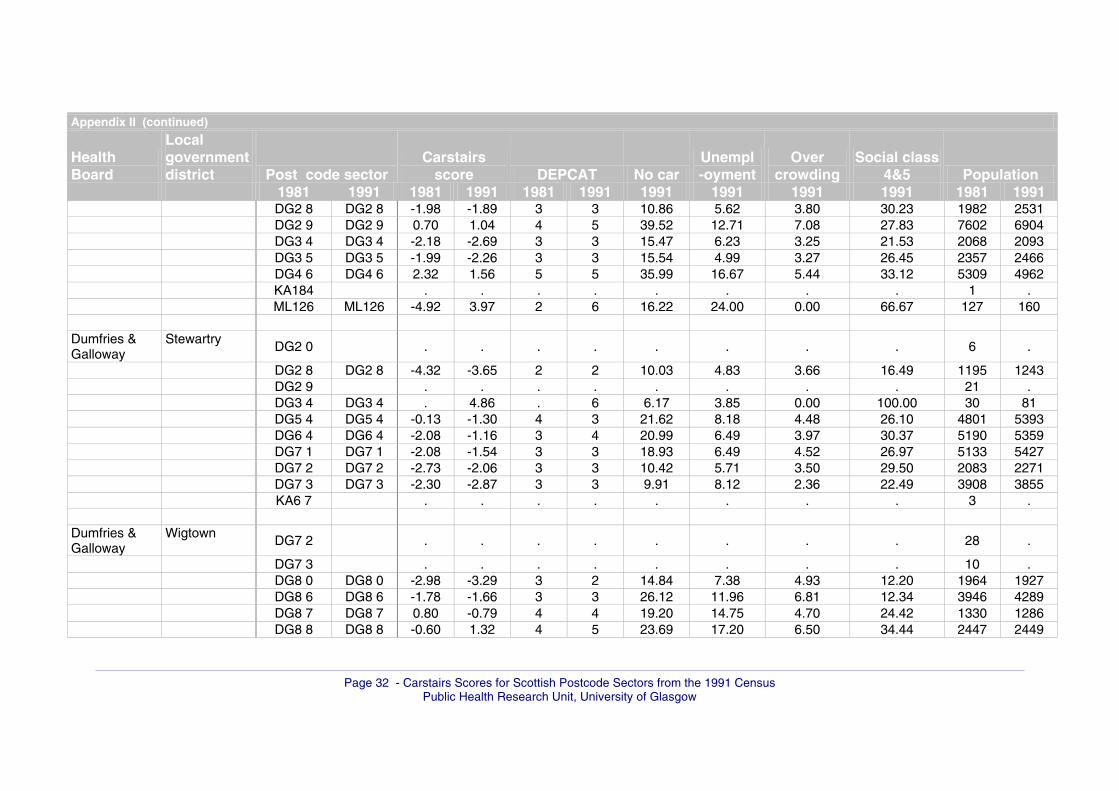
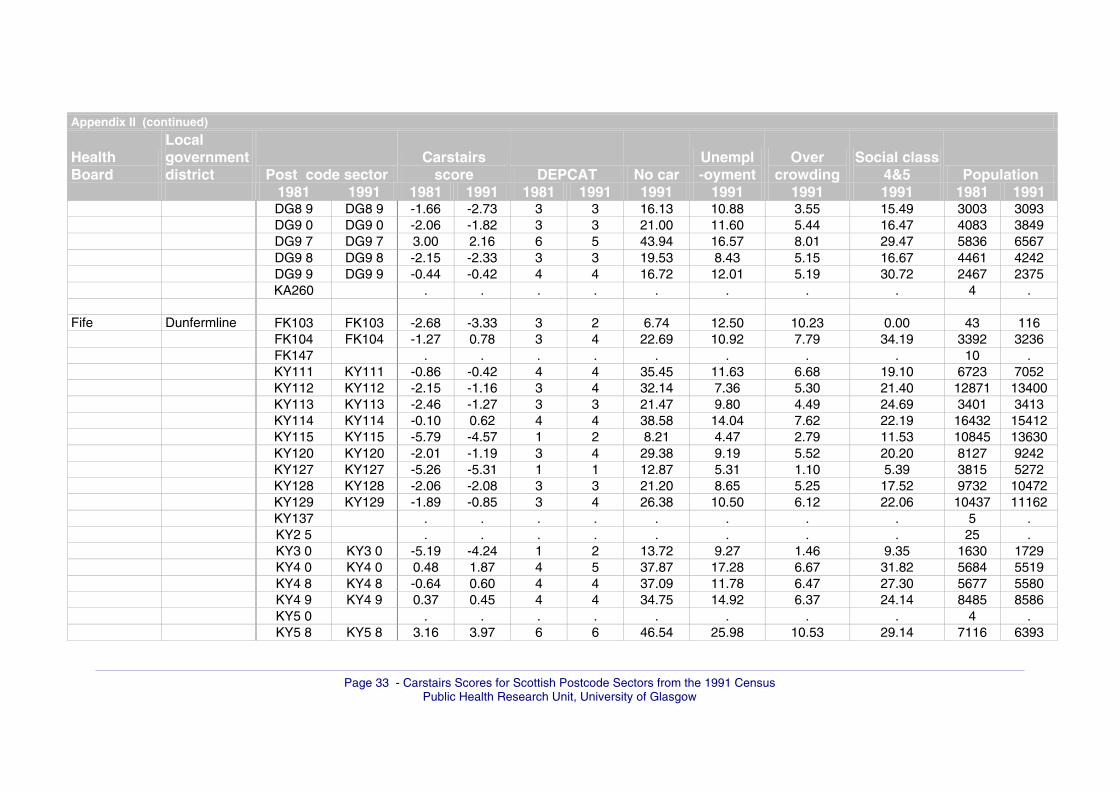
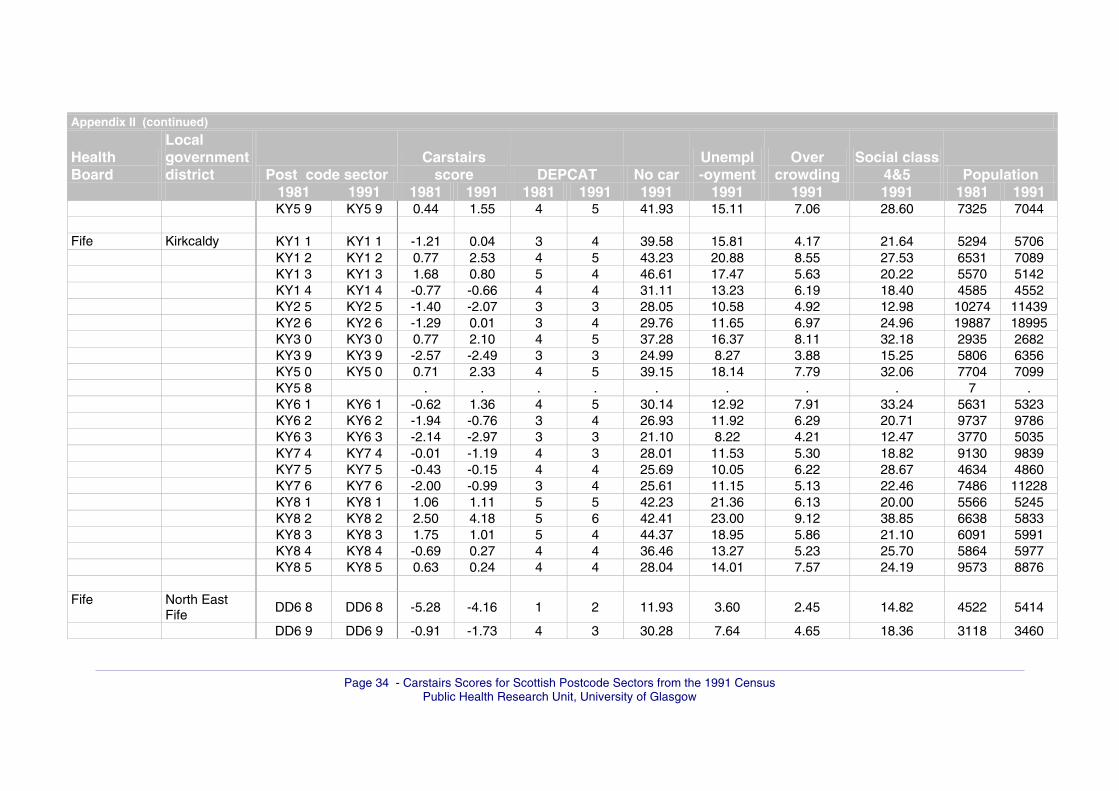
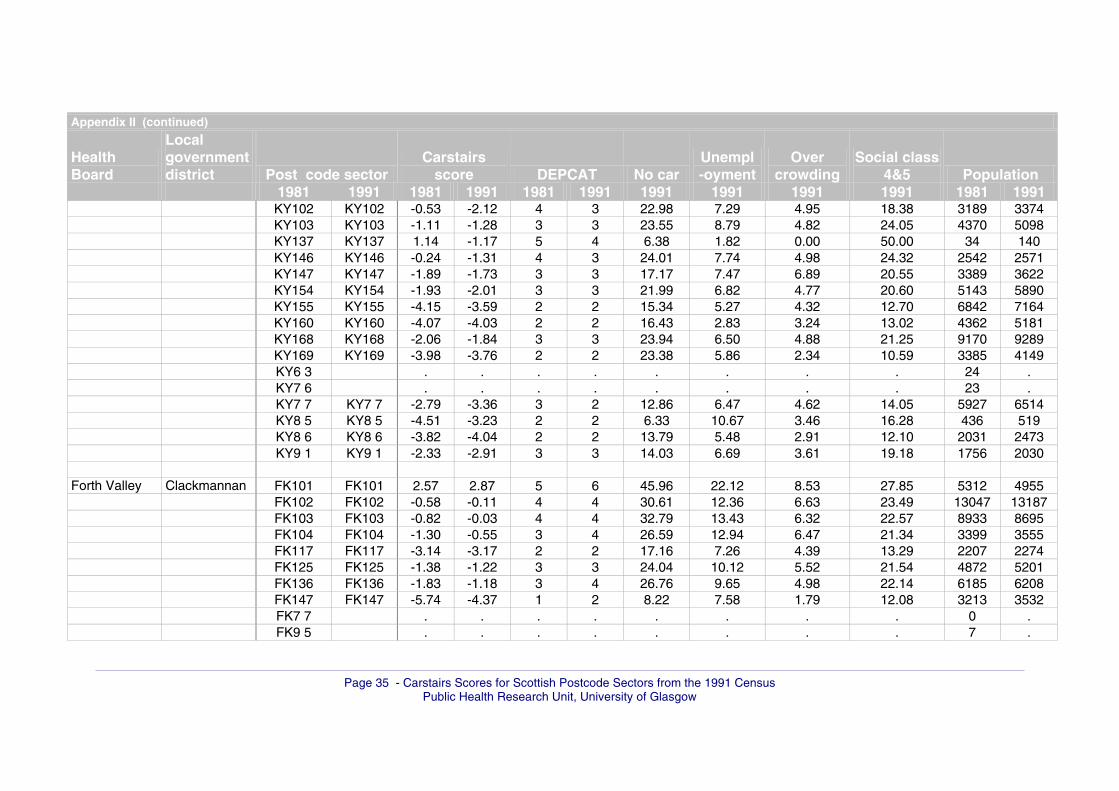
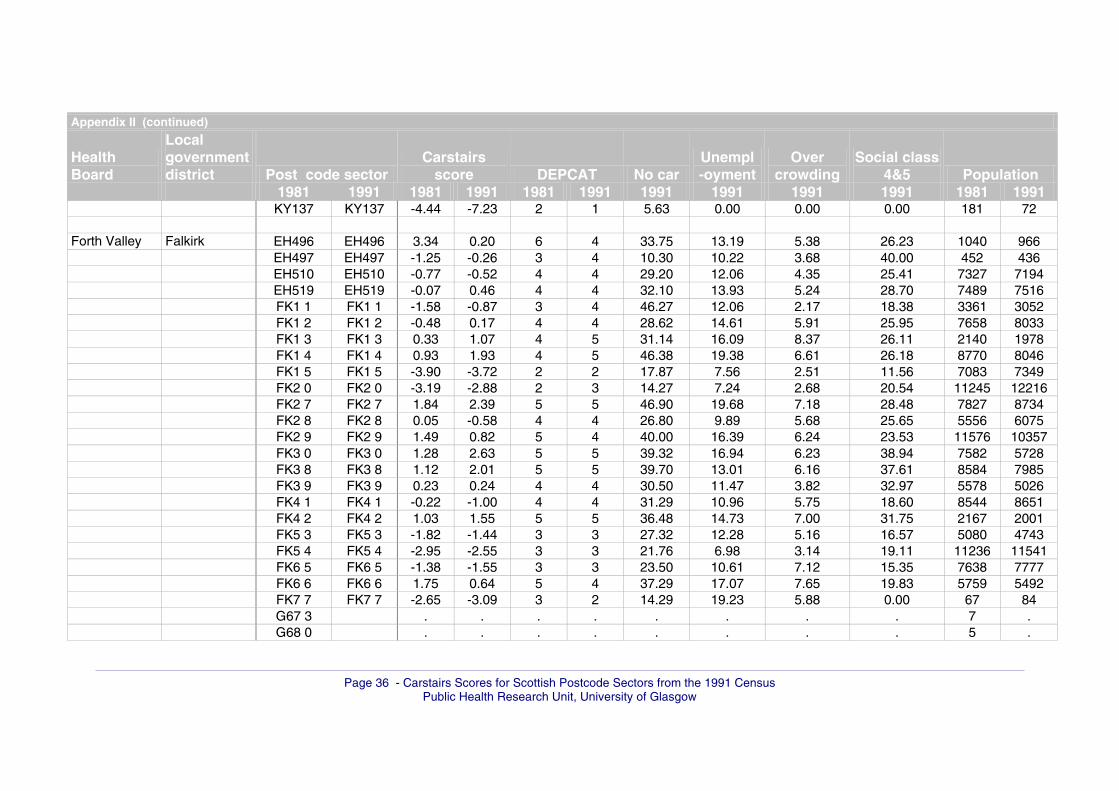
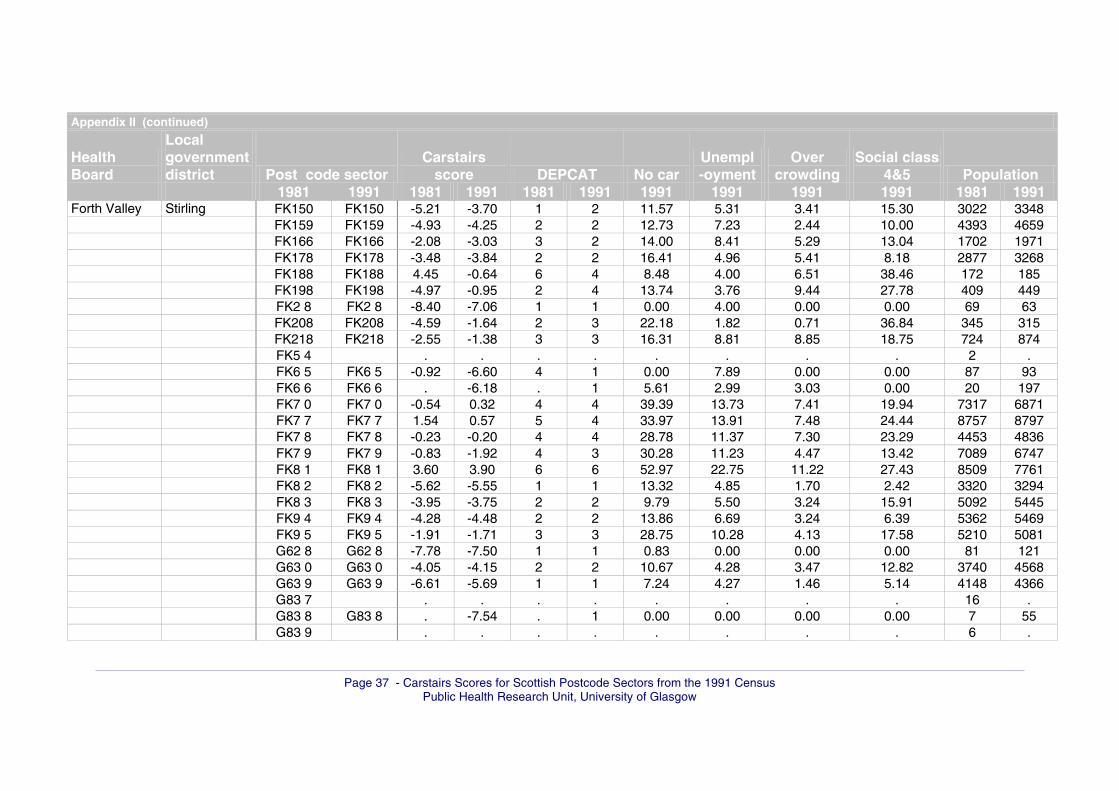
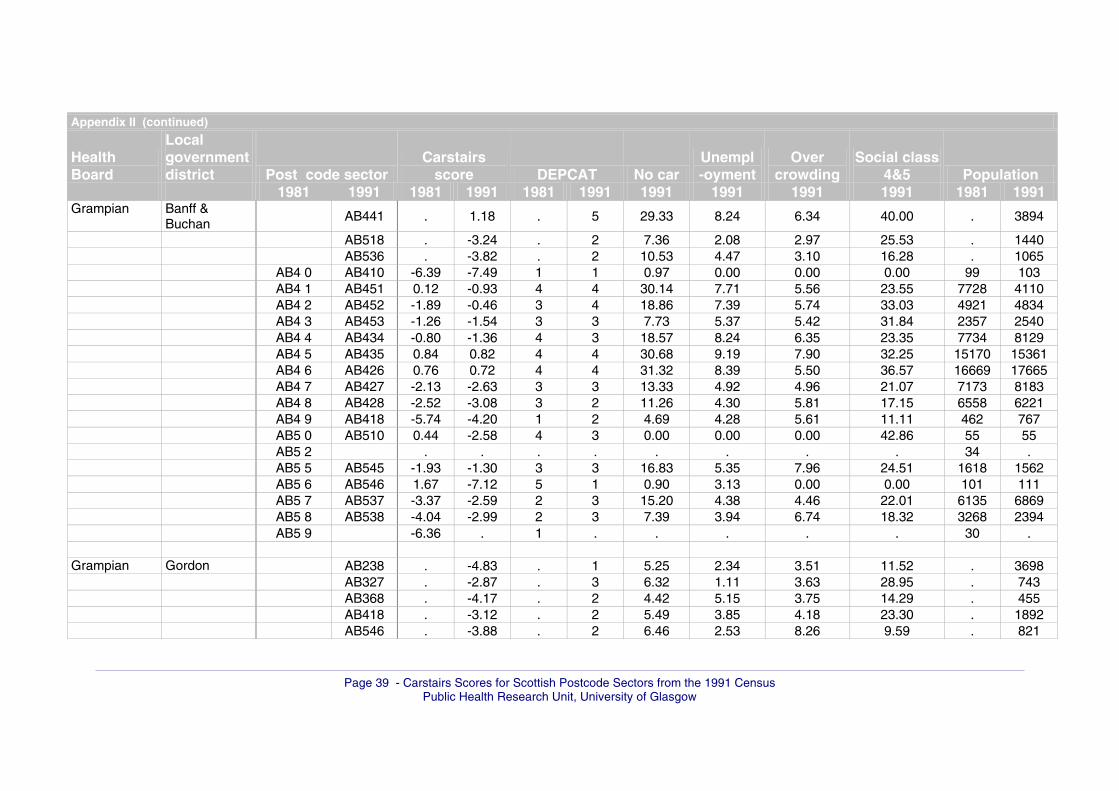
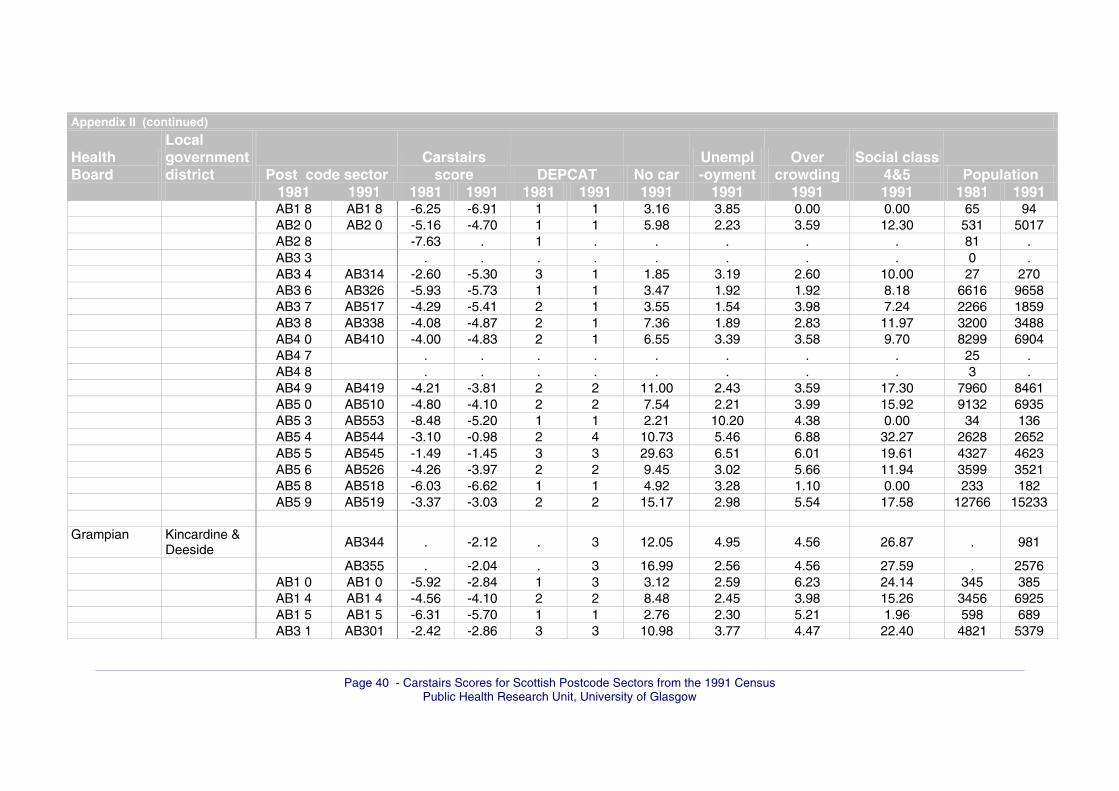
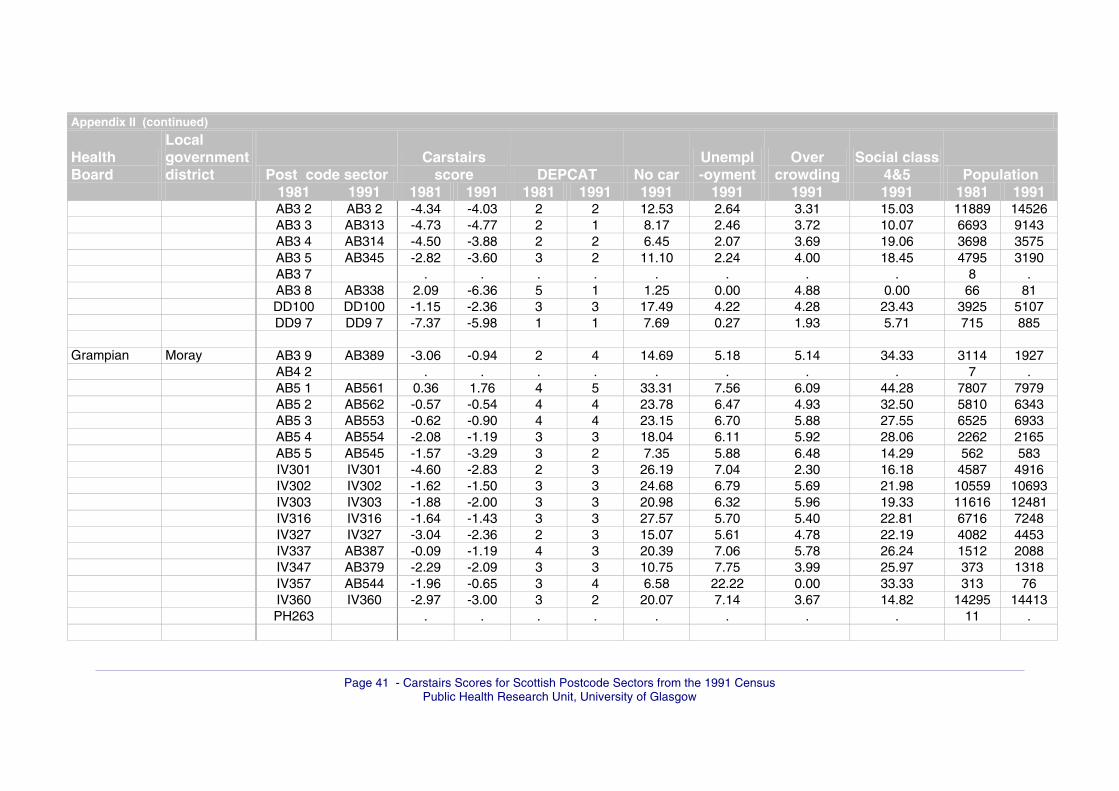
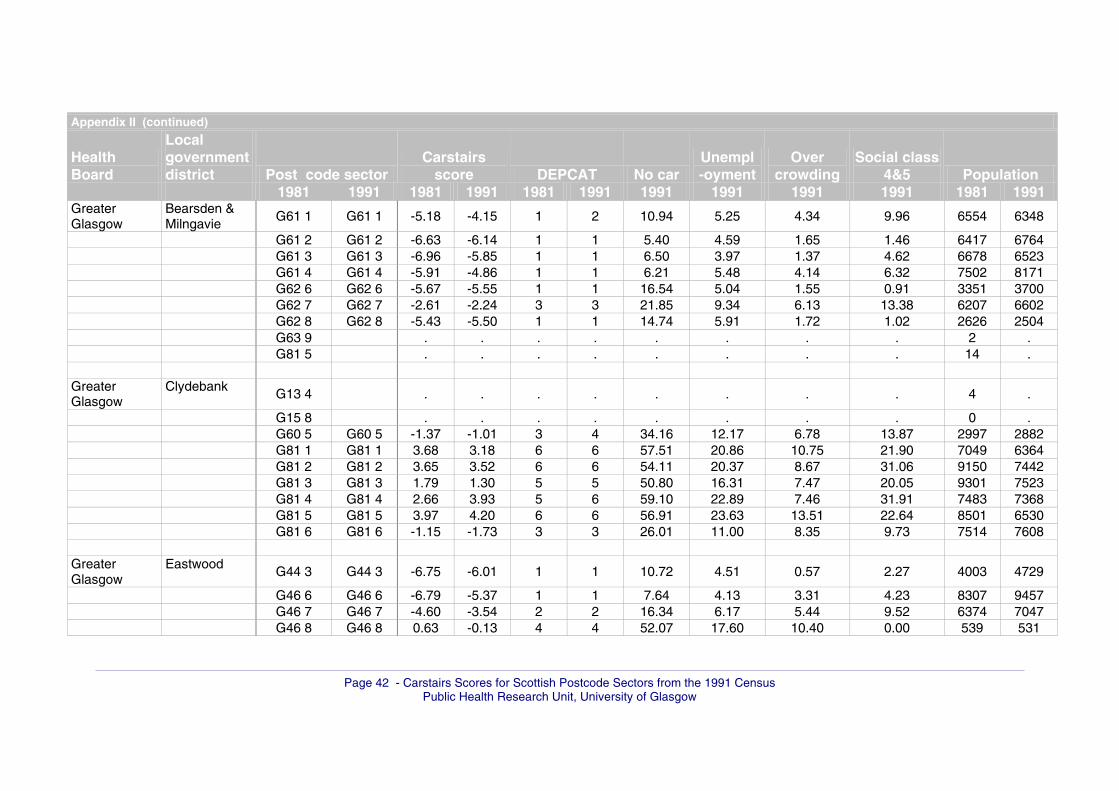
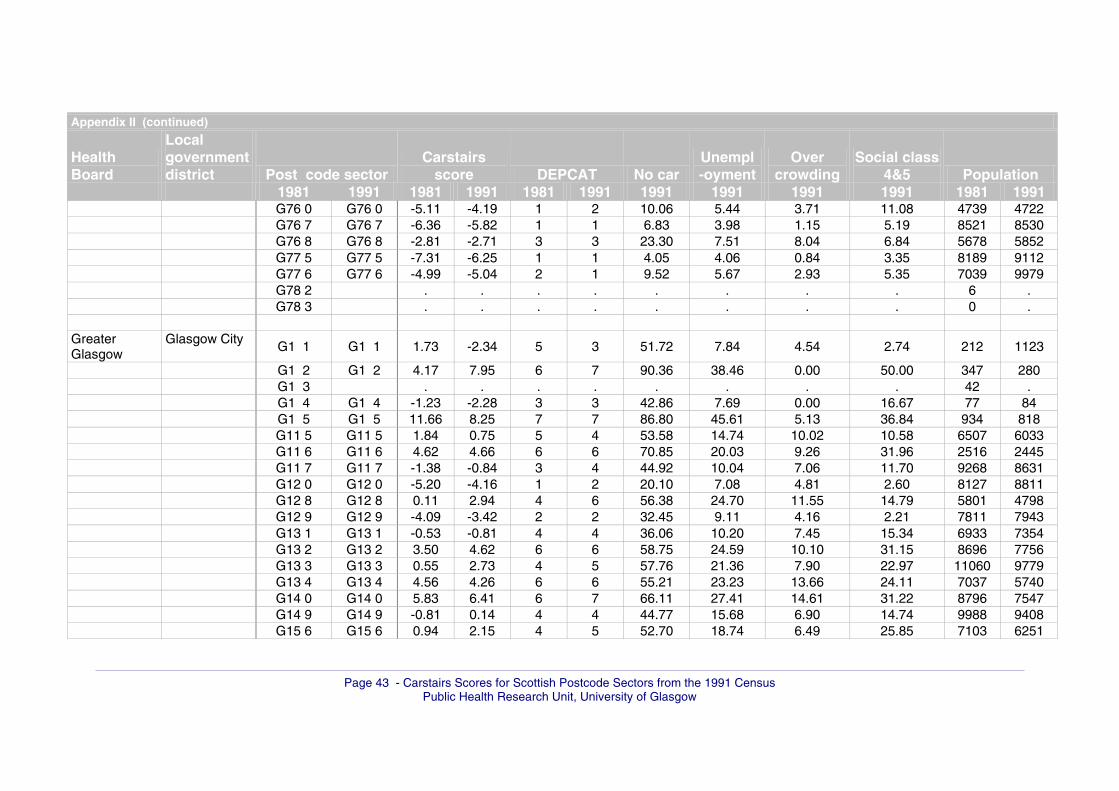
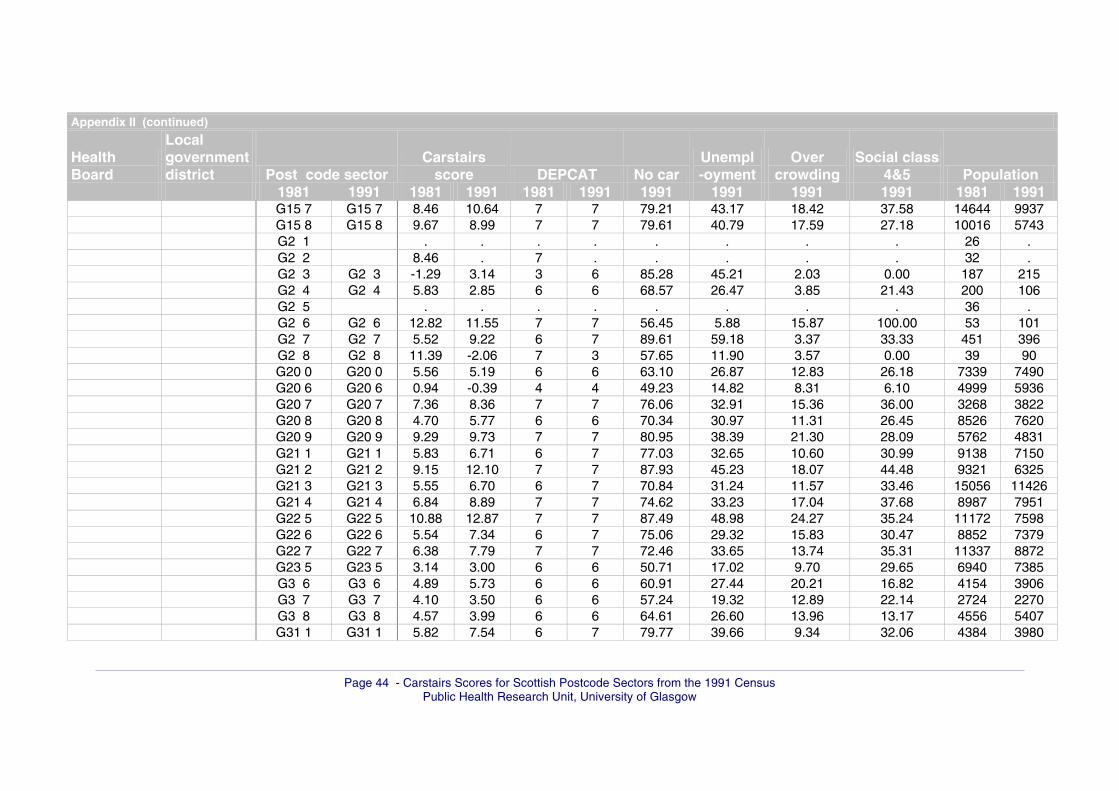
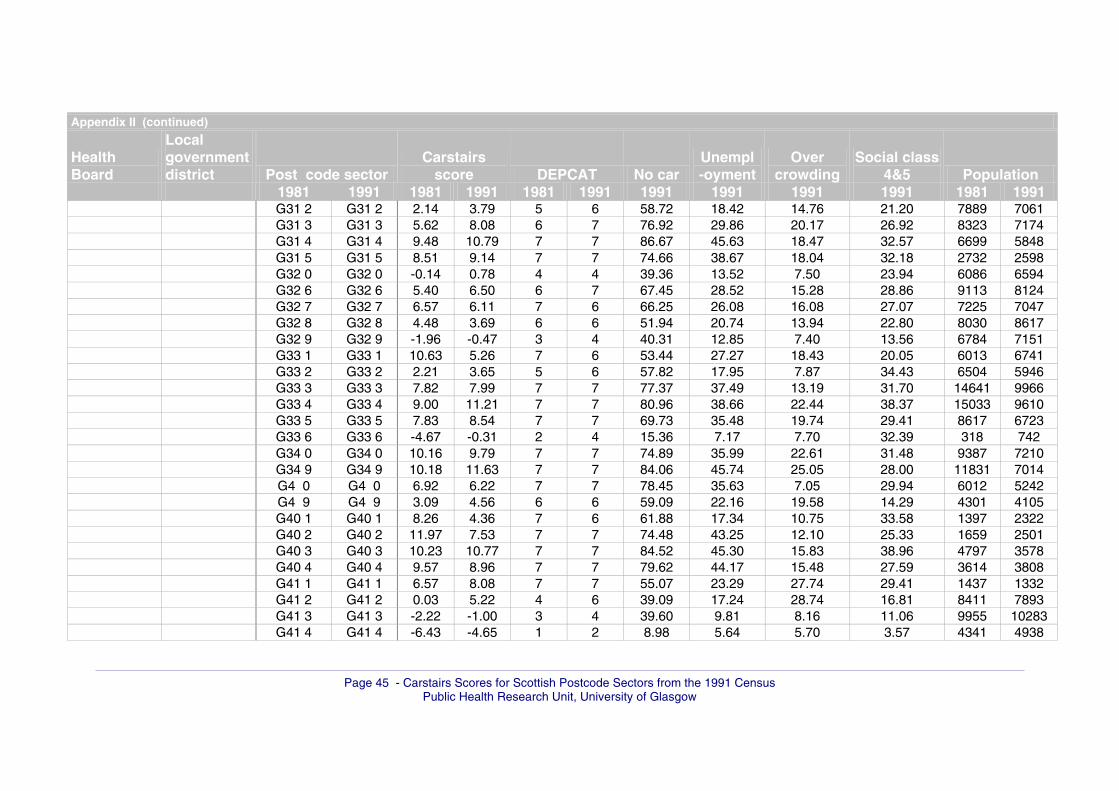
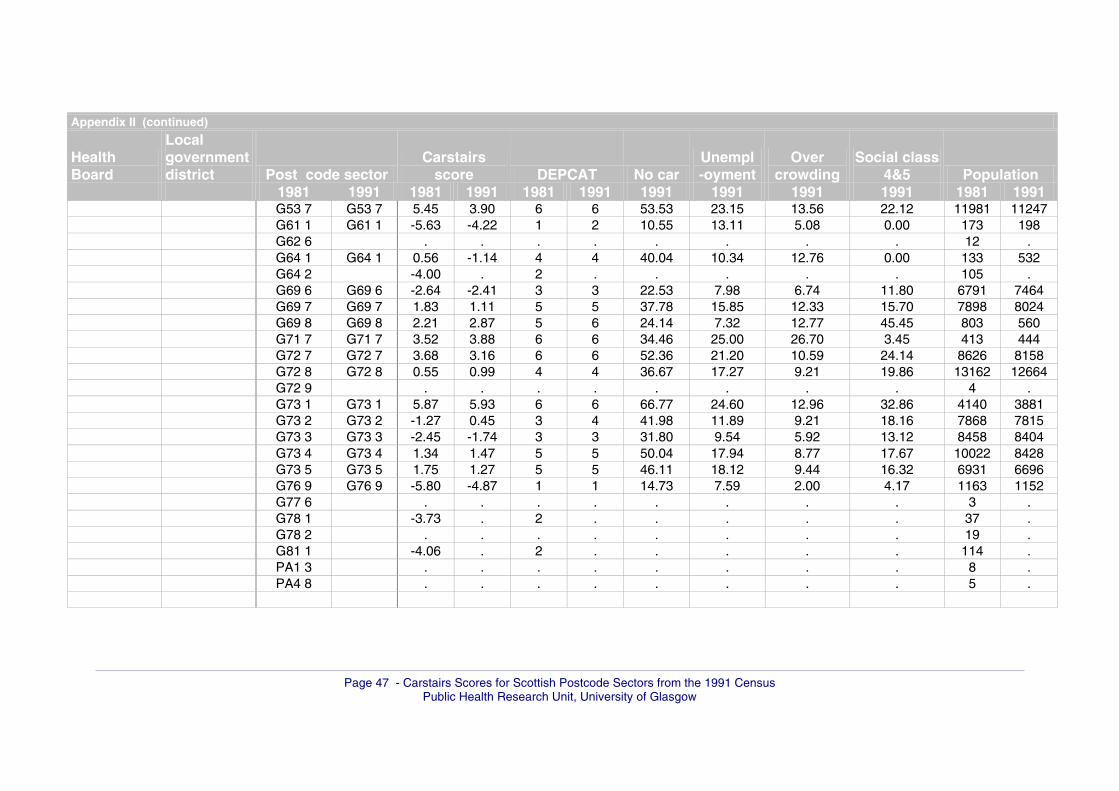
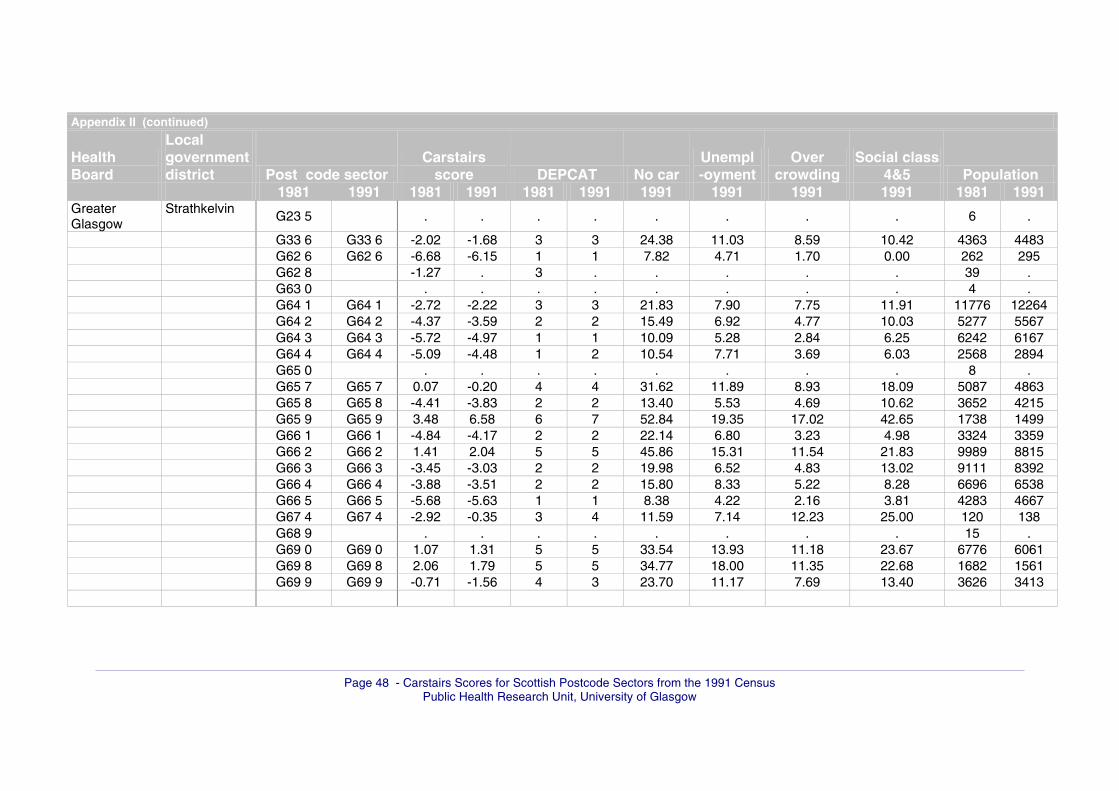
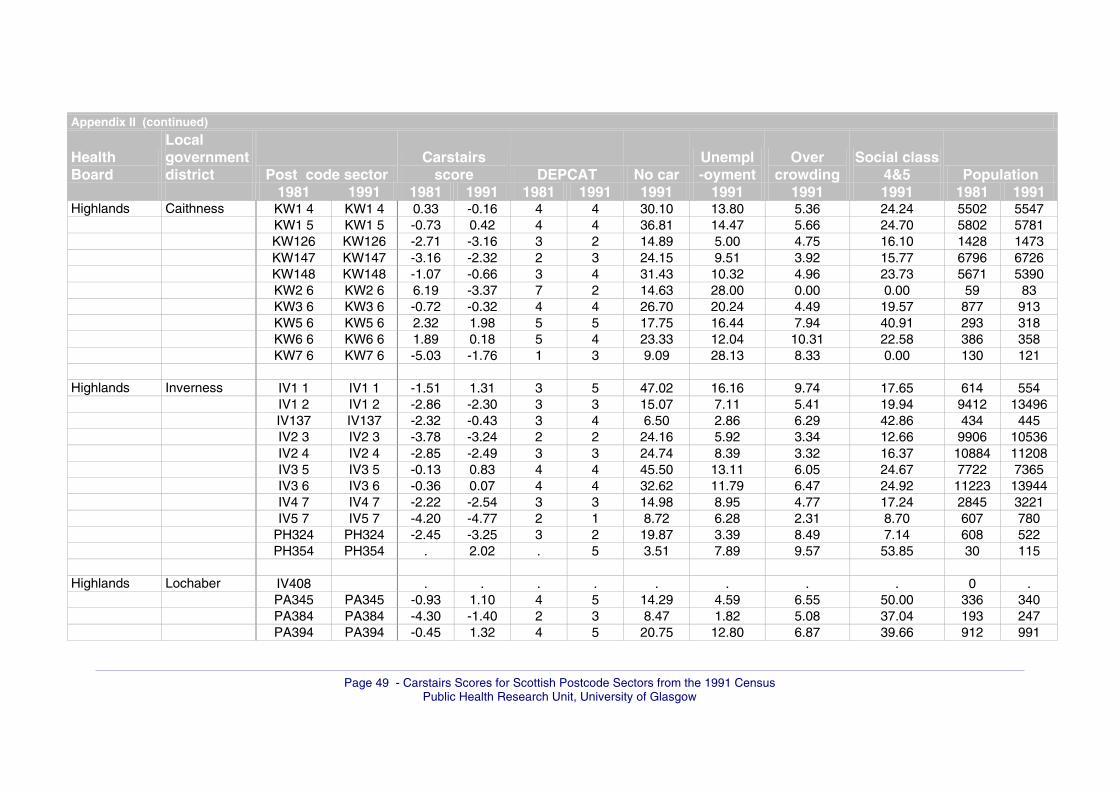
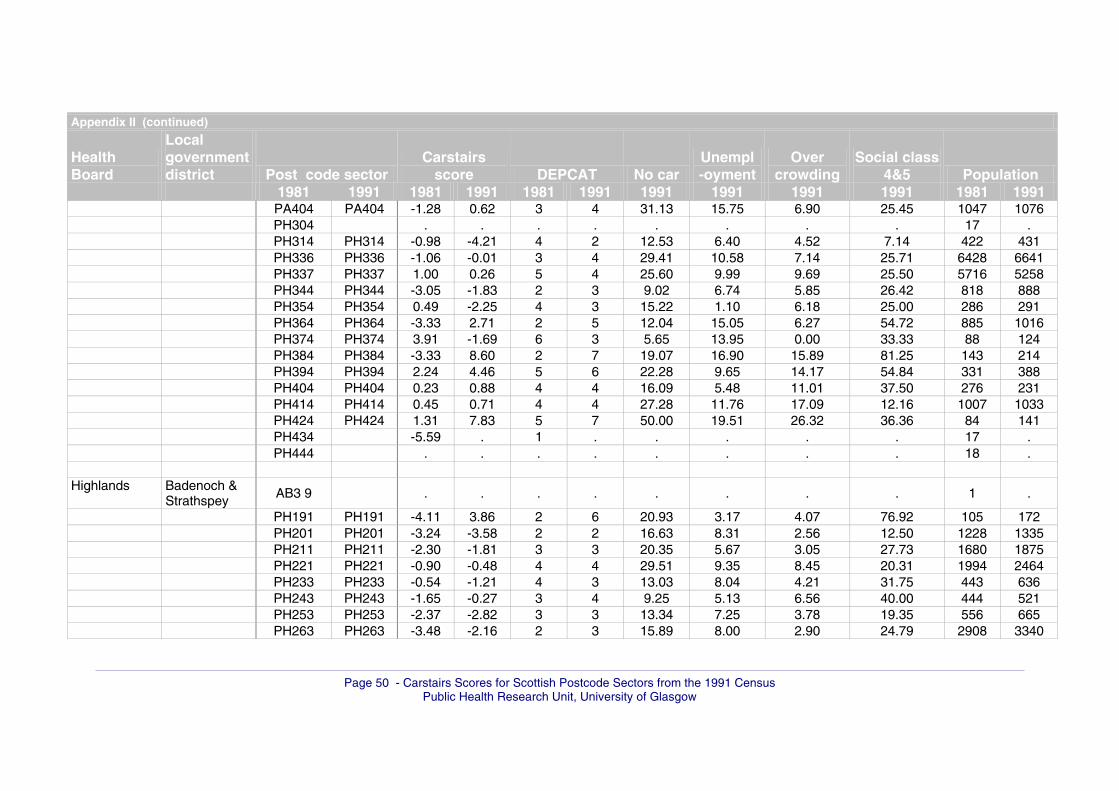
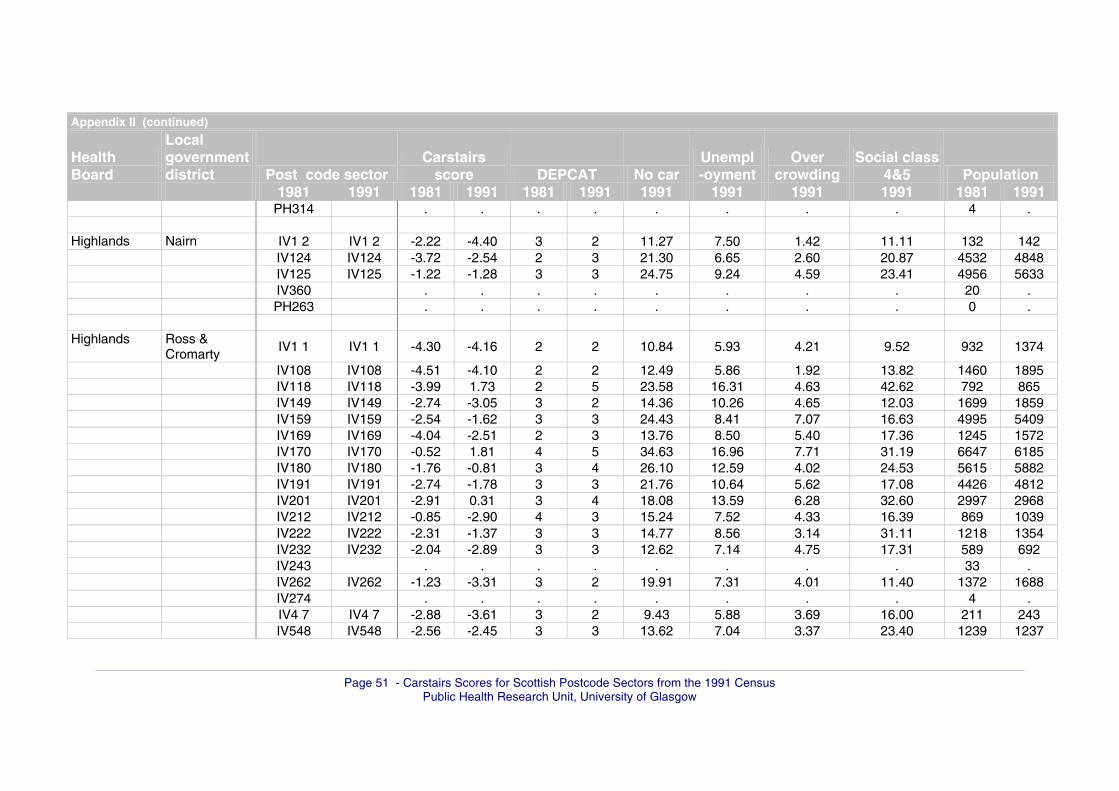
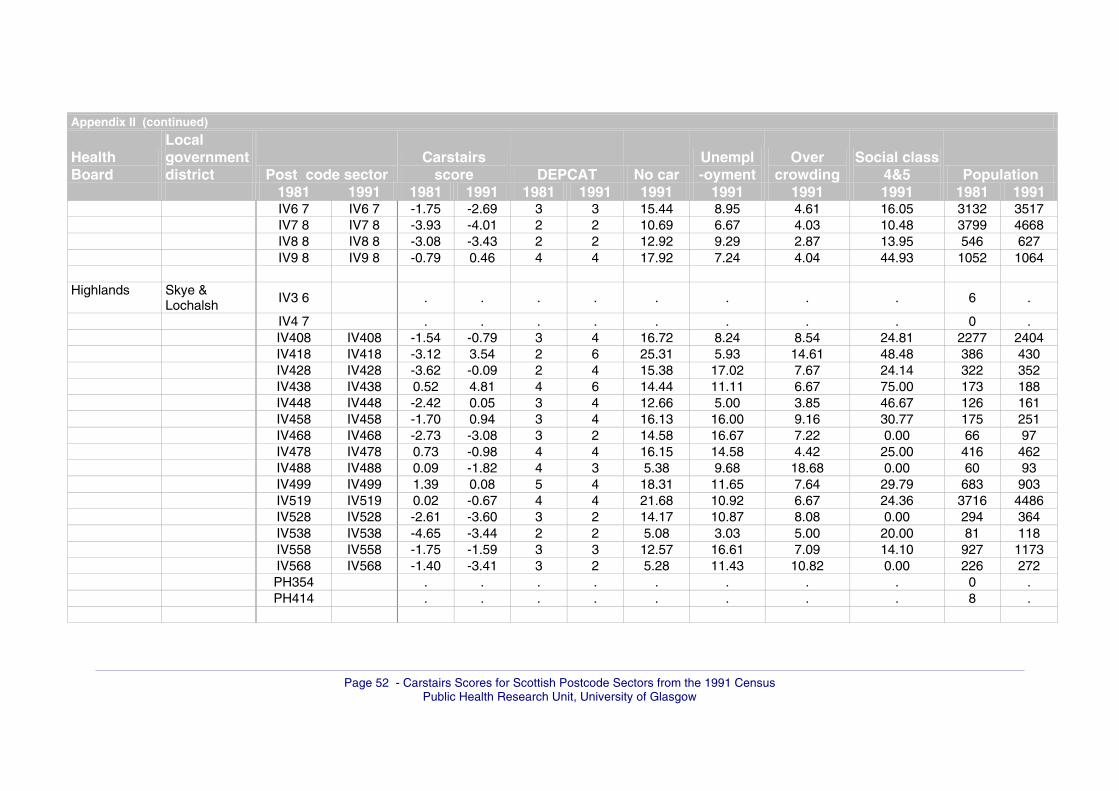
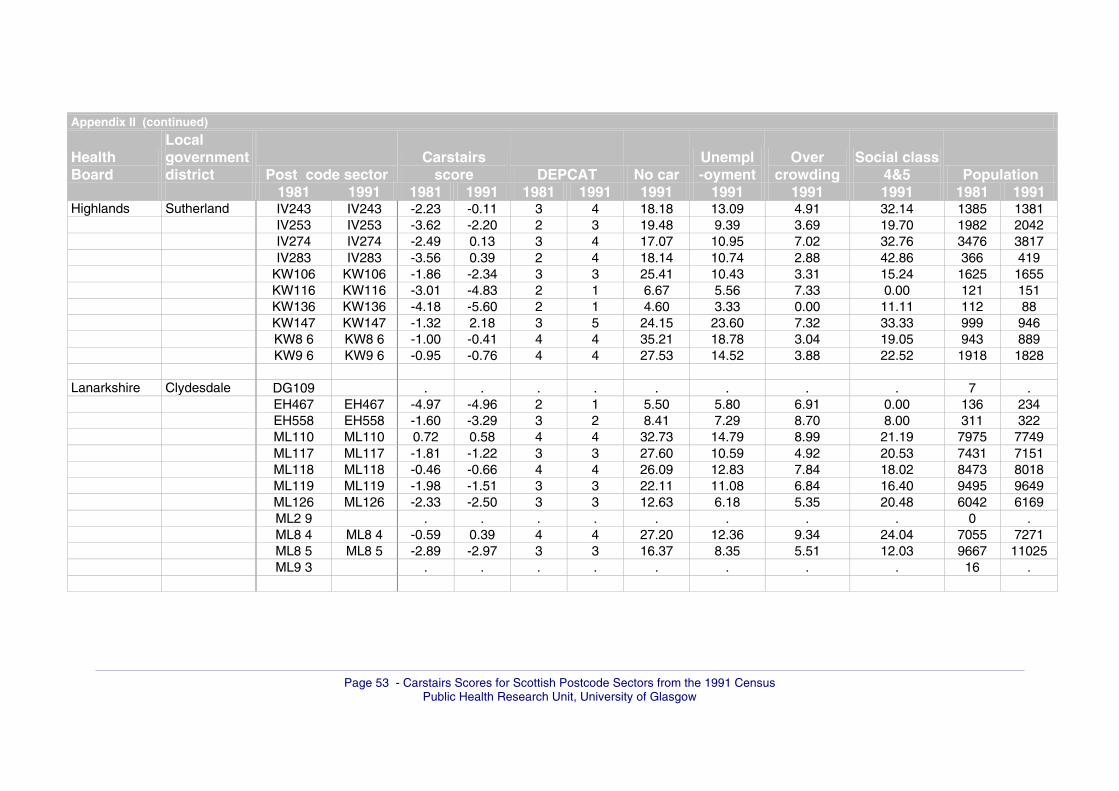
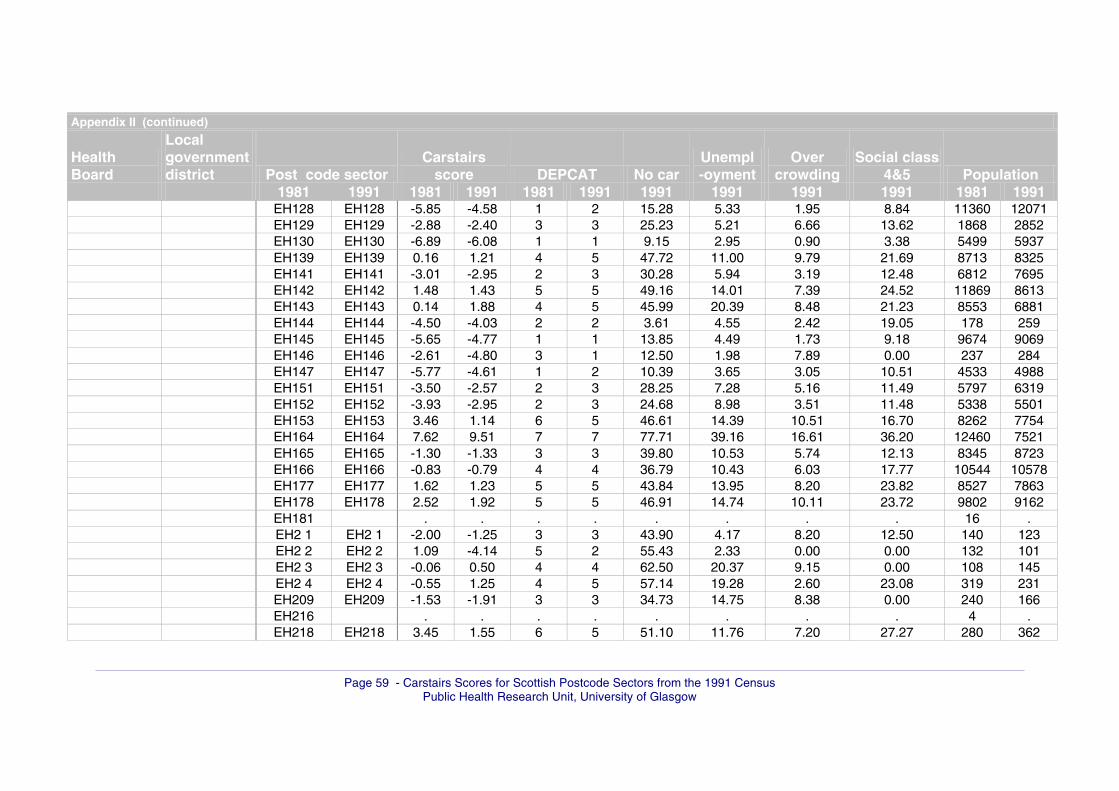
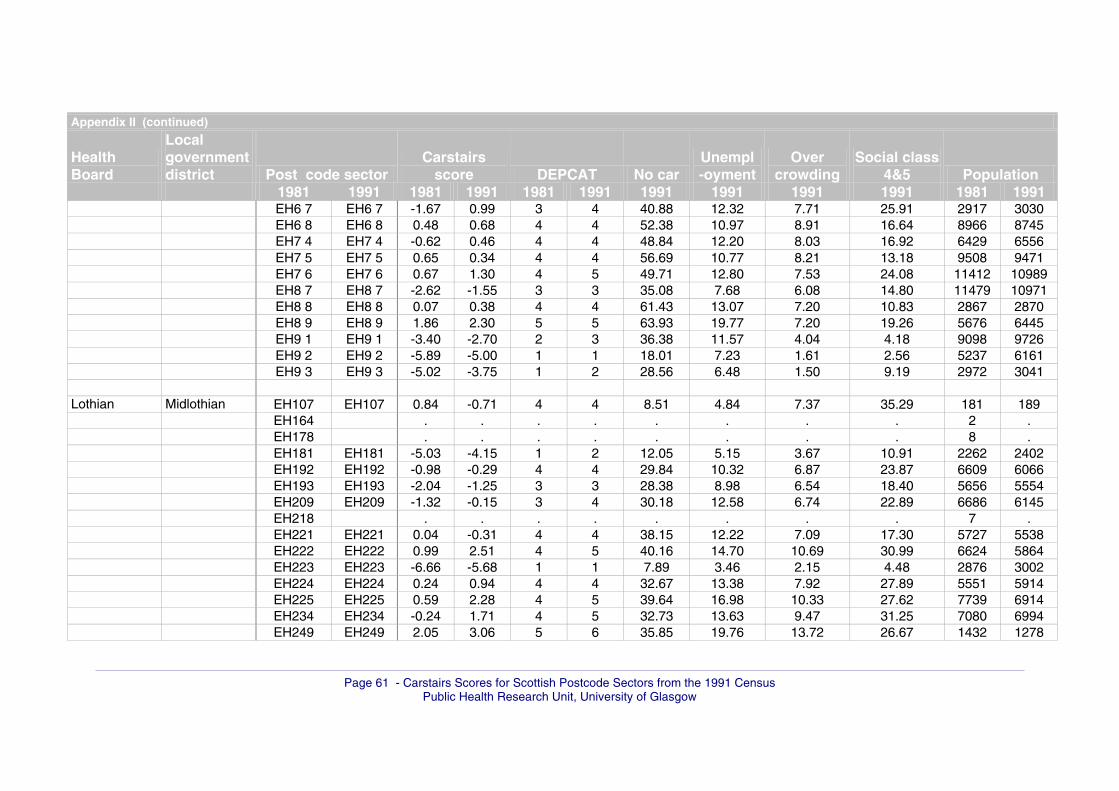
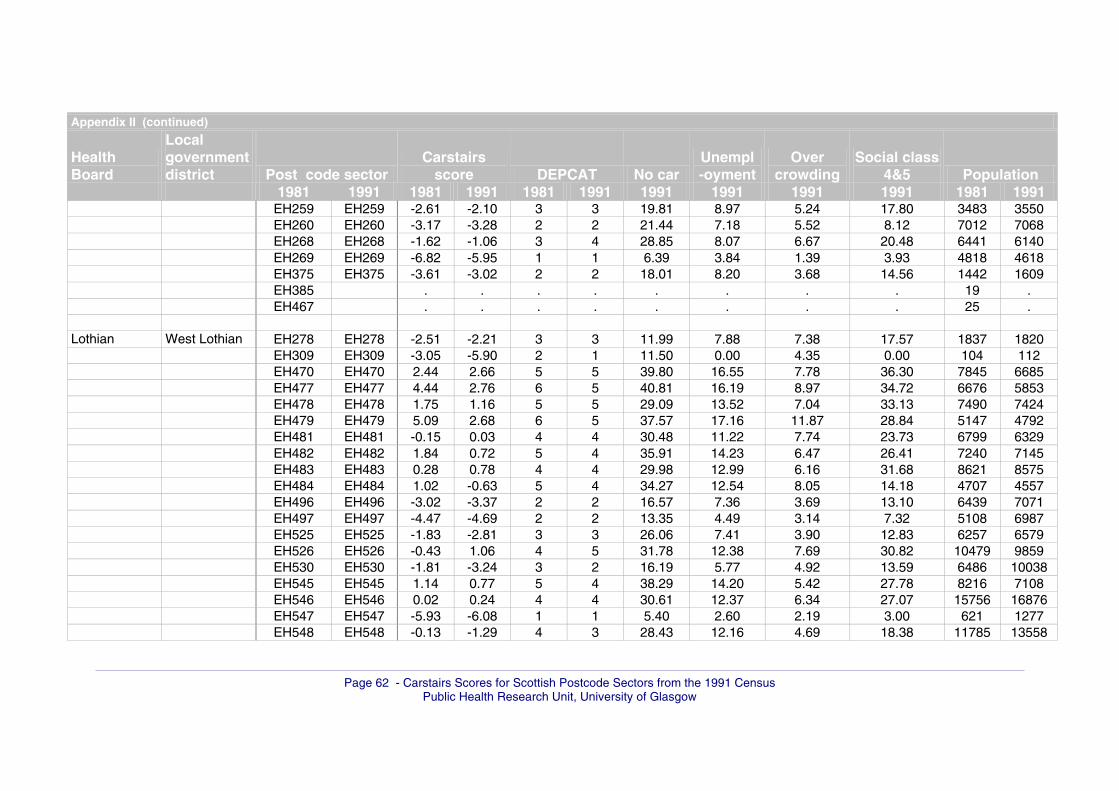
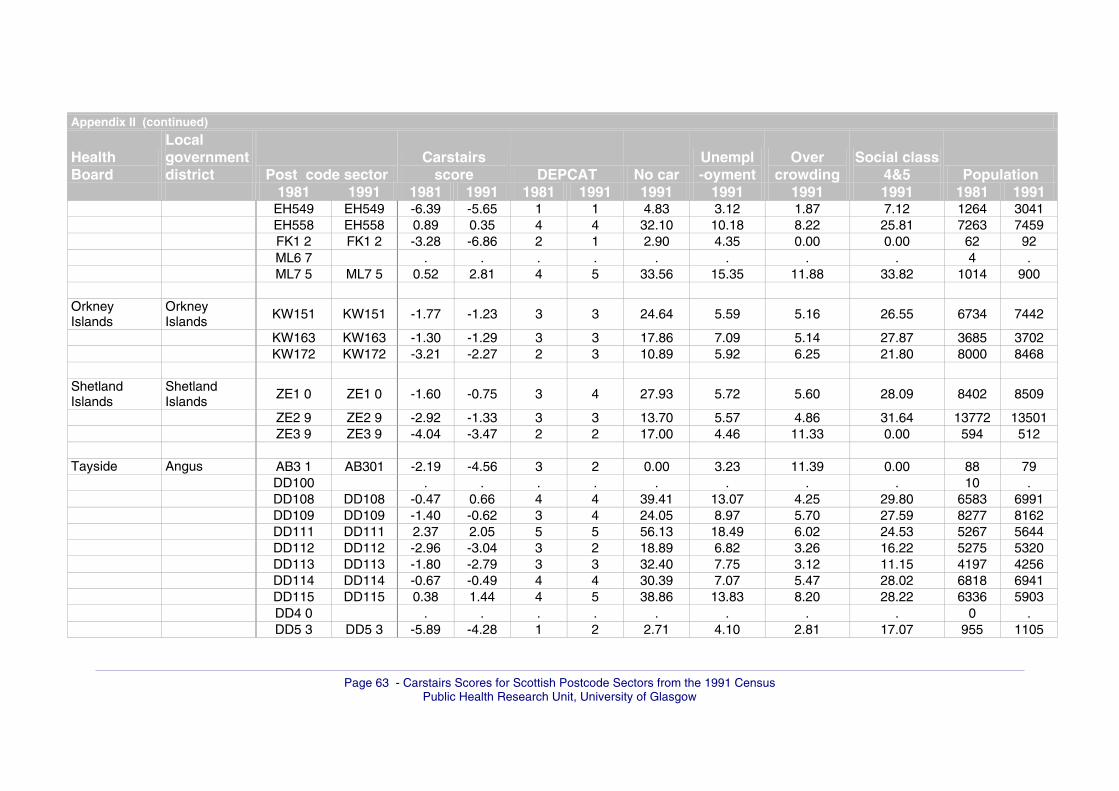
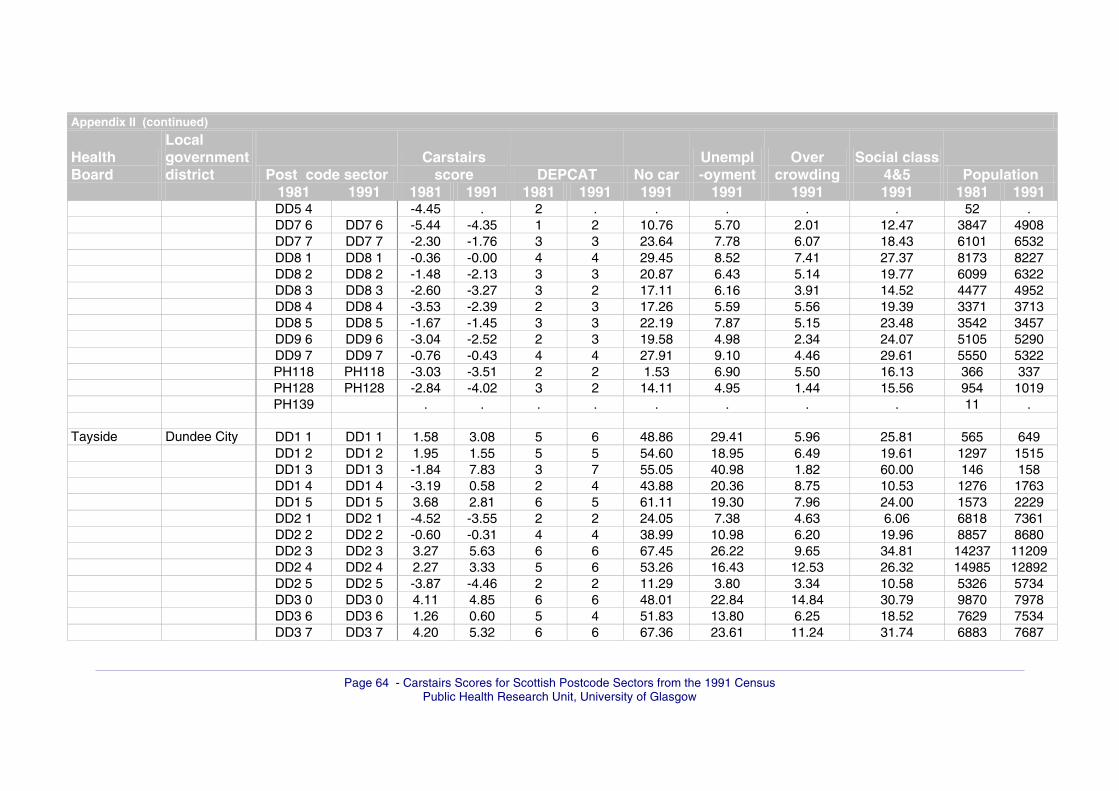
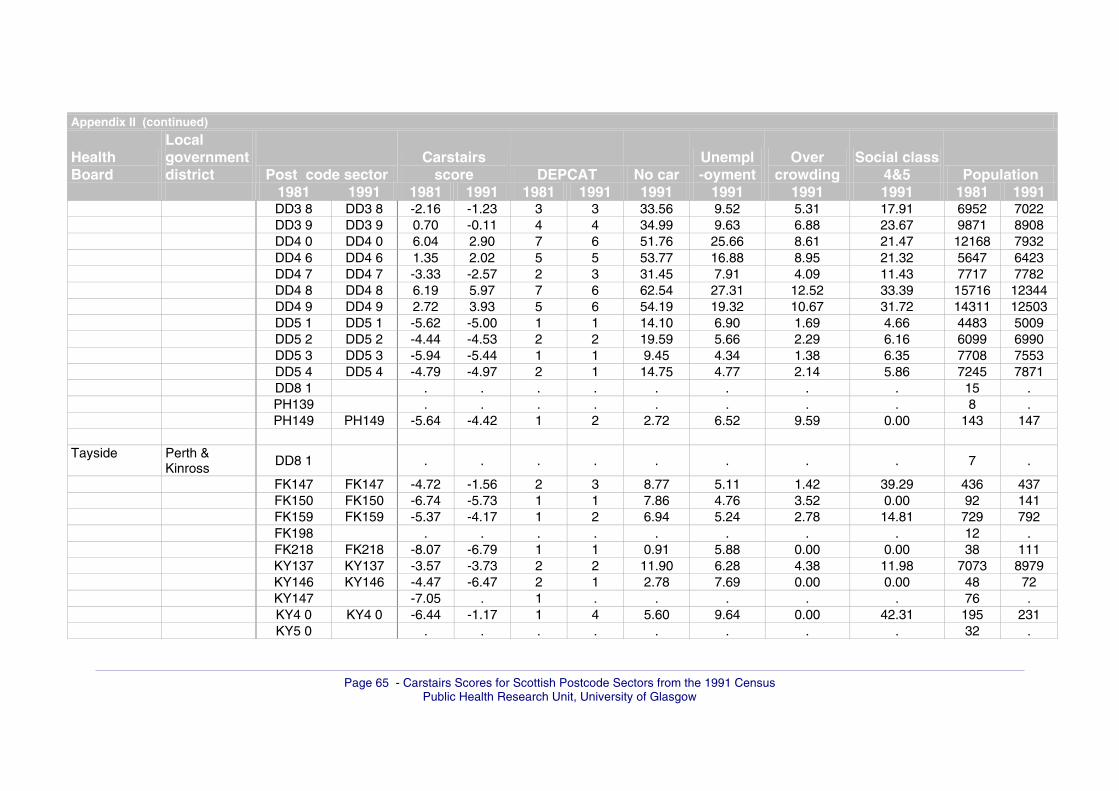
Appendix II
Health Board
Local government district
Post code sector Carstairs
score DEPCAT No car Unempl -oyment
Over crowding
Social class 4&5 Population
1981 1991 1981 1991 1981 1991 1991 1991 1991 1991 1981 1991 Argyll & Clyde Argyll & Bute FK208 FK208 . -6.86 . 1 12.12 0.00 0.00 0.00 4 73 G83 7 G83 7 -0.79 1.25 4 5 24.14 12.70 6.06 39.13 214 232 PA200 PA200 0.27 0.67 4 4 46.88 15.45 3.94 24.38 4057 3971 PA209 PA209 -1.43 0.99 3 4 39.92 15.26 7.55 23.56 3254 3383 PA212 PA212 -1.91 -0.14 3 4 20.66 12.56 5.76 29.55 874 906 PA223 PA223 -1.96 -5.61 3 1 7.40 9.28 1.78 0.00 343 339 PA237 PA237 -1.87 -1.97 3 3 29.79 10.02 4.71 14.02 5382 5819 PA238 PA238 -2.81 -1.31 3 3 31.68 11.42 4.41 17.94 7713 7962 PA248 PA248 -2.04 -3.37 3 2 12.30 13.91 0.00 15.63 425 456 PA258 PA258 -6.67 -5.30 1 1 10.53 13.79 0.00 0.00 74 96 PA268 PA268 -5.30 -5.76 1 1 11.29 2.08 3.94 0.00 109 125 PA278 PA278 -2.67 -2.59 3 3 11.82 9.28 2.22 23.08 736 720 PA286 PA286 -0.63 -0.57 4 4 30.28 10.12 8.88 17.52 8879 8610 PA296 PA296 0.30 -0.06 4 4 25.73 8.30 8.43 26.88 2524 2469 PA308 PA308 -1.75 -3.64 3 2 20.96 7.75 5.22 5.19 1407 1446 PA318 PA318 -2.73 -2.11 3 3 15.54 7.84 6.54 18.40 4290 4571 PA328 PA328 -0.59 -2.00 4 3 18.89 9.49 4.17 20.65 1155 1239 PA331 PA331 -1.42 -1.26 3 3 12.65 8.85 5.93 27.27 731 684 PA344 PA344 -0.71 -1.07 4 4 26.57 6.87 7.28 21.48 5537 6514 PA345 PA345 -1.63 -1.96 3 3 29.58 6.71 7.69 11.73 3501 3485 PA351 PA351 -3.41 -1.32 2 3 13.55 4.27 10.09 22.83 1090 1128 PA364 -6.33 . 1 . . . . . 70 . PA371 PA371 -0.75 -0.82 4 4 18.20 8.59 8.03 24.52 2523 2698 PA384 PA384 -0.89 1.08 4 5 10.41 8.40 5.41 50.00 423 453 PA417 PA417 -3.27 -1.92 2 3 18.75 1.89 0.00 37.50 153 143
Page 25
Page 22 - Carstairs Scores for Scottish Postcode Sectors from the 1991 Census
Public Health Research Unit, University of Glasgow
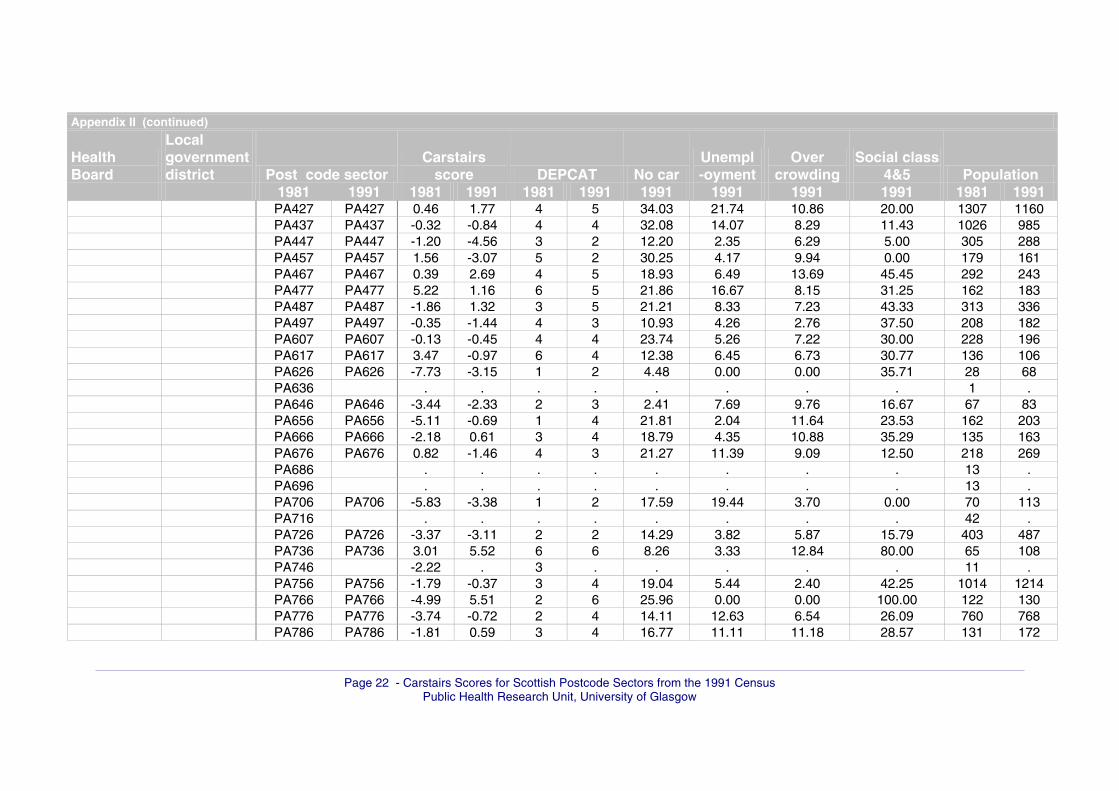
Appendix II (continued)
Health Board
Local government district Post code sector
Carstairs score DEPCAT No car
Unempl -oyment
Over crowding
Social class 4&5 Population
1981 1991 1981 1991 1981 1991 1991 1991 1991 1991 1981 1991 PA427 PA427 0.46 1.77 4 5 34.03 21.74 10.86 20.00 1307 1160 PA437 PA437 -0.32 -0.84 4 4 32.08 14.07 8.29 11.43 1026 985 PA447 PA447 -1.20 -4.56 3 2 12.20 2.35 6.29 5.00 305 288 PA457 PA457 1.56 -3.07 5 2 30.25 4.17 9.94 0.00 179 161 PA467 PA467 0.39 2.69 4 5 18.93 6.49 13.69 45.45 292 243 PA477 PA477 5.22 1.16 6 5 21.86 16.67 8.15 31.25 162 183 PA487 PA487 -1.86 1.32 3 5 21.21 8.33 7.23 43.33 313 336 PA497 PA497 -0.35 -1.44 4 3 10.93 4.26 2.76 37.50 208 182 PA607 PA607 -0.13 -0.45 4 4 23.74 5.26 7.22 30.00 228 196 PA617 PA617 3.47 -0.97 6 4 12.38 6.45 6.73 30.77 136 106 PA626 PA626 -7.73 -3.15 1 2 4.48 0.00 0.00 35.71 28 68 PA636 . . . . . . . . 1 . PA646 PA646 -3.44 -2.33 2 3 2.41 7.69 9.76 16.67 67 83 PA656 PA656 -5.11 -0.69 1 4 21.81 2.04 11.64 23.53 162 203 PA666 PA666 -2.18 0.61 3 4 18.79 4.35 10.88 35.29 135 163 PA676 PA676 0.82 -1.46 4 3 21.27 11.39 9.09 12.50 218 269 PA686 . . . . . . . . 13 . PA696 . . . . . . . . 13 . PA706 PA706 -5.83 -3.38 1 2 17.59 19.44 3.70 0.00 70 113 PA716 . . . . . . . . 42 . PA726 PA726 -3.37 -3.11 2 2 14.29 3.82 5.87 15.79 403 487 PA736 PA736 3.01 5.52 6 6 8.26 3.33 12.84 80.00 65 108 PA746 -2.22 . 3 . . . . . 11 . PA756 PA756 -1.79 -0.37 3 4 19.04 5.44 2.40 42.25 1014 1214 PA766 PA766 -4.99 5.51 2 6 25.96 0.00 0.00 100.00 122 130 PA776 PA776 -3.74 -0.72 2 4 14.11 12.63 6.54 26.09 760 768 PA786 PA786 -1.81 0.59 3 4 16.77 11.11 11.18 28.57 131 172
Page 26
Page 23 - Carstairs Scores for Scottish Postcode Sectors from the 1991 Census
Public Health Research Unit, University of Glasgow
Appendix II (continued)
Health Board
Local government district Post code sector
Carstairs score DEPCAT No car
Unempl -oyment
Over crowding
Social class 4&5 Population
1981 1991 1981 1991 1981 1991 1991 1991 1991 1991 1981 1991 Argyll & Clyde Dumbarton G60 5 G60 5 1.56 1.81 5 5 26.11 5.19 10.07 42.86 450 429 G63 0 -3.63 . 2 . . . . . 205 . G82 1 G82 1 -1.71 -0.79 3 4 37.06 8.12 6.78 18.50 2979 2996 G82 2 G82 2 -0.89 -1.43 4 3 33.28 11.47 5.39 14.17 6175 5948 G82 3 G82 3 1.60 2.31 5 5 42.80 17.07 9.42 28.04 8112 6752 G82 4 G82 4 4.77 2.60 6 5 49.59 23.25 8.90 21.87 5397 5090 G82 5 G82 5 1.36 0.93 5 4 36.03 14.80 9.47 21.68 6085 6084 G83 0 G83 0 0.81 0.72 4 4 42.64 14.13 7.02 22.12 7568 7187 G83 7 G83 7 -3.14 -2.26 2 3 15.85 6.74 7.39 16.39 717 833 G83 8 G83 8 0.54 0.40 4 4 34.03 15.58 7.32 21.51 8207 8266 G83 9 G83 9 2.51 0.72 5 4 34.53 13.71 9.35 21.93 9261 10178 G84 0 G84 0 -4.10 -3.19 2 2 16.89 8.56 4.99 10.71 4787 4853 G84 7 G84 7 -1.00 -2.50 4 3 26.84 9.30 5.49 10.08 6443 6720 G84 8 G84 8 -4.79 -4.18 2 2 20.25 3.88 3.67 7.96 5358 6339 G84 9 G84 9 -6.55 -5.92 1 1 10.68 2.17 2.15 2.40 5077 5498 Argyll & Clyde Inverclyde PA102 . . . . . . . . 7 . PA113 PA113 -3.62 -2.97 2 3 5.07 5.65 6.44 18.52 713 729 PA134 PA134 -5.08 -4.82 1 1 10.16 5.50 2.95 7.02 4007 4664 PA145 PA145 0.87 2.52 4 5 44.84 17.58 12.23 22.80 10239 9783 PA146 PA146 4.40 6.55 6 7 58.74 30.54 14.59 32.76 12466 9960 PA151 PA151 3.50 4.41 6 6 75.79 28.86 7.57 21.62 2289 2117 PA152 PA152 7.43 7.67 7 7 66.84 32.27 16.95 32.06 7873 5325 PA153 PA153 7.13 7.19 7 7 61.58 32.78 16.10 31.64 5535 4197 PA154 PA154 2.25 4.06 5 6 60.46 21.64 11.97 24.83 9740 8323 PA160 PA160 5.06 5.90 6 6 49.15 23.45 17.06 34.28 12110 10700 PA167 PA167 3.24 4.10 6 6 49.24 21.78 12.86 28.69 10436 9591
Page 27
Page 24 - Carstairs Scores for Scottish Postcode Sectors from the 1991 Census
Public Health Research Unit, University of Glasgow
Appendix II (continued)
Health Board
Local government district Post code sector
Carstairs score DEPCAT No car
Unempl -oyment
Over crowding
Social class 4&5 Population
1981 1991 1981 1991 1981 1991 1991 1991 1991 1991 1981 1991 PA168 PA168 -4.40 -2.86 2 3 21.33 7.15 5.15 12.53 6660 6516 PA169 PA169 -0.74 1.53 4 5 41.54 16.50 9.45 22.45 4922 4740 PA186 PA186 -4.98 -3.13 2 2 7.85 7.11 2.45 22.07 1460 1715 PA191 PA191 -2.64 -1.19 3 3 25.60 9.05 6.23 20.80 11096 11743 Argyll & Clyde Renfrew G52 3 . . . . . . . . 29 . G52 4 . . . . . . . . 10 . G53 7 G53 7 -1.49 9.74 3 7 47.83 42.86 41.49 0.00 60 92 G77 6 . . . . . . . . 4 . G78 1 G78 1 0.76 0.23 4 4 36.55 13.27 9.31 17.27 8484 7991 G78 2 G78 2 1.10 1.12 5 5 39.98 14.64 8.37 23.76 9965 9260 G78 3 G78 3 -1.51 -0.46 3 4 26.23 11.82 8.66 19.07 5049 5725 G78 4 G78 4 -6.53 -5.85 1 1 5.67 5.10 1.74 3.13 716 700 PA1 1 PA1 1 3.76 2.17 6 5 55.54 15.17 10.41 20.63 5443 5483 PA1 2 PA1 2 2.14 3.19 5 6 58.87 16.93 8.63 29.55 6493 6939 PA1 3 PA1 3 -5.08 -3.99 1 2 18.71 5.85 2.66 10.26 8247 8528 PA102 PA102 -3.74 -3.97 2 2 18.09 7.37 4.37 5.80 4289 4106 PA113 PA113 -3.46 -4.20 2 2 16.02 6.34 3.97 6.75 5150 5344 PA124 PA124 -2.33 -2.59 3 3 20.94 10.21 5.69 10.81 2777 2994 PA134 . . . . . . . . 21 . PA146 PA146 -6.61 -6.10 1 1 4.26 5.35 0.00 4.88 816 1023 PA2 0 PA2 0 2.50 3.04 5 6 51.00 21.66 10.60 23.26 10115 7527 PA2 6 PA2 6 0.89 0.71 4 4 47.31 12.40 7.07 21.54 9902 9654 PA2 7 PA2 7 -0.38 -1.53 4 3 32.38 11.91 6.05 11.92 7307 6494 PA2 8 PA2 8 2.78 2.65 5 5 46.67 17.13 11.41 25.14 9925 8199 PA2 9 PA2 9 -2.10 -2.32 3 3 24.34 7.39 5.71 14.40 6897 7747 PA3 1 PA3 1 12.27 10.53 7 7 78.05 40.84 20.76 34.96 8171 5229 PA3 2 PA3 2 5.57 3.84 6 6 63.20 23.08 11.28 21.43 4607 4472
Page 28
Page 25 - Carstairs Scores for Scottish Postcode Sectors from the 1991 Census
Public Health Research Unit, University of Glasgow
Appendix II (continued)
Health Board
Local government district Post code sector
Carstairs score DEPCAT No car
Unempl -oyment
Over crowding
Social class 4&5 Population
1981 1991 1981 1991 1981 1991 1991 1991 1991 1991 1981 1991 PA3 3 PA3 3 2.40 2.58 5 5 47.48 15.35 10.27 28.21 12407 10278 PA3 4 PA3 4 3.04 4.94 6 6 58.24 19.87 9.82 39.59 7393 6452 PA4 0 PA4 0 -2.27 -1.66 3 3 26.35 7.62 5.91 18.46 10746 10682 PA4 8 PA4 8 2.08 3.14 5 6 52.50 17.45 9.61 29.74 8101 6957 PA4 9 PA4 9 0.09 0.27 4 4 38.31 10.20 9.04 20.45 4643 4497 PA5 0 PA5 0 2.94 3.30 5 6 48.96 20.11 12.50 24.35 10160 8395 PA5 8 PA5 8 2.23 2.45 5 5 47.33 16.01 8.92 29.16 8246 8418 PA5 9 PA5 9 -0.19 0.43 4 4 37.11 13.28 8.48 20.37 8063 7416 PA6 7 PA6 7 -5.24 -5.54 1 1 5.20 3.80 2.20 6.51 3593 5944 PA7 5 PA7 5 -5.20 -5.09 1 1 9.02 4.92 2.34 7.07 6002 6014 PA8 6 PA8 6 -3.22 -3.16 2 2 23.67 8.30 2.91 12.01 5892 6531 PA8 7 PA8 7 -3.39 -4.04 2 2 20.35 6.61 2.21 9.20 4329 6655 PA9 1 PA9 1 -2.09 -4.23 3 2 19.33 8.53 3.37 3.74 1271 1234 Ayrshire & Arran
Cumnock & Doon
DG4 6 . . . . . . . . 0 .
DG7 3 . . . . . . . . 2 . KA1 5 . . . . . . . . 16 . KA181 KA181 0.01 1.09 4 5 31.16 16.68 7.01 28.27 7287 7362 KA182 KA182 1.47 1.79 5 5 37.20 23.30 9.27 20.16 5873 5548 KA183 KA183 1.22 2.93 5 6 38.78 23.66 9.94 27.53 6827 6010 KA184 KA184 1.05 1.69 5 5 40.17 26.24 5.21 22.74 5218 4590 KA4 8 KA4 8 -5.79 -4.19 1 2 5.88 0.00 13.24 0.00 63 68 KA5 5 KA5 5 -5.11 -3.85 1 2 12.79 8.43 4.00 9.02 1480 1979 KA5 6 KA5 6 0.71 1.12 4 5 34.33 18.39 7.37 24.57 5845 5518 KA6 6 KA6 6 -0.15 1.43 4 5 28.62 16.29 10.51 25.98 1527 1619
Page 29
Page 26 - Carstairs Scores for Scottish Postcode Sectors from the 1991 Census
Public Health Research Unit, University of Glasgow
Appendix II (continued)
Health Board
Local government district Post code sector
Carstairs score DEPCAT No car
Unempl -oyment
Over crowding
Social class 4&5 Population
1981 1991 1981 1991 1981 1991 1991 1991 1991 1991 1981 1991 Ayrshire & Arran
Cunninghame G78 4 . . . . . . . . 68 .
KA111 KA111 -0.71 -0.61 4 4 31.23 12.56 4.08 23.67 10272 12544 KA112 KA112 -4.65 -4.18 2 2 17.63 4.78 7.89 0.00 229 810 KA113 KA113 6.13 3.15 7 6 51.33 23.80 10.49 22.06 1524 1364 KA114 KA114 0.58 -1.52 4 3 27.66 8.67 4.57 20.62 4076 3960 KA115 KA115 -0.24 -3.94 4 2 15.46 9.27 2.48 9.09 345 485 KA120 KA120 2.04 1.18 5 5 42.36 16.90 5.90 25.58 9683 8996 KA128 KA128 1.81 0.66 5 4 43.17 18.43 6.27 18.39 3997 4063 KA129 KA129 2.83 3.13 5 6 47.20 17.47 8.35 34.70 8592 7460 KA136 KA136 0.45 0.34 4 4 35.74 13.14 5.73 25.76 10087 9624 KA137 KA137 2.20 1.35 5 5 39.89 17.48 6.46 26.58 6648 6476 KA143 KA143 2.22 0.50 5 4 31.49 22.55 10.77 9.62 769 743 KA151 KA151 -1.36 -2.68 3 3 23.38 9.33 4.61 11.90 3234 3737 KA152 KA152 -1.02 -1.21 3 3 26.09 10.51 5.12 21.00 3397 3503 KA2 0 KA2 0 . -6.75 . 1 0.00 6.67 0.00 0.00 31 76 KA203 KA203 2.76 2.81 5 5 47.28 20.25 7.47 30.77 5952 5475 KA204 KA204 3.78 3.27 6 6 46.26 21.82 8.91 30.74 5461 4768 KA215 KA215 1.76 0.95 5 4 44.20 17.72 6.17 21.35 6754 6489 KA216 KA216 3.48 3.34 6 6 44.80 20.39 8.54 34.27 6141 5505 KA227 KA227 3.41 1.39 6 5 41.54 16.87 8.86 22.02 7676 6955 KA228 KA228 -0.74 0.50 4 4 34.74 18.95 5.13 22.83 3807 3898 KA239 KA239 -3.04 -2.65 2 3 19.57 10.40 4.06 14.02 4535 4941 KA244 KA244 1.13 0.92 5 4 39.42 15.77 6.25 25.24 3846 3679 KA245 KA245 -1.39 -2.15 3 3 19.35 9.60 5.48 16.46 2629 2668 KA256 KA256 4.69 2.92 6 6 47.02 19.25 8.46 30.89 4903 4303 KA257 KA257 -0.39 -0.00 4 4 31.59 16.76 7.59 17.45 3380 3331
Page 30
Page 27 - Carstairs Scores for Scottish Postcode Sectors from the 1991 Census
Public Health Research Unit, University of Glasgow
Appendix II (continued)
Health Board
Local government district Post code sector
Carstairs score DEPCAT No car
Unempl -oyment
Over crowding
Social class 4&5 Population
1981 1991 1981 1991 1981 1991 1991 1991 1991 1991 1981 1991 KA278 KA278 -2.24 -2.38 3 3 18.44 9.56 6.06 13.77 3845 4474 KA280 KA280 -2.75 -0.40 3 4 43.96 14.08 5.68 14.55 1306 1393 KA290 KA290 -3.77 -3.75 2 2 15.55 5.13 3.97 12.05 1365 1516 KA3 2 KA3 2 -3.01 1.92 2 5 6.31 8.11 1.78 66.67 188 222 KA3 3 . . . . . . . . 22 . KA3 4 . . . . . . . . 17 . KA308 KA308 -4.87 -4.01 2 2 20.43 7.34 2.41 8.21 3861 5328 KA309 KA309 -1.96 -1.36 3 3 32.93 12.44 4.50 15.63 5913 6093 PA175 PA175 -3.51 -3.23 2 2 13.72 9.22 2.54 16.00 1759 1996 Ayrshire & Arran
Kilmarnock & Loudoun
G77 6 . . . . . . . . 4 .
G78 4 . . . . . . . . 15 . KA1 1 KA1 1 -5.49 -4.10 1 2 13.63 4.05 3.21 12.61 2551 3080 KA1 2 KA1 2 -2.54 -2.17 3 3 29.64 8.33 3.05 17.37 4760 5020 KA1 3 KA1 3 0.45 0.22 4 4 37.04 12.37 4.89 26.61 7939 7524 KA1 4 KA1 4 3.05 2.92 6 6 47.63 22.79 7.76 28.30 8759 7567 KA1 5 KA1 5 1.63 2.02 5 5 38.70 13.68 9.05 31.77 4583 4729 KA112 . . . . . . . . 11 . KA137 -8.48 . 1 . . . . . 39 . KA169 KA169 -1.82 -0.42 3 4 28.60 12.44 7.17 20.56 3526 3623 KA170 KA170 -2.19 -2.34 3 3 24.53 8.52 4.21 15.89 3782 4002 KA2 0 KA2 0 0.06 -1.05 4 4 27.61 9.93 7.01 18.51 3449 3630 KA2 9 KA2 9 2.68 . 5 . 5.45 0.00 0.00 . 41 56 KA3 1 KA3 1 3.60 1.94 6 5 46.00 22.48 8.28 19.94 6023 5835 KA3 2 KA3 2 1.21 1.32 5 5 36.58 16.89 7.77 25.99 9099 8838 KA3 3 KA3 3 -0.56 -0.52 4 4 26.42 12.81 6.73 21.28 3198 3146
Page 31
Page 28 - Carstairs Scores for Scottish Postcode Sectors from the 1991 Census
Public Health Research Unit, University of Glasgow
Appendix II (continued)
Health Board
Local government district Post code sector
Carstairs score DEPCAT No car
Unempl -oyment
Over crowding
Social class 4&5 Population
1981 1991 1981 1991 1981 1991 1991 1991 1991 1991 1981 1991 KA3 4 KA3 4 -1.54 -2.59 3 3 15.71 8.88 4.88 16.28 1335 1343 KA3 5 KA3 5 -3.06 -3.37 2 2 19.56 7.81 4.20 10.20 3708 3886 KA3 6 KA3 6 -1.52 -1.39 3 3 20.35 11.25 6.85 18.09 2716 2741 KA3 7 KA3 7 -0.62 0.04 4 4 29.24 11.53 4.80 29.82 10430 9157 KA4 8 KA4 8 -0.61 -1.02 4 4 29.43 11.66 4.16 21.74 5775 5684 Ayrshire & Arran
Kyle & Carrick DG8 0 . . . . . . . . 13 .
DG8 6 . . . . . . . . 8 . KA1 5 KA1 5 -2.67 -1.35 3 3 12.46 6.97 8.70 23.08 1930 1861 KA106 KA106 -3.62 -2.99 2 2 23.12 7.77 3.16 13.78 9540 10118 KA107 KA107 -3.66 -3.19 2 2 13.83 6.28 3.58 17.27 4643 5530 KA115 . . . . . . . . 10 . KA197 KA197 -0.31 -1.24 4 3 27.30 9.77 6.12 19.03 4517 4542 KA198 KA198 -0.70 -2.25 4 3 22.93 9.90 6.21 12.06 2994 2938 KA2 9 KA2 9 -0.98 -1.50 4 3 20.84 11.83 5.87 18.23 2944 2772 KA260 KA260 1.29 2.36 5 5 33.50 15.50 7.18 39.02 6739 6324 KA269 KA269 -1.20 0.25 3 4 26.88 13.90 6.19 27.62 5569 5451 KA5 5 KA5 5 0.80 1.47 4 5 27.13 17.27 6.93 33.13 2494 2543 KA6 5 KA6 5 1.16 1.29 5 5 36.75 15.13 6.15 30.58 4062 3629 KA6 6 KA6 6 -2.02 -3.03 3 2 13.87 5.97 3.65 18.83 2785 3055 KA6 7 5.30 . 6 . . . . . 114 . KA7 1 KA7 1 -1.97 0.68 3 4 50.92 20.16 5.92 13.71 1807 2029 KA7 2 KA7 2 -4.44 -4.22 2 2 15.98 6.01 1.51 11.73 5636 6007 KA7 3 KA7 3 -0.90 -0.86 4 4 29.20 10.94 5.94 20.50 12200 11552 KA7 4 KA7 4 -6.40 -5.60 1 1 5.23 4.55 0.65 8.23 8440 9217 KA8 0 KA8 0 2.63 3.26 5 6 50.10 19.09 8.13 33.19 8525 7917
Page 32
Page 29 - Carstairs Scores for Scottish Postcode Sectors from the 1991 Census
Public Health Research Unit, University of Glasgow
Appendix II (continued)
Health Board
Local government district Post code sector
Carstairs score DEPCAT No car
Unempl -oyment
Over crowding
Social class 4&5 Population
1981 1991 1981 1991 1981 1991 1991 1991 1991 1991 1981 1991 KA8 8 KA8 8 0.07 1.28 4 5 48.67 15.12 6.28 24.48 4048 3875 KA8 9 KA8 9 2.78 2.84 5 5 49.08 17.74 10.83 26.08 8651 8440 KA9 1 KA9 1 -2.79 -2.24 3 3 25.77 7.47 4.54 16.57 7361 7697 KA9 2 KA9 2 -3.36 -3.14 2 2 20.20 7.49 2.64 15.27 7241 7161 Borders Berwickshire TD106 TD106 -2.23 -2.72 3 3 14.91 6.60 4.87 17.95 1028 1014 TD113 TD113 -2.36 -1.84 3 3 15.89 5.16 3.99 28.31 6147 6532 TD124 TD124 -2.41 -1.40 3 3 18.67 7.51 3.24 29.78 2436 2689 TD135 TD135 -3.56 -0.30 2 4 11.83 12.14 2.44 39.39 474 574 TD145 TD145 -0.38 -0.71 4 4 23.57 8.26 4.66 29.82 5884 6302 TD151 TD151 -2.35 -4.08 3 2 8.25 7.03 2.60 13.48 982 1041 TD2 6 . . . . . . . . 12 . TD3 6 TD3 6 -3.67 -2.97 2 3 8.69 5.45 5.59 18.57 671 770 TD4 6 -5.46 . 1 . . . . . 32 . TD5 7 TD5 7 -4.04 -1.05 2 4 3.57 2.17 2.39 47.37 230 252 Borders Ettrick &
Lauderdale EH375 . . . . . . . . 5 .
EH385 EH385 3.81 -3.99 6 2 8.88 5.93 2.64 15.00 288 304 EH436 . . . . . . . . 10 . EH446 . . . . . . . . 0 . TD1 1 TD1 1 -0.92 -1.58 4 3 32.05 7.02 4.88 19.05 4821 5097 TD1 2 TD1 2 -0.44 -0.86 4 4 31.79 9.28 6.38 20.05 5904 6192 TD1 3 TD1 3 -4.16 -2.83 2 3 20.75 5.51 2.36 20.28 3500 4514 TD2 6 TD2 6 -4.49 -3.04 2 2 11.38 4.57 1.72 25.23 1415 1755 TD3 6 TD3 6 -5.64 -4.93 1 1 5.38 3.13 0.00 16.67 75 93 TD4 6 TD4 6 -1.87 -2.37 3 3 17.45 5.93 2.55 25.00 1937 2006
Page 33
Page 30 - Carstairs Scores for Scottish Postcode Sectors from the 1991 Census
Public Health Research Unit, University of Glasgow
Appendix II (continued)
Health Board
Local government district Post code sector
Carstairs score DEPCAT No car
Unempl -oyment
Over crowding
Social class 4&5 Population
1981 1991 1981 1991 1981 1991 1991 1991 1991 1991 1981 1991 TD5 7 -1.43 . 3 . . . . . 33 . TD5 8 TD5 8 -6.46 -3.68 1 2 0.00 0.00 0.00 33.33 74 63 TD6 0 TD6 0 -2.57 -2.50 3 3 17.36 6.13 3.10 22.64 2750 2949 TD6 9 TD6 9 -4.40 -3.63 2 2 11.37 3.18 2.50 20.00 3246 3626 TD7 4 TD7 4 -2.10 -2.83 3 3 21.72 3.96 2.54 21.02 4296 4650 TD7 5 TD7 5 -0.66 -1.67 4 3 23.10 5.90 6.13 21.28 2581 2789 TD9 7 . . . . . . . . 22 . Borders Roxburgh DG140 . . . . . . . . 5 . TD3 6 . . . . . . . . 8 . TD5 7 TD5 7 -2.23 -1.83 3 3 19.87 4.60 1.68 31.56 5616 6079 TD5 8 TD5 8 -3.45 -3.11 2 2 7.74 7.23 2.33 22.44 3282 3510 TD6 9 TD6 9 -4.60 -0.12 2 4 3.08 12.82 4.72 40.00 55 129 TD8 6 TD8 6 -1.92 -1.25 3 3 22.08 6.73 3.43 29.88 5641 5812 TD9 0 TD9 0 -0.28 -1.10 4 4 32.24 6.38 3.25 26.92 4933 4716 TD9 7 TD9 7 -1.65 -1.97 3 3 29.01 6.88 2.49 21.97 4389 4332 TD9 8 TD9 8 0.49 2.02 4 5 34.90 13.63 7.46 36.82 5967 6033 TD9 9 TD9 9 -2.75 -2.14 3 3 27.94 6.39 1.65 23.17 4690 4735 Borders Tweedale EH268 . . . . . . . . 3 . EH269 EH269 2.17 -3.41 5 2 2.04 9.38 0.00 25.00 91 97 EH436 EH436 0.28 0.55 4 4 32.54 13.66 4.90 30.23 773 716 EH446 EH446 -1.08 -0.09 3 4 25.14 11.55 5.59 29.15 2700 2874 EH458 EH458 -1.82 -2.49 3 3 27.81 8.36 4.70 12.22 4446 5003 EH459 EH459 -2.14 -3.10 3 2 17.84 5.38 4.33 15.59 3045 3362 EH467 EH467 -2.98 -4.28 3 2 6.12 3.79 4.04 13.29 1899 2327 ML126 ML126 -3.49 -3.59 2 2 8.34 6.11 1.92 20.00 810 944
Page 34
Page 31 - Carstairs Scores for Scottish Postcode Sectors from the 1991 Census
Public Health Research Unit, University of Glasgow
Appendix II (continued)
Health Board
Local government district Post code sector
Carstairs score DEPCAT No car
Unempl -oyment
Over crowding
Social class 4&5 Population
1981 1991 1981 1991 1981 1991 1991 1991 1991 1991 1981 1991 TD1 3 . . . . . . . . 12 . Dumfries & Galloway
Annandale & Eskdale
CA6 5 CA6 5 -0.51 -0.86 4 4 23.74 7.76 5.12 28.02 3124 3499
DG1 3 . . . . . . . . 5 . DG1 4 DG1 4 -2.03 -6.33 3 1 7.00 3.75 1.64 0.00 244 263 DG109 DG109 -2.50 -1.93 3 3 20.25 6.48 3.39 25.23 3125 3564 DG111 DG111 -3.03 -3.29 2 2 14.11 4.40 5.94 13.58 4006 4329 DG112 DG112 -2.58 -1.34 3 3 21.13 5.25 5.62 26.79 4610 5078 DG113 DG113 -1.01 -2.46 3 3 12.66 5.56 4.72 22.68 3071 3157 DG125 DG125 0.06 -0.45 4 4 29.94 8.00 3.90 30.73 5763 5741 DG126 DG126 -1.32 -0.98 3 4 26.84 8.16 5.49 24.36 6450 6839 DG130 DG130 -1.74 -1.74 3 3 23.92 7.23 3.61 23.89 3293 3282 DG140 DG140 -3.65 -3.02 2 2 8.86 4.03 3.75 23.17 1302 1335 TD7 5 . . . . . . . . 5 . TD9 0 . . . . . . . . 0 . Dumfries & Galloway
Nithsdale DG1 1 DG1 1 -1.52 -1.75 3 3 22.92 7.35 4.98 21.43 5762 5874
DG1 2 DG1 2 -1.13 0.90 3 4 45.57 15.17 4.92 25.37 2356 2385 DG1 3 DG1 3 -4.12 -3.14 2 2 13.96 4.66 3.07 20.34 4764 5453 DG1 4 DG1 4 -3.93 -4.05 2 2 12.23 4.22 2.72 14.52 9326 11331 DG111 DG111 -4.65 0.81 2 4 5.97 4.95 5.35 53.57 309 341 DG125 -7.41 . 1 . . . . . 42 . DG2 0 DG2 0 2.26 1.59 5 5 40.86 15.23 8.60 26.27 8294 7703 DG2 7 DG2 7 -1.94 -2.47 3 3 27.10 8.25 3.68 14.83 4617 4809
Page 35
Page 32 - Carstairs Scores for Scottish Postcode Sectors from the 1991 Census
Public Health Research Unit, University of Glasgow
Appendix II (continued)
Health Board
Local government district Post code sector
Carstairs score DEPCAT No car
Unempl -oyment
Over crowding
Social class 4&5 Population
1981 1991 1981 1991 1981 1991 1991 1991 1991 1991 1981 1991 DG2 8 DG2 8 -1.98 -1.89 3 3 10.86 5.62 3.80 30.23 1982 2531 DG2 9 DG2 9 0.70 1.04 4 5 39.52 12.71 7.08 27.83 7602 6904 DG3 4 DG3 4 -2.18 -2.69 3 3 15.47 6.23 3.25 21.53 2068 2093 DG3 5 DG3 5 -1.99 -2.26 3 3 15.54 4.99 3.27 26.45 2357 2466 DG4 6 DG4 6 2.32 1.56 5 5 35.99 16.67 5.44 33.12 5309 4962 KA184 . . . . . . . . 1 . ML126 ML126 -4.92 3.97 2 6 16.22 24.00 0.00 66.67 127 160 Dumfries & Galloway
Stewartry DG2 0 . . . . . . . . 6 .
DG2 8 DG2 8 -4.32 -3.65 2 2 10.03 4.83 3.66 16.49 1195 1243 DG2 9 . . . . . . . . 21 . DG3 4 DG3 4 . 4.86 . 6 6.17 3.85 0.00 100.00 30 81 DG5 4 DG5 4 -0.13 -1.30 4 3 21.62 8.18 4.48 26.10 4801 5393 DG6 4 DG6 4 -2.08 -1.16 3 4 20.99 6.49 3.97 30.37 5190 5359 DG7 1 DG7 1 -2.08 -1.54 3 3 18.93 6.49 4.52 26.97 5133 5427 DG7 2 DG7 2 -2.73 -2.06 3 3 10.42 5.71 3.50 29.50 2083 2271 DG7 3 DG7 3 -2.30 -2.87 3 3 9.91 8.12 2.36 22.49 3908 3855 KA6 7 . . . . . . . . 3 . Dumfries & Galloway
Wigtown DG7 2 . . . . . . . . 28 .
DG7 3 . . . . . . . . 10 . DG8 0 DG8 0 -2.98 -3.29 3 2 14.84 7.38 4.93 12.20 1964 1927 DG8 6 DG8 6 -1.78 -1.66 3 3 26.12 11.96 6.81 12.34 3946 4289 DG8 7 DG8 7 0.80 -0.79 4 4 19.20 14.75 4.70 24.42 1330 1286 DG8 8 DG8 8 -0.60 1.32 4 5 23.69 17.20 6.50 34.44 2447 2449
Page 36
Page 33 - Carstairs Scores for Scottish Postcode Sectors from the 1991 Census
Public Health Research Unit, University of Glasgow
Appendix II (continued)
Health Board
Local government district Post code sector
Carstairs score DEPCAT No car
Unempl -oyment
Over crowding
Social class 4&5 Population
1981 1991 1981 1991 1981 1991 1991 1991 1991 1991 1981 1991 DG8 9 DG8 9 -1.66 -2.73 3 3 16.13 10.88 3.55 15.49 3003 3093 DG9 0 DG9 0 -2.06 -1.82 3 3 21.00 11.60 5.44 16.47 4083 3849 DG9 7 DG9 7 3.00 2.16 6 5 43.94 16.57 8.01 29.47 5836 6567 DG9 8 DG9 8 -2.15 -2.33 3 3 19.53 8.43 5.15 16.67 4461 4242 DG9 9 DG9 9 -0.44 -0.42 4 4 16.72 12.01 5.19 30.72 2467 2375 KA260 . . . . . . . . 4 . Fife Dunfermline FK103 FK103 -2.68 -3.33 3 2 6.74 12.50 10.23 0.00 43 116 FK104 FK104 -1.27 0.78 3 4 22.69 10.92 7.79 34.19 3392 3236 FK147 . . . . . . . . 10 . KY111 KY111 -0.86 -0.42 4 4 35.45 11.63 6.68 19.10 6723 7052 KY112 KY112 -2.15 -1.16 3 4 32.14 7.36 5.30 21.40 12871 13400 KY113 KY113 -2.46 -1.27 3 3 21.47 9.80 4.49 24.69 3401 3413 KY114 KY114 -0.10 0.62 4 4 38.58 14.04 7.62 22.19 16432 15412 KY115 KY115 -5.79 -4.57 1 2 8.21 4.47 2.79 11.53 10845 13630 KY120 KY120 -2.01 -1.19 3 4 29.38 9.19 5.52 20.20 8127 9242 KY127 KY127 -5.26 -5.31 1 1 12.87 5.31 1.10 5.39 3815 5272 KY128 KY128 -2.06 -2.08 3 3 21.20 8.65 5.25 17.52 9732 10472 KY129 KY129 -1.89 -0.85 3 4 26.38 10.50 6.12 22.06 10437 11162 KY137 . . . . . . . . 5 . KY2 5 . . . . . . . . 25 . KY3 0 KY3 0 -5.19 -4.24 1 2 13.72 9.27 1.46 9.35 1630 1729 KY4 0 KY4 0 0.48 1.87 4 5 37.87 17.28 6.67 31.82 5684 5519 KY4 8 KY4 8 -0.64 0.60 4 4 37.09 11.78 6.47 27.30 5677 5580 KY4 9 KY4 9 0.37 0.45 4 4 34.75 14.92 6.37 24.14 8485 8586 KY5 0 . . . . . . . . 4 . KY5 8 KY5 8 3.16 3.97 6 6 46.54 25.98 10.53 29.14 7116 6393
Page 37
Page 34 - Carstairs Scores for Scottish Postcode Sectors from the 1991 Census
Public Health Research Unit, University of Glasgow
Appendix II (continued)
Health Board
Local government district Post code sector
Carstairs score DEPCAT No car
Unempl -oyment
Over crowding
Social class 4&5 Population
1981 1991 1981 1991 1981 1991 1991 1991 1991 1991 1981 1991 KY5 9 KY5 9 0.44 1.55 4 5 41.93 15.11 7.06 28.60 7325 7044 Fife Kirkcaldy KY1 1 KY1 1 -1.21 0.04 3 4 39.58 15.81 4.17 21.64 5294 5706 KY1 2 KY1 2 0.77 2.53 4 5 43.23 20.88 8.55 27.53 6531 7089 KY1 3 KY1 3 1.68 0.80 5 4 46.61 17.47 5.63 20.22 5570 5142 KY1 4 KY1 4 -0.77 -0.66 4 4 31.11 13.23 6.19 18.40 4585 4552 KY2 5 KY2 5 -1.40 -2.07 3 3 28.05 10.58 4.92 12.98 10274 11439 KY2 6 KY2 6 -1.29 0.01 3 4 29.76 11.65 6.97 24.96 19887 18995 KY3 0 KY3 0 0.77 2.10 4 5 37.28 16.37 8.11 32.18 2935 2682 KY3 9 KY3 9 -2.57 -2.49 3 3 24.99 8.27 3.88 15.25 5806 6356 KY5 0 KY5 0 0.71 2.33 4 5 39.15 18.14 7.79 32.06 7704 7099 KY5 8 . . . . . . . . 7 . KY6 1 KY6 1 -0.62 1.36 4 5 30.14 12.92 7.91 33.24 5631 5323 KY6 2 KY6 2 -1.94 -0.76 3 4 26.93 11.92 6.29 20.71 9737 9786 KY6 3 KY6 3 -2.14 -2.97 3 3 21.10 8.22 4.21 12.47 3770 5035 KY7 4 KY7 4 -0.01 -1.19 4 3 28.01 11.53 5.30 18.82 9130 9839 KY7 5 KY7 5 -0.43 -0.15 4 4 25.69 10.05 6.22 28.67 4634 4860 KY7 6 KY7 6 -2.00 -0.99 3 4 25.61 11.15 5.13 22.46 7486 11228 KY8 1 KY8 1 1.06 1.11 5 5 42.23 21.36 6.13 20.00 5566 5245 KY8 2 KY8 2 2.50 4.18 5 6 42.41 23.00 9.12 38.85 6638 5833 KY8 3 KY8 3 1.75 1.01 5 4 44.37 18.95 5.86 21.10 6091 5991 KY8 4 KY8 4 -0.69 0.27 4 4 36.46 13.27 5.23 25.70 5864 5977 KY8 5 KY8 5 0.63 0.24 4 4 28.04 14.01 7.57 24.19 9573 8876 Fife North East
Fife DD6 8 DD6 8 -5.28 -4.16 1 2 11.93 3.60 2.45 14.82 4522 5414
DD6 9 DD6 9 -0.91 -1.73 4 3 30.28 7.64 4.65 18.36 3118 3460
Page 38
Page 35 - Carstairs Scores for Scottish Postcode Sectors from the 1991 Census
Public Health Research Unit, University of Glasgow
Appendix II (continued)
Health Board
Local government district Post code sector
Carstairs score DEPCAT No car
Unempl -oyment
Over crowding
Social class 4&5 Population
1981 1991 1981 1991 1981 1991 1991 1991 1991 1991 1981 1991 KY102 KY102 -0.53 -2.12 4 3 22.98 7.29 4.95 18.38 3189 3374 KY103 KY103 -1.11 -1.28 3 3 23.55 8.79 4.82 24.05 4370 5098 KY137 KY137 1.14 -1.17 5 4 6.38 1.82 0.00 50.00 34 140 KY146 KY146 -0.24 -1.31 4 3 24.01 7.74 4.98 24.32 2542 2571 KY147 KY147 -1.89 -1.73 3 3 17.17 7.47 6.89 20.55 3389 3622 KY154 KY154 -1.93 -2.01 3 3 21.99 6.82 4.77 20.60 5143 5890 KY155 KY155 -4.15 -3.59 2 2 15.34 5.27 4.32 12.70 6842 7164 KY160 KY160 -4.07 -4.03 2 2 16.43 2.83 3.24 13.02 4362 5181 KY168 KY168 -2.06 -1.84 3 3 23.94 6.50 4.88 21.25 9170 9289 KY169 KY169 -3.98 -3.76 2 2 23.38 5.86 2.34 10.59 3385 4149 KY6 3 . . . . . . . . 24 . KY7 6 . . . . . . . . 23 . KY7 7 KY7 7 -2.79 -3.36 3 2 12.86 6.47 4.62 14.05 5927 6514 KY8 5 KY8 5 -4.51 -3.23 2 2 6.33 10.67 3.46 16.28 436 519 KY8 6 KY8 6 -3.82 -4.04 2 2 13.79 5.48 2.91 12.10 2031 2473 KY9 1 KY9 1 -2.33 -2.91 3 3 14.03 6.69 3.61 19.18 1756 2030 Forth Valley Clackmannan FK101 FK101 2.57 2.87 5 6 45.96 22.12 8.53 27.85 5312 4955 FK102 FK102 -0.58 -0.11 4 4 30.61 12.36 6.63 23.49 13047 13187 FK103 FK103 -0.82 -0.03 4 4 32.79 13.43 6.32 22.57 8933 8695 FK104 FK104 -1.30 -0.55 3 4 26.59 12.94 6.47 21.34 3399 3555 FK117 FK117 -3.14 -3.17 2 2 17.16 7.26 4.39 13.29 2207 2274 FK125 FK125 -1.38 -1.22 3 3 24.04 10.12 5.52 21.54 4872 5201 FK136 FK136 -1.83 -1.18 3 4 26.76 9.65 4.98 22.14 6185 6208 FK147 FK147 -5.74 -4.37 1 2 8.22 7.58 1.79 12.08 3213 3532 FK7 7 . . . . . . . . 0 . FK9 5 . . . . . . . . 7 .
Page 39
Page 36 - Carstairs Scores for Scottish Postcode Sectors from the 1991 Census
Public Health Research Unit, University of Glasgow
Appendix II (continued)
Health Board
Local government district Post code sector
Carstairs score DEPCAT No car
Unempl -oyment
Over crowding
Social class 4&5 Population
1981 1991 1981 1991 1981 1991 1991 1991 1991 1991 1981 1991 KY137 KY137 -4.44 -7.23 2 1 5.63 0.00 0.00 0.00 181 72 Forth Valley Falkirk EH496 EH496 3.34 0.20 6 4 33.75 13.19 5.38 26.23 1040 966 EH497 EH497 -1.25 -0.26 3 4 10.30 10.22 3.68 40.00 452 436 EH510 EH510 -0.77 -0.52 4 4 29.20 12.06 4.35 25.41 7327 7194 EH519 EH519 -0.07 0.46 4 4 32.10 13.93 5.24 28.70 7489 7516 FK1 1 FK1 1 -1.58 -0.87 3 4 46.27 12.06 2.17 18.38 3361 3052 FK1 2 FK1 2 -0.48 0.17 4 4 28.62 14.61 5.91 25.95 7658 8033 FK1 3 FK1 3 0.33 1.07 4 5 31.14 16.09 8.37 26.11 2140 1978 FK1 4 FK1 4 0.93 1.93 4 5 46.38 19.38 6.61 26.18 8770 8046 FK1 5 FK1 5 -3.90 -3.72 2 2 17.87 7.56 2.51 11.56 7083 7349 FK2 0 FK2 0 -3.19 -2.88 2 3 14.27 7.24 2.68 20.54 11245 12216 FK2 7 FK2 7 1.84 2.39 5 5 46.90 19.68 7.18 28.48 7827 8734 FK2 8 FK2 8 0.05 -0.58 4 4 26.80 9.89 5.68 25.65 5556 6075 FK2 9 FK2 9 1.49 0.82 5 4 40.00 16.39 6.24 23.53 11576 10357 FK3 0 FK3 0 1.28 2.63 5 5 39.32 16.94 6.23 38.94 7582 5728 FK3 8 FK3 8 1.12 2.01 5 5 39.70 13.01 6.16 37.61 8584 7985 FK3 9 FK3 9 0.23 0.24 4 4 30.50 11.47 3.82 32.97 5578 5026 FK4 1 FK4 1 -0.22 -1.00 4 4 31.29 10.96 5.75 18.60 8544 8651 FK4 2 FK4 2 1.03 1.55 5 5 36.48 14.73 7.00 31.75 2167 2001 FK5 3 FK5 3 -1.82 -1.44 3 3 27.32 12.28 5.16 16.57 5080 4743 FK5 4 FK5 4 -2.95 -2.55 3 3 21.76 6.98 3.14 19.11 11236 11541 FK6 5 FK6 5 -1.38 -1.55 3 3 23.50 10.61 7.12 15.35 7638 7777 FK6 6 FK6 6 1.75 0.64 5 4 37.29 17.07 7.65 19.83 5759 5492 FK7 7 FK7 7 -2.65 -3.09 3 2 14.29 19.23 5.88 0.00 67 84 G67 3 . . . . . . . . 7 . G68 0 . . . . . . . . 5 .
Page 40
Page 37 - Carstairs Scores for Scottish Postcode Sectors from the 1991 Census
Public Health Research Unit, University of Glasgow
Appendix II (continued)
Health Board
Local government district Post code sector
Carstairs score DEPCAT No car
Unempl -oyment
Over crowding
Social class 4&5 Population
1981 1991 1981 1991 1981 1991 1991 1991 1991 1991 1981 1991 Forth Valley Stirling FK150 FK150 -5.21 -3.70 1 2 11.57 5.31 3.41 15.30 3022 3348 FK159 FK159 -4.93 -4.25 2 2 12.73 7.23 2.44 10.00 4393 4659 FK166 FK166 -2.08 -3.03 3 2 14.00 8.41 5.29 13.04 1702 1971 FK178 FK178 -3.48 -3.84 2 2 16.41 4.96 5.41 8.18 2877 3268 FK188 FK188 4.45 -0.64 6 4 8.48 4.00 6.51 38.46 172 185 FK198 FK198 -4.97 -0.95 2 4 13.74 3.76 9.44 27.78 409 449 FK2 8 FK2 8 -8.40 -7.06 1 1 0.00 4.00 0.00 0.00 69 63 FK208 FK208 -4.59 -1.64 2 3 22.18 1.82 0.71 36.84 345 315 FK218 FK218 -2.55 -1.38 3 3 16.31 8.81 8.85 18.75 724 874 FK5 4 . . . . . . . . 2 . FK6 5 FK6 5 -0.92 -6.60 4 1 0.00 7.89 0.00 0.00 87 93 FK6 6 FK6 6 . -6.18 . 1 5.61 2.99 3.03 0.00 20 197 FK7 0 FK7 0 -0.54 0.32 4 4 39.39 13.73 7.41 19.94 7317 6871 FK7 7 FK7 7 1.54 0.57 5 4 33.97 13.91 7.48 24.44 8757 8797 FK7 8 FK7 8 -0.23 -0.20 4 4 28.78 11.37 7.30 23.29 4453 4836 FK7 9 FK7 9 -0.83 -1.92 4 3 30.28 11.23 4.47 13.42 7089 6747 FK8 1 FK8 1 3.60 3.90 6 6 52.97 22.75 11.22 27.43 8509 7761 FK8 2 FK8 2 -5.62 -5.55 1 1 13.32 4.85 1.70 2.42 3320 3294 FK8 3 FK8 3 -3.95 -3.75 2 2 9.79 5.50 3.24 15.91 5092 5445 FK9 4 FK9 4 -4.28 -4.48 2 2 13.86 6.69 3.24 6.39 5362 5469 FK9 5 FK9 5 -1.91 -1.71 3 3 28.75 10.28 4.13 17.58 5210 5081 G62 8 G62 8 -7.78 -7.50 1 1 0.83 0.00 0.00 0.00 81 121 G63 0 G63 0 -4.05 -4.15 2 2 10.67 4.28 3.47 12.82 3740 4568 G63 9 G63 9 -6.61 -5.69 1 1 7.24 4.27 1.46 5.14 4148 4366 G83 7 . . . . . . . . 16 . G83 8 G83 8 . -7.54 . 1 0.00 0.00 0.00 0.00 7 55 G83 9 . . . . . . . . 6 .
Page 41
Page 38 - Carstairs Scores for Scottish Postcode Sectors from the 1991 Census
Public Health Research Unit, University of Glasgow
Appendix II (continued)
Health Board
Local government district Post code sector
Carstairs score DEPCAT No car
Unempl -oyment
Over crowding
Social class 4&5 Population
1981 1991 1981 1991 1981 1991 1991 1991 1991 1991 1981 1991 Grampian Aberdeen City AB1 0 AB1 0 -3.99 -4.37 2 2 10.21 2.75 3.43 12.81 6313 7312 AB1 1 AB1 1 0.12 -0.23 4 4 52.70 7.82 4.81 19.94 4681 4695 AB1 2 AB1 2 -2.88 -2.73 3 3 29.50 6.59 3.89 12.74 5851 6080 AB1 3 AB1 3 0.83 2.69 4 5 54.45 10.23 11.68 28.30 10882 9707 AB1 4 AB1 4 -0.04 -1.81 4 3 20.45 3.93 6.98 21.74 5175 6988 AB1 5 AB1 5 -0.02 -0.35 4 4 35.74 5.08 7.05 25.59 10048 8822 AB1 6 AB1 6 -4.93 -4.32 2 2 22.79 3.71 1.79 9.37 12582 13170 AB1 7 AB1 7 -3.41 -3.45 2 2 24.49 4.57 3.93 11.00 12913 12571 AB1 8 AB1 8 -5.44 -5.25 1 1 12.16 2.04 1.68 8.44 4458 5498 AB1 9 AB1 9 -7.17 -6.45 1 1 4.86 2.83 0.51 3.14 5679 7014 AB2 0 AB2 0 -3.08 -3.00 2 2 14.32 3.21 5.43 18.26 7095 6724 AB2 1 AB2 1 1.44 2.33 5 5 58.29 10.37 9.54 27.36 9763 9945 AB2 2 AB2 2 0.96 2.56 4 5 49.54 11.56 10.32 30.84 14445 13700 AB2 3 AB2 3 -0.48 0.13 4 4 44.75 8.81 7.21 21.19 9887 9605 AB2 4 AB2 4 -4.61 -4.28 2 2 25.17 3.11 2.74 7.36 11748 12589 AB2 5 AB2 5 0.44 0.77 4 4 40.33 6.47 8.57 28.56 15733 14126 AB2 6 AB2 6 -0.67 -0.11 4 4 32.81 5.33 9.98 23.05 15858 15549 AB2 7 AB2 7 3.46 3.18 6 6 45.91 12.30 13.57 30.81 13677 11549 AB2 8 AB228 -3.46 -4.69 2 1 10.65 1.69 3.90 10.01 14103 15418 AB2 9 AB2 9 -2.20 -1.89 3 3 23.51 3.48 7.08 19.86 8661 8059 AB3 3 . . . . . . . . 23 . AB3 6 . . . . . . . . 22 . AB4 0 AB238 . -4.28 . 2 12.73 2.19 3.13 13.55 2 5764 AB5 0 -0.80 . 4 . . . . . 225 .
Page 42
Page 39 - Carstairs Scores for Scottish Postcode Sectors from the 1991 Census
Public Health Research Unit, University of Glasgow
Appendix II (continued)
Health Board
Local government district Post code sector
Carstairs score DEPCAT No car
Unempl -oyment
Over crowding
Social class 4&5 Population
1981 1991 1981 1991 1981 1991 1991 1991 1991 1991 1981 1991 Grampian Banff &
Buchan AB441 . 1.18 . 5 29.33 8.24 6.34 40.00 . 3894
AB518 . -3.24 . 2 7.36 2.08 2.97 25.53 . 1440 AB536 . -3.82 . 2 10.53 4.47 3.10 16.28 . 1065 AB4 0 AB410 -6.39 -7.49 1 1 0.97 0.00 0.00 0.00 99 103 AB4 1 AB451 0.12 -0.93 4 4 30.14 7.71 5.56 23.55 7728 4110 AB4 2 AB452 -1.89 -0.46 3 4 18.86 7.39 5.74 33.03 4921 4834 AB4 3 AB453 -1.26 -1.54 3 3 7.73 5.37 5.42 31.84 2357 2540 AB4 4 AB434 -0.80 -1.36 4 3 18.57 8.24 6.35 23.35 7734 8129 AB4 5 AB435 0.84 0.82 4 4 30.68 9.19 7.90 32.25 15170 15361 AB4 6 AB426 0.76 0.72 4 4 31.32 8.39 5.50 36.57 16669 17665 AB4 7 AB427 -2.13 -2.63 3 3 13.33 4.92 4.96 21.07 7173 8183 AB4 8 AB428 -2.52 -3.08 3 2 11.26 4.30 5.81 17.15 6558 6221 AB4 9 AB418 -5.74 -4.20 1 2 4.69 4.28 5.61 11.11 462 767 AB5 0 AB510 0.44 -2.58 4 3 0.00 0.00 0.00 42.86 55 55 AB5 2 . . . . . . . . 34 . AB5 5 AB545 -1.93 -1.30 3 3 16.83 5.35 7.96 24.51 1618 1562 AB5 6 AB546 1.67 -7.12 5 1 0.90 3.13 0.00 0.00 101 111 AB5 7 AB537 -3.37 -2.59 2 3 15.20 4.38 4.46 22.01 6135 6869 AB5 8 AB538 -4.04 -2.99 2 3 7.39 3.94 6.74 18.32 3268 2394 AB5 9 -6.36 . 1 . . . . . 30 . Grampian Gordon AB238 . -4.83 . 1 5.25 2.34 3.51 11.52 . 3698 AB327 . -2.87 . 3 6.32 1.11 3.63 28.95 . 743 AB368 . -4.17 . 2 4.42 5.15 3.75 14.29 . 455 AB418 . -3.12 . 2 5.49 3.85 4.18 23.30 . 1892 AB546 . -3.88 . 2 6.46 2.53 8.26 9.59 . 821
Page 43
Page 40 - Carstairs Scores for Scottish Postcode Sectors from the 1991 Census
Public Health Research Unit, University of Glasgow
Appendix II (continued)
Health Board
Local government district Post code sector
Carstairs score DEPCAT No car
Unempl -oyment
Over crowding
Social class 4&5 Population
1981 1991 1981 1991 1981 1991 1991 1991 1991 1991 1981 1991 AB1 8 AB1 8 -6.25 -6.91 1 1 3.16 3.85 0.00 0.00 65 94 AB2 0 AB2 0 -5.16 -4.70 1 1 5.98 2.23 3.59 12.30 531 5017 AB2 8 -7.63 . 1 . . . . . 81 . AB3 3 . . . . . . . . 0 . AB3 4 AB314 -2.60 -5.30 3 1 1.85 3.19 2.60 10.00 27 270 AB3 6 AB326 -5.93 -5.73 1 1 3.47 1.92 1.92 8.18 6616 9658 AB3 7 AB517 -4.29 -5.41 2 1 3.55 1.54 3.98 7.24 2266 1859 AB3 8 AB338 -4.08 -4.87 2 1 7.36 1.89 2.83 11.97 3200 3488 AB4 0 AB410 -4.00 -4.83 2 1 6.55 3.39 3.58 9.70 8299 6904 AB4 7 . . . . . . . . 25 . AB4 8 . . . . . . . . 3 . AB4 9 AB419 -4.21 -3.81 2 2 11.00 2.43 3.59 17.30 7960 8461 AB5 0 AB510 -4.80 -4.10 2 2 7.54 2.21 3.99 15.92 9132 6935 AB5 3 AB553 -8.48 -5.20 1 1 2.21 10.20 4.38 0.00 34 136 AB5 4 AB544 -3.10 -0.98 2 4 10.73 5.46 6.88 32.27 2628 2652 AB5 5 AB545 -1.49 -1.45 3 3 29.63 6.51 6.01 19.61 4327 4623 AB5 6 AB526 -4.26 -3.97 2 2 9.45 3.02 5.66 11.94 3599 3521 AB5 8 AB518 -6.03 -6.62 1 1 4.92 3.28 1.10 0.00 233 182 AB5 9 AB519 -3.37 -3.03 2 2 15.17 2.98 5.54 17.58 12766 15233 Grampian Kincardine &
Deeside AB344 . -2.12 . 3 12.05 4.95 4.56 26.87 . 981
AB355 . -2.04 . 3 16.99 2.56 4.56 27.59 . 2576 AB1 0 AB1 0 -5.92 -2.84 1 3 3.12 2.59 6.23 24.14 345 385 AB1 4 AB1 4 -4.56 -4.10 2 2 8.48 2.45 3.98 15.26 3456 6925 AB1 5 AB1 5 -6.31 -5.70 1 1 2.76 2.30 5.21 1.96 598 689 AB3 1 AB301 -2.42 -2.86 3 3 10.98 3.77 4.47 22.40 4821 5379
Page 44
Page 41 - Carstairs Scores for Scottish Postcode Sectors from the 1991 Census
Public Health Research Unit, University of Glasgow
Appendix II (continued)
Health Board
Local government district Post code sector
Carstairs score DEPCAT No car
Unempl -oyment
Over crowding
Social class 4&5 Population
1981 1991 1981 1991 1981 1991 1991 1991 1991 1991 1981 1991 AB3 2 AB3 2 -4.34 -4.03 2 2 12.53 2.64 3.31 15.03 11889 14526 AB3 3 AB313 -4.73 -4.77 2 1 8.17 2.46 3.72 10.07 6693 9143 AB3 4 AB314 -4.50 -3.88 2 2 6.45 2.07 3.69 19.06 3698 3575 AB3 5 AB345 -2.82 -3.60 3 2 11.10 2.24 4.00 18.45 4795 3190 AB3 7 . . . . . . . . 8 . AB3 8 AB338 2.09 -6.36 5 1 1.25 0.00 4.88 0.00 66 81 DD100 DD100 -1.15 -2.36 3 3 17.49 4.22 4.28 23.43 3925 5107 DD9 7 DD9 7 -7.37 -5.98 1 1 7.69 0.27 1.93 5.71 715 885 Grampian Moray AB3 9 AB389 -3.06 -0.94 2 4 14.69 5.18 5.14 34.33 3114 1927 AB4 2 . . . . . . . . 7 . AB5 1 AB561 0.36 1.76 4 5 33.31 7.56 6.09 44.28 7807 7979 AB5 2 AB562 -0.57 -0.54 4 4 23.78 6.47 4.93 32.50 5810 6343 AB5 3 AB553 -0.62 -0.90 4 4 23.15 6.70 5.88 27.55 6525 6933 AB5 4 AB554 -2.08 -1.19 3 3 18.04 6.11 5.92 28.06 2262 2165 AB5 5 AB545 -1.57 -3.29 3 2 7.35 5.88 6.48 14.29 562 583 IV301 IV301 -4.60 -2.83 2 3 26.19 7.04 2.30 16.18 4587 4916 IV302 IV302 -1.62 -1.50 3 3 24.68 6.79 5.69 21.98 10559 10693 IV303 IV303 -1.88 -2.00 3 3 20.98 6.32 5.96 19.33 11616 12481 IV316 IV316 -1.64 -1.43 3 3 27.57 5.70 5.40 22.81 6716 7248 IV327 IV327 -3.04 -2.36 2 3 15.07 5.61 4.78 22.19 4082 4453 IV337 AB387 -0.09 -1.19 4 3 20.39 7.06 5.78 26.24 1512 2088 IV347 AB379 -2.29 -2.09 3 3 10.75 7.75 3.99 25.97 373 1318 IV357 AB544 -1.96 -0.65 3 4 6.58 22.22 0.00 33.33 313 76 IV360 IV360 -2.97 -3.00 3 2 20.07 7.14 3.67 14.82 14295 14413 PH263 . . . . . . . . 11 .
Page 45
Page 42 - Carstairs Scores for Scottish Postcode Sectors from the 1991 Census
Public Health Research Unit, University of Glasgow
Appendix II (continued)
Health Board
Local government district Post code sector
Carstairs score DEPCAT No car
Unempl -oyment
Over crowding
Social class 4&5 Population
1981 1991 1981 1991 1981 1991 1991 1991 1991 1991 1981 1991 Greater Glasgow
Bearsden & Milngavie
G61 1 G61 1 -5.18 -4.15 1 2 10.94 5.25 4.34 9.96 6554 6348
G61 2 G61 2 -6.63 -6.14 1 1 5.40 4.59 1.65 1.46 6417 6764 G61 3 G61 3 -6.96 -5.85 1 1 6.50 3.97 1.37 4.62 6678 6523 G61 4 G61 4 -5.91 -4.86 1 1 6.21 5.48 4.14 6.32 7502 8171 G62 6 G62 6 -5.67 -5.55 1 1 16.54 5.04 1.55 0.91 3351 3700 G62 7 G62 7 -2.61 -2.24 3 3 21.85 9.34 6.13 13.38 6207 6602 G62 8 G62 8 -5.43 -5.50 1 1 14.74 5.91 1.72 1.02 2626 2504 G63 9 . . . . . . . . 2 . G81 5 . . . . . . . . 14 . Greater Glasgow
Clydebank G13 4 . . . . . . . . 4 .
G15 8 . . . . . . . . 0 . G60 5 G60 5 -1.37 -1.01 3 4 34.16 12.17 6.78 13.87 2997 2882 G81 1 G81 1 3.68 3.18 6 6 57.51 20.86 10.75 21.90 7049 6364 G81 2 G81 2 3.65 3.52 6 6 54.11 20.37 8.67 31.06 9150 7442 G81 3 G81 3 1.79 1.30 5 5 50.80 16.31 7.47 20.05 9301 7523 G81 4 G81 4 2.66 3.93 5 6 59.10 22.89 7.46 31.91 7483 7368 G81 5 G81 5 3.97 4.20 6 6 56.91 23.63 13.51 22.64 8501 6530 G81 6 G81 6 -1.15 -1.73 3 3 26.01 11.00 8.35 9.73 7514 7608 Greater Glasgow
Eastwood G44 3 G44 3 -6.75 -6.01 1 1 10.72 4.51 0.57 2.27 4003 4729
G46 6 G46 6 -6.79 -5.37 1 1 7.64 4.13 3.31 4.23 8307 9457 G46 7 G46 7 -4.60 -3.54 2 2 16.34 6.17 5.44 9.52 6374 7047 G46 8 G46 8 0.63 -0.13 4 4 52.07 17.60 10.40 0.00 539 531
Page 46
Page 43 - Carstairs Scores for Scottish Postcode Sectors from the 1991 Census
Public Health Research Unit, University of Glasgow
Appendix II (continued)
Health Board
Local government district Post code sector
Carstairs score DEPCAT No car
Unempl -oyment
Over crowding
Social class 4&5 Population
1981 1991 1981 1991 1981 1991 1991 1991 1991 1991 1981 1991 G76 0 G76 0 -5.11 -4.19 1 2 10.06 5.44 3.71 11.08 4739 4722 G76 7 G76 7 -6.36 -5.82 1 1 6.83 3.98 1.15 5.19 8521 8530 G76 8 G76 8 -2.81 -2.71 3 3 23.30 7.51 8.04 6.84 5678 5852 G77 5 G77 5 -7.31 -6.25 1 1 4.05 4.06 0.84 3.35 8189 9112 G77 6 G77 6 -4.99 -5.04 2 1 9.52 5.67 2.93 5.35 7039 9979 G78 2 . . . . . . . . 6 . G78 3 . . . . . . . . 0 . Greater Glasgow
Glasgow City G1 1 G1 1 1.73 -2.34 5 3 51.72 7.84 4.54 2.74 212 1123
G1 2 G1 2 4.17 7.95 6 7 90.36 38.46 0.00 50.00 347 280 G1 3 . . . . . . . . 42 . G1 4 G1 4 -1.23 -2.28 3 3 42.86 7.69 0.00 16.67 77 84 G1 5 G1 5 11.66 8.25 7 7 86.80 45.61 5.13 36.84 934 818 G11 5 G11 5 1.84 0.75 5 4 53.58 14.74 10.02 10.58 6507 6033 G11 6 G11 6 4.62 4.66 6 6 70.85 20.03 9.26 31.96 2516 2445 G11 7 G11 7 -1.38 -0.84 3 4 44.92 10.04 7.06 11.70 9268 8631 G12 0 G12 0 -5.20 -4.16 1 2 20.10 7.08 4.81 2.60 8127 8811 G12 8 G12 8 0.11 2.94 4 6 56.38 24.70 11.55 14.79 5801 4798 G12 9 G12 9 -4.09 -3.42 2 2 32.45 9.11 4.16 2.21 7811 7943 G13 1 G13 1 -0.53 -0.81 4 4 36.06 10.20 7.45 15.34 6933 7354 G13 2 G13 2 3.50 4.62 6 6 58.75 24.59 10.10 31.15 8696 7756 G13 3 G13 3 0.55 2.73 4 5 57.76 21.36 7.90 22.97 11060 9779 G13 4 G13 4 4.56 4.26 6 6 55.21 23.23 13.66 24.11 7037 5740 G14 0 G14 0 5.83 6.41 6 7 66.11 27.41 14.61 31.22 8796 7547 G14 9 G14 9 -0.81 0.14 4 4 44.77 15.68 6.90 14.74 9988 9408 G15 6 G15 6 0.94 2.15 4 5 52.70 18.74 6.49 25.85 7103 6251
Page 47
Page 44 - Carstairs Scores for Scottish Postcode Sectors from the 1991 Census
Public Health Research Unit, University of Glasgow
Appendix II (continued)
Health Board
Local government district Post code sector
Carstairs score DEPCAT No car
Unempl -oyment
Over crowding
Social class 4&5 Population
1981 1991 1981 1991 1981 1991 1991 1991 1991 1991 1981 1991 G15 7 G15 7 8.46 10.64 7 7 79.21 43.17 18.42 37.58 14644 9937 G15 8 G15 8 9.67 8.99 7 7 79.61 40.79 17.59 27.18 10016 5743 G2 1 . . . . . . . . 26 . G2 2 8.46 . 7 . . . . . 32 . G2 3 G2 3 -1.29 3.14 3 6 85.28 45.21 2.03 0.00 187 215 G2 4 G2 4 5.83 2.85 6 6 68.57 26.47 3.85 21.43 200 106 G2 5 . . . . . . . . 36 . G2 6 G2 6 12.82 11.55 7 7 56.45 5.88 15.87 100.00 53 101 G2 7 G2 7 5.52 9.22 6 7 89.61 59.18 3.37 33.33 451 396 G2 8 G2 8 11.39 -2.06 7 3 57.65 11.90 3.57 0.00 39 90 G20 0 G20 0 5.56 5.19 6 6 63.10 26.87 12.83 26.18 7339 7490 G20 6 G20 6 0.94 -0.39 4 4 49.23 14.82 8.31 6.10 4999 5936 G20 7 G20 7 7.36 8.36 7 7 76.06 32.91 15.36 36.00 3268 3822 G20 8 G20 8 4.70 5.77 6 6 70.34 30.97 11.31 26.45 8526 7620 G20 9 G20 9 9.29 9.73 7 7 80.95 38.39 21.30 28.09 5762 4831 G21 1 G21 1 5.83 6.71 6 7 77.03 32.65 10.60 30.99 9138 7150 G21 2 G21 2 9.15 12.10 7 7 87.93 45.23 18.07 44.48 9321 6325 G21 3 G21 3 5.55 6.70 6 7 70.84 31.24 11.57 33.46 15056 11426 G21 4 G21 4 6.84 8.89 7 7 74.62 33.23 17.04 37.68 8987 7951 G22 5 G22 5 10.88 12.87 7 7 87.49 48.98 24.27 35.24 11172 7598 G22 6 G22 6 5.54 7.34 6 7 75.06 29.32 15.83 30.47 8852 7379 G22 7 G22 7 6.38 7.79 7 7 72.46 33.65 13.74 35.31 11337 8872 G23 5 G23 5 3.14 3.00 6 6 50.71 17.02 9.70 29.65 6940 7385 G3 6 G3 6 4.89 5.73 6 6 60.91 27.44 20.21 16.82 4154 3906 G3 7 G3 7 4.10 3.50 6 6 57.24 19.32 12.89 22.14 2724 2270 G3 8 G3 8 4.57 3.99 6 6 64.61 26.60 13.96 13.17 4556 5407 G31 1 G31 1 5.82 7.54 6 7 79.77 39.66 9.34 32.06 4384 3980
Page 48
Page 45 - Carstairs Scores for Scottish Postcode Sectors from the 1991 Census
Public Health Research Unit, University of Glasgow
Appendix II (continued)
Health Board
Local government district Post code sector
Carstairs score DEPCAT No car
Unempl -oyment
Over crowding
Social class 4&5 Population
1981 1991 1981 1991 1981 1991 1991 1991 1991 1991 1981 1991 G31 2 G31 2 2.14 3.79 5 6 58.72 18.42 14.76 21.20 7889 7061 G31 3 G31 3 5.62 8.08 6 7 76.92 29.86 20.17 26.92 8323 7174 G31 4 G31 4 9.48 10.79 7 7 86.67 45.63 18.47 32.57 6699 5848 G31 5 G31 5 8.51 9.14 7 7 74.66 38.67 18.04 32.18 2732 2598 G32 0 G32 0 -0.14 0.78 4 4 39.36 13.52 7.50 23.94 6086 6594 G32 6 G32 6 5.40 6.50 6 7 67.45 28.52 15.28 28.86 9113 8124 G32 7 G32 7 6.57 6.11 7 6 66.25 26.08 16.08 27.07 7225 7047 G32 8 G32 8 4.48 3.69 6 6 51.94 20.74 13.94 22.80 8030 8617 G32 9 G32 9 -1.96 -0.47 3 4 40.31 12.85 7.40 13.56 6784 7151 G33 1 G33 1 10.63 5.26 7 6 53.44 27.27 18.43 20.05 6013 6741 G33 2 G33 2 2.21 3.65 5 6 57.82 17.95 7.87 34.43 6504 5946 G33 3 G33 3 7.82 7.99 7 7 77.37 37.49 13.19 31.70 14641 9966 G33 4 G33 4 9.00 11.21 7 7 80.96 38.66 22.44 38.37 15033 9610 G33 5 G33 5 7.83 8.54 7 7 69.73 35.48 19.74 29.41 8617 6723 G33 6 G33 6 -4.67 -0.31 2 4 15.36 7.17 7.70 32.39 318 742 G34 0 G34 0 10.16 9.79 7 7 74.89 35.99 22.61 31.48 9387 7210 G34 9 G34 9 10.18 11.63 7 7 84.06 45.74 25.05 28.00 11831 7014 G4 0 G4 0 6.92 6.22 7 7 78.45 35.63 7.05 29.94 6012 5242 G4 9 G4 9 3.09 4.56 6 6 59.09 22.16 19.58 14.29 4301 4105 G40 1 G40 1 8.26 4.36 7 6 61.88 17.34 10.75 33.58 1397 2322 G40 2 G40 2 11.97 7.53 7 7 74.48 43.25 12.10 25.33 1659 2501 G40 3 G40 3 10.23 10.77 7 7 84.52 45.30 15.83 38.96 4797 3578 G40 4 G40 4 9.57 8.96 7 7 79.62 44.17 15.48 27.59 3614 3808 G41 1 G41 1 6.57 8.08 7 7 55.07 23.29 27.74 29.41 1437 1332 G41 2 G41 2 0.03 5.22 4 6 39.09 17.24 28.74 16.81 8411 7893 G41 3 G41 3 -2.22 -1.00 3 4 39.60 9.81 8.16 11.06 9955 10283 G41 4 G41 4 -6.43 -4.65 1 2 8.98 5.64 5.70 3.57 4341 4938
Page 49
Page 46 - Carstairs Scores for Scottish Postcode Sectors from the 1991 Census
Public Health Research Unit, University of Glasgow
Appendix II (continued)
Health Board
Local government district Post code sector
Carstairs score DEPCAT No car
Unempl -oyment
Over crowding
Social class 4&5 Population
1981 1991 1981 1991 1981 1991 1991 1991 1991 1991 1981 1991 G41 5 G41 5 -3.51 -0.82 2 4 30.15 14.40 8.75 11.25 5730 5481 G42 0 G42 0 4.57 6.64 6 7 73.13 32.36 10.20 33.33 8119 6428 G42 7 G42 7 5.38 6.02 6 6 72.11 24.11 17.82 21.99 4694 4833 G42 8 G42 8 2.45 4.67 5 6 57.42 19.33 21.38 15.38 12257 10204 G42 9 G42 9 -0.75 1.94 4 5 50.21 14.69 13.00 16.67 9308 8449 G43 1 G43 1 2.05 3.05 5 6 61.04 20.41 8.08 24.72 7960 7530 G43 2 G43 2 -3.81 -2.68 2 3 28.49 9.45 4.85 8.81 10992 10463 G44 3 G44 3 -4.57 -3.77 2 2 22.21 5.87 5.18 5.49 3896 3931 G44 4 G44 4 -2.46 -0.28 3 4 35.25 9.05 11.03 14.47 9969 9719 G44 5 G44 5 -3.80 -0.45 2 4 26.25 7.76 11.57 17.69 10980 11275 G45 0 G45 0 10.17 12.32 7 7 82.05 43.47 23.33 40.70 11926 6814 G45 9 G45 9 7.89 10.45 7 7 82.23 37.57 18.59 39.92 16932 11533 G46 7 G46 7 -0.54 -0.51 4 4 45.45 14.29 12.12 0.00 91 65 G46 8 G46 8 5.55 5.71 6 6 63.78 28.32 14.62 25.31 11782 9475 G5 0 G5 0 7.91 9.00 7 7 84.53 45.02 14.11 27.41 9179 6589 G5 8 G5 8 7.02 -2.90 7 3 32.21 11.36 6.44 0.00 473 397 G5 9 G5 9 7.25 9.40 7 7 83.64 43.59 14.99 31.00 3382 2705 G51 1 G51 1 5.90 5.55 6 6 59.58 19.44 20.80 23.01 6173 5381 G51 2 G51 2 8.79 9.44 7 7 80.21 37.15 18.13 33.49 9742 8053 G51 3 G51 3 9.53 7.55 7 7 77.95 35.33 15.88 24.59 4880 5436 G51 4 G51 4 5.23 6.78 6 7 67.79 25.15 15.65 33.87 9268 8995 G52 1 G52 1 1.61 3.09 5 6 56.45 20.14 9.88 24.07 9103 8260 G52 2 G52 2 1.44 2.00 5 5 50.09 17.50 10.59 19.12 11738 10872 G52 3 G52 3 -1.42 0.43 3 4 40.79 12.20 7.16 22.26 8744 8732 G52 4 G52 4 5.42 7.59 6 7 65.09 30.42 13.50 40.93 5419 4370 G53 5 G53 5 6.94 7.62 7 7 66.30 31.26 15.87 35.06 16557 11240 G53 6 G53 6 8.90 8.20 7 7 70.55 33.73 19.83 27.70 12663 9051
Page 50
Page 47 - Carstairs Scores for Scottish Postcode Sectors from the 1991 Census
Public Health Research Unit, University of Glasgow
Appendix II (continued)
Health Board
Local government district Post code sector
Carstairs score DEPCAT No car
Unempl -oyment
Over crowding
Social class 4&5 Population
1981 1991 1981 1991 1981 1991 1991 1991 1991 1991 1981 1991 G53 7 G53 7 5.45 3.90 6 6 53.53 23.15 13.56 22.12 11981 11247 G61 1 G61 1 -5.63 -4.22 1 2 10.55 13.11 5.08 0.00 173 198 G62 6 . . . . . . . . 12 . G64 1 G64 1 0.56 -1.14 4 4 40.04 10.34 12.76 0.00 133 532 G64 2 -4.00 . 2 . . . . . 105 . G69 6 G69 6 -2.64 -2.41 3 3 22.53 7.98 6.74 11.80 6791 7464 G69 7 G69 7 1.83 1.11 5 5 37.78 15.85 12.33 15.70 7898 8024 G69 8 G69 8 2.21 2.87 5 6 24.14 7.32 12.77 45.45 803 560 G71 7 G71 7 3.52 3.88 6 6 34.46 25.00 26.70 3.45 413 444 G72 7 G72 7 3.68 3.16 6 6 52.36 21.20 10.59 24.14 8626 8158 G72 8 G72 8 0.55 0.99 4 4 36.67 17.27 9.21 19.86 13162 12664 G72 9 . . . . . . . . 4 . G73 1 G73 1 5.87 5.93 6 6 66.77 24.60 12.96 32.86 4140 3881 G73 2 G73 2 -1.27 0.45 3 4 41.98 11.89 9.21 18.16 7868 7815 G73 3 G73 3 -2.45 -1.74 3 3 31.80 9.54 5.92 13.12 8458 8404 G73 4 G73 4 1.34 1.47 5 5 50.04 17.94 8.77 17.67 10022 8428 G73 5 G73 5 1.75 1.27 5 5 46.11 18.12 9.44 16.32 6931 6696 G76 9 G76 9 -5.80 -4.87 1 1 14.73 7.59 2.00 4.17 1163 1152 G77 6 . . . . . . . . 3 . G78 1 -3.73 . 2 . . . . . 37 . G78 2 . . . . . . . . 19 . G81 1 -4.06 . 2 . . . . . 114 . PA1 3 . . . . . . . . 8 . PA4 8 . . . . . . . . 5 .
Page 51
Page 48 - Carstairs Scores for Scottish Postcode Sectors from the 1991 Census
Public Health Research Unit, University of Glasgow
Appendix II (continued)
Health Board
Local government district Post code sector
Carstairs score DEPCAT No car
Unempl -oyment
Over crowding
Social class 4&5 Population
1981 1991 1981 1991 1981 1991 1991 1991 1991 1991 1981 1991 Greater Glasgow
Strathkelvin G23 5 . . . . . . . . 6 .
G33 6 G33 6 -2.02 -1.68 3 3 24.38 11.03 8.59 10.42 4363 4483 G62 6 G62 6 -6.68 -6.15 1 1 7.82 4.71 1.70 0.00 262 295 G62 8 -1.27 . 3 . . . . . 39 . G63 0 . . . . . . . . 4 . G64 1 G64 1 -2.72 -2.22 3 3 21.83 7.90 7.75 11.91 11776 12264 G64 2 G64 2 -4.37 -3.59 2 2 15.49 6.92 4.77 10.03 5277 5567 G64 3 G64 3 -5.72 -4.97 1 1 10.09 5.28 2.84 6.25 6242 6167 G64 4 G64 4 -5.09 -4.48 1 2 10.54 7.71 3.69 6.03 2568 2894 G65 0 . . . . . . . . 8 . G65 7 G65 7 0.07 -0.20 4 4 31.62 11.89 8.93 18.09 5087 4863 G65 8 G65 8 -4.41 -3.83 2 2 13.40 5.53 4.69 10.62 3652 4215 G65 9 G65 9 3.48 6.58 6 7 52.84 19.35 17.02 42.65 1738 1499 G66 1 G66 1 -4.84 -4.17 2 2 22.14 6.80 3.23 4.98 3324 3359 G66 2 G66 2 1.41 2.04 5 5 45.86 15.31 11.54 21.83 9989 8815 G66 3 G66 3 -3.45 -3.03 2 2 19.98 6.52 4.83 13.02 9111 8392 G66 4 G66 4 -3.88 -3.51 2 2 15.80 8.33 5.22 8.28 6696 6538 G66 5 G66 5 -5.68 -5.63 1 1 8.38 4.22 2.16 3.81 4283 4667 G67 4 G67 4 -2.92 -0.35 3 4 11.59 7.14 12.23 25.00 120 138 G68 9 . . . . . . . . 15 . G69 0 G69 0 1.07 1.31 5 5 33.54 13.93 11.18 23.67 6776 6061 G69 8 G69 8 2.06 1.79 5 5 34.77 18.00 11.35 22.68 1682 1561 G69 9 G69 9 -0.71 -1.56 4 3 23.70 11.17 7.69 13.40 3626 3413
Page 52
Page 49 - Carstairs Scores for Scottish Postcode Sectors from the 1991 Census
Public Health Research Unit, University of Glasgow
Appendix II (continued)
Health Board
Local government district Post code sector
Carstairs score DEPCAT No car
Unempl -oyment
Over crowding
Social class 4&5 Population
1981 1991 1981 1991 1981 1991 1991 1991 1991 1991 1981 1991 Highlands Caithness KW1 4 KW1 4 0.33 -0.16 4 4 30.10 13.80 5.36 24.24 5502 5547 KW1 5 KW1 5 -0.73 0.42 4 4 36.81 14.47 5.66 24.70 5802 5781 KW126 KW126 -2.71 -3.16 3 2 14.89 5.00 4.75 16.10 1428 1473 KW147 KW147 -3.16 -2.32 2 3 24.15 9.51 3.92 15.77 6796 6726 KW148 KW148 -1.07 -0.66 3 4 31.43 10.32 4.96 23.73 5671 5390 KW2 6 KW2 6 6.19 -3.37 7 2 14.63 28.00 0.00 0.00 59 83 KW3 6 KW3 6 -0.72 -0.32 4 4 26.70 20.24 4.49 19.57 877 913 KW5 6 KW5 6 2.32 1.98 5 5 17.75 16.44 7.94 40.91 293 318 KW6 6 KW6 6 1.89 0.18 5 4 23.33 12.04 10.31 22.58 386 358 KW7 6 KW7 6 -5.03 -1.76 1 3 9.09 28.13 8.33 0.00 130 121 Highlands Inverness IV1 1 IV1 1 -1.51 1.31 3 5 47.02 16.16 9.74 17.65 614 554 IV1 2 IV1 2 -2.86 -2.30 3 3 15.07 7.11 5.41 19.94 9412 13496 IV137 IV137 -2.32 -0.43 3 4 6.50 2.86 6.29 42.86 434 445 IV2 3 IV2 3 -3.78 -3.24 2 2 24.16 5.92 3.34 12.66 9906 10536 IV2 4 IV2 4 -2.85 -2.49 3 3 24.74 8.39 3.32 16.37 10884 11208 IV3 5 IV3 5 -0.13 0.83 4 4 45.50 13.11 6.05 24.67 7722 7365 IV3 6 IV3 6 -0.36 0.07 4 4 32.62 11.79 6.47 24.92 11223 13944 IV4 7 IV4 7 -2.22 -2.54 3 3 14.98 8.95 4.77 17.24 2845 3221 IV5 7 IV5 7 -4.20 -4.77 2 1 8.72 6.28 2.31 8.70 607 780 PH324 PH324 -2.45 -3.25 3 2 19.87 3.39 8.49 7.14 608 522 PH354 PH354 . 2.02 . 5 3.51 7.89 9.57 53.85 30 115 Highlands Lochaber IV408 . . . . . . . . 0 . PA345 PA345 -0.93 1.10 4 5 14.29 4.59 6.55 50.00 336 340 PA384 PA384 -4.30 -1.40 2 3 8.47 1.82 5.08 37.04 193 247 PA394 PA394 -0.45 1.32 4 5 20.75 12.80 6.87 39.66 912 991
Page 53
Page 50 - Carstairs Scores for Scottish Postcode Sectors from the 1991 Census
Public Health Research Unit, University of Glasgow
Appendix II (continued)
Health Board
Local government district Post code sector
Carstairs score DEPCAT No car
Unempl -oyment
Over crowding
Social class 4&5 Population
1981 1991 1981 1991 1981 1991 1991 1991 1991 1991 1981 1991 PA404 PA404 -1.28 0.62 3 4 31.13 15.75 6.90 25.45 1047 1076 PH304 . . . . . . . . 17 . PH314 PH314 -0.98 -4.21 4 2 12.53 6.40 4.52 7.14 422 431 PH336 PH336 -1.06 -0.01 3 4 29.41 10.58 7.14 25.71 6428 6641 PH337 PH337 1.00 0.26 5 4 25.60 9.99 9.69 25.50 5716 5258 PH344 PH344 -3.05 -1.83 2 3 9.02 6.74 5.85 26.42 818 888 PH354 PH354 0.49 -2.25 4 3 15.22 1.10 6.18 25.00 286 291 PH364 PH364 -3.33 2.71 2 5 12.04 15.05 6.27 54.72 885 1016 PH374 PH374 3.91 -1.69 6 3 5.65 13.95 0.00 33.33 88 124 PH384 PH384 -3.33 8.60 2 7 19.07 16.90 15.89 81.25 143 214 PH394 PH394 2.24 4.46 5 6 22.28 9.65 14.17 54.84 331 388 PH404 PH404 0.23 0.88 4 4 16.09 5.48 11.01 37.50 276 231 PH414 PH414 0.45 0.71 4 4 27.28 11.76 17.09 12.16 1007 1033 PH424 PH424 1.31 7.83 5 7 50.00 19.51 26.32 36.36 84 141 PH434 -5.59 . 1 . . . . . 17 . PH444 . . . . . . . . 18 . Highlands Badenoch &
Strathspey AB3 9 . . . . . . . . 1 .
PH191 PH191 -4.11 3.86 2 6 20.93 3.17 4.07 76.92 105 172 PH201 PH201 -3.24 -3.58 2 2 16.63 8.31 2.56 12.50 1228 1335 PH211 PH211 -2.30 -1.81 3 3 20.35 5.67 3.05 27.73 1680 1875 PH221 PH221 -0.90 -0.48 4 4 29.51 9.35 8.45 20.31 1994 2464 PH233 PH233 -0.54 -1.21 4 3 13.03 8.04 4.21 31.75 443 636 PH243 PH243 -1.65 -0.27 3 4 9.25 5.13 6.56 40.00 444 521 PH253 PH253 -2.37 -2.82 3 3 13.34 7.25 3.78 19.35 556 665 PH263 PH263 -3.48 -2.16 2 3 15.89 8.00 2.90 24.79 2908 3340
Page 54
Page 51 - Carstairs Scores for Scottish Postcode Sectors from the 1991 Census
Public Health Research Unit, University of Glasgow
Appendix II (continued)
Health Board
Local government district Post code sector
Carstairs score DEPCAT No car
Unempl -oyment
Over crowding
Social class 4&5 Population
1981 1991 1981 1991 1981 1991 1991 1991 1991 1991 1981 1991 PH314 . . . . . . . . 4 . Highlands Nairn IV1 2 IV1 2 -2.22 -4.40 3 2 11.27 7.50 1.42 11.11 132 142 IV124 IV124 -3.72 -2.54 2 3 21.30 6.65 2.60 20.87 4532 4848 IV125 IV125 -1.22 -1.28 3 3 24.75 9.24 4.59 23.41 4956 5633 IV360 . . . . . . . . 20 . PH263 . . . . . . . . 0 . Highlands Ross &
Cromarty IV1 1 IV1 1 -4.30 -4.16 2 2 10.84 5.93 4.21 9.52 932 1374
IV108 IV108 -4.51 -4.10 2 2 12.49 5.86 1.92 13.82 1460 1895 IV118 IV118 -3.99 1.73 2 5 23.58 16.31 4.63 42.62 792 865 IV149 IV149 -2.74 -3.05 3 2 14.36 10.26 4.65 12.03 1699 1859 IV159 IV159 -2.54 -1.62 3 3 24.43 8.41 7.07 16.63 4995 5409 IV169 IV169 -4.04 -2.51 2 3 13.76 8.50 5.40 17.36 1245 1572 IV170 IV170 -0.52 1.81 4 5 34.63 16.96 7.71 31.19 6647 6185 IV180 IV180 -1.76 -0.81 3 4 26.10 12.59 4.02 24.53 5615 5882 IV191 IV191 -2.74 -1.78 3 3 21.76 10.64 5.62 17.08 4426 4812 IV201 IV201 -2.91 0.31 3 4 18.08 13.59 6.28 32.60 2997 2968 IV212 IV212 -0.85 -2.90 4 3 15.24 7.52 4.33 16.39 869 1039 IV222 IV222 -2.31 -1.37 3 3 14.77 8.56 3.14 31.11 1218 1354 IV232 IV232 -2.04 -2.89 3 3 12.62 7.14 4.75 17.31 589 692 IV243 . . . . . . . . 33 . IV262 IV262 -1.23 -3.31 3 2 19.91 7.31 4.01 11.40 1372 1688 IV274 . . . . . . . . 4 . IV4 7 IV4 7 -2.88 -3.61 3 2 9.43 5.88 3.69 16.00 211 243 IV548 IV548 -2.56 -2.45 3 3 13.62 7.04 3.37 23.40 1239 1237
Page 55
Page 52 - Carstairs Scores for Scottish Postcode Sectors from the 1991 Census
Public Health Research Unit, University of Glasgow
Appendix II (continued)
Health Board
Local government district Post code sector
Carstairs score DEPCAT No car
Unempl -oyment
Over crowding
Social class 4&5 Population
1981 1991 1981 1991 1981 1991 1991 1991 1991 1991 1981 1991 IV6 7 IV6 7 -1.75 -2.69 3 3 15.44 8.95 4.61 16.05 3132 3517 IV7 8 IV7 8 -3.93 -4.01 2 2 10.69 6.67 4.03 10.48 3799 4668 IV8 8 IV8 8 -3.08 -3.43 2 2 12.92 9.29 2.87 13.95 546 627 IV9 8 IV9 8 -0.79 0.46 4 4 17.92 7.24 4.04 44.93 1052 1064 Highlands Skye &
Lochalsh IV3 6 . . . . . . . . 6 .
IV4 7 . . . . . . . . 0 . IV408 IV408 -1.54 -0.79 3 4 16.72 8.24 8.54 24.81 2277 2404 IV418 IV418 -3.12 3.54 2 6 25.31 5.93 14.61 48.48 386 430 IV428 IV428 -3.62 -0.09 2 4 15.38 17.02 7.67 24.14 322 352 IV438 IV438 0.52 4.81 4 6 14.44 11.11 6.67 75.00 173 188 IV448 IV448 -2.42 0.05 3 4 12.66 5.00 3.85 46.67 126 161 IV458 IV458 -1.70 0.94 3 4 16.13 16.00 9.16 30.77 175 251 IV468 IV468 -2.73 -3.08 3 2 14.58 16.67 7.22 0.00 66 97 IV478 IV478 0.73 -0.98 4 4 16.15 14.58 4.42 25.00 416 462 IV488 IV488 0.09 -1.82 4 3 5.38 9.68 18.68 0.00 60 93 IV499 IV499 1.39 0.08 5 4 18.31 11.65 7.64 29.79 683 903 IV519 IV519 0.02 -0.67 4 4 21.68 10.92 6.67 24.36 3716 4486 IV528 IV528 -2.61 -3.60 3 2 14.17 10.87 8.08 0.00 294 364 IV538 IV538 -4.65 -3.44 2 2 5.08 3.03 5.00 20.00 81 118 IV558 IV558 -1.75 -1.59 3 3 12.57 16.61 7.09 14.10 927 1173 IV568 IV568 -1.40 -3.41 3 2 5.28 11.43 10.82 0.00 226 272 PH354 . . . . . . . . 0 . PH414 . . . . . . . . 8 .
Page 56
Page 53 - Carstairs Scores for Scottish Postcode Sectors from the 1991 Census
Public Health Research Unit, University of Glasgow
Appendix II (continued)
Health Board
Local government district Post code sector
Carstairs score DEPCAT No car
Unempl -oyment
Over crowding
Social class 4&5 Population
1981 1991 1981 1991 1981 1991 1991 1991 1991 1991 1981 1991 Highlands Sutherland IV243 IV243 -2.23 -0.11 3 4 18.18 13.09 4.91 32.14 1385 1381 IV253 IV253 -3.62 -2.20 2 3 19.48 9.39 3.69 19.70 1982 2042 IV274 IV274 -2.49 0.13 3 4 17.07 10.95 7.02 32.76 3476 3817 IV283 IV283 -3.56 0.39 2 4 18.14 10.74 2.88 42.86 366 419 KW106 KW106 -1.86 -2.34 3 3 25.41 10.43 3.31 15.24 1625 1655 KW116 KW116 -3.01 -4.83 2 1 6.67 5.56 7.33 0.00 121 151 KW136 KW136 -4.18 -5.60 2 1 4.60 3.33 0.00 11.11 112 88 KW147 KW147 -1.32 2.18 3 5 24.15 23.60 7.32 33.33 999 946 KW8 6 KW8 6 -1.00 -0.41 4 4 35.21 18.78 3.04 19.05 943 889 KW9 6 KW9 6 -0.95 -0.76 4 4 27.53 14.52 3.88 22.52 1918 1828 Lanarkshire Clydesdale DG109 . . . . . . . . 7 . EH467 EH467 -4.97 -4.96 2 1 5.50 5.80 6.91 0.00 136 234 EH558 EH558 -1.60 -3.29 3 2 8.41 7.29 8.70 8.00 311 322 ML110 ML110 0.72 0.58 4 4 32.73 14.79 8.99 21.19 7975 7749 ML117 ML117 -1.81 -1.22 3 3 27.60 10.59 4.92 20.53 7431 7151 ML118 ML118 -0.46 -0.66 4 4 26.09 12.83 7.84 18.02 8473 8018 ML119 ML119 -1.98 -1.51 3 3 22.11 11.08 6.84 16.40 9495 9649 ML126 ML126 -2.33 -2.50 3 3 12.63 6.18 5.35 20.48 6042 6169 ML2 9 . . . . . . . . 0 . ML8 4 ML8 4 -0.59 0.39 4 4 27.20 12.36 9.34 24.04 7055 7271 ML8 5 ML8 5 -2.89 -2.97 3 3 16.37 8.35 5.51 12.03 9667 11025 ML9 3 . . . . . . . . 16 .
Page 57
Page 54 - Carstairs Scores for Scottish Postcode Sectors from the 1991 Census
Public Health Research Unit, University of Glasgow
Appendix II (continued)
Health Board
Local government district Post code sector
Carstairs score DEPCAT No car
Unempl -oyment
Over crowding
Social class 4&5 Population
1981 1991 1981 1991 1981 1991 1991 1991 1991 1991 1981 1991 Lanarkshire Cumbernauld
& Kilsyth FK1 3 . . . . . . . . 13 .
FK4 2 . . . . . . . . 15 . FK6 5 . . . . . . . . 3 . G65 0 G65 0 1.60 1.05 5 5 40.83 13.15 9.29 22.47 6159 5941 G65 8 . . . . . . . . 16 . G65 9 G65 9 1.05 0.37 5 4 35.86 12.91 9.55 18.69 7242 6508 G67 1 G67 1 -1.27 -1.96 3 3 35.68 10.48 5.22 9.72 6131 5423 G67 2 G67 2 0.17 0.80 4 4 44.19 15.38 5.87 23.04 16204 14028 G67 3 G67 3 -1.80 -1.43 3 3 28.28 10.20 5.22 18.17 10869 10574 G67 4 G67 4 -2.49 -2.28 3 3 22.09 8.93 5.73 14.18 11360 11176 G68 0 G68 0 -4.18 -3.05 2 2 4.59 2.88 4.21 25.29 372 1024 G68 9 G68 9 -1.58 -2.53 3 3 21.29 8.69 4.16 15.74 3147 7738 ML6 7 . . . . . . . . 3 . Lanarkshire East Kilbride G72 0 . . . . . . . . 17 . G72 8 G72 8 -8.26 4.28 1 6 4.17 0.00 0.00 100.00 51 71 G72 9 G72 9 4.29 -5.48 6 1 14.29 10.53 0.00 0.00 40 67 G73 4 . . . . . . . . 4 . G73 5 . . . . . . . . 23 . G74 1 G74 1 -0.09 -0.42 4 4 36.41 13.16 6.50 17.37 4567 3878 G74 2 G74 2 -3.68 -3.30 2 2 19.06 7.52 3.79 12.10 10111 9041 G74 3 G74 3 -1.08 -1.77 3 3 32.20 10.39 4.08 15.42 15723 14310 G74 4 G74 4 0.65 -2.22 4 3 26.36 9.94 3.89 15.23 5101 6732 G74 5 G74 5 -7.02 -6.30 1 1 1.97 2.08 1.62 4.44 432 568 G75 0 G75 0 -0.45 -0.58 4 4 35.54 11.60 5.74 19.52 8106 9423 G75 8 G75 8 -1.24 -1.79 3 3 23.76 9.33 5.01 18.59 17558 18934
Page 58
Page 55 - Carstairs Scores for Scottish Postcode Sectors from the 1991 Census
Public Health Research Unit, University of Glasgow
Appendix II (continued)
Health Board
Local government district Post code sector
Carstairs score DEPCAT No car
Unempl -oyment
Over crowding
Social class 4&5 Population
1981 1991 1981 1991 1981 1991 1991 1991 1991 1991 1981 1991 G75 9 G75 9 0.13 0.02 4 4 33.81 12.47 7.05 22.08 10211 8635 G76 8 G76 8 -3.57 -4.97 2 1 16.89 6.75 3.58 0.00 1253 1617 G76 9 G76 9 0.50 -6.24 4 1 2.89 4.00 2.91 0.00 143 173 KA170 . . . . . . . . 5 . ML106 ML106 -3.41 -3.42 2 2 15.29 7.97 4.29 11.52 9235 9328 ML3 7 . . . . . . . . 15 . ML3 8 . . . . . . . . 5 . Lanarkshire Hamilton G71 6 . . . . . . . . 0 . G71 7 G71 7 -2.57 -2.12 3 3 23.14 10.73 8.03 8.65 4804 5126 G71 8 G71 8 -2.64 -2.34 3 3 19.70 8.93 8.01 10.37 6197 6871 G72 0 G72 0 5.52 6.91 6 7 56.88 28.90 18.83 30.14 9190 7745 G72 9 G72 9 0.20 1.61 4 5 34.45 15.17 12.10 22.79 10866 10839 G74 2 . . . . . . . . 9 . ML106 2.42 . 5 . . . . . 51 . ML3 0 ML3 0 3.67 3.86 6 6 51.13 21.67 11.73 28.03 5754 5548 ML3 6 ML3 6 0.39 0.00 4 4 43.17 15.94 7.07 13.73 5625 5642 ML3 7 ML3 7 -1.97 -1.57 3 3 23.78 10.65 6.75 15.71 12261 11911 ML3 8 ML3 8 0.24 0.45 4 4 33.57 15.56 9.81 17.31 15389 14333 ML3 9 ML3 9 2.31 1.24 5 5 42.32 16.00 10.16 18.70 14005 13721 ML8 5 ML8 5 -6.65 -6.71 1 1 5.49 4.35 0.00 0.00 91 90 ML9 1 ML9 1 1.84 0.58 5 4 42.77 16.96 6.96 18.04 7393 7087 ML9 2 ML9 2 -1.06 -0.55 3 4 27.50 12.92 7.22 19.40 9061 8821 ML9 3 ML9 3 -1.01 -0.62 3 4 26.33 12.37 7.03 20.29 7239 7468
Page 59
Page 56 - Carstairs Scores for Scottish Postcode Sectors from the 1991 Census
Public Health Research Unit, University of Glasgow
Appendix II (continued)
Health Board
Local government district Post code sector
Carstairs score DEPCAT No car
Unempl -oyment
Over crowding
Social class 4&5 Population
1981 1991 1981 1991 1981 1991 1991 1991 1991 1991 1981 1991 Lanarkshire Monklands EH483 . . . . . . . . 4 . FK1 3 . . . . . . . . 24 . G67 4 G67 4 -1.77 3.96 3 6 4.12 0.00 13.13 71.43 104 98 G69 6 . . . . . . . . 9 . G69 7 G69 7 3.95 5.92 6 6 54.36 20.93 17.85 33.00 2639 2325 G69 8 -4.43 . 2 . . . . . 44 . ML1 5 ML1 5 -7.60 -0.76 1 4 2.06 5.13 3.09 46.15 61 98 ML4 1 . . . . . . . . 0 . ML5 1 ML5 1 0.98 0.86 4 4 37.14 13.46 11.21 18.52 6926 7217 ML5 2 ML5 2 3.36 3.51 6 6 45.52 20.00 15.21 22.68 11072 9570 ML5 3 ML5 3 1.50 1.59 5 5 44.09 15.43 10.57 20.67 4821 4864 ML5 4 ML5 4 3.23 4.53 6 6 46.09 21.40 16.89 26.38 12945 11118 ML5 5 ML5 5 5.40 6.31 6 7 52.89 24.01 19.37 30.88 15044 13132 ML6 0 ML6 0 2.92 2.10 5 5 38.48 18.61 14.66 16.42 8674 9039 ML6 6 ML6 6 3.54 3.18 6 6 46.66 21.92 11.33 24.92 9848 9627 ML6 7 ML6 7 3.25 3.73 6 6 38.69 19.92 15.52 27.32 10697 10134 ML6 8 ML6 8 2.91 2.88 5 6 36.47 19.41 12.22 28.07 13115 11721 ML6 9 ML6 9 -0.18 0.10 4 4 32.11 14.15 9.07 17.86 12082 11881 ML7 4 ML7 4 4.53 4.31 6 6 42.43 19.36 14.97 32.14 1734 1555 ML7 5 . . . . . . . . 19 . Lanarkshire Motherwell EH479 . . . . . . . . 20 . EH483 2.84 . 5 . . . . . 184 . G71 5 G71 5 5.92 7.05 6 7 50.56 26.32 21.81 31.26 8332 7525 G71 6 G71 6 -0.51 -0.29 4 4 26.90 14.73 7.99 18.56 7017 7433 G71 7 G71 7 -6.65 -5.85 1 1 2.38 13.04 0.00 0.00 59 86 G71 8 . . . . . . . . 3 .
Page 60
Page 57 - Carstairs Scores for Scottish Postcode Sectors from the 1991 Census
Public Health Research Unit, University of Glasgow
Appendix II (continued)
Health Board
Local government district Post code sector
Carstairs score DEPCAT No car
Unempl -oyment
Over crowding
Social class 4&5 Population
1981 1991 1981 1991 1981 1991 1991 1991 1991 1991 1981 1991 ML1 1 ML1 1 1.86 3.26 5 6 55.33 22.80 9.13 24.82 6233 5788 ML1 2 ML1 2 0.38 1.44 4 5 42.14 16.46 5.96 28.30 9275 8579 ML1 3 ML1 3 2.05 1.39 5 5 38.88 18.09 9.61 20.57 14765 14056 ML1 4 ML1 4 3.29 3.30 6 6 40.69 21.88 13.30 24.97 11551 11838 ML1 5 ML1 5 3.05 3.41 6 6 36.40 17.49 17.93 23.49 10308 10038 ML2 0 ML2 0 2.25 2.73 5 5 41.34 19.82 12.37 23.75 12296 10505 ML2 7 ML2 7 2.92 2.52 5 5 45.56 23.45 11.73 17.38 11624 10369 ML2 8 ML2 8 0.77 1.45 4 5 35.41 16.84 10.23 22.84 13454 13244 ML2 9 ML2 9 2.49 4.30 5 6 39.44 19.28 14.28 34.97 6932 6381 ML4 1 ML4 1 0.84 2.60 4 5 38.83 19.46 11.85 25.20 6758 6551 ML4 2 ML4 2 3.69 3.36 6 6 45.53 22.07 12.40 24.79 11462 11598 ML4 3 ML4 3 2.81 3.67 5 6 42.72 19.45 12.02 32.27 3656 4012 ML5 4 . . . . . . . . 0 . ML7 4 ML7 4 2.65 3.34 5 6 36.37 16.64 15.03 29.50 7055 6526 ML7 5 ML7 5 2.55 2.77 5 5 36.64 17.26 13.00 27.78 8494 8103 Lothian East Lothian EH216 EH216 -2.99 -2.53 3 3 30.47 6.90 4.06 13.30 7309 9583 EH217 EH217 -0.26 -0.46 4 4 37.60 8.96 6.06 21.69 6862 6734 EH218 EH218 1.29 2.05 5 5 44.19 17.42 9.23 25.12 6324 5841 EH222 EH222 -5.32 -1.33 1 3 7.50 0.00 0.00 50.00 67 80 EH312 EH312 -5.91 -4.41 1 2 14.87 5.50 2.00 10.20 2124 2229 EH320 EH320 -3.83 -3.79 2 2 17.42 6.11 3.21 11.29 7981 8582 EH329 EH329 1.46 2.73 5 5 44.76 16.63 7.99 33.99 7577 7014 EH331 EH331 0.23 0.43 4 4 32.74 11.49 7.58 26.06 4717 4533 EH332 EH332 -0.86 -1.00 4 4 30.54 12.52 6.02 16.87 5746 6030 EH345 EH345 -4.28 -4.26 2 2 8.87 4.75 3.81 11.64 1766 2155 EH355 EH355 -2.70 -1.32 3 3 23.55 8.98 6.52 20.12 2241 2238
Page 61
Page 58 - Carstairs Scores for Scottish Postcode Sectors from the 1991 Census
Public Health Research Unit, University of Glasgow
Appendix II (continued)
Health Board
Local government district Post code sector
Carstairs score DEPCAT No car
Unempl -oyment
Over crowding
Social class 4&5 Population
1981 1991 1981 1991 1981 1991 1991 1991 1991 1991 1981 1991 EH365 EH365 -4.58 -4.40 2 2 3.67 2.63 3.98 14.81 304 376 EH375 -7.35 . 1 . . . . . 40 . EH394 EH394 -3.34 -2.64 2 3 20.96 8.11 3.57 16.76 4543 5258 EH395 EH395 -4.06 -2.68 2 3 11.97 5.71 4.10 22.15 2218 2227 EH403 EH403 -3.11 -3.06 2 2 14.63 6.36 3.70 17.74 1337 1685 EH413 EH413 -1.87 -1.05 3 4 22.91 8.03 4.99 26.75 4974 5299 EH414 EH414 -2.75 -3.57 3 2 15.69 7.82 3.58 11.55 5432 6111 EH421 EH421 -0.56 -1.15 4 4 25.74 10.85 4.96 21.73 7176 7935 TD113 1.19 . 5 . . . . . 60 . TD135 TD135 -4.98 -7.21 2 1 5.88 0.00 0.00 0.00 154 204 Lothian Edinburgh
City EH1 1 EH1 1 4.17 2.22 6 5 69.18 25.10 5.53 13.79 815 1584
EH1 2 EH1 2 0.14 0.82 4 4 63.98 16.22 4.45 15.56 1291 1607 EH1 3 EH1 3 1.07 0.25 5 4 44.99 19.36 8.19 9.30 1111 1225 EH104 EH104 -4.07 -2.97 2 3 34.75 9.66 3.32 6.08 8042 8450 EH105 EH105 -5.17 -5.09 1 1 21.58 5.18 1.83 1.71 8462 8922 EH106 EH106 -6.97 -6.03 1 1 7.42 3.23 1.29 3.60 7825 8419 EH107 EH107 -7.16 -6.24 1 1 2.94 3.36 0.66 5.10 2434 4143 EH111 EH111 -1.38 -0.50 3 4 46.74 8.86 6.68 15.78 10651 10478 EH112 EH112 0.71 1.96 4 5 61.20 11.23 9.74 21.44 6646 6931 EH113 EH113 3.19 4.17 6 6 62.75 17.78 11.33 29.93 10964 9402 EH114 EH114 0.74 1.17 4 5 50.99 11.15 8.58 22.04 9092 8138 EH120 EH120 0.51 -4.75 4 1 9.09 0.00 4.93 10.00 251 184 EH125 EH125 -3.63 -3.62 2 2 30.50 7.37 2.71 6.05 5775 6142 EH126 EH126 -6.96 -6.00 1 1 8.72 5.36 0.35 2.88 4796 5097 EH127 EH127 -3.89 -2.54 2 3 25.53 4.93 5.79 14.29 10129 9726
Page 62
Page 59 - Carstairs Scores for Scottish Postcode Sectors from the 1991 Census
Public Health Research Unit, University of Glasgow
Appendix II (continued)
Health Board
Local government district Post code sector
Carstairs score DEPCAT No car
Unempl -oyment
Over crowding
Social class 4&5 Population
1981 1991 1981 1991 1981 1991 1991 1991 1991 1991 1981 1991 EH128 EH128 -5.85 -4.58 1 2 15.28 5.33 1.95 8.84 11360 12071 EH129 EH129 -2.88 -2.40 3 3 25.23 5.21 6.66 13.62 1868 2852 EH130 EH130 -6.89 -6.08 1 1 9.15 2.95 0.90 3.38 5499 5937 EH139 EH139 0.16 1.21 4 5 47.72 11.00 9.79 21.69 8713 8325 EH141 EH141 -3.01 -2.95 2 3 30.28 5.94 3.19 12.48 6812 7695 EH142 EH142 1.48 1.43 5 5 49.16 14.01 7.39 24.52 11869 8613 EH143 EH143 0.14 1.88 4 5 45.99 20.39 8.48 21.23 8553 6881 EH144 EH144 -4.50 -4.03 2 2 3.61 4.55 2.42 19.05 178 259 EH145 EH145 -5.65 -4.77 1 1 13.85 4.49 1.73 9.18 9674 9069 EH146 EH146 -2.61 -4.80 3 1 12.50 1.98 7.89 0.00 237 284 EH147 EH147 -5.77 -4.61 1 2 10.39 3.65 3.05 10.51 4533 4988 EH151 EH151 -3.50 -2.57 2 3 28.25 7.28 5.16 11.49 5797 6319 EH152 EH152 -3.93 -2.95 2 3 24.68 8.98 3.51 11.48 5338 5501 EH153 EH153 3.46 1.14 6 5 46.61 14.39 10.51 16.70 8262 7754 EH164 EH164 7.62 9.51 7 7 77.71 39.16 16.61 36.20 12460 7521 EH165 EH165 -1.30 -1.33 3 3 39.80 10.53 5.74 12.13 8345 8723 EH166 EH166 -0.83 -0.79 4 4 36.79 10.43 6.03 17.77 10544 10578 EH177 EH177 1.62 1.23 5 5 43.84 13.95 8.20 23.82 8527 7863 EH178 EH178 2.52 1.92 5 5 46.91 14.74 10.11 23.72 9802 9162 EH181 . . . . . . . . 16 . EH2 1 EH2 1 -2.00 -1.25 3 3 43.90 4.17 8.20 12.50 140 123 EH2 2 EH2 2 1.09 -4.14 5 2 55.43 2.33 0.00 0.00 132 101 EH2 3 EH2 3 -0.06 0.50 4 4 62.50 20.37 9.15 0.00 108 145 EH2 4 EH2 4 -0.55 1.25 4 5 57.14 19.28 2.60 23.08 319 231 EH209 EH209 -1.53 -1.91 3 3 34.73 14.75 8.38 0.00 240 166 EH216 . . . . . . . . 4 . EH218 EH218 3.45 1.55 6 5 51.10 11.76 7.20 27.27 280 362
Page 63
Page 60 - Carstairs Scores for Scottish Postcode Sectors from the 1991 Census
Public Health Research Unit, University of Glasgow
Appendix II (continued)
Health Board
Local government district Post code sector
Carstairs score DEPCAT No car
Unempl -oyment
Over crowding
Social class 4&5 Population
1981 1991 1981 1991 1981 1991 1991 1991 1991 1991 1981 1991 EH221 . . . . . . . . 19 . EH278 EH278 -5.69 -6.25 1 1 6.33 7.81 0.00 0.00 170 161 EH288 EH288 -2.18 -1.94 3 3 19.18 6.48 6.71 19.14 3283 3073 EH299 EH299 -3.30 -2.63 2 3 21.10 7.65 3.37 17.60 3135 2940 EH3 5 EH3 5 -2.88 -3.20 3 2 36.05 7.91 3.49 4.92 5501 6065 EH3 6 EH3 6 -3.01 -1.97 2 3 32.54 10.60 3.76 13.97 5004 5225 EH3 7 EH3 7 -1.72 -3.50 3 2 31.26 9.57 2.33 5.26 801 970 EH3 8 EH3 8 2.30 0.19 5 4 60.06 15.01 6.65 8.93 1555 1628 EH3 9 EH3 9 -0.27 0.35 4 4 56.04 13.88 6.08 14.60 5067 5144 EH309 EH309 -2.62 -3.35 3 2 18.01 6.42 3.71 13.54 8005 9419 EH4 1 EH4 1 -3.64 -3.09 2 2 32.73 7.15 2.68 9.89 5507 6046 EH4 2 EH4 2 -0.66 -1.24 4 3 36.45 9.35 5.91 15.41 9953 9424 EH4 3 EH4 3 -6.68 -5.75 1 1 11.73 4.39 1.42 2.41 4728 5368 EH4 4 EH4 4 7.38 6.51 7 7 70.99 29.44 13.29 30.18 15099 10574 EH4 5 EH4 5 -4.69 -2.79 2 3 19.76 6.37 3.10 18.69 4876 4328 EH4 6 EH4 6 -7.10 -6.26 1 1 5.51 4.34 0.35 3.24 5335 5460 EH4 7 EH4 7 0.02 -0.88 4 4 40.04 10.37 5.91 15.66 8327 7471 EH4 8 EH4 8 -7.06 -5.93 1 1 8.49 3.97 2.68 0.40 2819 2721 EH5 1 EH5 1 5.13 7.62 6 7 71.39 23.58 14.62 42.98 5654 4875 EH5 2 EH5 2 -0.45 0.88 4 4 37.62 8.36 11.98 22.22 5594 5996 EH5 3 EH5 3 -4.78 -4.68 2 2 21.11 6.07 1.90 4.46 5365 5598 EH525 . . . . . . . . 11 . EH526 . . . . . . . . 21 . EH530 -3.72 . 2 . . . . . 35 . EH6 4 EH6 4 -0.77 -0.17 4 4 41.42 13.01 6.07 18.13 7883 8189 EH6 5 EH6 5 0.17 1.36 4 5 51.40 16.40 6.41 22.28 3437 4764 EH6 6 EH6 6 4.70 3.07 6 6 62.36 19.86 6.08 28.82 3617 3499
Page 64
Page 61 - Carstairs Scores for Scottish Postcode Sectors from the 1991 Census
Public Health Research Unit, University of Glasgow
Appendix II (continued)
Health Board
Local government district Post code sector
Carstairs score DEPCAT No car
Unempl -oyment
Over crowding
Social class 4&5 Population
1981 1991 1981 1991 1981 1991 1991 1991 1991 1991 1981 1991 EH6 7 EH6 7 -1.67 0.99 3 4 40.88 12.32 7.71 25.91 2917 3030 EH6 8 EH6 8 0.48 0.68 4 4 52.38 10.97 8.91 16.64 8966 8745 EH7 4 EH7 4 -0.62 0.46 4 4 48.84 12.20 8.03 16.92 6429 6556 EH7 5 EH7 5 0.65 0.34 4 4 56.69 10.77 8.21 13.18 9508 9471 EH7 6 EH7 6 0.67 1.30 4 5 49.71 12.80 7.53 24.08 11412 10989 EH8 7 EH8 7 -2.62 -1.55 3 3 35.08 7.68 6.08 14.80 11479 10971 EH8 8 EH8 8 0.07 0.38 4 4 61.43 13.07 7.20 10.83 2867 2870 EH8 9 EH8 9 1.86 2.30 5 5 63.93 19.77 7.20 19.26 5676 6445 EH9 1 EH9 1 -3.40 -2.70 2 3 36.38 11.57 4.04 4.18 9098 9726 EH9 2 EH9 2 -5.89 -5.00 1 1 18.01 7.23 1.61 2.56 5237 6161 EH9 3 EH9 3 -5.02 -3.75 1 2 28.56 6.48 1.50 9.19 2972 3041 Lothian Midlothian EH107 EH107 0.84 -0.71 4 4 8.51 4.84 7.37 35.29 181 189 EH164 . . . . . . . . 2 . EH178 . . . . . . . . 8 . EH181 EH181 -5.03 -4.15 1 2 12.05 5.15 3.67 10.91 2262 2402 EH192 EH192 -0.98 -0.29 4 4 29.84 10.32 6.87 23.87 6609 6066 EH193 EH193 -2.04 -1.25 3 3 28.38 8.98 6.54 18.40 5656 5554 EH209 EH209 -1.32 -0.15 3 4 30.18 12.58 6.74 22.89 6686 6145 EH218 . . . . . . . . 7 . EH221 EH221 0.04 -0.31 4 4 38.15 12.22 7.09 17.30 5727 5538 EH222 EH222 0.99 2.51 4 5 40.16 14.70 10.69 30.99 6624 5864 EH223 EH223 -6.66 -5.68 1 1 7.89 3.46 2.15 4.48 2876 3002 EH224 EH224 0.24 0.94 4 4 32.67 13.38 7.92 27.89 5551 5914 EH225 EH225 0.59 2.28 4 5 39.64 16.98 10.33 27.62 7739 6914 EH234 EH234 -0.24 1.71 4 5 32.73 13.63 9.47 31.25 7080 6994 EH249 EH249 2.05 3.06 5 6 35.85 19.76 13.72 26.67 1432 1278
Page 65
Page 62 - Carstairs Scores for Scottish Postcode Sectors from the 1991 Census
Public Health Research Unit, University of Glasgow
Appendix II (continued)
Health Board
Local government district Post code sector
Carstairs score DEPCAT No car
Unempl -oyment
Over crowding
Social class 4&5 Population
1981 1991 1981 1991 1981 1991 1991 1991 1991 1991 1981 1991 EH259 EH259 -2.61 -2.10 3 3 19.81 8.97 5.24 17.80 3483 3550 EH260 EH260 -3.17 -3.28 2 2 21.44 7.18 5.52 8.12 7012 7068 EH268 EH268 -1.62 -1.06 3 4 28.85 8.07 6.67 20.48 6441 6140 EH269 EH269 -6.82 -5.95 1 1 6.39 3.84 1.39 3.93 4818 4618 EH375 EH375 -3.61 -3.02 2 2 18.01 8.20 3.68 14.56 1442 1609 EH385 . . . . . . . . 19 . EH467 . . . . . . . . 25 . Lothian West Lothian EH278 EH278 -2.51 -2.21 3 3 11.99 7.88 7.38 17.57 1837 1820 EH309 EH309 -3.05 -5.90 2 1 11.50 0.00 4.35 0.00 104 112 EH470 EH470 2.44 2.66 5 5 39.80 16.55 7.78 36.30 7845 6685 EH477 EH477 4.44 2.76 6 5 40.81 16.19 8.97 34.72 6676 5853 EH478 EH478 1.75 1.16 5 5 29.09 13.52 7.04 33.13 7490 7424 EH479 EH479 5.09 2.68 6 5 37.57 17.16 11.87 28.84 5147 4792 EH481 EH481 -0.15 0.03 4 4 30.48 11.22 7.74 23.73 6799 6329 EH482 EH482 1.84 0.72 5 4 35.91 14.23 6.47 26.41 7240 7145
EH483 EH483 0.28 0.78 4 4 29.98 12.99 6.16 31.68 8621 8575 EH484 EH484 1.02 -0.63 5 4 34.27 12.54 8.05 14.18 4707 4557 EH496 EH496 -3.02 -3.37 2 2 16.57 7.36 3.69 13.10 6439 7071 EH497 EH497 -4.47 -4.69 2 2 13.35 4.49 3.14 7.32 5108 6987 EH525 EH525 -1.83 -2.81 3 3 26.06 7.41 3.90 12.83 6257 6579 EH526 EH526 -0.43 1.06 4 5 31.78 12.38 7.69 30.82 10479 9859 EH530 EH530 -1.81 -3.24 3 2 16.19 5.77 4.92 13.59 6486 10038 EH545 EH545 1.14 0.77 5 4 38.29 14.20 5.42 27.78 8216 7108 EH546 EH546 0.02 0.24 4 4 30.61 12.37 6.34 27.07 15756 16876 EH547 EH547 -5.93 -6.08 1 1 5.40 2.60 2.19 3.00 621 1277 EH548 EH548 -0.13 -1.29 4 3 28.43 12.16 4.69 18.38 11785 13558
Page 66
Page 63 - Carstairs Scores for Scottish Postcode Sectors from the 1991 Census
Public Health Research Unit, University of Glasgow
Appendix II (continued)
Health Board
Local government district Post code sector
Carstairs score DEPCAT No car
Unempl -oyment
Over crowding
Social class 4&5 Population
1981 1991 1981 1991 1981 1991 1991 1991 1991 1991 1981 1991 EH549 EH549 -6.39 -5.65 1 1 4.83 3.12 1.87 7.12 1264 3041 EH558 EH558 0.89 0.35 4 4 32.10 10.18 8.22 25.81 7263 7459 FK1 2 FK1 2 -3.28 -6.86 2 1 2.90 4.35 0.00 0.00 62 92 ML6 7 . . . . . . . . 4 . ML7 5 ML7 5 0.52 2.81 4 5 33.56 15.35 11.88 33.82 1014 900
Orkney Islands
Orkney Islands
KW151 KW151 -1.77 -1.23 3 3 24.64 5.59 5.16 26.55 6734 7442
KW163 KW163 -1.30 -1.29 3 3 17.86 7.09 5.14 27.87 3685 3702 KW172 KW172 -3.21 -2.27 2 3 10.89 5.92 6.25 21.80 8000 8468 Shetland Islands
Shetland Islands
ZE1 0 ZE1 0 -1.60 -0.75 3 4 27.93 5.72 5.60 28.09 8402 8509
ZE2 9 ZE2 9 -2.92 -1.33 3 3 13.70 5.57 4.86 31.64 13772 13501 ZE3 9 ZE3 9 -4.04 -3.47 2 2 17.00 4.46 11.33 0.00 594 512 Tayside Angus AB3 1 AB301 -2.19 -4.56 3 2 0.00 3.23 11.39 0.00 88 79 DD100 . . . . . . . . 10 .
DD108 DD108 -0.47 0.66 4 4 39.41 13.07 4.25 29.80 6583 6991 DD109 DD109 -1.40 -0.62 3 4 24.05 8.97 5.70 27.59 8277 8162 DD111 DD111 2.37 2.05 5 5 56.13 18.49 6.02 24.53 5267 5644 DD112 DD112 -2.96 -3.04 3 2 18.89 6.82 3.26 16.22 5275 5320 DD113 DD113 -1.80 -2.79 3 3 32.40 7.75 3.12 11.15 4197 4256 DD114 DD114 -0.67 -0.49 4 4 30.39 7.07 5.47 28.02 6818 6941 DD115 DD115 0.38 1.44 4 5 38.86 13.83 8.20 28.22 6336 5903 DD4 0 . . . . . . . . 0 . DD5 3 DD5 3 -5.89 -4.28 1 2 2.71 4.10 2.81 17.07 955 1105
Page 67
Page 64 - Carstairs Scores for Scottish Postcode Sectors from the 1991 Census
Public Health Research Unit, University of Glasgow
Appendix II (continued)
Health Board
Local government district Post code sector
Carstairs score DEPCAT No car
Unempl -oyment
Over crowding
Social class 4&5 Population
1981 1991 1981 1991 1981 1991 1991 1991 1991 1991 1981 1991 DD5 4 -4.45 . 2 . . . . . 52 . DD7 6 DD7 6 -5.44 -4.35 1 2 10.76 5.70 2.01 12.47 3847 4908 DD7 7 DD7 7 -2.30 -1.76 3 3 23.64 7.78 6.07 18.43 6101 6532 DD8 1 DD8 1 -0.36 -0.00 4 4 29.45 8.52 7.41 27.37 8173 8227 DD8 2 DD8 2 -1.48 -2.13 3 3 20.87 6.43 5.14 19.77 6099 6322 DD8 3 DD8 3 -2.60 -3.27 3 2 17.11 6.16 3.91 14.52 4477 4952 DD8 4 DD8 4 -3.53 -2.39 2 3 17.26 5.59 5.56 19.39 3371 3713 DD8 5 DD8 5 -1.67 -1.45 3 3 22.19 7.87 5.15 23.48 3542 3457 DD9 6 DD9 6 -3.04 -2.52 2 3 19.58 4.98 2.34 24.07 5105 5290 DD9 7 DD9 7 -0.76 -0.43 4 4 27.91 9.10 4.46 29.61 5550 5322 PH118 PH118 -3.03 -3.51 2 2 1.53 6.90 5.50 16.13 366 337 PH128 PH128 -2.84 -4.02 3 2 14.11 4.95 1.44 15.56 954 1019 PH139 . . . . . . . . 11 .
Tayside Dundee City DD1 1 DD1 1 1.58 3.08 5 6 48.86 29.41 5.96 25.81 565 649 DD1 2 DD1 2 1.95 1.55 5 5 54.60 18.95 6.49 19.61 1297 1515 DD1 3 DD1 3 -1.84 7.83 3 7 55.05 40.98 1.82 60.00 146 158 DD1 4 DD1 4 -3.19 0.58 2 4 43.88 20.36 8.75 10.53 1276 1763 DD1 5 DD1 5 3.68 2.81 6 5 61.11 19.30 7.96 24.00 1573 2229 DD2 1 DD2 1 -4.52 -3.55 2 2 24.05 7.38 4.63 6.06 6818 7361
DD2 2 DD2 2 -0.60 -0.31 4 4 38.99 10.98 6.20 19.96 8857 8680 DD2 3 DD2 3 3.27 5.63 6 6 67.45 26.22 9.65 34.81 14237 11209 DD2 4 DD2 4 2.27 3.33 5 6 53.26 16.43 12.53 26.32 14985 12892 DD2 5 DD2 5 -3.87 -4.46 2 2 11.29 3.80 3.34 10.58 5326 5734 DD3 0 DD3 0 4.11 4.85 6 6 48.01 22.84 14.84 30.79 9870 7978 DD3 6 DD3 6 1.26 0.60 5 4 51.83 13.80 6.25 18.52 7629 7534 DD3 7 DD3 7 4.20 5.32 6 6 67.36 23.61 11.24 31.74 6883 7687
Page 68
Page 65 - Carstairs Scores for Scottish Postcode Sectors from the 1991 Census
Public Health Research Unit, University of Glasgow
Appendix II (continued)
Health Board
Local government district Post code sector
Carstairs score DEPCAT No car
Unempl -oyment
Over crowding
Social class 4&5 Population
1981 1991 1981 1991 1981 1991 1991 1991 1991 1991 1981 1991 DD3 8 DD3 8 -2.16 -1.23 3 3 33.56 9.52 5.31 17.91 6952 7022 DD3 9 DD3 9 0.70 -0.11 4 4 34.99 9.63 6.88 23.67 9871 8908 DD4 0 DD4 0 6.04 2.90 7 6 51.76 25.66 8.61 21.47 12168 7932 DD4 6 DD4 6 1.35 2.02 5 5 53.77 16.88 8.95 21.32 5647 6423 DD4 7 DD4 7 -3.33 -2.57 2 3 31.45 7.91 4.09 11.43 7717 7782 DD4 8 DD4 8 6.19 5.97 7 6 62.54 27.31 12.52 33.39 15716 12344 DD4 9 DD4 9 2.72 3.93 5 6 54.19 19.32 10.67 31.72 14311 12503 DD5 1 DD5 1 -5.62 -5.00 1 1 14.10 6.90 1.69 4.66 4483 5009 DD5 2 DD5 2 -4.44 -4.53 2 2 19.59 5.66 2.29 6.16 6099 6990 DD5 3 DD5 3 -5.94 -5.44 1 1 9.45 4.34 1.38 6.35 7708 7553
DD5 4 DD5 4 -4.79 -4.97 2 1 14.75 4.77 2.14 5.86 7245 7871 DD8 1 . . . . . . . . 15 . PH139 . . . . . . . . 8 . PH149 PH149 -5.64 -4.42 1 2 2.72 6.52 9.59 0.00 143 147 Tayside Perth &
Kinross DD8 1 . . . . . . . . 7 .
FK147 FK147 -4.72 -1.56 2 3 8.77 5.11 1.42 39.29 436 437 FK150 FK150 -6.74 -5.73 1 1 7.86 4.76 3.52 0.00 92 141 FK159 FK159 -5.37 -4.17 1 2 6.94 5.24 2.78 14.81 729 792 FK198 . . . . . . . . 12 . FK218 FK218 -8.07 -6.79 1 1 0.91 5.88 0.00 0.00 38 111 KY137 KY137 -3.57 -3.73 2 2 11.90 6.28 4.38 11.98 7073 8979 KY146 KY146 -4.47 -6.47 2 1 2.78 7.69 0.00 0.00 48 72 KY147 -7.05 . 1 . . . . . 76 . KY4 0 KY4 0 -6.44 -1.17 1 4 5.60 9.64 0.00 42.31 195 231 KY5 0 . . . . . . . . 32 .
Page 69
Page 66 - Carstairs Scores for Scottish Postcode Sectors from the 1991 Census
Public Health Research Unit, University of Glasgow
Appendix II (continued)
Health Board
Local government district Post code sector
Carstairs score DEPCAT No car
Unempl -oyment
Over crowding
Social class 4&5 Population
1981 1991 1981 1991 1981 1991 1991 1991 1991 1991 1981 1991 KY6 3 KY6 3 4.89 -7.19 6 1 6.25 0.00 0.00 0.00 65 62 PH1 1 PH1 1 -6.14 -5.18 1 1 9.24 3.20 0.88 10.88 6421 7124 PH1 2 PH1 2 1.72 1.80 5 5 44.09 12.93 8.61 28.88 12668 11594 PH1 3 PH1 3 -0.95 -1.51 4 3 24.10 6.06 5.78 22.69 8369 8823 PH1 4 PH1 4 -2.09 -3.13 3 2 17.04 5.24 5.01 14.51 3727 3631 PH1 5 PH1 5 1.75 1.89 5 5 55.88 14.25 8.29 23.21 6640 6792 PH106 PH106 -3.07 -2.58 2 3 19.07 10.40 3.77 15.42 4817 5852 PH107 PH107 0.71 -0.00 4 4 26.40 12.95 8.68 21.77 3732 3952 PH118 PH118 -1.28 -1.58 3 3 20.50 6.92 5.97 22.64 2717 2868 PH128 PH128 -1.85 -2.66 3 3 9.36 3.67 5.10 23.73 906 878 PH139 PH139 -2.07 -1.31 3 3 18.95 3.57 7.63 25.85 3705 3934 PH149 PH149 -4.61 -4.21 2 2 6.81 3.83 4.16 13.33 1078 1253 PH152 PH152 -2.59 -1.63 3 3 17.10 5.64 4.63 27.78 2740 3007 PH165 PH165 -2.62 -2.76 3 3 18.46 6.10 4.80 16.60 3291 3704 PH172 PH172 0.50 -3.01 4 2 4.98 3.45 3.48 26.32 186 220 PH185 PH185 -1.44 -1.93 3 3 16.52 3.33 5.00 27.14 805 807 PH2 0 PH2 0 -3.02 -1.89 2 3 25.33 6.97 4.16 21.06 6982 7155 PH2 6 PH2 6 -4.21 -3.81 2 2 13.13 3.55 2.66 16.95 6132 6842 PH2 7 PH2 7 -4.51 -3.77 2 2 15.11 4.88 2.60 15.05 6607 7197 PH2 8 PH2 8 -0.37 1.38 4 5 44.35 14.16 3.79 33.33 2799 3171 PH2 9 PH2 9 -3.95 -4.19 2 2 10.76 4.11 3.39 12.83 4427 5328 PH3 1 PH3 1 -2.27 -2.47 3 3 17.24 5.17 4.33 21.55 3827 4574 PH4 1 PH4 1 0.96 0.44 4 4 18.82 7.78 8.87 34.21 630 584 PH5 2 PH5 2 -3.28 -0.38 2 4 18.41 4.76 4.04 40.00 779 887 PH6 2 PH6 2 -2.36 -3.46 3 2 15.06 6.53 2.72 15.83 1868 1990 PH7 3 PH7 3 -1.57 -1.31 3 3 20.63 7.48 5.52 25.16 4799 5222 PH7 4 PH7 4 -3.31 -1.92 2 3 15.45 7.24 4.01 25.60 1812 2306
Page 70
Page 67 - Carstairs Scores for Scottish Postcode Sectors from the 1991 Census
Public Health Research Unit, University of Glasgow
Appendix II (continued)
Health Board
Local government district Post code sector
Carstairs score DEPCAT No car
Unempl -oyment
Over crowding
Social class 4&5 Population
1981 1991 1981 1991 1981 1991 1991 1991 1991 1991 1981 1991 PH8 0 PH8 0 -3.42 -0.75 2 4 14.02 5.72 7.31 31.53 1599 2010 PH9 0 PH9 0 -1.61 -4.08 3 2 13.38 4.53 4.04 10.77 842 965
Western Islands
Western Islands
PA805 PA805 3.94 4.70 6 6 29.03 21.82 13.66 42.11 1371 1316
PA815 PA815 4.09 4.62 6 6 25.21 17.49 17.68 39.81 2432 2285 PA825 PA825 0.80 -1.92 4 3 19.47 10.07 6.76 15.38 1803 1815 PA833 PA833 -1.23 0.58 3 4 14.47 9.57 4.42 44.44 352 332
PA843 PA843 0.61 1.76 4 5 31.23 18.37 8.92 28.57 455 382 PA853 PA853 1.83 3.59 5 6 26.25 23.15 7.82 44.00 1685 1508 PA860 PA860 -0.53 -1.36 4 3 23.94 11.52 5.91 18.14 9707 9547 PA869 PA869 0.01 -0.34 4 4 24.27 16.26 4.98 23.75 5075 4637 PA872 PA872 -0.63 -0.27 4 4 35.54 10.75 6.97 20.64 5944 5975 PA885 PA885 -1.55 -1.87 3 3 18.57 5.25 12.03 10.81 1887 1803
Page 71
Page 68 - Carstairs Scores for Scottish Postcode Sectors from the 1991 Census
Public Health Research Unit, University of Glasgow
Appendix III
Health Board Local government district Carstairs score No car
Unemploy -ment
Over crowding
Social class 4&5 Population
1981 1991 1991 1991 1991 1991 1981 1991 Argyll & Clyde Argyll & Bute -1.38 -1.00 27.07 9.90 6.49 20.27 62879 65140 Dumbarton -0.22 -0.69 32.17 12.11 6.89 17.46 76821 77173 Inverclyde 1.95 2.79 44.40 19.53 11.31 25.12 99553 90103 Renfrew 0.62 0.25 37.56 13.40 7.79 19.78 205323 196980 Ayrshire & Arran Cumnock & Doon 1.24 1.67 36.08 20.85 7.87 24.93 44738 42594 Cunninghame 0.85 0.23 35.43 14.84 6.07 22.57 136312 136875 Kilmarnock & Loudoun 0.00 -0.12 32.28 13.34 6.00 22.76 81743 79861 Kyle & Carrick -1.35 -1.08 27.63 11.00 5.24 20.65 112271 112658 Borders Berwickshire -1.81 -1.56 17.77 6.87 4.07 27.85 17896 19174 Ettrick & Lauderdale -2.06 -2.25 22.62 6.01 3.85 20.91 30957 34038 Roxburgh -1.55 -1.16 25.38 7.54 3.34 28.39 34586 35346 Tweedale -1.86 -2.38 20.68 7.72 4.50 17.70 13779 15323 Dumfries & Galloway Annandale & Eskdale -1.59 -1.60 21.87 6.62 4.76 24.45 34998 37087 Nithsdale -1.02 -1.24 25.56 9.21 4.82 22.94 54916 57012 Stewartry -1.88 -1.75 17.21 6.97 3.88 26.75 22370 23629 Wigtown -0.67 -0.78 25.44 12.57 5.96 21.30 29579 30077 Fife Dunfermline -1.38 -0.76 29.24 11.21 5.84 21.21 121779 127258 Kirkcaldy -0.39 0.02 32.34 13.83 6.23 23.02 142713 147053 North East Fife -2.64 -2.73 19.22 6.20 4.27 17.38 60263 66888 Forth Valley Clackmannan -1.05 -0.55 28.75 12.40 5.95 21.86 47356 47679 Falkirk -0.40 -0.27 31.18 12.74 5.25 24.07 143771 140980 Stirling -1.79 -1.89 24.52 10.07 5.31 16.06 76929 78833
Page 72
Page 69 - Carstairs Scores for Scottish Postcode Sectors from the 1991 Census
Public Health Research Unit, University of Glasgow
Appendix III (continued)
Health Board Local government district Carstairs score No car
Unemploy -ment
Over crowding
Social class 4&5 Population
1981 1991 1991 1991 1991 1991 1981 1991 Grampian Aberdeen City -1.41 -1.44 30.92 5.84 6.47 18.89 199824 204885 Banff & Buchan -0.80 -0.85 22.01 6.98 5.94 28.16 80112 85303 Gordon -4.07 -3.97 9.92 2.92 4.18 14.76 61792 76642 Kincardine & Deeside -3.81 -3.77 11.00 2.77 3.85 16.77 41009 53442 Moray -1.84 -1.51 22.92 6.65 5.08 24.05 80151 83616 Greater Glasgow Bearsden & Milngavie -5.51 -4.80 10.87 5.67 3.25 6.13 39351 406.12 Clydebank 2.25 2.11 49.31 18.57 9.09 22.28 51999 45717 Eastwood -5.65 -4.95 10.67 5.18 3.16 5.64 53395 59959 Glasgow City 4.07 4.46 58.36 24.50 13.15 24.00 755429 662853 Strathkelvin -2.31 -2.03 23.20 9.27 6.91 13.14 86644 85191 Highlands Caithness -1.24 -0.84 28.99 12.01 5.01 21.49 26944 26710 Inverness -2.08 -1.59 26.05 9.01 5.00 19.56 54285 62186 Lochaber -0.45 0.38 24.51 10.57 8.50 28.81 19024 19310
Badenoch & Strathspey
-2.40 -1.70 19.23 7.69 4.45 24.41 9363 11008
Nairn -2.41 -1.90 23.00 8.03 3.64 22.09 9640 10623 Ross & Cromarty -2.31 -1.59 20.31 10.31 5.12 20.78 44872 48950 Skye & Lochalsh -0.84 -0.65 17.90 11.14 7.64 24.24 9942 11754 Sutherland -2.18 -0.66 21.61 12.67 4.96 25.99 12927 13216 Lanarkshire Clydesdale -1.37 -1.24 23.16 10.83 6.94 18.24 56608 57588
Cumbernauld & Kilsyth
-0.68 -0.87 32.12 11.42 6.15 18.09 61534 62412
East Kilbride -1.39 -1.88 26.59 9.86 4.84 16.23 82600 82777 Hamilton 0.51 0.61 35.01 15.32 9.54 18.74 107935 105202 Monklands 2.94 3.16 42.16 19.27 14.03 24.37 109862 102379 Motherwell 2.33 2.74 40.46 19.48 12.28 24.78 149478 142632
Page 73
Page 70 - Carstairs Scores for Scottish Postcode Sectors from the 1991 Census
Public Health Research Unit, University of Glasgow
Appendix III (continued)
Health Board Local government district Carstairs score No car
Unemploy -ment
Over crowding
Social class 4&5 Population
1981 1991 1991 1991 1991 1991 1981 1991 Lothian East Lothian -1.58 -1.42 27.23 9.64 5.21 19.38 78952 84114 Edinburgh City -1.10 -0.98 37.75 10.93 6.00 15.22 425256 418914 Midlothian -1.51 -0.71 28.22 10.75 6.99 20.39 81680 78845 West Lothian 0.26 -0.46 28.52 11.33 6.25 23.29 137220 144137 Orkney Islands Orkney Islands -2.30 -1.69 17.42 6.02 5.63 24.75 18419 19612 Shetland Islands Shetland Islands -2.46 -1.16 19.15 5.61 5.28 29.58 22768 22522 Tayside Angus -1.46 -1.21 26.93 8.72 4.99 22.74 91454 94480 Dundee City 0.89 0.85 42.47 15.24 7.67 20.90 177545 165873 Perth & Kinross -2.05 -1.92 22.26 7.28 4.95 20.41 113708 123495 Western Islands Western Islands 0.26 0.00 26.16 13.21 7.78 23.39 30711 29600
Page 74
Page 71 - Carstairs Scores for Scottish Postcode Sectors from the 1991 Census
Public Health Research Unit, University of Glasgow
Appendix IV
Health Board Carstairs
score Carstairs
score No car Unemployment Over
crowding Social class
4&5 Population Population
1981 1991 1991 1991 1991 1991 1981 1991
Argyll & Clyde 0.49 0.42 36.44 13.92 8.17 20.56 444576 429396
Ayrshire & Arran 0.05 -0.08 32.47 14.04 6.01 22.30 375064 371988
Borders -1.80 -1.77 22.38 6.94 3.81 24.26 97218 103881
Dumfries & Galloway -1.22 -1.32 23.28 8.88 4.89 23.59 141863 147805
Fife -1.18 -0.81 28.61 11.36 5.70 21.24 324755 341199
Forth Valley -0.91 -0.80 28.78 11.89 5.39 21.31 268056 267492
Grampian -1.95 -1.98 22.78 5.40 5.52 20.46 462888 503888
Greater Glasgow 2.50 2.67 49.19 20.59 11.23 20.84 986818 894332
Highlands -1.82 -1.21 23.63 10.10 5.41 22.06 186997 203757
Lanarkshire 0.87 0.90 34.92 15.40 9.72 20.84 568017 552990
Lothian -0.94 -0.90 33.66 10.84 6.07 17.87 723108 726010
Orkney Islands -2.30 -1.69 17.42 6.02 5.63 24.75 18419 19612
Shetland Islands -2.46 -1.16 19.15 5.61 5.28 29.58 22768 22522
Tayside -0.55 -0.55 32.14 11.07 6.14 21.20 382707 383848
Western Islands 0.26 0.00 26.16 13.21 7.78 23.39 30711 29600
Page 75
Page 72 - Carstairs Scores for Scottish Postcode Sectors from the 1991 Census
Public Health Research Unit, University of Glasgow
Appendix V
Health Board Local government District
Post code
sector
Carstairs score
DEPCAT Pop. aged 40-64
Obs. deaths
SMRs ages 40-64
95% CI Obs. discharges
SDRs 40-64
95% CI
1991 1991 1991 1991 1991-92 1991 Argyll & Clyde Argyll & Bute FK208 -6.86 1 24 0 0 ( 0 ,1111) 1 25 ( 1 , 139) G83 7 1.25 5 62 1 98 ( 2 , 544) 15 140 ( 78 , 230) PA200 0.67 4 1198 19 99 ( 60 , 155) 212 103 ( 90 , 118) PA209 0.99 4 1061 9 53 ( 24 , 101) 183 100 ( 86 , 116) PA212 -0.14 4 303 1 19 ( 0 , 104) 50 93 ( 69 , 123) PA223 -5.61 1 131 0 0 ( 0 , 187) 9 40 ( 18 , 76) PA237 -1.97 3 1564 25 110 ( 71 , 162) 291 111 ( 99 , 125) PA238 -1.31 3 2024 32 111 ( 76 , 157) 416 124 (112 , 136) PA248 -3.37 2 164 1 39 ( 1 , 218) 23 82 ( 52 , 123) PA258 -5.30 1 39 0 0 ( 0 , 473) 3 42 ( 9 , 123) PA268 -5.76 1 36 0 0 ( 0 , 678) 8 132 ( 57 , 261) PA278 -2.59 3 227 5 147 ( 47 , 342) 27 71 ( 47 , 103) PA286 -0.57 4 2663 33 81 ( 56 , 114) 477 106 ( 96 , 116) PA296 -0.06 4 784 13 113 ( 60 , 194) 89 68 ( 55 , 84) PA308 -3.64 2 464 9 136 ( 62 , 257) 67 87 ( 67 , 110) PA318 -2.11 3 1422 27 127 ( 84 , 185) 220 91 ( 80 , 104) PA328 -2.00 3 425 9 136 ( 62 , 257) 59 82 ( 62 , 105) PA331 -1.26 3 237 4 109 ( 30 , 279) 30 74 ( 50 , 105) PA344 -1.07 4 1868 27 104 ( 68 , 151) 356 115 (104 , 128) PA345 -1.96 3 1032 19 121 ( 73 , 190) 202 116 (100 , 133)
Page 76
Page 73 - Carstairs Scores for Scottish Postcode Sectors from the 1991 Census
Public Health Research Unit, University of Glasgow
Appendix V (continued)
Health Board
Local government District
Post code
sector
Carstairs score DEPCAT
Pop. aged 40-64
Obs. deaths
SMRs ages 40-64
95% CI Obs.
discharges
SDRs 40-64
95% CI
1991 1991 1991 1991 1991-92 1991 PA351 -1.32 3 376 3 53 ( 11 , 154) 92 143 (116 , 176) PA371 -0.82 4 851 14 113 ( 61 , 189) 187 131 (113 , 151) PA384 1.08 5 173 1 37 ( 1 , 207) 15 51 ( 28 , 83) PA417 -1.92 3 53 0 0 ( 0 , 520) 3 34 ( 7 , 100) PA427 1.77 5 397 3 52 ( 11 , 151) 118 177 (147 , 212) PA437 -0.84 4 304 9 197 ( 90 , 374) 53 103 ( 77 , 135) PA447 -4.56 2 91 2 166 ( 20 , 601) 24 163 (105 , 243) PA457 -3.07 2 49 0 0 ( 0 , 522) 4 50 ( 14 , 128) PA467 2.69 5 72 0 0 ( 0 , 399) 26 224 (146 , 328) PA477 1.16 5 56 1 119 ( 3 , 665) 12 129 ( 66 , 225) PA487 1.32 5 116 3 166 ( 34 , 485) 25 126 ( 82 , 187) PA497 -1.44 3 58 0 0 ( 0 , 440) 19 195 (117 , 305) PA607 -0.45 4 57 0 0 ( 0 , 464) 14 152 ( 83 , 256) PA617 -0.97 4 50 1 146 ( 4 , 814) 4 49 ( 13 , 126) PA626 -3.15 2 19 0 0 ( 0 ,1647) 2 68 ( 8 , 245) PA646 -2.33 3 36 1 153 ( 4 , 852) 9 140 ( 64 , 266) PA656 -0.69 4 59 0 0 ( 0 , 442) 10 102 ( 49 , 188) PA666 0.61 4 41 0 0 ( 0 , 753) 3 45 ( 9 , 133) PA676 -1.46 3 75 0 0 ( 0 , 384) 15 124 ( 69 , 205) PA706 -3.38 2 37 0 0 ( 0 , 608) 4 63 ( 17 , 162) PA726 -3.11 2 132 1 58 ( 1 , 320) 33 154 (106 , 216) PA736 5.52 6 27 0 0 ( 0 , 772) 1 21 ( 1 , 115) PA756 -0.37 4 373 3 55 ( 11 , 160) 81 131 (104 , 162) PA766 5.51 6 32 0 0 ( 0 ,1037) 3 58 ( 12 , 170)
Page 77
Page 74 - Carstairs Scores for Scottish Postcode Sectors from the 1991 Census
Public Health Research Unit, University of Glasgow
Appendix V (continued)
Health Board
Local government District
Post code
sector
Carstairs score DEPCAT
Pop. aged 40-64
Obs. deaths
SMRs ages 40-64
95% CI Obs.
discharges
SDRs 40-64
95% CI
1991 1991 1991 1991 1991-92 1991 PA776 -0.72 4 239 6 153 ( 56 , 334) 53 130 ( 97 , 170) PA786 0.59 4 51 3 493 (102 ,1440) 13 163 ( 87 , 278) Argyll & Clyde Dumbarton G60 5 1.81 5 124 0 0 ( 0 , 189) 13 61 ( 33 , 105) G82 1 -0.79 4 704 13 117 ( 62 , 200) 138 115 ( 96 , 136) G82 2 -1.43 3 1807 38 134 ( 95 , 184) 378 122 (110 , 135) G82 3 2.31 5 1824 25 94 ( 61 , 139) 327 107 ( 96 , 119) G82 4 2.60 5 1446 29 134 ( 90 , 193) 314 129 (115 , 144) G82 5 0.93 4 1790 20 81 ( 49 , 125) 299 102 ( 90 , 114) G83 0 0.72 4 2058 34 104 ( 72 , 146) 369 105 ( 94 , 116) G83 7 -2.26 3 242 3 90 ( 19 , 264) 27 68 ( 45 , 99) G83 8 0.40 4 2441 40 116 ( 83 , 158) 422 104 ( 94 , 115) G83 9 0.72 4 2619 44 137 ( 99 , 183) 428 102 ( 93 , 112) G84 0 -3.19 2 1466 17 78 ( 45 , 125) 286 116 (103 , 130) G84 7 -2.50 3 1907 23 88 ( 56 , 132) 286 91 ( 81 , 102) G84 8 -4.18 2 1717 21 82 ( 51 , 126) 243 84 ( 74 , 95) G84 9 -5.92 1 1478 15 86 ( 48 , 143) 216 93 ( 81 , 106) Argyll & Clyde Inverclyde PA113 -2.97 3 222 10 321 ( 154 , 591) 40 110 ( 79 , 150) PA134 -4.82 1 1586 12 55 ( 28 , 96) 192 73 ( 63 , 85) PA145 2.52 5 2762 46 118 ( 86 , 157) 523 114 (105 , 125) PA146 6.55 7 3065 64 147 (113 , 187) 601 118 (109 , 128) PA151 4.41 6 630 26 205 (134 , 301) 177 152 (131 , 177) PA152 7.67 7 1567 39 162 (115 , 222) 352 132 (119 , 147)
Page 78
Page 75 - Carstairs Scores for Scottish Postcode Sectors from the 1991 Census
Public Health Research Unit, University of Glasgow
Appendix V (continued)
Health Board
Local government District
Post code
sector
Carstairs score DEPCAT
Pop. aged 40-64
Obs. deaths
SMRs ages 40-64
95% CI Obs.
discharges
SDRs 40-64
95% CI
1991 1991 1991 1991 1991-92 1991 PA153 7.19 7 1038 10 64 ( 31 , 118) 255 145 (128 , 164) PA154 4.06 6 2626 63 144 (110 , 184) 535 117 (107 , 127) PA160 5.90 6 3005 60 135 (103 , 174) 625 124 (114 , 134) PA167 4.10 6 2834 55 120 ( 91 , 156) 540 110 (101 , 120) PA168 -2.86 3 1767 19 78 ( 47 , 122) 266 91 ( 81 , 103) PA169 1.53 5 1385 14 65 ( 35 , 109) 239 101 ( 89 , 115) PA186 -3.13 2 444 4 73 ( 20 , 186) 69 97 ( 76 , 123) PA191 -1.19 3 3605 52 96 ( 72 , 126) 511 84 ( 77 , 92) Argyll & Clyde Renfrew G53 7 9.74 7 13 0 0 ( 0 ,2016) 5 235 ( 76 , 549) G78 1 0.23 4 2372 36 109 ( 76 , 151) 427 109 ( 99 , 120) G78 2 1.12 5 2904 51 115 ( 86 , 151) 615 124 (115 , 134) G78 3 -0.46 4 1517 20 98 ( 60 , 152) 268 108 ( 95 , 122) G78 4 -5.85 1 247 3 86 ( 18 , 250) 35 85 ( 60 , 119) PA1 1 2.17 5 1311 26 139 ( 91 , 204) 286 131 (116 , 147) PA1 2 3.19 6 1897 41 129 ( 92 , 175) 413 125 (113 , 137) PA1 3 -3.99 2 2789 31 71 ( 48 , 101) 448 94 ( 86 , 103) PA102 -3.97 2 1295 13 72 ( 38 , 123) 179 84 ( 72 , 97) PA113 -4.20 2 1831 15 63 ( 35 , 103) 294 99 ( 88 , 111) PA124 -2.59 3 948 12 95 ( 49 , 165) 156 101 ( 86 , 119) PA146 -6.10 1 370 2 41 ( 5 , 149) 39 65 ( 46 , 89) PA2 0 3.04 6 2300 45 120 ( 88 , 161) 486 122 (111 , 133) PA2 6 0.71 4 2877 38 84 ( 59 , 115) 561 114 (105 , 124) PA2 7 -1.53 3 2251 38 107 ( 76 , 147) 409 106 ( 96 , 117)
Page 79
Page 76 - Carstairs Scores for Scottish Postcode Sectors from the 1991 Census
Public Health Research Unit, University of Glasgow
Appendix V (continued)
Health Board
Local government District
Post code
sector
Carstairs score DEPCAT
Pop. aged 40-64
Obs. deaths
SMRs ages 40-64
95% CI Obs.
discharges
SDRs 40-64
95% CI
1991 1991 1991 1991 1991-92 1991 PA2 8 2.65 5 2584 50 132 ( 98 , 174) 536 123 (113 , 134) PA2 9 -2.32 3 2279 39 126 ( 89 , 172) 369 99 ( 89 , 109) PA3 1 10.53 7 1240 37 196 (138 , 271) 316 150 (134 , 167) PA3 2 3.84 6 1281 18 90 ( 53 , 142) 269 123 (109 , 138) PA3 3 2.58 5 3544 68 124 ( 96 , 157) 656 108 (100 , 116) PA3 4 4.94 6 2147 37 114 ( 80 , 157) 427 117 (106 , 129) PA4 0 -1.66 3 3452 45 93 ( 68 , 125) 562 99 ( 91 , 107) PA4 8 3.14 6 2079 32 106 ( 73 , 150) 413 119 (107 , 131) PA4 9 0.27 4 1285 26 134 ( 87 , 196) 222 102 ( 89 , 117) PA5 0 3.30 6 2829 47 104 ( 77 , 139) 561 115 (106 , 125) PA5 8 2.45 5 2544 47 124 ( 91 , 165) 563 131 (120 , 142) PA5 9 0.43 4 2325 32 88 ( 60 , 124) 389 98 ( 88 , 108) PA6 7 -5.54 1 1714 9 45 ( 21 , 85) 231 86 ( 75 , 98) PA7 5 -5.09 1 1864 20 84 ( 52 , 131) 267 89 ( 79 , 100) PA8 6 -3.16 2 1868 18 70 ( 41 , 110) 293 95 ( 85 , 107) PA8 7 -4.04 2 1842 19 83 ( 50 , 130) 284 96 ( 85 , 108) PA9 1 -4.23 2 413 9 162 ( 74 , 307) 85 126 (100 , 155) Ayrshire & Arran
Cumnock & Doon KA181 1.09 5 2256 16 49 ( 28 , 80) 432 115 (104 , 126)
KA182 1.79 5 1686 25 97 ( 63 , 143) 274 95 ( 85 , 108) KA183 2.93 6 1749 33 123 ( 85 , 173) 304 103 ( 91 , 115) KA184 1.69 5 1498 27 116 ( 77 , 169) 213 83 ( 73 , 95) KA4 8 -4.19 2 22 0 0 ( 0 ,1198) 4 110 ( 30 , 281) KA5 5 -3.85 2 638 6 63 ( 23 , 137) 71 66 ( 52 , 83)
Page 80
Page 77 - Carstairs Scores for Scottish Postcode Sectors from the 1991 Census
Public Health Research Unit, University of Glasgow
Appendix V (continued)
Health Board
Local government District
Post code
sector
Carstairs score DEPCAT
Pop. aged 40-64
Obs. deaths
SMRs ages 40-64
95% CI Obs.
discharges
SDRs 40-64
95% CI
1991 1991 1991 1991 1991-92 1991 KA5 6 1.12 5 1652 20 83 ( 51 , 129) 249 90 ( 79 , 102) KA6 6 1.43 5 478 6 84 ( 31 , 183) 70 87 ( 68 , 110) KA6 7 2.75 5 2999 41 95 ( 68 , 128) 440 88 ( 80 , 96) Ayrshire & Arran
Cunninghame KA111 -0.61 4 2944 42 115 ( 83 , 155) 521 111 (101 , 120)
KA112 -4.18 2 201 4 157 ( 43 , 401) 32 99 ( 67 , 139) KA113 3.15 6 413 10 169 ( 81 , 311) 85 123 ( 98 , 152) KA114 -1.52 3 1236 16 99 ( 56 , 160) 197 98 ( 85 , 113) KA115 -3.94 2 92 2 169 ( 20 , 610) 16 106 ( 61 , 173) KA120 1.18 5 2871 48 107 ( 79 , 141) 574 116 (107 , 126) KA128 0.66 4 1197 26 142 ( 93 , 208) 181 89 ( 77 , 103) KA129 3.13 6 2359 38 110 ( 78 , 152) 388 98 ( 88 , 108) KA136 0.34 4 2719 32 90 ( 61 , 127) 436 98 ( 89 , 108) KA137 1.35 5 1933 29 103 ( 69 , 147) 277 85 ( 76 , 96) KA143 0.50 4 265 9 252 (115 , 478) 38 88 ( 62 , 121) KA151 -2.68 3 1074 14 94 ( 51 , 157) 162 92 ( 78 , 107) KA152 -1.21 3 1076 16 103 ( 59 , 168) 162 90 ( 77 , 105) KA2 0 -6.75 1 30 0 0 ( 0 ,1054) 1 21 ( 1 , 119) KA203 2.81 5 1654 26 108 ( 71 , 159) 277 100 ( 88 , 112) KA204 3.27 6 1354 20 98 ( 60 , 151) 242 105 ( 92 , 119) KA215 0.95 4 1929 41 137 ( 98 , 186) 320 98 ( 87 , 109) KA216 3.34 6 1692 26 106 ( 69 , 156) 287 101 ( 90 , 113) KA227 1.39 5 1839 31 125 ( 85 , 178) 237 79 ( 69 , 89) KA228 0.50 4 1167 19 107 ( 64 , 167) 168 85 ( 73 , 99)
Page 81
Page 78 - Carstairs Scores for Scottish Postcode Sectors from the 1991 Census
Public Health Research Unit, University of Glasgow
Appendix V (continued)
Health Board
Local government District
Post code
sector
Carstairs score DEPCAT
Pop. aged 40-64
Obs. deaths
SMRs ages 40-64
95% CI Obs.
discharges
SDRs 40-64
95% CI
1991 1991 1991 1991 1991-92 1991 KA239 -2.65 3 1557 19 88 ( 53 , 138) 200 78 ( 68 , 90) KA244 0.92 4 1148 23 132 ( 83 , 197) 182 93 ( 80 , 108) KA245 -2.15 3 854 10 90 ( 43 , 166) 120 87 ( 72 , 104) KA256 2.92 6 1280 31 154 (104 , 218) 218 99 ( 86 , 113) KA257 -0.00 4 925 6 47 ( 17 , 102) 193 126 (109 , 145) KA278 -2.38 3 1477 19 82 ( 49 , 128) 251 99 ( 87 , 112) KA280 -0.40 4 458 6 77 ( 28 , 167) 85 106 ( 85 , 131) KA290 -3.75 2 521 2 25 ( 3 , 92) 71 81 ( 63 , 102) KA3 2 1.92 5 70 3 357 ( 74 ,1043) 11 100 ( 50 , 178) KA308 -4.01 2 1591 15 62 ( 35 , 102) 165 61 ( 52 , 71) KA309 -1.36 3 1864 23 77 ( 49 , 116) 251 79 ( 69 , 89) PA175 -3.23 2 663 3 33 ( 7 , 98) 78 72 ( 57 , 89) Ayrshire & Arran
Kilmarnock & Loudoun
KA1 1 -4.10 2 911 9 73 ( 33 , 139) 156 105 ( 89 , 123)
KA1 2 -2.17 3 1404 24 104 ( 67 , 155) 216 89 ( 77 , 101) KA1 3 0.22 4 2383 42 99 ( 72 , 134) 420 99 ( 90 , 109) KA1 4 2.92 6 2039 35 114 ( 80 , 159) 354 103 ( 92 , 114) KA1 5 2.02 5 1326 23 110 ( 70 , 166) 221 97 ( 85 , 111) KA169 -0.42 4 1051 13 86 ( 46 , 147) 163 93 ( 79 , 109) KA170 -2.34 3 1150 17 107 ( 62 , 171) 174 92 ( 79 , 107) KA2 0 -1.05 4 1011 14 101 ( 55 , 169) 122 74 ( 61 , 88) KA2 9 . . 12 0 0 ( 0 ,1922) 3 142 ( 29 , 415) KA3 1 1.94 5 1576 34 141 ( 98 , 198) 279 104 ( 92 , 117) KA3 2 1.32 5 2429 37 107 ( 75 , 147) 389 97 ( 87 , 107)
Page 82
Page 79 - Carstairs Scores for Scottish Postcode Sectors from the 1991 Census
Public Health Research Unit, University of Glasgow
Appendix V (continued)
Health Board
Local government District
Post code
sector
Carstairs score DEPCAT
Pop. aged 40-64
Obs. deaths
SMRs ages 40-64
95% CI Obs.
discharges
SDRs 40-64
95% CI
1991 1991 1991 1991 1991-92 1991 KA3 3 -0.52 4 956 10 74 ( 36 , 137) 123 77 ( 64 , 92) KA3 4 -2.59 3 458 7 115 ( 46 , 237) 68 91 ( 70 , 115) KA3 5 -3.37 2 1216 16 104 ( 59 , 169) 132 67 ( 56 , 80) KA3 6 -1.39 3 870 8 67 ( 29 , 133) 100 70 ( 57 , 85) KA3 7 0.04 4 3200 31 74 ( 51 , 106) 435 83 ( 76 , 91) Ayrshire & Arran
Kyle & Carrick KA1 5 -1.35 3 669 7 76 ( 30 , 156) 132 119 (100 , 142)
KA106 -2.99 2 3029 32 75 ( 52 , 106) 507 101 ( 93 , 111) KA107 -3.19 2 1666 16 75 ( 43 , 122) 243 91 ( 80 , 103) KA197 -1.24 3 1334 17 85 ( 50 , 136) 208 93 ( 81 , 106) KA198 -2.25 3 877 10 85 ( 40 , 156) 125 87 ( 72 , 103) KA2 9 -1.50 3 908 13 106 ( 56 , 181) 113 76 ( 62 , 91) KA260 2.36 5 1976 29 97 ( 65 , 139) 339 101 ( 91 , 113) KA269 0.25 4 1766 23 86 ( 54 , 129) 274 91 ( 81 , 103) KA5 5 1.47 5 783 14 129 ( 71 , 217) 124 96 ( 80 , 114) KA6 5 1.29 5 1170 22 127 ( 79 , 192) 201 102 ( 88 , 117) KA6 6 -3.03 2 882 10 76 ( 36 , 140) 117 78 ( 65 , 94) KA7 1 0.68 4 543 12 143 ( 74 , 250) 94 102 ( 82 , 125) KA7 2 -4.22 2 1941 23 79 ( 50 , 118) 299 91 ( 81 , 102) KA7 3 -0.86 4 3762 43 75 ( 55 , 102) 559 88 ( 80 , 95) KA7 4 -5.60 1 3413 16 34 ( 19 , 55) 403 71 ( 64 , 79) KA8 0 3.26 6 2436 48 124 ( 91 , 165) 487 116 (106 , 127) KA8 8 1.28 5 1207 19 98 ( 59 , 153) 250 120 (106 , 136) KA8 9 2.84 5 2304 44 121 ( 88 , 162) 416 105 ( 95 , 116)
Page 83
Page 80 - Carstairs Scores for Scottish Postcode Sectors from the 1991 Census
Public Health Research Unit, University of Glasgow
Appendix V (continued)
Health Board
Local government District
Post code
sector
Carstairs score DEPCAT
Pop. aged 40-64
Obs. deaths
SMRs ages 40-64
95% CI Obs.
discharges
SDRs 40-64
95% CI
1991 1991 1991 1991 1991-92 1991 KA9 1 -2.24 3 2362 34 98 ( 68 , 137) 348 88 ( 79 , 97) KA9 2 -3.14 2 2159 32 100 ( 68 , 141) 352 97 ( 87 , 108) Borders Berwickshire TD106 -2.72 3 310 6 128 ( 47 , 278) 28 53 ( 35 , 77) TD113 -1.84 3 2053 19 61 ( 37 , 95) 283 82 ( 72 , 92) TD124 -1.40 3 773 8 67 ( 29 , 131) 99 75 ( 61 , 91) TD135 -0.30 4 188 4 135 ( 37 , 346) 15 47 ( 26 , 77) TD145 -0.71 4 1929 17 60 ( 35 , 96) 288 89 ( 79 , 100) TD151 -4.08 2 412 2 30 ( 4 , 107) 17 24 ( 14 , 38) TD3 6 -2.97 3 230 5 148 ( 48 , 345) 31 81 ( 55 , 114) TD5 7 -1.05 4 86 1 85 ( 2 , 476) 14 100 ( 55 , 168)
Borders Ettrick & Lauderdale
EH385 -3.99 2 93 0 0 ( 0 , 332) 13 88 ( 47 , 151)
TD1 1 -1.58 3 1368 18 87 ( 51 , 137) 252 109 ( 96 , 123) TD1 2 -0.86 4 1728 22 90 ( 56 , 136) 304 106 ( 94 , 119) TD1 3 -2.83 3 1375 15 77 ( 43 , 127) 264 116 (102 , 130) TD2 6 -3.04 2 496 7 98 ( 39 , 202) 66 80 ( 62 , 102) TD3 6 -4.93 1 35 0 0 ( 0 , 661) 2 33 ( 4 , 119) TD4 6 -2.37 3 622 3 31 ( 6 , 91) 68 64 ( 50 , 82) TD5 8 -3.68 2 26 1 219 ( 6 ,1221) 4 87 ( 24 , 222) TD6 0 -2.50 3 899 9 69 ( 31 , 131) 120 80 ( 66 , 96) TD6 9 -3.63 2 1129 15 92 ( 51 , 152) 165 87 ( 75 , 102) TD7 4 -2.83 3 1427 16 78 ( 44 , 126) 208 87 ( 76 , 100) TD7 5 -1.67 3 828 4 34 ( 9 , 86) 122 89 ( 74 , 106)
Page 84
Page 81 - Carstairs Scores for Scottish Postcode Sectors from the 1991 Census
Public Health Research Unit, University of Glasgow
Appendix V (continued)
Health Board
Local government District
Post code
sector
Carstairs score DEPCAT
Pop. aged 40-64
Obs. deaths
SMRs ages 40-64
95% CI Obs.
discharges
SDRs 40-64
95% CI
1991 1991 1991 1991 1991-92 1991 Borders Roxburgh TD5 7 -1.83 3 1797 26 98 ( 64 , 144) 285 95 ( 84 , 106) TD5 8 -3.11 2 1083 7 45 ( 18 , 93) 108 60 ( 49 , 72) TD6 9 -0.12 4 42 0 0 ( 0 , 471) 4 52 ( 14 , 133) TD8 6 -1.25 3 1811 24 88 ( 56 , 131) 274 89 ( 79 , 100) TD9 0 -1.10 4 1489 26 108 ( 71 , 159) 191 74 ( 64 , 86) TD9 7 -1.97 3 1414 18 83 ( 49 , 131) 198 82 ( 71 , 95) TD9 8 2.02 5 1738 25 99 ( 64 , 146) 256 88 ( 78 , 100) TD9 9 -2.14 3 1484 14 63 ( 35 , 106) 209 84 ( 73 , 96) Borders Tweedale EH269 -3.41 2 43 0 0 ( 0 , 567) 7 96 ( 38 , 197) EH436 0.55 4 237 3 76 ( 16 , 221) 51 123 ( 92 , 162)
Appendix
V
Post Pop. SMRs Local code Carstairs aged ages Obs. SDRs government sector score DEPCAT 40-64 Obs. 40-64 dis- 40-64 Health Board district 1991 1991 1991 1991 deaths 1991-92 95% CI charges 1991 95% CI -----------------------------
--------------------------
--------- ------------ ------------ -------- --------- ---------- ---------- ----------- -------- ----------
EH446 -0.09 4 906 12 90 ( 47 , 158) 151 99 ( 84 , 117) EH458 -2.49 3 1399 13 62 ( 33 , 106) 217 92 ( 80 , 105) EH459 -3.10 2 1135 10 61 ( 29 , 112) 171 90 ( 77 , 105) EH467 -4.28 2 781 7 68 ( 27 , 141) 107 84 ( 69 , 102) ML126 -3.59 2 300 1 22 ( 1 , 121) 34 67 ( 46 , 93)
Page 85
Page 82 - Carstairs Scores for Scottish Postcode Sectors from the 1991 Census
Public Health Research Unit, University of Glasgow
Appendix V (continued)
Health Board
Local government District
Post code
sector
Carstairs score DEPCAT
Pop. aged 40-64
Obs. deaths
SMRs ages 40-64
95% CI Obs.
discharges
SDRs 40-64
95% CI
1991 1991 1991 1991 1991-92 1991 Dumfries & Galloway
Annandale & Eskdale
CA6 5 -0.86 4 1042 7 42 ( 17 , 86) 21 12 ( 7 , 18)
DG1 4 -6.33 1 85 2 163 ( 20 , 588) 17 121 ( 70 , 193) DG109 -1.93 3 1132 16 90 ( 51 , 146) 165 85 ( 73 , 99) DG111 -3.29 2 1372 18 85 ( 50 , 134) 221 95 ( 82 , 108) DG112 -1.34 3 1515 13 58 ( 31 , 99) 166 65 ( 56 , 76) DG113 -2.46 3 1012 13 84 ( 45 , 144) 109 63 ( 52 , 76) DG125 -0.45 4 1798 21 74 ( 46 , 113) 259 84 ( 74 , 95) DG126 -0.98 4 1947 23 83 ( 52 , 124) 326 101 ( 90 , 113) DG130 -1.74 3 1049 7 47 ( 19 , 97) 26 15 ( 10 , 22) DG140 -3.02 2 448 3 46 ( 9 , 134) 2 3 ( 0 , 10) Dumfries & Galloway
Nithsdale DG1 1 -1.75 3 1951 26 85 ( 56 , 125) 310 93 ( 83 , 104)
DG1 2 0.90 4 612 8 86 ( 37 , 170) 100 97 ( 79 , 118) DG1 3 -3.14 2 1719 16 61 ( 35 , 99) 246 84 ( 74 , 96) DG1 4 -4.05 2 3197 32 76 ( 52 , 107) 368 71 ( 64 , 79) DG111 0.81 4 93 1 76 ( 2 , 426) 14 91 ( 49 , 152) DG2 0 1.59 5 2379 63 170 (131 , 217) 389 96 ( 87 , 106) DG2 7 -2.47 3 1534 15 64 ( 36 , 106) 218 84 ( 73 , 96) DG2 8 -1.89 3 813 11 87 ( 43 , 155) 113 82 ( 67 , 98) DG2 9 1.04 5 2071 30 93 ( 62 , 132) 322 91 ( 81 , 101) DG3 4 -2.69 3 653 5 51 ( 17 , 119) 96 87 ( 70 , 106) DG3 5 -2.26 3 791 11 86 ( 43 , 154) 87 64 ( 51 , 79) DG4 6 1.56 5 1555 25 107 ( 69 , 157) 198 75 ( 65 , 87)
Page 86
Page 83 - Carstairs Scores for Scottish Postcode Sectors from the 1991 Census
Public Health Research Unit, University of Glasgow
Appendix V (continued)
Health Board
Local government District
Post code
sector
Carstairs score DEPCAT
Pop. aged 40-64
Obs. deaths
SMRs ages 40-64
95% CI Obs.
discharges
SDRs 40-64
95% CI
1991 1991 1991 1991 1991-92 1991 ML126 3.97 6 71 0 0 ( 0 , 329) 9 74 ( 34 , 140) Dumfries & Galloway
Stewartry DG2 8 -3.65 2 382 2 34 ( 4 , 124) 34 52 ( 36 , 73)
DG3 4 4.86 6 36 1 173 ( 4 , 962) 0 0 ( 0 , 59) DG5 4 -1.30 3 1655 28 108 ( 72 , 156) 287 102 ( 90 , 114) DG6 4 -1.16 4 1677 14 53 ( 29 , 89) 194 68 ( 59 , 78) DG7 1 -1.54 3 1705 18 69 ( 41 , 108) 186 64 ( 55 , 74) DG7 2 -2.06 3 743 6 48 ( 18 , 105) 110 85 ( 70 , 102) DG7 3 -2.87 3 1317 13 61 ( 33 , 105) 163 72 ( 61 , 84) Dumfries & Galloway
Wigtown DG8 0 -3.29 2 654 7 71 ( 28 , 146) 105 95 ( 78 , 115)
DG8 6 -1.66 3 1309 11 57 ( 29 , 103) 255 116 (102 , 131) DG8 7 -0.79 4 443 10 145 ( 69 , 266) 89 117 ( 94 , 145) DG8 8 1.32 5 806 12 96 ( 50 , 168) 106 77 ( 63 , 93) DG8 9 -2.73 3 1014 13 81 ( 43 , 139) 162 93 ( 79 , 109) DG9 0 -1.82 3 1398 28 136 ( 90 , 197) 240 102 ( 90 , 116) DG9 7 2.16 5 1893 37 131 ( 92 , 180) 389 122 (110 , 135) DG9 8 -2.33 3 1381 15 71 ( 40 , 117) 243 104 ( 91 , 118) DG9 9 -0.42 4 799 9 73 ( 34 , 139) 150 111 ( 94 , 130) Fife Dunfermline FK103 -3.33 2 37 0 0 ( 0 , 650) 2 31 ( 4 , 112) FK104 0.78 4 1046 10 63 ( 30 , 116) 208 118 (102 , 135) KY111 -0.42 4 2072 34 115 ( 80 , 161) 314 91 ( 81 , 102)
Page 87
Page 84 - Carstairs Scores for Scottish Postcode Sectors from the 1991 Census
Public Health Research Unit, University of Glasgow
Appendix V (continued)
Health Board
Local government District
Post code
sector
Carstairs score DEPCAT
Pop. aged 40-64
Obs. deaths
SMRs ages 40-64
95% CI Obs.
discharges
SDRs 40-64
95% CI
1991 1991 1991 1991 1991-92 1991 KY112 -1.16 4 3159 42 97 ( 70 , 131) 508 98 ( 90 , 107) KY113 -1.27 3 1183 11 64 ( 32 , 115) 159 80 ( 68 , 94) KY114 0.62 4 4366 68 107 ( 83 , 136) 701 96 ( 89 , 103) KY115 -4.57 2 4107 31 64 ( 44 , 91) 578 89 ( 82 , 97) KY120 -1.19 4 2619 40 106 ( 76 , 145) 379 87 ( 78 , 96) KY127 -5.31 1 1677 23 102 ( 64 , 152) 269 98 ( 87 , 111) KY128 -2.08 3 3128 38 90 ( 63 , 123) 434 85 ( 77 , 93) KY129 -0.85 4 3132 42 102 ( 73 , 137) 440 86 ( 79 , 95) KY3 0 -4.24 2 539 5 67 ( 22 , 156) 55 61 ( 46 , 80) KY4 0 1.87 5 1597 31 129 ( 88 , 183) 242 90 ( 79 , 102) KY4 8 0.60 4 1666 24 96 ( 61 , 143) 340 121 (109 , 135) KY4 9 0.45 4 2515 34 96 ( 67 , 134) 439 105 ( 96 , 116) KY5 8 3.97 6 1797 33 119 ( 82 , 167) 311 102 ( 91 , 114) KY5 9 1.55 5 1979 29 94 ( 63 , 134) 300 89 ( 79 , 99) Fife Kirkcaldy KY1 1 0.04 4 1556 24 99 ( 64 , 148) 248 94 ( 82 , 106) KY1 2 2.53 5 1918 28 96 ( 64 , 138) 245 75 ( 66 , 85) KY1 3 0.80 4 1526 23 94 ( 60 , 142) 244 93 ( 82 , 106) KY1 4 -0.66 4 1321 22 103 ( 65 , 156) 167 74 ( 63 , 86) KY2 5 -2.07 3 3344 51 100 ( 75 , 132) 448 79 ( 72 , 87) KY2 6 0.01 4 5726 75 91 ( 72 , 114) 696 73 ( 68 , 79) KY3 0 2.10 5 830 13 104 ( 56 , 178) 102 73 ( 59 , 88) KY3 9 -2.49 3 1934 34 123 ( 85 , 172) 180 56 ( 48 , 65) KY5 0 2.33 5 2106 35 113 ( 79 , 157) 315 89 ( 80 , 100)
Page 88
Page 85 - Carstairs Scores for Scottish Postcode Sectors from the 1991 Census
Public Health Research Unit, University of Glasgow
Appendix V (continued)
Health Board
Local government District
Post code
sector
Carstairs score DEPCAT
Pop. aged 40-64
Obs. deaths
SMRs ages 40-64
95% CI Obs.
discharges
SDRs 40-64
95% CI
1991 1991 1991 1991 1991-92 1991 KY6 1 1.36 5 1657 25 100 ( 65 , 148) 213 76 ( 66 , 86) KY6 2 -0.76 4 2821 32 87 ( 59 , 123) 320 69 ( 62 , 77) KY6 3 -2.97 3 1652 15 65 ( 37 , 108) 209 77 ( 67 , 88) KY7 4 -1.19 3 2867 34 88 ( 61 , 123) 414 88 ( 80 , 97) KY7 5 -0.15 4 1590 21 86 ( 53 , 132) 197 73 ( 63 , 84) KY7 6 -0.99 4 2729 31 83 ( 56 , 117) 370 83 ( 74 , 92) KY8 1 1.11 5 1515 24 104 ( 67 , 155) 199 78 ( 67 , 89) KY8 2 4.18 6 1841 32 112 ( 76 , 158) 282 90 ( 80 , 101) KY8 3 1.01 4 1669 43 165 (120 , 222) 293 103 ( 91 , 115) KY8 4 0.27 4 1825 27 95 ( 63 , 139) 254 82 ( 72 , 92) KY8 5 0.24 4 2675 34 89 ( 62 , 125) 425 95 ( 87 , 105) Fife North East Fife DD6 8 -4.16 2 1646 15 68 ( 38 , 112) 208 77 ( 67 , 88) DD6 9 -1.73 3 993 18 120 ( 71 , 189) 139 83 ( 69 , 98) KY102 -2.12 3 994 9 60 ( 27 , 113) 116 69 ( 57 , 83) KY103 -1.28 3 1482 16 72 ( 41 , 118) 175 70 ( 60 , 81) KY137 -1.17 4 55 0 0 ( 0 , 607) 5 58 ( 19 , 136) KY146 -1.31 3 810 5 42 ( 14 , 98) 97 72 ( 58 , 87) KY147 -1.73 3 1080 9 58 ( 26 , 109) 115 64 ( 53 , 77) KY154 -2.01 3 1734 29 117 ( 78 , 167) 186 64 ( 55 , 74) KY155 -3.59 2 2199 33 102 ( 70 , 143) 257 70 ( 61 , 79) KY160 -4.03 2 1041 9 64 ( 29 , 122) 94 55 ( 45 , 68) KY168 -1.84 3 2975 29 65 ( 43 , 93) 386 77 ( 69 , 85) KY169 -3.76 2 1155 8 45 ( 19 , 88) 143 73 ( 61 , 85)
Page 89
Page 86 - Carstairs Scores for Scottish Postcode Sectors from the 1991 Census
Public Health Research Unit, University of Glasgow
Appendix V (continued)
Health Board
Local government District
Post code
sector
Carstairs score DEPCAT
Pop. aged 40-64
Obs. deaths
SMRs ages 40-64
95% CI Obs.
discharges
SDRs 40-64
95% CI
1991 1991 1991 1991 1991-92 1991 KY7 7 -3.36 2 2097 24 82 ( 52 , 122) 257 74 ( 65 , 84) KY8 5 -3.23 2 164 1 42 ( 1 , 235) 20 73 ( 44 , 112) KY8 6 -4.04 2 776 12 100 ( 52 , 175) 80 60 ( 48 , 75) KY9 1 -2.91 3 668 6 56 ( 20 , 121) 68 59 ( 46 , 75) Forth Valley Clackmannan FK101 2.87 6 1287 19 104 ( 62 , 162) 270 126 (111 , 142) FK102 -0.11 4 3778 55 101 ( 76 , 132) 758 120 (112 , 129) FK103 -0.03 4 2585 35 93 ( 65 , 130) 427 99 ( 90 , 109) FK104 -0.55 4 1087 10 64 ( 31 , 118) 176 98 ( 84 , 113) FK117 -3.17 2 743 10 101 ( 48 , 185) 110 91 ( 75 , 109) FK125 -1.22 3 1572 25 117 ( 75 , 172) 257 100 ( 88 , 113) FK136 -1.18 4 1852 20 79 ( 48 , 122) 374 123 (111 , 137) FK147 -4.37 2 1290 13 74 ( 39 , 126) 155 73 ( 62 , 86) KY137 -7.23 1 18 0 0 ( 0 ,1995) 1 37 ( 1 , 205) Forth Valley Falkirk EH496 0.20 4 287 6 143 ( 52 , 311) 30 63 ( 42 , 89) EH497 -0.26 4 152 1 46 ( 1 , 255) 13 52 ( 27 , 88) EH510 -0.52 4 2183 15 52 ( 29 , 86) 328 93 ( 83 , 103) EH519 0.46 4 2276 32 94 ( 64 , 133) 340 89 ( 79 , 99) FK1 1 -0.87 4 914 18 111 ( 66 , 175) 185 114 ( 98 , 132) FK1 2 0.17 4 2137 18 63 ( 37 , 100) 316 91 ( 81 , 101) FK1 3 1.07 5 601 4 43 ( 12 , 111) 69 67 ( 52 , 85) FK1 4 1.93 5 2425 41 115 ( 82 , 155) 478 117 (107 , 128) FK1 5 -3.72 2 2533 30 79 ( 53 , 112) 313 73 ( 65 , 82)
Page 90
Page 87 - Carstairs Scores for Scottish Postcode Sectors from the 1991 Census
Public Health Research Unit, University of Glasgow
Appendix V (continued)
Health Board
Local government District
Post code
sector
Carstairs score DEPCAT
Pop. aged 40-64
Obs. deaths
SMRs ages 40-64
95% CI Obs.
discharges
SDRs 40-64
95% CI
1991 1991 1991 1991 1991-92 1991 FK2 0 -2.88 3 3688 41 84 ( 60 , 114) 539 90 ( 82 , 98) FK2 7 2.39 5 2315 42 117 ( 84 , 158) 425 108 ( 98 , 118) FK2 8 -0.58 4 1729 21 87 ( 54 , 132) 279 98 ( 87 , 110) FK2 9 0.82 4 3293 41 82 ( 59 , 111) 561 100 ( 92 , 109) FK3 0 2.63 5 1944 28 95 ( 63 , 138) 314 94 ( 84 , 106) FK3 8 2.01 5 2587 40 97 ( 69 , 132) 386 87 ( 78 , 96) FK3 9 0.24 4 1608 22 85 ( 53 , 129) 233 84 ( 74 , 96) FK4 1 -1.00 4 2430 28 80 ( 53 , 116) 408 101 ( 91 , 111) FK4 2 1.55 5 556 13 155 ( 83 , 265) 92 98 ( 79 , 120) FK5 3 -1.44 3 1458 20 96 ( 58 , 148) 217 89 ( 78 , 102) FK5 4 -2.55 3 3566 63 125 ( 96 , 159) 544 92 ( 84 , 100) FK6 5 -1.55 3 2339 28 90 ( 60 , 130) 367 96 ( 87 , 107) FK6 6 0.64 4 1555 24 104 ( 67 , 154) 295 113 (100 , 126) FK7 7 -3.09 2 22 0 0 ( 0 ,1408) 3 87 ( 18 , 255) Forth Valley Stirling FK150 -3.70 2 1084 9 65 ( 30 , 123) 140 80 ( 67 , 94) FK159 -4.25 2 1537 24 118 ( 75 , 175) 248 99 ( 87 , 112) FK166 -3.03 2 601 5 57 ( 18 , 133) 85 85 ( 68 , 105) FK178 -3.84 2 1073 9 60 ( 27 , 114) 185 104 ( 89 , 120) FK188 -0.64 4 66 0 0 ( 0 , 428) 7 65 ( 26 , 134) FK198 -0.95 4 156 1 41 ( 1 , 229) 29 108 ( 73 , 156) FK2 8 -7.06 1 28 0 0 ( 0 ,1017) 0 0 ( 0 , 80) FK208 -1.64 3 91 1 85 ( 2 , 472) 15 102 ( 57 , 168) FK218 -1.38 3 246 2 53 ( 6 , 191) 46 111 ( 81 , 148)
Page 91
Page 88 - Carstairs Scores for Scottish Postcode Sectors from the 1991 Census
Public Health Research Unit, University of Glasgow
Appendix V (continued)
Health Board
Local government District
Post code
sector
Carstairs score DEPCAT
Pop. aged 40-64
Obs. deaths
SMRs ages 40-64
95% CI Obs.
discharges
SDRs 40-64
95% CI
1991 1991 1991 1991 1991-92 1991 FK6 5 -6.60 1 27 0 0 ( 0 ,1387) 6 148 ( 54 , 322) FK6 6 -6.18 1 78 0 0 ( 0 , 458) 0 0 ( 0 , 31) FK7 0 0.32 4 2198 32 91 ( 62 , 129) 473 125 (114 , 137) FK7 7 0.57 4 2578 48 132 ( 97 , 175) 540 126 (116 , 137) FK7 8 -0.20 4 1367 25 120 ( 78 , 177) 306 132 (118 , 148) FK7 9 -1.92 3 2159 40 127 ( 91 , 173) 407 112 (101 , 124) FK8 1 3.90 6 1805 60 231 (176 , 297) 413 138 (125 , 152) FK8 2 -5.55 1 1174 10 58 ( 28 , 107) 163 83 ( 70 , 96) FK8 3 -3.75 2 1823 22 86 ( 54 , 130) 254 84 ( 74 , 95) FK9 4 -4.48 2 1774 19 79 ( 47 , 123) 277 95 ( 84 , 107) FK9 5 -1.71 3 1543 17 78 ( 45 , 125) 270 105 ( 93 , 119) G62 8 -7.50 1 50 1 152 ( 4 , 849) 7 85 ( 34 , 176) G63 0 -4.15 2 1513 12 53 ( 28 , 93) 208 81 ( 71 , 93) G63 9 -5.69 1 1575 18 85 ( 51 , 135) 191 74 ( 64 , 85) G83 8 -7.54 1 20 1 386 ( 10 ,2151) 2 61 ( 7 , 220) Grampian Aberdeen City AB1 0 -4.37 2 2342 20 61 ( 37 , 95) 306 79 ( 71 , 89) AB1 1 -0.23 4 1306 18 86 ( 51 , 136) 263 117 (104 , 133) AB1 2 -2.73 3 1359 15 82 ( 46 , 136) 226 103 ( 90 , 117) AB1 3 2.69 5 2554 46 117 ( 86 , 157) 478 110 (100 , 120) AB1 4 -1.81 3 1868 27 116 ( 76 , 169) 341 114 (102 , 127) AB1 5 -0.35 4 3106 47 91 ( 67 , 121) 594 109 (100 , 118) AB1 6 -4.32 2 3283 35 77 ( 53 , 107) 524 97 ( 89 , 106) AB1 7 -3.45 2 4096 48 73 ( 54 , 96) 652 92 ( 85 , 100)
Page 92
Page 89 - Carstairs Scores for Scottish Postcode Sectors from the 1991 Census
Public Health Research Unit, University of Glasgow
Appendix V (continued)
Health Board
Local government District
Post code
sector
Carstairs score DEPCAT
Pop. aged 40-64
Obs. deaths
SMRs ages 40-64
95% CI Obs.
discharges
SDRs 40-64
95% CI
1991 1991 1991 1991 1991-92 1991 AB1 8 -5.25 1 2008 20 64 ( 39 , 100) 248 72 ( 64 , 82) AB1 9 -6.45 1 2305 14 47 ( 26 , 79) 263 71 ( 62 , 80) AB2 0 -3.00 2 2392 28 97 ( 65 , 141) 324 85 ( 76 , 95) AB2 1 2.33 5 2582 63 140 (107 , 179) 595 131 (121 , 142) AB2 2 2.56 5 3588 56 102 ( 77 , 133) 706 116 (107 , 125) AB2 3 0.13 4 2306 44 129 ( 94 , 173) 442 115 (105 , 126) AB2 4 -4.28 2 3086 22 52 ( 33 , 79) 409 81 ( 73 , 89) AB2 5 0.77 4 4544 58 80 ( 60 , 103) 822 105 ( 98 , 112) AB2 6 -0.11 4 4620 65 86 ( 66 , 109) 822 103 ( 96 , 110) AB2 7 3.18 6 3243 54 118 ( 89 , 154) 688 128 (118 , 138) AB2 9 -1.89 3 2779 39 94 ( 66 , 128) 381 81 ( 73 , 90) AB228 -4.69 1 3842 32 74 ( 51 , 104) 316 53 ( 47 , 59) AB238 -4.28 2 1902 13 52 ( 28 , 89) 130 42 ( 35 , 50) Grampian Banff & Buchan AB410 -7.49 1 36 0 0 ( 0 , 846) 8 142 ( 61 , 281) AB418 -4.20 2 246 1 31 ( 1 , 173) 17 43 ( 25 , 68) AB426 0.72 4 5093 59 80 ( 61 , 103) 553 65 ( 60 , 71) AB427 -2.63 3 2334 19 62 ( 37 , 97) 244 65 ( 57 , 73) AB428 -3.08 2 1842 9 36 ( 16 , 68) 173 57 ( 49 , 66) AB434 -1.36 3 2476 33 96 ( 66 , 134) 222 54 ( 47 , 62) AB435 0.82 4 4395 52 82 ( 61 , 108) 503 69 ( 63 , 75) AB441 1.18 5 1122 13 76 ( 41 , 131) 166 87 ( 74 , 101) AB451 -0.93 4 1254 14 74 ( 40 , 124) 186 88 ( 76 , 101) AB452 -0.46 4 1604 22 92 ( 57 , 139) 164 61 ( 52 , 71)
Page 93
Page 90 - Carstairs Scores for Scottish Postcode Sectors from the 1991 Census
Public Health Research Unit, University of Glasgow
Appendix V (continued)
Health Board
Local government District
Post code
sector
Carstairs score DEPCAT
Pop. aged 40-64
Obs. deaths
SMRs ages 40-64
95% CI Obs.
discharges
SDRs 40-64
95% CI
1991 1991 1991 1991 1991-92 1991 AB453 -1.54 3 772 3 27 ( 6 , 79) 90 70 ( 56 , 86) AB510 -2.58 3 18 0 0 ( 0 ,1800) 7 254 (102 , 524) AB518 -3.24 2 415 3 53 ( 11 , 154) 29 43 ( 29 , 61) AB536 -3.82 2 352 1 20 ( 0 , 109) 43 73 ( 53 , 99) AB537 -2.59 3 2094 29 94 ( 63 , 134) 237 67 ( 59 , 76) AB538 -2.99 3 724 5 52 ( 17 , 121) 67 57 ( 44 , 72) AB545 -1.30 3 469 5 72 ( 23 , 168) 63 80 ( 61 , 102) AB546 -7.12 1 32 0 0 ( 0 , 650) 4 71 ( 19 , 181) Grampian Gordon AB1 8 -6.91 1 22 0 0 ( 0 ,1309) 2 56 ( 7 , 201) AB2 0 -4.70 1 1406 17 97 ( 57 , 156) 119 53 ( 44 , 63) AB238 -4.83 1 1009 12 98 ( 51 , 172) 62 39 ( 30 , 50) AB314 -5.30 1 75 0 0 ( 0 , 417) 0 0 ( 0 , 31) AB326 -5.73 1 2527 26 90 ( 59 , 132) 197 50 ( 43 , 58) AB327 -2.87 3 225 2 58 ( 7 , 208) 21 55 ( 34 , 84) AB338 -4.87 1 1091 9 58 ( 27 , 110) 97 54 ( 44 , 66) AB368 -4.17 2 153 2 86 ( 10 , 311) 17 66 ( 39 , 106) AB410 -4.83 1 2003 20 80 ( 49 , 124) 189 59 ( 51 , 68) AB418 -3.12 2 543 5 66 ( 21 , 154) 46 52 ( 38 , 69) AB419 -3.81 2 2229 19 70 ( 42 , 109) 214 61 ( 53 , 69) AB510 -4.10 2 2047 10 36 ( 17 , 66) 165 49 ( 42 , 57) AB517 -5.41 1 571 3 39 ( 8 , 113) 48 52 ( 38 , 69) AB518 -6.62 1 59 0 0 ( 0 , 581) 11 121 ( 60 , 217) AB519 -3.03 2 4321 32 55 ( 38 , 78) 443 63 ( 57 , 69)
Page 94
Page 91 - Carstairs Scores for Scottish Postcode Sectors from the 1991 Census
Public Health Research Unit, University of Glasgow
Appendix V (continued)
Health Board
Local government District
Post code
sector
Carstairs score DEPCAT
Pop. aged 40-64
Obs. deaths
SMRs ages 40-64
95% CI Obs.
discharges
SDRs 40-64
95% CI
1991 1991 1991 1991 1991-92 1991 AB526 -3.97 2 1022 5 36 ( 12 , 85) 86 52 ( 41 , 64) AB544 -0.98 4 866 14 112 ( 61 , 187) 86 59 ( 48 , 73) AB545 -1.45 3 1363 24 111 ( 71 , 165) 154 66 ( 56 , 77) AB546 -3.88 2 274 1 26 ( 1 , 145) 18 40 ( 24 , 63) AB553 -5.20 1 53 0 0 ( 0 , 577) 5 59 ( 19 , 138)
Grampian Kincardine & Deeside
AB1 0 -2.84 3 130 0 0 ( 0 , 213) 14 65 ( 36 , 110)
AB1 4 -4.10 2 1607 16 86 ( 49 , 140) 295 118 (105 , 132) AB1 5 -5.70 1 202 2 75 ( 9 , 269) 30 92 ( 62 , 131) AB3 2 -4.03 2 4324 42 75 ( 54 , 102) 611 88 ( 81 , 95) AB301 -2.86 3 1569 15 65 ( 37 , 108) 129 49 ( 41 , 59) AB313 -4.77 1 2960 32 80 ( 55 , 113) 256 53 ( 47 , 60) AB314 -3.88 2 1091 7 45 ( 18 , 93) 103 57 ( 47 , 69) AB338 -6.36 1 24 0 0 ( 0 ,1125) 2 52 ( 6 , 187) AB344 -2.12 3 321 5 101 ( 33 , 235) 26 47 ( 31 , 69) AB345 -3.60 2 1076 6 39 ( 14 , 85) 93 52 ( 42 , 64) AB355 -2.04 3 784 7 56 ( 23 , 116) 62 46 ( 36 , 59) DD100 -2.36 3 1408 13 66 ( 35 , 114) 204 88 ( 77 , 101) DD9 7 -5.98 1 103 1 82 ( 2 , 458) 20 123 ( 75 , 190) Grampian Moray AB379 -2.09 3 431 6 95 ( 35 , 207) 48 67 ( 49 , 88) AB387 -1.19 3 681 3 28 ( 6 , 83) 85 73 ( 59 , 91) AB389 -0.94 4 641 4 42 ( 12 , 108) 71 66 ( 51 , 83) AB544 -0.65 4 25 1 253 ( 6 ,1410) 1 23 ( 1 , 128)
Page 95
Page 92 - Carstairs Scores for Scottish Postcode Sectors from the 1991 Census
Public Health Research Unit, University of Glasgow
Appendix V (continued)
Health Board
Local government District
Post code
sector
Carstairs score DEPCAT
Pop. aged 40-64
Obs. deaths
SMRs ages 40-64
95% CI Obs.
discharges
SDRs 40-64
95% CI
1991 1991 1991 1991 1991-92 1991 AB545 -3.29 2 183 2 73 ( 9 , 263) 23 75 ( 47 , 112) AB553 -0.90 4 2119 35 111 ( 78 , 155) 271 76 ( 67 , 86) AB554 -1.19 3 689 10 95 ( 45 , 175) 67 57 ( 44 , 73) AB561 1.76 5 2368 30 81 ( 55 , 115) 284 70 ( 62 , 79) AB562 -0.54 4 1917 25 84 ( 54 , 124) 195 60 ( 52 , 69) IV301 -2.83 3 1437 14 60 ( 33 , 101) 190 77 ( 66 , 88) IV302 -1.50 3 3227 44 91 ( 66 , 123) 510 94 ( 86 , 102) IV303 -2.00 3 3604 47 94 ( 69 , 125) 476 80 ( 73 , 88) IV316 -1.43 3 1766 12 48 ( 25 , 84) 288 98 ( 87 , 110) IV327 -2.36 3 1400 16 79 ( 45 , 129) 180 77 ( 67 , 90) IV360 -3.00 2 3840 50 94 ( 70 , 124) 547 86 ( 79 , 94) Greater Glasgow
Bearsden & Milngavie
G61 1 -4.15 2 2104 27 88 ( 58 , 128) 278 79 ( 70 , 89)
G61 2 -6.14 1 2433 20 59 ( 36 , 90) 276 68 ( 61 , 77) G61 3 -5.85 1 2337 20 61 ( 37 , 94) 269 69 ( 61 , 78) G61 4 -4.86 1 2698 25 72 ( 47 , 106) 349 80 ( 72 , 89) G62 6 -5.55 1 1285 10 51 ( 25 , 95) 208 96 ( 83 , 110) G62 7 -2.24 3 2064 16 54 ( 31 , 87) 388 112 (101 , 124) G62 8 -5.50 1 906 12 87 ( 45 , 151) 133 87 ( 72 , 103) Greater Glasgow
Clydebank G60 5 -1.01 4 868 9 71 ( 32 , 135) 141 97 ( 82 , 115)
G81 1 3.18 6 1776 44 155 (112 , 208) 339 111 (100 , 124) G81 2 3.52 6 2383 35 100 ( 69 , 138) 464 115 (105 , 126)
Page 96
Page 93 - Carstairs Scores for Scottish Postcode Sectors from the 1991 Census
Public Health Research Unit, University of Glasgow
Appendix V (continued)
Health Board
Local government District
Post code
sector
Carstairs score DEPCAT
Pop. aged 40-64
Obs. deaths
SMRs ages 40-64
95% CI Obs.
discharges
SDRs 40-64
95% CI
1991 1991 1991 1991 1991-92 1991 G81 3 1.30 5 2460 46 113 ( 83 , 151) 442 103 ( 94 , 113) G81 4 3.93 6 2060 46 133 ( 97 , 177) 384 107 ( 96 , 118) G81 5 4.20 6 1513 30 130 ( 88 , 186) 294 115 (102 , 129) G81 6 -1.73 3 2243 39 132 ( 94 , 180) 348 95 ( 86 , 106) Greater Glasgow
Eastwood G44 3 -6.01 1 1546 11 48 ( 24 , 86) 148 57 ( 48 , 67)
G46 6 -5.37 1 3037 19 47 ( 28 , 73) 355 71 ( 64 , 79) G46 7 -3.54 2 2080 22 72 ( 45 , 108) 270 77 ( 68 , 87) G46 8 -0.13 4 132 2 95 ( 12 , 344) 16 70 ( 40 , 113) G76 0 -4.19 2 1500 18 84 ( 50 , 132) 167 67 ( 57 , 78) G76 7 -5.82 1 2715 18 48 ( 28 , 75) 308 69 ( 61 , 77) G76 8 -2.71 3 1578 16 72 ( 41 , 116) 198 75 ( 65 , 87) G77 5 -6.25 1 3279 21 45 ( 28 , 68) 291 53 ( 47 , 60) G77 6 -5.04 1 2760 27 76 ( 50 , 111) 278 62 ( 55 , 70) Greater Glasgow
Glasgow City G1 1 -2.34 3 240 2 60 ( 7 , 218) 24 62 ( 40 , 92)
G1 2 7.95 7 112 3 131 ( 27 , 382) 41 198 (142 , 269) G1 4 -2.28 3 23 0 0 ( 0 ,1146) 10 273 (131 , 502) G1 5 8.25 7 312 7 121 ( 49 , 250) 98 177 (144 , 216) G11 5 0.75 4 1495 23 108 ( 68 , 162) 306 124 (110 , 138) G11 6 4.66 6 622 15 155 ( 86 , 255) 120 114 ( 94 , 136) G11 7 -0.84 4 2242 34 98 ( 68 , 137) 352 92 ( 83 , 103) G12 0 -4.16 2 2383 28 83 ( 55 , 120) 303 77 ( 69 , 86)
Page 97
Page 94 - Carstairs Scores for Scottish Postcode Sectors from the 1991 Census
Public Health Research Unit, University of Glasgow
Appendix V (continued)
Health Board
Local government District
Post code
sector
Carstairs score DEPCAT
Pop. aged 40-64
Obs. deaths
SMRs ages 40-64
95% CI Obs.
discharges
SDRs 40-64
95% CI
1991 1991 1991 1991 1991-92 1991 G12 8 2.94 6 939 12 94 ( 49 , 165) 162 106 ( 90 , 124) G12 9 -3.42 2 1815 26 109 ( 71 , 159) 253 87 ( 76 , 98) G13 1 -0.81 4 1961 27 93 ( 61 , 135) 332 101 ( 90 , 112) G13 2 4.62 6 2466 59 133 (102 , 172) 518 118 (108 , 128) G13 3 2.73 5 3220 71 122 ( 95 , 154) 754 131 (122 , 140) G13 4 4.26 6 1912 41 129 ( 93 , 175) 436 130 (119 , 143) G14 0 6.41 7 1827 54 184 (138 , 240) 414 132 (119 , 145) G14 9 0.14 4 2739 53 127 ( 95 , 166) 468 101 ( 92 , 111) G15 6 2.15 5 1822 37 125 ( 88 , 172) 371 118 (106 , 131) G15 7 10.64 7 2094 44 151 (110 , 203) 564 162 (149 , 176) G15 8 8.99 7 1365 38 205 (145 , 282) 307 136 (121 , 152) G2 3 3.14 6 34 1 182 ( 5 ,1015) 10 176 ( 84 , 324) G2 4 2.85 6 20 1 281 ( 7 ,1565) 3 85 ( 18 , 248) G2 6 11.55 7 48 0 0 ( 0 , 614) 1 13 ( 0 , 71) G2 7 9.22 7 155 8 275 (119 , 542) 57 209 (158 , 271) G2 8 -2.06 3 19 1 368 ( 9 ,2048) 10 314 (150 , 578) G20 0 5.19 6 2081 45 138 (101 , 185) 430 120 (109 , 132) G20 6 -0.39 4 1319 28 148 ( 98 , 214) 248 113 (100 , 128) G20 7 8.36 7 1000 30 189 (127 , 270) 263 153 (135 , 173) G20 8 5.77 6 2258 60 152 (116 , 196) 530 133 (122 , 145) G20 9 9.73 7 1210 36 195 (137 , 270) 327 159 (142 , 177) G21 1 6.71 7 2018 53 159 (119 , 208) 576 164 (150 , 177) G21 2 12.10 7 1783 46 157 (115 , 210) 500 162 (148 , 177) G21 3 6.70 7 3559 73 124 ( 97 , 156) 861 138 (129 , 147)
Page 98
Page 95 - Carstairs Scores for Scottish Postcode Sectors from the 1991 Census
Public Health Research Unit, University of Glasgow
Appendix V (continued)
Health Board
Local government District
Post code
sector
Carstairs score DEPCAT
Pop. aged 40-64
Obs. deaths
SMRs ages 40-64
95% CI Obs.
discharges
SDRs 40-64
95% CI
1991 1991 1991 1991 1991-92 1991 G21 4 8.89 7 2264 56 155 (117 , 201) 543 139 (128 , 151) G22 5 12.87 7 2079 73 228 (179 , 287) 637 180 (166 , 194) G22 6 7.34 7 2439 82 194 (155 , 241) 660 153 (142 , 165) G22 7 7.79 7 2747 68 159 (124 , 202) 658 139 (129 , 150) G23 5 3.00 6 2130 30 101 ( 68 , 144) 493 140 (128 , 152) G3 6 5.73 6 823 10 76 ( 36 , 139) 191 136 (118 , 157) G3 7 3.50 6 443 11 167 ( 83 , 299) 98 132 (107 , 161) G3 8 3.99 6 1370 37 166 (117 , 228) 366 155 (140 , 172) G31 1 7.54 7 1302 35 167 (117 , 233) 284 127 (112 , 142) G31 2 3.79 6 1866 28 101 ( 67 , 147) 366 117 (105 , 129) G31 3 8.08 7 1828 35 126 ( 88 , 175) 360 116 (104 , 128) G31 4 10.79 7 1553 55 216 (162 , 281) 321 119 (106 , 133) G31 5 9.14 7 716 22 189 (118 , 286) 166 134 (115 , 156) G32 0 0.78 4 2136 36 114 ( 80 , 157) 385 107 ( 96 , 118) G32 6 6.50 7 2720 69 151 (117 , 191) 536 112 (103 , 122) G32 7 6.11 6 2003 52 158 (118 , 207) 472 136 (124 , 149) G32 8 3.69 6 2342 56 151 (114 , 196) 444 110 (100 , 121) G32 9 -0.47 4 2281 31 81 ( 55 , 115) 441 111 (100 , 121) G33 1 5.26 6 1698 33 134 ( 92 , 188) 381 134 (121 , 148) G33 2 3.65 6 1970 47 132 ( 97 , 175) 376 107 ( 96 , 118) G33 3 7.99 7 2576 62 158 (121 , 202) 594 135 (124 , 146) G33 4 11.21 7 2106 43 145 (105 , 196) 443 126 (115 , 139) G33 5 8.54 7 1849 53 201 (151 , 263) 410 133 (120 , 146) G33 6 -0.31 4 126 0 0 ( 0 , 247) 29 147 ( 99 , 211)
Page 99
Page 96 - Carstairs Scores for Scottish Postcode Sectors from the 1991 Census
Public Health Research Unit, University of Glasgow
Appendix V (continued)
Health Board
Local government District
Post code
sector
Carstairs score DEPCAT
Pop. aged 40-64
Obs. deaths
SMRs ages 40-64
95% CI Obs.
discharges
SDRs 40-64
95% CI
1991 1991 1991 1991 1991-92 1991 G34 0 9.79 7 1688 35 132 ( 92 , 184) 376 130 (117 , 144) G34 9 11.63 7 1604 36 146 (102 , 202) 363 133 (120 , 148) G4 0 6.22 7 1734 51 153 (114 , 202) 435 139 (126 , 152) G4 9 4.56 6 906 18 126 ( 74 , 199) 198 128 (111 , 147) G40 1 4.36 6 589 22 238 (149 , 360) 169 168 (143 , 195) G40 2 7.53 7 883 30 196 (132 , 280) 240 155 (136 , 176) G40 3 10.77 7 1141 31 167 (113 , 237) 275 138 (122 , 156) G40 4 8.96 7 1149 37 198 (139 , 273) 298 151 (134 , 169) G41 1 8.08 7 296 4 84 ( 23 , 215) 65 127 ( 98 , 162) G41 2 5.22 6 1610 35 157 (109 , 218) 235 89 ( 78 , 101) G41 3 -1.00 4 2574 49 127 ( 94 , 168) 354 82 ( 73 , 91) G41 4 -4.65 2 1496 18 85 ( 50 , 134) 235 95 ( 83 , 108) G41 5 -0.82 4 1770 29 105 ( 70 , 151) 293 97 ( 86 , 108) G42 0 6.64 7 2057 53 148 (111 , 193) 428 117 (107 , 129) G42 7 6.02 6 1166 24 135 ( 86 , 200) 236 119 (105 , 136) G42 8 4.67 6 2221 37 107 ( 75 , 147) 407 108 ( 97 , 119) G42 9 1.94 5 1733 27 103 ( 68 , 150) 316 108 ( 97 , 121) G43 1 3.05 6 2312 55 141 (106 , 183) 402 99 ( 90 , 109) G43 2 -2.68 3 3304 42 83 ( 60 , 112) 467 83 ( 76 , 91) G44 3 -3.77 2 1071 12 75 ( 39 , 132) 123 68 ( 57 , 82) G44 4 -0.28 4 2453 41 116 ( 83 , 158) 439 108 ( 98 , 118) G44 5 -0.45 4 2853 25 66 ( 43 , 98) 345 74 ( 67 , 82) G45 0 12.32 7 1520 44 208 (151 , 280) 351 139 (125 , 155) G45 9 10.45 7 3143 71 146 (114 , 185) 657 122 (113 , 132)
Page 100
Page 97 - Carstairs Scores for Scottish Postcode Sectors from the 1991 Census
Public Health Research Unit, University of Glasgow
Appendix V (continued)
Health Board
Local government District
Post code
sector
Carstairs score DEPCAT
Pop. aged 40-64
Obs. deaths
SMRs ages 40-64
95% CI Obs.
discharges
SDRs 40-64
95% CI
1991 1991 1991 1991 1991-92 1991 G46 7 -0.51 4 17 0 0 ( 0 ,1494) 4 141 ( 38 , 360) G46 8 5.71 6 2463 54 147 (110 , 192) 505 121 (111 , 132) G5 0 9.00 7 2223 70 186 (145 , 235) 494 127 (116 , 139) G5 8 -2.90 3 95 8 488 (210 , 962) 39 240 (171 , 328) G5 9 9.40 7 923 30 195 (131 , 278) 212 132 (115 , 151) G51 1 5.55 6 1211 36 192 (134 , 266) 308 150 (134 , 167) G51 2 9.44 7 2255 55 152 (114 , 197) 539 139 (128 , 151) G51 3 7.55 7 1302 41 213 (153 , 290) 318 146 (131 , 163) G51 4 6.78 7 2399 47 121 ( 89 , 161) 517 125 (114 , 136) G52 1 3.09 6 2490 61 134 (103 , 173) 523 117 (107 , 128) G52 2 2.00 5 3111 59 115 ( 88 , 149) 566 105 ( 96 , 114) G52 3 0.43 4 2462 43 108 ( 78 , 145) 415 98 ( 89 , 108) G52 4 7.59 7 1386 43 179 (129 , 241) 312 127 (113 , 142) G53 5 7.62 7 3325 66 123 ( 95 , 156) 690 119 (111 , 129) G53 6 8.20 7 2553 61 154 (118 , 198) 552 126 (116 , 137) G53 7 3.90 6 2378 53 146 (109 , 190) 459 114 (104 , 125) G61 1 -4.22 2 56 1 111 ( 3 , 618) 10 104 ( 50 , 191) G64 1 -1.14 4 111 2 135 ( 16 , 487) 13 72 ( 38 , 123) G69 6 -2.41 3 2131 27 89 ( 59 , 129) 262 74 ( 65 , 83) G69 7 1.11 5 2630 38 100 ( 71 , 137) 435 99 ( 90 , 109) G69 8 2.87 6 135 9 353 (161 , 671) 19 79 ( 47 , 123) G71 7 3.88 6 126 4 189 ( 52 , 485) 27 123 ( 81 , 178) G72 7 3.16 6 2414 38 106 ( 75 , 145) 428 105 ( 95 , 115) G72 8 0.99 4 3455 54 117 ( 88 , 152) 528 94 ( 86 , 102)
Page 101
Page 98 - Carstairs Scores for Scottish Postcode Sectors from the 1991 Census
Public Health Research Unit, University of Glasgow
Appendix V (continued)
Health Board
Local government District
Post code
sector
Carstairs score DEPCAT
Pop. aged 40-64
Obs. deaths
SMRs ages 40-64
95% CI Obs.
discharges
SDRs 40-64
95% CI
1991 1991 1991 1991 1991-92 1991 G73 1 5.93 6 1085 33 194 (134 , 273) 202 109 ( 94 , 125) G73 2 0.45 4 2232 34 104 ( 72 , 145) 348 93 ( 83 , 103) G73 3 -1.74 3 2685 38 91 ( 64 , 124) 338 74 ( 66 , 82) G73 4 1.47 5 2935 59 126 ( 96 , 163) 429 85 ( 77 , 93) G73 5 1.27 5 1944 36 120 ( 84 , 166) 375 113 (102 , 125) G76 9 -4.87 1 380 2 34 ( 4 , 121) 34 52 ( 36 , 73) Greater Glasgow
Strathkelvin G33 6 -1.68 3 1439 16 81 ( 46 , 132) 233 98 ( 86 , 112)
G62 6 -6.15 1 104 0 0 ( 0 , 288) 15 90 ( 50 , 149) G64 1 -2.22 3 3661 38 77 ( 54 , 106) 544 90 ( 83 , 98) G64 2 -3.59 2 1880 21 73 ( 45 , 111) 253 79 ( 70 , 89) G64 3 -4.97 1 2276 18 50 ( 29 , 79) 282 72 ( 64 , 81) G64 4 -4.48 2 844 10 95 ( 45 , 174) 135 100 ( 84 , 119) G65 7 -0.20 4 1460 31 148 (101 , 210) 242 100 ( 88 , 114) G65 8 -3.83 2 1169 11 78 ( 39 , 139) 203 109 ( 94 , 125) G65 9 6.58 7 421 10 158 ( 76 , 291) 102 145 (118 , 176) G66 1 -4.17 2 1135 12 70 ( 36 , 122) 176 91 ( 78 , 106) G66 2 2.04 5 2556 53 140 (105 , 183) 678 157 (145 , 169) G66 3 -3.03 2 2464 43 127 ( 92 , 171) 409 100 ( 91 , 111) G66 4 -3.51 2 2240 19 61 ( 37 , 95) 354 95 ( 86 , 106) G66 5 -5.63 1 1527 9 48 ( 22 , 92) 225 92 ( 81 , 105) G67 4 -0.35 4 39 1 161 ( 4 , 898) 1 15 ( 0 , 85) G69 0 1.31 5 1771 29 118 ( 79 , 170) 324 111 ( 99 , 123) G69 8 1.79 5 468 8 119 ( 51 , 234) 78 100 ( 79 , 125)
Page 102
Page 99 - Carstairs Scores for Scottish Postcode Sectors from the 1991 Census
Public Health Research Unit, University of Glasgow
Appendix V (continued)
Health Board
Local government District
Post code
sector
Carstairs score DEPCAT
Pop. aged 40-64
Obs. deaths
SMRs ages 40-64
95% CI Obs.
discharges
SDRs 40-64
95% CI
1991 1991 1991 1991 1991-92 1991 G69 9 -1.56 3 1075 12 82 ( 42 , 143) 181 102 ( 88 , 118) Highlands Caithness KW1 4 -0.16 4 1686 33 132 ( 91 , 186) 277 98 ( 87 , 110) KW1 5 0.42 4 1719 23 89 ( 56 , 134) 298 103 ( 92 , 115) KW126 -3.16 2 461 5 77 ( 25 , 180) 68 89 ( 69 , 113) KW147 -2.32 3 2004 23 77 ( 49 , 116) 293 87 ( 77 , 97) KW148 -0.66 4 1743 24 91 ( 58 , 135) 253 86 ( 75 , 97) KW2 6 -3.37 2 26 0 0 ( 0 , 735) 8 171 ( 74 , 338) KW3 6 -0.32 4 286 1 24 ( 1 , 131) 54 112 ( 84 , 146) KW5 6 1.98 5 96 2 111 ( 13 , 400) 7 41 ( 16 , 83) KW6 6 0.18 4 127 3 151 ( 31 , 442) 26 120 ( 78 , 175) KW7 6 -1.76 3 39 0 0 ( 0 , 537) 3 43 ( 9 , 125) Highlands Inverness IV1 1 1.31 5 157 5 215 ( 70 , 502) 45 173 (126 , 231) IV1 2 -2.30 3 3821 43 85 ( 61 , 114) 527 85 ( 78 , 92) IV137 -0.43 4 153 3 122 ( 25 , 356) 16 61 ( 35 , 99) IV2 3 -3.24 2 2926 26 66 ( 43 , 96) 444 92 ( 84 , 101) IV2 4 -2.49 3 3519 34 66 ( 45 , 92) 482 81 ( 74 , 89) IV3 5 0.83 4 2201 42 116 ( 83 , 156) 440 115 (105 , 126) IV3 6 0.07 4 3758 52 98 ( 73 , 129) 652 105 ( 97 , 113) IV4 7 -2.54 3 1040 12 76 ( 39 , 133) 133 76 ( 63 , 90) IV5 7 -4.77 1 254 5 130 ( 42 , 304) 33 77 ( 53 , 108) PH324 -3.25 2 157 2 82 ( 10 , 297) 28 105 ( 70 , 152) PH354 2.02 5 56 1 99 ( 3 , 553) 0 0 ( 0 , 37)
Page 103
Page 100 - Carstairs Scores for Scottish Postcode Sectors from the 1991 Census
Public Health Research Unit, University of Glasgow
Appendix V (continued)
Health Board
Local government District
Post code
sector
Carstairs score DEPCAT
Pop. aged 40-64
Obs. deaths
SMRs ages 40-64
95% CI Obs.
discharges
SDRs 40-64
95% CI
1991 1991 1991 1991 1991-92 1991 Highlands Lochaber PA345 1.10 5 110 3 182 ( 38 , 532) 38 203 (144 , 279) PA384 -1.40 3 77 0 0 ( 0 , 309) 7 53 ( 21 , 109) PA394 1.32 5 287 3 66 ( 14 , 193) 36 73 ( 51 , 102) PA404 0.62 4 308 3 62 ( 13 , 182) 48 91 ( 67 , 121) PH314 -4.21 2 152 1 48 ( 1 , 270) 12 48 ( 25 , 84) PH336 -0.01 4 2022 34 116 ( 80 , 162) 316 94 ( 84 , 105) PH337 0.26 4 1592 26 113 ( 74 , 166) 299 112 (100 , 126) PH344 -1.83 3 276 2 53 ( 6 , 191) 42 93 ( 67 , 126) PH354 -2.25 3 84 1 74 ( 2 , 412) 18 123 ( 73 , 194) PH364 2.71 5 363 3 53 ( 11 , 154) 47 76 ( 56 , 102) PH374 -1.69 3 41 0 0 ( 0 , 555) 2 28 ( 3 , 102) PH384 8.60 7 64 0 0 ( 0 , 423) 4 38 ( 10 , 98) PH394 4.46 6 121 1 52 ( 1 , 288) 22 105 ( 66 , 159) PH404 0.88 4 62 1 102 ( 3 , 565) 8 73 ( 32 , 144) PH414 0.71 4 272 4 104 ( 28 , 266) 39 87 ( 62 , 118) PH424 7.83 7 32 0 0 ( 0 , 802) 8 156 ( 67 , 306)
Highlands Badenoch & Strathspey
PH191 3.86 6 53 1 122 ( 3 , 680) 7 78 ( 31 , 161)
PH201 -3.58 2 444 8 120 ( 52 , 236) 64 85 ( 66 , 109) PH211 -1.81 3 593 5 58 ( 19 , 135) 68 69 ( 53 , 87) PH221 -0.48 4 673 5 54 ( 17 , 126) 94 85 ( 69 , 104) PH233 -1.21 3 229 2 68 ( 8 , 244) 24 65 ( 41 , 96) PH243 -0.27 4 172 1 39 ( 1 , 216) 28 96 ( 64 , 139) PH253 -2.82 3 217 2 57 ( 7 , 206) 40 107 ( 76 , 146)
Page 104
Page 101 - Carstairs Scores for Scottish Postcode Sectors from the 1991 Census
Public Health Research Unit, University of Glasgow
Appendix V (continued)
Health Board
Local government District
Post code
sector
Carstairs score DEPCAT
Pop. aged 40-64
Obs. deaths
SMRs ages 40-64
95% CI Obs.
discharges
SDRs 40-64
95% CI
1991 1991 1991 1991 1991-92 1991 PH263 -2.16 3 1061 9 59 ( 27 , 111) 142 80 ( 67 , 94) Highlands Nairn IV1 2 -4.40 2 58 0 0 ( 0 , 424) 3 31 ( 6 , 91) IV124 -2.54 3 1406 14 71 ( 39 , 119) 169 73 ( 62 , 84) IV125 -1.28 3 1714 19 72 ( 43 , 112) 193 66 ( 57 , 76) Highlands Ross & Cromarty IV1 1 -4.16 2 469 3 47 ( 10 , 137) 91 117 ( 95 , 144) IV108 -4.10 2 602 2 22 ( 3 , 80) 51 50 ( 38 , 66) IV118 1.73 5 238 1 31 ( 1 , 175) 48 123 ( 91 , 164) IV149 -3.05 2 577 6 69 ( 25 , 150) 83 85 ( 68 , 106) IV159 -1.62 3 1593 30 131 ( 89 , 187) 266 100 ( 89 , 113) IV169 -2.51 3 458 3 54 ( 11 , 158) 50 69 ( 51 , 91) IV170 1.81 5 1721 36 164 (115 , 228) 324 117 (104 , 130) IV180 -0.81 4 1730 21 88 ( 54 , 135) 272 95 ( 84 , 107) IV191 -1.78 3 1420 18 87 ( 52 , 138) 239 101 ( 89 , 115) IV201 0.31 4 890 18 142 ( 84 , 224) 142 96 ( 81 , 113) IV212 -2.90 3 356 7 134 ( 54 , 277) 43 72 ( 52 , 97) IV222 -1.37 3 424 2 29 ( 4 , 106) 53 73 ( 55 , 95) IV232 -2.89 3 226 4 117 ( 32 , 300) 37 97 ( 69 , 134) IV262 -3.31 2 458 7 98 ( 39 , 202) 66 85 ( 66 , 108) IV4 7 -3.61 2 85 0 0 ( 0 , 348) 13 97 ( 52 , 166) IV548 -2.45 3 436 3 45 ( 9 , 130) 68 92 ( 72 , 117) IV6 7 -2.69 3 1091 12 75 ( 39 , 131) 176 96 ( 82 , 111) IV7 8 -4.01 2 1407 13 66 ( 35 , 114) 232 100 ( 88 , 114)
Page 105
Page 102 - Carstairs Scores for Scottish Postcode Sectors from the 1991 Census
Public Health Research Unit, University of Glasgow
Appendix V (continued)
Health Board
Local government District
Post code
sector
Carstairs score DEPCAT
Pop. aged 40-64
Obs. deaths
SMRs ages 40-64
95% CI Obs.
discharges
SDRs 40-64
95% CI
1991 1991 1991 1991 1991-92 1991 IV8 8 -3.43 2 195 1 36 ( 1 , 202) 34 106 ( 73 , 148) IV9 8 0.46 4 365 3 55 ( 11 , 162) 56 91 ( 68 , 118) Highlands Skye & Lochalsh IV408 -0.79 4 696 7 66 ( 27 , 136) 125 106 ( 89 , 127) IV418 3.54 6 116 1 65 ( 2 , 362) 16 84 ( 48 , 137) IV428 -0.09 4 129 5 335 (109 , 782) 48 238 (176 , 316) IV438 4.81 6 59 0 0 ( 0 , 484) 12 125 ( 65 , 218) IV448 0.05 4 52 0 0 ( 0 , 588) 14 173 ( 95 , 291) IV458 0.94 4 74 0 0 ( 0 , 368) 14 116 ( 64 , 195) IV468 -3.08 2 27 0 0 ( 0 ,1042) 1 23 ( 1 , 128) IV478 -0.98 4 156 2 89 ( 11 , 321) 25 95 ( 61 , 140) IV488 -1.82 3 20 0 0 ( 0 ,1414) 2 63 ( 8 , 226) IV499 0.08 4 264 2 50 ( 6 , 182) 57 128 ( 97 , 166) IV519 -0.67 4 1266 15 83 ( 47 , 137) 273 130 (115 , 146) IV528 -3.60 2 119 1 63 ( 2 , 350) 15 77 ( 43 , 128) IV538 -3.44 2 43 1 178 ( 5 , 993) 7 101 ( 40 , 208) IV558 -1.59 3 422 10 162 ( 77 , 297) 110 156 (128 , 188) IV568 -3.41 2 84 1 87 ( 2 , 483) 21 151 ( 93 , 231) Highlands Sutherland IV243 -0.11 4 468 9 118 ( 54 , 223) 66 82 ( 63 , 104) IV253 -2.20 3 650 8 77 ( 33 , 152) 72 65 ( 50 , 81) IV274 0.13 4 1190 22 123 ( 77 , 186) 205 103 ( 89 , 118) IV283 0.39 4 144 2 95 ( 12 , 343) 20 84 ( 51 , 129) KW106 -2.34 3 498 4 57 ( 15 , 145) 80 97 ( 77 , 121)
Page 106
Page 103 - Carstairs Scores for Scottish Postcode Sectors from the 1991 Census
Public Health Research Unit, University of Glasgow
Appendix V (continued)
Health Board
Local government District
Post code
sector
Carstairs score DEPCAT
Pop. aged 40-64
Obs. deaths
SMRs ages 40-64
95% CI Obs.
discharges
SDRs 40-64
95% CI
1991 1991 1991 1991 1991-92 1991 KW116 -4.83 1 60 0 0 ( 0 , 339) 10 92 ( 44 , 168) KW136 -5.60 1 38 0 0 ( 0 , 643) 7 106 ( 43 , 219) KW147 2.18 5 351 5 89 ( 29 , 208) 44 73 ( 53 , 98) KW8 6 -0.41 4 299 5 91 ( 29 , 212) 76 142 (112 , 178) KW9 6 -0.76 4 601 6 65 ( 24 , 141) 87 85 ( 68 , 105) Lanarkshire Clydesdale EH467 -4.96 1 72 1 119 ( 3 , 661) 8 71 ( 30 , 139) EH558 -3.29 2 92 0 0 ( 0 , 305) 9 59 ( 27 , 113) ML110 0.58 4 2384 27 77 ( 51 , 113) 368 92 ( 83 , 102) ML117 -1.22 3 2248 34 100 ( 69 , 140) 357 94 ( 84 , 104) ML118 -0.66 4 2453 31 84 ( 57 , 119) 408 99 ( 90 , 109) ML119 -1.51 3 2981 39 92 ( 66 , 126) 462 93 ( 85 , 102) ML126 -2.50 3 2006 18 64 ( 38 , 101) 293 88 ( 78 , 99) ML8 4 0.39 4 2079 22 78 ( 49 , 118) 341 100 ( 90 , 111) ML8 5 -2.97 3 3162 29 69 ( 46 , 99) 458 89 ( 81 , 98)
Lanarkshire Cumbernauld & Kilsyth
G65 0 1.05 5 1679 32 137 ( 94 , 194) 306 110 ( 98 , 123)
G65 9 0.37 4 2104 42 136 ( 98 , 184) 381 108 ( 97 , 119) G67 1 -1.96 3 1861 30 94 ( 64 , 135) 366 111 (100 , 123) G67 2 0.80 4 3957 73 129 (101 , 162) 599 90 ( 83 , 98) G67 3 -1.43 3 2854 41 121 ( 87 , 164) 477 105 ( 96 , 115) G67 4 -2.28 3 3475 35 83 ( 58 , 116) 494 89 ( 81 , 97) G68 0 -3.05 2 291 2 61 ( 7 , 219) 15 33 ( 18 , 54) G68 9 -2.53 3 2106 17 64 ( 37 , 103) 334 99 ( 89 , 110)
Page 107
Page 104 - Carstairs Scores for Scottish Postcode Sectors from the 1991 Census
Public Health Research Unit, University of Glasgow
Appendix V (continued)
Health Board
Local government District
Post code
sector
Carstairs score DEPCAT
Pop. aged 40-64
Obs. deaths
SMRs ages 40-64
95% CI Obs.
discharges
SDRs 40-64
95% CI
1991 1991 1991 1991 1991-92 1991 Lanarkshire East Kilbride G72 8 4.28 6 18 0 0 ( 0 ,1984) 4 146 ( 40 , 373) G72 9 -5.48 1 21 0 0 ( 0 ,1003) 0 0 ( 0 , 101) G74 1 -0.42 4 1229 18 80 ( 47 , 126) 263 119 (105 , 135) G74 2 -3.30 2 3073 31 70 ( 47 , 99) 513 99 ( 91 , 108) G74 3 -1.77 3 4521 63 82 ( 63 , 105) 855 107 (100 , 115) G74 4 -2.22 3 2024 33 105 ( 72 , 148) 364 106 ( 95 , 117) G74 5 -6.30 1 254 2 55 ( 7 , 199) 17 40 ( 24 , 65) G75 0 -0.58 4 2786 52 110 ( 82 , 145) 566 116 (107 , 126) G75 8 -1.79 3 5467 57 74 ( 56 , 96) 930 102 ( 96 , 109) G75 9 0.02 4 2282 23 83 ( 52 , 124) 409 112 (102 , 124) G76 8 -4.97 1 502 7 91 ( 36 , 187) 50 59 ( 44 , 77) G76 9 -6.24 1 56 0 0 ( 0 , 584) 3 34 ( 7 , 98) ML106 -3.42 2 3034 24 58 ( 37 , 86) 453 91 ( 82 , 99) Lanarkshire Hamilton G71 7 -2.12 3 1552 21 94 ( 58 , 143) 233 89 ( 78 , 102) G71 8 -2.34 3 2189 32 105 ( 72 , 148) 297 82 ( 73 , 92) G72 0 6.91 7 2239 44 135 ( 98 , 181) 451 120 (109 , 132) G72 9 1.61 5 3250 55 127 ( 95 , 165) 638 120 (111 , 130) ML3 0 3.86 6 1525 35 151 (105 , 210) 355 136 (123 , 151) ML3 6 0.00 4 1772 37 132 ( 93 , 182) 381 126 (114 , 139) ML3 7 -1.57 3 3800 43 83 ( 60 , 112) 633 101 ( 94 , 109) ML3 8 0.45 4 4413 63 107 ( 82 , 137) 833 115 (107 , 123) ML3 9 1.24 5 3815 51 86 ( 64 , 114) 775 119 (111 , 128) ML8 5 -6.71 1 31 0 0 ( 0 , 820) 4 77 ( 21 , 197)
Page 108
Page 105 - Carstairs Scores for Scottish Postcode Sectors from the 1991 Census
Public Health Research Unit, University of Glasgow
Appendix V (continued)
Health Board
Local government District
Post code
sector
Carstairs score DEPCAT
Pop. aged 40-64
Obs. deaths
SMRs ages 40-64
95% CI Obs.
discharges
SDRs 40-64
95% CI
1991 1991 1991 1991 1991-92 1991 ML9 1 0.58 4 2223 35 109 ( 76 , 152) 365 99 ( 89 , 109) ML9 2 -0.55 4 2775 39 102 ( 72 , 139) 486 106 ( 97 , 116) ML9 3 -0.62 4 1956 23 84 ( 53 , 127) 351 109 ( 98 , 121) Lanarkshire Monklands G67 4 3.96 6 31 0 0 ( 0 , 941) 7 140 ( 56 , 289) G69 7 5.92 6 663 13 139 ( 74 , 237) 137 124 (105 , 147) ML1 5 -0.76 4 35 0 0 ( 0 , 755) 2 34 ( 4 , 124) ML5 1 0.86 4 1976 33 112 ( 77 , 157) 380 114 (103 , 126) ML5 2 3.51 6 2857 61 142 (109 , 183) 529 109 (100 , 119) ML5 3 1.59 5 1398 17 77 ( 45 , 123) 286 119 (106 , 134) ML5 4 4.53 6 2955 62 129 ( 99 , 165) 628 123 (114 , 133) ML5 5 6.31 7 3451 65 125 ( 96 , 159) 681 117 (108 , 126) ML6 0 2.10 5 2481 48 135 ( 99 , 179) 537 130 (119 , 141) ML6 6 3.18 6 2694 56 141 (107 , 183) 508 112 (102 , 122) ML6 7 3.73 6 3031 53 120 ( 90 , 156) 524 103 ( 95 , 112) ML6 8 2.88 6 3363 58 124 ( 94 , 161) 631 113 (105 , 123) ML6 9 0.10 4 3537 47 93 ( 68 , 124) 652 110 (102 , 119) ML7 4 4.31 6 489 5 73 ( 24 , 171) 83 102 ( 82 , 127) Lanarkshire Motherwell G71 5 7.05 7 2108 45 153 (112 , 205) 384 110 ( 99 , 122) G71 6 -0.29 4 2123 44 155 (112 , 208) 381 110 ( 99 , 121) G71 7 -5.85 1 28 0 0 ( 0 ,1708) 5 126 ( 41 , 295) ML1 1 3.26 6 1934 35 113 ( 78 , 156) 350 105 ( 94 , 116) ML1 2 1.44 5 2769 50 111 ( 82 , 146) 409 85 ( 77 , 94)
Page 109
Page 106 - Carstairs Scores for Scottish Postcode Sectors from the 1991 Census
Public Health Research Unit, University of Glasgow
Appendix V (continued)
Health Board
Local government District
Post code
sector
Carstairs score DEPCAT
Pop. aged 40-64
Obs. deaths
SMRs ages 40-64
95% CI Obs.
discharges
SDRs 40-64
95% CI
1991 1991 1991 1991 1991-92 1991 ML1 3 1.39 5 4052 63 113 ( 87 , 144) 570 85 ( 78 , 93) ML1 4 3.30 6 3190 68 141 (109 , 178) 567 105 ( 97 , 114) ML1 5 3.41 6 2735 42 109 ( 79 , 147) 500 110 (101 , 121) ML2 0 2.73 5 3179 36 77 ( 54 , 107) 524 98 ( 90 , 107) ML2 7 2.52 5 3142 60 119 ( 91 , 153) 568 105 ( 96 , 114) ML2 8 1.45 5 3891 56 92 ( 69 , 119) 677 101 ( 94 , 109) ML2 9 4.30 6 1919 39 141 (100 , 193) 314 98 ( 87 , 109) ML4 1 2.60 5 1857 42 154 (111 , 208) 357 114 (103 , 127) ML4 2 3.36 6 3058 58 134 (102 , 174) 635 125 (116 , 136) ML4 3 3.67 6 1098 18 109 ( 65 , 172) 201 109 ( 95 , 125) ML7 4 3.34 6 1786 40 156 (111 , 212) 364 123 (110 , 136) ML7 5 2.77 5 2433 42 111 ( 80 , 150) 357 86 ( 77 , 95) Lothian East Lothian EH216 -2.53 3 2520 30 81 ( 55 , 116) 446 106 ( 96 , 116) EH217 -0.46 4 2017 22 72 ( 45 , 108) 360 105 ( 95 , 117) EH218 2.05 5 1590 23 95 ( 60 , 142) 331 123 (110 , 137) EH222 -1.33 3 23 0 0 ( 0 ,1153) 0 0 ( 0 , 96) EH312 -4.41 2 769 7 58 ( 23 , 120) 90 68 ( 55 , 84) EH320 -3.79 2 2718 25 68 ( 44 , 100) 368 83 ( 75 , 92) EH329 2.73 5 2223 27 79 ( 52 , 115) 448 118 (108 , 130) EH331 0.43 4 1348 19 94 ( 57 , 147) 238 105 ( 92 , 119) EH332 -1.00 4 1885 23 83 ( 53 , 125) 300 95 ( 84 , 106) EH345 -4.26 2 644 5 63 ( 21 , 148) 86 84 ( 67 , 104) EH355 -1.32 3 693 5 52 ( 17 , 121) 91 80 ( 64 , 98)
Page 110
Page 107 - Carstairs Scores for Scottish Postcode Sectors from the 1991 Census
Public Health Research Unit, University of Glasgow
Appendix V (continued)
Health Board
Local government District
Post code
sector
Carstairs score DEPCAT
Pop. aged 40-64
Obs. deaths
SMRs ages 40-64
95% CI Obs.
discharges
SDRs 40-64
95% CI
1991 1991 1991 1991 1991-92 1991 EH365 -4.40 2 108 1 66 ( 2 , 366) 14 78 ( 43 , 131) EH394 -2.64 3 1642 13 55 ( 29 , 93) 255 93 ( 82 , 105) EH395 -2.68 3 757 7 63 ( 25 , 129) 103 81 ( 66 , 98) EH403 -3.06 2 548 7 90 ( 36 , 186) 94 104 ( 84 , 127) EH413 -1.05 4 1573 17 74 ( 43 , 118) 213 81 ( 70 , 92) EH414 -3.57 2 1843 23 89 ( 56 , 133) 272 89 ( 79 , 100) EH421 -1.15 4 2315 25 73 ( 47 , 108) 377 97 ( 88 , 107) TD135 -7.21 1 69 1 98 ( 2 , 545) 4 34 ( 9 , 88) Lothian Edinburgh City EH1 1 2.22 5 343 7 123 ( 49 , 253) 98 168 (136 , 204) EH1 2 0.82 4 359 17 287 (167 , 460) 80 130 (103 , 162) EH1 3 0.25 4 268 2 53 ( 6 , 190) 55 126 ( 95 , 164) EH104 -2.97 3 1744 15 64 ( 36 , 105) 187 66 ( 57 , 76) EH105 -5.09 1 2454 21 61 ( 38 , 93) 293 72 ( 64 , 81) EH106 -6.03 1 2647 15 42 ( 23 , 69) 282 65 ( 57 , 73) EH107 -6.24 1 1386 8 43 ( 19 , 85) 132 58 ( 49 , 69) EH111 -0.50 4 2032 44 150 (109 , 202) 345 102 ( 92 , 113) EH112 1.96 5 1415 33 148 (102 , 208) 283 117 (104 , 132) EH113 4.17 6 2904 49 105 ( 77 , 138) 556 111 (102 , 120) EH114 1.17 5 2253 39 128 ( 91 , 174) 383 103 ( 93 , 114) EH120 -4.75 1 23 0 0 ( 0 ,1414) 2 58 ( 7 , 209) EH125 -3.62 2 1811 17 60 ( 35 , 96) 247 80 ( 70 , 90) EH126 -6.00 1 1736 16 63 ( 36 , 102) 187 64 ( 55 , 74) EH127 -2.54 3 2961 20 44 ( 27 , 68) 427 85 ( 77 , 93)
Page 111
Page 108 - Carstairs Scores for Scottish Postcode Sectors from the 1991 Census
Public Health Research Unit, University of Glasgow
Appendix V (continued)
Health Board
Local government District
Post code
sector
Carstairs score DEPCAT
Pop. aged 40-64
Obs. deaths
SMRs ages 40-64
95% CI Obs.
discharges
SDRs 40-64
95% CI
1991 1991 1991 1991 1991-92 1991 EH128 -4.58 2 4012 38 63 ( 45 , 87) 575 85 ( 78 , 92) EH129 -2.40 3 562 8 116 ( 50 , 228) 79 88 ( 70 , 110) EH130 -6.08 1 2071 20 71 ( 43 , 110) 216 63 ( 55 , 72) EH139 1.21 5 2180 45 126 ( 92 , 168) 413 109 ( 99 , 120) EH141 -2.95 3 2512 35 91 ( 64 , 127) 380 89 ( 80 , 98) EH142 1.43 5 2462 22 65 ( 41 , 98) 381 93 ( 84 , 103) EH143 1.88 5 1804 25 123 ( 80 , 182) 282 100 ( 89 , 113) EH144 -4.03 2 58 0 0 ( 0 , 546) 3 33 ( 7 , 96) EH145 -4.77 1 3308 31 62 ( 42 , 89) 326 58 ( 52 , 65) EH146 -4.80 1 86 0 0 ( 0 , 280) 4 27 ( 7 , 70) EH147 -4.61 2 1692 9 44 ( 20 , 84) 170 63 ( 54 , 74) EH151 -2.57 3 2070 20 63 ( 39 , 98) 308 87 ( 78 , 98) EH152 -2.95 3 1692 18 77 ( 46 , 122) 250 90 ( 79 , 101) EH153 1.14 5 2344 47 123 ( 90 , 163) 451 111 (101 , 122) EH164 9.51 7 2030 52 176 (132 , 231) 489 144 (131 , 157) EH165 -1.33 3 2566 43 111 ( 80 , 149) 457 106 ( 96 , 116) EH166 -0.79 4 3135 52 105 ( 78 , 137) 535 100 ( 92 , 109) EH177 1.23 5 2499 32 92 ( 63 , 130) 415 100 ( 91 , 110) EH178 1.92 5 2585 47 123 ( 90 , 163) 463 106 ( 97 , 116) EH2 1 -1.25 3 17 0 0 ( 0 ,1101) 1 33 ( 1 , 181) EH2 2 -4.14 2 35 1 171 ( 4 , 951) 6 97 ( 35 , 211) EH2 3 0.50 4 23 1 212 ( 5 ,1183) 3 69 ( 14 , 202) EH2 4 1.25 5 59 1 118 ( 3 , 660) 10 104 ( 50 , 191) EH209 -1.91 3 60 2 223 ( 27 , 807) 4 40 ( 11 , 101)
Page 112
Page 109 - Carstairs Scores for Scottish Postcode Sectors from the 1991 Census
Public Health Research Unit, University of Glasgow
Appendix V (continued)
Health Board
Local government District
Post code
sector
Carstairs score DEPCAT
Pop. aged 40-64
Obs. deaths
SMRs ages 40-64
95% CI Obs.
discharges
SDRs 40-64
95% CI
1991 1991 1991 1991 1991-92 1991 EH218 1.55 5 131 2 89 ( 11 , 320) 32 139 ( 95 , 196) EH278 -6.25 1 60 3 289 ( 60 , 844) 5 48 ( 15 , 111) EH288 -1.94 3 918 14 104 ( 57 , 175) 150 97 ( 82 , 114) EH299 -2.63 3 999 9 67 ( 30 , 127) 73 45 ( 35 , 56) EH3 5 -3.20 2 1464 10 48 ( 23 , 88) 192 79 ( 68 , 91) EH3 6 -1.97 3 1535 11 50 ( 25 , 90) 197 77 ( 67 , 89) EH3 7 -3.50 2 266 3 82 ( 17 , 240) 34 77 ( 54 , 108) EH3 8 0.19 4 337 3 57 ( 12 , 168) 65 113 ( 87 , 144) EH3 9 0.35 4 1028 25 161 (104 , 238) 161 93 ( 80 , 109) EH309 -3.35 2 2642 32 95 ( 65 , 134) 400 94 ( 85 , 104) EH4 1 -3.09 2 1524 19 88 ( 53 , 137) 199 79 ( 68 , 90) EH4 2 -1.24 3 3202 41 79 ( 57 , 108) 670 121 (112 , 131) EH4 3 -5.75 1 1781 13 48 ( 26 , 83) 197 65 ( 57 , 75) EH4 4 6.51 7 2588 60 161 (123 , 207) 696 161 (149 , 173) EH4 5 -2.79 3 1637 21 79 ( 49 , 121) 273 96 ( 85 , 108) EH4 6 -6.26 1 2069 15 51 ( 29 , 85) 197 57 ( 49 , 66) EH4 7 -0.88 4 2595 41 89 ( 64 , 121) 535 116 (106 , 126) EH4 8 -5.93 1 986 10 70 ( 33 , 128) 128 78 ( 65 , 92) EH5 1 7.62 7 1301 30 143 ( 96 , 204) 319 142 (126 , 158) EH5 2 0.88 4 1706 21 84 ( 52 , 128) 334 116 (104 , 129) EH5 3 -4.68 2 1765 22 86 ( 54 , 130) 276 93 ( 83 , 105) EH6 4 -0.17 4 2171 36 117 ( 82 , 162) 345 96 ( 86 , 107) EH6 5 1.36 5 1238 14 76 ( 41 , 127) 227 109 ( 95 , 124) EH6 6 3.07 6 1048 14 88 ( 48 , 148) 195 110 ( 95 , 126)
Page 113
Page 110 - Carstairs Scores for Scottish Postcode Sectors from the 1991 Census
Public Health Research Unit, University of Glasgow
Appendix V (continued)
Health Board
Local government District
Post code
sector
Carstairs score DEPCAT
Pop. aged 40-64
Obs. deaths
SMRs ages 40-64
95% CI Obs.
discharges
SDRs 40-64
95% CI
1991 1991 1991 1991 1991-92 1991 EH6 7 0.99 4 904 12 88 ( 45 , 153) 130 85 ( 71 , 101) EH6 8 0.68 4 2263 45 129 ( 94 , 173) 405 105 ( 95 , 116) EH7 4 0.46 4 1634 32 127 ( 87 , 180) 260 94 ( 83 , 106) EH7 5 0.34 4 1975 40 136 ( 97 , 186) 362 109 ( 98 , 121) EH7 6 1.30 5 3746 71 112 ( 88 , 142) 647 99 ( 91 , 107) EH8 7 -1.55 3 3434 32 61 ( 42 , 86) 545 93 ( 86 , 102) EH8 8 0.38 4 665 20 170 (104 , 262) 124 105 ( 88 , 125) EH8 9 2.30 5 1381 32 150 (103 , 212) 308 131 (117 , 147) EH9 1 -2.70 3 2066 23 85 ( 54 , 127) 219 66 ( 57 , 75) EH9 2 -5.00 1 1762 8 33 ( 14 , 66) 177 61 ( 52 , 71) EH9 3 -3.75 2 876 7 53 ( 21 , 110) 104 70 ( 57 , 85) Lothian Midlothian EH107 -0.71 4 67 1 99 ( 2 , 550) 12 107 ( 55 , 186) EH181 -4.15 2 732 9 95 ( 43 , 180) 89 75 ( 60 , 93) EH192 -0.29 4 1970 29 106 ( 71 , 152) 314 96 ( 86 , 107) EH193 -1.25 3 1734 16 65 ( 37 , 105) 255 88 ( 78 , 100) EH209 -0.15 4 2027 23 79 ( 50 , 119) 264 78 ( 69 , 88) EH221 -0.31 4 1774 23 83 ( 53 , 124) 358 118 (106 , 131) EH222 2.51 5 1823 27 103 ( 68 , 149) 304 100 ( 89 , 112) EH223 -5.68 1 1022 10 75 ( 36 , 138) 138 83 ( 70 , 98) EH224 0.94 4 1636 25 101 ( 65 , 149) 260 94 ( 83 , 106) EH225 2.28 5 2019 31 107 ( 73 , 152) 418 124 (112 , 136) EH234 1.71 5 2031 39 125 ( 89 , 171) 360 105 ( 94 , 116) EH249 3.06 6 386 11 206 (102 , 368) 42 66 ( 48 , 89)
Page 114
Page 111 - Carstairs Scores for Scottish Postcode Sectors from the 1991 Census
Public Health Research Unit, University of Glasgow
Appendix V (continued)
Health Board
Local government District
Post code
sector
Carstairs score DEPCAT
Pop. aged 40-64
Obs. deaths
SMRs ages 40-64
95% CI Obs.
discharges
SDRs 40-64
95% CI
1991 1991 1991 1991 1991-92 1991 EH259 -2.10 3 1099 14 90 ( 49 , 152) 126 69 ( 58 , 82) EH260 -3.28 2 2036 21 79 ( 49 , 121) 268 81 ( 72 , 91) EH268 -1.06 4 1913 17 68 ( 40 , 109) 241 77 ( 68 , 88) EH269 -5.95 1 1558 15 78 ( 44 , 129) 173 69 ( 59 , 80) EH375 -3.02 2 512 4 51 ( 14 , 131) 58 67 ( 51 , 87) Lothian West Lothian EH278 -2.21 3 509 9 133 ( 61 , 253) 72 87 ( 68 , 110) EH309 -5.90 1 36 0 0 ( 0 , 989) 11 199 ( 99 , 357) EH470 2.66 5 2215 38 112 ( 79 , 153) 313 83 ( 74 , 92) EH477 2.76 5 1781 24 90 ( 57 , 133) 294 97 ( 86 , 109) EH478 1.16 5 2212 32 111 ( 76 , 156) 265 73 ( 65 , 83) EH479 2.68 5 1441 19 91 ( 55 , 142) 177 73 ( 63 , 85) EH481 0.03 4 1977 15 48 ( 27 , 79) 289 85 ( 75 , 95) EH482 0.72 4 2095 39 125 ( 89 , 171) 284 80 ( 71 , 90) EH483 0.78 4 2630 32 90 ( 62 , 127) 317 74 ( 66 , 82) EH484 -0.63 4 1428 16 75 ( 43 , 121) 212 88 ( 76 , 100) EH496 -3.37 2 2221 22 75 ( 47 , 114) 277 77 ( 68 , 86) EH497 -4.69 2 1869 27 115 ( 75 , 167) 225 75 ( 66 , 86) EH525 -2.81 3 2083 36 121 ( 85 , 168) 281 81 ( 72 , 91) EH526 1.06 5 2961 42 97 ( 70 , 131) 465 94 ( 85 , 103) EH530 -3.24 2 2456 19 62 ( 37 , 96) 297 76 ( 67 , 85) EH545 0.77 4 2025 18 67 ( 39 , 105) 391 118 (106 , 130) EH546 0.24 4 4391 44 82 ( 59 , 109) 762 108 (101 , 116) EH547 -6.08 1 387 4 91 ( 25 , 232) 33 55 ( 38 , 77)
Page 115
Page 112 - Carstairs Scores for Scottish Postcode Sectors from the 1991 Census
Public Health Research Unit, University of Glasgow
Appendix V (continued)
Health Board
Local government District
Post code
sector
Carstairs score DEPCAT
Pop. aged 40-64
Obs. deaths
SMRs ages 40-64
95% CI Obs.
discharges
SDRs 40-64
95% CI
1991 1991 1991 1991 1991-92 1991 EH548 -1.29 3 3364 46 114 ( 83 , 152) 579 108 (100 , 118) EH549 -5.65 1 789 2 24 ( 3 , 88) 66 55 ( 43 , 70) EH558 0.35 4 2202 24 76 ( 49 , 114) 335 92 ( 82 , 102) FK1 2 -6.86 1 18 1 450 ( 11 ,2509) 3 101 ( 21 , 294) ML7 5 2.81 5 273 7 207 ( 83 , 427) 38 86 ( 61 , 118) Orkney Islands Orkney Islands KW151 -1.23 3 2120 23 77 ( 49 , 115) 339 96 ( 86 , 107) KW163 -1.29 3 1151 9 56 ( 26 , 106) 139 73 ( 61 , 86) KW172 -2.27 3 2661 25 65 ( 42 , 96) 369 83 ( 75 , 92) Shetland Islands
Shetland Islands ZE1 0 -0.75 4 2374 27 82 ( 54 , 120) 493 126 (115 , 138)
ZE2 9 -1.33 3 3752 34 69 ( 48 , 96) 617 102 ( 94 , 110) ZE3 9 -3.47 2 129 4 212 ( 58 , 542) 21 99 ( 61 , 151) Tayside Angus AB301 -4.56 2 8 0 0 ( 0 ,3583) 0 0 ( 0 , 277) DD108 0.66 4 1963 25 82 ( 53 , 122) 275 83 ( 73 , 93) DD109 -0.62 4 2527 24 67 ( 43 , 99) 374 89 ( 81 , 99) DD111 2.05 5 1475 23 103 ( 65 , 154) 217 87 ( 76 , 99) DD112 -3.04 2 1723 19 79 ( 47 , 123) 231 81 ( 71 , 93) DD113 -2.79 3 1148 9 51 ( 23 , 97) 118 60 ( 50 , 72) DD114 -0.49 4 2070 20 71 ( 43 , 110) 325 96 ( 86 , 107) DD115 1.44 5 1830 30 110 ( 74 , 157) 255 83 ( 73 , 93) DD5 3 -4.28 2 391 5 99 ( 32 , 231) 52 82 ( 61 , 108) DD7 6 -4.35 2 1497 18 91 ( 54 , 144) 204 84 ( 73 , 96) DD7 7 -1.76 3 1928 21 80 ( 50 , 123) 258 82 ( 72 , 92)
Page 116
Page 113 - Carstairs Scores for Scottish Postcode Sectors from the 1991 Census
Public Health Research Unit, University of Glasgow
Appendix V (continued)
Health Board
Local government District
Post code
sector
Carstairs score DEPCAT
Pop. aged 40-64
Obs. deaths
SMRs ages 40-64
95% CI Obs.
discharges
SDRs 40-64
95% CI
1991 1991 1991 1991 1991-92 1991 DD8 1 -0.00 4 2617 33 85 ( 58 , 119) 428 97 ( 88 , 107) DD8 2 -2.13 3 1946 23 81 ( 51 , 121) 295 91 ( 81 , 102) DD8 3 -3.27 2 1558 14 62 ( 34 , 104) 253 97 ( 86 , 110) DD8 4 -2.39 3 1092 5 33 ( 11 , 77) 161 90 ( 76 , 105) DD8 5 -1.45 3 1067 17 106 ( 62 , 170) 170 94 ( 80 , 109) DD9 6 -2.52 3 1531 10 43 ( 21 , 79) 205 79 ( 68 , 90) DD9 7 -0.43 4 1554 14 59 ( 32 , 98) 188 71 ( 61 , 82) PH118 -3.51 2 117 2 128 ( 16 , 463) 11 58 ( 29 , 104) PH128 -4.02 2 305 5 116 ( 38 , 271) 50 99 ( 73 , 131) Tayside Dundee City DD1 1 3.08 6 156 2 75 ( 9 , 272) 43 159 (115 , 214) DD1 2 1.55 5 385 3 54 ( 11 , 159) 58 90 ( 69 , 117) DD1 3 7.83 7 41 3 434 ( 89 ,1267) 13 188 (100 , 321) DD1 4 0.58 4 301 8 206 ( 89 , 406) 72 149 (117 , 188) DD1 5 2.81 5 472 8 105 ( 45 , 207) 98 121 ( 98 , 147) DD2 1 -3.55 2 2061 21 68 ( 42 , 104) 270 78 ( 69 , 87) DD2 2 -0.31 4 2582 27 65 ( 43 , 94) 484 108 ( 99 , 118) DD2 3 5.63 6 2793 57 129 ( 98 , 167) 657 137 (127 , 148) DD2 4 3.33 6 3886 60 93 ( 71 , 119) 799 118 (110 , 126) DD2 5 -4.46 2 1926 21 74 ( 46 , 113) 253 78 ( 69 , 88) DD3 0 4.85 6 2215 32 108 ( 74 , 152) 433 120 (109 , 132) DD3 6 0.60 4 2322 71 181 (141 , 228) 492 121 (111 , 133) DD3 7 5.32 6 2022 48 150 (110 , 199) 473 136 (124 , 149) DD3 8 -1.23 3 2392 40 102 ( 73 , 140) 478 115 (105 , 126) DD3 9 -0.11 4 3039 36 83 ( 58 , 115) 582 114 (105 , 124)
Page 117
Page 114 - Carstairs Scores for Scottish Postcode Sectors from the 1991 Census
Public Health Research Unit, University of Glasgow
Appendix V (continued)
Health Board
Local government District
Post code
sector
Carstairs score DEPCAT
Pop. aged 40-64
Obs. deaths
SMRs ages 40-64
95% CI Obs.
discharges
SDRs 40-64
95% CI
1991 1991 1991 1991 1991-92 1991 DD4 0 2.90 6 1962 29 113 ( 76 , 163) 445 140 (127 , 153) DD4 6 2.02 5 1478 28 126 ( 84 , 182) 303 122 (108 , 136) DD4 7 -2.57 3 2564 37 88 ( 62 , 121) 421 95 ( 86 , 104)
DD4 8 5.97 6 3607 76 132 (104 , 166) 764 123 (115 , 132) DD4 9 3.93 6 3753 72 131 (103 , 165) 720 114 (106 , 123) DD5 1 -5.00 1 1781 10 37 ( 18 , 68) 246 82 ( 72 , 92) DD5 2 -4.53 2 2318 25 70 ( 45 , 103) 281 71 ( 63 , 80) DD5 3 -5.44 1 2778 21 53 ( 33 , 81) 358 77 ( 69 , 86) DD5 4 -4.97 1 2698 21 55 ( 34 , 84) 384 85 ( 77 , 94) PH149 -4.42 2 44 0 0 ( 0 , 822) 10 148 ( 71 , 272)
Tayside Perth & Kinross FK147 -1.56 3 155 0 0 ( 0 , 162) 13 49 ( 26 , 85) FK150 -5.73 1 48 0 0 ( 0 , 642) 2 26 ( 3 , 95) FK159 -4.17 2 266 2 60 ( 7 , 215) 30 70 ( 47 , 100) FK218 -6.79 1 42 0 0 ( 0 , 465) 5 66 ( 21 , 154) KY137 -3.73 2 2876 33 87 ( 60 , 122) 382 82 ( 74 , 90) KY146 -6.47 1 25 1 226 ( 6 ,1257) 9 199 ( 91 , 378) KY4 0 -1.17 4 81 1 94 ( 2 , 522) 10 75 ( 36 , 138) KY6 3 -7.19 1 18 0 0 ( 0 ,1299) 7 227 ( 91 , 467) PH1 1 -5.18 1 2441 21 61 ( 38 , 93) 314 77 ( 69 , 86) PH1 2 1.80 5 3364 62 121 ( 93 , 156) 627 110 (101 , 119) PH1 3 -1.51 3 2742 24 64 ( 41 , 95) 399 88 ( 80 , 97) PH1 4 -3.13 2 1112 18 105 ( 62 , 166) 176 93 ( 80 , 108) PH1 5 1.89 5 1535 27 106 ( 70 , 155) 242 91 ( 80 , 103)
Page 118
Page 115 - Carstairs Scores for Scottish Postcode Sectors from the 1991 Census
Public Health Research Unit, University of Glasgow
Appendix V (continued)
Health Board
Local government District
Post code
sector
Carstairs score DEPCAT
Pop. aged 40-64
Obs. deaths
SMRs ages 40-64
95% CI Obs.
discharges
SDRs 40-64
95% CI
1991 1991 1991 1991 1991-92 1991 PH106 -2.58 3 1938 21 72 ( 44 , 109) 272 83 ( 73 , 94) PH107 -0.00 4 1184 19 108 ( 65 , 169) 190 95 ( 82 , 110) PH118 -1.58 3 871 10 78 ( 38 , 144) 129 88 ( 74 , 105) PH128 -2.66 3 271 3 75 ( 15 , 218) 49 108 ( 80 , 142) PH139 -1.31 3 1188 18 101 ( 60 , 160) 204 102 ( 89 , 117) PH149 -4.21 2 389 3 64 ( 13 , 188) 51 83 ( 62 , 109) PH152 -1.63 3 963 12 82 ( 42 , 143) 138 85 ( 71 , 100) PH165 -2.76 3 1262 9 44 ( 20 , 83) 208 96 ( 83 , 110) PH172 -3.01 2 68 0 0 ( 0 , 421) 7 64 ( 26 , 131) PH185 -1.93 3 280 3 68 ( 14 , 200) 51 107 ( 80 , 141) PH2 0 -1.89 3 2166 34 105 ( 72 , 146) 321 88 ( 78 , 98) PH2 6 -3.81 2 2281 19 53 ( 32 , 83) 395 101 ( 92 , 112) PH2 7 -3.77 2 2459 31 85 ( 58 , 121) 345 84 ( 75 , 93) PH2 8 1.38 5 884 15 104 ( 58 , 171) 166 110 ( 94 , 128) PH2 9 -4.19 2 1611 24 108 ( 69 , 160) 227 86 ( 75 , 98) PH3 1 -2.47 3 1377 18 83 ( 49 , 130) 245 104 ( 91 , 117) PH4 1 0.44 4 165 1 40 ( 1 , 223) 35 125 ( 87 , 174) PH5 2 -0.38 4 267 1 27 ( 1 , 153) 39 89 ( 63 , 121) PH6 2 -3.46 2 648 9 87 ( 40 , 165) 82 73 ( 58 , 91) PH7 3 -1.31 3 1618 16 65 ( 37 , 106) 202 74 ( 64 , 85) PH7 4 -1.92 3 713 8 76 ( 33 , 150) 88 73 ( 59 , 90) PH8 0 -0.75 4 610 5 54 ( 18 , 127) 89 86 ( 69 , 106) PH9 0 -4.08 2 331 1 20 ( 1 , 111) 35 62 ( 43 , 87)
Page 119
Page 116 - Carstairs Scores for Scottish Postcode Sectors from the 1991 Census
Public Health Research Unit, University of Glasgow
Appendix V (continued)
Health Board
Local government District
Post code
sector
Carstairs score DEPCAT
Pop. aged 40-64
Obs. deaths
SMRs ages 40-64
95% CI Obs.
discharges
SDRs 40-64
95% CI
1991 1991 1991 1991 1991-92 1991 Western Islands Western Islands PA805 4.70 6 404 3 52 ( 11 , 152) 93 138 (112 , 169)
PA815 4.62 6 686 15 143 ( 80 , 236) 154 133 (113 , 156) PA825 -1.92 3 541 3 39 ( 8 , 114) 98 110 ( 89 , 134) PA833 0.58 4 90 1 65 ( 2 , 362) 13 83 ( 44 , 142) PA843 1.76 5 116 4 198 ( 54 , 507) 17 83 ( 48 , 133) PA853 3.59 6 489 7 89 ( 36 , 183) 64 76 ( 59 , 97) PA860 -1.36 3 2772 34 84 ( 58 , 118) 410 89 ( 80 , 98) PA869 -0.34 4 1405 16 70 ( 40 , 114) 266 110 ( 97 , 124) PA872 -0.27 4 1761 31 120 ( 81 , 170) 391 132 (119 , 146) PA885 -1.87 3 380 4 85 ( 23 , 217) 62 103 ( 79 , 132)