45
Case 5-17 (pg. 272)
| Date post: | 22-Dec-2015 |
| Category: |
Documents |
| View: | 220 times |
| Download: | 3 times |

Case 5-17 (pg. 272)

Balance Sheet
Assets
Cash $15,000 given
Accounts receivable (net)
Inventory
Prepaid expenses and other current assets
Current assets
Property, plant, and equipment (net)
Liabilities and Shareholders’ Equity
Accounts payable
Short-term notes 5,000 given
Current liabilities
Bonds payable
Shareholders’ equity
Income Statement
Sales
Cost of goods sold
Gross profit
Operating expenses
Interest expense
Tax expense
Net income $15,000 given
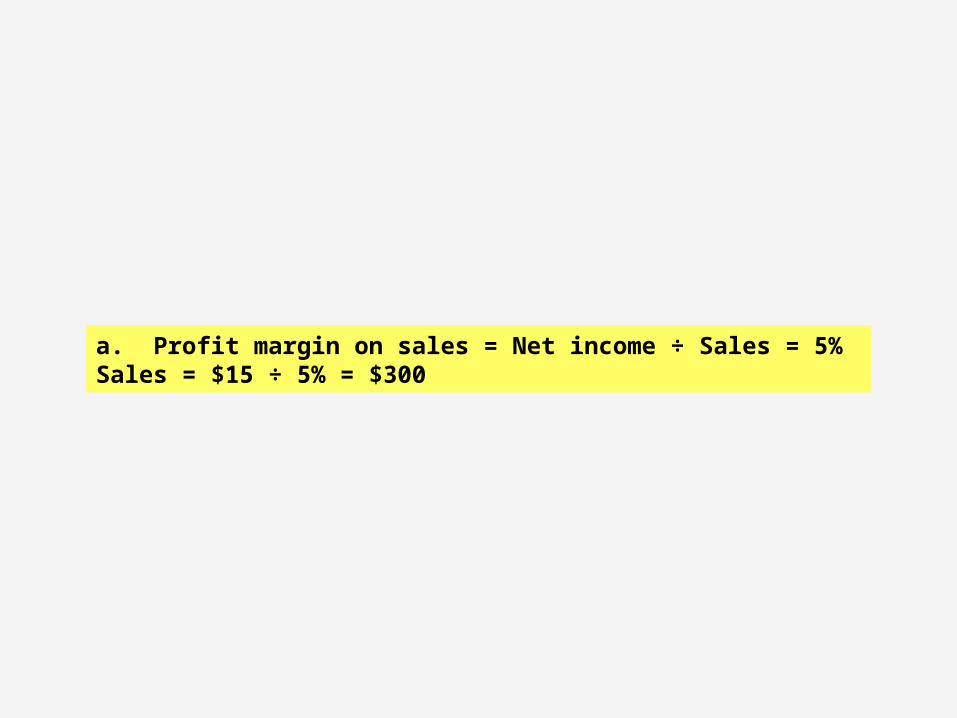
a. Profit margin on sales = Net income ÷ Sales = 5%Sales = $15 ÷ 5% = $300

Balance Sheet
Assets
Cash $15,000 given
Accounts receivable (net)
Inventory
Prepaid expenses and other current assets
Current assets
Property, plant, and equipment (net)
Liabilities and Shareholders’ Equity
Accounts payable
Short-term notes 5,000 given
Current liabilities
Bonds payable
Shareholders’ equity
Income Statement
Sales $300,000 (a)
Cost of goods sold
Gross profit
Operating expenses
Interest expense
Tax expense
Net income $15,000 given
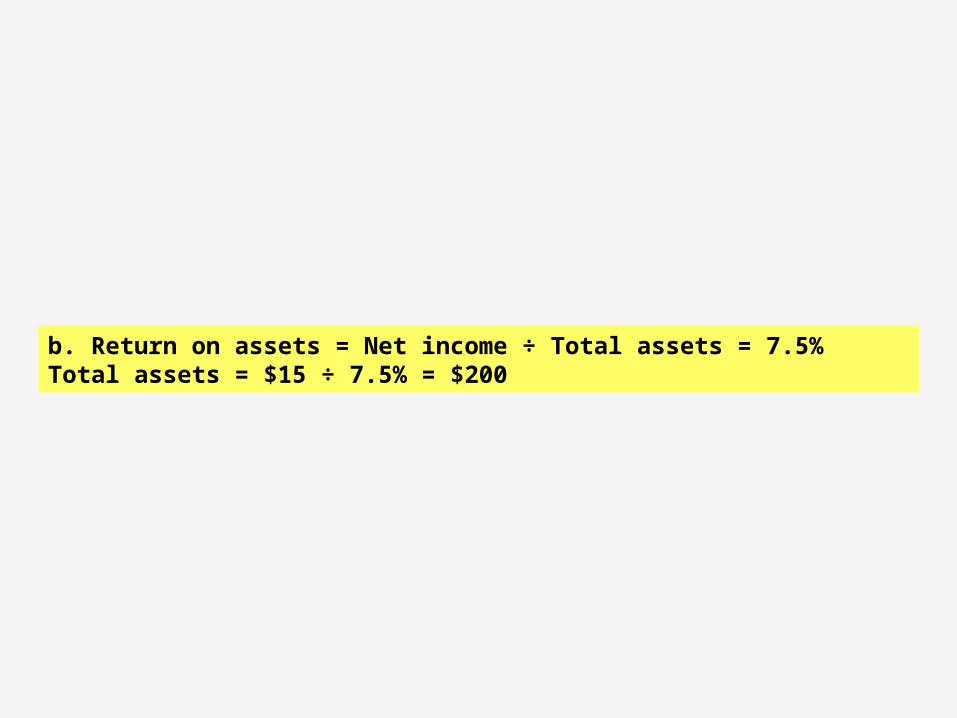
b. Return on assets = Net income ÷ Total assets = 7.5%Total assets = $15 ÷ 7.5% = $200
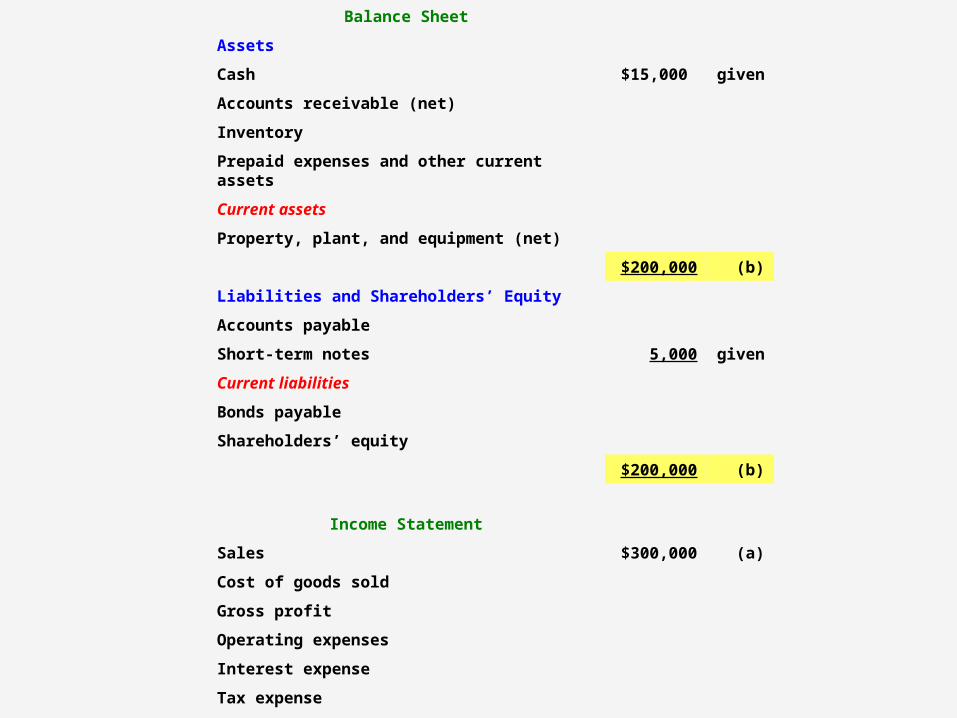
Balance Sheet
Assets
Cash $15,000 given
Accounts receivable (net)
Inventory
Prepaid expenses and other current assets
Current assets
Property, plant, and equipment (net)
$200,000 (b)
Liabilities and Shareholders’ Equity
Accounts payable
Short-term notes 5,000 given
Current liabilities
Bonds payable
Shareholders’ equity
$200,000 (b)
Income Statement
Sales $300,000 (a)
Cost of goods sold
Gross profit
Operating expenses
Interest expense
Tax expense
Net income $15,000 given

c. Gross profit margin = Gross profit ÷ Sales = 40%Gross profit = $300 x 40% = $120Cost of goods sold = Sales – Gross profit = $300 – 120 = $180

Balance Sheet
Assets
Cash $15,000 given
Accounts receivable (net)
Inventory
Prepaid expenses and other current assets
Current assets
Property, plant, and equipment (net)
$200,000 (b)
Liabilities and Shareholders’ Equity
Accounts payable
Short-term notes 5,000 given
Current liabilities
Bonds payable
Shareholders’ equity
$200,000 (b)
Income Statement
Sales $300,000 (a)
Cost of goods sold -180,000 (c)
Gross profit 120,000 (c)
Operating expenses
Interest expense
Tax expense
Net income $15,000 given

d. Inventory turnover ratio = Cost of goods sold ÷ Inventory = 6Inventory = $180 ÷ 6 = $30

Balance Sheet
Assets
Cash $15,000 given
Accounts receivable (net)
Inventory 30,000 (d)
Prepaid expenses and other current assets
Current assets
Property, plant, and equipment (net)
$200,000 (b)
Liabilities and Shareholders’ Equity
Accounts payable
Short-term notes 5,000 given
Current liabilities
Bonds payable
Shareholders’ equity
$200,000 (b)
Income Statement
Sales $300,000 (a)
Cost of goods sold -180,000 (c)
Gross profit 120,000 (c)
Operating expenses
Interest expense
Tax expense
Net income $15,000 given
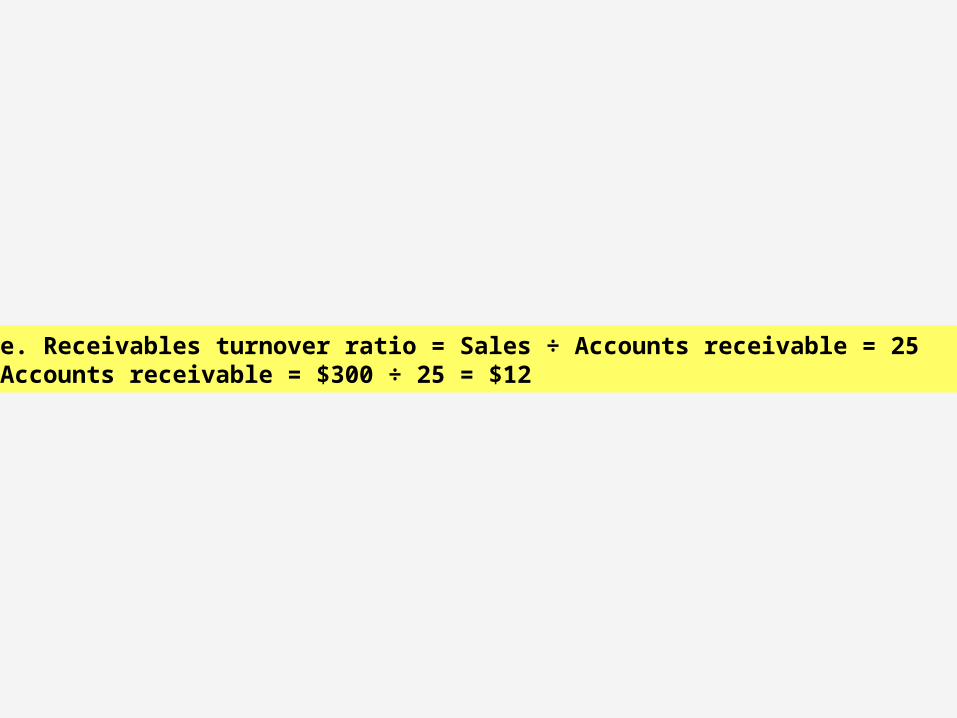
e. Receivables turnover ratio = Sales ÷ Accounts receivable = 25Accounts receivable = $300 ÷ 25 = $12

Balance Sheet
Assets
Cash $15,000 given
Accounts receivable (net) 12,000 (e)
Inventory 30,000 (d)
Prepaid expenses and other current assets
Current assets
Property, plant, and equipment (net)
$200,000 (b)
Liabilities and Shareholders’ Equity
Accounts payable
Short-term notes 5,000 given
Current liabilities
Bonds payable
Shareholders’ equity
$200,000 (b)
Income Statement
Sales $300,000 (a)
Cost of goods sold -180,000 (c)
Gross profit 120,000 (c)
Operating expenses
Interest expense
Tax expense
Net income $15,000 given
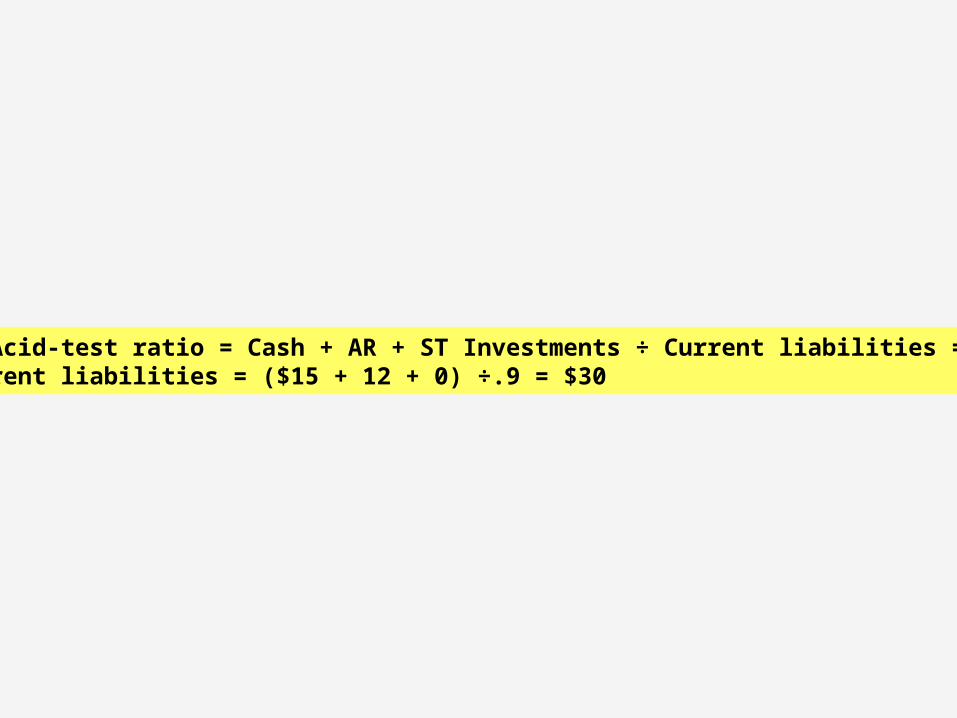
f. Acid-test ratio = Cash + AR + ST Investments ÷ Current liabilities = .9Current liabilities = ($15 + 12 + 0) ÷.9 = $30

Balance Sheet
Assets
Cash $15,000 given
Accounts receivable (net) 12,000 (e)
Inventory 30,000 (d)
Prepaid expenses and other current assets
Current assets
Property, plant, and equipment (net)
$200,000 (b)
Liabilities and Shareholders’ Equity
Accounts payable
Short-term notes 5,000 given
Current liabilities 30,000 (f)
Bonds payable
Shareholders’ equity
$200,000 (b)
Income Statement
Sales $300,000 (a)
Cost of goods sold -180,000 (c)
Gross profit 120,000 (c)
Operating expenses
Interest expense
Tax expense
Net income $15,000 given

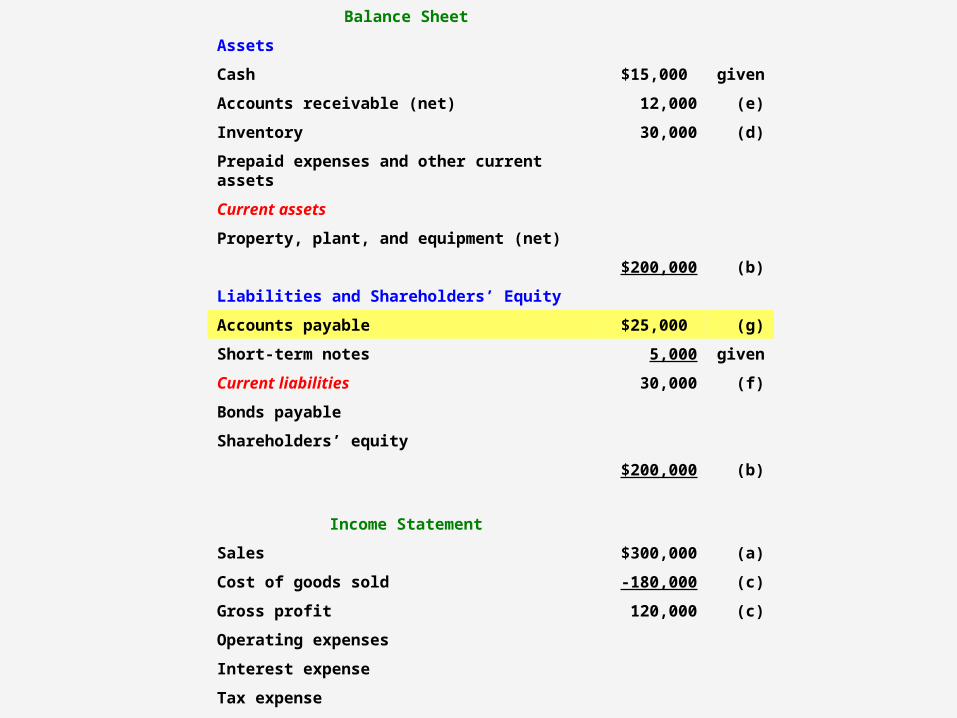
g. Accounts payable = Current liabilities – Short-term notes = $30 – 5 = $25
Balance Sheet
Assets
Cash $15,000 given
Accounts receivable (net) 12,000 (e)
Inventory 30,000 (d)
Prepaid expenses and other current assets
Current assets
Property, plant, and equipment (net)
$200,000 (b)
Liabilities and Shareholders’ Equity
Accounts payable $25,000 (g)
Short-term notes 5,000 given
Current liabilities 30,000 (f)
Bonds payable
Shareholders’ equity
$200,000 (b)
Income Statement
Sales $300,000 (a)
Cost of goods sold -180,000 (c)
Gross profit 120,000 (c)
Operating expenses
Interest expense
Tax expense
Net income $15,000 given
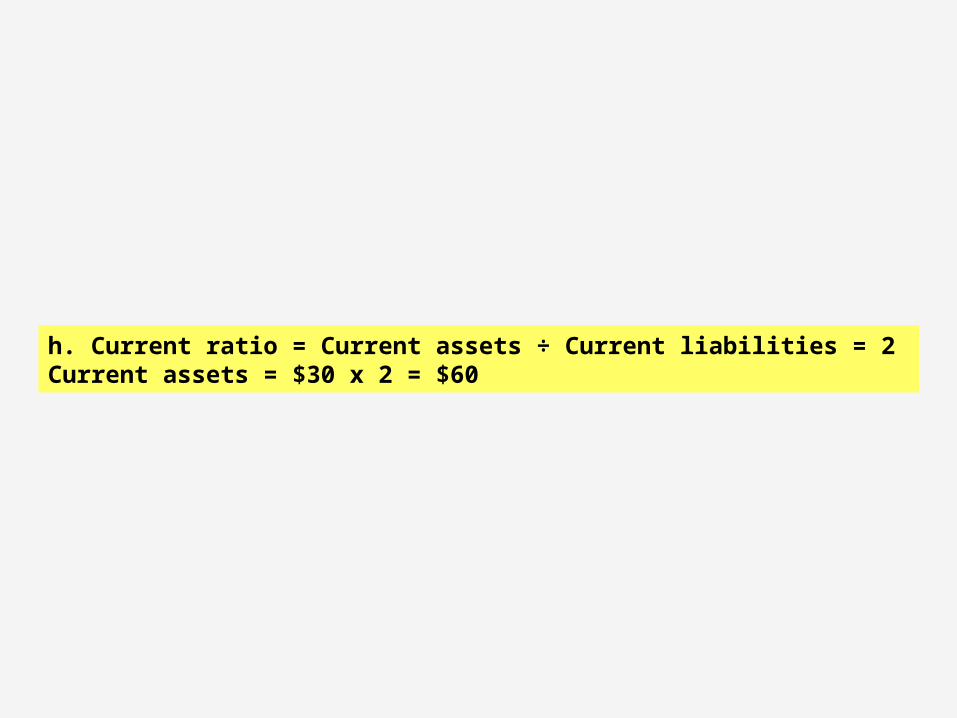
h. Current ratio = Current assets ÷ Current liabilities = 2Current assets = $30 x 2 = $60

Balance Sheet
Assets
Cash $15,000 given
Accounts receivable (net) 12,000 (e)
Inventory 30,000 (d)
Prepaid expenses and other current assets
Current assets 60,000 (h)
Property, plant, and equipment (net)
$200,000 (b)
Liabilities and Shareholders’ Equity
Accounts payable $25,000 (g)
Short-term notes 5,000 given
Current liabilities 30,000 (f)
Bonds payable
Shareholders’ equity
$200,000 (b)
Income Statement
Sales $300,000 (a)
Cost of goods sold -180,000 (c)
Gross profit 120,000 (c)
Operating expenses
Interest expense
Tax expense
Net income $15,000 given

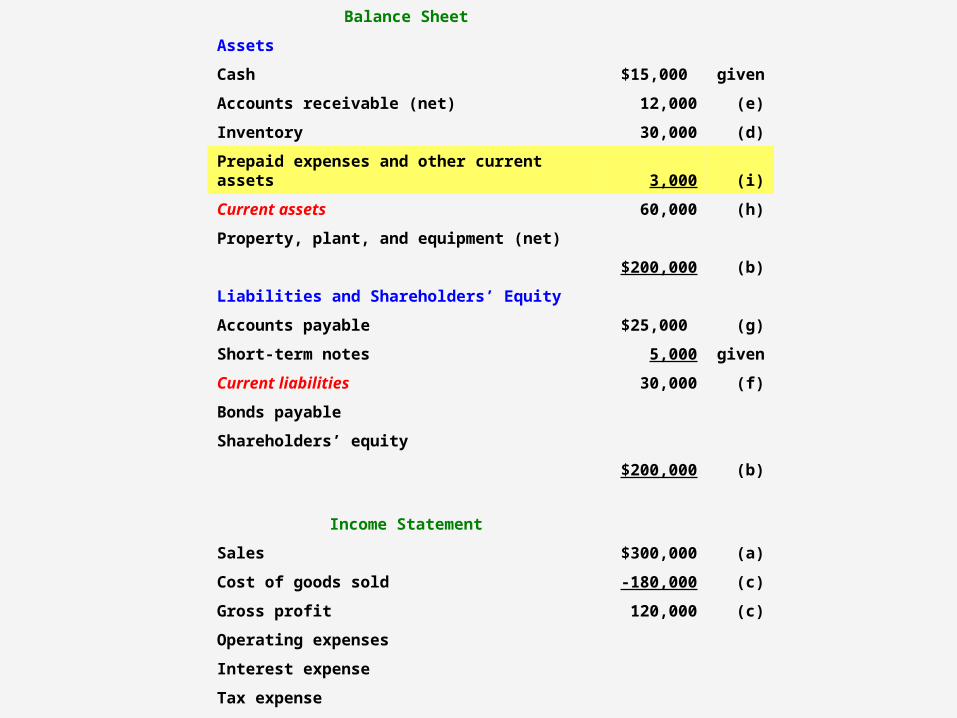
i. Prepaid expenses and other current assets = Current assets – (Cash + AR + Inventory) = $60 – ($15 + 12 + 30) = $3
Balance Sheet
Assets
Cash $15,000 given
Accounts receivable (net) 12,000 (e)
Inventory 30,000 (d)
Prepaid expenses and other current assets 3,000 (i)
Current assets 60,000 (h)
Property, plant, and equipment (net)
$200,000 (b)
Liabilities and Shareholders’ Equity
Accounts payable $25,000 (g)
Short-term notes 5,000 given
Current liabilities 30,000 (f)
Bonds payable
Shareholders’ equity
$200,000 (b)
Income Statement
Sales $300,000 (a)
Cost of goods sold -180,000 (c)
Gross profit 120,000 (c)
Operating expenses
Interest expense
Tax expense
Net income $15,000 given

j. Property, plant, and equipment = Total assets – Current assets = $200 – 60 = $140

Balance Sheet
Assets
Cash $15,000 given
Accounts receivable (net) 12,000 (e)
Inventory 30,000 (d)
Prepaid expenses and other current assets 3,000 (i)
Current assets 60,000 (h)
Property, plant, and equipment (net) 140,000 (j)
$200,000 (b)
Liabilities and Shareholders’ Equity
Accounts payable $25,000 (g)
Short-term notes 5,000 given
Current liabilities 30,000 (f)
Bonds payable
Shareholders’ equity
$200,000 (b)
Income Statement
Sales $300,000 (a)
Cost of goods sold -180,000 (c)
Gross profit 120,000 (c)
Operating expenses
Interest expense
Tax expense
Net income $15,000 given
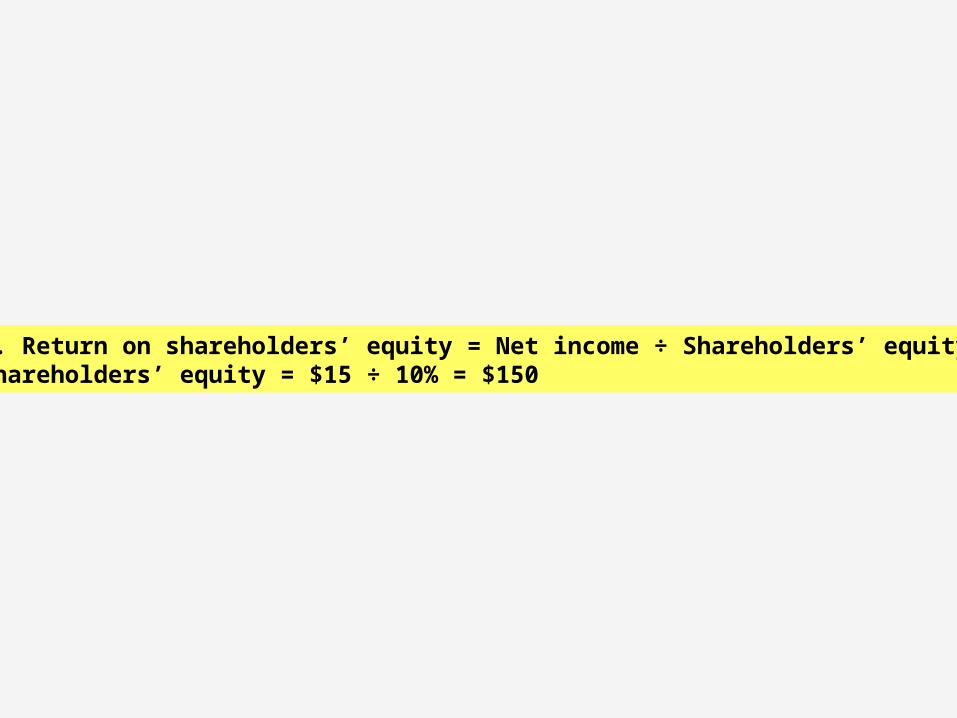
k. Return on shareholders’ equity = Net income ÷ Shareholders’ equity =10%Shareholders’ equity = $15 ÷ 10% = $150

Balance Sheet
Assets
Cash $15,000 given
Accounts receivable (net) 12,000 (e)
Inventory 30,000 (d)
Prepaid expenses and other current assets 3,000 (i)
Current assets 60,000 (h)
Property, plant, and equipment (net) 140,000 (j)
$200,000 (b)
Liabilities and Shareholders’ Equity
Accounts payable $25,000 (g)
Short-term notes 5,000 given
Current liabilities 30,000 (f)
Bonds payable
Shareholders’ equity 150,000 (k)
$200,000 (b)
Income Statement
Sales $300,000 (a)
Cost of goods sold -180,000 (c)
Gross profit 120,000 (c)
Operating expenses
Interest expense
Tax expense
Net income $15,000 given

l. Debt to equity ratio = Total liabilities ÷ Shareholders’ equity = 1/3 Total liabilities = $150 x 1/3 = $50
Bonds payable = Total liabilities - Current liabilities = $50 - 30 = $20

Balance Sheet
Assets
Cash $15,000 given
Accounts receivable (net) 12,000 (e)
Inventory 30,000 (d)
Prepaid expenses and other current assets 3,000 (i)
Current assets 60,000 (h)
Property, plant, and equipment (net) 140,000 (j)
$200,000 (b)
Liabilities and Shareholders’ Equity
Accounts payable $25,000 (g)
Short-term notes 5,000 given
Current liabilities 30,000 (f)
Bonds payable 20,000 (l)
Shareholders’ equity 150,000 (k)
$200,000 (b)
Income Statement
Sales $300,000 (a)
Cost of goods sold -180,000 (c)
Gross profit 120,000 (c)
Operating expenses
Interest expense
Tax expense
Net income $15,000 given
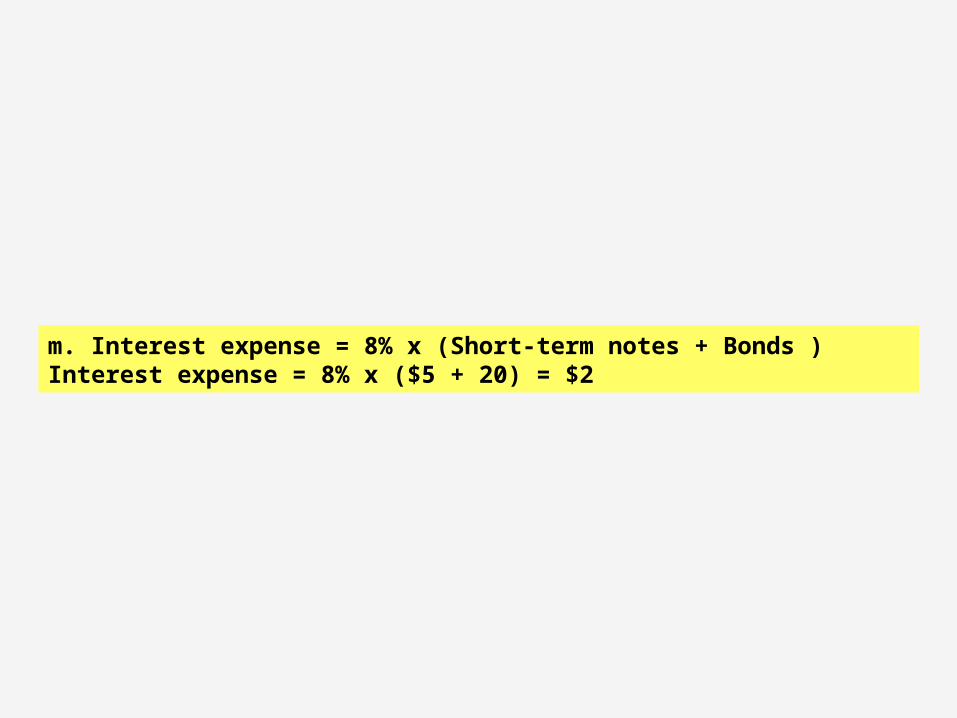
m. Interest expense = 8% x (Short-term notes + Bonds )Interest expense = 8% x ($5 + 20) = $2

Balance Sheet
Assets
Cash $15,000 given
Accounts receivable (net) 12,000 (e)
Inventory 30,000 (d)
Prepaid expenses and other current assets 3,000 (i)
Current assets 60,000 (h)
Property, plant, and equipment (net) 140,000 (j)
$200,000 (b)
Liabilities and Shareholders’ Equity
Accounts payable $25,000 (g)
Short-term notes 5,000 given
Current liabilities 30,000 (f)
Bonds payable 20,000 (l)
Shareholders’ equity 150,000 (k)
$200,000 (b)
Income Statement
Sales $300,000 (a)
Cost of goods sold -180,000 (c)
Gross profit 120,000 (c)
Operating expenses
Interest expense -2,000 (m)
Tax expense
Net income $15,000 given
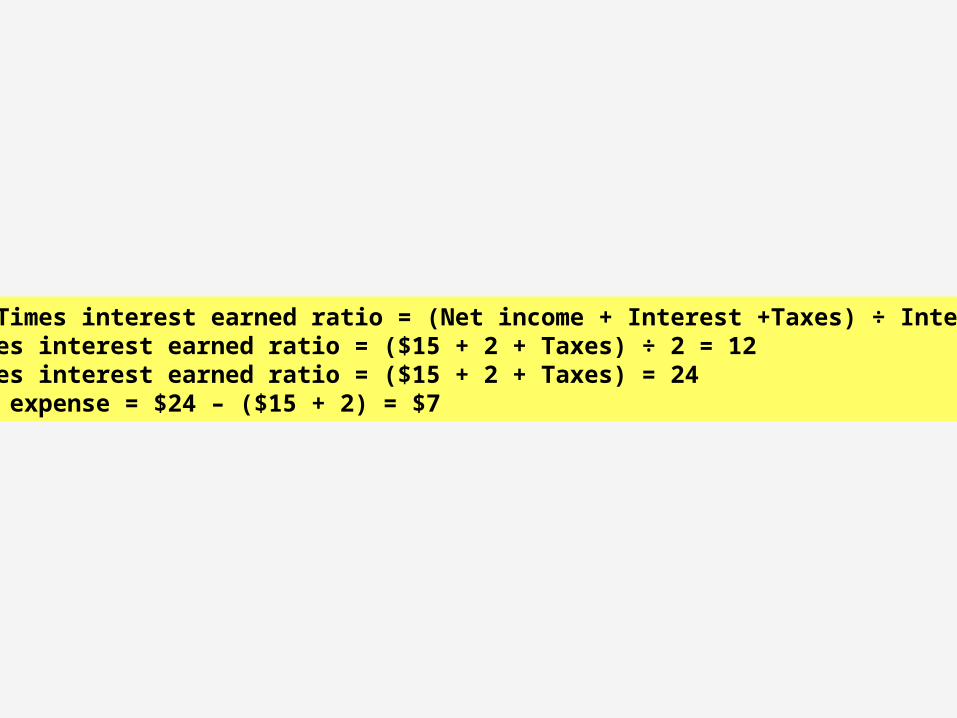
n. Times interest earned ratio = (Net income + Interest +Taxes) ÷ Interest = 12Times interest earned ratio = ($15 + 2 + Taxes) ÷ 2 = 12Times interest earned ratio = ($15 + 2 + Taxes) = 24Tax expense = $24 – ($15 + 2) = $7

Balance Sheet
Assets
Cash $15,000 given
Accounts receivable (net) 12,000 (e)
Inventory 30,000 (d)
Prepaid expenses and other current assets 3,000 (i)
Current assets 60,000 (h)
Property, plant, and equipment (net) 140,000 (j)
$200,000 (b)
Liabilities and Shareholders’ Equity
Accounts payable $25,000 (g)
Short-term notes 5,000 given
Current liabilities 30,000 (f)
Bonds payable 20,000 (l)
Shareholders’ equity 150,000 (k)
$200,000 (b)
Income Statement
Sales $300,000 (a)
Cost of goods sold -180,000 (c)
Gross profit 120,000 (c)
Operating expenses
Interest expense -2,000 (m)
Tax expense -7,000 (n)
Net income $15,000 given

o. Operating expenses = (Sales – Cost of goods sold – Interest expense – Tax expense) – Net income = ($300 - 180 - 2 - 7) - 15 = $96

Balance Sheet
Assets
Cash $15,000 given
Accounts receivable (net) 12,000 (e)
Inventory 30,000 (d)
Prepaid expenses and other current assets 3,000 (i)
Current assets 60,000 (h)
Property, plant, and equipment (net) 140,000 (j)
$200,000 (b)
Liabilities and Shareholders’ Equity
Accounts payable $25,000 (g)
Short-term notes 5,000 given
Current liabilities 30,000 (f)
Bonds payable 20,000 (l)
Shareholders’ equity 150,000 (k)
$200,000 (b)
Income Statement
Sales $300,000 (a)
Cost of goods sold -180,000 (c)
Gross profit 120,000 (c)
Operating expenses -96,000 (o)
Interest expense -2,000 (m)
Tax expense -7,000 (n)
Net income $15,000 given
SEARS (B) CASE
My first approach was to analyze SEARS’ most recent two annual income statements horizontally and vertically. The raw data came from EDGARSCAN, and then I did the analyses in an Excel spreadsheet, which I have pasted in here for convenience of presentation.
The horizontal (trend) analysis (see below) is simply the percentage change in income statement items from 2000 to 2001.

(dollars in millions) SEARS SEARS Horizontal
2001 2000 2001/2000
REVENUES
Merchandise sales and services $35,843 $36,366 -1.40%
Credit and financial products revenues 5,235 4,571 14.50%
Total revenues 41,078 40,937 0.30%
COSTS AND EXPENSES
Cost of sales, buying and occupancy 26,322 26,721 -1.50%
Selling and administrative 8,892 8,807 1.00%
Provision for uncollectible accounts 1,344 884 52.00%
Provision for previously securitized receivables 522 --
Depreciation and amortization 863 839 2.90%
Interest 1,415 1,248 13.40%
Special charges and impairments 542 251 115.90%
Total costs and expenses 39,900 38,750 3.00%
Operating income 1,178 2,187 -46.10%
Other income, net 45 36 25.00%
Income before income taxes and minority interest 1,223 2,223 -45.00%
Income taxes 467 831 -43.80%
Minority interest 21 49 -57.10%
NET INCOME $735 $1,343 -45.30%
EARNINGS PER COMMON SHARE $2 $3.89 -42.20%

Next, let’s look at the SEARS vertical analysis (see below) in which income statement elements are common-sized as a % of sales revenue. This allows comparisons without the influence of variations of sales volume. Notice that there are two types of revenues; therefore, there are different ways to do this analysis.

(dollars in millions) Vertical Vertical Vertical Vertical
2001 2000 2001 2000
REVENUES
Merchandise sales and services --- --- 100.00% 100.00%
Credit and financial products revenues --- --- 14.60% 12.60%
Total revenues 100.00% 100.00% 114.60% 112.60%
COSTS AND EXPENSES
Cost of sales, buying and occupancy 64.10% 65.30% 73.40% 73.50%
Selling and administrative 21.60% 21.50% 24.80% 24.20%
Provision for uncollectible accounts 3.30% 2.20% 3.70% 2.40%
Provision for previously securitized receivables 1.30% --- 1.50% ---
Depreciation and amortization 2.10% 2.00% 2.40% 2.30%
Interest 3.40% 3.00% 3.90% 3.40%
Special charges and impairments 1.30% 0.60% 1.50% 0.70%
0.00% 0.00% 0.00% 0.00%
Total costs and expenses 97.10% 94.70% 111.30% 106.60%
Operating income 2.90% 5.30% 3.30% 6.00%
Other income, net 0.10% 0.10% 0.10% 0.10%
Income before income taxes and minority interest 3.00% 5.40% 3.40% 6.10%
Income taxes 1.10% 2.00% 1.30% 2.30%
Minority interest 0.10% 0.10% 0.10% 0.10%
NET INCOME 1.80% 3.30% 2.10% 3.70%

RATIOS AND BENCHMARKING AGAINST INDUSTRY
Growth Rates(%) SEARS Industry
Sales (MRQ) vs Qtr. 1 Yr. Ago 2.03 10.96
Sales (TTM) vs TTM 1 Yr. Ago 0.95 11.48
Sales - 5 Yr. Growth Rate 1.54 14.24
EPS (MRQ) vs Qtr. 1 Yr. Ago 85.99 16.25
EPS (TTM) vs TTM 1 Yr. Ago -28.45 5.63
EPS - 5 Yr. Growth Rate -6.45 17.52
Capital Spending - 5 Yr. Growth Rate -1.08 21.14

RATIOS AND BENCHMARKING AGAINST INDUSTRY
Profitability Ratios (%) SEARS Industry
Gross Margin (TTM) 36.71 25.11
Gross Margin - 5 Yr. Avg. 35.36 25.05
EBITD Margin (TTM) 8.52 8.01
EBITD - 5 Yr. Avg. 10.14 8.26
Operating Margin (TTM) 3.06 5.37
Operating Margin - 5 Yr. Avg. 4.75 5.68
Pre-Tax Margin (TTM) 3.36 5.26
Pre-Tax Margin - 5 Yr. Avg. 4.88 5.56
Net Profit Margin (TTM) 2.1 3.34
Net Profit Margin - 5 Yr. Avg. 2.96 3.48
Effective Tax Rate (TTM) 37.36 36.67
Effective Tax Rate - 5 Yr. Avg. 39.26 37.42

RATIOS AND BENCHMARKING AGAINST INDUSTRY
Management Effectiveness (%) SEARS Industry
Return On Assets (TTM) 2.08 7.67
Return On Assets - 5 Yr. Avg. 3.18 8.3
Return On Investment (TTM) 3.24 11.44
Return On Investment - 5 Yr. Avg. 5.24 12.26
Return On Equity (TTM) 14.36 18.84
Return On Equity - 5 Yr. Avg. 18.73 20.46

RATIOS AND BENCHMARKING AGAINST INDUSTRY
Efficiency SEARS Industry
Revenue/Employee (TTM) 133,090 176,805
Net Income/Employee (TTM) 2,797 6,660
Receivable Turnover (TTM) 1.63 12.86
Inventory Turnover (TTM) 4.7 6.39
Asset Turnover (TTM) 0.99 2.32
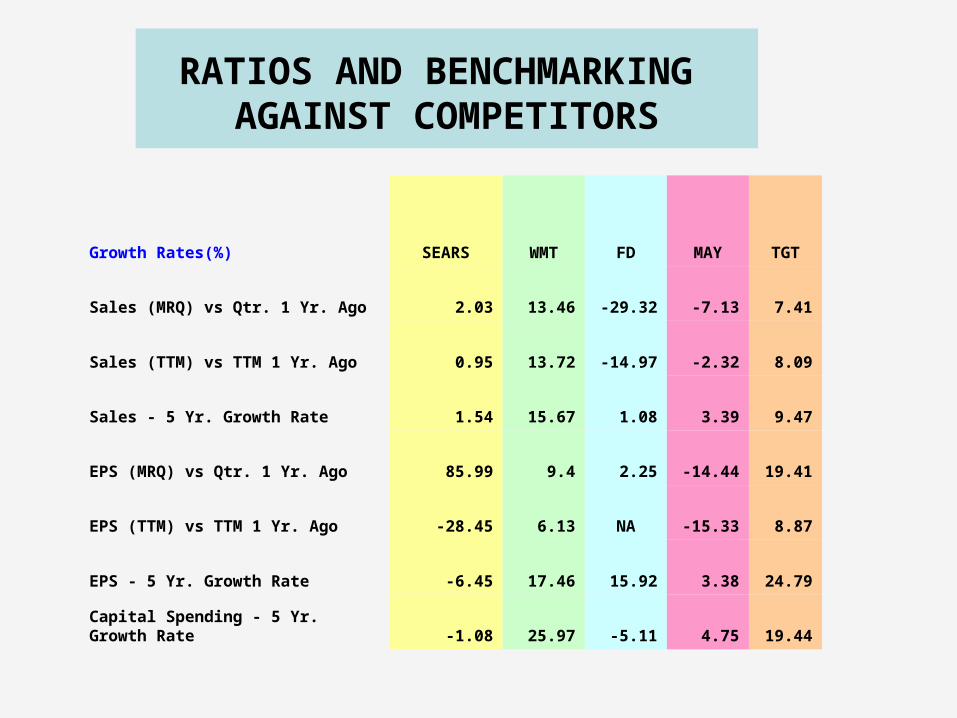
RATIOS AND BENCHMARKING AGAINST COMPETITORS
Growth Rates(%) SEARS WMT FD MAY TGT
Sales (MRQ) vs Qtr. 1 Yr. Ago 2.03 13.46 -29.32 -7.13 7.41
Sales (TTM) vs TTM 1 Yr. Ago 0.95 13.72 -14.97 -2.32 8.09
Sales - 5 Yr. Growth Rate 1.54 15.67 1.08 3.39 9.47
EPS (MRQ) vs Qtr. 1 Yr. Ago 85.99 9.4 2.25 -14.44 19.41
EPS (TTM) vs TTM 1 Yr. Ago -28.45 6.13 NA -15.33 8.87
EPS - 5 Yr. Growth Rate -6.45 17.46 15.92 3.38 24.79
Capital Spending - 5 Yr. Growth Rate -1.08 25.97 -5.11 4.75 19.44

RATIOS AND BENCHMARKING AGAINST COMPETITORS
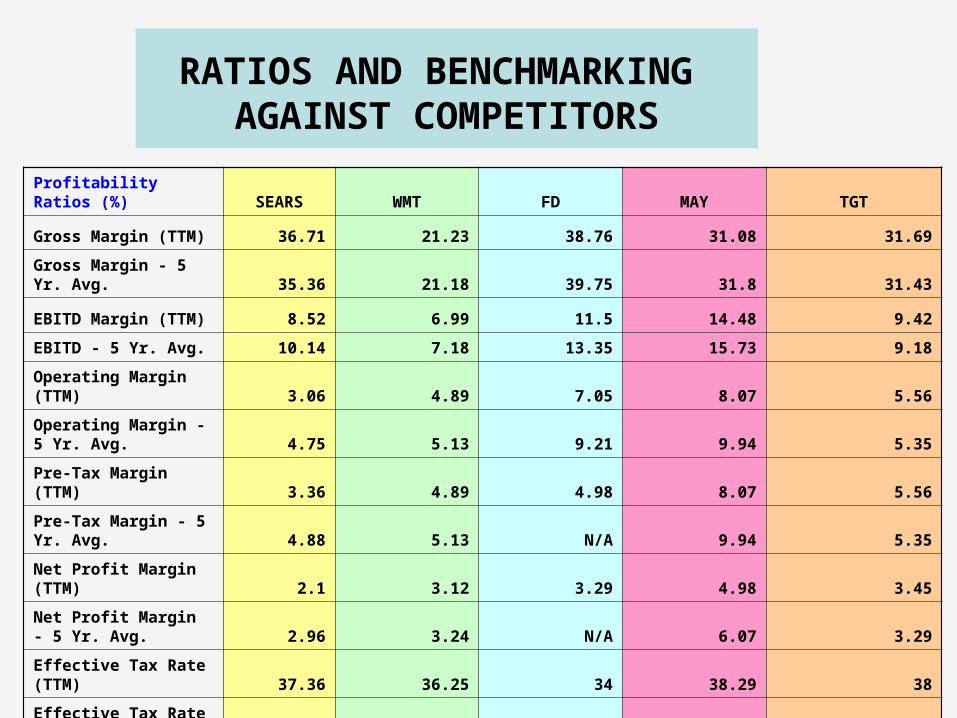
RATIOS AND BENCHMARKING AGAINST COMPETITORS
Profitability Ratios (%) SEARS WMT FD MAY TGT
Gross Margin (TTM) 36.71 21.23 38.76 31.08 31.69
Gross Margin - 5 Yr. Avg. 35.36 21.18 39.75 31.8 31.43
EBITD Margin (TTM) 8.52 6.99 11.5 14.48 9.42
EBITD - 5 Yr. Avg. 10.14 7.18 13.35 15.73 9.18
Operating Margin (TTM) 3.06 4.89 7.05 8.07 5.56
Operating Margin - 5 Yr. Avg. 4.75 5.13 9.21 9.94 5.35
Pre-Tax Margin (TTM) 3.36 4.89 4.98 8.07 5.56
Pre-Tax Margin - 5 Yr. Avg. 4.88 5.13 N/A 9.94 5.35
Net Profit Margin (TTM) 2.1 3.12 3.29 4.98 3.45
Net Profit Margin - 5 Yr. Avg. 2.96 3.24 N/A 6.07 3.29
Effective Tax Rate (TTM) 37.36 36.25 34 38.29 38
Effective Tax Rate - 5 Yr. Avg. 39.26 36.78 N/A 38.89 38.58

RATIOS AND BENCHMARKING AGAINST COMPETITORS
Management Effectiveness (%) SEARS WMT FD MAY TGT
Return On Assets (TTM) 2.08 8.34 3.17 5.91 6.3
Return On Assets - 5 Yr. Avg. 3.18 8.96 4.55 7.67 6.54
Return On Investment (TTM) 3.24 12.9 4.31 7.58 9.01
Return On Investment - 5 Yr. Avg. 5.24 13.58 6.01 9.58 9.64
Return On Equity (TTM) 14.36 20.12 9.04 17.84 19.47
Return On Equity - 5 Yr. Avg. 18.73 21.6 11.98 20.83 20.34

RATIOS AND BENCHMARKING AGAINST COMPETITORS
Efficiency SEARS WMT FD MAY TGT
Revenue/Employee (TTM) 133,090 158,939 136,096 225,000 142,457
Net Income/Employee (TTM) 2,797 4,956 4,504 11,206 4,907
Receivable Turnover (TTM) 1.63 122.81 5.12 7.56 16.69
Inventory Turnover (TTM) 4.7 7.31 2.4 3.05 5.88
Asset Turnover (TTM) 0.99 2.68 0.96 1.19 1.83


![Financial statements March 31, 2020€¦ · Prepaid expenses 25,044 21,483 Total current assets 494,615 419,205 Loans receivable 2,372 2,722 Capital assets, net [note 4 ] 1,324,630](https://static.documents.pub/doc/80x56/607c02c930cb8348b5282765/financial-statements-march-31-2020-prepaid-expenses-25044-21483-total-current.jpg)


