Case Depth in SAE 1020 Steel Using Barkhausen Noise
Alessandra Drehmer, Gunther J. L. Gerhardt, Frank P. Missell*
Centro de Ciências Exatas e Tecnologia – CCET, Universidade de Caxias do Sul – UCS, Cidade Universitária/Bloco V, CEP 95070-560, Caxias do Sul, RS, Brazil
Received: December 4, 2012; Revised: February 6, 2013
The most widely used thermochemical process for surface hardening of steels is case hardening. Using several different heat treatments, martensitic surface layers were formed on SAE 1020 steel into which carbon had been diffused. Case depths were measured by traditional destructive techniques. Barkhausen noise measurements were made and both the RMS Barkhausen pulse envelope and the fast Fourier transform (FFT) were obtained from numerical calculation. The FFT amplitudes, functions of frequency, were associated with distance from the sample surface using the skin depth equation d = 1/ (pfsm)½ , where f is the frequency of the electromagnetic wave, s is the electrical conductivity, and μ is the magnetic permeability. We define a normalized power index (NPI) which can be used to estimate case depths. The NPI is discussed in relation to the sample microstructure and it is shown that the case depth is most easily determined when the magnetic properties of the surface layer and core are substantially different.
Keywords: case depth, SAE 1020 steel, Barkhausen noise, frequency spectrum
1. IntroductionIt is well known1 that hardened layers can be used on
the surface of steel components to provide greater wear resistance. The most widely used thermochemical process for surface hardening of steels is carburizing or case hardening2, in which carbon is diffused into austenite, after which an appropriate heat treatment is realized to develop the desired microstructure. A major benefit of carburizing is the introduction of compressive residual stresses into the surfaces of carburized parts. These stresses counteract applied tensile stresses and therefore improve bending fatigue performance. An estimate of the thickness of the hardened layer on the surface of a steel is important for ensuring the quality of parts by means of a greater control over the thermal processing. In addition, a measurement of the case depth on a part is important for planning a reworking of the part. Various destructive methods for measuring case depth are outlined in SAE specification J4233. Since steels are ferromagnetic, magnetic techniques are frequently used for their non-destructive evaluation4.
Barkhausen noise (BN) measurements were employed for case depth determination by Bach et al.5 who related the ratio between the two BN amplitudes to the thickness of the hardened layer. Since it is not always possible to obtain BN signals both from the surface and the core of the sample, Dubois and Fiset6, using BN measurements up to 200 kHz, evaluated the thickness of a modified surface layer of steel via a correlation between the thickness and the integrated frequency spectrum of BN. These works were criticized by Vaidyanathan et al.7 for not considering the variations in the microstructure of the hardened layer. Lo et al.8 employed a hysteretic-stochastic model to
extract case depths from relatively high frequency data (10-100 kHz). A patent by Stresstech workers9 also suggests the use of BN signal integration over a frequency interval as an interesting approach. The patent emphasizes the use of ultra-low frequencies (100-1000 Hz) and the use of not too high magnetic fields to eliminate, as far as possible, noise associated with the hard outer layer. The use of low frequencies is an especially important consideration since the penetration of an electromagnetic wave into a metal is governed by the classical skin depth equation d = 1/ (pfsm)½ , where the penetration depth10, or skin depth d, is related to the frequency f of the electromagnetic wave, the electrical conductivity of the metal s, as well as its magnetic permeability m. A recent paper by Lo11 employed the hysteretic-stochastic model with power spectrum measurements at lower frequencies (1-100 kHz) to extract case depths from oxidized Ni
97Al
3 and carburized steel. An
investigation of frequency domain information was recently made by Mironenko et al.12.
The intent of this paper is to use frequency domain information from Fourier transforms of BN data to estimate the case depth of carburized material. Results are presented for carburized samples with different microstructures, which illustrate the importance of differences between the magnetic properties of the surface layer and core.
2. Experiment
2.1. Sample fabrication
The measurements presented here were performed on modified low-carbon SAE 1020 steel. Several blocks of this steel were normalized at 870 °C for 2 hours. The resulting
microstructure was a mixture of ferrite and pearlite with a Vickers hardness around HV 120. Magnetic measurements were made on toroids and showed a coercive field of about H
c = 700 A/m for this material.
Samples with a carbon-rich surface layer were produced at HardTec by diffusing carbon into the steel for different lengths of time, using a Durferit NaCN-based liquid. After heating for short times ( ~10 min) at 870 °C, the material was quenched into water. The resulting samples (for example, samples 9410, 9420, and 9520) had a hard exterior due to the presence of martensite (with some retained austenite) over the soft core which still presented a microstructure of ferrite/pearlite. This procedure was used in order to maintain the greatest difference possible between the magnetic properties of the sample surface and core. Some materials were also heat treated at HardTec. For these materials (samples 9210 and 9230), the core microstructure presented some martensite and bainite, the core was harder and the coercive field was higher.
2.2. Hardness profiles
The microhardness profiles of the samples were determined in the classical (destructive) manner. In our case, a Shimadzu microhardness tester, model HMV2, was used with an indenter load of 300 g. Hardness profiles were obtained along several sample directions to test the uniformity of the hardened layer. An example of the profiles obtained is shown in Figure 1 for sample 9520.
The measured hardness profile can be mathematically described13 by
11 2
2
ty c erfc c − l
= + l (1)
In Equation 1 the hardness y is given as a function of the distance t from the surface. The core hardness is c
2, while
the surface hardness is 2c1 + c
2. The transition midpoint
is given by l1, while the transition width is l
2. erfc(z) is
the complementary error function. Since the hardness measurements were carried beyond the transition, it was possible to estimate values for c
1 and c
2 from the data. Then
the Excel Solver routine was used to find the best values for the whole set of parameters l
1, l
2, c
1, and c
2. An example
of the measured hardness profiles and their mathematical description can be found in Figure 1. The following Table 1 shows values of l
1, l
2, c
1, and c
2 for the samples studied here.
We note that the hardness of the sample core was a good indicator of the microstructure and the coercive field value. Values of the hardness below about 200 HV always corresponded to a ferrite plus pearlite microstructure and a low value (600-800 A/m) for the coercive field H
c. See
Figure 2. Dn the other hand, hardness values of 400 HV or above were associated with a low-carbon martensitic microstructure14 and coercive field values above 1000 A/m.
2.3. Magnetic and Barkhausen noise measurements
Hysteresis loops were determined for our samples (approximately toroidal in shape) at f = 0.2 Hz using a Globalmag hysteresis loop tracer. The magnetic permeability was then determined by numerical differentiation. Average permeability values could be calculated, but the values
depended on the magnetic field range used for calculating the average. For sample 9520, for example, m
r = 215-380.
The relative permeability μr was then used for estimating
the skin depth. We note that Lo8,11 used much lower values for the relative permeability, obtained by a curve fitting procedure. However, since Lo gave no information about his samples of low carbon steel, we cannot comment further on his work. We just note that the relative permeability value is one of the largest sources of uncertainty in determining the skin depth.
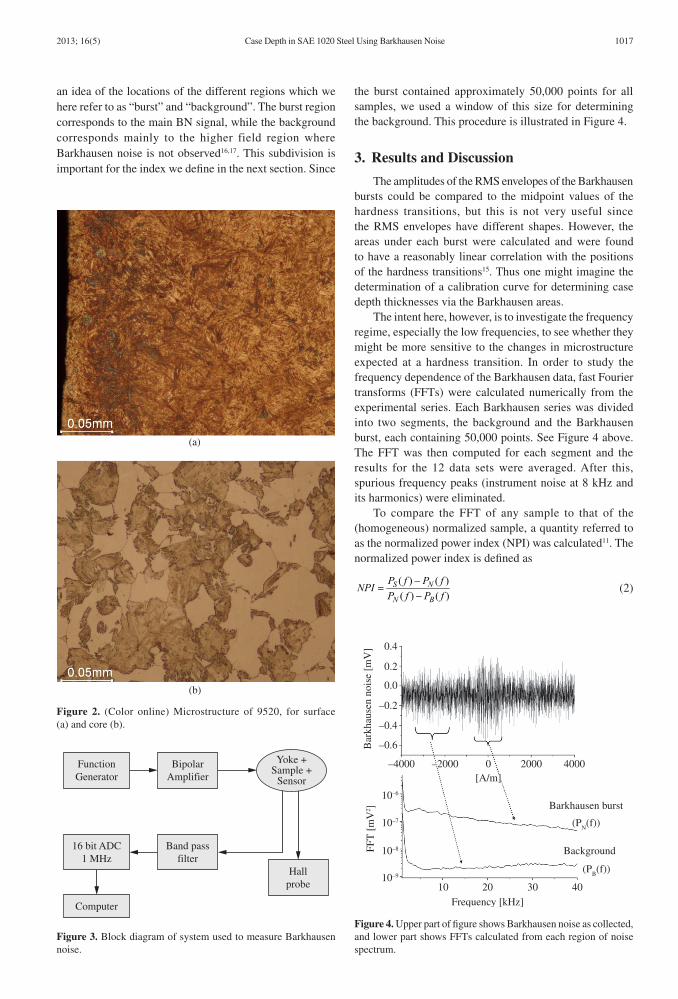
The system for measuring Barkhausen noise15 is shown in Figure 3. A function generator (Stanford Research Systems DS345) produced a triangular signal at a low frequency, typically 1 Hz. This signal drove a bipolar amplifier (Kepco BDP 36-6M) which in turn drove a MnZn yoke (240 turns of 28 AWG Cu wire) which magnetized the sample (paralelapiped with longest dimension 3 cm) to about 4000 A/m. The magnetic field at the sample surface was measured with a Hall probe (Lakeshore Cryotronics 475 DSP). Barkhausen noise was captured by a MnZn cylinder wrapped with 400 turns of 42 AWG Cu wire, the sensor. The noise signal was filtered and amplified with a band pass filter (Stanford Research Systems SR640) whose frequency limits were typically set at 300 Hz-60 kHz. Twelve data sets, consisting of a single Barkhausen burst, were collected for each sample, usually at 250,000 samples per second, with a data acquisition board (IDTech 16 bit ADC 1 MHz) and stored in a computer for further analysis.
For each sample, 12 data sets were collected. The RMS envelopes of the Barkhausen bursts were obtained with a moving window of 1000 points which was moved successively by 10 points. This procedure allowed us to determine the signal amplitudes and was used to obtain
Table 1. Parameters describing the hardness transitions of the samples studied.
Sample l1 l2 c1 c2
9230 0.67 0.57 255 375
9340 0.71 0.39 335 210
9410 0.34 0.58 420 218
9420 0.46 0.34 296 240
9520 0.53 0.32 290 280
Figure 1. Experimental hardness profile for 9520 and a curve calculated using Equation 1.
1016 Materials Research
Case Depth in SAE 1020 Steel Using Barkhausen Noise
the burst contained approximately 50,000 points for all samples, we used a window of this size for determining the background. This procedure is illustrated in Figure 4.
3. Results and Discussion
The amplitudes of the RMS envelopes of the Barkhausen bursts could be compared to the midpoint values of the hardness transitions, but this is not very useful since the RMS envelopes have different shapes. However, the areas under each burst were calculated and were found to have a reasonably linear correlation with the positions of the hardness transitions15. Thus one might imagine the determination of a calibration curve for determining case depth thicknesses via the Barkhausen areas.
The intent here, however, is to investigate the frequency regime, especially the low frequencies, to see whether they might be more sensitive to the changes in microstructure expected at a hardness transition. In order to study the frequency dependence of the Barkhausen data, fast Fourier transforms (FFTs) were calculated numerically from the experimental series. Each Barkhausen series was divided into two segments, the background and the Barkhausen burst, each containing 50,000 points. See Figure 4 above. The FFT was then computed for each segment and the results for the 12 data sets were averaged. After this, spurious frequency peaks (instrument noise at 8 kHz and its harmonics) were eliminated.
To compare the FFT of any sample to that of the (homogeneous) normalized sample, a quantity referred to as the normalized power index (NPI) was calculated11. The normalized power index is defined as
( ) ( )( ) ( )
S N
N B
P f P fNPI
P f P f−
=−
(2)
Figure 2. (Color online) Microstructure of 9520, for surface (a) and core (b).
Figure 3. Block diagram of system used to measure Barkhausen noise.
Figure 4. Upper part of figure shows Barkhausen noise as collected, and lower part shows FFTs calculated from each region of noise spectrum.
an idea of the locations of the different regions which we here refer to as “burst” and “background”. The burst region corresponds to the main BN signal, while the background corresponds mainly to the higher field region where Barkhausen noise is not observed16,17. This subdivision is important for the index we define in the next section. Since
2013; 16(5) 1017
Drehmer et al.
where PS(f), P
N(f), and P
B(f), calculated at 1 kHz intervals,
are associated with the case-hardened sample, the normalized sample, and the background. A similar quantity was used by Lo11. The NPI is nothing more than an empirical way to emphasize structure in the FFT. For a normalized sample, the NPI, as defined, is equal to zero. A spatially inhomogeneous microstructure might lead to structure in the FFT and this structure would be more visible in the NPI.
The NPI is shown as a function of frequency in Figure 5 for several samples. The upper curve corresponding to the core of a sample (9520) does not show any structure, as one would expect, since it is homogeneous, although not equal to the normalized sample. The five curves corresponding to case-hardened samples show structure in the NPI. We note there is a small peak in each curve corresponding to the frequency range 30-40 kHz. This peak is associated with decarburization of the sample and will be discussed further in relation to Figure 6.
Following Lo, one might try to transform the frequency values on top of Figure 5 into a length scale, to estimate the case-depth11. Dne way that suggests itself is via the skin depth equation. In the case of a multi component sample, values of the parameters to be used should be chosen with care.
Although we expect the conductivity to be relatively independent of frequency at these low frequencies, the magnetic permeability is another matter. To construct the bottom scale on Figure 5, we used a relative permeability m
r = 223, which represents an average over the field interval
considered. The maximum (relative) permeability for these samples was measured to be around 800. Using the classical skin depth equation, the values of the skin depth were obtained as a function of frequency and placed on the bottom horizontal axis, giving us an idea of how the NPI varies with distance into the sample. These considerations indicate why the case depths of this work can only be considered as estimates.
This exercise revealed that the small peaks in the NPI for the frequency range 30-40 kHz correspond to the sample surface or the near surface. The curves of NPI vs. skin depth for the other samples reveal different amounts of structure. In the case of sample 9410, there is quite clearly a break in the NPI curve which could very well be the hardness transition. The numbers to the right of the curves are the Vickers hardness values of the core. For the other curves in that figure, it becomes increasingly more difficult to see structure in the NPI curve (which would indicate the hardness transition) as the hardness increases. That is, as the microstructure of the core approaches that of the surface layer, the magnetic probe has greater difficulty in distinguishing the two.
To emphasize again the importance of the core hardness values, Figure 6 shows the decarburized surface regions of samples 9410 and 9210. Both have the midpoint of the hardness transition around 0.33 mm, but the core of 9410 consists of ferrite/perlite and is, therefore, easily distinguished from the martensitic surface region.
Figure 6. (Color online) Micrographs for two samples. Decarburized regions are present at surface of both samples, but core hardness values are very different.
Figure 5. Normalized power index NPI vs frequency for several samples calculated from FFTs. The bottom scale (skin depth) relates the frequency dependent NPI to distance through the skin depth equation. Upper legend gives sample number and l
1 values for
the various curves. Numbers to the right of the curves are Vickers hardness values.
1018 Materials Research
Case Depth in SAE 1020 Steel Using Barkhausen Noise
4. ConclusionsBarkhausen measurements on SAE 1020 steel were used
to study case hardening. Samples were produced by diffusing carbon for various distances. Quenching after a short heat treatment resulted in a martensitic surface layer on top of a ferrite/pearlite core. Longer heat treatments resulted in core microstructures containing some low-carbon martensite. Case depths were measured by traditional destructive techniques. Barkhausen noise measurements were made and both the RMS Barkhausen pulse envelope and the fast Fourier transform (FFT) were obtained by numerical calculation.
The FFT amplitudes were obtained as a function of frequency, and were associated with distance from the sample surface via the classical skin depth equation. This ansatz furnished a length scale for Figure 5, which allows a case depth to be estimated from a normalized power index for a sample where the core consisted of ferrite/perlite. Increasing core hardness was associated with decreasing definition in the NPI and a decreasing usefulness of this technique to estimate case depths.
Many physical characteristics of the steel influence the BN and it is frequently difficult to specify those factors quantitatively. Nevertheless BN may be a very useful non-destructive evaluation technique. Absolute depth values depend on a proper evaluation of the magnetic permeability and other physical properties of the material. However, in a production line environment it is expected that those values should not vary greatly, so that sudden changes can be detected using the NPI. Thus, even requiring an initial destructive analysis for correct calibration, it can be expected that the NPI might be a useful measure for real time verification of production quality.
AcknowledgmentsThis work was supported by the Brazilian agencies
SCIT/RS and FAPERGS. FPM was partially supported by CNPq. The authors wish to thank R. Schwanke and F. Girotto for hardness profiles as well as G. Tonietto of HardTec for the case-hardened samples.
References1. Hutchings M. Tribology: Friction and Wear of Engineering
3. Society of Automotive Engineers. Methods of Measuring Case Depth J423 (revised 1983). SAE Handbook. 1990; 1.
4. Jiles DC. Review of magnetic methods for non-destructive evaluation. NDT International. 1988; 21 :311-319. http://dx.doi.org/10.1016/0308-9126(88)90189-7
5. Bach G, Goebbels K and Theiner WA. Characterization of hardening depth by Barkhausen noise measurement. Materials Evaluation. 1988; 46:1576-1580.
6. Dubois M and Fiset M. Evaluation of case depth on steels by Barkhausen noise measurement. Materials Science and Technology. 1995; 11:264-267. http://dx.doi.org/10.1179/026708395790164788
7. Vaidyanathan S, Moorthy V, Jayakumar T and Raj B. Evaluation of induction hardened case depth through microstructural characterization using magnetic Barkhausen emission techniques. Materials Science and Technology. 2000; 16:202-208. http://dx.doi.org/10.1179/026708300101507550
8. Lo CCH, Kinser ER and Jiles DC. Analysis of Barkhausen effect signals in surface-modified magnetic materials using a hysteretic-stochastic model. Journal of Applied Physics. 2006; 99:08B705.
9. Nummila K, Seppa H and Varpula T. Method for determining the hardening depth of steel. US Patent 7259555, 2007.
10. Jackson JD. Classical Electrodynamics. 3rd ed. New York: Wiley; 2007.
11. Lo CCH. Depth profiling of magnetic properties of surface modified materials by model-assisted multi-frequency analysis of Barkhausen effect signals. Journal of Applied Physics. 2008; 103:07E918.
12. Mironenko I, Szielasko K, Kiselmann I, Koop H, Koop M, Altpeter I et al. Wideband micromagnetic multi-parameter materials characterization with 3MA. In: Proceedings of the 9th International Conference on Barkhausen Noise and Micromagnetic Testing; 2011, Hejnice, Czech Republic. Hejnice; 2011.
13. Zhang C, Bowler N and Lo C. Magnetic characterization of surface-hardened steel. Journal of Magnetism and Magnetic Materials. 2009; 321:3878-3887. http://dx.doi.org/10.1016/j.jmmm.2009.07.065
14. Parrish G. The Influence of Microstructure on the Properties of Case-Carburized Components. American Society for Metals; 1980.
15. Drehmer A, Gerhardt GJL and Missell FP. Case depth determination using Barkhausen noise. In: Proceedings of the 17th International Workshop on Electromagnetic Nondestructive Testing; 2012; Rio de Janeiro. Rio de Janeiro; 2012.
16. Baiotto R, Gerhardt G, Fukuhara M, Yonamine T and Missell FP. Barkhausen noise and magnetic properties of plastically deformed silicon steels. IEEE Transactions on Magnetics. 2010; 46:294-297. http://dx.doi.org/10.1109/TMAG.2009.2032859
17. Rodrigues-Junior DL, Silveira JRF, Gerhardt GJL, Missell FP, Landgraf FJG, Machado R et al. Effect of plastic deformation on the excess loss of electrical steel. IEEE Transactions on Magnetics. 2012; 48:1425-1428. http://dx.doi.org/10.1109/TMAG.2011.2174214