Studia i Analizy Studies & Analyses Centrum Analiz Społeczno – Ekonomicznych Center for Social and Economic Research 2 5 8 Michał Brzozowski Exchange Rate Variability and Foreign Direct Investment – Consequences of EMU Enlargement Warsaw, November 2003
Transcript
S t u d i a i A n a l i z y S t u d i e s & A n a l y s e s
C e n t r u m A n a l i z S p o ł e c z n o – E k o n o m i c z n y c h
C e n t e r f o r S o c i a l
a n d E c o n o m i c R e s e a r c h
2 5 8
Michał Brzozowski Exchange Rate Variability and Foreign Direct
Investment – Consequences of EMU Enlargement
W a r s a w , N o v e m b e r 2 0 0 3
Materials published here have a working paper character. They can be subject to further publica-tion. The views and opinions expressed here reflect the author(s) point of view and not necessarily those of the CASE. The paper was prepared within the research project entitled: Strategie przystąpienia do Europe-jskiej Unii Gospodarczej i Walutowej: analiza porównawcza możliwych scenariuszy (Strategies for Joining the European Economic and Monetary Union: a Comparative Analysis of Possible Scenar-ios) financed by the State Committee for Scientific Research. Keywords: foreign direct investment, exchange rate uncertainty and volatility, transition, euro adoption.
The aim of the paper is to analyze theoretically and empirically the likely impact of the reduction in exchange rate uncertainty, due to the EMU accession, on the intensity of FDI inflow into candidate countries. Theoretical models give an ambiguous picture of how exchange rate uncertainty and volatility affect direction and magnitude of FDI inflows. The main contribution of this paper is in finding that exchange rate uncertainty and volatility may negatively influence the decision to locate investment in transition and accession countries. Nominal exchange rate uncertainty seems to particularly hamper FDI inflows in accession countries. The key finding of this paper is that euro adoption is likely to exert a positive influence on FDI inflows in accession countries.
Studies & Analyses No. 258 – Exchange rate variability and foreign direct investment …
6
Introduction
It is widely recognized that technology transfer via foreign direct investment (FDI) has played an important role in the transformation of the formerly centrally planned economies of Central and Eastern Europe. The transition process of accession countries has been conditioned upon attracting inward FDI. In fact countries of Central and Eastern Europe encouraged an impressive number of foreign investors to locate their capital in privatized enterprises as well as in greenfield projects. The FDI inward stock in that region increased from 40.508 billion of US dollars in year 1995 to 160.352 billion in year 20011. Over the same period FDI inward stock increased in developing economies by a factor of 2.6 compared to a factor of 4 in Central and Eastern Europe and 3.5 in the eight accession countries (Czech Republic, Estonia, Hungary, Latvia, Lithuania, Poland, Slovakia and Slovenia).
Opening up of transition countries and the process of systemic reforms have been crucial to attracting FDI. In Central and Eastern Europe the prospect of EU memberships has contributed to the creation of a particularly favorable investment climate. Bevan and Estrin (2000) explored the impact of the announcements about EU membership for the transition economies on FDI flows. Based on information on FDI flows from 18 market economies to 11 transition economies2, over 1994-98 period, the econometric model estimation revealed that although announcements concerning EU membership were found not to influence a country's credit rating, they have affected FDI directly. Bevan and Estrin concluded that the admission to the European Union process has had the potential to be self-reinforcing by later improving the country’s credit rating and thus further stimulating foreign investment flows. In contrast, countries excluded from the EU, typically because of poor progress in transition have received lower levels of FDI because their country credit ratings have been poor. Hence the accession into the EU raises considerably the attractiveness of a country as a place where FDI is located.
The aim of this paper is to analyze theoretically and empirically the likely impact of the reduction in exchange rate uncertainty, due to the EMU accession, on the intensity of FDI inflow into candidate countries. EU enlargement is expected to bring about a reduction in risk associated with investments in entrant countries and to spur FDI inflow. Given monetary and fiscal policy constraints imposed in the first place by the EU membership, the reduction of exchange rate variability will be the main alteration of investment conditions in candidate countries after the EMU enlargement.
1 UNCTAD (2002) p. 313 2 It is noteworthy that the specification error consisting in omitting a relevant variable, i.e. a measure of progress in transi-tion, that potentially affects both foreign direct investment and EU accession negotiations calendar has been avoided. In order to identify the independent effects of EU announcements on FDI inflows into transition economies the authors in-clude two indicators of progress in transition - the extent and method of privatisation and the industrial sector share.
Studies & Analyses No. 258 Michał Brzozowski
7
For investors from EMU countries exchange rate uncertainty will be eliminated and therefore the strongest effect of euro adoption on FDI inflows should be expected in host accession countries that receive the bulk of long-term capital from the euro area. As Figure 1 illustrates the stock of FDI originated from the EMU members accounts for three fourths of the total FDI stock in half of the eight accession countries under investigation. The strong ties of the Baltic countries with Norway and Sweden explain why FDI stock from EMU members in the former group of countries represents a relatively small fraction of total inward FDI stock. Poland ranks in between due to noticeable direct investment inflow coming from the UK, Sweden, the US and the Republic of Korea.
Figure 1. FDI stock originated from EMU members(as a fraction of total inward FDI stock) in the eight accession countries in 2000
0
0,2
0,4
0,6
0,8
1
CzechRep.
Estonia Hungary Latvia Lithuania Poland Slovakia Slovenia
Source: Author’s calculations based on UNCTAD’s Division on Investment, Technology and Enterprise Development FDI
statistics.
The paper is structured as follows. Section 2 is devoted to the review of pertinent literature. I
deal in section 3 with theoretical and empirical dimensions of the distinction between exchange rate volatility and uncertainty. The main empirical results are presented in section 4. Finally, section 5 concludes.
1. Literature Survey
The theoretical as well as empirical research into the impact of exchange rate volatility on the flow of FDI is scarce. The existing theoretical literature can de divided among two strands, coping with the consequences of exchange rate volatility in different time horizons. Both approaches provide contradicting results regarding the sign of the relation between exchange rate volatility and FDI inflow.
Studies & Analyses No. 258 – Exchange rate variability and foreign direct investment …
8
1.1. Long-run production flexibility
The first approach focuses on the production flexibility argument expounded by Aizenman (1992), Darby et al. (1999), and Sung and Lapan (2000). In this type of models producers commit to domestic and foreign capacity ex ante and commit to employment decisions ex post, following the realization of a nominal or real shock. The assumption of ex post variable factors of production is more realistic for long horizon. Effects of exchange rate volatility will in this approach generally depend on sunk costs in capacity, competitive structure and the convexity of the profit function in prices.
The key outcome of Aizenman’s (1992) analysis is that a fixed exchange rate regime is more conducive to FDI relative to a flexible exchange rate, regardless of the type of shock hitting an economy. For the case of a monetary shocks, the concavity of the production function implies that nominal shocks will reduce expected profits under a flexible exchange rate regime. Fixed exchange rates are capable of isolating the level of employment and production from monetary shocks and are associated with higher expected profits. This in turn stimulates domestic investment and FDI. For real shocks, flexible exchange rates are associated with higher volatility of employment and with lower expected profits. This is due to the fact that a country experiencing a positive productivity shock will tend to experience nominal and real appreciation, which will mitigate the resultant employment expansion. In the fixed exchange rate system positive productivity shock leads to an increase in employment and in expected profits. Therefore in the presence of productivity shocks the flow of FDI will be larger in a fixed than in a flexible exchange rate system.
Darby et al. (1999) challenge the conventional wisdom of a negative impact of exchange rate uncertainty on investment. The model is an extended and adapted version of Dixit - Pindyck (1994) and they share the basic structure. Production costs are fixed in local currency and an investor has to incur a sunk entry cost as well as a sunk cost of exit. In face of uncertainty, firms often find it optimal to wait rather than to commit to a given production capacity. Waiting is a proper alternative to investing or not investing. The option value (invest now or later) then becomes part of the investment costs because, once an irreversible investment is made, the possibility of exercising this option to invest later on has been lost. Therefore the expected discounted value of the investment project has to be compared to the value of waiting, with the option of investing later.
At that stage the analysis leads to a conclusion of a negative relationship between exchange rate uncertainty and FDI. However Darby et al. assume that the firm’s discount rate is increasing in exchange rate volatility and the opportunity cost of waiting is a difference between the discount rate and the deviation of the exchange rate from its equilibrium path. In other words exchange rate volatility affects FDI in two opposite ways. On the one hand it depresses investment because the firm will only invest it the present value of the expected revenues is higher, by an amount equal to the value of waiting, than the entry sunk cost. On the other hand the opportunity cost of waiting
Studies & Analyses No. 258 Michał Brzozowski
9
raises with exchange rate volatility and hence boosts investment. Darby et al. establish parametric conditions under which the former or the latter mechanism will overwhelm, i.e. exchange rate volatility will reduce or increase foreign direct investment.
The model constructed by Sung and Lapan (2000) is also inspired by Dixit-Pindyck (1994) theory and FDI is viewed as an investment option that allows the firm to defer the decision as to where to produce. The cost of the option is the sunk cost associated with opening the second plant and its value is equal to extra profits earned if the firm opens the foreign plant instead of the home plant. As the variability of exchange rate increases, the firm may find it profitable to either open the foreign plant instead of the home plant or open both plants. In a deterministic setting the firm opens only one plant because each plant exhibits decreasing average cost. However under exchange rate uncertainty firms may wish to open more plants3 since such a strategy allows to channel the production abroad if the foreign currency depreciates.
As a consequence if sunk costs are relatively large but similar across plants, then for low exchange rate variability, only the home plant will be opened, for intermediate values, only the foreign plant will be opened, whereas for large exchange rate variability, both plants will be opened. If sunk costs are not too large (or are relatively different across plants), then for low exchange rate variability, only the home plant will be opened, whereas for larger values of exchange rate variability, both plants will be opened. The conclusion that exchange rate volatility boosts FDI is also supported if strategic dimension is added to the model, i.e. the multinational faces a local competitor.
1.2. Short-run risk aversion
The second approach, adopted by Cushman (1985), Goldberg and Kolstad (1995), and Bénassy-Quéré et al. (2001), focuses on risk aversion with no possibility of ex post adjustment of a variable productive factor. Exchange rate risk arises because of the time lag between investment and profits in foreign currency. Cushman (1985) analyzed the effects of real exchange rate risk and expectations on FDI for four different cases, depending on where inputs were purchased, where output was produced, where financial capital was acquired, and where output was sold.
He found that an increase in exchange rate volatility induces a depreciation of the risk adjusted real exchange rate and thus lowers the costs of domestic versus foreign financing of foreign capital which translates into an increase in FDI. In case of foreign production with imported inputs a decrease in exchange rate volatility lowers both factor (foreign labor and capital) costs. However the ratio of wages to rents rises and the usage of capital invested abroad increases. Under the circumstances of domestic production and sale but with foreign subsidiary delivering an intermediate good, lower exchange rate volatility raises the cost of foreign labor while lowering the
3 Plant-opening decisions are made prior to exchange-rate realization.
Studies & Analyses No. 258 – Exchange rate variability and foreign direct investment …
10
cost of foreign capital. As a result three outcomes are possible. FDI rises and foreign employment falls or rises (if the increased FDI raises marginal productivity of labor enough to offset the rise in its cost) or both FDI and foreign employment falls (when the decline in the latter reduces the marginal productivity of capital invested abroad enough to offset the fall in its cost). Finally, in case of export production with plant located domestically or abroad, a decrease in exchange rate volatility may again reduce as well as increase FDI. The former result is more likely to occur if price elasticity of foreign demand is relatively high.
Goldberg and Kolstad (1995) argue that exchange rate volatility unambiguously stimulates the share of investment activity located abroad. Under risk aversion the nature of the relationships between exchange rate variability and flow of FDI critically depends on the covariance structure between exchange rate and foreign demand shocks. If both shocks are negatively correlated, a rise in the variability of exchange rates magnifies the share of capacity located offshore, although the overall capacity declines. Therefore the analysis does not allow to conclude that the absolute level of FDI rises or falls. However, as long as demand is not excessively convex with respect to price, the FDI share increases as the correlation between exchange rate and demand shocks rises.
Finally, Bénassy-Quéré et al. (2001) emphasize the role played by the covariance between the exchange rates of currencies used in two alternative locations of inward direct investment. A risk-averse firm contemplates relocating in two alternative foreign locations in order to re-export4 and therefore transportations costs influence the sensitiveness of FDI to exchange rate uncertainty. It stems from the analysis that regardless of the sign of correlation between the two exchange rates movements, an increase in the volatility of any of the two countries exchange rate leads to a reduction in FDI. Moreover lower volatility of exchange rate in a country increases the sensitivity of output in that country to local costs.
The empirical research mostly finds that increased exchange rate uncertainty has a positive effect on foreign direct investment. Positive effects are found by Goldberg and Kolstad (1995) on bilateral investment flows between the U.S. on the one hand and the U.K., Canada and Japan on the other for 1978-1991, were use was made of quarterly data. Exchange rate variability had a positive and statistically significant effect on four of the six bilateral FDI shares: real exchange rate variability increased the share of total United Sates investment capacity located in Canada and in Japan, and increased the share of Canadian and United Kingdom investment located in the United States. Exchange rate variability entered with opposite to expected sign or was insignificant only in cases where problems (nonstationarity and heteroskedasticity) arose in estimating the regression equations.
Cushman (1985) reports positive effects of exchange rate volatility on annual, bilateral FDI flows from the United States to the United Kingdom, France, Germany, Canada and Japan for the
4 FDI and trade are complements.
Studies & Analyses No. 258 Michał Brzozowski
11
years 1963 through 1978. Alternative measures of variability lead to a conclusion that the exchange rate risk variable’s effect is consistently positive for all specifications. However it is insignificant when contemporaneous error correlation is assumed. Since the contemporaneous error formulation outperforms other specifications with respect to remaining variables significance and correct signs, we may conclude that Cushman’s results give weak support to a hypothesis of positive link between direct investment and exchange rate volatility.
Bénassy-Quéré et al. (2001) test their theoretical model on a panel of 42 developing countries receiving FDI from 17 investing countries over 1984-1996. As expected the authors find that an increase in the nominal exchange rate volatility tends to reduce FDI. More precisely, it is shown that a 1 point increase in exchange rate volatility reduces the FDI stock by 0.63 percent. The result is particularly worth noting because seven transition countries from Central and Eastern Europe are included in the estimation sample.
2. Volatility vs. Uncertainty: Theoretical and Empirical Dimensions
Before we proceed to test the impact of exchange rate variability in transition and emerging market countries it is necessary to carefully disentangle volatility from uncertainty both theoretically and empirically.
2.1. Distinction between volatility and uncertainty on theoretical grounds
All decisions are made in environments which are defined with respect to the individual’s perception of the possible outcomes. There are three primary categories of environments that influence the means by which a decision, including decision of investing abroad, is reached. These are classified as “certainty”, “risk” and “uncertainty”5. A decision is made under conditions of certainty if the state of the world and the outcome of the decision are known in advance. Risk is associated with a decision only if the possible future states of the world and future outcomes together with the assigned probabilities are known in advance. In contrast a decision is made in an environment of uncertainty when not all of the many possible future states of the world and outcomes are known in advance, and their probabilities are unknown or may not exist.
The dividing line between the repercussions of exchange rate volatility and uncertainty in the context of FDI is straightforward to establish. The majority of theoretical models sketched in the preceding section are linked to exchange rate volatility. In a natural way . exchange rate volatility is an appropriate variable to be used for testing theories focusing on investors’ aversion to variance of profits. In all three papers by Cushman (1985), Goldberg and Kolstad (1995), and Bénassy-
5 For an in depth discussion of all three concepts see Katzner (1998).
Studies & Analyses No. 258 – Exchange rate variability and foreign direct investment …
12
Quéré et al. (2001) agents know the probability distribution of the exchange rate and use it to form expectations on future value of profits.
The knowledge of possible future states of the world is as well a feature of the production flexibility story. In Aizenman (1992) the distribution of money supply and labor productivity shocks are known to all agents. Darby et al. (1999), drawing from Dixit and Pindyck (1994), assume that the firm’s inverse demand function follows a Brownian process which means that its expected present discounted value is known.
In contrast, the multinational firm in Sung and Lapan (2000) expects that the future exchange rate will be equal to the prevailing exchange rate when the plant-opening decision is made. In other words, any exchange rate innovation is unanticipated. That situation coincides with the definition of uncertainty formulated above. Although most overviewed models emphasize the role of exchange rate volatility I have decided to gauge how strong, if any, correlation exists between FDI inflows and exchange rate uncertainty. To that end I specify empirical attempts to quantify uncertainty.
2.2. Measures of volatility and uncertainty
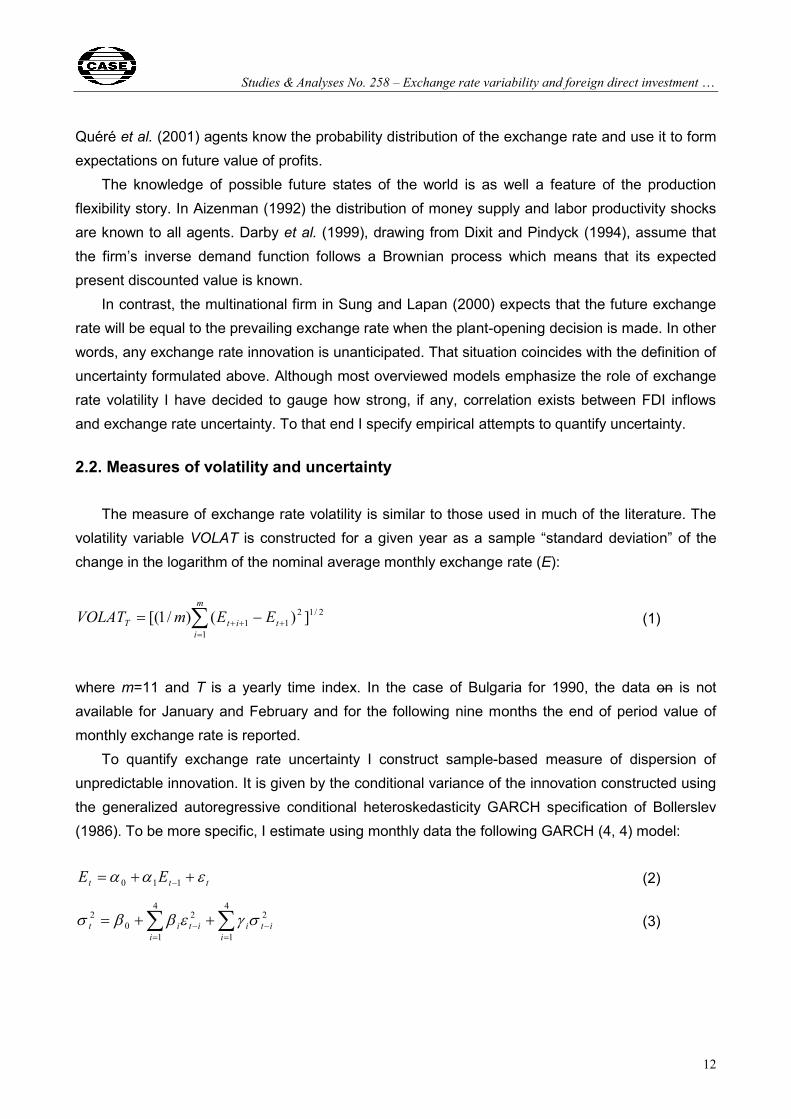
The measure of exchange rate volatility is similar to those used in much of the literature. The volatility variable VOLAT is constructed for a given year as a sample “standard deviation” of the change in the logarithm of the nominal average monthly exchange rate (E):
2/1
1
211 ])()/1[( ∑
=+++ −=
m
ititT EEmVOLAT (1)
where m=11 and T is a yearly time index. In the case of Bulgaria for 1990, the data on is not available for January and February and for the following nine months the end of period value of monthly exchange rate is reported.
To quantify exchange rate uncertainty I construct sample-based measure of dispersion of unpredictable innovation. It is given by the conditional variance of the innovation constructed using the generalized autoregressive conditional heteroskedasticity GARCH specification of Bollerslev (1986). To be more specific, I estimate using monthly data the following GARCH (4, 4) model:
ttt EE εαα ++= −110 (2)
∑∑=
−=
− ++=4
1
24
1
20
2
iiti
iitit σγεββσ (3)
Studies & Analyses No. 258 Michał Brzozowski
13
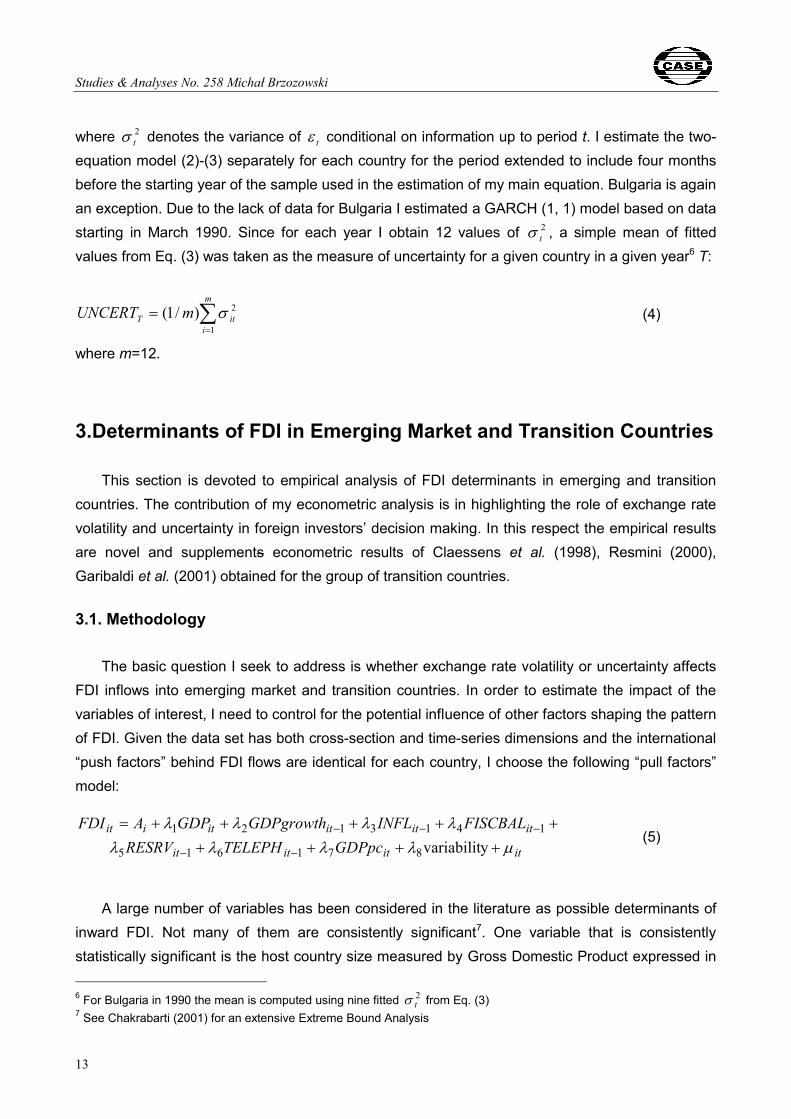
where 2tσ denotes the variance of tε conditional on information up to period t. I estimate the two-
equation model (2)-(3) separately for each country for the period extended to include four months before the starting year of the sample used in the estimation of my main equation. Bulgaria is again an exception. Due to the lack of data for Bulgaria I estimated a GARCH (1, 1) model based on data starting in March 1990. Since for each year I obtain 12 values of 2
tσ , a simple mean of fitted values from Eq. (3) was taken as the measure of uncertainty for a given country in a given year6 T:
∑=
=m
iitT mUNCERT
1
2)/1( σ (4)
where m=12.
3.Determinants of FDI in Emerging Market and Transition Countries
This section is devoted to empirical analysis of FDI determinants in emerging and transition countries. The contribution of my econometric analysis is in highlighting the role of exchange rate volatility and uncertainty in foreign investors’ decision making. In this respect the empirical results are novel and supplements econometric results of Claessens et al. (1998), Resmini (2000), Garibaldi et al. (2001) obtained for the group of transition countries.
3.1. Methodology
The basic question I seek to address is whether exchange rate volatility or uncertainty affects FDI inflows into emerging market and transition countries. In order to estimate the impact of the variables of interest, I need to control for the potential influence of other factors shaping the pattern of FDI. Given the data set has both cross-section and time-series dimensions and the international “push factors” behind FDI flows are identical for each country, I choose the following “pull factors” model:
itititit
ititititiit
GDPpcTELEPHRESRVFISCBALINFLGDPgrowthGDPAFDI
µλλλλλλλλ
+++++++++=
−−
−−−
yvariabilit871615
1413121 (5)
A large number of variables has been considered in the literature as possible determinants of inward FDI. Not many of them are consistently significant7. One variable that is consistently statistically significant is the host country size measured by Gross Domestic Product expressed in 6 For Bulgaria in 1990 the mean is computed using nine fitted 2
tσ from Eq. (3) 7 See Chakrabarti (2001) for an extensive Extreme Bound Analysis
Studies & Analyses No. 258 – Exchange rate variability and foreign direct investment …
14
US dollars (GDP). In all 17 econometric analysis discussed by Chakrabarti (2001), GDP, representing market size, is a statistically significant dominant variable determining FDI. In the present study I test whether the market-size hypothesis that holds that a large market is necessary for exploitation of economies of scale is acceptable for emerging and transition countries. Given results of Garibaldi et al. (2001) I expect the coefficient associated with GDP variable to be significant and positive.
The remaining explanatory variables can be divided into three groups: macroeconomic factors, country creditworthiness and factors related to capital productivity. There are three variables in the first group: lagged rate of growth of real per capita GDP (GDPgrowth), lagged rate of inflation (INFL), lagged general government balance as percent of GDP (FISCBAL). Macroeconomic stability is viewed as conducive to FDI, hence I expect a negative sign to be associated with the rate of inflation. Low fiscal deficit is also a stabilization proxy and a positive sign should be expected. However large fiscal deficit translates into low domestic savings and a more pronounced need for foreign financing partly met by the FDI inflows. As a result the sign associated with FISCBAL is ambiguous. Similarly, GDP growth could be on the one hand regarded as a factor encouraging investment since a growing economy is a prospect of large profits. On the other hand the output decline could be accompanied by the increase in the marginal product of new capital if it is combined with other resources freed from stagnating sectors. I cannot therefore exclude that the estimated coefficient of GDPgrowth could be negative.
Country creditworthiness is measured by the change in the reserve assets. I preserve the balance of payments notational convention, that is an increase in the stock of international reserves is recorded with the minus sign. I expect a negative coefficient to be associated with the RESERV variable, i.e. an accumulation of foreign reserves encourages FDI because it lowers the perceived risk.
The third group is composed of two variables. A proxy for the physical infrastructure used in the estimation is the number of telephone lines and cellular subscribers per 100 inhabitants. TELEPH variable should positively affect the FDI inflows since more developed infrastructure raises capital productivity. Per capita GDP (GDPpc) is the second variable in this group and is intended to measure labor productivity. High labor productivity is likely to encourage FDI. The problem with the GDPpc variable is that it is also an implicit measure of wage rates, since productivity levels are highly correlated with wage rates, as well as with GDP per capita. All other things equal, higher wage rates will discourage inward FDI. As a result one cannot a priori assign a specific sign to GDPpc variable.
I assume that GDPgrowth, RESERV, TELEPH affect FDI with a lag since they cannot be observed in the moment the investment decision is made. Hence I insert all three variables with the lags in the regression. Finally the set of explanatory variables includes two measures of variability described in the previous subsection, i.e. VOLAT and UNCERT. The data on the number of
Studies & Analyses No. 258 Michał Brzozowski
15
telephone lines and cellular subscribers per 100 inhabitants, real per capita GDP growth and real GDP are taken from the World Bank Development Indicators. The IMF International Financial Statistics is the source of the remaining variables.
Panel data techniques are used in regression analysis which has obvious advantages over other estimation methods. The fixed effects model allows us to control for all individual specific variables, potentially affecting inward FDI flows which have not been included in the set of regressors due to data limitation. Specifically the assumption that each cross section unit has its own intercept permits to control for the progress of market reforms in transition countries. In Eq. (5) Ai stands for an intercept for each country and a hypothesis that all cross section units have a common intercept, i.e. Ai=A, was tested with the use of F test.
The lagged value of FDI may be an important determinant of the current FDI inflow. The presence of foreign affiliates in a country may be the best recommendation for other investors contemplating placing their capital abroad. It is therefore justified to add the lagged value of FDI to the set of independent variables. The equation to be estimated takes then the form:
itititit
itititititiit
GDPpcTELEPHRESRVFISCBALINFLGDPgrowthGDPFDIAFDI
µλλλλλλλλλ
++++++++++=
−−
−−−−
yvariabilit981716
161514211 (6)
The presence of lagged dependent variable precludes the use of the standard fixed effects estimator. The conventional approach is based on the difference GMM estimator proposed by Arellano and Bond (1991) which uses the second lag as instrument for the first difference of FDIit-1. First differencing Eq. (6) eliminates the constant term from the set of independent variables.
3.2. Empirical results for emerging market and transition countries
I used a general-to-specific model selection approach in the context of Eq. (5) and (6). Since availability of data on the general government balance reduced significantly the time span of the transition countries sample8 I estimated separately Eq. (5) with FISCBAL and without it. In all regressions the lagged value of general government balance as percent of GDP appeared to be statistically insignificant which is at odds with results obtained by Garibaldi et al. (2001) who found that variable to be significantly and positively related to FDI in transition countries. Consequently, the results of estimations of Eq. (5) with FISCBAL are omitted and available upon request from the author.
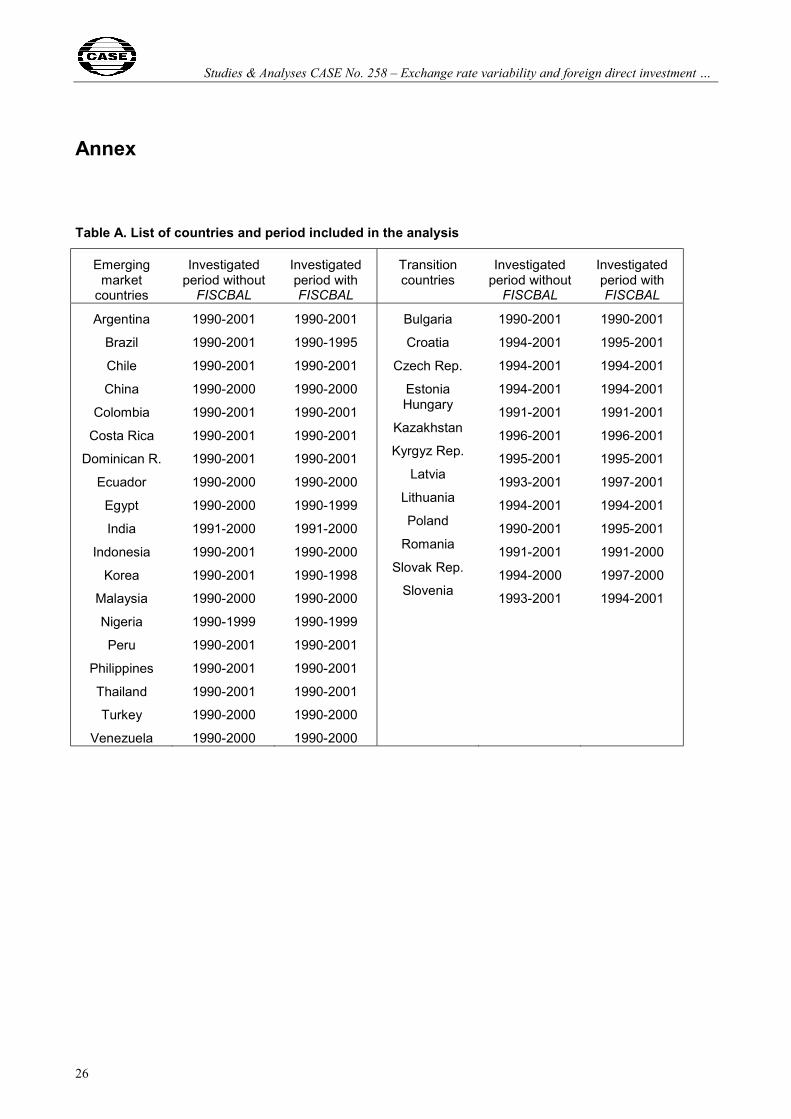
GDP per capita growth (GDPgrowth) was a second variable that was consistently insignificant in all specifications. Similar results were obtained by Garibaldi et al. (2001) for transition countries, whereas Chakrabarti (2001) cites five studies where the positive link between FDI and growth rate 8 The countries and investigated periods are listed in Table A in the Annex.
Studies & Analyses No. 258 – Exchange rate variability and foreign direct investment …
16
was detected and two papers where it was negative. The empirical exercise conducted by Noorbakhsh et al. (2001) on the sample of 36 developing countries supports the view that the growth of domestic market is a relevant factor explaining FDI flows. In all of the abovementioned studies, however, the authors have not investigated the possible reversion of the causality. In fact foreign investors’ activity may cause current GDP growth and the latter should be taken with a lag in econometric analysis of explanations for FDI inflows. On the other hand, Gastanaga et al. (1998) for the sample of 49 less-developed countries provided evidence that FDI flows are induced by rapid growth of real GDP in host country, both current, future (reflecting perfect rational expectations) and lagged. Hence my finding on statistical insignificance of real per capita GDP growth may reflect the fact that both effects - prospect of large profits and a potential decrease in the marginal product of capital (due to an increasing array of employment possibilities of remaining resources) - are countervailing in countries analyzed in the present study.
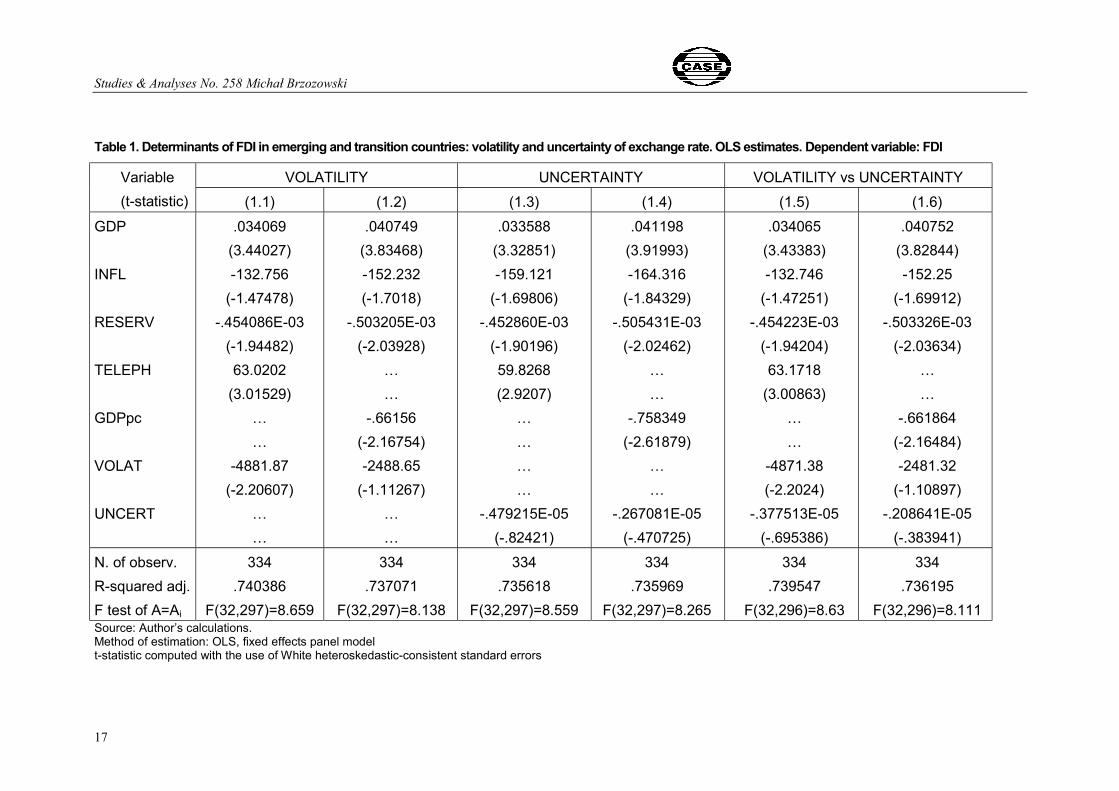
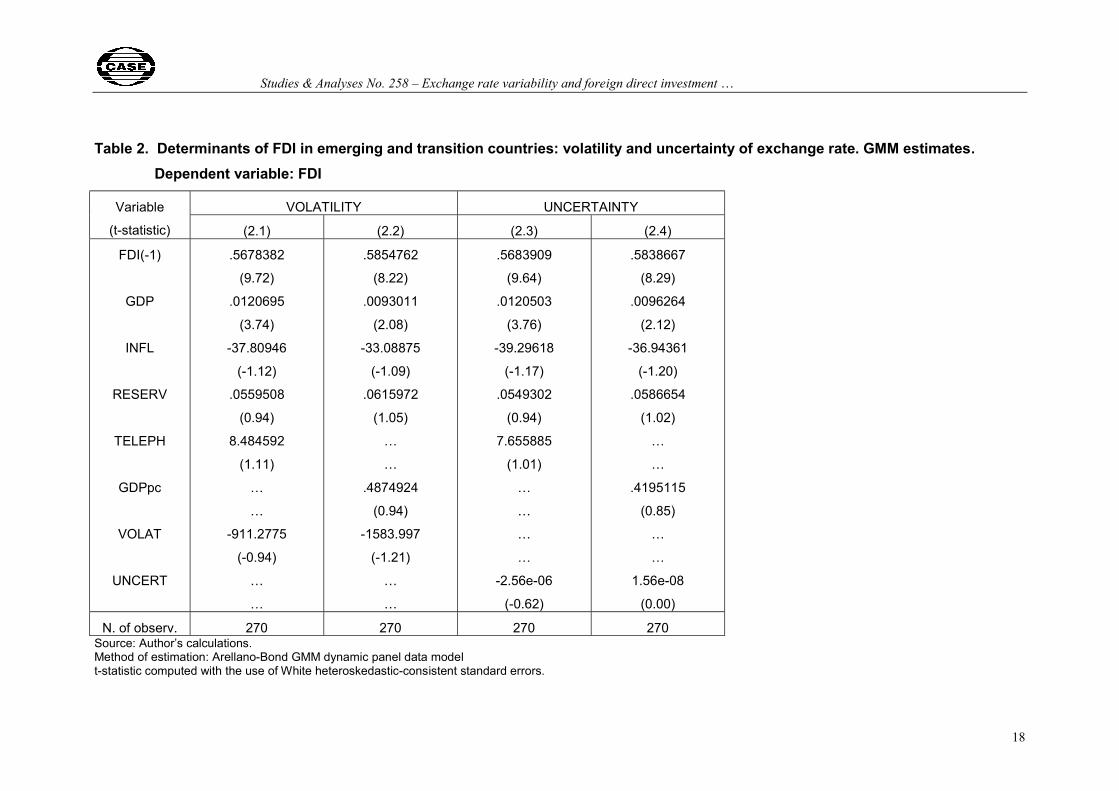
To sum up, after preliminary eliminations the set of regressors in Eq. (5) contains five control variables (GDP, INFL, RESERV, TELEPH, GDPpc) and two measures of exchange rate variability (VOLAT, UNCERT). The lagged value of FDI (FDI(-1)) is added to the group of control variables when Eq. (6) is estimated. The analysis of correlation of all variables revealed a strong positive correlation of TELEPH and GDPpc. It is therefore justified to estimate Eq (5) and Eq (6) separately with each of both correlated variables inserted in turn into regression. The results of estimation of Eq. (5) are presented in Table 1 and of Eq. (6) in Table 2. Columns 1.1, 1.3 and 1.5 of Table 1 and 2.1, 2.3 of Table 2 display results of regression analysis with TELEPH among regressors. The impact of GDPpc on FDI inflows in emerging and transition countries is examined in the remaining columns of Tables 1 and 2.
Studies & Analyses No. 258 Michał Brzozowski
17
Table 1. Determinants of FDI in emerging and transition countries: volatility and uncertainty of exchange rate. OLS estimates. Dependent variable: FDI
(-.383941) N. of observ. R-squared adj. F test of A=Ai
334 .740386
F(32,297)=8.659
334 .737071
F(32,297)=8.138
334 .735618
F(32,297)=8.559
334 .735969
F(32,297)=8.265
334 .739547
F(32,296)=8.63
334 .736195
F(32,296)=8.111 Source: Author’s calculations. Method of estimation: OLS, fixed effects panel model t-statistic computed with the use of White heteroskedastic-consistent standard errors
Studies & Analyses No. 258 – Exchange rate variability and foreign direct investment …
18
Table 2. Determinants of FDI in emerging and transition countries: volatility and uncertainty of exchange rate. GMM estimates. Dependent variable: FDI
VOLATILITY UNCERTAINTY Variable
(t-statistic) (2.1) (2.2) (2.3) (2.4)
FDI(-1)
GDP
INFL
RESERV
TELEPH
GDPpc
VOLAT
UNCERT
.5678382
(9.72)
.0120695
(3.74)
-37.80946
(-1.12)
.0559508
(0.94)
8.484592
(1.11)
…
…
-911.2775
(-0.94)
…
…
.5854762
(8.22)
.0093011
(2.08)
-33.08875
(-1.09)
.0615972
(1.05)
…
…
.4874924
(0.94)
-1583.997
(-1.21)
…
…
.5683909
(9.64)
.0120503
(3.76)
-39.29618
(-1.17)
.0549302
(0.94)
7.655885
(1.01)
…
…
…
…
-2.56e-06
(-0.62)
.5838667
(8.29)
.0096264
(2.12)
-36.94361
(-1.20)
.0586654
(1.02)
…
…
.4195115
(0.85)
…
…
1.56e-08
(0.00)
N. of observ. 270 270 270 270 Source: Author’s calculations. Method of estimation: Arellano-Bond GMM dynamic panel data model t-statistic computed with the use of White heteroskedastic-consistent standard errors.
Studies & Analyses No. 258 Michał Brzozowski
19
It stems from regression results reported in Table 1 that market size (GDP), change in the stock of reserves (RESERV), the communication facilities (TELEPH) and real per capita GDP (GDPpc) are significant explanations for FDI inflows. The coefficient of inflation (INFL) has an expected sign and is statistically significant in four out of six regressions. The sign associated with GDPpc is negative that corroborates the hypothesis of a strong correlation between that variable and the level of wages.
FDI inflows into emerging and transition countries do not seem particularly vulnerable to exchange rate volatility and uncertainty. Although the sign associated with both measures of exchange rate variability is consistently negative throughout Table 1, the estimated coefficient on VOLAT is significant only in column 1.1 and 1.5. Moreover, when an attempt is made, in columns 1.5 and 1.6, to test the relative importance of exchange rate volatility and uncertainty in shaping foreign investors’ decisions both variables of interest are insignificant. I therefore end up with a conclusion that in the whole sample of emerging and transition countries exchange rate volatility has at most marginal negative impact on FDI inflows whereas exchange rate uncertainty does not affect it at all.
The widening of the set of independent variables to include the lagged value of FDI inflows demolishes the inferences made from the estimation of fixed effects model. As results presented in Table 2 demonstrate FDI(-1) is a major factor which determines FDI inflows into emerging and transition countries. The coefficient on the lagged value of FDI is highly significant and its value means that a country attracts in the current year over one half of previous year FDI inflows regardless of the evolution of other variables that influence foreign investors’ decisions. The size of domestic market is the only variable that remains significant.
The analysis of Table 1 and 2 leads to a general conclusion that FDI inflows are mainly driven by the size of host country and the lagged value of direct investment. Neither exchange rate volatility nor uncertainty affects FDI inflows in an unquestionable manner despite the fact that the coefficient on the former was negative and statistically significant in few specifications.
3.3. Specificity of transition countries
To asses the consequences of EMU enlargement I need to verify whether the FDI inflows
into the transition and candidate countries react to exchange rate variability in a distinguishable
manner. To that end I redo the regression analysis for transition countries and I construct a
dummy variables ACCESS which takes on the value of 1 for eight accession countries and 0
otherwise. If FDI inflows into accession countries react to exchange rate variability in a distinct
way the variable VOLATAC, equal to the product of VOLAT and ACCESS, should be statistically
significant. Analogously I construct a variable UNCERTAC, equal to the product of dummy
ACCESS and the measure of exchange rate uncertainty UNCERT. The significance of the coeffi-
Studies & Analyses No. 258 – Exchange rate variability and foreign direct investment …
20
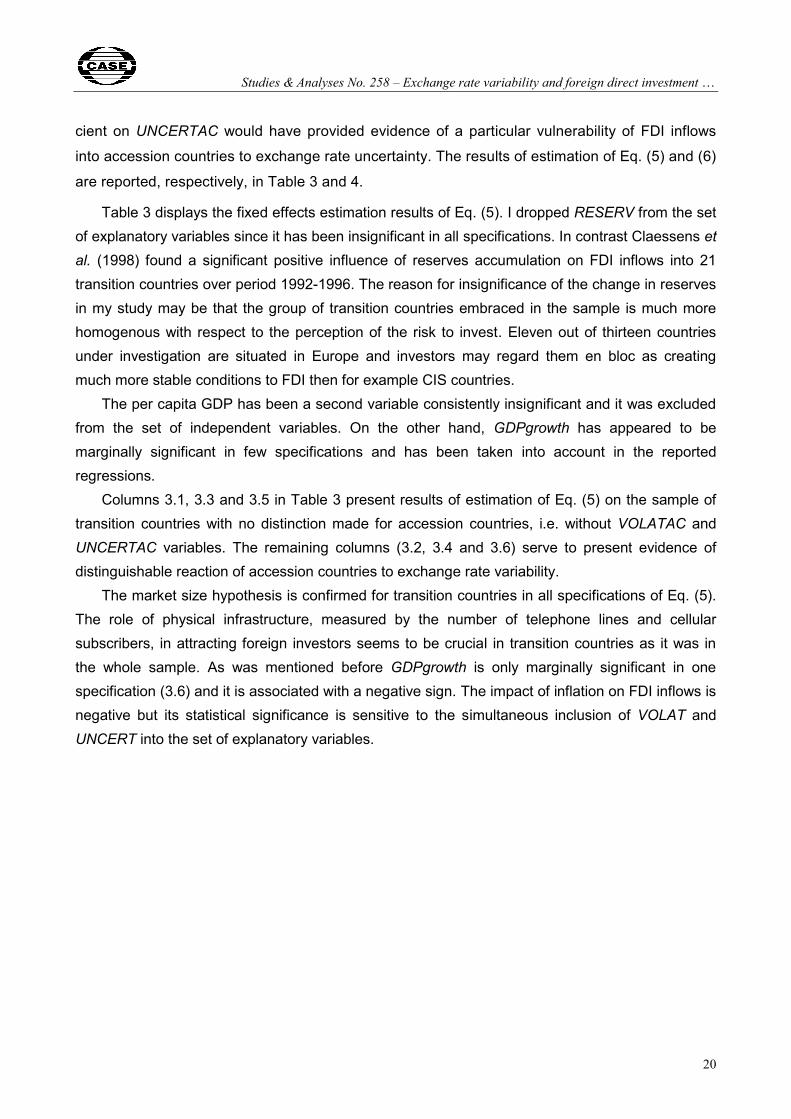
cient on UNCERTAC would have provided evidence of a particular vulnerability of FDI inflows
into accession countries to exchange rate uncertainty. The results of estimation of Eq. (5) and (6)
are reported, respectively, in Table 3 and 4.
Table 3 displays the fixed effects estimation results of Eq. (5). I dropped RESERV from the set of explanatory variables since it has been insignificant in all specifications. In contrast Claessens et al. (1998) found a significant positive influence of reserves accumulation on FDI inflows into 21 transition countries over period 1992-1996. The reason for insignificance of the change in reserves in my study may be that the group of transition countries embraced in the sample is much more homogenous with respect to the perception of the risk to invest. Eleven out of thirteen countries under investigation are situated in Europe and investors may regard them en bloc as creating much more stable conditions to FDI then for example CIS countries.
The per capita GDP has been a second variable consistently insignificant and it was excluded from the set of independent variables. On the other hand, GDPgrowth has appeared to be marginally significant in few specifications and has been taken into account in the reported regressions.
Columns 3.1, 3.3 and 3.5 in Table 3 present results of estimation of Eq. (5) on the sample of transition countries with no distinction made for accession countries, i.e. without VOLATAC and UNCERTAC variables. The remaining columns (3.2, 3.4 and 3.6) serve to present evidence of distinguishable reaction of accession countries to exchange rate variability.
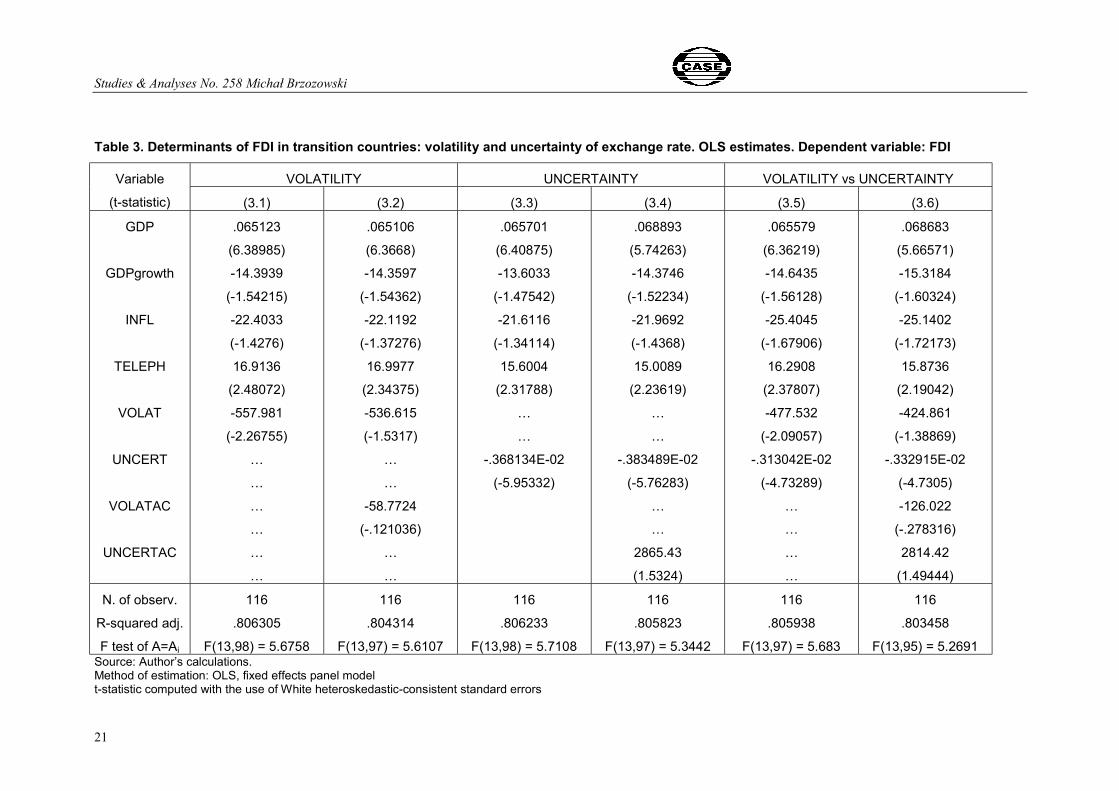
The market size hypothesis is confirmed for transition countries in all specifications of Eq. (5). The role of physical infrastructure, measured by the number of telephone lines and cellular subscribers, in attracting foreign investors seems to be crucial in transition countries as it was in the whole sample. As was mentioned before GDPgrowth is only marginally significant in one specification (3.6) and it is associated with a negative sign. The impact of inflation on FDI inflows is negative but its statistical significance is sensitive to the simultaneous inclusion of VOLAT and UNCERT into the set of explanatory variables.
Studies & Analyses No. 258 Michał Brzozowski
21
Table 3. Determinants of FDI in transition countries: volatility and uncertainty of exchange rate. OLS estimates. Dependent variable: FDI
VOLATILITY UNCERTAINTY VOLATILITY vs UNCERTAINTY Variable
(t-statistic) (3.1) (3.2) (3.3) (3.4) (3.5) (3.6)
GDP
GDPgrowth
INFL
TELEPH
VOLAT
UNCERT
VOLATAC
UNCERTAC
.065123
(6.38985)
-14.3939
(-1.54215)
-22.4033
(-1.4276)
16.9136
(2.48072)
-557.981
(-2.26755)
…
…
…
…
…
…
.065106
(6.3668)
-14.3597
(-1.54362)
-22.1192
(-1.37276)
16.9977
(2.34375)
-536.615
(-1.5317)
…
…
-58.7724
(-.121036)
…
…
.065701
(6.40875)
-13.6033
(-1.47542)
-21.6116
(-1.34114)
15.6004
(2.31788)
…
…
-.368134E-02
(-5.95332)
.068893
(5.74263)
-14.3746
(-1.52234)
-21.9692
(-1.4368)
15.0089
(2.23619)
…
…
-.383489E-02
(-5.76283)
…
…
2865.43
(1.5324)
.065579
(6.36219)
-14.6435
(-1.56128)
-25.4045
(-1.67906)
16.2908
(2.37807)
-477.532
(-2.09057)
-.313042E-02
(-4.73289)
…
…
…
…
.068683
(5.66571)
-15.3184
(-1.60324)
-25.1402
(-1.72173)
15.8736
(2.19042)
-424.861
(-1.38869)
-.332915E-02
(-4.7305)
-126.022
(-.278316)
2814.42
(1.49444)
N. of observ.
R-squared adj.
F test of A=Ai
116
.806305
F(13,98) = 5.6758
116
.804314
F(13,97) = 5.6107
116
.806233
F(13,98) = 5.7108
116
.805823
F(13,97) = 5.3442
116
.805938
F(13,97) = 5.683
116
.803458
F(13,95) = 5.2691 Source: Author’s calculations. Method of estimation: OLS, fixed effects panel model t-statistic computed with the use of White heteroskedastic-consistent standard errors
Studies & Analyses No. 258 – Exchange rate variability and foreign direct investment …
22
Table 4. Determinants of FDI in transition countries: volatility and uncertainty of exchange rate. GMM estimates. Dependent variable: FDI
VOLATILITY UNCERTAINTY VOLATILITY vs UNCERTAINTY Variable
(t-statistic) (4.1) (4.2) (4.3) (4.4) (4.5) (4.6)
FDI(-1)
GDP
GDPgrowth
INFL
TELEPH
VOLAT
UNCERT
VOLATAC
UNCERTAC
.316823
(2.79)
.0453805
(4.54)
-19.79811
(-1.20)
-31.98965
(-1.42)
9.399406
(1.41)
41.38507
(0.34)
…
…
…
…
…
…
.317935
(2.78)
.0454355
(4.49)
-20.40074
(-1.23)
-33.27561
(-1.50)
8.952492
(1.34)
-90.21137
(-0.97)
…
…
366.0624
(0.61)
…
…
.3170741
(2.78)
.0452473
(4.53)
-19.42086
(-1.18)
-34.15876
(-1.46)
9.317853
(1.40)
…
…
-.4248134
(-1.23)
.3223613
(2.87)
.0426669
(4.14)
-16.26359
(-1.01)
-17.49232
(-1.15)
9.46508
(1.42)
…
…
-.3469028
(-1.17)
…
…
-150842.8
(-4.43)
.3157375
(2.78)
.045411
(4.54)
-19.68909
(-1.20)
-33.2737
(-1.43)
9.303822
(1.39)
96.94462
(0.60)
-.4880761
(-1.25)
…
…
…
…
.3221023
(2.87)
.0428547
(4.11)
-16.97709
(-1.04)
-17.00404
(-1.13)
9.10056
(1.35)
-36.32994
(-0.37)
-.2860748
(-1.00)
317.718
(0.52)
-152512.8
(-4.67)
N. of observ. 90 90 90 90 90 90 Source: Author’s calculations. Method of estimation: Arellano-Bond GMM dynamic panel data model t-statistic computed with the use of White heteroskedastic-consistent standard errors
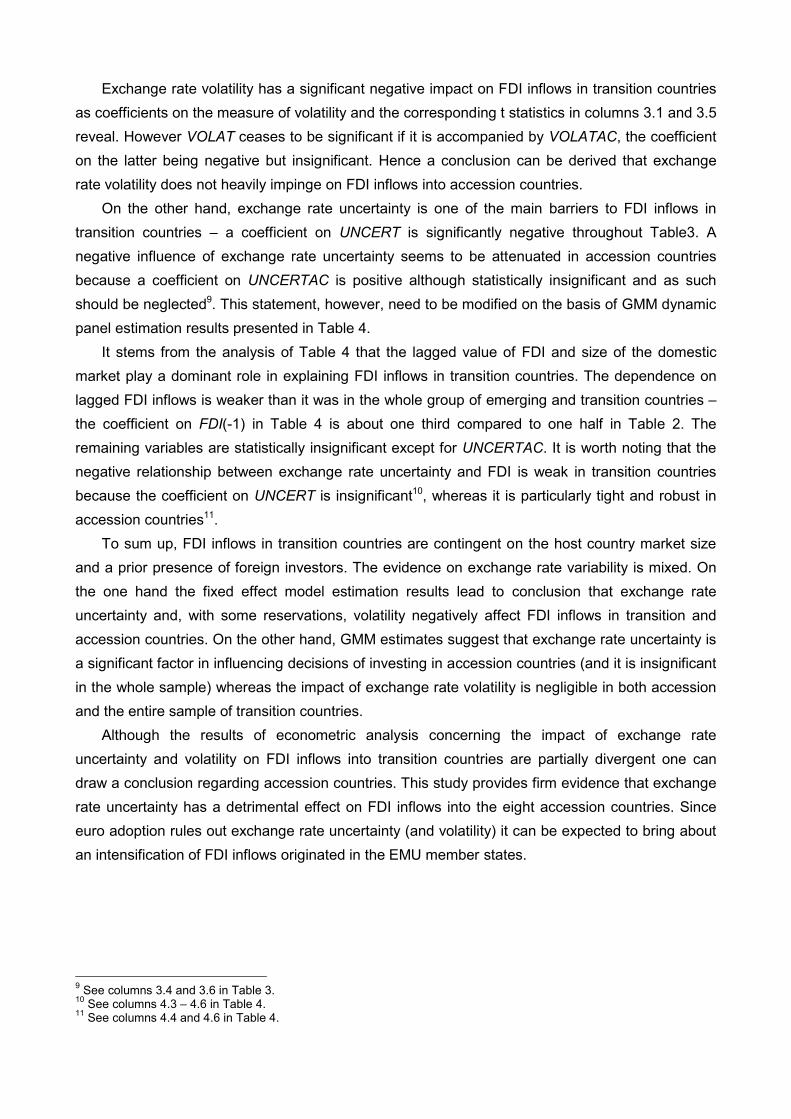
Exchange rate volatility has a significant negative impact on FDI inflows in transition countries as coefficients on the measure of volatility and the corresponding t statistics in columns 3.1 and 3.5 reveal. However VOLAT ceases to be significant if it is accompanied by VOLATAC, the coefficient on the latter being negative but insignificant. Hence a conclusion can be derived that exchange rate volatility does not heavily impinge on FDI inflows into accession countries.
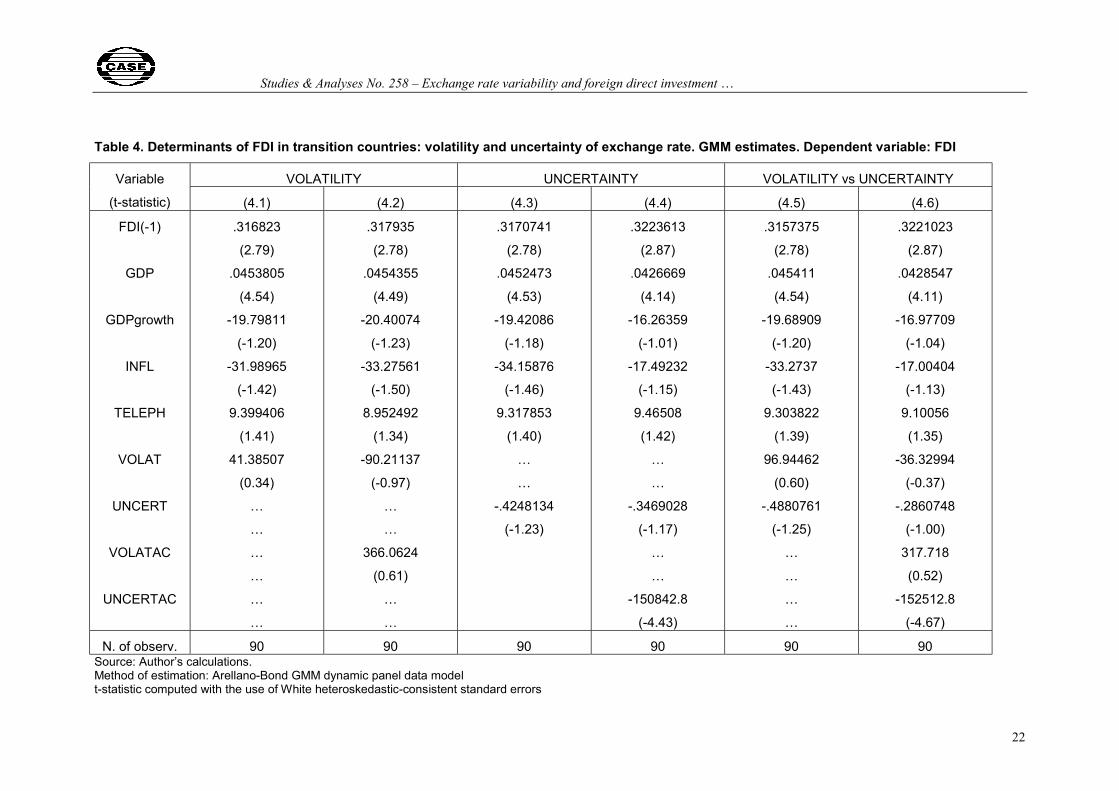
On the other hand, exchange rate uncertainty is one of the main barriers to FDI inflows in transition countries – a coefficient on UNCERT is significantly negative throughout Table3. A negative influence of exchange rate uncertainty seems to be attenuated in accession countries because a coefficient on UNCERTAC is positive although statistically insignificant and as such should be neglected9. This statement, however, need to be modified on the basis of GMM dynamic panel estimation results presented in Table 4.
It stems from the analysis of Table 4 that the lagged value of FDI and size of the domestic market play a dominant role in explaining FDI inflows in transition countries. The dependence on lagged FDI inflows is weaker than it was in the whole group of emerging and transition countries – the coefficient on FDI(-1) in Table 4 is about one third compared to one half in Table 2. The remaining variables are statistically insignificant except for UNCERTAC. It is worth noting that the negative relationship between exchange rate uncertainty and FDI is weak in transition countries because the coefficient on UNCERT is insignificant10, whereas it is particularly tight and robust in accession countries11.
To sum up, FDI inflows in transition countries are contingent on the host country market size and a prior presence of foreign investors. The evidence on exchange rate variability is mixed. On the one hand the fixed effect model estimation results lead to conclusion that exchange rate uncertainty and, with some reservations, volatility negatively affect FDI inflows in transition and accession countries. On the other hand, GMM estimates suggest that exchange rate uncertainty is a significant factor in influencing decisions of investing in accession countries (and it is insignificant in the whole sample) whereas the impact of exchange rate volatility is negligible in both accession and the entire sample of transition countries.
Although the results of econometric analysis concerning the impact of exchange rate uncertainty and volatility on FDI inflows into transition countries are partially divergent one can draw a conclusion regarding accession countries. This study provides firm evidence that exchange rate uncertainty has a detrimental effect on FDI inflows into the eight accession countries. Since euro adoption rules out exchange rate uncertainty (and volatility) it can be expected to bring about an intensification of FDI inflows originated in the EMU member states.
9 See columns 3.4 and 3.6 in Table 3. 10 See columns 4.3 – 4.6 in Table 4. 11 See columns 4.4 and 4.6 in Table 4.
Studies & Analyses CASE No. 258 – Exchange rate variability and foreign direct investment …
24
4. Conclusions
I have made an empirical investigation of the relation between FDI and nominal exchange rate uncertainty and volatility for 19 emerging market and 13 transition countries during the decade of the 1990s. I have employed two methods pertinent to data set with time-series and cross-section dimensions: fixed effects OLS and GMM Arellano-Bond models. The main findings can be summarized as follows.
The FDI inflows in transition and emerging countries significantly hinges on the host country market size and its own lagged value. Exchange rate uncertainty and volatility may negatively influence the decision to locate investment in transition and accession countries. Nominal exchange rate uncertainty seems to particularly hamper FDI inflows in accession countries.
Thus, the key contribution of this paper is in emphasizing the positive influence that the euro adoption is likely to exert on FDI inflows in accession countries. This is the direct channel through which fixing the exchange rate is likely to stimulate FDI inflow. Lowering trade costs, raising income and market size within EMU is the indirect channel through which fixing the exchange rate is likely to encourage foreign investors. In brief, the FDI enhancing effect of exchange rate stability is likely to reinforce the positive impact of GDP expansion and overall risk reduction due to the accession into the EU.
Studies & Analyses CASE No. 258 Michał Brzozowski
25
References
Aizenman, J. (1992) Exchange rate flexibility, volatility, and the patterns of domestic and foreign direct investment, NBER Working Paper, No. 3953.
Arellano M., and Bond S., (1991), “Some Tests of Specification for panel data: Monte Carlo evidence and an application to employment equations”. Review of Economic Studies, vol. 58, pp. 277-297.
Bénassy-Quéré, A., Fonatagné, L., and Lahrèche-Révil, A. (2001), “Exchange rate strategies in the competition for attracting foreign direct investment”. Journal of the Japanese and International Economies, vol. 15, No. 2, pp. 178-198.
Bevan, A. A., and Estrin, S. (2000), The determinants of foreign direct investment in transition economies. CEPR Discussion Paper, No. 2638.
Bollerslev, T. (1986), „Generalized Autoregressive Conditional Heteroskedasticity”. Journal of Econometrics, vol. 31, pp. 307-327.
Chakrabarti, A. (2001), “The determinants of foreign direct investment: sensitivity analyses of cross-country regressions”. Kyklos, vol. 54, pp. 89-114.
Claessens, S., Oks, D., and Polastri, R. (1998), Capital flows to Central and Eastern Europe and the former Soviet Union. World Bank Policy Research Working Paper No. 1976 (Washington: World Bank).
Cushman, D. O. (1985), “Real exchange rate risk, expectations, and the level of direct investment”. Review of Economics and Statistics, vol. 67, No. 2, pp. 297-308.
Darby, J., Hughes Hallet, A., Ireland, J., and Piscitelli, L. (1999), “The impact of exchange rate uncertainty on the level of investment”. Economic Journal, vol. 109, pp. C55-C67.
Dixit, A. K., and Pindyck R. S. (1994), Investment under uncertainty, Princeton University Press. Garibaldi, P., Mora, N., Sahay, R., and Zettelmeyer, J. (2001), “What moves capital to transition
economies”. IMF Staff Papers, vol. 48, Special Issue, pp. 109-145. Gastanaga, V. M., Nugent, J. B., and Pashamova, B. (1998), “Host country reforms and FDI inflows: how
much difference do they make?”. World Development, vol. 26, No. 7, pp. 1299-1314. Goldberg, L. and Kolstad, C. (1995), “Foreign direct investment, exchange rate volatility and demand
uncertainty”. International Economic Review, vol. 36, pp. 855-873. Katzner, D. W. (1998) Time, ignorance, and uncertainty in economic models, The University of Michigan
Press Noorbakhsh, F., Paloni, A., and Youssef, A. (2001), “Human capital and FDI inflows to developing
countries: new empirical evidence”. World Development, Vol. 29, No. 9, pp. 1593-1610. Resmini, L. (2000), “The determinants of foreign direct investment in the CEECs. New evidence from
sectoral patterns”. Economics of Transition, vol. 8 (3), pp. 665-689. Sung, H., and Lapan, H. E. (2000), “Strategic foreign direct investment and exchange rate uncertainty”.
International Economic Review, vol. 41, No. 2, pp. 411-423. UNCTAD (2002), World Investment Report: Transnational Corporations and Export Competitiveness.
Studies & Analyses CASE No. 258 – Exchange rate variability and foreign direct investment …
26
Annex
Table A. List of countries and period included in the analysis