FOREST GENETIC RESOURCES TRAINING GUIDE MODULE 3 Tree seed supply chains Case study 3.2 Tree planting on farms in East Africa: how to ensure genetic diversity? David Boshier, Ian Dawson and Ard Lengkeek
Transcript
Case study 3.2 Tree planting on farms in East Africa: how to ensure genetic diversity?
C
Forest Genetic resources traininG Guide
MODULE 3 Tree seed supply chains
Case study 3.2
Tree planting on farms in East Africa: how to ensure genetic diversity?David Boshier, Ian Dawson and Ard Lengkeek
Acknowledgements
The editors of this Forest Genetic Resources Training Guide wish to thank Jarkko Koskela and Barbara Vinceti for their contribution in identifying the need for the guide and for their continuous support during its preparation. We acknowledge the important advice from a reference group of scientists at Bioversity International - Elizabeth Goldberg, Jozef Turok and Laura Snook - who at various stages supported this project.
This training guide was tested during several training events around the world. We would like to acknowledge the valuable feedback received from many students and their teachers.
We would like to give special thanks to Ricardo Alía, National Institute of Agriculture and Food Research (INIA), Spain, for his review of the Case studies presented in this module.
The video, “Farming with trees, “Uganda: protecting and planting trees to limit land degradation”, “Trees for life” and “Fodder shrubs milking success”, were kindly made available by ICRAF.
The photos in the PowerPoint presentation are the copyright of Shera Benda, David Boshier, Ian Dawson, J.B. Friday, Thomas Geburek, Hannah Jaenicke, Antoine Kalinganire, Roeland Kindt, Ard Lengkeek, Duncan Macqueen, Jonathan Muriuki, James Were.
Finally, the production of the Forest Genetic Resources Training Guide would never have been possible without the financial support of the Austrian Development Cooperation through the project, ‘Developing training capacity and human resources for the management of forest biodiversity’, implemented by Bioversity International during 2004-2010. We would also like to thank the European Commission-funded “SEEDSOURCE” project for additional financial support.
All cover illustrations were drawn by Rosemary Wise and the layout was created by Patrizia Tazza. We are grateful for their beautiful work.
in collaboration with
Financed by
Citation:
Boshier D, Dawson I and Lengkeek A. 2014. Tree planting on farms in East Africa: how to ensure genetic diversity? A case study and teacher’s notes. In: Forest Genetic Resources Training Guide. Edited by Boshier D, Bozzano M, Loo J, Rudebjer P. Bioversity International, Rome, Italy.
Tree planting on farms in East Africa: how to ensure genetic diversity?
David Boshier, Department of Plant Sciences, University of Oxford, UK Ian Dawson, World Agroforestry Centre, ICRAF, Kenya
Ard Lengkeek, The Tree Domestication Team, Wageningen, The Netherlands
Intra-specific genetic diversity in trees on farms may be limited by a number of factors. Genetic issues can be of particular concern during establishment of nursery lots and be of further importance in subsequent generations. Farmers or nursery managers may collect germplasm (seed or cuttings) from a small number of trees. Furthermore, after initial planting on farms, germplasm for subsequent generations of planting may be harvested from trees on the same farm, limiting subsequent influxes of new diversity. Well functioning tree seed/seedling production and distribution systems are needed to reach large numbers of scattered and relatively isolated farms if they are to productively grow and maintain a range of tree species. This requires an appropriate combination of formal and informal approaches, and market and non-market channels, to stimulate and efficiently meet farmers’ evolving demand for quality tree seed, seedlings and other planting material, as well as an availability of a range of species and provenances that meet their requirements.
This case study presents information on tree nursery and seed collection practices in Kenya, Tanzania and Uganda. Use the information given to devise a plan for the collection and supply of seed, and to develop improved nursery practices that will promote the maintenance of genetic diversity in farm landscapes. In particular, your plan should cover levels of seed tree sampling, germplasm exchange and how to implement these within seed/seedling supply chains. Make sure your plan is specific and detailed.
In your discussions you should in particular think about and respond to the following points:
• What are the bottlenecks to ensuring genetic diversity? How will you overcome these?
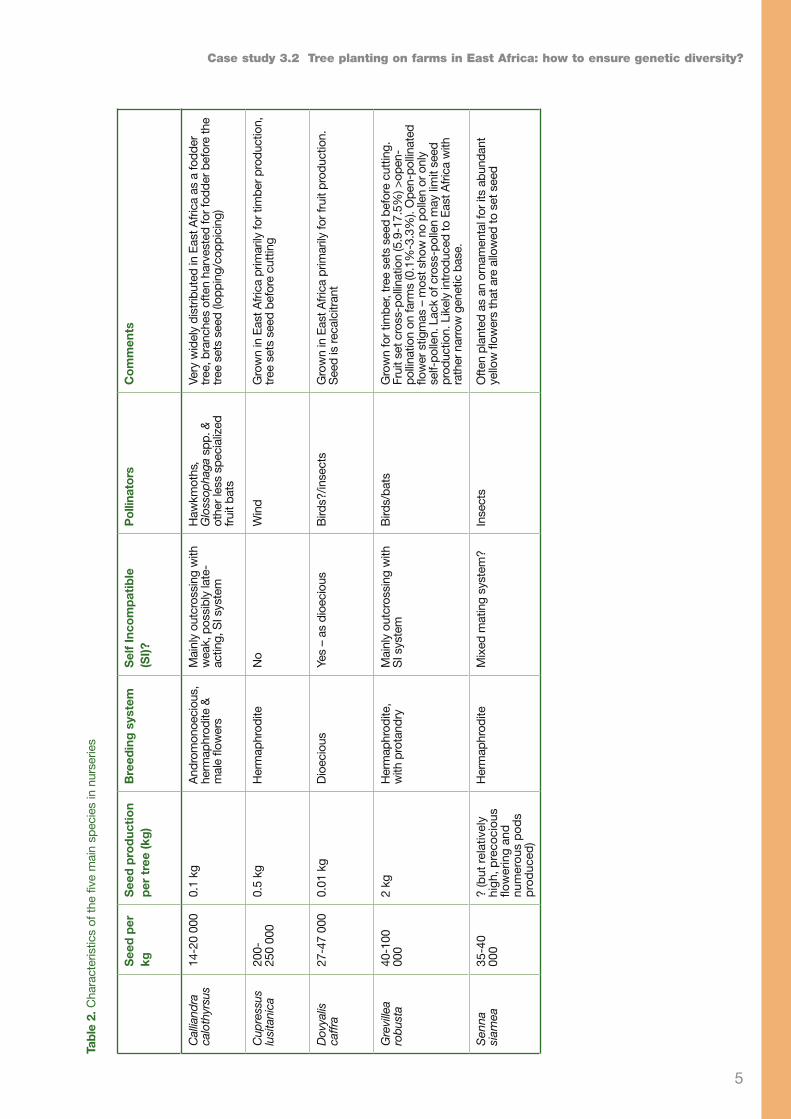
• For the five main species mentioned by nurseries, how does seed production per tree influence the number of trees that seed is collected from? How could other features of their biology (Table 2) affect genetic diversity in collections?
• How do seed collection and the production of seedlings occur? • Are seeds and seedlings transferred and if so how? Does this provide
limitations or opportunities in managing diversity?• How can mixing of seed of the same species ensure better use and
maintenance of the existing genetic diversity? Think about mean Ns/Nc compared to mean Ns/Nm.
• Do you need to give advice/training to improve the situation? Use Figures 2-4. Think if the advice/training should be to NGOs and/or directly to communities? What specific advice/training will you give?
associated with current seed collection and distribution paths.• Identify key actors (individuals and institutions), processes (what actors do) and
social limits in the seed supply chain (policy, trade, institutional, or capacity issues). Suggest communication and training needs related to specific key actors.
• Specific actions to improve the situation, addressing diversity issues in the delivery system, e.g. practical ways to collect and distribute seed/seedlings to ensure genetic diversity in nurseries and in material planted in the field.
Introduction
In areas where natural forests are disappearing, farmers increasingly depend on agroforestry ecosystems to provide tree products and services. Currently, more than 1.2 billion people practice agroforestry in some form worldwide and around 560 million people live in farm landscapes that have more than 10% tree cover. Improvement of livelihoods for small-scale farmers often involves bringing more trees into agricultural landscapes. The productivity, long-term viability and resilience of such on-farm tree populations depend on a wide genetic base for the capacity to adapt to changes in both the environment and farmers’ requirements. Many tree species are predominantly outbreeding, so any inbreeding has potentially negative impacts (e.g. losses in vigour, productivity, survival, seed set). Thus a wide genetic base is also required to prevent such inbreeding depression and thereby increase (or at least maintain) the benefits farmers derive from these trees. From a conservation perspective, only if farmers obtain these benefits will they be willing to maintain the trees in agricultural land.
The research summarized here examined the sourcing and supply of tree germplasm for small-holder farmers and the implications of current practices for genetic diversity. The World Agroforestry Centre (ICRAF) and collaborating organizations conducted surveys in East Africa (Kenya, Tanzania, Uganda) on seed sourcing by nurseries, seed supply chains, and the roles of different organizations such as non-government organizations (NGOs) and community-based organizations (CBOs).
Nursery surveys
Nursery surveys were conducted in five areas: i) Meru District, Kenya; on-farm nurseries sampled across the district, ii) Nairobi, Kenya; urban and peri-urban nurseries sampled in and around Nairobi and Kiambu, iii) Kabale District, Uganda; nurseries sampled across the district, including the buffer zone of Bwindi Impenetrable Forest, iv) Mabira, Mukono District, Uganda; including on-farm nurseries in the buffer zone to the Mabira Forest Reserve, v) Arusha, Tanzania; peri-urban and rural nurseries sampled.
For each area except Arusha (for which data were collected from nursery managers during a tree nursery management course in 2000), surveys involved visits to nurseries and interviews with nursery managers (Dec 1998-Apr 2001). Visits were timed to coincide with rainy seasons, so that nursery stocks were at a maximum. Interviews focused on the two seed-propagated tree species in each nursery that were considered by the manager to be of highest importance. Occasionally, more species were included, particularly if the number of nurseries available for survey in an area was limited. Interviewees were asked for the: i) number of seed trees sampled to establish a given nursery population or lot (Nm), ii) quantity of seedlings in that nursery lot (Ns), iii) projected number of clients (based on previous experience) for that nursery lot (Nc). On some occasions, nursery managers were unable to estimate Nc. In other cases, Nm was unknown as seed came from non-government projects or seed dealers, or managers could not recall from how many trees they had collected. Only cases where Nm was available were included in analyses. Ns values were checked directly in a
Case study 3.2 Tree planting on farms in East Africa: how to ensure genetic diversity?
3
number of cases for each area (except Arusha) and generally confirmed nursery managers’ estimates.
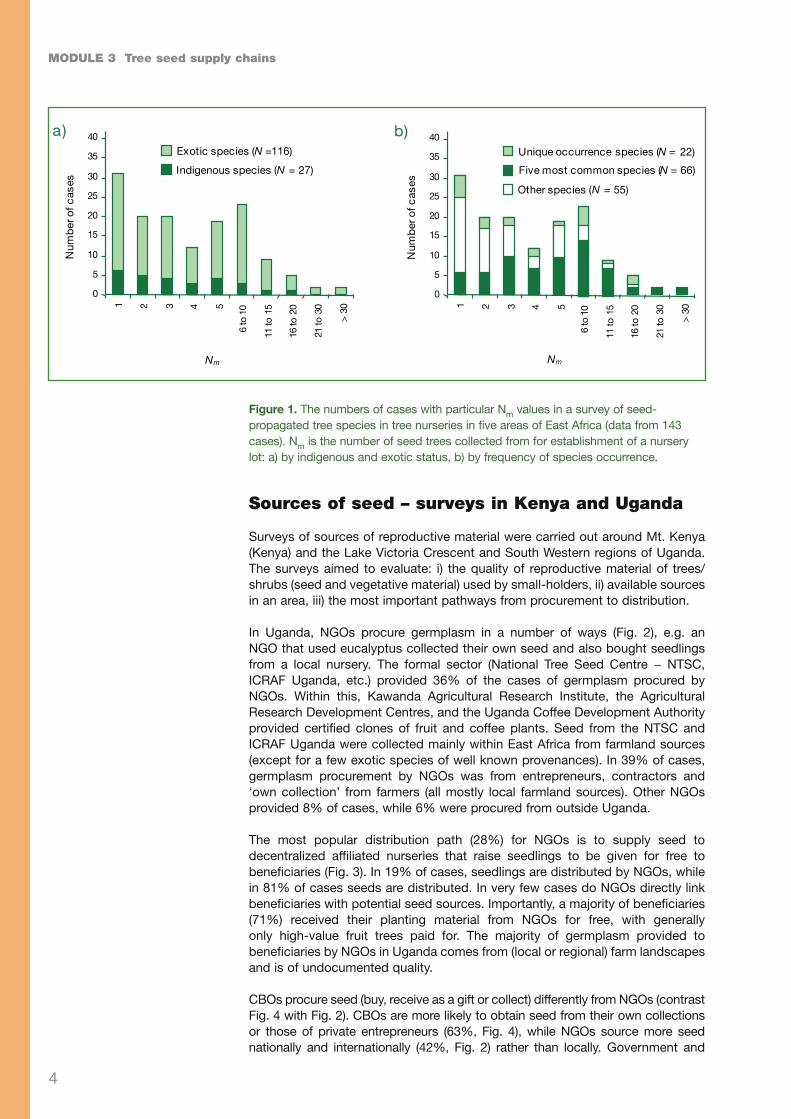
Data on 143 cases from 71 nurseries were analysed, with a total of 43 species (Table 1). Fifteen species (35%) were indigenous to the region, although indigenous species represented only 27 of all cases (19%). The five species most frequently represented were all exotic: Grevillea robusta, Calliandra calothyrsus, Dovyalis caffra, Senna siamea, Cupressus lusitanica (34, 10, 8, 7, and 7 cases, respectively; main species characteristics shown in Table 2). Twenty-two species (51%) occurred only once in the surveys. For nursery lot establishment, the mean number of seed trees collected from was 6.4 (mean Nm). In 22% of cases nursery lots were established from a single seed tree, of which six cases represented indigenous species. Considering exotic and indigenous species separately, mean Nm values were 6.8 (N=116) and 4.5 (N=27), respectively. For the five species most frequently represented (G. robusta, C. calothyrsus, D. caffra, S. siamea, C. lusitanica), mean Nm values were 8.6, 4.7, 21.6, 8.0, and 3.1, respectively. Mean Nm for the 22 species that occurred only once in the analysis was 5.9. Figure 1 shows the numbers of cases with particular Nm values. In only 18 cases (13%) was Nm>10, while in only two cases was Nm >30.
The mean number of seedlings raised in each nursery lot (mean Ns) was approximately 1400, with a mean of 28 clients projected to receive seedlings from each lot (mean Nc, Table 1). Approximately 370 seedlings were raised per maternal parent collected for nursery lot establishment (mean Ns/Nm; N=143) and each client received on average 125 seedlings from a nursery lot (mean Ns/Nc; N=113). Considering individual cases, in 106 cases the mean number of seedlings received by clients was ≥Nm. In 96 and 74 cases the mean number of seedlings received by clients was respectively ≥2 Nm and ≥5 Nm.
Table 1. Data collected in a survey of seed-propagated tree species in tree nurseries from five areas in East Africa
Pooled data shown for the five species most commonly found (by overall number of cases): Grevillea robusta, Calliandra calothyrsus, Dovyalis caffra, Senna siamea, Cupressus lusitanica (all exotics). 95% confidence intervals (±) are given for the three main variables assessed (Nm, Ns, Nc). *Client information available for a subset of analysed nurseries and cases (values in square parentheses, [ ]). Mean values relating to clients calculated from this subset of data.
Module 3 Tree seed supply chains
4
Figure 1. The numbers of cases with particular Nm values in a survey of seed-propagated tree species in tree nurseries in five areas of East Africa (data from 143 cases). Nm is the number of seed trees collected from for establishment of a nursery lot: a) by indigenous and exotic status, b) by frequency of species occurrence.
Sources of seed – surveys in Kenya and Uganda
Surveys of sources of reproductive material were carried out around Mt. Kenya (Kenya) and the Lake Victoria Crescent and South Western regions of Uganda. The surveys aimed to evaluate: i) the quality of reproductive material of trees/shrubs (seed and vegetative material) used by small-holders, ii) available sources in an area, iii) the most important pathways from procurement to distribution.
In Uganda, NGOs procure germplasm in a number of ways (Fig. 2), e.g. an NGO that used eucalyptus collected their own seed and also bought seedlings from a local nursery. The formal sector (National Tree Seed Centre − NTSC, ICRAF Uganda, etc.) provided 36% of the cases of germplasm procured by NGOs. Within this, Kawanda Agricultural Research Institute, the Agricultural Research Development Centres, and the Uganda Coffee Development Authority provided certified clones of fruit and coffee plants. Seed from the NTSC and ICRAF Uganda were collected mainly within East Africa from farmland sources (except for a few exotic species of well known provenances). In 39% of cases, germplasm procurement by NGOs was from entrepreneurs, contractors and ‘own collection’ from farmers (all mostly local farmland sources). Other NGOs provided 8% of cases, while 6% were procured from outside Uganda.
The most popular distribution path (28%) for NGOs is to supply seed to decentralized affiliated nurseries that raise seedlings to be given for free to beneficiaries (Fig. 3). In 19% of cases, seedlings are distributed by NGOs, while in 81% of cases seeds are distributed. In very few cases do NGOs directly link beneficiaries with potential seed sources. Importantly, a majority of beneficiaries (71%) received their planting material from NGOs for free, with generally only high-value fruit trees paid for. The majority of germplasm provided to beneficiaries by NGOs in Uganda comes from (local or regional) farm landscapes and is of undocumented quality.
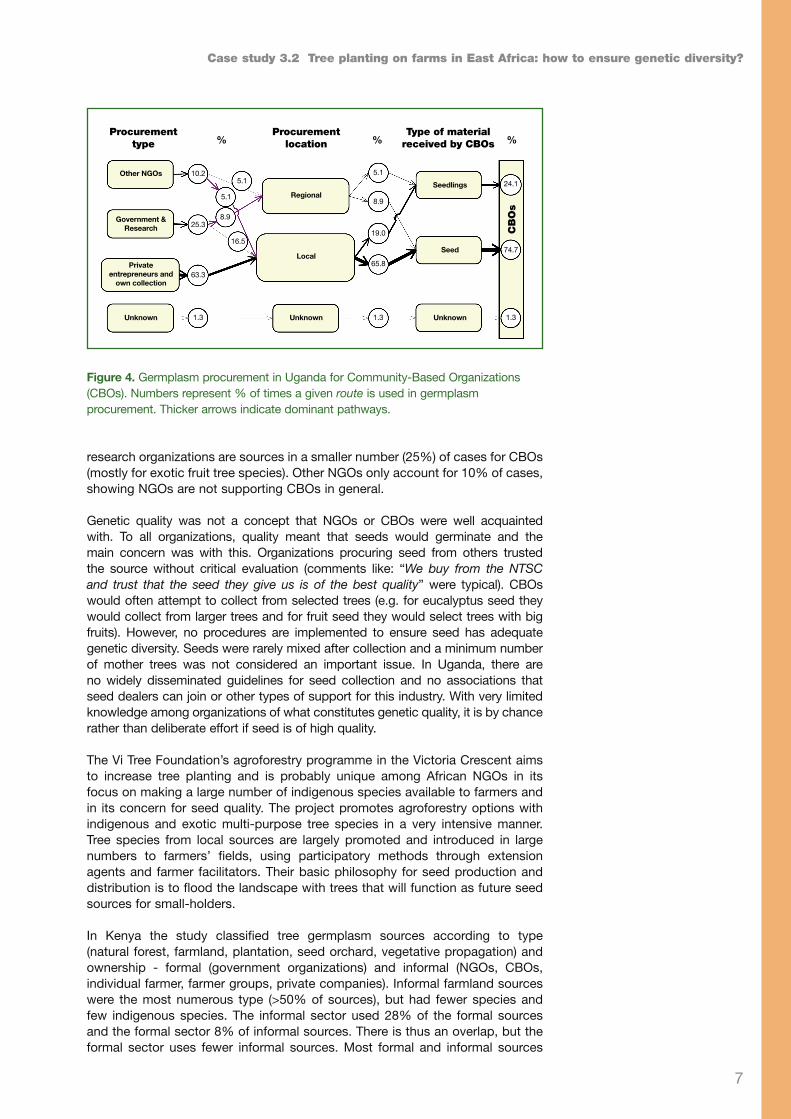
CBOs procure seed (buy, receive as a gift or collect) differently from NGOs (contrast Fig. 4 with Fig. 2). CBOs are more likely to obtain seed from their own collections or those of private entrepreneurs (63%, Fig. 4), while NGOs source more seed nationally and internationally (42%, Fig. 2) rather than locally. Government and
0
5
10
15
20
25
30
35
40
1 2 3 4 5
6 to
10
11 to
15
16 to
20
21 to
30
> 3
0
Nm
Num
ber
of c
ases
b)
0
5
10
15
20
25
30
35
40
1 2 3 4 5
6 to
10
11 to
15
16 to
20
21 to
30
> 3
0
Exotic species (N =116)
Indigenous species (N = 27)
Nm
Num
ber
of c
ases
a )
Five most common species (N = 66)
Unique occurrence species (N = 22)
Other species (N = 55)
0
5
10
15
20
25
30
35
40
1 2 3 4 5
6 to
10
11 to
15
16 to
20
21 to
30
> 3
0
Nm
Num
ber
of c
ases
b)
0
5
10
15
20
25
30
35
40
1 2 3 4 5
6 to
10
11 to
15
16 to
20
21 to
30
> 3
0
Exotic species (N =116)
Indigenous species (N = 27)
Nm
Num
ber
of c
ases
a )
Five most common species (N = 66)
Unique occurrence species (N = 22)
Other species (N = 55)
Case study 3.2 Tree planting on farms in East Africa: how to ensure genetic diversity?
5
Tab
le 2
. Cha
ract
eris
tics
of t
he fi
ve m
ain
spec
ies
in n
urse
ries
See
d p
er
kgS
eed
pro
duc
tio
n p
er t
ree
(kg
)B
reed
ing
sys
tem
Sel
f In
com
pat
ible
(S
I)?P
ollin
ator
sC
om
men
ts
Cal
liand
ra
calo
thyr
sus
14-2
0 00
00.
1 kg
A
ndro
mon
oeci
ous,
he
rmap
hrod
ite &
m
ale
flow
ers
Mai
nly
outc
ross
ing
with
w
eak,
pos
sibl
y la
te-
actin
g, S
I sys
tem
Haw
kmot
hs,
Glo
ssop
haga
spp
. &
othe
r les
s sp
ecia
lized
fr
uit b
ats
Very
wid
ely
dist
ribut
ed in
Eas
t Afr
ica
as a
fodd
er
tree
, bra
nche
s of
ten
harv
este
d fo
r fod
der b
efor
e th
e tr
ee s
ets
seed
(lop
ping
/cop
pici
ng)
Cup
ress
us
lusi
tani
ca20
0-25
0 00
00.
5 kg
Her
map
hrod
iteN
oW
ind
Gro
wn
in E
ast A
fric
a pr
imar
ily fo
r tim
ber p
rodu
ctio
n,
tree
set
s se
ed b
efor
e cu
ttin
g
Dov
yalis
ca
ffra
27-4
7 00
00.
01 k
gD
ioec
ious
Yes
– as
dio
ecio
usB
irds?
/inse
cts
Gro
wn
in E
ast A
fric
a pr
imar
ily fo
r fru
it pr
oduc
tion.
S
eed
is re
calc
itran
t
Gre
ville
a ro
bust
a40
-100
00
02
kgH
erm
aphr
odite
, w
ith p
rota
ndry
Mai
nly
outc
ross
ing
with
S
I sys
tem
Bird
s/ba
tsG
row
n fo
r tim
ber,
tree
set
s se
ed b
efor
e cu
ttin
g.
Frui
t set
cro
ss-p
ollin
atio
n (5
.9-1
7.5%
) >op
en-
polli
natio
n on
farm
s (0
.1%
-3.3
%).
Ope
n-po
llina
ted
flo
wer
stig
mas
– m
ost s
how
no
polle
n or
onl
y se
lf-po
llen.
Lac
k of
cro
ss-p
olle
n m
ay li
mit
seed
pr
oduc
tion.
Lik
ely
intr
oduc
ed to
Eas
t Afr
ica
with
ra
ther
nar
row
gen
etic
bas
e.
Sen
na
siam
ea35
-40
000
? (b
ut r
elat
ivel
y hi
gh, p
reco
ciou
s flo
wer
ing
and
nu
mer
ous
pod
s p
rod
uced
)
Her
map
hrod
iteM
ixed
mat
ing
syst
em?
Inse
cts
Ofte
n pl
ante
d as
an
orna
men
tal f
or it
s ab
unda
nt
yello
w fl
ower
s th
at a
re a
llow
ed to
set
see
d
Module 3 Tree seed supply chains
6
Linking germplasmproducer with users
OtherNGOs, CBOs
andindependent
nurseryoperations
Central org.nurseries
Decentral org.nurseries
Seed distributedto CBO etc.
From abroad
Ben
efici
arie
s
Free
Sal
e
Org
aniz
atio
ns
17.4
1.4
71.0
13.0
21.7
65.2
5.8
7.2
29.0
27.5
5.8
21.7
15.9
1.41.4
8.7
37.7
33.3
18.8
4.3
4.3
Distributionsystem
Planting materialdistribution
Recipients% %
%%
Private entrepreneursand own collection
Government &Research
From abroad International Seedling
Seed
Scions
Regional
Local or regional
Org
aniz
atio
ns
Local
Unknown Unknown
38.7
36.4
33.2
5.3
0.8
8.5
36.1
1.3
0.3
5.0
8.0
21.5
2.7
4.8
5.6 0.5
4.8
73.5
21.2
0.3
3.2
7.2
5.0
26.5
5.8
2.4
6.1
8.2
10.6
% % %%ProcurementProcurement
locationType of material
received by NGOs
Other NGOs
Unknown
Figure 2. Germplasm procurement in Uganda for NGOs. Numbers represent % of times a given route is used in germplasm procurement. Flow pathways from left to right show from whom (procurement), where (procurement location) and in what form (type of material) NGOs receive material. Thicker arrows indicate dominant pathways.
Figure 3. Germplasm distribution in Uganda by NGOs. Numbers represent % of times channels are used out of the total number of channels (some NGOs use multiple channels). Flow pathways from left to right show types of actors involved in distribution, whether material is given for free or by sale (planting material distribution), and if additional actors are involved in input supply chains (recipients). Thicker arrows indicate dominant pathways.
Case study 3.2 Tree planting on farms in East Africa: how to ensure genetic diversity?
7
research organizations are sources in a smaller number (25%) of cases for CBOs (mostly for exotic fruit tree species). Other NGOs only account for 10% of cases, showing NGOs are not supporting CBOs in general.
Genetic quality was not a concept that NGOs or CBOs were well acquainted with. To all organizations, quality meant that seeds would germinate and the main concern was with this. Organizations procuring seed from others trusted the source without critical evaluation (comments like: “We buy from the NTSC and trust that the seed they give us is of the best quality” were typical). CBOs would often attempt to collect from selected trees (e.g. for eucalyptus seed they would collect from larger trees and for fruit seed they would select trees with big fruits). However, no procedures are implemented to ensure seed has adequate genetic diversity. Seeds were rarely mixed after collection and a minimum number of mother trees was not considered an important issue. In Uganda, there are no widely disseminated guidelines for seed collection and no associations that seed dealers can join or other types of support for this industry. With very limited knowledge among organizations of what constitutes genetic quality, it is by chance rather than deliberate effort if seed is of high quality.
The Vi Tree Foundation’s agroforestry programme in the Victoria Crescent aims to increase tree planting and is probably unique among African NGOs in its focus on making a large number of indigenous species available to farmers and in its concern for seed quality. The project promotes agroforestry options with indigenous and exotic multi-purpose tree species in a very intensive manner. Tree species from local sources are largely promoted and introduced in large numbers to farmers’ fields, using participatory methods through extension agents and farmer facilitators. Their basic philosophy for seed production and distribution is to flood the landscape with trees that will function as future seed sources for small-holders.
In Kenya the study classified tree germplasm sources according to type (natural forest, farmland, plantation, seed orchard, vegetative propagation) and ownership - formal (government organizations) and informal (NGOs, CBOs, individual farmer, farmer groups, private companies). Informal farmland sources were the most numerous type (>50% of sources), but had fewer species and few indigenous species. The informal sector used 28% of the formal sources and the formal sector 8% of informal sources. There is thus an overlap, but the formal sector uses fewer informal sources. Most formal and informal sources
Privateentrepreneurs and
own collection
Government &Research
Other NGOs
Unknown Unknown
Local
Regional
Unknown
Seed
Seedlings
CB
Os
10.2
25.3
63.3
65.8
19.0
8.9
5.15.1
5.1
8.9
16.5
24.1
74.7
1.3 1.3 1.3
Procurementtype
Procurementlocation
Type of materialreceived by CBOs% % %
Figure 4. Germplasm procurement in Uganda for Community-Based Organizations (CBOs). Numbers represent % of times a given route is used in germplasm procurement. Thicker arrows indicate dominant pathways.
Module 3 Tree seed supply chains
8
Tab
le 3
. Num
ber
of t
rees
for
seed
sou
rces
, tre
es c
olle
cted
from
and
num
bers
of s
eed
colle
cted
in t
he p
revi
ous
year
Num
ber
of
seed
so
urce
s b
y ca
teg
ory
of
tree
nu
mb
ers
com
pri
sing
tha
t so
urce
Num
ber
of
tree
s at
see
d s
our
ce s
ites
, tre
es
colle
cted
fro
m a
nd n
umb
ers
of
seed
co
llect
ed in
th
e p
revi
ous
yea
r (M
y K
enya
reg
ion)
Sou
rce
type
Unk
now
n1-
910
-19
20-2
930
-49
>50
Unk
now
n1-
910
-19
20-2
930
-49
>50
Num
bers
of s
eed
colle
cted
by
see
d so
urce
type
Form
alFa
rmla
nd1
21
11
132
000-
830
000
Form
alN
atur
al F
ores
t1
23
13
4800
-100
000
Form
alP
lant
atio
ns1
11
37
41
23
230
000
-35
000
000
Form
alS
eed
orch
ards
11
186
963
-171
000
Info
rmal
Farm
land
6544
178
77
108
31
230
0-22
0 00
0 00
0
Info
rmal
Pla
ntat
ions
72
11
140
000
-3 3
87 5
00
Info
rmal
See
d or
char
ds1
14
100-
20 0
00
Case study 3.2 Tree planting on farms in East Africa: how to ensure genetic diversity?
9
produce germplasm for sale, but a larger proportion of informal sources produce germplasm for free (in particular, farmland sources promoted by ICRAF for fodder trees, which feed into farmer-to-farmer seed diffusion pathways). Grafted fruit seedlings are sold rather than given for free, but another survey in the Mount Kenya area suggested a larger informal vegetative propagation chain, with up to 28% of all planted farm trees sourced in this manner.
The Kenya survey gave detailed information on sizes of sources, including numbers of trees in a source, as well as the numbers of trees collected from (Table 3) and can be contrasted with ICRAF’s Criteria used for the evaluation of the types of seed sources (Box 1). For several sources, the number of trees collected from reflects the limited number of trees in the source. However, in plantations and natural forest with many trees available, collectors often take seed from only a few trees. For farmland sources, trees are usually far apart (scattered on farmlands), and for some species the number, density and uneven distribution of trees could be a concern with respect to adequate cross-pollination. A survey around Mount Kenya also recorded densities of less than one seed producing tree per hectare for approximately 75% of 300 observed species. More than half the species observed (primarily indigenous) had a density less than 0.25 trees per hectare.
Perceived problems in the maintenance and protection of sources, as well as collection and distribution, differed between formal and informal sectors. While a majority of formal sector sources had problems of maintenance and protection, this was not the case for informal sources. For the informal sector the dominant problem in collection is lack of technical knowledge, while for the formal it is limited equipment. This is probably related to collection techniques, where many informal sources are shrubs, while many formal sources are tall trees. For distribution, the main informal sector problem was lack of a market.
Box 1. Criteria used for the evaluation of the types of seed sources (Mbora and Lillesø 2007)
Farmland seed sources: ideally a farmland seed source should consist of a minimum of 50 trees with a minimum of 30 trees contributing to a seed lot. This strategy will increase the likelihood that the collection is broad-based and minimize inbreeding for the next generation.
Natural forest seed sources: ideally a natural forest seed source should consist of a minimum of 50 trees, preferably more – all of which should be more than 100 m from other trees of the same species with a minimum of 40 trees contributing to a seed lot.
Plantation seed sources: ideally the minimum size of a plantation source should be 75 trees with a minimum of 40 trees contributing to a seed lot. The likelihood that a plantation originated from seed collected from one (or a few trees) will be lower for plantations covering large areas, and for species which produce few, large seed.
Seed orchards sources: ideally a seed orchard with family structure should start with at least 50 families, whereas a bulked seed orchard should start with at least 80 families.
Why we recommend these criteria: trees introduced to agroforestry landscapes become the future seed trees for farmers. The extra cost of collecting from many trees is for most species very small per seedling planted, while the effect may be large.
Module 3 Tree seed supply chains
10
On the other hand, most germplasm distributed by the formal sector is by request from clients and thus collection takes place when there is a market for seed.
The study found that the informal sector is able to produce as good physiological quality germplasm as the formal sector, though both sectors do not provide the best material possible to farmers. Improvements should be possible based on both sectors common stated aim of benefiting small-holders’ livelihoods and farm incomes. The informal sector has a larger capacity for expansion than the formal. There are opportunities for increasing the efficiency and reach of the tree germplasm sector, but it requires that government accepts that a private sector approach based on small-scale entrepreneurs is beneficial. Policy and the development of suitable support systems need to be implemented accordingly.
East Africa profile
Kenya• Area: 580 367 km2, low plains rise to the Central Highlands bisected by the
Great Rift Valley; fertile plateau in the west.• Population: 38 million.• GDP per capita: $1600 (2009 estimated).• Unemployment rate 40%, with 50% of population below poverty line.
Seventy five per cent of the labour force is in agriculture. Principal products: tea, coffee, wheat, sugarcane, fruit, flowers, vegetables, dairy products, beef. Principal exports: tea, coffee, horticultural products, petroleum products, fish, cement.
• The Kenyan Highlands comprise one of the most successful agricultural production regions in Africa; the unique physiography supports abundant and varied wildlife of scientific and economic value.
Tanzania • Area: 947 300 km2, with plains along the coast, a central plateau and
highlands in north and south.• Population: 41.05 million.• GDP per capita $1400 (2009 estimated).• Thirty six per cent of the population is below the poverty line. Eighty per
cent of the labour force is in agriculture. Principal products: coffee, sisal, tea, cotton, pyrethrum, cashew nuts, tobacco, fruit, vegetables, cattle. Principal exports: gold, coffee, cashew nuts, cotton.
• The economy depends heavily on agriculture, which accounts for more than one quarter of GDP and provides 85% of exports. Topography and climatic conditions limit cultivated crops to about 4% of the land area. Industry traditionally featured processing of agricultural products and light consumer goods. Long-term growth to 2005 showed a pickup in industrial production and substantial increase in output of minerals, led by gold.
Uganda• Area: 241 038 km2, mostly plateau with rim of mountains.• Population: 32.37 million. • GDP per capita: $1200 (2009 estimated).• Thirty five per cent of the population is below the poverty line. Eighty two per
cent of the labour force is in agriculture. Principal products: coffee, tea, cotton, tobacco, cassava, potatoes, maize, millet, flowers, cattle. Principal exports: coffee, fish, fish products, tea, cotton, flowers, horticultural products, gold.
• Uganda has substantial natural resources, including fertile soils, regular rainfall, small deposits of copper, gold, and other minerals, and recently discovered oil. Agriculture is the most important sector of the economy.
Case study 3.2 Tree planting on farms in East Africa: how to ensure genetic diversity?
11
Coffee accounts for the bulk of export revenues. Since 1990, economic reforms led to solid economic growth based on continued investment in infrastructure, improved incentives for production and exports and lower inflation.
Tree seed and seedling supply policiesTree seed and seedling delivery systems in many developing countries are still regarded as solely belonging to the sphere of forestry, although most trees are currently planted on farmland and most seed/seedling customers are rural farmers. The availability of tree planting material is seen as one of the main obstacles for large scale improvement of tree planting by small-holders and the question often posed is “How can we increase the efficiency of national tree seed centres, research organizations, NGOs and other actors to produce and distribute seed and seedlings?” Lessons from agricultural crop systems suggest the question should be “How and to what extent can national tree seed centres, agricultural and forestry research organizations and NGOs support the development of a decentralized market for seeds and seedlings?”
In many African countries, national tree seed centres (NTSCs) traditionally had the official responsibility to provide seed to tree planters. The role of NTSCs in tree seed procurement has declined, and a large number of NGOs, CBOs, bilateral projects and small private suppliers now procure and deliver tree seed and seedlings to farmers. Most NGO and bilateral projects exist for a limited time, are active in relatively small areas and work with a limited number of tree species. Tree seed and seedling production and distribution systems share some of the same problems as the agricultural seed sector. For the majority of small-holders, the success of formal crop seed delivery systems and markets has been limited to a few species (e.g. hybrid maize, sorghum), with prevailing producers and distributors unable to provide other crops. It is estimated that parastatal seed systems at their peak supplied only about 10% of the total crop seed that was sown by small-holders each year. Many crop seed parastatals have now been privatized or dissolved, mainly because they were seen as inefficient and too dependent on state or donor subsidies. Private enterprise has taken over some roles, such as training and extension and value chain development. However, access to improved seed is still a major limitation for small-holders.
Due to the biological differences between trees and annual crops, not all aspects of crop seed systems are valid for tree seed systems. In particular, seed source identification, establishment and management are different due to the larger size, different breeding systems, longer period to maturity, greater longevity and overlapping generations of perennial woody species compared to crops. Seed production, procurement and distribution require larger landscape units than for crop seed production. Also, for practically all products from trees, seed is a very small part of the total cost of production.
Specific policies that take account of the different roles of public and private sectors in production, procurement and distribution of tree seed and seedlings exist in only a few African countries, although tree seed has sometimes been tentatively included in proposed crop seed policies. Extrapolation from the emerging consensus for crop systems suggests that the creation of sustainable tree germplasm delivery systems to small-holders requires fundamental changes in the approaches of government, donors, private enterprise and NGOs. In particular, the development of sustainable tree seed/seedling systems will require that the state redefines its main role from seed provider to an enabler of small- and larger-scale private tree seed/seedling producers and distributors. Furthermore, the current NGO model of providing tree planting material for free has little justification and impedes the development of the decentralized small-scale enterprise model for tree seed distribution, in the same way as it does for crop seed.
Module 3 Tree seed supply chains
12
Information sources
Forest & Landscape (formerly Forest & Landscape Denmark) has been involved in characterising and developing more effective tree germplasm delivery systems in the tropics for several decades. Further information can be found on their website www.sl.life.ku.dk. This case study is derived mainly from the following sources, several of which originated from their work and their collaboration with ICRAF.
Brandi E, Lillesø J-PB, Moestrup S, Kisera HK. 2007. Do organisations provide quality seed to smallholders? - A study on tree planting in Uganda, by NGOs and CBOs. Development and Environment No. 8-2007. Forest & Landscape Denmark.
Dawson IK, Lengkeek A, Weber JC, Jamnadass R. 2009. Managing genetic variation in tropical trees: linking knowledge with action in agroforestry ecosystems for improved conservation and enhanced livelihoods. Biodiversity and Conservation 18:969–986.
Graudal L, Lillesø JPB. 2007. Experiences and future prospects for tree seed supply in agricultural development support-based on lessons learnt in Danida supported programmes 1965-2005. Danida Working Paper-April 2007. Ministry of Foreign Affairs of Denmark. Copenhagen, Denmark.
Lengkeek AG, Jaenicke H, Dawson, IK. 2005. Genetic bottlenecks in agroforestry systems: results of tree nursery surveys in East Africa. Agroforestry Systems 63:149–155.
Lillesø, JBL, Graudal L, Moestrup S, Kjær ED, Kindt R, Mbora A, Dawson IK, Muriuki J, Ræbild A, Jamnadass R. 2011. Innovation in input supply systems in smallholder agroforestry: seed sources, supply chains and support systems. Agroforestry Systems 83:347-359.
Mbora A, Lillesø J-PB. 2007. Sources of tree seed and vegetative propagation of trees around Mt. Kenya. Development and Environment No. 9-2007. Forest & Landscape Denmark.
Module 3 Tree seed supply chains
B
Forest Genetic Resources Training GuideMODULE 1 Species conservation strategies
1.1 Leucaena salvadorensis: genetic variation and conservation
1.2 Talbotiella gentii: genetic variation and conservation1.3 Shorea lumutensis: genetic variation and conservation
MODULE 2 Trees outside of forests
2.1 Conservation of tree species diversity in cocoa agroforests in Nigeria
2.2 Devising options for conservation of two tree species outside of forests
MODULE 3 Tree seed supply chains
3.1 Genetic bottlenecks in the restoration of Araucaria nemorosa
3.2 Tree planting on farms in East Africa: how to ensure genetic diversity?
MODULE 4 Forest management
4.1 Impacts of selective logging on the genetic diversity of two Amazonian timber species
4.2 Does selective logging degrade the genetic quality of succeeding generations through dysgenic selection?
4.3 Conserving Prunus africana: spatial analysis of genetic diversity for non-timber forest product management
MODULE 5 How local is local? – the scale of adaptation
5.1 Selecting planting material for forest restoration in the Pacific north-west of the USA
5.2 Local adaptation and forest restoration in Western Australia
Other modules to be published among the following: Plantation forestry, Tree domestication, Forest restoration, Genetic modification