34
2005-12-07 Case study – final draft SOCIO-ECONOMIC STUDY – Ystad Sandskog COMPONENT 3 VALUATION OF THE SHORELINE MESSINA PROJECT
2005-12-07
Case study – final draft
SOCIO-ECONOMIC STUDY – Ystad Sandskog
COMPONENT 3
VALUATION OF THE SHORELINE
MESSINA PROJECT

Component 3
3(34)
PREFACE
This case study is made within the Messina project. The purpose is to demonstrate a practical application of economic analysis in coastal management. The case study is based on existing data and many shortcuts have been taken and simplifications have been made. This refers to the fundamental technical prognosis of the implications of erosion and sea level rise. However we hope that this first outline can serve as inspiration and guidance for further case studies. Thanks and acknowledgement to everybody who have contributed to this case study. Ystad November 2005 Ann-Sofi Eriksson and Mats Persson
Component 3
4(34)
LIST OF CONTENT
Preface .............................................................................................................. 3
Summary ........................................................................................................... 5
1 Introduction................................................................................................. 6
2 OVERVIEW OF Coastal processes............................................................ 6 2.1 The formation of Sandskogen...................................................................... 6
2.1.1 Historical ................................................................................................... 6 2.2 Active processes and future development .................................................... 7
3 Values affected by coastal processes ...................................................... 7 3.1 Archaeological values ................................................................................. 8 3.2 Values for the municipality of Ystad ........................................................... 8 3.3 Infrastructure values.................................................................................... 9 3.4 Spare time values ........................................................................................ 9 3.5 Nature values .............................................................................................. 9 3.6 Values in buildings and establishments........................................................ 9 3.7 Values of tourism...................................................................................... 10
4 Identification of stakeholders .................................................................. 10
5 Technical assessment of the future and Alternative ways of action.... 11 5.1 The technical assessment........................................................................... 11 5.2 The strategy of the municipality ................................................................ 13 5.3 Studied alternatives of coastal management............................................... 13
6 Socio-Economic study ............................................................................. 14 6.1 Cost-Benefit Analysis ............................................................................... 14 6.2 Valuation of effects ................................................................................... 14 6.3 Values lost in “Do nothing” case (No project) ........................................... 15 6.4 Cost of implementing protecting measures ................................................ 15 6.5 Evaluation model ...................................................................................... 16
7 Results and discussion............................................................................ 16
8 Conclusions .............................................................................................. 17
References...................................................................................................... 17
Appendix A – Maps showing the evaluated coastline and intersection points............................................................................................................... 19
Appendix B – Cost benefit analysis.............................................................. 29
Component 3
5(34)
SUMMARY
Sandskogen is an important part of the city of Ystad. Over the last 100 years the coastline has moved about 50 meters inland. The coastline of Sandskogen consists of sandy beaches and the area directly above the shore is well visited for different kind of recreation activities. It is vital for Ystad that the erosion of the coast does not continue. Large areas at Ystad sandskog are currently protected from erosion and possible flooding at high water levels by an existing seawall with promenade that needs constant maintenance. If the existing wall and other protective measures are not maintained and upgraded the weather situations will lead to flooding of the protected area and progressive erosion will lead to loss of large beach areas. Considering the predicted sea level rise over the next 100 years, due to global varming, protection of the shoreline and land areas close to the sea is becoming more acute. A brief Social Cost-Benefit Analysis (CBA) of the area has been conducted. It has been conducted with scarce resources and is therefore only accurate as to give indications. The CBA indicates that the benefits of maintaining and protecting the present shoreline is 3 times larger than the cost. Of the investigated alternatives, beach nourishment is the best option. However, there should be additional technical and economical evaluation before final strategy is decided.
Component 3
6(34)
1 INTRODUCTION
Sandskogen is situated east of the city of Ystad and has an area of about 5 km2. With a coastal strip of about 5 kilometres1 it is an important site for the inhabitants of Ystad and for its tourists. The coastline of Sandskogen consists of sandy beaches and the area directly above the shore is well visited for different kind of recreation activities. In the last 50 – 100 years Sandskogen has lost about 50 meters of shoreline due to coastal erosion and it is vital for Ystad that this erosion does not continue. Large areas at Ystad sandskog are currently protected from erosion and possible flooding at high water levels by an existing seawall with promenade that needs constant maintenance. Other measures taken to reduce the effects of coastal erosion in Sandskogen are a reverse filter, groins, draining pipes and vegetation stabilisation. Failure of the existing wall and other protective measures will at extreme weather situations lead to flooding of the protected area, progressive erosion will lead to loss of the beach area with some 415 000 m2 in the coming 100 years.
2 OVERVIEW OF COASTAL PROCESSES
2.1 The formation of Sandskogen2
2.1.1 Historical
Approximately 8 000 years ago the sea level in Ystad was about ten meters below the sea level today. At this time the Baltic Sea was a freshwater lake since it was separated from the North Sea. But as the water level in the oceans began to rise the water was forced from the west into the Baltic Sea, thereby forming water passages as for instance Öresund. Due to these changes, the sea level in Ystad started to change and about 7 000 years ago the sea level was 3-5 meters over the sea level that we can observe today. As a first step, this lead to the creation of swamps over large areas of Sandskogen and on top of these swamps peat was formed. As the water level continued to rise Sandskogen was more and more covered by water. Due to waves and coast parallel streams sand was transported along the coastline. At this time the area around Ystad consisted of an open creek and as a result the sand could settle in long, bank shaped formations. A major accumulation of sand took place and this accumulation continued over thousands of years. The water level changed a lot during these years though, and at times the banks rose from the water, leaving them unprotected against the waves. The waves brought larger materials with them and because of this, stones and rocks could also accumulate together with the sand. When the area consisting of swamps and sand banks ultimately ended up above the sea level the area called Sandskogen had been formed.
1 Ystads Fornminnesförening, p. 9 2 Ystads Fornminnesförening, p. 16-20
Component 3
7(34)
In the early Middle Ages the city of Ystad began to grow. Along with the growing process one can imagine an increasing demand of timber, as fuel and in different constructions. The woods of Sandskogen were used for this purpose, leaving the grounds open as pastureland. At the same time grass from the pastures was harvested to be used as building material in different enclosures and this all together surely had a great negative effect on the grounds. Around this time seaweed from the coastline was also removed from the sandy beaches to be used as fertilizer, leaving the beaches wide open. As a grand total, the sand in Sandskogen was left unbound and easily accessible for wind transportation. Shifting sand hereby became a big problem for Ystad and its surroundings and sand hills were formed all over Sandskogen.
To reduce the negative effects of the shifting sand the idea to plant vegetation in Sandskogen is thought to have been acknowledged early on. For example, the well-known Swedish botanist Carl von Linné proposed in 1749 that the area should be planted with pine trees to obtain less windy conditions and avoid the shifting sand. Many attempts were made to plant vegetation in Sandskogen. All of which proved useless since the conditions were too hard. In 1838 a Danish expert, mr Fintelmann, was called in and finally the problem became manageable. He proposed that an embankment should be built along the coastline and that this bank should be planted with sand oat grass and sand rye grass, thus protecting the area from the wind and the sand. After the construction was finished the real plantation could begin and through the 19th century and in the beginning of the 20th century trees, bushes and grasses were planted all over Sandskogen.
2.2 Active processes and future development
The studied area is mainly influenced by a coast parallel current going from west to east and the studied area is part of a larger but well defined coastal sediment cell3. The most extreme waves are developed with wind from south-east to west-south-west. The dominant wind direction is from the west, which also contains the hardest winds forces4. Predictions based on evaluation of historical data show that the coastal erosion in Sandskogen will be about 0.5 meters per year if no action will be taken. Since different types of erosion protection already exists the erosion of today both act on the shoreline and on the underwater areas. Underwater erosion thereby undermines the ground and this erosion is therefore just as important as the more visible one. To maintain the coastal situation that exists today maintenance actions, mostly sand nourishment onto the beaches, must therefore be undertaken. A big problem is also to get a clear picture of what an erosion of 0.5 meters per year really means. Sandskogen consists of lowlands protected almost entirely by dunes situated very near the coastal line. If these dunes disappear large areas could be flooded, with or without continued erosion.
3 VALUES AFFECTED BY COASTAL PROCESSES
Sandskogen consists of sandy grounds covered with mostly pine-trees. North of Sandskogen a wetland area, around 3 km2, is situated. Sandskogen is considered to be an important area for many different reasons and there are many stakeholders. First of all
3 Eurosion reports 4 Uppspolning och klittererosion längs Ystad kusten, p 24
Component 3
8(34)
the municipality of Ystad and different authorities all have an interest in preserving Sandskogen. Also all of those who have a money interest in the area, such as owners of houses, cottages, restaurants and different kinds of tourist establishments are dependent on the future of Sandskogen. Last but not least the area is well visited by tourists and inhabitants in and around Ystad. The values of Sandskogen listed below gives a general picture of what is at stake if the erosion is allowed to continue.
3.1 Archaeological values
The area within and around Sandskogen is of great archaeological interest. Many settlements and findings from the time called the Mesolithic (10 000 – 4 000 B.C.) have been found and it is clear that the area was attractive and well used by the people of this age5.
3.2 Values for the municipality of Ystad
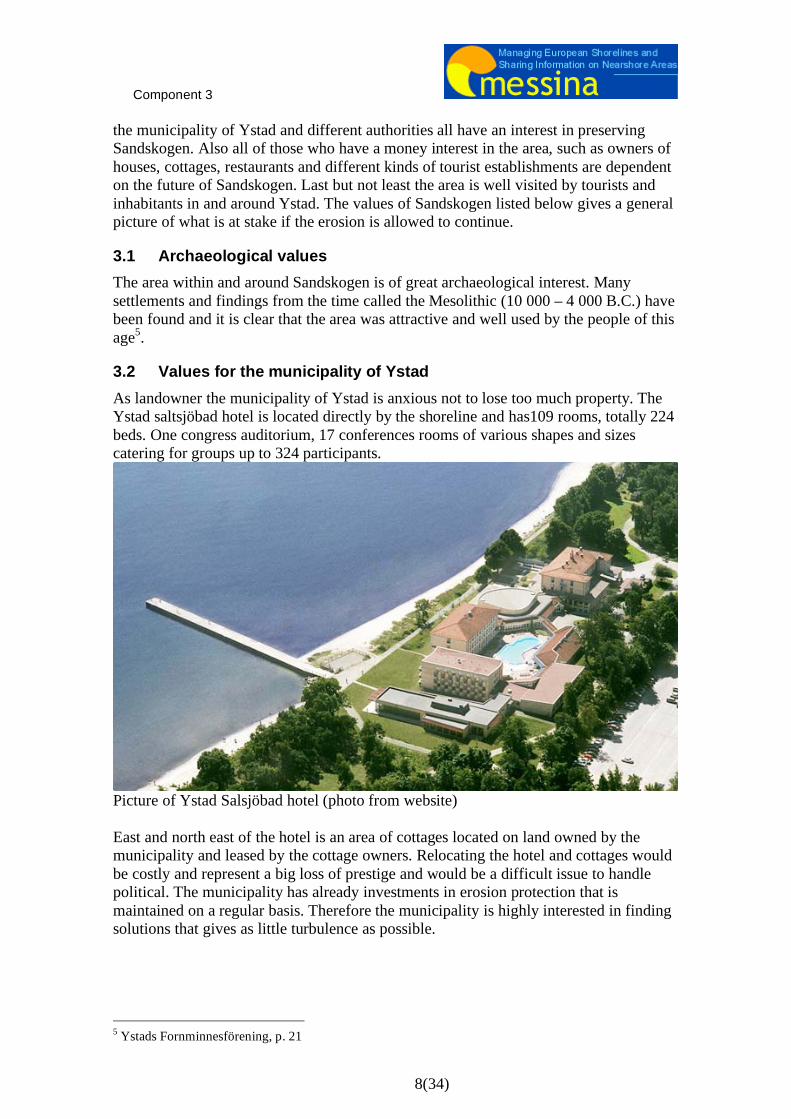
As landowner the municipality of Ystad is anxious not to lose too much property. The Ystad saltsjöbad hotel is located directly by the shoreline and has109 rooms, totally 224 beds. One congress auditorium, 17 conferences rooms of various shapes and sizes catering for groups up to 324 participants.
Picture of Ystad Salsjöbad hotel (photo from website) East and north east of the hotel is an area of cottages located on land owned by the municipality and leased by the cottage owners. Relocating the hotel and cottages would be costly and represent a big loss of prestige and would be a difficult issue to handle political. The municipality has already investments in erosion protection that is maintained on a regular basis. Therefore the municipality is highly interested in finding solutions that gives as little turbulence as possible.
5 Ystads Fornminnesförening, p. 21
Component 3
9(34)
3.3 Infrastructure values
Both national road nr 9 and the local railway run through Sandskogen. These constructions, as well as water and sewage pipes, electrical and telephone cabling etc could be at stake if the erosion is allowed to continue.
3.4 Spare time values
In the 1930s the government in Sweden proposed a 40-hour working week and in its footsteps came holiday with pay for the Swedes. Already around 1850 the citizens of Ystad started to recognise what an asset Sandskogen was6 but the spare time activities really took off after this historic event. Since then Sandskogen has been an important recreation site for everyone in and around Ystad. A lot of people come to Sandskogen just for walks along the beach or in the forest and the place is of great value for people interested in nature and biology as well as for sport fishers, cyclists and runners. The fact that the beaches in Sandskogen attract a lot of people is of course given and the beaches importance to Ystad can hardly be overrated. In the summer the beaches are well visited for baths, sunbaths, beach volleyball and handball and in the wintertime the activities are instead winter baths and visits to the sauna. Many different sport associations are also located in Sandskogen with sports like soccer, track and fields, golf and tennis. A sports field is also situated very close to the beach.
3.5 Nature values7
Sandskogen consists of many different types of biotopes: swampy grounds, dry pine forests, deciduous forests, bushy grounds, thick fir and pine forests, older forests and summerhouses with lawns. The district is therefore important for many plants, herbs and animals and 205 out of the 450-hectare large area of Sandskogen is a Natura 2000-area. Sandskogen is, among other things, important for birds and during an inventory in 1999 69 different species were found. Eight of these are of specific interest since they are red listed in Sweden and are considered to be vulnerable (1 species) or near threatened (7 species)8. It is only fair to say that many important habitats are at risk because of the erosion.
3.6 Values in buildings and establishments
The colonisation of Sandskogen started as early as in the later half of the 19th century. Among the earliest buildings a shooting range and a dance pavilion can be mentioned. In 1897 Saltsjöbaden, a hotel and restaurant, was built right by the beach and this establishment still exists today, though different from the original building because of fires and rebuilding. In the 1880s the first villas were erected in Sandskogen and at the turn of the century 56 villas had already been built. Two large colonisation periods took place after that, in the 1930s and 1960s. Today there are about 550 villas and cottages in the area. A significant event for the evolvement of Sandskogen was an exhibit in Ystad 1936 called Fritiden (translated Spare time) where the significance of spare time was illuminated. The first camping ground in Sandskogen was founded as a result of the
6 Ystads Fornminnesförening, p. 40 7 ANSER 2000 Nr 4, Fåglarna i Ystads Sandskog – Ett försök till heltäckande inventering av häckande
arter 8 www.artdata.slu.se/rodlista/ 2005-07-05
Component 3
10(34)
exhibit and since then the interest for camping has only increased. Today Sandskogen contains villas, houses, cottages, tourist establishments, restaurants and cafés. Many of these buildings and establishments are at stake due to the erosion problem.
3.7 Values of tourism
The tourism is immensely important to Ystad. Last year (2004) around one million tourists visited Ystad, spending 434 million SEK (~ 48 million Euro) there. The tourism in Ystad started in the 1920s and from the very beginning it was concentrated to Sandskogen. In the mid 1930s the first hostel and camping ground took shape and in the 1950s a tourist village was established. A trip to Ystad is an experience with many various elements and naturally it is hard to truly estimate the importance of Sandskogen in these contexts. It is however clear that the beaches and the recreation areas in Sandskogen is among the most tourist friendly in Ystad and its surroundings. The reduced beach area with a risk for flooding would have a gravely negative effect on the tourism and all its establishments.
4 IDENTIFICATION OF STAKEHOLDERS
There are numerous stakeholders with interests in Ystad sandskog. The following is a list of stakeholders concerned by coastal erosion in this area.
Authorities participating in decisions
Ystads kommun – Tourist department Technical and facilities department Children and education department Environment and construction department
Länsstyrelsen (County administrative board) Naturvårdsverket (Swedish Environmental Protection Agency) SGI (Swedish Geotechnical Institute)
Landowners and infrastructure owners
The Municipality of Ystad Banverket (Swedish railway network) Telia (telephone cabling) Vägverket (Swedish road administration) Ystad energi (electrical cabling) Private landowners
Leaseholders
Villa and Cottage owners Owner of Bathing huts Hotel and Restaurants Camping ground Kiosks
Recreational stakeholders
Associations/clubs Beach handball Beach volleyball
Component 3
11(34)
Boule Football Jet ski Mini golf Motor cycles Riding Sauna Scouting Shooting Track and field Tennis Working dog
Individual Angling Bathing Physical exercise
Jogging, bikers, strollers, dog walkers, riders, Nordic walking Strollers, Passers by
5 TECHNICAL ASSESSMENT OF THE FUTURE AND ALTERNATIVE WAYS OF ACTION
5.1 The technical assessment
The technical assessment of the future situation is based on: Available maps from municipality (Geosecma) Appendix A Report: Erosionsrapport over kusten i Ystad kommun, Ystad 2004 Report: Strandmorfologi. Studie av kuststräckan från Ystad till Sandhammaren
Rankka, K. et al. Report: Uppspolning och klittererosion längs Ystads kusten – Situation idag och
framtida scenarier Dahlerus, Carl-Johan, Egermayer Daniel Discussions with Prof. Hans Hanson of Lund University The assumption that sea level will rise by 0.5 m the next 100 years Rule of thumb – 0.5 m sea level rise gives 50 m of coastal erosion Historical data indicates erosion rate of 0.3-0.7 m per year
One problem for the technical assessment is that available maps only have altitude contour lines every 5 metres. Most of the area is below at an altitude of 1.5 to 2.5 m above sea level. Given a highest water level of plus 1.2 m and sea level rise of 0.5 m a large area is flooding prone. The available maps lack required accuracy to determine which areas might be flooded. The prognosis regarding the position of the coastline in 100 years if nothing at all is done to protect the coastline is presented in Map1 and Table 1 (detailed maps are available in appendix A).

Component 3
12(34)
Map 1 – Map over Ystad sandskog coastline with estimated coastline retreat in 100 years if no actions are taken. Table 1. Estimated coastline movement over the next 100 years if no measures are taken to hinder erosion. (Sections are described in Appendix A)
Coastline retreat (m)
Section Type Length
(m) due to
erosion
due to sea
level rise
0-A Stone protection 400 -40 -50 A-B Stone protection + gabion
±100 meter of B 450 -30 -50
B-C Sand 230 -30 -50 C-D Sand + gabion 310 -30 -50 D-E Sand + gabion 290 -30 -50 E-F Sand + gabion 300 -30 -50 F-G Sand + Stone protection 150 -30 -50 G-H Sand + Stone protection 300 -50 -50 H-I Sand + Stone protection 400 -50 -50 I-J Sand 100 -70 -50 J-K Sand 380 -90 -50 K-L Sand 300 -70 -50 L-M Sand 450 -70 -50 M-N Sand 140 -50 -50
The analysed coastline is 4 200 m long and the estimated loss of land in the “do nothing” alternative is 415 000 m2 (an average 98 m of coastal retreat).

Component 3
13(34)
5.2 The strategy of the municipality
The present strategy of Ystad municipality is to “Hold the line” with ”Limited intervention” to preserve the present position of the coastline. There is a yearly budget for maintaining the present erosion protection constructions and to test new methods. The municipality is also the sole landowner of the coast in Sandskogen. The municipality actually has applied for permission to extract sand from accumulating areas to the eroding parts of the beach in Sandskogen. Permission has been giving for sand nourishment in the water and on the beach but extracting of sand from the seafloor has been rejected.
5.3 Studied alternatives of coastal management
Several alternatives, that can be considered in order to mitigate the coastal erosion, have been evaluated. The “Do nothing” alternative (No Project option) implies that land, properties, roads and utilities are successively lost to the sea. The protecting sand dunes will probably not move landward but erode and give space for flooding in times of high water levels. This is not really an option for the municipality. They will have to do something measures as roads are cut etc. This option is used in the analysis to demonstrate what values are at stake. A “Managed realignment” of the coastline would mean that the municipality moves their facilities, hotel, the promenade/bike road etc as erosion and sea level rise evolves. This alternative is not analysed! The “Move seaward” is really not one of the discussed options. However not many would mind if there was an accumulation of sand along the coast. The two analysed options are “Hold the line”/ ”Limited intervention” options. Option 1 – Maintain existing seawall and groins and new breakwaters
The municipality is currently maintaining the shore protecting structures at place. The municipality is also planning to install submerged breakwaters at location H-I. The groins at section B to F traps sand transported along the coast giving less available material to be deposited between section G and N. The submerged breakwaters at section H-I will protect the coastal bike road and a building situated only 50 meters from the present shoreline. Option 2 - Beach nourishment
The municipality is investigating a beach nourishment alternative. At present a permission is given to deposit 20 000 m3 along the shores of Sandskogen. The municipality will also apply for a permission to extract sand from the sea floor 5 km south of Sandhammaren. This option also includes limited maintenance of existing erosion protection constructions.
Component 3
14(34)
6 SOCIO-ECONOMIC STUDY
6.1 Cost-Benefit Analysis
For this study Cost-Benefit Analysis (CBA) has been chosen as the method to use. Whit this it will be possible to evaluate the present strategy of the municipality and see if it is worthwhile or not. This mapping of the costs and benefits might also give indications on how to develop the strategy.
6.2 Valuation of effects
Two alternative combinations of preventive measures will be used in this study. The first alternative (Option 1) is to maintain existing groins and stone protection (seawall) and to establish new breakwaters. The second alternative (Option 2) involves beach nourishment and limited maintenance for existing groins and seawall and planned breakwaters. The estimated development of the shoreline if nothing is done and the two alternatives are shown in table 2 Table 2 – Estimated coastline movement for the alternatives “Do nothing”, ”Maintenance” and “Beach nourishment”.
Coastline movement (m)
“-“ = retreat “+” = extension
Section Type
Length
(m) No Project
Do nothing
Option 1
Maintain
Option 2
Beach
nourishment
0-A Stone protection 400 -90 -0 -0 A-B Stone protection +
gabion ±100 meter of B 450
-80 -0 -0
B-C Sand 230 -80 -0 +5 C-D Sand + gabion 310 -80 -0 +5 D-E Sand + gabion 290 -80 -0 +2 E-F Sand + gabion 300 -80 -0 +2 F-G Sand + Stone protection 150 -80 -0 +2 G-H Sand + Stone protection 300 -100 -0 +2 H-I Sand + Stone protection 400 -100 -0 +2 I-J Sand 100 -120 -50 -1 J-K Sand 380 -140 -90 -7 K-L Sand 300 -120 -90 -4 L-M Sand 450 -120 -90 -3 M-N Sand 140 -100 -70 -2
Properties at danger are
• House – villas, summer cottages, a hotel, a couple of restaurants, rent cabins and cottages.
• Road – a road of local and regional importance, railroad and about ten parking areas, a system of smaller roads that leads to the summerhouses.
• Industry – there is no industry accept tourism industry in the area. • Other – the municipality athletic stadium.
Component 3
15(34)
Other values affected are tourism, recreation and nature life. The municipality owns approximately 90 % of the land in the area. The effects are summarized in table 3. Table 3 – Effects table for the Ystad sandskog case Alternatives
Units Do nothing
Option 1 Maintain &
Repair
Option 2 Beach
nourishment Direct effects
Investment costs 0 Yes Yes Maintenance costs 0 Yes Yes
Direct/indirect effects Damage to property and infrastructure
Yes Some Some
Agriculture 0 0 0 Recreation/Tourism Yes 0 0 Other damages Yes 0 0
6.3 Values lost in “Do nothing” case (No project)
Estimated values, that may be lost, in the “Do nothing” alternative. Hotel: 2000 m2 * 20,000 SEK/ m2 = 40 MSEK Football area: (estimated value) = 4 MSEK Summer villa area: 200,000 square metres * 2000 SEK/ m2 = 400 MSEK (properties in this area are at present sold for 1,5-2 MSEK each) Forest Area: 200,000 m2 * 200 SEK/ m2 = 40 MSEK Annual loss due to less tourism etc: 1% of tourism turnover (434) = 4MSEK/year. Data sources: Quantity data is collected from drawing shown in Appendix A. Cost data is estimated from historical data and past experience.
6.4 Cost of implementing protecting measures
Cost of option 1 (maintain existing seawall and groins and new breakwaters) Repair of 5 groins 100,000-120,000 SEK per groin and year Repair of seawall 500,000 SEK every 5:th year Repair of breakwaters 100,000 SEK every 5:th year starting year 10 Cost of option 2 (beach nourishment) Sand nourishment 20 000 m3 at a cost of 40-80 SEK per m3 every fifth year 20,000m3 * 60 SEK/m3 = 1.2 MSEK Repair of 5 groins 50,000-60,000 SEK per groin and year Repair of seawall 500,000 every 15 years Repair of breakwaters 50,000 every 5 years Data sources: Quantity and cost data are collected from the Municipality of Ystad and are based on analogous estimate and historical data.
Component 3
16(34)
6.5 Evaluation model
The CBA is done using a modified version of spreadsheets developed by British authorities9. The modification concerns only layout of the spreadsheets that have been adjusted to suit this particular case study. Formulas and calculations are original. The whole calculation is presented with Present Values (PV) in Appendix B. The basic way of working with the CBA model is to start with estimating total damage and loss of the “Do Nothing”-alternative (No Project), see table B-2. This value is later used as the Benefit (or avoided damage) for the investigated options of preventive actions. Next step is to estimate the schedule and Cost of implementing the options see Table B6. Finally there is still risk of damages for the investigated options, the cost of this is calculated, see table 3 and 4. The results are summarized in Table 4.
7 RESULTS AND DISCUSSION
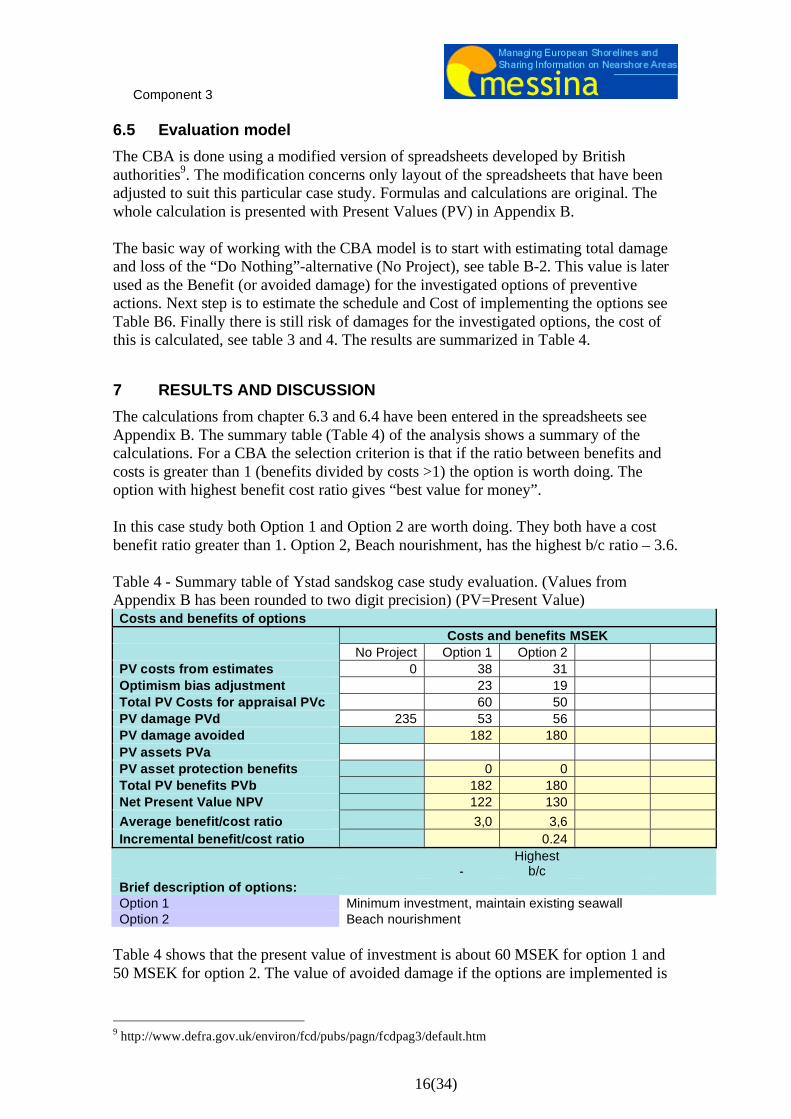
The calculations from chapter 6.3 and 6.4 have been entered in the spreadsheets see Appendix B. The summary table (Table 4) of the analysis shows a summary of the calculations. For a CBA the selection criterion is that if the ratio between benefits and costs is greater than 1 (benefits divided by costs >1) the option is worth doing. The option with highest benefit cost ratio gives “best value for money”. In this case study both Option 1 and Option 2 are worth doing. They both have a cost benefit ratio greater than 1. Option 2, Beach nourishment, has the highest b/c ratio – 3.6. Table 4 - Summary table of Ystad sandskog case study evaluation. (Values from Appendix B has been rounded to two digit precision) (PV=Present Value) Costs and benefits of options
Costs and benefits MSEK
No Project Option 1 Option 2
PV costs from estimates 0 38 31
Optimism bias adjustment 23 19
Total PV Costs for appraisal PVc 60 50
PV damage PVd 235 53 56
PV damage avoided 182 180
PV assets PVa
PV asset protection benefits 0 0
Total PV benefits PVb 182 180
Net Present Value NPV 122 130
Average benefit/cost ratio 3,0 3,6
Incremental benefit/cost ratio 0.24
- Highest
b/c
Brief description of options:
Option 1 Minimum investment, maintain existing seawall
Option 2 Beach nourishment
Table 4 shows that the present value of investment is about 60 MSEK for option 1 and 50 MSEK for option 2. The value of avoided damage if the options are implemented is
9 http://www.defra.gov.uk/environ/fcd/pubs/pagn/fcdpag3/default.htm

Component 3
17(34)
182 and 180 MSEK respectively. This means for option 1 that if we invest 10 MSEK extra, compared to option 2, we will avoid 2MSEK. A decision maker can use the b/c ratio to select the best alternative. One possible way of reacting to this is to ask for better alternatives. Can we accept the predicted damage level of the case study? Is there an option that reduces predicted damages even better? Further investigation
It is always possible to improve an appraisal, in this case specifically - Data used in the case study mainly considering infrastructure cost. Are there
omitted items that should be included in the CBA? Environment, heritage etc. - Accuracy of result – Calculations in spreadsheets are made with many digits but
results should only be presented with justifiable number of digits. In this case at least not more than two.
- Quantities – can they be better measured? Possibility to obtain data from Land Survey authority?
- Cost data – better basic data? Could be bettered with data from government real estate assessed value. Real estate agents can be interviewed
- Risk and sensitivity – Different scenarios can be used when appraising future damage and loss, optimistic and pessimistic. What happens if sea level rise is not 50 cm but 100 cm in 100 years? What technical measures will have to be implemented then?
8 CONCLUSIONS
By making a case study for an area a good background and technical involved persons are activated and questions are put on the agenda. With a CBA a long-term perspective is generated and the influence over time of natural change and manmade intervention is evaluated in one context. In a case like Ystad sandskog where land is lost to the sea it is of direct interest for the landowner to evaluate future possibilities. It is therefore suitable for a municipality like Ystad. The neighbouring areas to the one investigated are reasonably stable and do not carry any bigger uncertainties to the project. When CBA is adopted on higher levels, regional national etc. to choose priority between projects additional care should be taken that the different projects are analysed using the same methods to estimate quantities and to establish cost data. In the case of single project analysis, over- or underestimating may be more systematic and may not pose a big problem as long as the options are treated equal. Technical evaluation and models for evaluating shoreline development and impact of manmade activities on erosion and the shoreline are fundamental for good analysis.
REFERENCES
ANSER nr 4, Fåglarna i Ystads Sandskog – Ett försök till heltäckande inventering av
häckande arter, Skånes Ornitologiska Förening, Lund, 2000 (in Swedish)
Component 3
18(34)
ArtDatabankens hemsida, www.artdata.slu.se/rodlista/, 2005-07-05 Ystads Fornminnesförening, Ystadiana 1989, Ystads Centraltryckeri, Ystad, 1989 Eurosion reports (2004) Living with coastal erosion in Europe, Sediment and Space for Sustainability, part 1 to 5_8b www.eurosion.org/reports-online/reports.html Karin Rankka, Ann-Christine Hågeryd, Wilhelm Rankka och Håkan Rosqvist. Strandmorfologi. Studie av kuststräckan från Ystad till Sandhammaren Swedish Geotechnical Institute, SGI. Varia 554, 2005, 62 pages Socio-economic methods for evaluating decisions in coastal erosion management – State-of-the-art, Messina project Component 3, 2005 Dahlerus, Carl-Johan, Egermayer Daniel. Uppspolning och klittererosion längs Ystads kusten – Situation idag och framtida scenarier, Blomgren, S. & Hanson, H. (1993). Kusterosion i nio skånska kommuner – Skador och förslag till åtgärder. Inst. för teknisk vattenresurslära, Lunds Universitet, Lund.
Component 3
19(34)
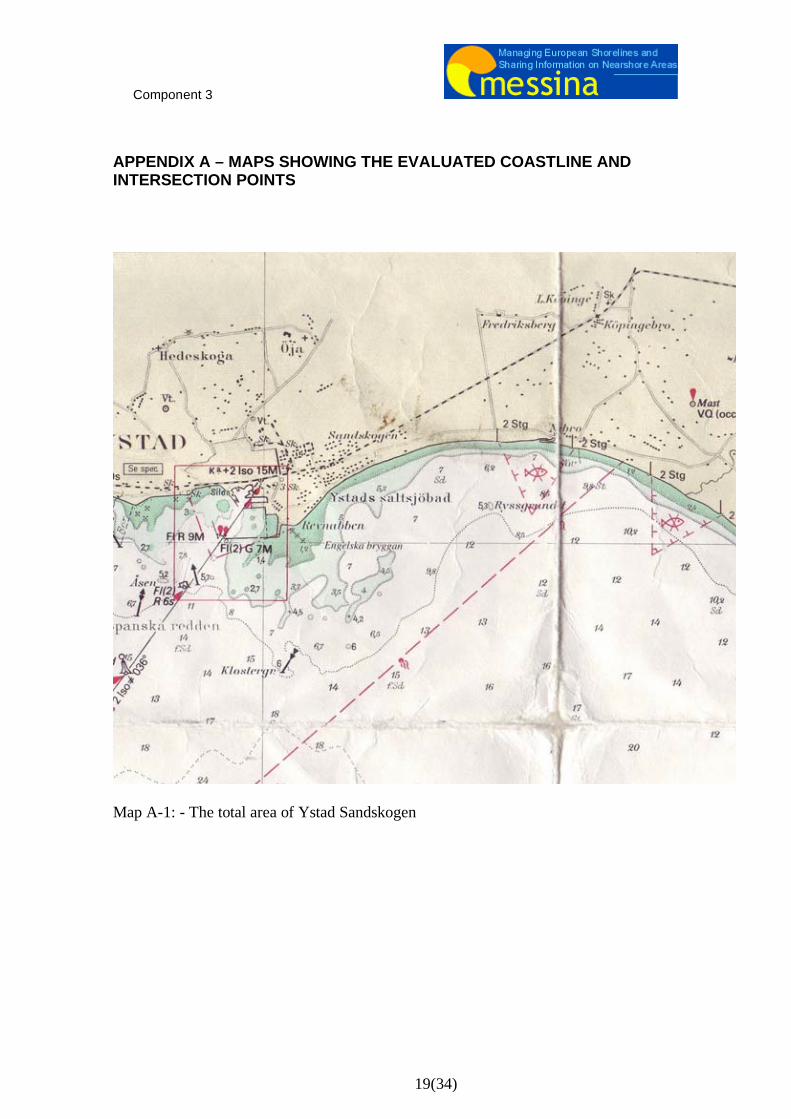
APPENDIX A – MAPS SHOWING THE EVALUATED COASTLINE AND INTERSECTION POINTS
Map A-1: - The total area of Ystad Sandskogen
Component 3
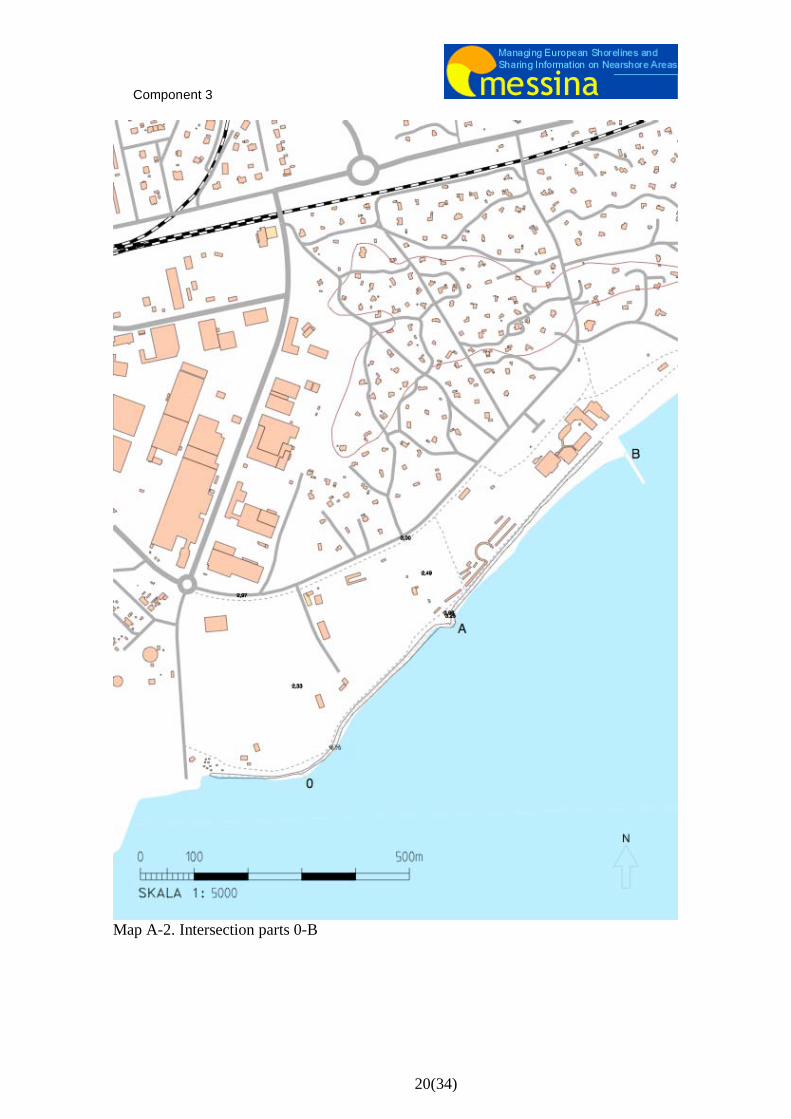
20(34)
Map A-2. Intersection parts 0-B
Component 3
21(34)
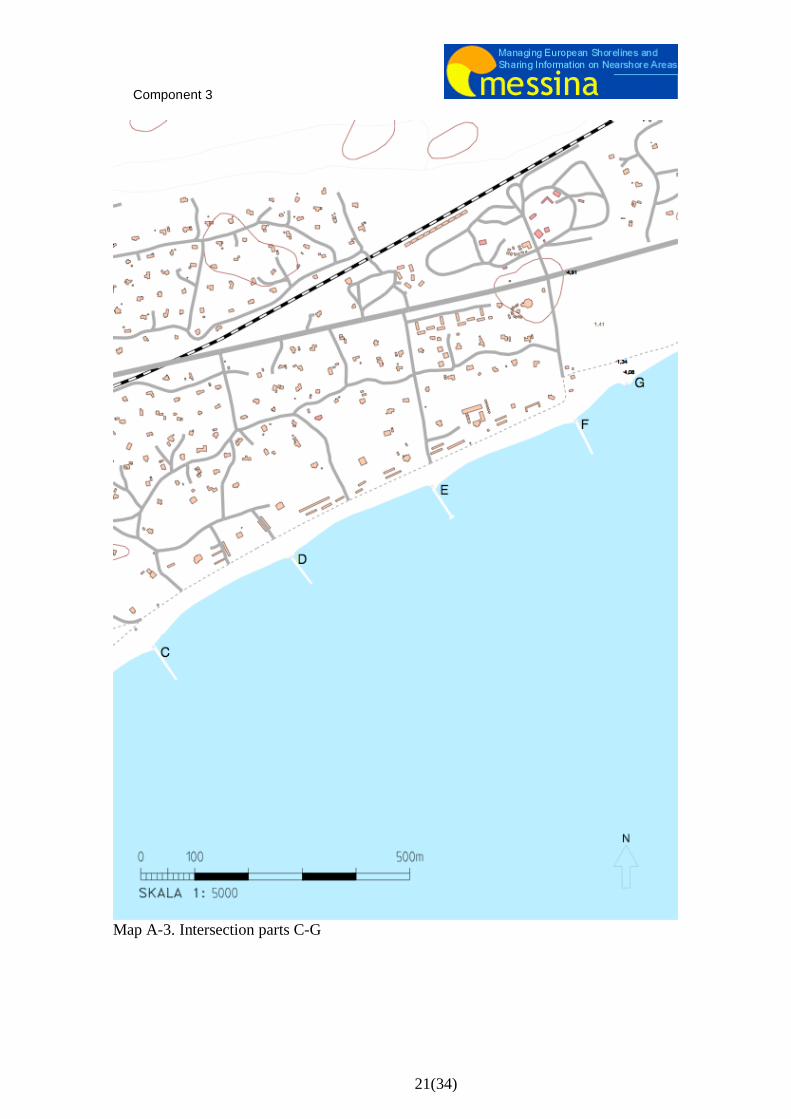
Map A-3. Intersection parts C-G
Component 3
22(34)
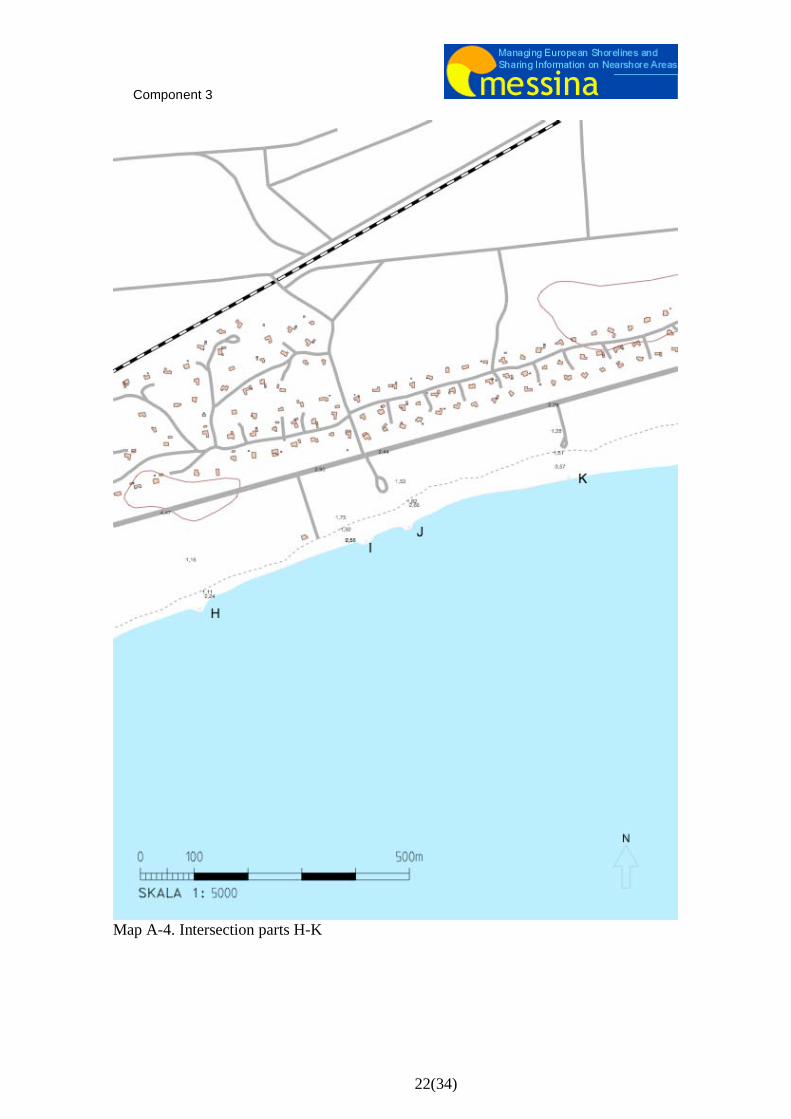
Map A-4. Intersection parts H-K
Component 3
23(34)
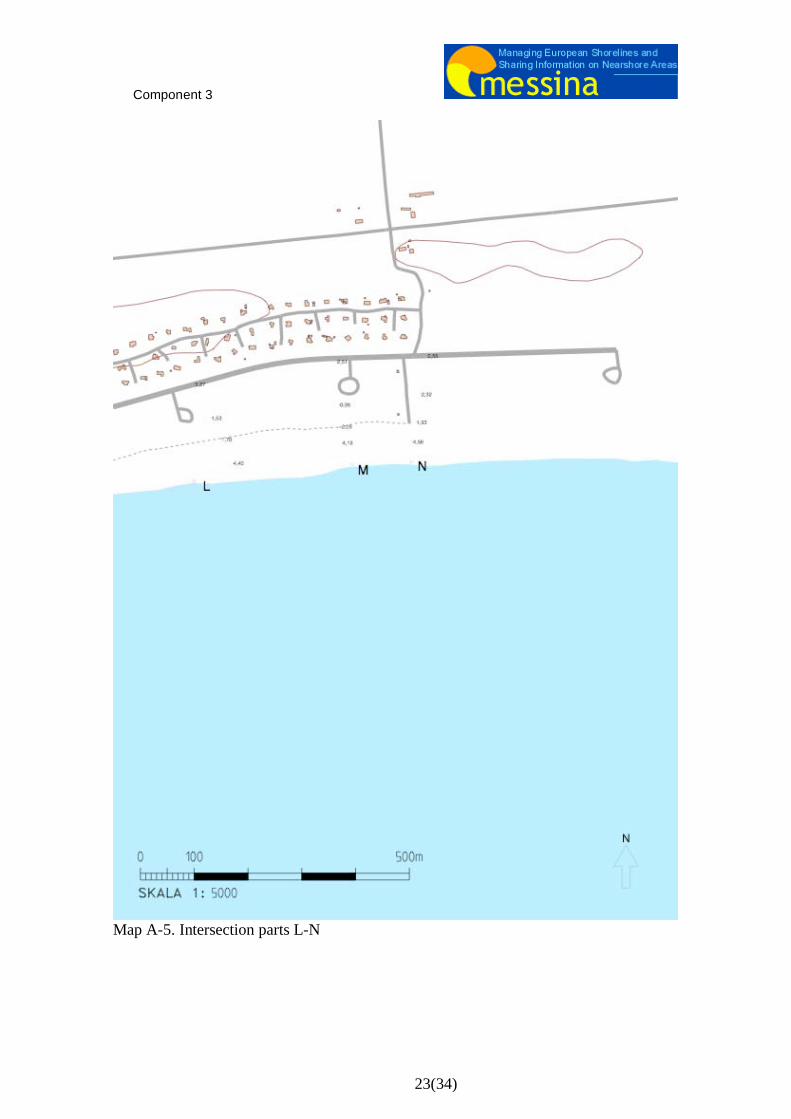
Map A-5. Intersection parts L-N
Component 3
24(34)
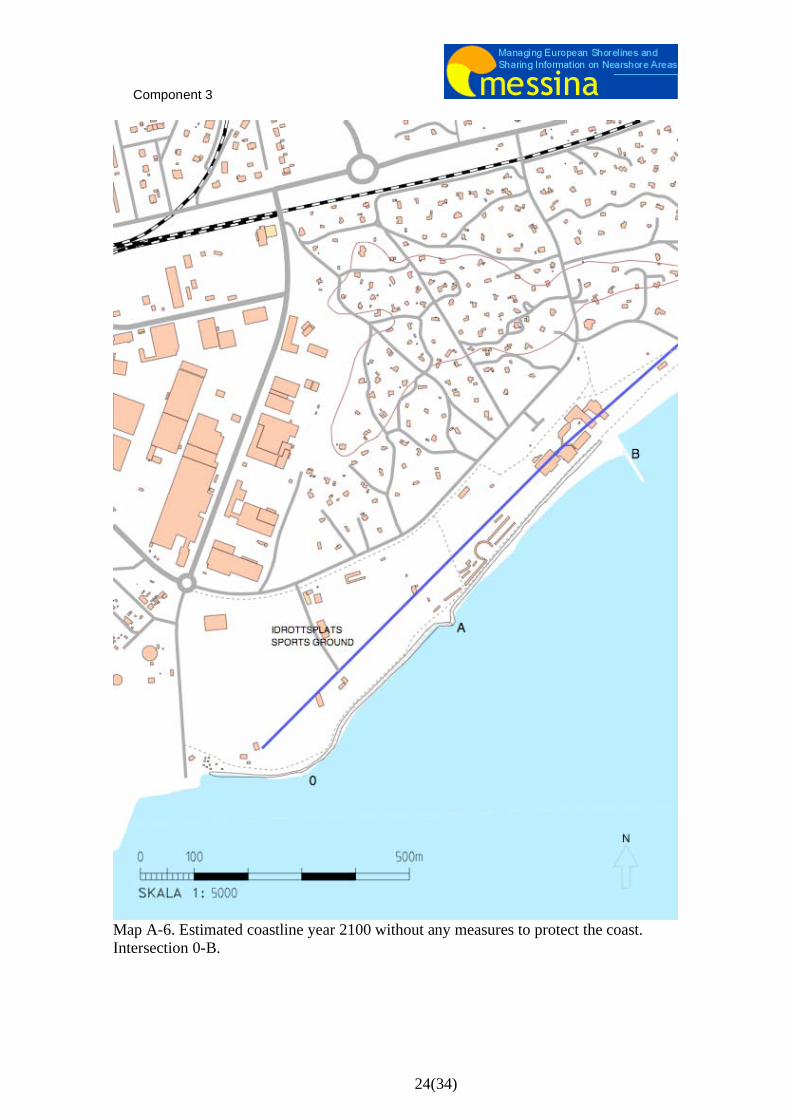
Map A-6. Estimated coastline year 2100 without any measures to protect the coast. Intersection 0-B.
Component 3
25(34)
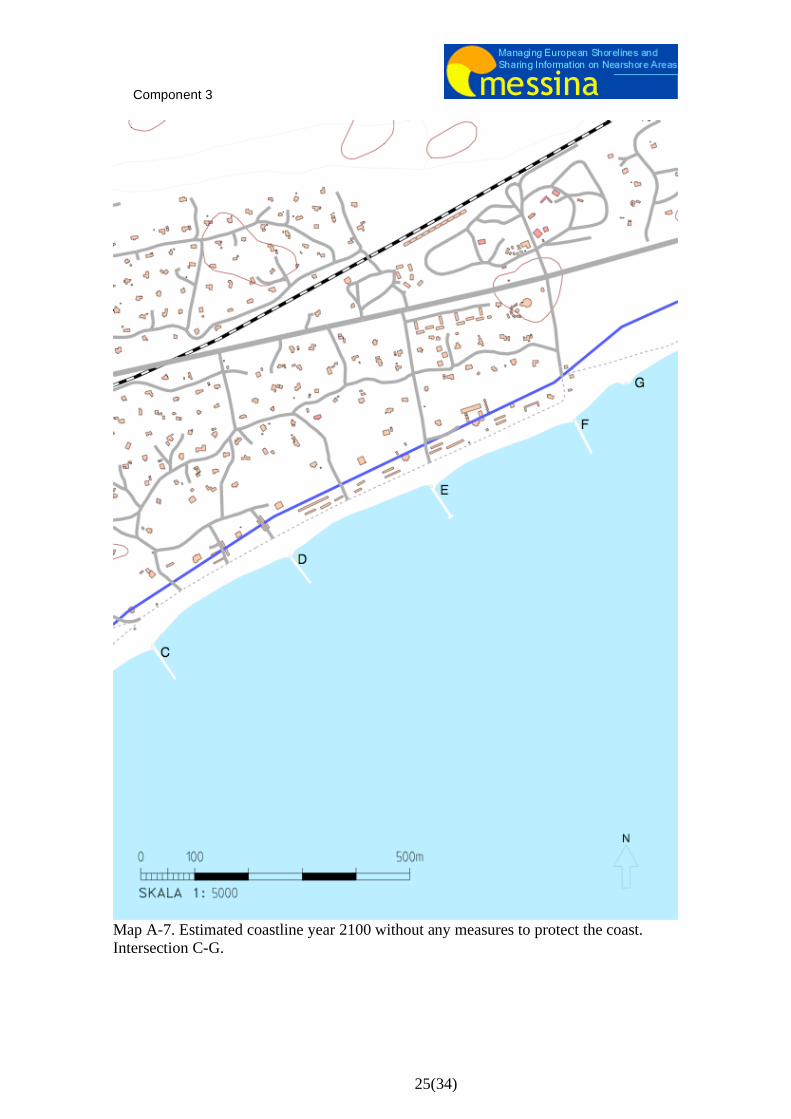
Map A-7. Estimated coastline year 2100 without any measures to protect the coast. Intersection C-G.
Component 3
26(34)
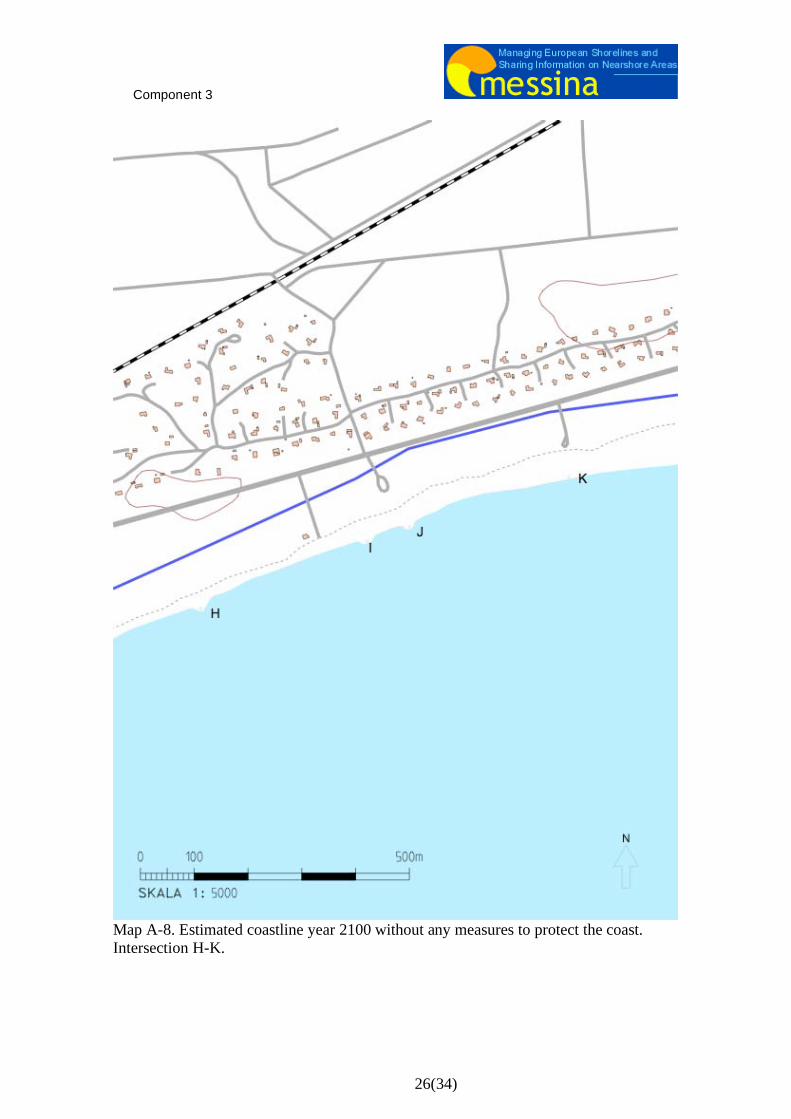
Map A-8. Estimated coastline year 2100 without any measures to protect the coast. Intersection H-K.
Component 3
27(34)
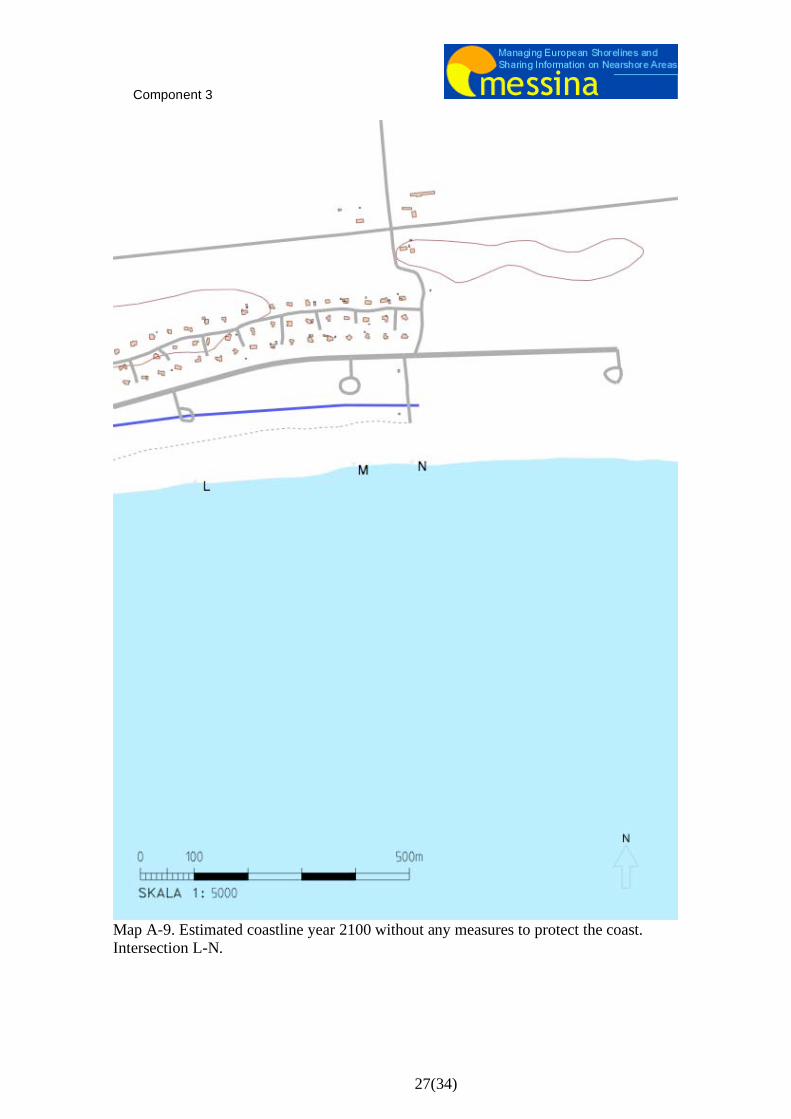
Map A-9. Estimated coastline year 2100 without any measures to protect the coast. Intersection L-N.
Component 3
28(34)
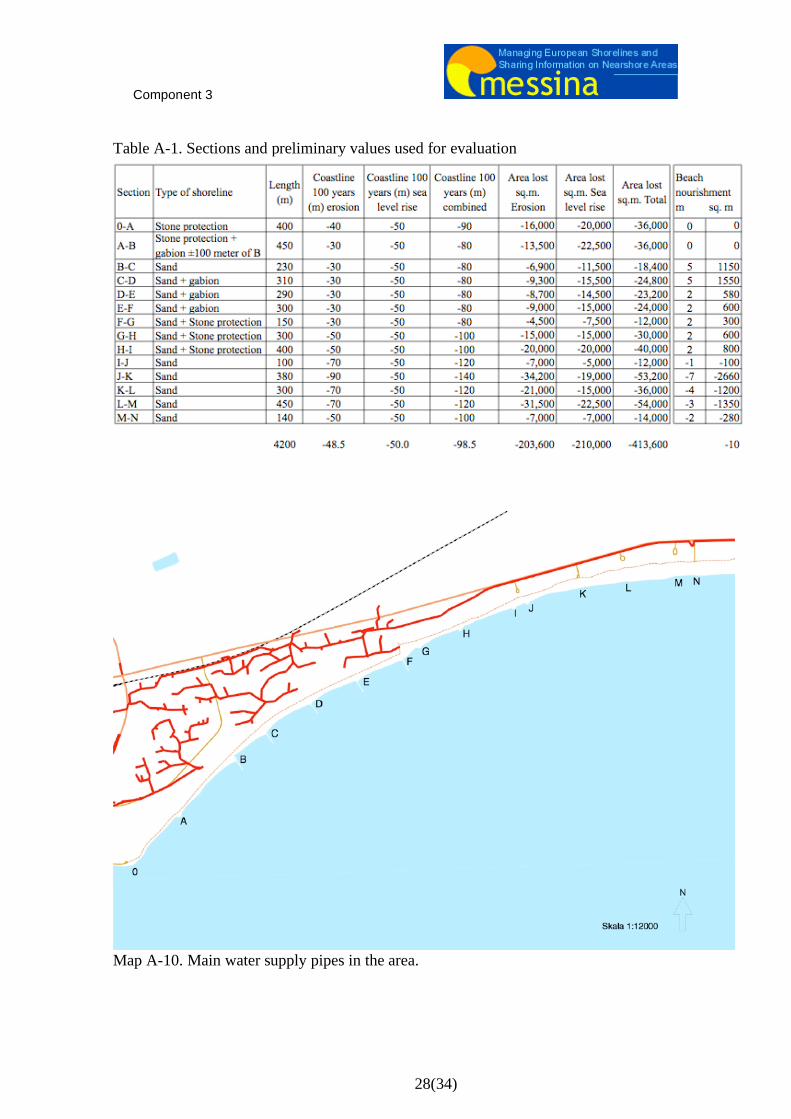
Table A-1. Sections and preliminary values used for evaluation
Map A-10. Main water supply pipes in the area.
Component 3
29(34)
APPENDIX B – COST BENEFIT ANALYSIS
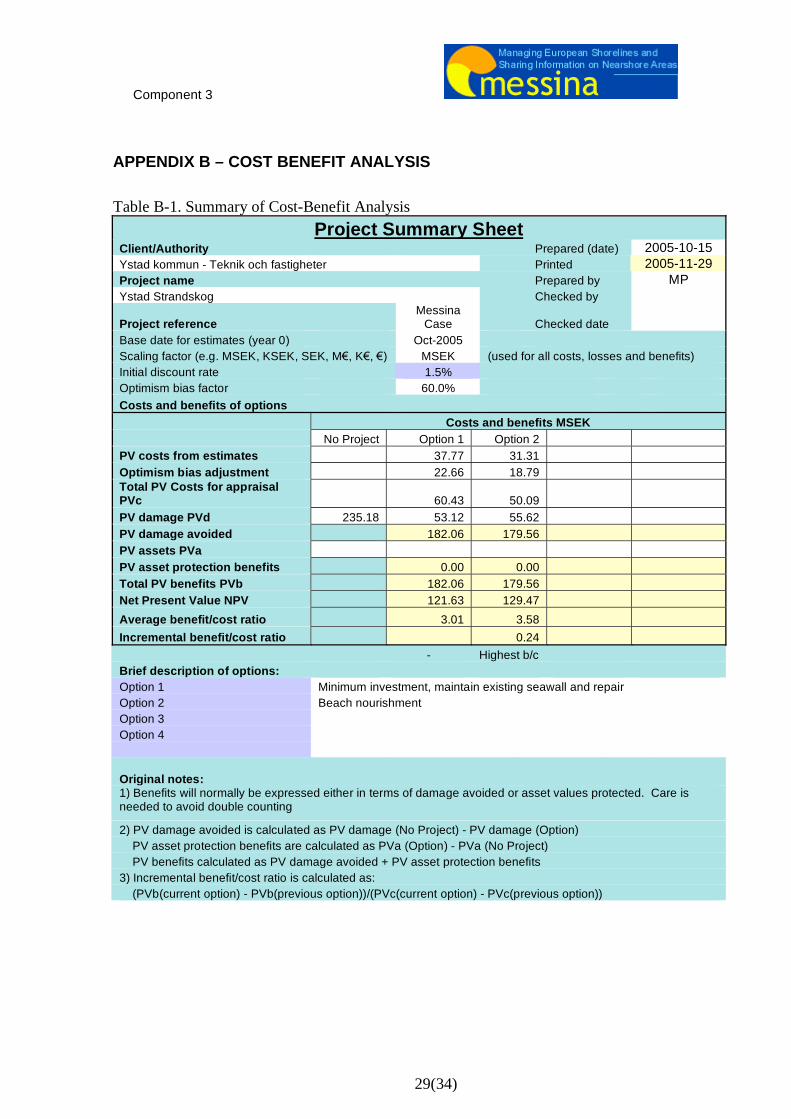
Table B-1. Summary of Cost-Benefit Analysis
Project Summary Sheet
Client/Authority Prepared (date) 2005-10-15
Ystad kommun - Teknik och fastigheter Printed 2005-11-29
Project name Prepared by MP
Ystad Strandskog Checked by
Project reference Messina
Case Checked date
Base date for estimates (year 0) Oct-2005
Scaling factor (e.g. MSEK, KSEK, SEK, M , K , ) MSEK (used for all costs, losses and benefits)
Initial discount rate 1.5%
Optimism bias factor 60.0%
Costs and benefits of options
Costs and benefits MSEK
No Project Option 1 Option 2
PV costs from estimates 37.77 31.31
Optimism bias adjustment 22.66 18.79 Total PV Costs for appraisal PVc 60.43 50.09
PV damage PVd 235.18 53.12 55.62
PV damage avoided 182.06 179.56
PV assets PVa
PV asset protection benefits 0.00 0.00
Total PV benefits PVb 182.06 179.56
Net Present Value NPV 121.63 129.47
Average benefit/cost ratio 3.01 3.58
Incremental benefit/cost ratio 0.24
- Highest b/c
Brief description of options:
Option 1 Minimum investment, maintain existing seawall and repair
Option 2 Beach nourishment
Option 3
Option 4
Original notes: 1) Benefits will normally be expressed either in terms of damage avoided or asset values protected. Care is needed to avoid double counting
2) PV damage avoided is calculated as PV damage (No Project) - PV damage (Option)
PV asset protection benefits are calculated as PVa (Option) - PVa (No Project)
PV benefits calculated as PV damage avoided + PV asset protection benefits
3) Incremental benefit/cost ratio is calculated as:
(PVb(current option) - PVb(previous option))/(PVc(current option) - PVc(previous option))
Component 3
30(34)
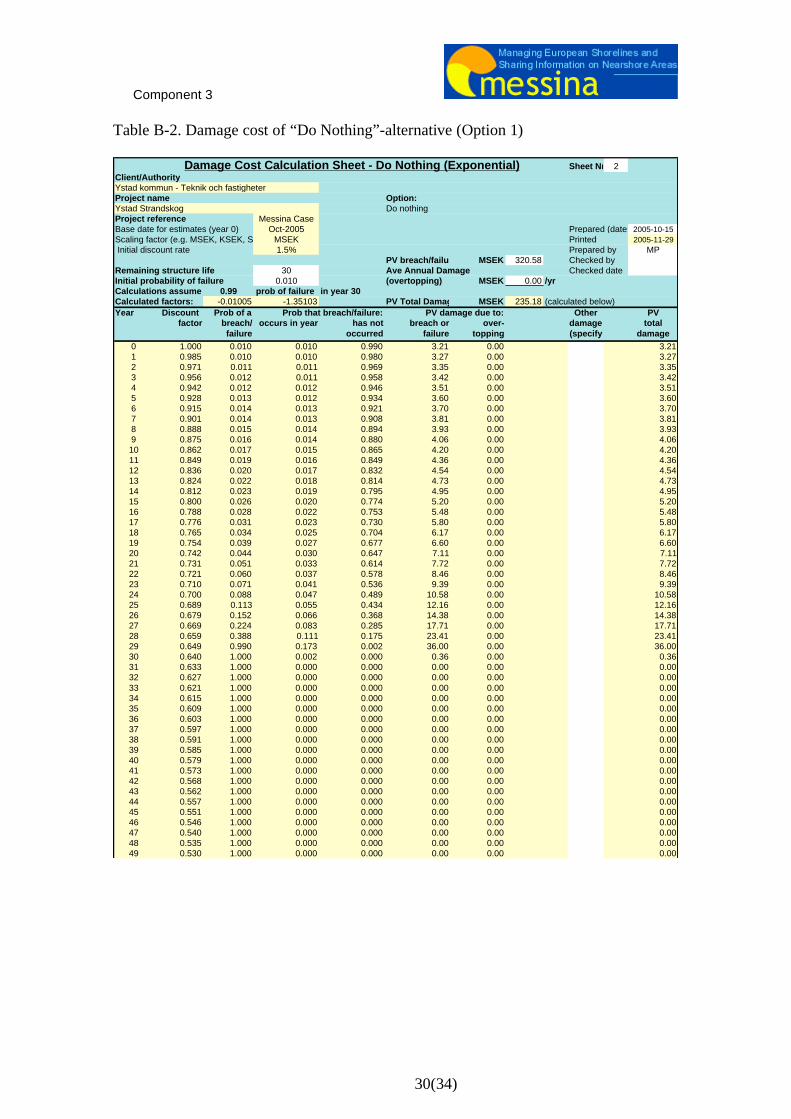
Table B-2. Damage cost of “Do Nothing”-alternative (Option 1)
Damage Cost Calculation Sheet - Do Nothing (Exponential) Sheet Nr 2
Client/Authority
Project name Option:
Project reference Messina Case
Base date for estimates (year 0) Oct-2005 Prepared (date 2005-10-15
Scaling factor (e.g. MSEK, KSEK, S MSEK Printed 2005-11-29
Initial discount rate 1.5% Prepared by MP
PV breach/failur MSEK 320.58 Checked by
Remaining structure life 30 Ave Annual Damage Checked date
Initial probability of failure 0.010 (overtopping) MSEK 0.00 /yr
Calculations assume 0.99 prob of failure in year 30
Calculated factors: -0.01005 -1.35103 PV Total Damag MSEK 235.18 (calculated below)
Year Discount Prob of a Prob that breach/failure: PV damage due to: Other PV
factor breach/
failure
occurs in year has not
occurred
breach or
failure
over-
topping
damage
(specify
)
total
damage
0 1.000 0.010 0.010 0.990 3.21 0.00 3.21
1 0.985 0.010 0.010 0.980 3.27 0.00 3.27
2 0.971 0.011 0.011 0.969 3.35 0.00 3.35
3 0.956 0.012 0.011 0.958 3.42 0.00 3.42
4 0.942 0.012 0.012 0.946 3.51 0.00 3.51
5 0.928 0.013 0.012 0.934 3.60 0.00 3.60
6 0.915 0.014 0.013 0.921 3.70 0.00 3.70
7 0.901 0.014 0.013 0.908 3.81 0.00 3.81
8 0.888 0.015 0.014 0.894 3.93 0.00 3.93
9 0.875 0.016 0.014 0.880 4.06 0.00 4.06
10 0.862 0.017 0.015 0.865 4.20 0.00 4.20
11 0.849 0.019 0.016 0.849 4.36 0.00 4.36
12 0.836 0.020 0.017 0.832 4.54 0.00 4.54
13 0.824 0.022 0.018 0.814 4.73 0.00 4.73
14 0.812 0.023 0.019 0.795 4.95 0.00 4.95
15 0.800 0.026 0.020 0.774 5.20 0.00 5.20
16 0.788 0.028 0.022 0.753 5.48 0.00 5.48
17 0.776 0.031 0.023 0.730 5.80 0.00 5.80
18 0.765 0.034 0.025 0.704 6.17 0.00 6.17
19 0.754 0.039 0.027 0.677 6.60 0.00 6.60
20 0.742 0.044 0.030 0.647 7.11 0.00 7.11
21 0.731 0.051 0.033 0.614 7.72 0.00 7.72
22 0.721 0.060 0.037 0.578 8.46 0.00 8.46
23 0.710 0.071 0.041 0.536 9.39 0.00 9.39
24 0.700 0.088 0.047 0.489 10.58 0.00 10.58
25 0.689 0.113 0.055 0.434 12.16 0.00 12.16
26 0.679 0.152 0.066 0.368 14.38 0.00 14.38
27 0.669 0.224 0.083 0.285 17.71 0.00 17.71
28 0.659 0.388 0.111 0.175 23.41 0.00 23.41
29 0.649 0.990 0.173 0.002 36.00 0.00 36.00
30 0.640 1.000 0.002 0.000 0.36 0.00 0.36
31 0.633 1.000 0.000 0.000 0.00 0.00 0.00
32 0.627 1.000 0.000 0.000 0.00 0.00 0.00
33 0.621 1.000 0.000 0.000 0.00 0.00 0.00
34 0.615 1.000 0.000 0.000 0.00 0.00 0.00
35 0.609 1.000 0.000 0.000 0.00 0.00 0.00
36 0.603 1.000 0.000 0.000 0.00 0.00 0.00
37 0.597 1.000 0.000 0.000 0.00 0.00 0.00
38 0.591 1.000 0.000 0.000 0.00 0.00 0.00
39 0.585 1.000 0.000 0.000 0.00 0.00 0.00
40 0.579 1.000 0.000 0.000 0.00 0.00 0.00
41 0.573 1.000 0.000 0.000 0.00 0.00 0.00
42 0.568 1.000 0.000 0.000 0.00 0.00 0.00
43 0.562 1.000 0.000 0.000 0.00 0.00 0.00
44 0.557 1.000 0.000 0.000 0.00 0.00 0.00
45 0.551 1.000 0.000 0.000 0.00 0.00 0.00
46 0.546 1.000 0.000 0.000 0.00 0.00 0.00
47 0.540 1.000 0.000 0.000 0.00 0.00 0.00
48 0.535 1.000 0.000 0.000 0.00 0.00 0.00
49 0.530 1.000 0.000 0.000 0.00 0.00 0.00
Do nothing
Ystad kommun - Teknik och fastigheter
Ystad Strandskog
Component 3
31(34)
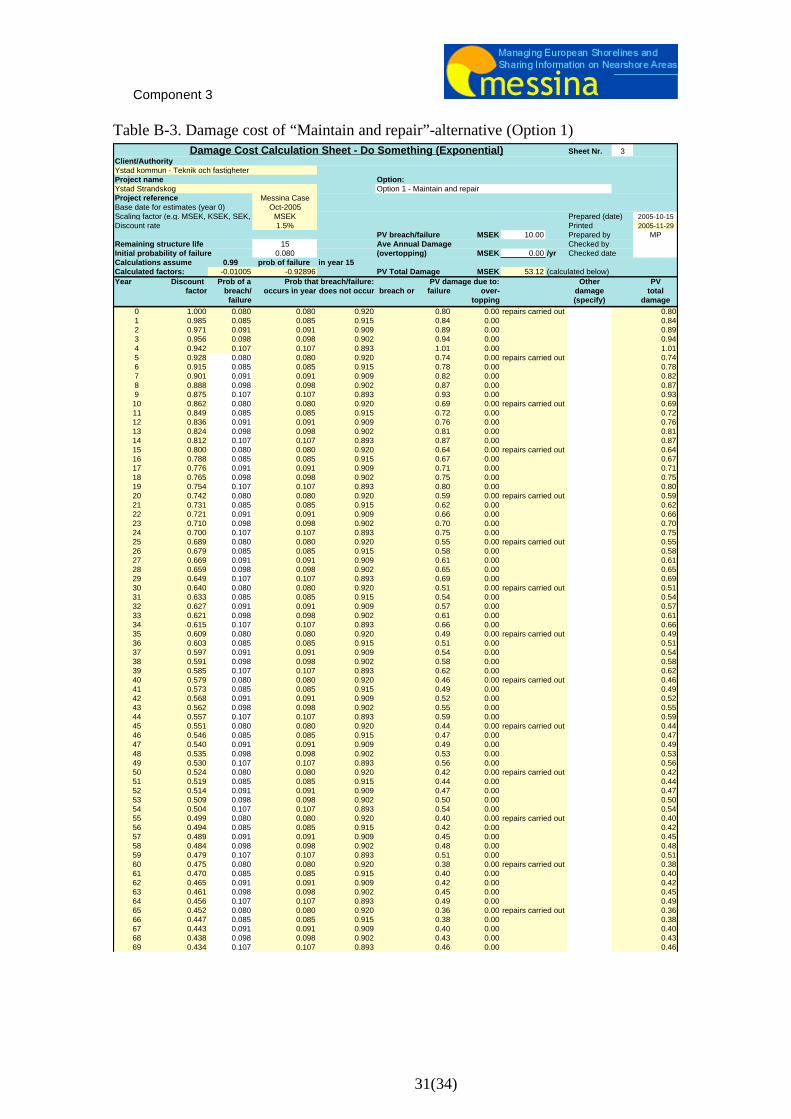
Table B-3. Damage cost of “Maintain and repair”-alternative (Option 1)
Damage Cost Calculation Sheet - Do Something (Exponential) Sheet Nr. 3
Client/Authority
Project name Option:
Project reference Messina Case
Base date for estimates (year 0) Oct-2005
Scaling factor (e.g. MSEK, KSEK, SEK, MSEK Prepared (date) 2005-10-15
Discount rate 1.5% Printed 2005-11-29
PV breach/failure MSEK 10.00 Prepared by MP
Remaining structure life 15 Ave Annual Damage Checked by
Initial probability of failure 0.080 (overtopping) MSEK 0.00 /yr Checked date
Calculations assume 0.99 prob of failure in year 15
Calculated factors: -0.01005 -0.92896 PV Total Damage MSEK 53.12 (calculated below)
Year Discount Prob of a Prob that breach/failure: PV damage due to: Other PV
factor breach/
failure
occurs in year does not occur breach or failure over-
topping
damage
(specify)
total
damage
0 1.000 0.080 0.080 0.920 0.80 0.00 repairs carried out 0.80
1 0.985 0.085 0.085 0.915 0.84 0.00 0.84
2 0.971 0.091 0.091 0.909 0.89 0.00 0.89
3 0.956 0.098 0.098 0.902 0.94 0.00 0.94
4 0.942 0.107 0.107 0.893 1.01 0.00 1.01
5 0.928 0.080 0.080 0.920 0.74 0.00 repairs carried out 0.74
6 0.915 0.085 0.085 0.915 0.78 0.00 0.78
7 0.901 0.091 0.091 0.909 0.82 0.00 0.82
8 0.888 0.098 0.098 0.902 0.87 0.00 0.87
9 0.875 0.107 0.107 0.893 0.93 0.00 0.93
10 0.862 0.080 0.080 0.920 0.69 0.00 repairs carried out 0.69
11 0.849 0.085 0.085 0.915 0.72 0.00 0.72
12 0.836 0.091 0.091 0.909 0.76 0.00 0.76
13 0.824 0.098 0.098 0.902 0.81 0.00 0.81
14 0.812 0.107 0.107 0.893 0.87 0.00 0.87
15 0.800 0.080 0.080 0.920 0.64 0.00 repairs carried out 0.64
16 0.788 0.085 0.085 0.915 0.67 0.00 0.67
17 0.776 0.091 0.091 0.909 0.71 0.00 0.71
18 0.765 0.098 0.098 0.902 0.75 0.00 0.75
19 0.754 0.107 0.107 0.893 0.80 0.00 0.80
20 0.742 0.080 0.080 0.920 0.59 0.00 repairs carried out 0.59
21 0.731 0.085 0.085 0.915 0.62 0.00 0.62
22 0.721 0.091 0.091 0.909 0.66 0.00 0.66
23 0.710 0.098 0.098 0.902 0.70 0.00 0.70
24 0.700 0.107 0.107 0.893 0.75 0.00 0.75
25 0.689 0.080 0.080 0.920 0.55 0.00 repairs carried out 0.55
26 0.679 0.085 0.085 0.915 0.58 0.00 0.58
27 0.669 0.091 0.091 0.909 0.61 0.00 0.61
28 0.659 0.098 0.098 0.902 0.65 0.00 0.65
29 0.649 0.107 0.107 0.893 0.69 0.00 0.69
30 0.640 0.080 0.080 0.920 0.51 0.00 repairs carried out 0.51
31 0.633 0.085 0.085 0.915 0.54 0.00 0.54
32 0.627 0.091 0.091 0.909 0.57 0.00 0.57
33 0.621 0.098 0.098 0.902 0.61 0.00 0.61
34 0.615 0.107 0.107 0.893 0.66 0.00 0.66
35 0.609 0.080 0.080 0.920 0.49 0.00 repairs carried out 0.49
36 0.603 0.085 0.085 0.915 0.51 0.00 0.51
37 0.597 0.091 0.091 0.909 0.54 0.00 0.54
38 0.591 0.098 0.098 0.902 0.58 0.00 0.58
39 0.585 0.107 0.107 0.893 0.62 0.00 0.62
40 0.579 0.080 0.080 0.920 0.46 0.00 repairs carried out 0.46
41 0.573 0.085 0.085 0.915 0.49 0.00 0.49
42 0.568 0.091 0.091 0.909 0.52 0.00 0.52
43 0.562 0.098 0.098 0.902 0.55 0.00 0.55
44 0.557 0.107 0.107 0.893 0.59 0.00 0.59
45 0.551 0.080 0.080 0.920 0.44 0.00 repairs carried out 0.44
46 0.546 0.085 0.085 0.915 0.47 0.00 0.47
47 0.540 0.091 0.091 0.909 0.49 0.00 0.49
48 0.535 0.098 0.098 0.902 0.53 0.00 0.53
49 0.530 0.107 0.107 0.893 0.56 0.00 0.56
50 0.524 0.080 0.080 0.920 0.42 0.00 repairs carried out 0.42
51 0.519 0.085 0.085 0.915 0.44 0.00 0.44
52 0.514 0.091 0.091 0.909 0.47 0.00 0.47
53 0.509 0.098 0.098 0.902 0.50 0.00 0.50
54 0.504 0.107 0.107 0.893 0.54 0.00 0.54
55 0.499 0.080 0.080 0.920 0.40 0.00 repairs carried out 0.40
56 0.494 0.085 0.085 0.915 0.42 0.00 0.42
57 0.489 0.091 0.091 0.909 0.45 0.00 0.45
58 0.484 0.098 0.098 0.902 0.48 0.00 0.48
59 0.479 0.107 0.107 0.893 0.51 0.00 0.51
60 0.475 0.080 0.080 0.920 0.38 0.00 repairs carried out 0.38
61 0.470 0.085 0.085 0.915 0.40 0.00 0.40
62 0.465 0.091 0.091 0.909 0.42 0.00 0.42
63 0.461 0.098 0.098 0.902 0.45 0.00 0.45
64 0.456 0.107 0.107 0.893 0.49 0.00 0.49
65 0.452 0.080 0.080 0.920 0.36 0.00 repairs carried out 0.36
66 0.447 0.085 0.085 0.915 0.38 0.00 0.38
67 0.443 0.091 0.091 0.909 0.40 0.00 0.40
68 0.438 0.098 0.098 0.902 0.43 0.00 0.43
69 0.434 0.107 0.107 0.893 0.46 0.00 0.46
Option 1 - Maintain and repair
Ystad kommun - Teknik och fastigheter
Ystad Strandskog

Component 3
32(34)
Table B-4. Damage cost of “Beach nourishment”-alternative (Option 2)
Damage Cost Calculation Sheet - Do Something (Exponential) Sheet Nr. 4
Client/Authority
Project name Option:
Project reference Messina Case
Base date for estimates (year 0) Oct-2005
Scaling factor (e.g. MSEK, KSEK, SEK, MSEK Prepared (date) 2005-10-15
Discount rate 1.5% Printed 2005-11-29
PV breach/failure MSEK 10.00 Prepared by MP
Remaining structure life 15 Ave Annual Damage Checked by
Initial probability of failure 0.080 (overtopping) MSEK 0.00 /yr Checked date
Calculations assume 0.99 prob of failure in year 15
Calculated factors: -0.01005 -0.92896 PV Total Damage MSEK 55.62 (calculated below)
Year Discount Prob of a Prob that breach/failure: PV damage due to: Other PV
factor breach/
failure
occurs in year does not occur breach or failure over-
topping
damage
(specify)
total
damage
0 1.000 0.080 0.080 0.920 0.80 0.00 repairs carried out 0.80
1 0.985 0.085 0.085 0.915 0.84 0.00 0.84
2 0.971 0.091 0.091 0.909 0.89 0.00 0.89
3 0.956 0.098 0.098 0.902 0.94 0.00 0.94
4 0.942 0.107 0.107 0.893 1.01 0.00 1.01
5 0.928 0.117 0.117 0.883 1.08 0.00 1.08
6 0.915 0.129 0.129 0.871 1.18 0.00 1.18
7 0.901 0.143 0.143 0.857 1.29 0.00 1.29
8 0.888 0.162 0.162 0.838 1.44 0.00 1.44
9 0.875 0.187 0.187 0.813 1.64 0.00 1.64
10 0.862 0.080 0.080 0.920 0.69 0.00 repairs carried out 0.69
11 0.849 0.085 0.085 0.915 0.72 0.00 0.72
12 0.836 0.091 0.091 0.909 0.76 0.00 0.76
13 0.824 0.098 0.098 0.902 0.81 0.00 0.81
14 0.812 0.107 0.107 0.893 0.87 0.00 0.87
15 0.800 0.080 0.080 0.920 0.64 0.00 repairs carried out 0.64
16 0.788 0.085 0.085 0.915 0.67 0.00 0.67
17 0.776 0.091 0.091 0.909 0.71 0.00 0.71
18 0.765 0.098 0.098 0.902 0.75 0.00 0.75
19 0.754 0.107 0.107 0.893 0.80 0.00 0.80
20 0.742 0.080 0.080 0.920 0.59 0.00 repairs carried out 0.59
21 0.731 0.085 0.085 0.915 0.62 0.00 0.62
22 0.721 0.091 0.091 0.909 0.66 0.00 0.66
23 0.710 0.098 0.098 0.902 0.70 0.00 0.70
24 0.700 0.107 0.107 0.893 0.75 0.00 0.75
25 0.689 0.080 0.080 0.920 0.55 0.00 repairs carried out 0.55
26 0.679 0.085 0.085 0.915 0.58 0.00 0.58
27 0.669 0.091 0.091 0.909 0.61 0.00 0.61
28 0.659 0.098 0.098 0.902 0.65 0.00 0.65
29 0.649 0.107 0.107 0.893 0.69 0.00 0.69
30 0.640 0.080 0.080 0.920 0.51 0.00 repairs carried out 0.51
31 0.633 0.085 0.085 0.915 0.54 0.00 0.54
32 0.627 0.091 0.091 0.909 0.57 0.00 0.57
33 0.621 0.098 0.098 0.902 0.61 0.00 0.61
34 0.615 0.107 0.107 0.893 0.66 0.00 0.66
35 0.609 0.080 0.080 0.920 0.49 0.00 repairs carried out 0.49
36 0.603 0.085 0.085 0.915 0.51 0.00 0.51
37 0.597 0.091 0.091 0.909 0.55 0.00 0.55
38 0.591 0.098 0.098 0.902 0.58 0.00 0.58
39 0.585 0.107 0.107 0.893 0.62 0.00 0.62
40 0.579 0.080 0.080 0.920 0.46 0.00 repairs carried out 0.46
41 0.573 0.085 0.085 0.915 0.49 0.00 0.49
42 0.568 0.091 0.091 0.909 0.52 0.00 0.52
43 0.562 0.098 0.098 0.902 0.55 0.00 0.55
44 0.557 0.107 0.107 0.893 0.59 0.00 0.59
45 0.551 0.080 0.080 0.920 0.44 0.00 repairs carried out 0.44
46 0.546 0.085 0.085 0.915 0.47 0.00 0.47
47 0.540 0.091 0.091 0.909 0.49 0.00 0.49
48 0.535 0.098 0.098 0.902 0.53 0.00 0.53
49 0.530 0.107 0.107 0.893 0.57 0.00 0.57
50 0.524 0.080 0.080 0.920 0.42 0.00 repairs carried out 0.42
51 0.519 0.085 0.085 0.915 0.44 0.00 0.44
52 0.514 0.091 0.091 0.909 0.47 0.00 0.47
53 0.509 0.098 0.098 0.902 0.50 0.00 0.50
54 0.504 0.107 0.107 0.893 0.54 0.00 0.54
55 0.499 0.080 0.080 0.920 0.40 0.00 repairs carried out 0.40
56 0.494 0.085 0.085 0.915 0.42 0.00 0.42
57 0.489 0.091 0.091 0.909 0.45 0.00 0.45
58 0.484 0.098 0.098 0.902 0.48 0.00 0.48
59 0.479 0.107 0.107 0.893 0.51 0.00 0.51
60 0.475 0.080 0.080 0.920 0.38 0.00 repairs carried out 0.38
61 0.470 0.085 0.085 0.915 0.40 0.00 0.40
62 0.465 0.091 0.091 0.909 0.42 0.00 0.42
63 0.461 0.098 0.098 0.902 0.45 0.00 0.45
64 0.456 0.107 0.107 0.893 0.49 0.00 0.49
65 0.452 0.080 0.080 0.920 0.36 0.00 repairs carried out 0.36
66 0.447 0.085 0.085 0.915 0.38 0.00 0.38
67 0.443 0.091 0.091 0.909 0.40 0.00 0.40
68 0.438 0.098 0.098 0.902 0.43 0.00 0.43
69 0.434 0.107 0.107 0.893 0.46 0.00 0.46
Option 2 - Beach nourishment
Ystad kommun - Teknik och fastigheter
Ystad Strandskog
Component 3
33(34)
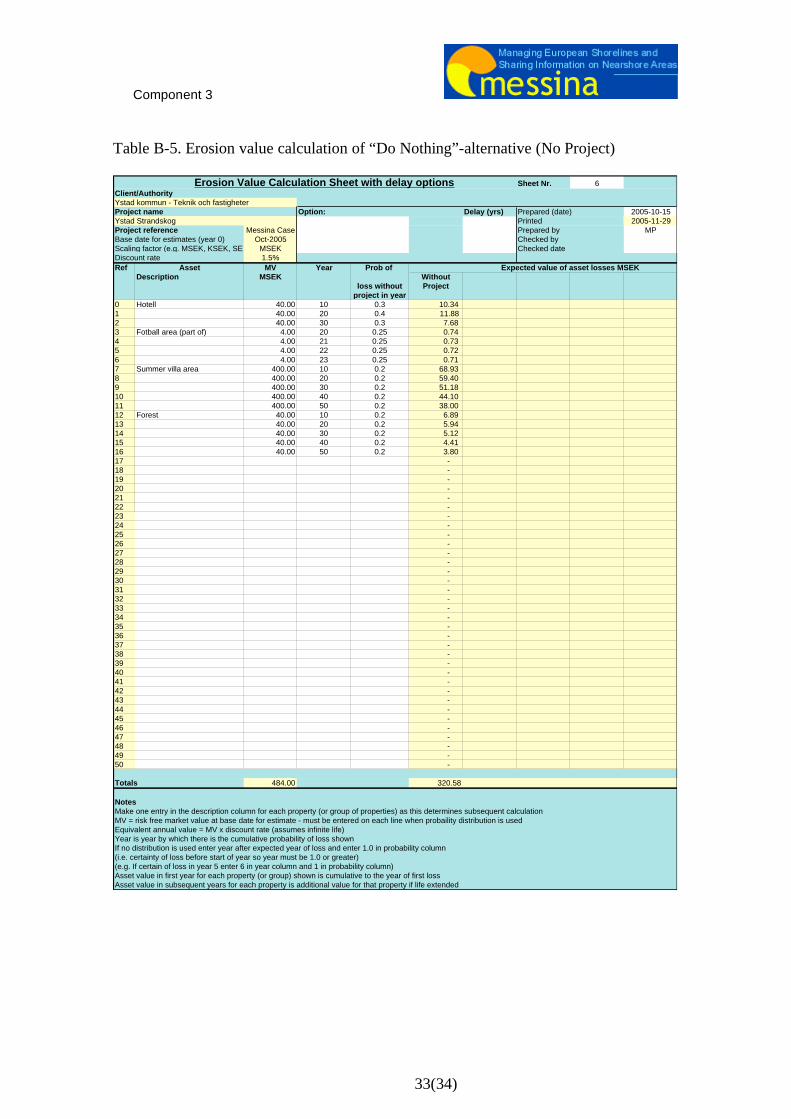
Table B-5. Erosion value calculation of “Do Nothing”-alternative (No Project)
Erosion Value Calculation Sheet with delay options Sheet Nr. 6
Client/Authority
Ystad kommun - Teknik och fastigheter
Project name Option: Delay (yrs) Prepared (date) 2005-10-15
Ystad Strandskog Printed 2005-11-29
Project reference Messina Case Prepared by MP
Base date for estimates (year 0) Oct-2005 Checked by
Scaling factor (e.g. MSEK, KSEK, SEK MSEK Checked date
Discount rate 1.5%
Ref Asset MV Year Prob of Expected value of asset losses MSEK
Description MSEK
loss without
project in year
Without
Project
0 Hotell 40.00 10 0.3 10.34
1 40.00 20 0.4 11.88
2 40.00 30 0.3 7.68
3 Fotball area (part of) 4.00 20 0.25 0.74
4 4.00 21 0.25 0.73
5 4.00 22 0.25 0.72
6 4.00 23 0.25 0.71
7 Summer villa area 400.00 10 0.2 68.93
8 400.00 20 0.2 59.40
9 400.00 30 0.2 51.18
10 400.00 40 0.2 44.10
11 400.00 50 0.2 38.00
12 Forest 40.00 10 0.2 6.89
13 40.00 20 0.2 5.94
14 40.00 30 0.2 5.12
15 40.00 40 0.2 4.41
16 40.00 50 0.2 3.80
17 -
18 -
19 -
20 -
21 -
22 -
23 -
24 -
25 -
26 -
27 -
28 -
29 -
30 -
31 -
32 -
33 -
34 -
35 -
36 -
37 -
38 -
39 -
40 -
41 -
42 -
43 -
44 -
45 -
46 -
47 -
48 -
49 -
50 -
Totals 484.00 320.58
Notes
Make one entry in the description column for each property (or group of properties) as this determines subsequent calculation
MV = risk free market value at base date for estimate - must be entered on each line when probaility distribution is used
Equivalent annual value = MV x discount rate (assumes infinite life)
Year is year by which there is the cumulative probability of loss shown
If no distribution is used enter year after expected year of loss and enter 1.0 in probability column
(i.e. certainty of loss before start of year so year must be 1.0 or greater)
(e.g. If certain of loss in year 5 enter 6 in year column and 1 in probability column)
Asset value in first year for each property (or group) shown is cumulative to the year of first loss
Asset value in subsequent years for each property is additional value for that property if life extended
Component 3
34(34)
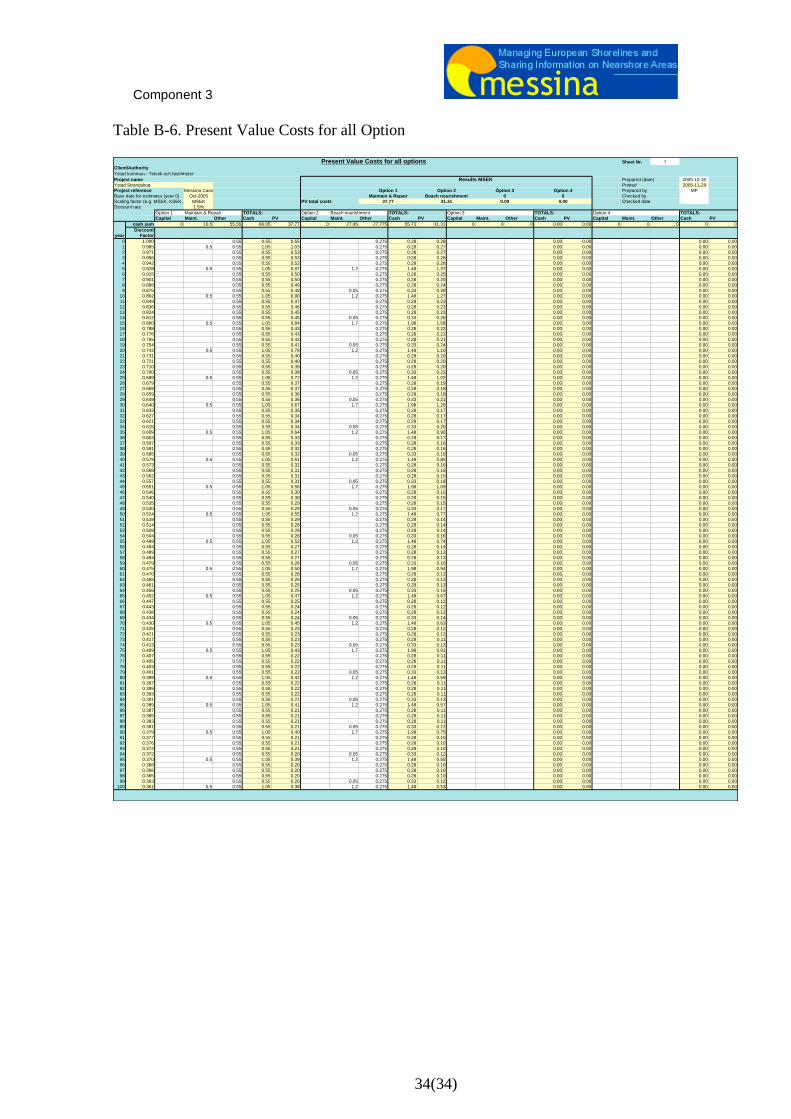
Table B-6. Present Value Costs for all Option
Present Value Costs for all options Sheet Nr. 7
Client/Authority
Project name Prepared (date) 2005-10-15
Printed 2005-11-29
Project reference Messina Case Prepared by MP
Base date for estimates (year 0) Oct-2005 Checked by
Scaling factor (e.g. MSEK, KSEK, MSEK PV total costs Checked date
Discount rate 1.5%
Option 1 TOTALS: Option 2 TOTALS: Option 3 TOTALS: Option 4 TOTALS:
Capital Maint. Other Cash PV Capital Maint. Other Cash PV Capital Maint. Other Cash PV Capital Maint. Other Cash PV
cash sum 0 10.5 55.55 66.05 37.77 0 27.95 27.775 55.73 31.31 0 0 0 0.00 0.00 0 0 0 0 0
Discount
year Factor
0 1.000 0.55 0.55 0.55 0.275 0.28 0.28 0.00 0.00 0.00 0.00
1 0.985 0.5 0.55 1.05 1.03 0.275 0.28 0.27 0.00 0.00 0.00 0.00
2 0.971 0.55 0.55 0.53 0.275 0.28 0.27 0.00 0.00 0.00 0.00
3 0.956 0.55 0.55 0.53 0.275 0.28 0.26 0.00 0.00 0.00 0.00
4 0.942 0.55 0.55 0.52 0.275 0.28 0.26 0.00 0.00 0.00 0.00
5 0.928 0.5 0.55 1.05 0.97 1.2 0.275 1.48 1.37 0.00 0.00 0.00 0.00
6 0.915 0.55 0.55 0.50 0.275 0.28 0.25 0.00 0.00 0.00 0.00
7 0.901 0.55 0.55 0.50 0.275 0.28 0.25 0.00 0.00 0.00 0.00
8 0.888 0.55 0.55 0.49 0.275 0.28 0.24 0.00 0.00 0.00 0.00
9 0.875 0.55 0.55 0.48 0.05 0.275 0.33 0.28 0.00 0.00 0.00 0.00
10 0.862 0.5 0.55 1.05 0.90 1.2 0.275 1.48 1.27 0.00 0.00 0.00 0.00
11 0.849 0.55 0.55 0.47 0.275 0.28 0.23 0.00 0.00 0.00 0.00
12 0.836 0.55 0.55 0.46 0.275 0.28 0.23 0.00 0.00 0.00 0.00
13 0.824 0.55 0.55 0.45 0.275 0.28 0.23 0.00 0.00 0.00 0.0014 0.812 0.55 0.55 0.45 0.05 0.275 0.33 0.26 0.00 0.00 0.00 0.00
15 0.800 0.5 0.55 1.05 0.84 1.7 0.275 1.98 1.58 0.00 0.00 0.00 0.00
16 0.788 0.55 0.55 0.43 0.275 0.28 0.22 0.00 0.00 0.00 0.00
17 0.776 0.55 0.55 0.43 0.275 0.28 0.21 0.00 0.00 0.00 0.00
18 0.765 0.55 0.55 0.42 0.275 0.28 0.21 0.00 0.00 0.00 0.00
19 0.754 0.55 0.55 0.41 0.05 0.275 0.33 0.24 0.00 0.00 0.00 0.00
20 0.742 0.5 0.55 1.05 0.78 1.2 0.275 1.48 1.10 0.00 0.00 0.00 0.00
21 0.731 0.55 0.55 0.40 0.275 0.28 0.20 0.00 0.00 0.00 0.00
22 0.721 0.55 0.55 0.40 0.275 0.28 0.20 0.00 0.00 0.00 0.00
23 0.710 0.55 0.55 0.39 0.275 0.28 0.20 0.00 0.00 0.00 0.00
24 0.700 0.55 0.55 0.38 0.05 0.275 0.33 0.23 0.00 0.00 0.00 0.00
25 0.689 0.5 0.55 1.05 0.72 1.2 0.275 1.48 1.02 0.00 0.00 0.00 0.00
26 0.679 0.55 0.55 0.37 0.275 0.28 0.19 0.00 0.00 0.00 0.00
27 0.669 0.55 0.55 0.37 0.275 0.28 0.18 0.00 0.00 0.00 0.00
28 0.659 0.55 0.55 0.36 0.275 0.28 0.18 0.00 0.00 0.00 0.00
29 0.649 0.55 0.55 0.36 0.05 0.275 0.33 0.21 0.00 0.00 0.00 0.00
30 0.640 0.5 0.55 1.05 0.67 1.7 0.275 1.98 1.26 0.00 0.00 0.00 0.00
31 0.633 0.55 0.55 0.35 0.275 0.28 0.17 0.00 0.00 0.00 0.00
32 0.627 0.55 0.55 0.34 0.275 0.28 0.17 0.00 0.00 0.00 0.00
33 0.621 0.55 0.55 0.34 0.275 0.28 0.17 0.00 0.00 0.00 0.00
34 0.615 0.55 0.55 0.34 0.05 0.275 0.33 0.20 0.00 0.00 0.00 0.00
35 0.609 0.5 0.55 1.05 0.64 1.2 0.275 1.48 0.90 0.00 0.00 0.00 0.00
36 0.603 0.55 0.55 0.33 0.275 0.28 0.17 0.00 0.00 0.00 0.00
37 0.597 0.55 0.55 0.33 0.275 0.28 0.16 0.00 0.00 0.00 0.00
38 0.591 0.55 0.55 0.32 0.275 0.28 0.16 0.00 0.00 0.00 0.00
39 0.585 0.55 0.55 0.32 0.05 0.275 0.33 0.19 0.00 0.00 0.00 0.00
40 0.579 0.5 0.55 1.05 0.61 1.2 0.275 1.48 0.85 0.00 0.00 0.00 0.00
41 0.573 0.55 0.55 0.32 0.275 0.28 0.16 0.00 0.00 0.00 0.00
42 0.568 0.55 0.55 0.31 0.275 0.28 0.16 0.00 0.00 0.00 0.00
43 0.562 0.55 0.55 0.31 0.275 0.28 0.15 0.00 0.00 0.00 0.00
44 0.557 0.55 0.55 0.31 0.05 0.275 0.33 0.18 0.00 0.00 0.00 0.00
45 0.551 0.5 0.55 1.05 0.58 1.7 0.275 1.98 1.09 0.00 0.00 0.00 0.00
46 0.546 0.55 0.55 0.30 0.275 0.28 0.15 0.00 0.00 0.00 0.00
47 0.540 0.55 0.55 0.30 0.275 0.28 0.15 0.00 0.00 0.00 0.00
48 0.535 0.55 0.55 0.29 0.275 0.28 0.15 0.00 0.00 0.00 0.00
49 0.530 0.55 0.55 0.29 0.05 0.275 0.33 0.17 0.00 0.00 0.00 0.00
50 0.524 0.5 0.55 1.05 0.55 1.2 0.275 1.48 0.77 0.00 0.00 0.00 0.00
51 0.519 0.55 0.55 0.29 0.275 0.28 0.14 0.00 0.00 0.00 0.00
52 0.514 0.55 0.55 0.28 0.275 0.28 0.14 0.00 0.00 0.00 0.00
53 0.509 0.55 0.55 0.28 0.275 0.28 0.14 0.00 0.00 0.00 0.00
54 0.504 0.55 0.55 0.28 0.05 0.275 0.33 0.16 0.00 0.00 0.00 0.00
55 0.499 0.5 0.55 1.05 0.52 1.2 0.275 1.48 0.74 0.00 0.00 0.00 0.00
56 0.494 0.55 0.55 0.27 0.275 0.28 0.14 0.00 0.00 0.00 0.00
57 0.489 0.55 0.55 0.27 0.275 0.28 0.13 0.00 0.00 0.00 0.00
58 0.484 0.55 0.55 0.27 0.275 0.28 0.13 0.00 0.00 0.00 0.00
59 0.479 0.55 0.55 0.26 0.05 0.275 0.33 0.16 0.00 0.00 0.00 0.00
60 0.475 0.5 0.55 1.05 0.50 1.7 0.275 1.98 0.94 0.00 0.00 0.00 0.00
61 0.470 0.55 0.55 0.26 0.275 0.28 0.13 0.00 0.00 0.00 0.00
62 0.465 0.55 0.55 0.26 0.275 0.28 0.13 0.00 0.00 0.00 0.00
63 0.461 0.55 0.55 0.25 0.275 0.28 0.13 0.00 0.00 0.00 0.00
64 0.456 0.55 0.55 0.25 0.05 0.275 0.33 0.15 0.00 0.00 0.00 0.00
65 0.452 0.5 0.55 1.05 0.47 1.2 0.275 1.48 0.67 0.00 0.00 0.00 0.00
66 0.447 0.55 0.55 0.25 0.275 0.28 0.12 0.00 0.00 0.00 0.00
67 0.443 0.55 0.55 0.24 0.275 0.28 0.12 0.00 0.00 0.00 0.00
68 0.438 0.55 0.55 0.24 0.275 0.28 0.12 0.00 0.00 0.00 0.00
69 0.434 0.55 0.55 0.24 0.05 0.275 0.33 0.14 0.00 0.00 0.00 0.00
70 0.430 0.5 0.55 1.05 0.45 1.2 0.275 1.48 0.63 0.00 0.00 0.00 0.00
71 0.425 0.55 0.55 0.23 0.275 0.28 0.12 0.00 0.00 0.00 0.00
72 0.421 0.55 0.55 0.23 0.275 0.28 0.12 0.00 0.00 0.00 0.0073 0.417 0.55 0.55 0.23 0.275 0.28 0.11 0.00 0.00 0.00 0.00
74 0.413 0.55 0.55 0.23 0.05 0.275 0.33 0.13 0.00 0.00 0.00 0.00
75 0.409 0.5 0.55 1.05 0.43 1.7 0.275 1.98 0.81 0.00 0.00 0.00 0.00
76 0.407 0.55 0.55 0.22 0.275 0.28 0.11 0.00 0.00 0.00 0.00
77 0.405 0.55 0.55 0.22 0.275 0.28 0.11 0.00 0.00 0.00 0.00
78 0.403 0.55 0.55 0.22 0.275 0.28 0.11 0.00 0.00 0.00 0.00
79 0.401 0.55 0.55 0.22 0.05 0.275 0.33 0.13 0.00 0.00 0.00 0.00
80 0.399 0.5 0.55 1.05 0.42 1.2 0.275 1.48 0.59 0.00 0.00 0.00 0.00
81 0.397 0.55 0.55 0.22 0.275 0.28 0.11 0.00 0.00 0.00 0.00
82 0.395 0.55 0.55 0.22 0.275 0.28 0.11 0.00 0.00 0.00 0.00
83 0.393 0.55 0.55 0.22 0.275 0.28 0.11 0.00 0.00 0.00 0.00
84 0.391 0.55 0.55 0.21 0.05 0.275 0.33 0.13 0.00 0.00 0.00 0.00
85 0.389 0.5 0.55 1.05 0.41 1.2 0.275 1.48 0.57 0.00 0.00 0.00 0.00
86 0.387 0.55 0.55 0.21 0.275 0.28 0.11 0.00 0.00 0.00 0.00
87 0.385 0.55 0.55 0.21 0.275 0.28 0.11 0.00 0.00 0.00 0.00
88 0.383 0.55 0.55 0.21 0.275 0.28 0.11 0.00 0.00 0.00 0.00
89 0.381 0.55 0.55 0.21 0.05 0.275 0.33 0.12 0.00 0.00 0.00 0.00
90 0.379 0.5 0.55 1.05 0.40 1.7 0.275 1.98 0.75 0.00 0.00 0.00 0.00
91 0.377 0.55 0.55 0.21 0.275 0.28 0.10 0.00 0.00 0.00 0.00
92 0.376 0.55 0.55 0.21 0.275 0.28 0.10 0.00 0.00 0.00 0.00
93 0.374 0.55 0.55 0.21 0.275 0.28 0.10 0.00 0.00 0.00 0.00
94 0.372 0.55 0.55 0.20 0.05 0.275 0.33 0.12 0.00 0.00 0.00 0.00
95 0.370 0.5 0.55 1.05 0.39 1.2 0.275 1.48 0.55 0.00 0.00 0.00 0.00
96 0.368 0.55 0.55 0.20 0.275 0.28 0.10 0.00 0.00 0.00 0.00
97 0.366 0.55 0.55 0.20 0.275 0.28 0.10 0.00 0.00 0.00 0.00
98 0.365 0.55 0.55 0.20 0.275 0.28 0.10 0.00 0.00 0.00 0.00
99 0.363 0.55 0.55 0.20 0.05 0.275 0.33 0.12 0.00 0.00 0.00 0.00
100 0.361 0.5 0.55 1.05 0.38 1.2 0.275 1.48 0.53 0.00 0.00 0.00 0.00
Beach nourishmentMaintain & Repair
Option 1
Maintain & Repair
37.77 31.31
Beach nourishment
Option 2 Option 3
0
0.00
Option 4
0
0.00
Ystad kommun - Teknik och fastigheter
Ystad Strandskog
Results MSEK


![Application Brochure A265 - Patriot Supply1].pdf · Electrical Essential Control Settings ... 115 V (ac) Class II Transformer L Do not apply power 12 13 Com – 5A 5A 5A 5A 5A 5A](https://static.documents.pub/doc/80x56/5eaeca02e603423ba506622e/application-brochure-a265-patriot-1pdf-electrical-essential-control-settings.jpg)